the Creative Commons Attribution 4.0 License.
the Creative Commons Attribution 4.0 License.
 | 11 Nov 2025
Brief communication: Enhanced representation of the power spectra of wind speed in convection-permitting models
Nathalia Correa-Sánchez
Xiaoli Guo Larsén
Giorgia Fosser
Eleonora Dallan
Marco Borga
Francesco Marra
The accurate representation of the power spectra of wind speed is crucial for assessing extreme wind speeds, but numerical models often suffer from premature energy loss at high frequencies. Here, we show that convection-permitting models from the CORDEX Flagship Pilot Studies (FPS) can reproduce the theoretical slope of the 100 m wind speed power spectra in the high-frequency range, contrarily to other mesoscale simulations and global reanalyses used by the wind community (New European Wind Atlas – NEWA – and ERA5, respectively), which exhibit steepened spectral slopes. This superior energy cascade representation is essential for extreme-wind estimation and eliminates the need for spectral corrections, opening opportunities for improved wind farm design and more reliable energy transition planning.
- Article
(3131 KB) - Full-text XML
- BibTeX
- EndNote


A fundamental parameter for wind turbine design is the 10 min mean wind speed with a 50-year return period (2 % annual exceedance probability) at hub height U50. Calculating U50 from a wind time series requires the wind variability to be resolved to a temporal resolution of 10 min. The power spectrum of wind speed S(f) as a function of frequency f (in d−1) provides a convenient approach to examine this temporal resolution requirement. Larsén et al. (2012) developed a spectral correction method to estimate 10 min equivalent extreme winds from coarser-resolution mesoscale model outputs. Mesoscale models typically exhibit spectral energy deficits above a cutoff frequency of fc≈2 d−1 compared to the theoretical slope expected from observations (e.g. Frehlich and Sharman, 2004; Larsén et al., 2013). These spectral limitations are exacerbated by additional biases in reanalysis datasets, such as ERA5, which consistently underestimates strong wind speeds offshore, implying design risks for turbine engineering applications (Gandoin and Garza, 2024). Since the second-order spectral moment weights high frequencies quadratically, these spectral deficits cause substantial underestimation of extreme winds. This moment quantifies the contribution of short-timescale fluctuations to total wind variance and is particularly relevant for estimating wind extremes (Frehlich and Sharman, 2004; Larsén et al., 2012). Therefore, spectral correction methods are used to address this issue by replacing the model's deficient spectral tail with the theoretically expected spectral slope of for S(f) versus f in log–log coordinates, extending to the Nyquist frequency of 10 min data (72 d−1). The Nyquist frequency represents the maximum resolvable frequency given the data's sampling interval; for hourly and 10 min time series, this corresponds to 12 and 72 d−1, respectively (Skamarock, 2004; Larsén et al., 2012). This correction has been used in wind-extreme assessment as a post-processing technique to restore m2 to physically consistent values and improves extreme-wind estimates (Bastine et al., 2018).
Due to the lack of wind measurements at the required height and future projection needs, numerical models are an attractive alternative in providing data for the extreme-wind calculation as they usually have a good spatial and temporal coverage (global and/or regional, tens of years). Typically, model simulations are stored every hour (e.g. the reanalysis products such as ERA5, CFSR, and MERRA) or, for some mesoscale regional models, every half an hour or even every 10 min (e.g. the New European Wind Atlas, NEWA, based on the Weather Research and Forecasting Model, WRF; Hahmann et al., 2020; Dörenkämper et al., 2020). However, their representation of high-frequency wind variability and, hence, extreme wind speed is often biased. This issue is exemplified by global extreme-wind assessments based on ERA5, where authors acknowledge that a coarse model resolution inherently leads to spectral truncation and variance underestimation, pointing out that such corrections could be applied to overcome those field-smoothing effects (Pryor and Barthelmie, 2021). Atmospheric models that produce a steeper spectral slope than in the frequency range of about 1–72 d−1 systematically underestimate both variability and extreme values in the wind speed distribution, compromising the reliability of wind-extreme estimation and structural load estimates. It is therefore important to assess whether these simulations are able to represent the expected high-frequency wind variability up to the corresponding temporal resolutions required for calculating U50.
Skamarock (2004) has shown that the WRF model can resolve a spatial resolution of 7 times the grid spacing δx when evaluated at 22, 10, and 4 km configurations. However, as spatial resolution is inherently linked to temporal discretization in model physics schemes, the WRF model wind speed output at an hourly resolution cannot be expected to reproduce spectral power at the corresponding high-frequency scales. This temporal limitation is confirmed by spectral analyses in Larsén et al. (2012), which showed that two other regional models, HIRHAM and REMO, were also unable to reproduce similar spectral behaviour in the frequency range from approximately 1 d−1 to 1 h−1. It needs to be pointed out that all models in Larsén et al. (2012) employed relatively coarse spatial resolutions (δx = 10–50 km). However, even the NEWA data generated using WRF at δx=3 km exhibit similar spectral deficiencies (Bastine et al., 2018), suggesting that the problem is not only resolution-dependent.
Convection-permitting models (CPMs), developed within the CORDEX Flagship Pilot Studies (FPS) to explicitly resolve convective processes at a horizontal grid spacing finer than 3 km and to improve the accuracy in representing precipitation (Coppola et al., 2020; Fosser et al., 2024; Ban et al., 2021), provide an opportunity to investigate whether explicit convection also improves the representation of near-surface wind variability at scales critical for extreme-value estimation. Despite the increasing use of CPMs in meteorology and climatology (e.g. Pirooz et al., 2023; Raffaele et al., 2024), their ability to reproduce wind spectral properties in the context of wind energy applications has not yet been explored in detail. While some studies suggest that CPMs could better represent kinetic energy spectra compared to lower-resolution models (Bierdel et al., 2012; Ricard et al., 2013), the transfer of these advantages to the wind sector remains unexplored. This knowledge gap is particularly relevant considering the fact that an adequate representation of wind variability on multiple timescales is critical for accurate wind resource estimates, prediction of extreme events, and characterization of intermittency in power generation, all of which are essential elements to adequately prepare for future scenarios. Here, we specifically study wind speed variability at temporal scales from a few hours to ∼ 1 h, which is crucial for accurate U50 estimation as high-frequency variability directly affects extreme-value statistics (Larsén et al., 2012), but this brief communication does not address all factors that influence extreme wind speed estimation accuracy using different modelling approaches.
We examine the power spectra of the wind speed simulated by three CPMs at 100 m height, the typical height of wind turbines, to provide insights into the simulation of high-frequency wind variability for the wind energy sector. We compare the spectral behaviour of these models against benchmark in situ observations and model simulations commonly used within the wind community to assess whether the CPMs are able to reproduce the theoretical spectral slope in the high-frequency range. We then discuss the practical implications of these findings for wind energy applications, particularly in resource assessment, extreme characterization, and wind farm design.
2.1 Convection-permitting model simulations
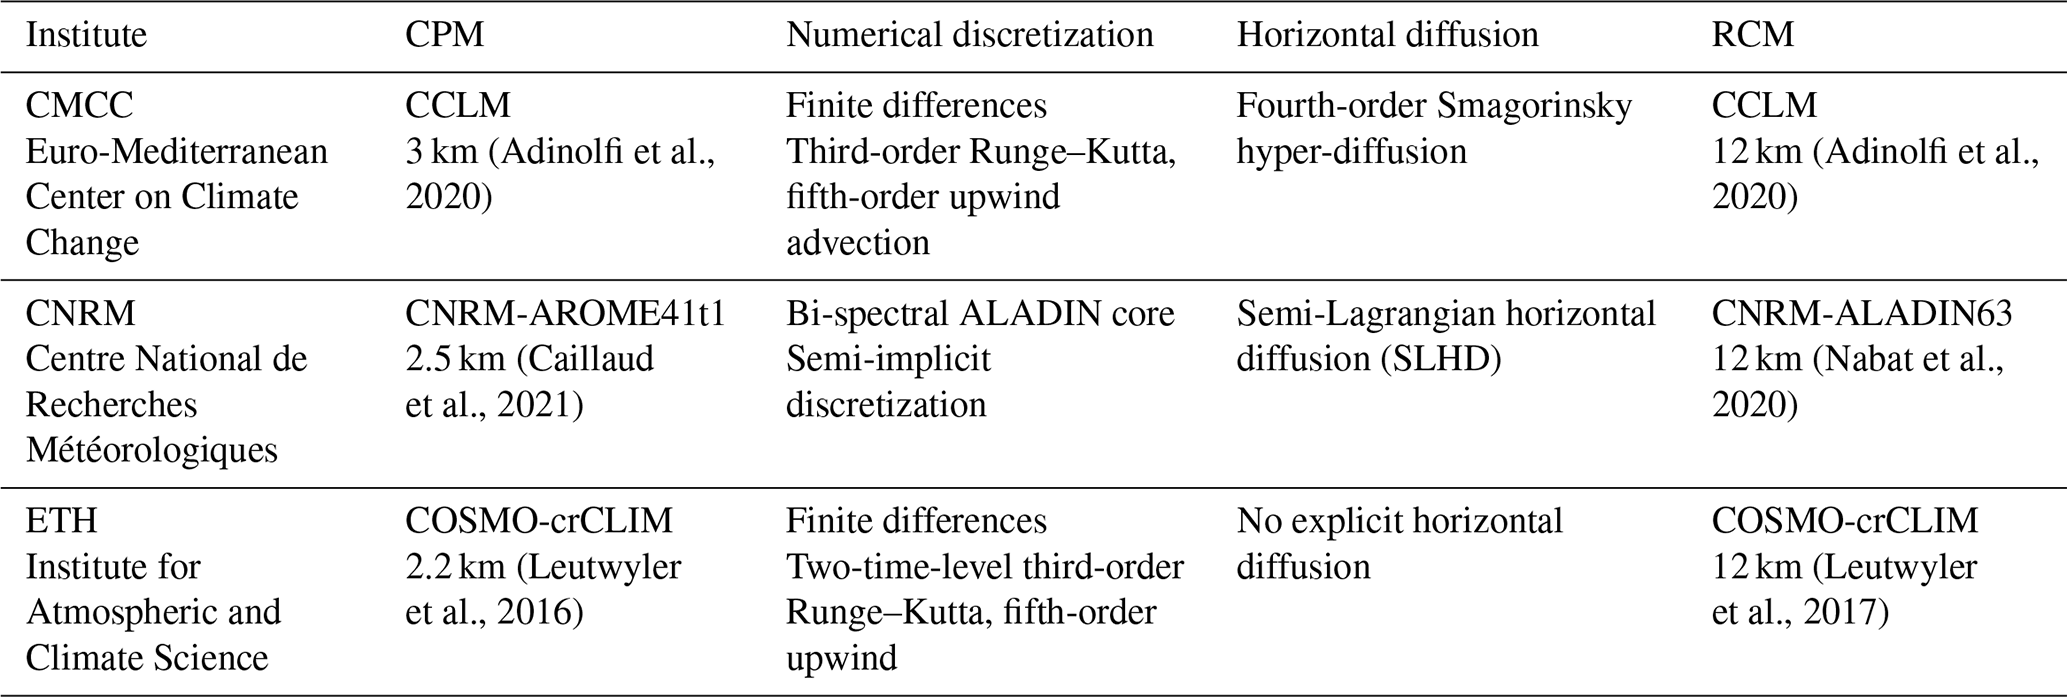
Here, we assess the three CPMs from the CORDEX Flagship Pilot Project (Coppola et al., 2020) that were publicly available at the time of this research: COSMO-CLM, CNRM-AROME, and COSMO-ETH (Table 1). COSMO-CLM is a regional climate model commonly used for high-resolution simulations (Adinolfi et al., 2020), while CNRM-AROME employs parameterizations optimized for Mediterranean systems (Caillaud et al., 2021). COSMO-ETH, similarly to COSMO-CLM, offers a GPU-accelerated implementation for continental-scale simulations (Leutwyler et al., 2017, 2016). Though all operate at similar convection-permitting resolutions (≤3 km) and are non-hydrostatic (allowing for explicit vertical accelerations), they differ in terms of numerical discretizations, physical parameterizations, and diffusion formulations (Coppola et al., 2020), all of which may influence the spectral energy distribution (Malardel and Wedi, 2016). The 100 m wind speeds were calculated directly from the zonal (U) and meridional (V) wind component simulations available at this level without requiring vertical extrapolation. All CPMs are nested in a European 12 km domain driven by ERA-Interim. Additionally, the simulations are available at an hourly frequency and cover the period 2000–2009. The specifications are listed in Table 1 for each CPM member, and the common domain covered by the CPM members is shown in Fig. A1a in Appendix A.
(Adinolfi et al., 2020)(Adinolfi et al., 2020)(Caillaud et al., 2021)(Nabat et al., 2020)(Leutwyler et al., 2016)(Leutwyler et al., 2017)Table 1List of the three CPM members with technical specifications, including coupled regional climate model (RCM) information.
2.2 Observational data
The observed wind speed data at 100 m height used in this study were provided by the Institute for Meteorology and Climate Research – Troposphere Research (IMK-TRO) of the Karlsruhe Institute of Technology (KIT). These records come from the 200 m meteorological tower located at the KIT North Campus (49.0925° N, 8.4259° E; 110.4 m a.s.l. – above sea level; see Fig. A1a), which has been continuously operational since 1972 and is equipped with high-precision instruments for turbulence measurement (Kohler et al., 2018). The 100 m wind speed data from the KIT mast cover the period 2000–2009, being the only open-access records available within our study domain upon specific request to the institute. Originally recorded at 10 min intervals, these data were subsequently aggregated to hourly values by arithmetic averaging to facilitate direct comparison with the simulations of the CPM models. The quality and completeness of the data were checked prior to sampling for each year before aggregating the time series.
2.3 New European Wind Atlas
Focusing on the location of the KIT mast, for a direct comparison with the available observed data, wind speed time series at 100 m from the New European Wind Atlas (NEWA) were extracted for a time period consistent with that of the CPM models and observational data, i.e. 2000–2009. Hahmann et al. (2020) describe the sensitivity simulations performed to select the optimal mesoscale WRF model configuration used in the generation of NEWA, which is a set of WRF climate simulations using spectral nudging (different from the freely evolving CPMs from CORDEX-FPS). Although the internal domain also has a 3 km grid spacing, the NEWA simulation uses spectral nudging in the outer domain (27 km), which constrains the large-scale flow influencing the 3 km simulations. The specific diffusion-related numerical settings that Hahmann et al. (2020) applied to the WRF model simulations for NEWA are detailed in their annexes and are based on “best practice” guidelines and modeller's experience, with the aim of maintaining numerical stability and controlling errors associated with discretization in mesoscale simulations – especially important at the 3 km resolution of the inner domain. The global evaluation of NEWA against 291 meteorological masts supports the performance of the final configuration selected for the atlas in terms of mean wind speed and wind direction statistics at 100 m height (Dörenkämper et al., 2020). However, Bastine et al. (2018) and Meyer and Gottschall (2022) applied spectral corrections to address the smoothing effect and to correct the underestimation of extreme winds since they detected that NEWA tends to smooth out high-frequency wind fluctuations.
2.4 ERA5
Wind speed data at 100 m height from the ERA5 reanalysis were calculated directly from the U and V components available at this level from the Climate Data Store (Hersbach et al., 2020) for the location of the KIT mast and constitute an hourly time series covering the period 2000–2009 at a spatial resolution of 0.25° × 0.25° (approximately 31 km at this latitude). The relevance of ERA5 in our study is that it combines global observations with atmospheric physical models through the ECMWF data assimilation system, providing consistent estimates of the atmospheric state. ERA5 is the successor of ERA-Interim, used as forcing in the CPMs, among the reanalyses developed by the ECMWF. This data source complements the set of observations and diverse model simulations analysed in this study, allowing for a comprehensive assessment of the spectral characteristics of the wind speeds. The inclusion of ERA5 in our comparative analysis provides insights into the representation of wind variability from different schemes and approaches since this reanalysis product is widely used in climate research and wind energy applications. Furthermore, ERA5 was the main source of initial and boundary conditions for the NEWA simulations.
All datasets are analysed at an hourly frequency for consistency and comparison, but they have different time window definitions. CPMs represent instantaneous model states. ERA5 offers hourly values, representing Reynolds-averaged fields with parameterized turbulence. NEWA provides 30 min resolution data, grouped into hourly values. Observations are collected from 10 min averages and converted into hourly values. These differences in time windows do not influence spectral analysis in our frequency range of interest, which is from 1 to 6 d−1, because the atmospheric processes that generate the spectral slopes operate at longer timescales (4–24 h) than these methodological differences. A statistical comparison of the time series from the different datasets at the KIT point is presented in Fig. B1 in Appendix B.
Here, we use a comparative approach to examine whether the raw spectra from all three CPMs exhibit energy deficits at high frequencies that affect wind variability representation, a limitation previously attributed to artificial spectral damping in numerical models (Wang and Sardeshmukh, 2021; Skamarock, 2004). We compare the CPM spectra with both simulations' spectra corrected with the methodology of Larsén et al. (2012) and observed spectra to determine whether continuous CPMs' free-running simulations reduce, maintain, or exacerbate these high-frequency deficits compared to nudged high-resolution models. For this, the hourly time series of CPMs, ERA5, and NEWA were first mean-centred by subtracting their mean value, thus removing the constant component, and then were linearly detrended to remove any systematic temporal trends.
Subsequently, we applied Welch's method with Hanning windowing to obtain the power spectral density (PSD) using segment lengths of 1024 data with 50 % overlap between segments. This method divides the time series into overlapping segments, applies a windowing function to each segment, computes the fast Fourier transform (FFT), and averages the resulting periodograms to reduce spectral variance while maintaining frequency resolution. Here, frequencies are expressed in d−1 following standard practices in atmospheric spectral analysis (e.g. Larsén et al., 2012; Skamarock, 2004).
The cutoff frequency fc and its corresponding spectral value S(fc) were determined by a linear regression fit to the doubly logarithmic transformation of the spectrum in the frequency range 0.6–0.9 d−1, as recommended by Larsén et al. (2012) to adequately capture the transition between the spectral regimes. In this sense, we make an explicit comparison between the raw and corrected spectra. Following Larsén et al. (2012), the spectral correction methodology is implemented for the time series in the KIT mast point. The corrected spectra for high frequencies are calculated as follows:
where represents the theoretical slope expected from energy cascade processes in the mesoscale range, and fc is the frequency at which the slope deviates from the theoretical one.
We first focused on the location of the KIT mast as a specific validation reference point, where direct wind speed measurements at 100 m height are available, and we extracted the points geographically closest to this from the CPMs, NEWA, and ERA5. This allows us to validate CPM, NEWA, and ERA5 simulations against the observational data and to provide a direct and reliable reference to assess the realism of the spectra generated by the CPMs, particularly at the high frequencies where the theoretical behaviour slope of is expected. Furthermore, since previous studies have already demonstrated the spectral limitations of NEWA and ERA5 (Bastine et al., 2018; Wang and Sardeshmukh, 2021) and to ensure that our results were not driven by a fortuitous choice of the benchmark location, we selected 10 locations within the study domain characterized by diverse topographic and climatic settings (we sampled a range of elevations including both marine and terrestrial environments; see Fig. A1, as well as Table C1 in Appendix C). This approach allows for an assessment of whether the spectral properties of CPMs show spatial consistency or systematic variations related to terrain features.
Figure 1a–c show the wind power spectra at the KIT mast from the three CPMs and the observations. Remarkably, all raw CPM spectra closely follow the theoretical slope of at the high frequencies of the mesoscale spectral range (pale lines in the background). In order to give a visual comparison of what the corrected spectra would look like, we also applied the spectral correction of Larsén et al. (2012) (solid lines). As can be seen in Fig. 1, the corrected and raw spectra from the CPMs show good agreement in the mesoscale frequency range (1–10 d−1), confirming that CPMs already represent the spectral behaviour at these frequencies. However, a divergence occurs at frequencies >10 d−1 (periods < 2.4 h), approaching the effective temporal resolution limit of hourly model output, where the representation of sub-daily atmospheric variability becomes increasingly uncertain. The CMCC model, however, shows slightly larger divergence between its raw and corrected spectra, suggesting relatively more artificial spectral damping.
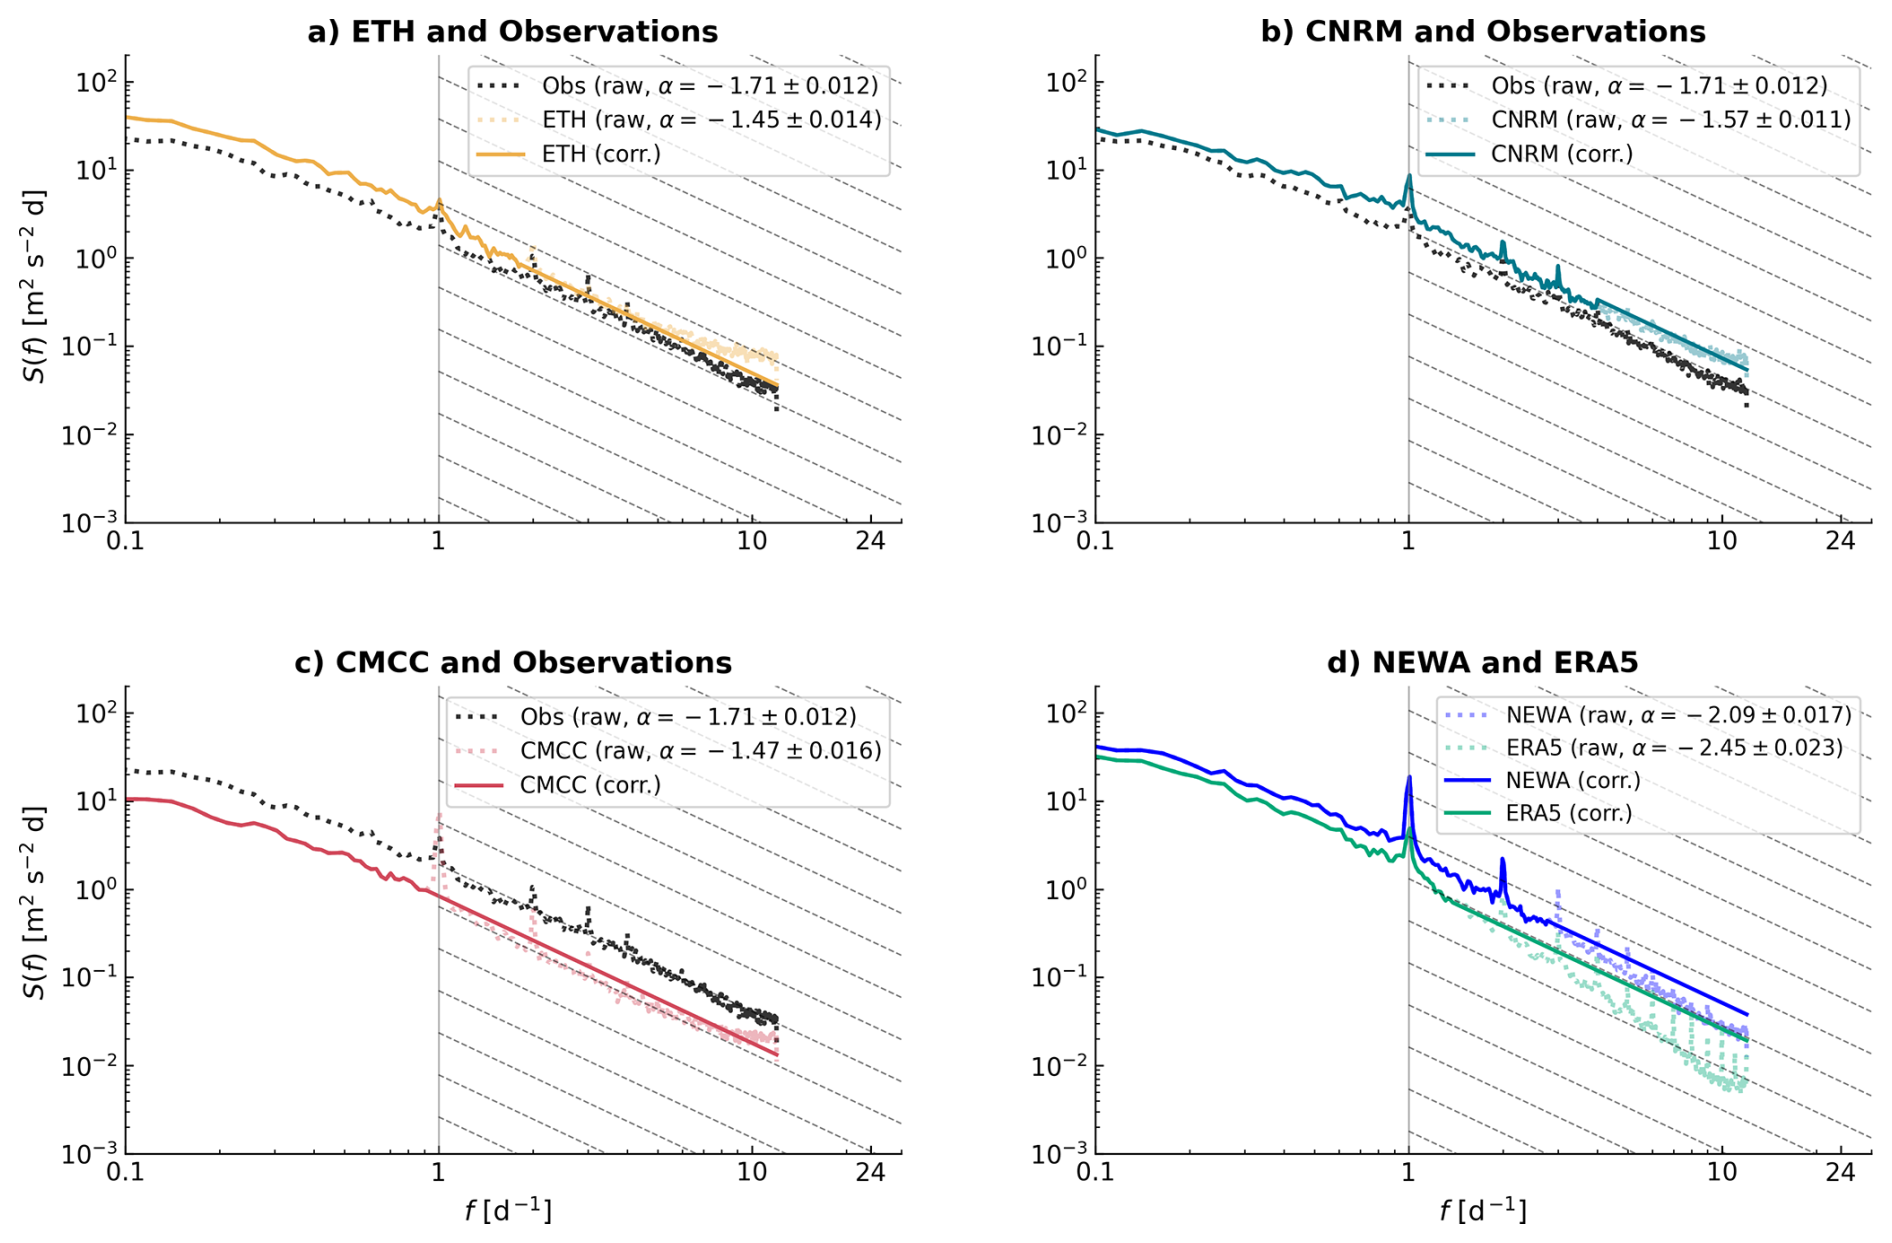
Figure 1Power spectra of the wind speeds at the measurement mast location for the three CPMs and the observed data (“Obs”): (a) ETH, (b) CNRM, and (c) CMCC. (d) The ERA5 and the NEWA power spectra. Pale-coloured lines show the smoothed raw spectra for each simulation dataset. In contrast, the solid lines of corresponding colours represent the spectra after applying the spectral correction method proposed by Larsén et al. (2012). The dashed grey lines in the high-frequency region indicate the theoretical slope. α denotes the slope of the linear fit, with the associated uncertainty expressed as a ± value.
On the other hand, Fig. 1d shows the wind power spectra from the NEWA and ERA5 data at the KIT measurement site. In both cases, the difference between the raw and corrected spectra is substantial as the raw power spectra slope is steeper than the reference slope, with a marked difference from the corrected spectra, evidencing the divergence in the energy cascade representation. This result reaffirms that these types of data need to undergo spectral correction techniques in order to capture high-frequency variability.
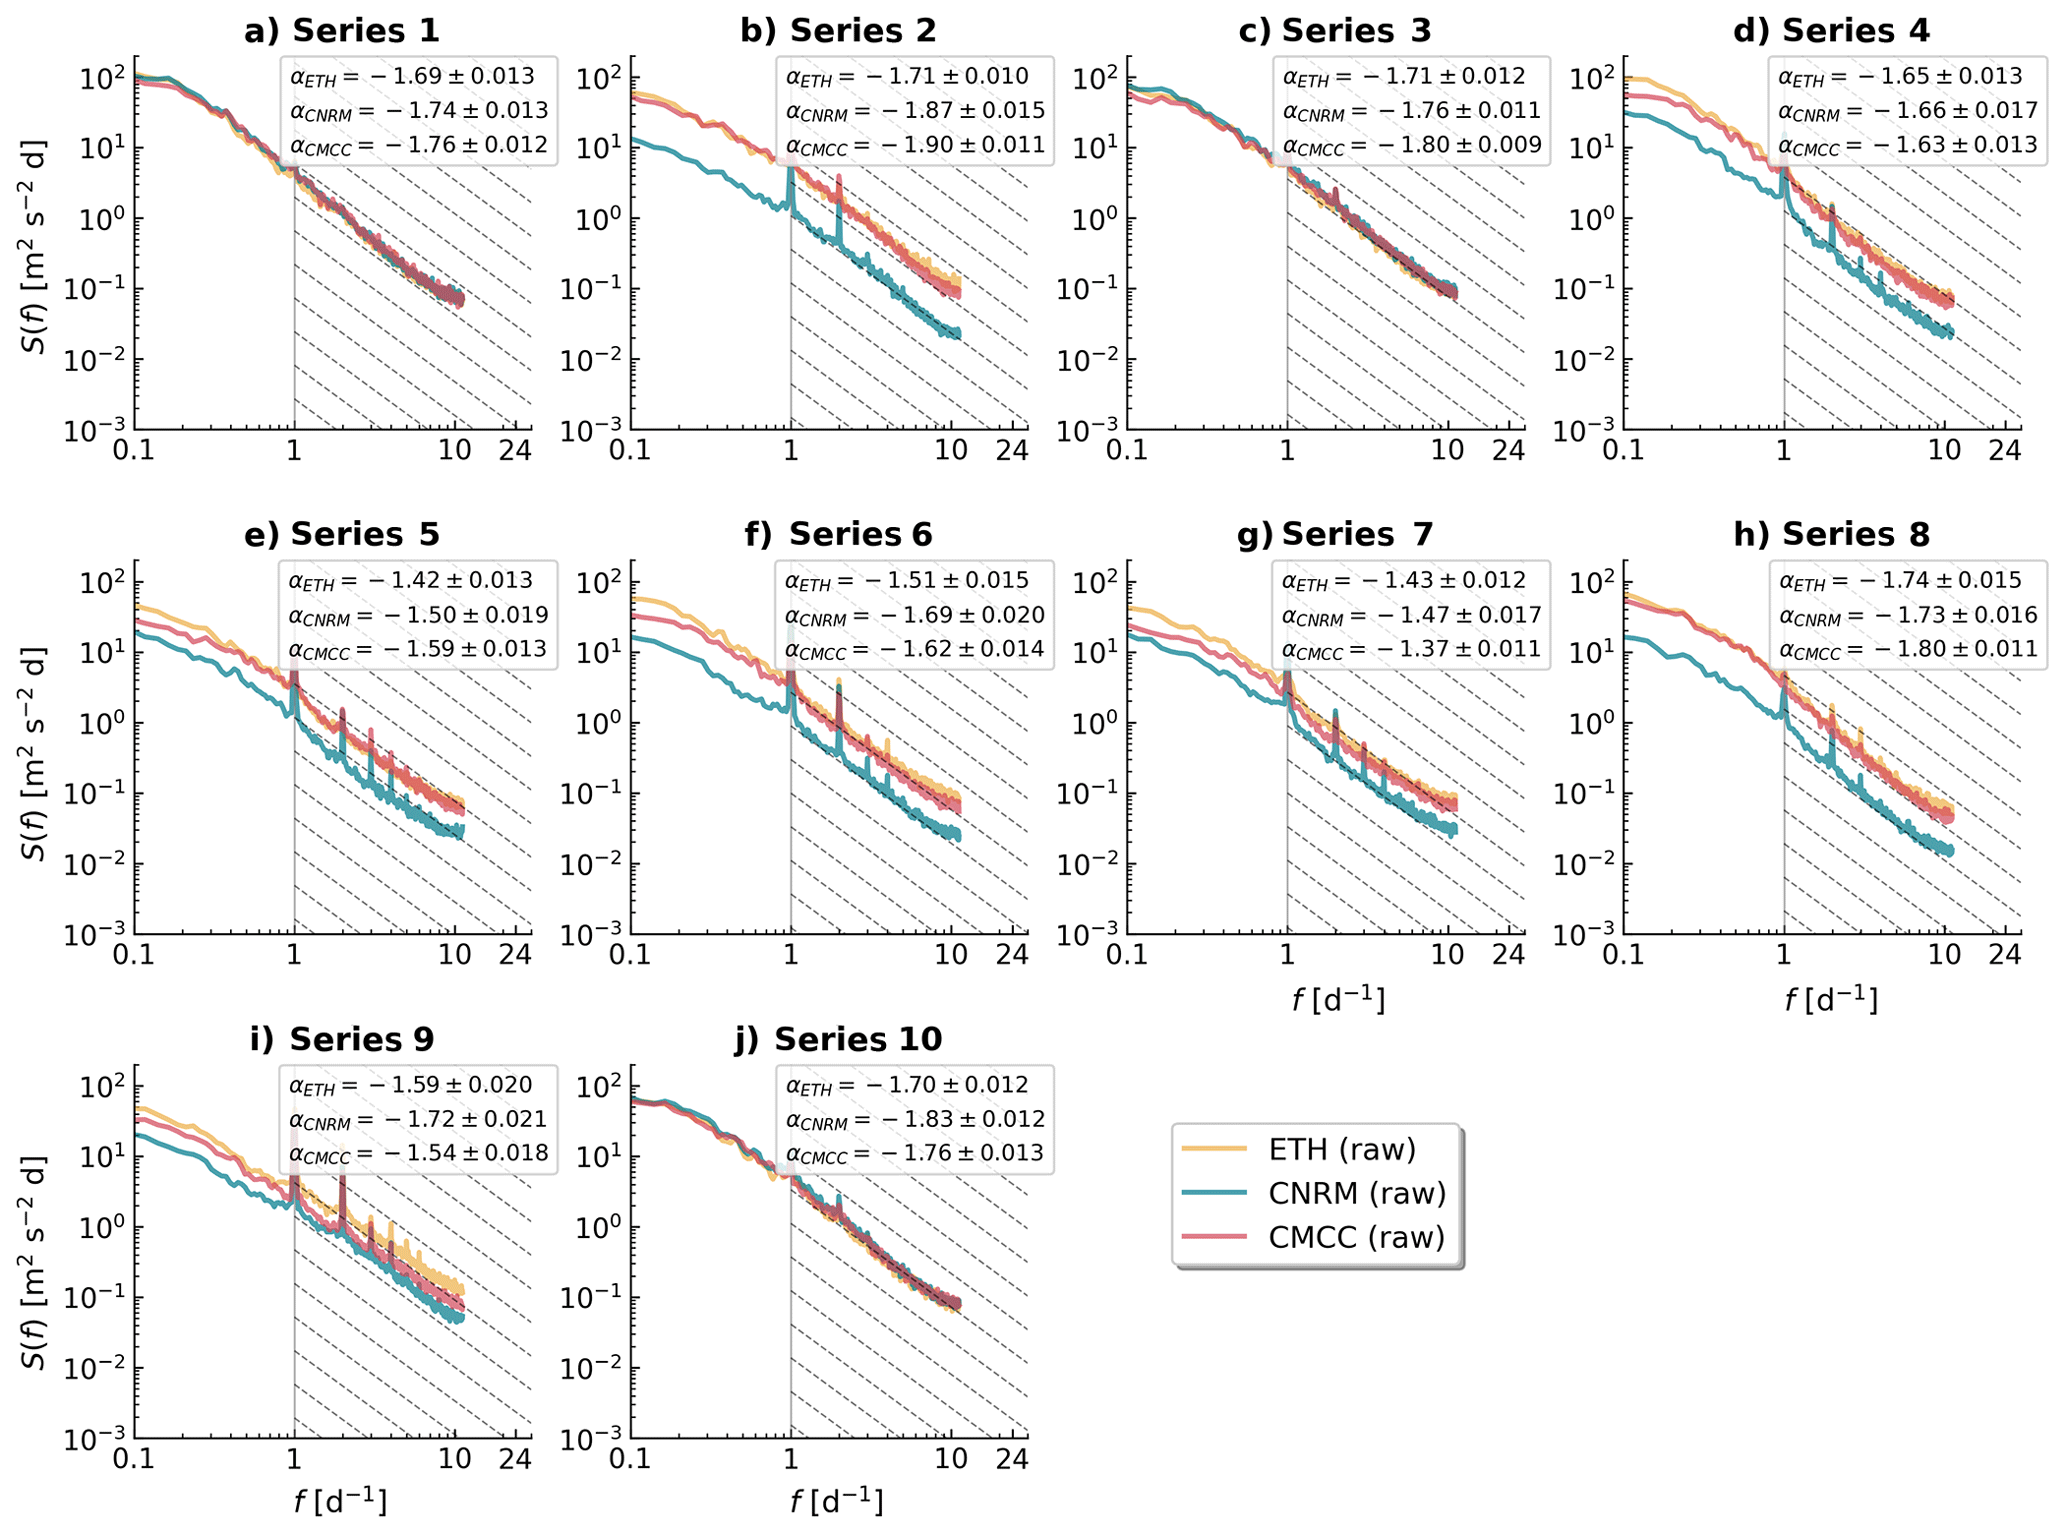
Figure 2Power spectra of wind speed time series from three CPMs at 10 randomly selected locations (a–j). Pale-coloured lines show the smoothed raw spectra for each model. The dashed grey lines in the high-frequency region indicate the theoretical slope. α denotes the slope of the linear fit, with the associated uncertainty expressed as a ± value.
To assess whether this improved spectral performance represents a systematic feature rather than an isolated case, Fig. 2 displays the raw power spectra for the three CPM models at 10 additional locations (series 1–10). Consistently with Fig. 1a–c, the power spectra align with the theoretical reference lines in the high-frequency region ( slope) across all locations. This agreement indicates that the CPM's realistic representation of the spectral characteristics is not an isolated phenomenon at the KIT mast location but rather represents an inherent property of 100 m wind simulations in CPMs. At the same time, systematic differences in energy levels are observed between the three models, with the ETH model generally showing the highest energy, followed by CMCC and CNRM. This is related to the large-scale offsets between the different models, that is, differences in spectral energy levels. While these energy level differences affect the absolute magnitude of wind variability estimates, the consistent preservation of the slope across all models demonstrates that the fundamental spectral features remain intact regardless of specific model implementation. Nevertheless, all models share inherent technical limitations. Figures 1 and 2 exhibit a flattening of the spectral slope at the highest frequencies (f>8 d−1) across all simulation datasets, which likely indicates that the models are approaching the temporal resolution limit, where numerical predictions cease to represent physical processes and likely begin to show numerical artefacts.
The spatial consistency of spectral properties suggests that CPMs can serve as reliable tools for evaluating potential wind farm sites, which is evident even in mountainous terrain, without needing additional spectral corrections. This may drastically simplify the process of obtaining the peak or extreme values. In addition, the enhanced representation of the energy spectra, particularly at high frequencies, suggests that these CPMs can provide more accurate estimates of extreme wind speeds. Since extremes depend primarily on the tail of the probability distribution, realistic spectral behaviours help to reduce uncertainty in the estimation of extreme events relevant to turbine structural design. These results pave the way for the use of CPMs for future projections of extreme wind speed, facilitating the integration of wind energy into electricity grids through more accurate prediction models.
The differences in terms of spectral behaviour between NEWA, ERA5, and direct measurements illustrate how the enhanced spectral characteristics in the CORDEX-FPS CPMs can contribute to reducing uncertainties in energy planning. On the other hand, the improved spectral performance of these CPMs compared to other high-resolution datasets such as NEWA (Fig. 1d) reveals that a convection-permitting resolution alone is insufficient to guarantee realistic spectral characteristics. While both NEWA and CORDEX-FPS operate at similar spatial resolutions (≤3 km), with both resolving convection explicitly, their different numerical configurations produce markedly different spectral behaviours. NEWA employs spectral nudging to maintain consistency with reanalysis forcing (Hahmann et al., 2020), which constrains large-scale patterns but may interfere with the natural energy cascade processes that generate mesoscale variability. In contrast, the CORDEX-FPS models examined here use freely evolving simulations that allow convective processes to develop their intrinsic spectral characteristics without large-scale constraints (Coppola et al., 2020). This fundamental difference in the simulation approach may explain why these CPMs naturally preserve the energy sources and cascades that produce realistic high-frequency wind variability, whereas constrained high-resolution models require spectral correction methods to compensate for artificially steepened spectra.
These findings contrast with well-documented limitations in traditional mesoscale approaches. Larsén et al. (2012) identified the numerical smoothing effect resulting in low spectral energy at high frequencies, which systematically affects extreme-wind estimation. Olsen et al. (2017) confirmed these limitations using mainly the WRF model in an intercomparison of 25 configurations on simple terrain, while Vincent and Hahmann (2015) demonstrated that nudging techniques significantly reduce wind variance on mesoscale scales.
Recent studies of current reanalysis and numerical weather prediction (NWP) datasets reveal persistent spectral deficiencies. Wang and Sardeshmukh (2021) found “highly inconsistent” mesoscale kinetic energy spectra across global reanalysis products (ERA-Interim, JRA-55, ERA5, NOAA GFS), with energy differences reaching factors of 47 at spatial scales smaller than 400 km. All exhibited steeper slopes than the theoretical in mesoscale ranges, attributable to inadequate data assimilation at small scales and scale-dependent numerical damping.
The CPMs evaluated in this study seem to have overcome these fundamental limitations. While a convection-permitting resolution provides the necessary spatial scales, simulation designs prioritizing physical process fidelity over climatological constraints seem to be crucial for preserving realistic wind variability characteristics despite the computational costs involved. The implications extend beyond spectral accuracy to practical applications as these enhanced characteristics in CPMs can provide more reliable estimates of extreme winds and turbine fatigue loads without requiring post-processing corrections, facilitating more accurate wind energy assessments and grid integration planning since CPM simulations also include projections for the near and far future. While the literature indicates that enhanced spectral characteristics directly improve extreme-wind estimates through spectral correction methods (Bastine et al., 2018), further validation across wind speed distributions, mean wind biases, and extreme-value methodologies represents an important research priority for wind energy applications.
We examined the power spectra of wind speed of three convection-permitting models from the CORDEX-FPS initiative. The examined CPMs can reproduce the high-frequency behaviour in the 1–12 d−1 range, with slopes approaching the theoretical expectation. This contrasts with previously documented energy deficits in this frequency range observed in other datasets, including simulations with similar resolutions, which were subject to significant energy loss in this frequency range. Indeed, simulations from a global reanalysis product (ERA5) and from a convection-permitting model specifically tailored to wind applications (NEWA) exhibit significantly steeper spectral slopes (−2.45 and −2.10, respectively), requiring post-processing corrections to achieve realistic wind variability characteristics.
These fundamental differences in spectral performance could be related to the contrasting simulation philosophies rather than spatial resolution alone. While the three CPMs and NEWA datasets operate at convection-permitting scales (≤3 km), NEWA employs multi-day simulations with spectral nudging (8 d runs). On the other hand, ERA5 uses data assimilation with systematic temporal discontinuities, both of which interfere with natural energy cascade processes. In contrast, CORDEX-FPS CPMs operate as continuous and freely evolving climate simulations that preserve the downscale energy transfer from large-scale motions to mesoscale variability. Furthermore, CPM simulations are specifically optimized to accurately represent convective processes at intraday timescales (<24 h), which directly correspond to the high-frequency domain (1–12 d−1) where spectral improvements are observed.
The superior spectral representation achieved by CPM simulations eliminates the need for post-processing techniques such as the spectral correction method, simplifying the analysis methodology for estimating the turbine design parameter U50. This improvement is expected to translate into more accurate estimates of extreme wind speeds and turbine fatigue loads as realistic high-frequency variability directly affects the calculation of spectral moments that govern extreme-value statistics. Moreover, since these CPMs are specifically developed for future climate projections, our results open the way to a direct use of simulations for wind resource assessment and extreme wind speed quantification under future climate scenarios, supporting more reliable energy transition planning.
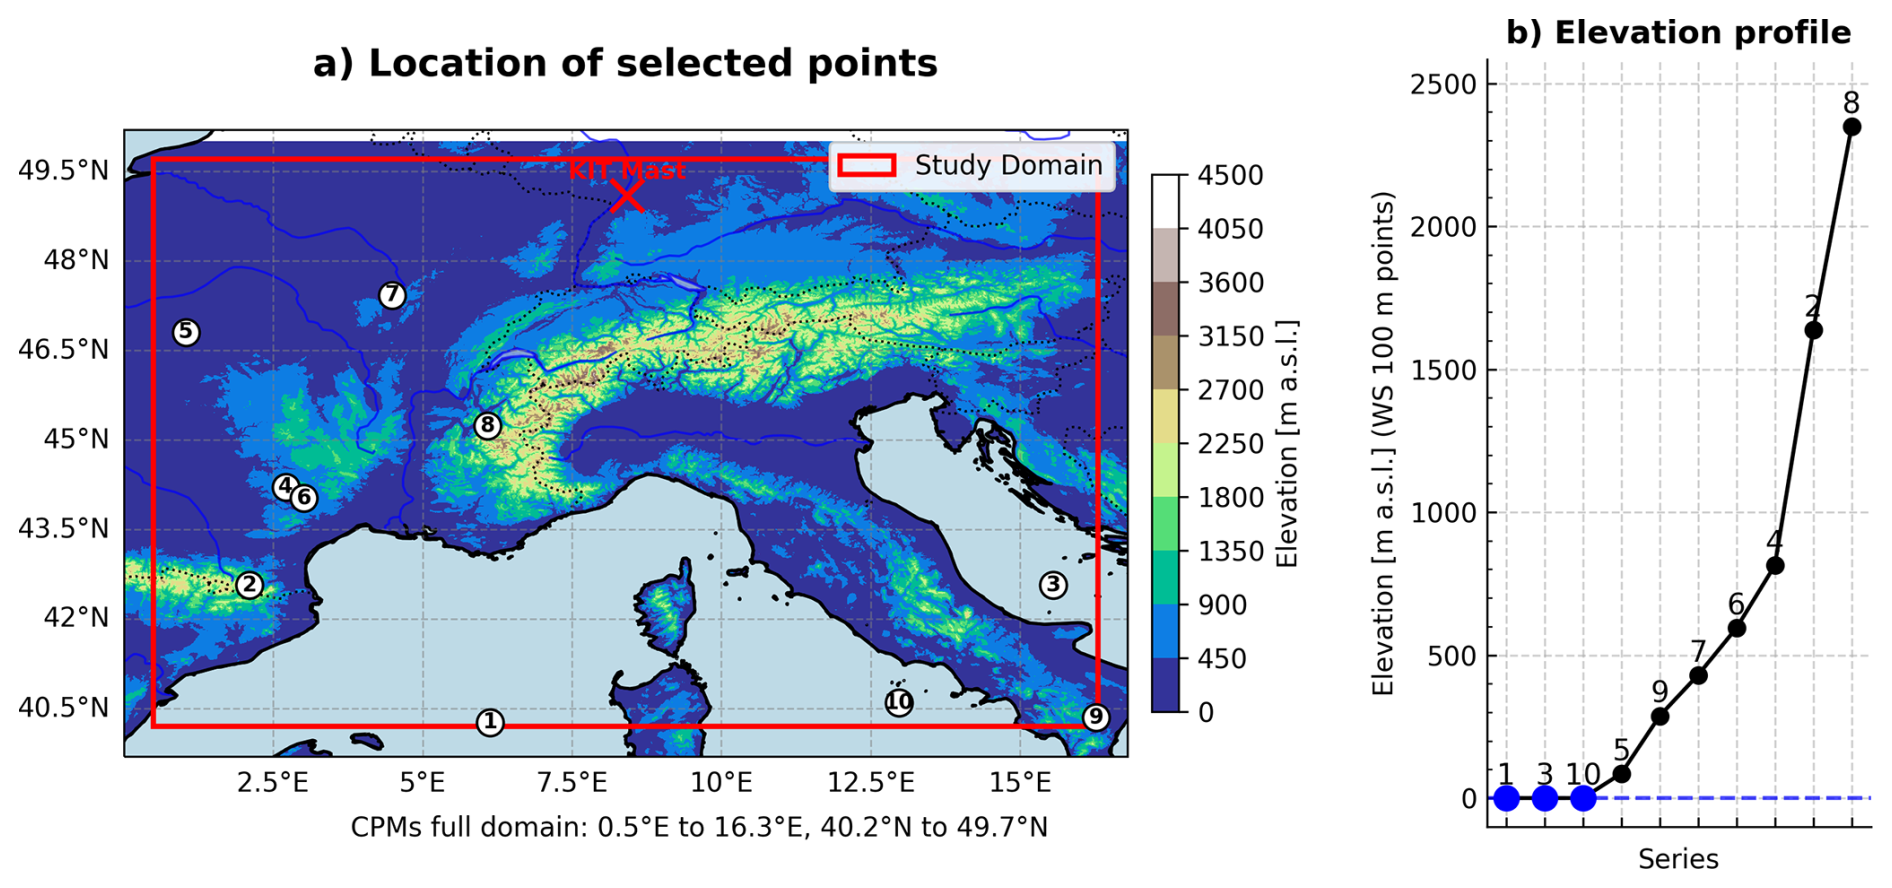
Figure A1(a) Locations of randomly selected points in white background circles, with the indicated number of the series at each point. Elevations (m a.s.l.) are from ETOPO 2022 (MacFerrin et al., 2025), remapped to 3 km. The red cross indicates the location of the mast of the KIT observations. Marine areas are in light blue. (b) Elevation profile above sea level of the series of all random points; the maritime points are marked in blue. “Study domain” refers to an internal domain within the total extent of the CPMs, which has been established to avoid edge effects in the random selection of points. Note that the label of the selected locations has a visible size but exceeds the 3 km × 3 km spatial resolution.
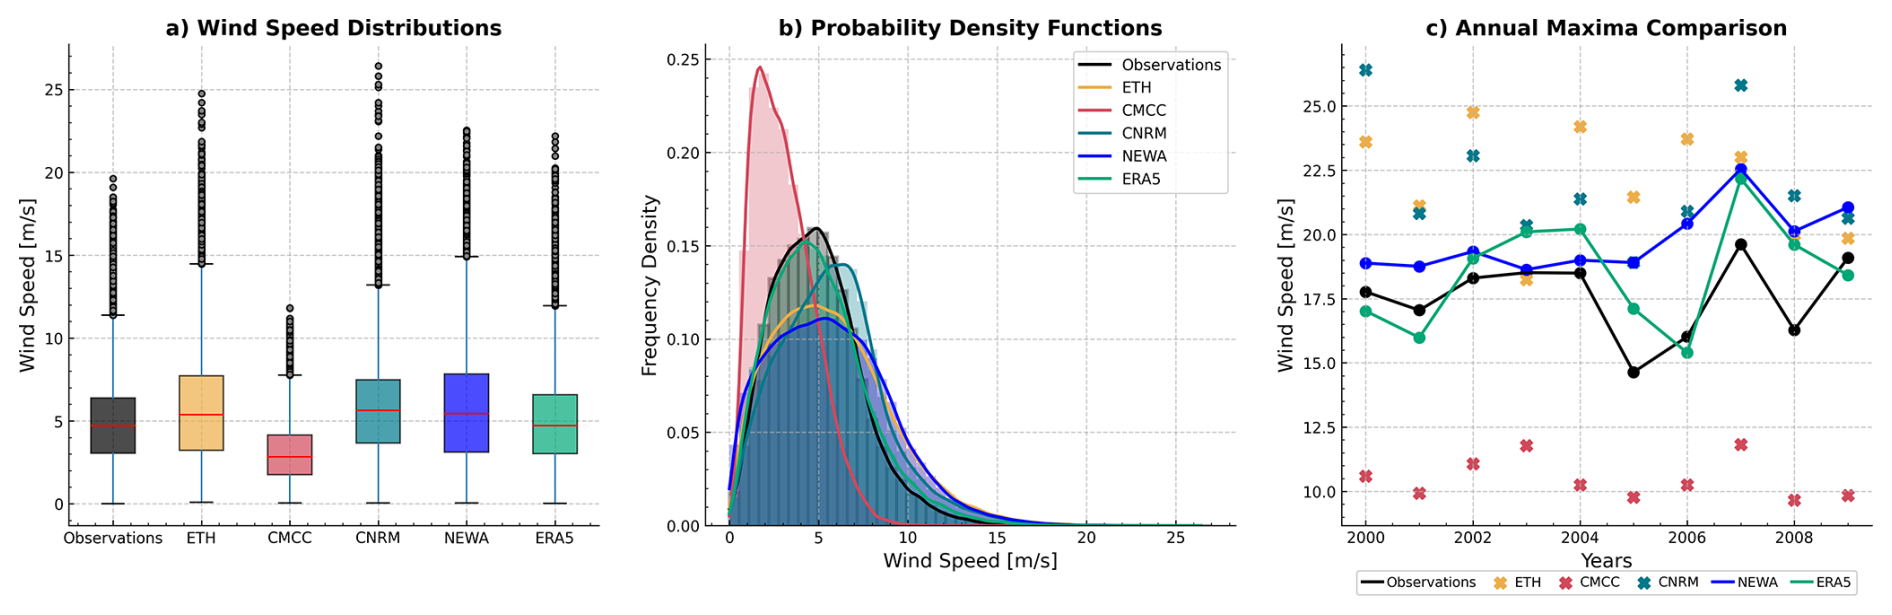
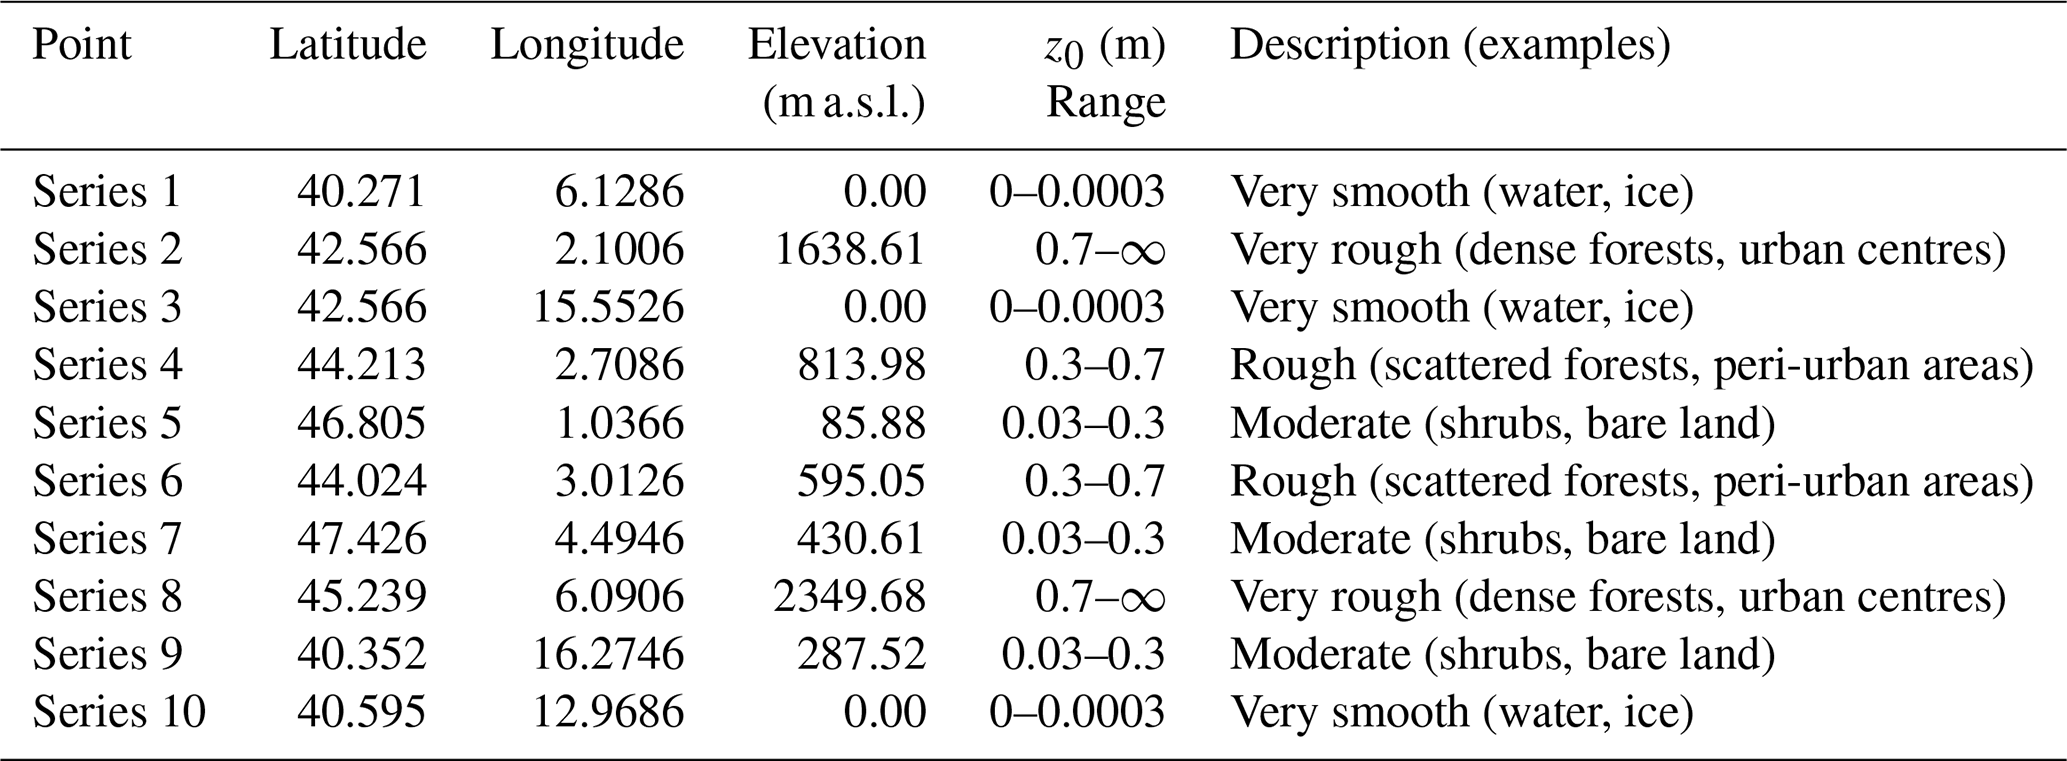
Table C1Characteristics of the 10 randomly selected locations for spectral analysis. Roughness length (z0, m) values are from the COSMO model, and ranges are based on CORINE Land Cover classifications (Demuzere et al., 2008).
| Abbreviation | Meaning |
| CCLM | Consortium for Small-scale Modelling – Climate Limited-area Modelling |
| CFSR | Climate Forecast System Reanalysis |
| CMCC | Euro-Mediterranean Center on Climate Change (Fondazione CMCC) |
| CNRM | Centre National de Recherches Météorologiques (Météo-France and CNRS) |
| CNRM-ALADIN63 | CNRM configuration of the ALADIN limited-area model, version 63 (ALADIN = Aire Limitée Adaptation dynamique Développement InterNational) |
| CNRM-AROME | CNRM configuration of AROME (Applications of Research to Operations at Mesoscale) |
| CORDEX-FPS | Coordinated Regional Climate Downscaling Experiment – Flagship Pilot Studies |
| COSMO-crCLIM | Climate (convection-resolving) version of COSMO for climate simulations |
| CPM/CPMs | Convection–permitting model(s) |
| ERA5 | ECMWF Reanalysis v5 |
| ERA-Interim | ECMWF Interim Reanalysis |
| ESGF | Earth System Grid Federation |
| ETH | ETH Zürich – Eidgenössische Technische Hochschule Zürich (Swiss Federal Institute of Technology) |
| FFT | Fast Fourier transform |
| HIRHAM | Regional climate model combining HIRLAM (High-Resolution Limited Area Model) and ECHAM (ECMWF/Max-Planck model) |
| IMK-TRO | Institute of Meteorology and Climate Research – Troposphere (KIT) |
| JRA-55 | Japanese 55-year Reanalysis (JMA) |
| KIT | Karlsruhe Institute of Technology |
| MERRA | Modern-Era Retrospective Analysis for Research and Applications |
| NEWA | New European Wind Atlas |
| NOAA GFS | National Oceanic and Atmospheric Administration – Global Forecast System (run by NCEP/NWS) |
| NWP | Numerical weather prediction |
| PSD | Power spectral density |
| RCM | Regional climate model |
| REMO | REgional MOdel |
| S(f) | Power spectral density as a function of frequency f |
| SLHD | Semi-Lagrangian horizontal diffusion |
| U50 | 50-year return period wind speed |
| WRF | Weather Research and Forecasting Model |
The scripts for the formal analyses performed in this work are available in Correa-Sánchez (2025).
The CPM data used in the study cannot be shared by the authors, but they are available at the Metagrid user interface of the infrastructure software Earth System Grid Federation (ESGF) at https://esgf-metagrid.cloud.dkrz.de/search (last access: 30 November 2024) for the CORDEX-FPS CONV project. The observational data cannot be shared by the authors but can be obtained from the data owner (https://www.imk-tro.kit.edu/english/7779.php, last access: 4 December 2024) upon request.
NCS: data curation, formal analysis, software, visualization, writing (original draft preparation). NCS, XGL, FM: conceptualization, methodology. NCS, XGL, GF, FM: investigation. XGL, FM: supervision. MB: funding acquisition. NCS, XGL, GF, ED, MB, FM: writing (review and editing).
The contact author has declared that none of the authors has any competing interests.
Publisher's note: Copernicus Publications remains neutral with regard to jurisdictional claims made in the text, published maps, institutional affiliations, or any other geographical representation in this paper. While Copernicus Publications makes every effort to include appropriate place names, the final responsibility lies with the authors. Views expressed in the text are those of the authors and do not necessarily reflect the views of the publisher.
We thank the reviewers and editor, who helped refine the paper. We thank Marianna Adinolfi for providing the roughness layer used in the COSMO model for the study annexes.
This study was partially supported by the CARIPARO Foundation through the Excellence Grant 2021 to the “Resilience” Project. Francesco Marra was supported by the “The Geosciences for Sustainable Development” project (Budget Ministero dell'Università e della Ricerca–Dipartimenti di Eccellenza 2023–2027, grant no. C93C23002690001). Eleonora Dallan was supported by the RETURN Extended Partnership and received funding from the European Union Next-Generation EU (National Recovery and Resilience Plan – NRRP, Mission 4, Component 2, Investment 1.3 – D.D. 1243 2/8/2022, PE0000005, grant no. C93C22005160002). Xiaoli Guo Larsén acknowledges support from the Horizon Europe DTWO project (grant no. 101146689).
This paper was edited by Etienne Cheynet and reviewed by three anonymous referees.
Adinolfi, M., Raffa, M., Reder, A., and Mercogliano, P.: Evaluation and Expected Changes of Summer Precipitation at Convection Permitting Scale with COSMO-CLM over Alpine Space, Atmosphere, 12, 54, https://doi.org/10.3390/ATMOS12010054, 2020. a, b, c
Ban, N., Caillaud, C., Coppola, E., Pichelli, E., Sobolowski, S., Adinolfi, M., Ahrens, B., Alias, A., Anders, I., Bastin, S., Belušić, D., Berthou, S., Brisson, E., Cardoso, R. M., Chan, S. C., Christensen, O. B., Fernández, J., Fita, L., Frisius, T., Gašparac, G., Giorgi, F., Goergen, K., Haugen, J. E., Hodnebrog, Ø., Kartsios, S., Katragkou, E., Kendon, E. J., Keuler, K., Lavín-Gullón, A., Lenderink, G., Leutwyler, D., Lorenz, T., Maraun, D., Mercogliano, P., Milovac, J., Panitz, H.-J., Raffa, M., Remedio, A. R., Schär, C., Soares, P. M. M., Srnec, L., Steensen, B. M., Stocchi, P., Tölle, M. H., Truhetz, H., Vergara-Temprado, J., de Vries, H., Warrach-Sagi, K., Wulfmeyer, V., and Zander, M. J.: The first multi-model ensemble of regional climate simulations at kilometer-scale resolution, part I: evaluation of precipitation, Climate Dynamics, 57, 275–302, 2021. a
Bastine, D., Larsén, X., Witha, B., Dörenkämper, M., and Gottschall, J.: Extreme winds in the new European wind atlas, Journal of Physics: Conference Series, 1102, 012006, https://doi.org/10.1088/1742-6596/1102/1/012006, 2018. a, b, c, d, e
Bierdel, L., Friederichs, P., and Bentzien, S.: Spatial kinetic energy spectra in the convection-permitting limited area NWP model COSMO-DE, Schweizerbart Science Publishers, Stuttgart, Germany, 21, 245–258, https://doi.org/10.1127/0941-2948/2012/0319, 2012. a
Caillaud, C., Somot, S., Alias, A., Bernard-Bouissières, I., Fumière, Q., Laurantin, O., Seity, Y., and Ducrocq, V.: Modelling Mediterranean heavy precipitation events at climate scale: An object-oriented evaluation of the CNRM-AROME convection-permitting regional climate model, Climate Dynamics, 56, 1717–1752, https://doi.org/10.1007/S00382-020-05558-Y, 2021. a, b
Coppola, E., Sobolowski, S., Pichelli, E., Raffaele, F., Ahrens, B., Anders, I., Ban, N., Bastin, S., Belda, M., Belušić, D., Caldas-Alvarez, A., Cardoso, R. M., Davolio, S., Dobler, A., Fernández, J., Fita, L., Fumiere, Q., Giorgi, F., Goergen, K., Güttler, I., Halenka, T., Heinzeller, D., Hodnebrog, Ø., Jacob, D., Kartsios, S., Katragkou, E., Kendon, E., Khodayar, S., Kunstmann, H., Knist, S., Lavín-Gullón, A., Lind, P., Lorenz, T., Maraun, D., Marelle, L., van Meijgaard, E., Milovac, J., Myhre, G., Panitz, H.-J., Piazza, M., Raffa, M., Raub, T., Rockel, B., Schär, C., Sieck, K., Soares, P. M. M., Somot, S., Srnec, L., Stocchi, P., Tölle, M. H., Truhetz, H., Vautard, R., de Vries, H., and Warrach-Sagi, K.: A first-of-its-kind multi-model convection permitting ensemble for investigating convective phenomena over Europe and the Mediterranean, Climate Dynamics, 55, 3–34, https://doi.org/10.1007/s00382-018-4521-8, 2020. a, b, c, d
Correa-Sánchez, N.: First official release – [Scripts] CPM spectral characteristics scripts (v1.0.0), Zenodo [code], https://doi.org/10.5281/zenodo.17518035, 2025.
Demuzere, M., De Ridder, K., and van Lipzig, N. P. M.: Modeling the energy balance in Marseille: Sensitivity to roughness length parameterizations and thermal admittance, Journal of Geophysical Research: Atmospheres, 113, D16120, https://doi.org/10.1029/2007JD009113, 2008. a
Dörenkämper, M., Olsen, B. T., Witha, B., Hahmann, A. N., Davis, N. N., Barcons, J., Ezber, Y., García-Bustamante, E., González-Rouco, J. F., Navarro, J., Sastre-Marugán, M., Sīle, T., Trei, W., Žagar, M., Badger, J., Gottschall, J., Sanz Rodrigo, J., and Mann, J.: The Making of the New European Wind Atlas – Part 2: Production and evaluation, Geosci. Model Dev., 13, 5079–5102, https://doi.org/10.5194/gmd-13-5079-2020, 2020. a, b
Fosser, G., Gaetani, M., Kendon, E. J., Adinolfi, M., Ban, N., Belušić, D., Caillaud, C., Careto, J. A. M., Coppola, E., Demory, M.-E., de Vries, H., Dobler, A., Feldmann, H., Goergen, K., Lenderink, G., Pichelli, E., Schär, C., Soares, P. M. M., Somot, S., and Tölle, M. H.: Convection-permitting climate models offer more certain extreme rainfall projections, NPJ Climate and Atmospheric Science, 7, 51, https://doi.org/10.1038/s41612-024-00600-w, 2024. a
Frehlich, R. and Sharman, R.: Estimates of turbulence from numerical weather prediction model output with applications to turbulence diagnosis and data assimilation, Monthly Weather Review, 132, 2308–2324, https://doi.org/10.1175/1520-0493(2004)132<2308:EOTFNW>2.0.CO;2, 2004. a, b
Gandoin, R. and Garza, J.: Underestimation of strong wind speeds offshore in ERA5: evidence, discussion and correction, Wind Energ. Sci., 9, 1727–1745, https://doi.org/10.5194/wes-9-1727-2024, 2024. a
Hahmann, A. N., Davis, N. N., Dörenkämper, M., Sīle, T., Witha, B., and Trey, W.: WRF configuration files for NEWA mesoscale ensemble and production simulations, Zenodo, https://doi.org/10.5281/zenodo.3709088, 2020. a, b, c, d
Hersbach, H., Bell, B., Berrisford, P., Hirahara, S., Horányi, A., Muñoz-Sabater, J., Nicolas, J., Peubey, C., Radu, R., Schepers, D., Simmons, A., Soci, C., Abdalla, S., Abellan, X., Balsamo, G., Bechtold, P., Biavati, G., Bidlot, J., Bonavita, M., De Chiara, G., Dahlgren, P., Dee, D., Diamantakis, M., Dragani, R., Flemming, J., Forbes, R., Fuentes, M., Geer, A., Haimberger, L., Healy, S., Hogan, R. J., Hólm, E., Janisková, M., Keeley, S., Laloyaux, P., Lopez, P., Lupu, C., Radnoti, G., de Rosnay, P., Rozum, I., Vamborg, F., Villaume, S., and Thépaut, J.-N.: The ERA5 global reanalysis, Quarterly Journal of the Royal Meteorological Society, 146, 1999–2049, https://doi.org/10.1002/qj.3803, 2020. a
Kohler, M., Metzger, J., and Kalthoff, N.: Trends in temperature and wind speed from 40 years of observations at a 200-m high meteorological tower in Southwest Germany, International Journal of Climatology, 38, 23–34, 2018. a
Larsén, X. G., Ott, S., Badger, J., Hahmann, A. N., and Mann, J.: Recipes for correcting the impact of effective mesoscale resolution on the estimation of extreme winds, Journal of Applied Meteorology and Climatology, 51, 521–533, 2012. a, b, c, d, e, f, g, h, i, j, k, l
Larsén, X. G., Vincent, C. L., and Larsen, S.: Spectral structure of the mesoscale winds over the water, Q. J. R. Meteorol. Soc., 139, 685–700, https://doi.org/10.1002/qj.2003, 2013. a
Leutwyler, D., Fuhrer, O., Lapillonne, X., Lüthi, D., and Schär, C.: Towards European-scale convection-resolving climate simulations with GPUs: a study with COSMO 4.19, Geosci. Model Dev., 9, 3393–3412, https://doi.org/10.5194/gmd-9-3393-2016, 2016. a, b
Leutwyler, D., Lüthi, D., Ban, N., Fuhrer, O., and Schär, C.: Evaluation of the convection-resolving climate modeling approach on continental scales, Journal of Geophysical Research: Atmospheres, 122, 5237–5258, https://doi.org/10.1002/2016JD026013, 2017. a, b
MacFerrin, M., Amante, C., Carignan, K., Love, M., and Lim, E.: The Earth Topography 2022 (ETOPO 2022) global DEM dataset, Earth Syst. Sci. Data, 17, 1835–1849, https://doi.org/10.5194/essd-17-1835-2025, 2025. a
Malardel, S. and Wedi, N. P.: How does subgrid-scale parametrisation influence non-linear spectral energy fluxes in global NWP models?, Journal of Geophysical Research: Atmospheres, 121, 5395–5410, https://doi.org/10.1002/2015JD023970, 2016. a
Meyer, P. J. and Gottschall, J.: How do NEWA and ERA5 compare for assessing offshore wind resources and wind farm siting conditions?, Journal of Physics: Conference Series, 2151, 012009, https://doi.org/10.1088/1742-6596/2151/1/012009, 2022. a
Nabat, P., Somot, S., Cassou, C., Mallet, M., Michou, M., Bouniol, D., Decharme, B., Drugé, T., Roehrig, R., and Saint-Martin, D.: Modulation of radiative aerosols effects by atmospheric circulation over the Euro-Mediterranean region, Atmos. Chem. Phys., 20, 8315–8349, https://doi.org/10.5194/acp-20-8315-2020, 2020. a
Olsen, B. T., Hahmann, A. N., Sempreviva, A. M., Badger, J., and Jørgensen, H. E.: An intercomparison of mesoscale models at simple sites for wind energy applications, Wind Energ. Sci., 2, 211–228, https://doi.org/10.5194/wes-2-211-2017, 2017. a
Pirooz, A., Moore, S., Carey-Smith, T., Turner, R., and Su, C.-H.: The New Zealand Reanalysis (NZRA), Weather and Climate, 42, 58–74, 2023. a
Pryor, S. C. and Barthelmie, R. J.: A global assessment of extreme wind speeds for wind energy applications, Nature Energy, 6, 268–276, 2021. a
Raffaele, L., Bruno, L., and Colucci, E.: Reanalysis-based mesoscale wind maps for the design of structures and infrastructures with an application to Italy, Journal of Wind Engineering and Industrial Aerodynamics, 253, 105844, https://doi.org/10.1016/j.jweia.2024.105844, 2024. a
Ricard, D., Ducrocq, V., Lafore, J. P., and Masson, V.: Kinetic Energy Spectra Characteristics of Two Convection-Permitting Models during HyMeX IOP13, Quarterly Journal of the Royal Meteorological Society, 139, 1327–1341, https://doi.org/10.1002/qj.2025, 2013. a
Skamarock, W. C.: Evaluating mesoscale NWP models using kinetic energy spectra, Monthly Weather Review, 132, 3019–3032, 2004. a, b, c, d
Vincent, C. L. and Hahmann, A. N.: The impact of grid and spectral nudging on the variance of the near-surface wind speed, Journal of Applied Meteorology and Climatology, 54, 1021–1038, 2015. a
Wang, J.-W. A. and Sardeshmukh, P. D.: Inconsistent Global Kinetic Energy Spectra in Reanalyses and Models, Journal of the Atmospheric Sciences, 78, 2589–2603, https://doi.org/10.1175/JAS-D-20-0294.1, 2021. a, b, c
- Abstract
- Introduction
- Data
- Methods
- Results and discussion
- Conclusions
- Appendix A: Location of the randomly selected points
- Appendix B: Descriptive information of each dataset used in the KIT mast point
- Appendix C: Table with the elevation and roughness characteristics of each randomly selected point
- Appendix D: List of abbreviations and their meanings
- Code availability
- Data availability
- Author contributions
- Competing interests
- Disclaimer
- Acknowledgements
- Financial support
- Review statement
- References