the Creative Commons Attribution 4.0 License.
the Creative Commons Attribution 4.0 License.
 | 07 Mar 2025
A machine-learning-based approach for active monitoring of blade pitch misalignment in wind turbines
Sabrina Milani
Jessica Leoni
Stefano Cacciola
Alessandro Croce
Mara Tanelli
In recent years, timely anomaly detection in wind turbine operations, especially offshore, has become critical. Yet, promptly identifying faults and damage remains a significant challenge, leading to costly maintenance and consumption of resources. Rotor blade pitch misalignment constitutes an essential issue, causing downtime and reduced energy production. Traditional inspection methods are resource-intensive, time-consuming, and also struggle to identify the specific misaligned blades. In addition, their accuracy degrades in the case of small misalignments and strongly depends on the wind regimes, as they are less reliable in turbulence. The absence of an effective automatic solution persists, requiring costly on-site verification.
To tackle this challenge, this paper introduces a novel machine-learning-based approach that relies on the combination of random forest classifier instances and linear regression for automatic pitch misalignment detection and localization. This approach not only localizes the affected blades but also detects small misalignments as low as 0.1°. Validation using virtual data coming from a state-of-the-art simulator shows the approach's ability to detect and localize misalignment accurately, even with multiple misaligned blades and in different turbulence conditions, achieving an F1 score exceeding 93 %. Additionally, regression analysis proves the capability of the framework to detect misalignments as low as 0.1° with a root mean square error of 5.48 %. The methodology relies on features extracted from a limited set of sensors already integrated into modern wind turbine systems. Specifically, the extracted indicators are designed to effectively integrate frequency and time domain information on turbine operating conditions, enabling high detection performance even in turbulent wind regimes.
The approach is validated across an extended operational envelope using data gathered from a state-of-the-art simulation model commonly used for designing and certifying commercial wind turbine systems.
- Article
(5604 KB) - Full-text XML
- BibTeX
- EndNote


Persistent vibrations due to misalignment in blade pitches may impact the residual life of a wind turbine, leading to system failure through the mechanical degradation of fundamental components such as gearboxes, electronic boards, sensors, motors, and blades. The standards for design and certification of wind turbines (IEC 61400-1 Ed.3., 2004) prescribe the expected loading status of a machine to be quantified including a mild misalignment equal to ±0.3° in two blades. Hence, it is expected that unbalanced conditions do not represent an issue unless the aerodynamic imbalance does not exceed 0.3°. As discussed in Saathoff et al. (2021), pitch angle misalignments lower than 0.3° are generally considered acceptable during wind turbine operation. The same study, however, showed through an analysis of empirical data that about 34.8 % of wind turbines experience a greater degree of misalignment, with values ranging between 0.6 and 2.0°. These represent more significant imbalances as they may substantially impact the performance and structural health. Another study on an onshore farm (Astolfi, 2019) reported that a maximum pitch imbalance of 4.5° was detected, a value significantly higher than those generally accepted. Finally, in Yang et al. (2014), the pitch system is associated with one of the highest failure rates experienced by wind turbines.
System failure due to imbalances can result in reduced energy production and increased fatigue loads on turbine components, which are considerable limitations that require periodic inspections to monitor the pitch actuator status (Wilkinson et al., 2010). Maintenance interventions on such systems are costly and challenging, especially considering offshore or remotely located machines. Indeed, scheduled maintenance can prove inefficient, resulting in failures between interventions due to sparse intervals or unnecessary interventions from overly short intervals. Consequently, transitioning to condition-based scheduling is pivotal. However, to facilitate this transition, an automatic diagnostics algorithm is necessary. It would enable continuous health monitoring, promptly detecting early faults and promoting timely interventions to prevent irreversible damages.
Various approaches have been proposed to identify pitch misalignment conditions, typically falling into two categories: model-based and machine-learning methods. Model-based approaches compare expected and actual turbine behavior, attributing deviations to faults. Machine-learning methods, on the other hand, learn from extensive sets of normal and abnormal operating data to identify general and robust patterns that allow them to distinguish the two conditions. However, regardless of category, these approaches suffer from one or more of these main limitations.
-
They require data from sensors that are currently challenging to implement on commercial turbine blades.
-
They lose accuracy in turbulent wind conditions or with minor misalignments.
-
They only detect overall turbine misalignment without being able to identify the specific misaligned blades.
-
They are too complex to allow for an exhaustive interpretation of their decision-making processes, resulting in predictions that are not useful as they are uncorrelated with the physics of the system.
1.1 First-principle model approaches
In the literature, several works such as Dalsgaard et al. (2009), Tang et al. (2021), Axelsson et al. (2010), and Kusnick et al. (2015) propose model-based techniques to identify and locate pitch and load misalignment anomalies. These techniques, though, tend to be tailored to the specific application as a physical model of the system is required, harming the generality of the method. Furthermore, the proposed methods analyze signals from sensors that could be difficult to install on a real system and are focused more on the analysis of biases and faults of the sensors describing the anomaly of the misalignment of the blades. In addition, these approaches are intended to be effective and efficient in constant wind regime conditions, typically far from what is experienced in a real environment.
Other model-based techniques have been proposed in Desheng et al. (2021), Cacciola et al. (2016), Cacciola and Riboldi (2017), Cacciola et al. (2018), Bertelè et al. (2018), and Bertelè and Bottasso (2022), where the focus is to identify the presence of rotor imbalances and target them through a load compensation technique or via suitable control actions.
These techniques, though, do not propose a method to specifically localize the anomaly or require a modification of the turbine control system, a task practically unfeasible in the case of existing turbines featuring a certified controller.
Conversely, the method presented in this paper is efficient in every wind regime condition, being more general and applicable in a real scenario, where typically turbulent wind conditions are present. In addition, the proposed approach is capable of identifying and locating the presence of the misalignment in a single or multiple blades, without interfering with the nominal functioning of the wind turbine.
1.2 Machine-learning approaches
Given the high performance achieved by machine-learning approaches in anomaly detection applications for mechanical systems (Lei et al., 2020), in the last decades, novel methods have been presented in the literature, focused on detecting pitch misalignment (Zhong and Fei, 2022; Kusiak and Verma, 2011). Often, such methodologies require a huge number of signals or consider sensors rarely available on standard machines (e.g., force signals). In addition, most approaches, such as the one in Kusiak and Verma (2011), are not capable of estimating the severity of the misalignment or of locating the blades affected by the anomaly. In Milani et al. (2024), the potential of machine-learning methods for detecting pitch misalignment was analyzed with the aim of developing a real-time detection method using a machine-learning classifier. The approach demonstrated robust performance even in turbulent wind conditions and with mild misalignment angles. However, while misalignment levels can be classified as small, medium, or high, the methodology lacked localization capability and addressed only cases with a single blade misaligned.
Conversely, deep learning techniques, such as that discussed in Cacciola et al. (2016), can detect and locate misalignments, even in turbulent conditions, with satisfactory performance. However, their complex structure prevents interpretability, thus hindering their reliability.
If a detection strategy pinpoints an anomaly without providing a plausible reason, it would be challenging to take corrective actions. For example, detecting the presence of a misalignment is certainly useful, but understanding how the different measurements contributed to the detection can guide more informed maintenance decisions, reducing downtimes and operator interventions.
1.3 Novel contribution
To overcome state-of-the-art limitations, in this paper we introduce an automatic machine-learning-based diagnostic framework to detect pitch misalignment in wind turbines. Building upon our prior work (Milani et al., 2024), this framework utilizes a minimal set of sensors commonly available in wind turbine systems and employs specialized signal processing techniques to extract relevant features tailored to the physical behavior of the monitored system. Specifically, they have been designed to describe the vibrational behavior and load distribution of the system, as they both are known to be affected in the case of misalignment. In particular, the following measurements were employed for the analysis and features extraction: flap-wise and edge-wise blade root moments, nodding and yawing moments at the main bearing, and wind speed and rotor azimuth angle. Similar to our previous method, real-time feature extraction is performed within a fixed and limited number of rotor revolutions, with subsequent classification using a random forest algorithm to categorize misalignment levels as low, medium, or high.
However, in this work, we extend our dataset to include scenarios with multiple misaligned blades, demonstrating that the approach still achieves high performance. Additionally, we enhance the original framework architecture by designing a hierarchical classification structure. Specifically, after the initial layer, aimed at reporting the presence of a misalignment, our novel methodology integrates an additional layer comprising a random forest classifier to localize the specifically affected blade in the case that misalignment is detected. Last, to further enhance detection accuracy, we also propose an alternative classification approach for the first layer that leverages linear regression to precisely quantify misalignment severity. Evaluation results validate the effectiveness of our approach, showcasing exceptional accuracy in misalignment classification, regression, and localization, even under realistic turbulent wind conditions.
To summarize, significant progress beyond existing solutions in the field includes the following.
-
Precise detection of pitch misalignment. The presented method is capable of detecting misalignment conditions even in the case that multiple blades are misaligned, also reporting the exact entity of the misalignment, even when deviations are as minimal as 0.1°. According to regulations, turbine design tolerates a misalignment of up to 0.3°. Hence, our method provides a finer detection capability, capturing misalignments down to 0.1°, ensuring optimal performance and preventative maintenance within the operational limits.
-
Accurate localization of affected blades. By considering the same minimal set of sensors, the proposed approach is also capable of precisely localizing the misaligned blades. This innovation minimizes the complexity of fault localization, enabling swift and targeted maintenance interventions.
-
Interpretability and robustness. In our prior research (Milani et al., 2024), we stressed the need for physics-based features to maintain robustness, even in turbulent wind conditions. This ensures consistent diagnostic accuracy across different operational scenarios, including cases with turbulent winds. Additionally, by combining these features with an interpretable machine-learning technique like random forest and linear regression, we developed a method with an explainable decision-making process. This allows us to rank feature importance, providing insights to domain experts on key indicators influencing the detection process.
The designed approach performance has been validated considering data from an extensive simulation campaign, which encompasses a wide range of different wind conditions and pitch misalignment, affecting both one blade and multiple blades. To enhance the reliability of the results, we employ a state-of-the-art simulation model commonly used for designing and certifying commercial wind turbine systems.
The article is divided as follows: Sect. 2 compares the expected physical behavior of a wind turbine affected by pitch misalignment on single or multiple blades to the experimental evidence obtained by analyzing an extensive set of simulation data referring to both nominal and anomalous conditions. Section 3 details the adopted techniques to extract significant and effective features in the time and frequency domain and the designed machine-learning methods. Then, the achieved results are presented and discussed in Sect. 4. Last, in Sect. 5 the main achievements of the proposed work are underlined and possible future developments are proposed.
This section compares the theoretical and experimental behavior of a wind turbine in healthy and faulty conditions to look for informative patterns that can be extracted to quantify the misalignment and locate the affected rotor blades. The available dataset is described as well.
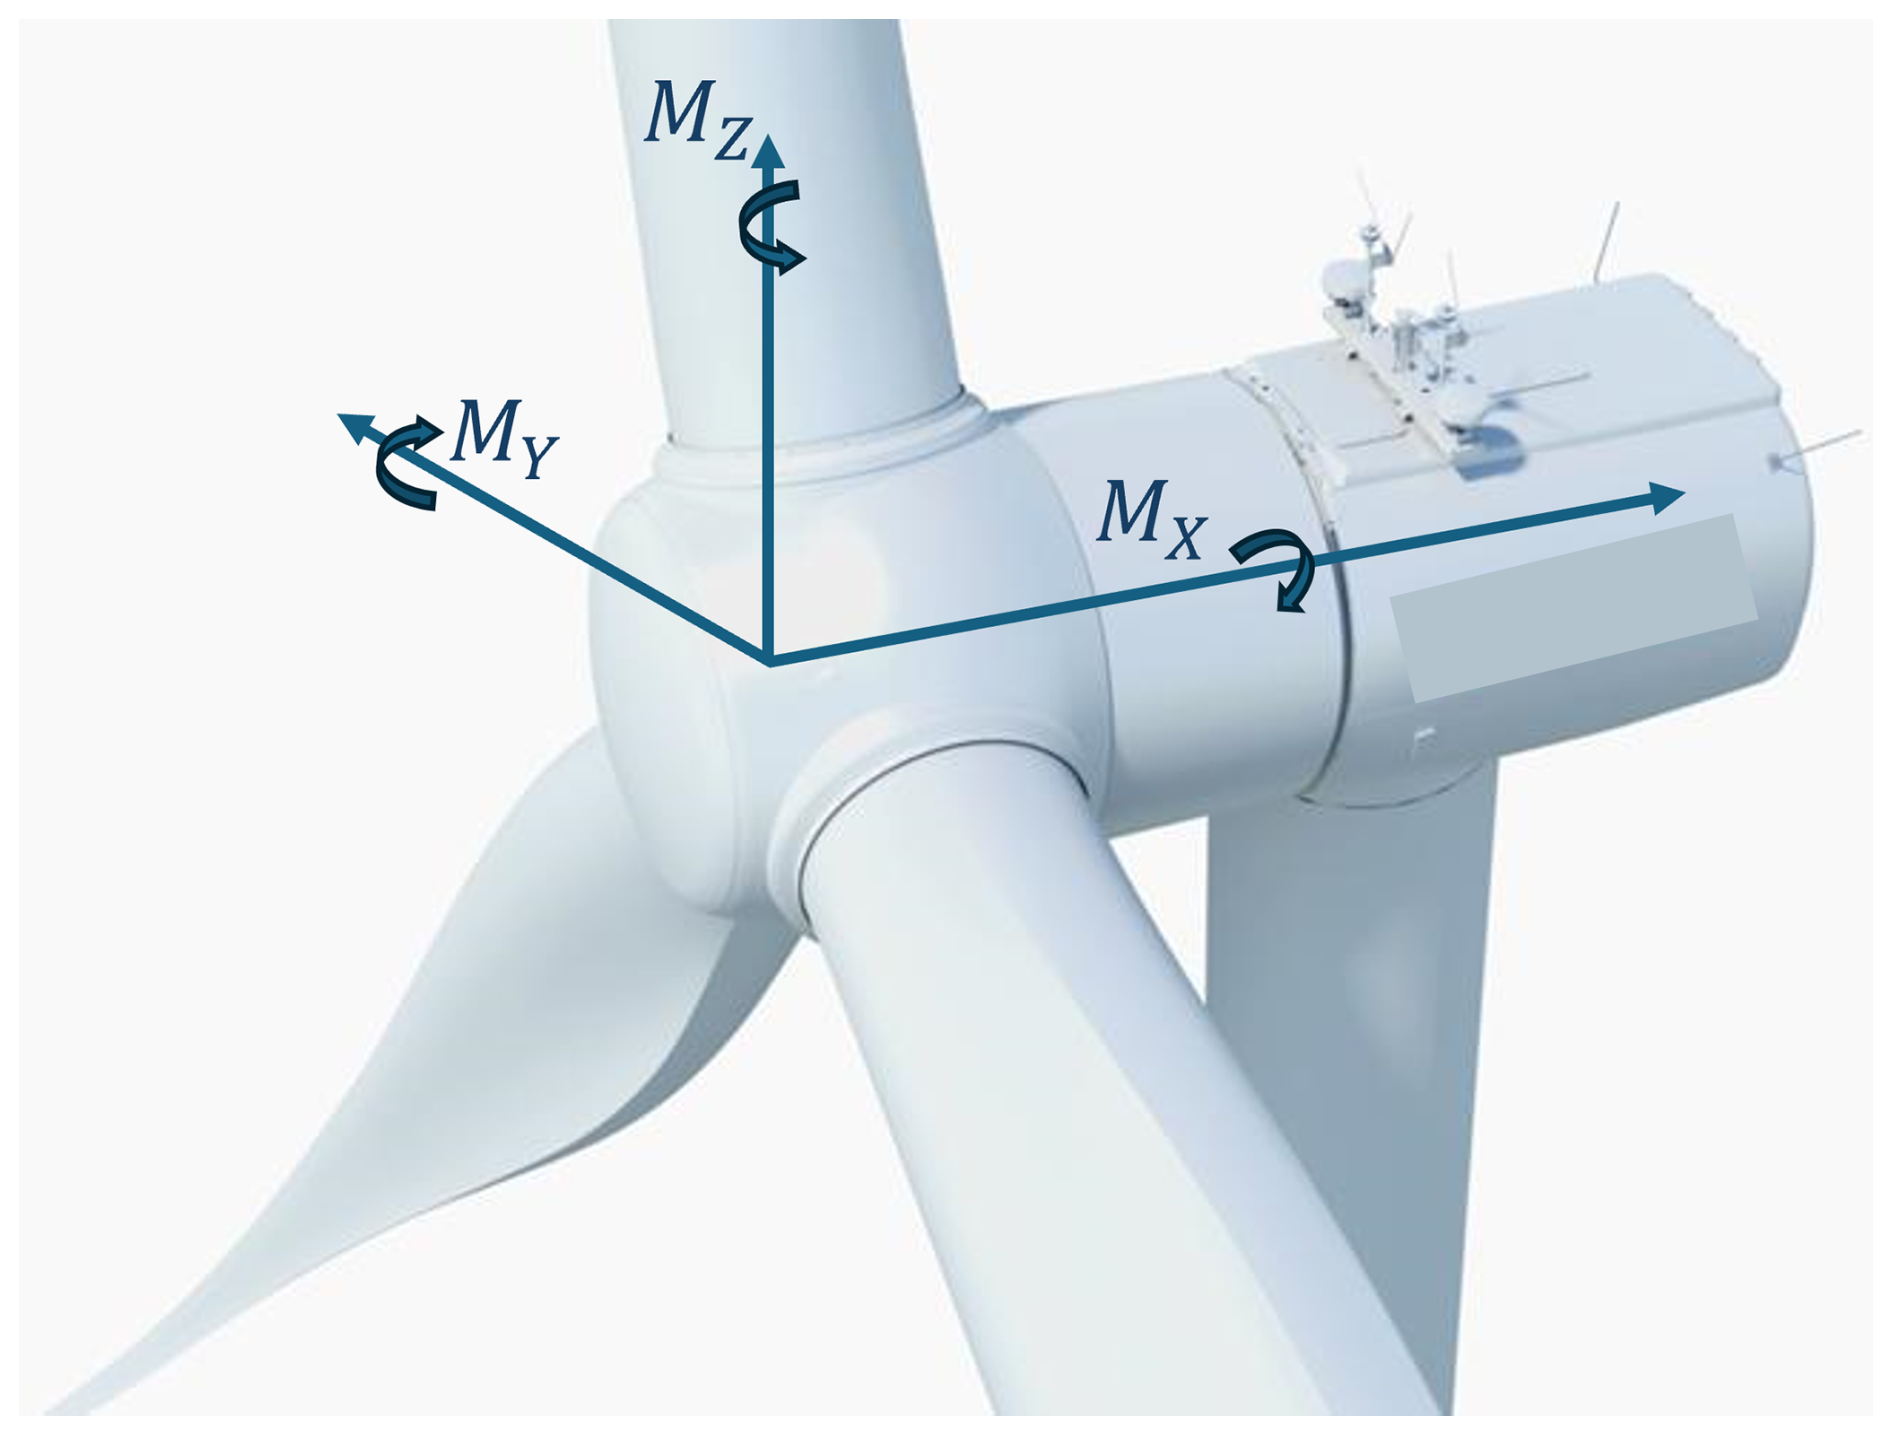
Figure 1Hub coordinate system: x in the direction of the rotor axis, z upwards perpendicular to x, and y horizontally sideways. In the figure the relevant moments My (nodding moment) and Mz (yawing moment) are depicted.
2.1 Rotor system behavior
In a balanced rotating system, loads are conveyed to the fixed frame by the rotor only at the harmonics that are multiples of the number B of blades (i.e., for a three-bladed rotor only the 3 × Rev, 6 × Rev, and 9 × Rev are transmitted, where “Rev” stands for the rotor frequency). On the other hand, when the rotor is unbalanced, loads are transmitted at all harmonics, with 1 × Rev being the most energetic and deceptive frequency. The most significant signals that reveal the presence of the 1 × Rev harmonic contribution in a misaligned scenario are the rotor moments in the fixed reference frame along the lateral and vertical axes, as well as nodding moment My and yawing moment Mz, forces, and accelerations along the same axis. In Fig. 1 the mentioned signals of interest in the fixed reference frame are represented.
Given the considered realistic scenario of wind turbines, where typically force sensors are impractical to be installed, the focus in this work is on the blade root bending, nodding, and yawing moment signals, whose sensing is less demanding, even though the following considerations hold for both acceleration and force signals. As already shown in Cacciola et al. (2016), Cacciola et al. (2018), and Bertelè et al. (2018) in stationary conditions, the loads exerted on the blades of a balanced three-bladed rotor are periodic and shifted by 120°, where the period is associated with the rotor speed, Ω. When transmitted to the fixed frame, blade loads compensate for each other such that fixed frame measurements feature only harmonics at frequencies equal to nBΩ, where n is an integer number and B is the number of blades. As soon as a blade shows a pitch misalignment, the contribution is seen in both the amplitude of the 1 × Rev harmonic conveyed to the fixed reference frame, providing insights into the severity of the misalignment by its amplitude, and the affected blade by its phase.
When turbulence wind conditions are considered, the blade moments are not exactly periodic. Yet, when a sufficiently long time window is analyzed, the turbulence effects tend to compensate and balance, and only secondary 1 × Rev harmonic contributions can be seen in a healthy balanced rotor.
Therefore, when analyzing the harmonic response of the rotor in the fixed frame, the presence of the 1 × Rev harmonic is a clear indication of the presence of the anomaly. The amplitude of this contribution is linearly dependent on the severity of the anomaly – thus the higher the amplitude, the more severe the anomaly – and its phase is an indicator of the affected blade.
These considerations hold whenever a fixed wind velocity is considered for different anomaly cases. When considering different wind velocities, the amplitude of the harmonic response changes, and the higher the velocity the higher the amplitude of the peak at the 1 × Rev harmonic. In addition, the position of the peak shifts along the spectrum frequencies, according to the velocities as explained in more detail in the next paragraphs.
Through extensive simulation studies, we can state that even mild pitch misalignment angles may induce significant vibratory issues, while their impact on overall power output and annual energy production remains limited. To better show this, in Fig. 2, we show the power curve, extracted from 10 min turbulent simulations, for the healthy turbine (blue line) and the unbalanced one (red line), where blade no. 1 is misaligned by 2.0°. The effect of pitch misalignment on power production can only be seen around a rated speed of V=13 m s−1 associated with a loss of ∼167 kW equal to about 3.5 % of the power produced at the same speed. In the full-power region, i.e., above 15 m s−1, the pitch misalignment does not seem to impact power because the controller compensates for it by collectively pitching the blades.
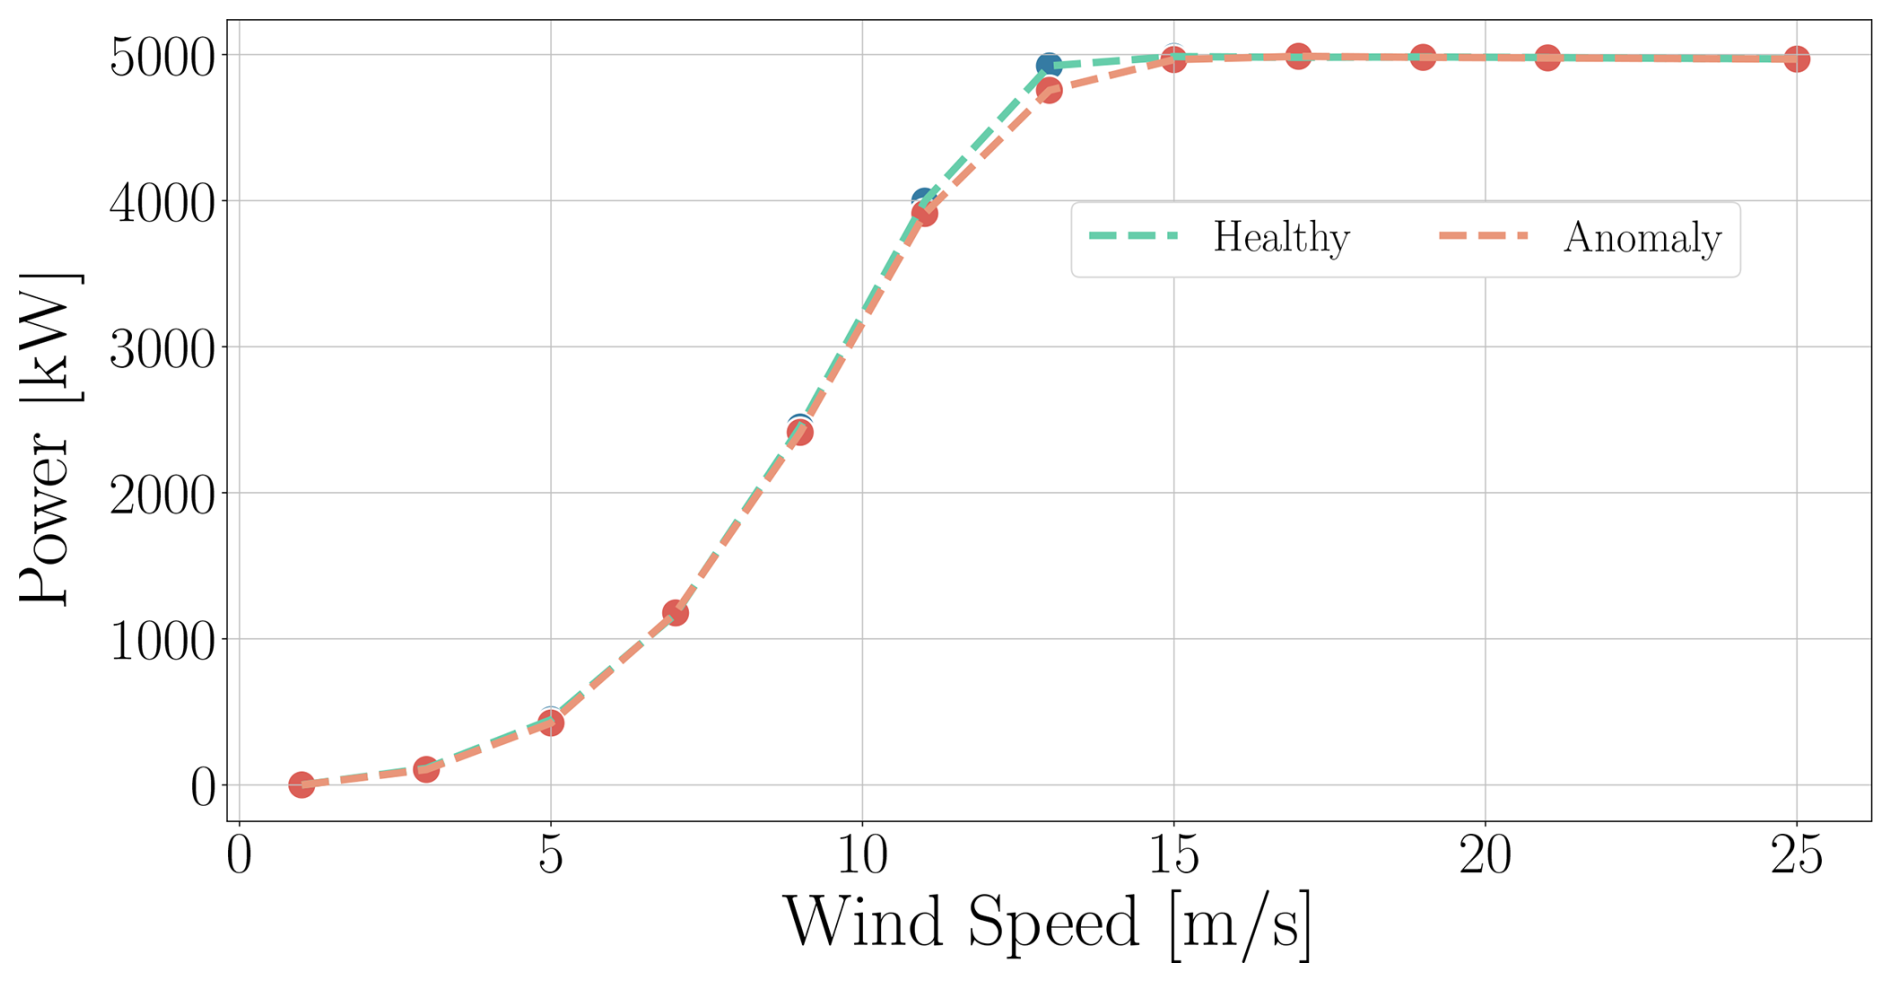
Figure 2Power curves associated with a healthy (blue line) and an unbalanced (red line) case. The unbalanced case refers to a pitch offset of 2° applied to the first blade. The maximum power loss is experienced at V=13 m s−1 and is approximately equal to 167 kW.
2.2 Collected dataset structure
Before detailing the proposed method, our initial endeavor was to generate a dataset of wind turbine virtual measurements aligned with what is expected in a realistic operational condition. To achieve this, we harnessed an extensive dataset gathered from virtual experiments conducted through the software Cp-Lambda, a high-fidelity simulation multibody tool (Bottasso and Croce, 2009–2018). Within this simulator, the flexible elements of the turbine (e.g., tower, blades, shaft) are modeled as kinematically exact beams with predefined 6×6 sectional stiffness properties (Bauchau, 2011). The classical blade element momentum theory is used for rotor aerodynamics, whereas lifting lines are employed for rendering the aerodynamic forces and moments exerted on the blades, tower, and nacelle. The rotor aerodynamic model implemented in Cp-Lambda was recently validated against data from an 80 m diameter wind turbine in sheared and yawed inflow conditions (Boorsma et al., 2023).
A multibody model of the NREL 5 MW baseline was implemented in Cp-Lambda and used for all simulations. The turbine is a realistic three-bladed, variable pitch-controlled machine with a diameter of 126 m that is thoroughly described in Jonkman et al. (2009).
This simulation environment also possesses the ability to replicate an array of inflow types, including steady and turbulent wind conditions, and can reliably simulate misalignment scenarios of different severity across one blade or multiple blades concurrently.
The considered turbulent wind conditions are reproduced according to a normal turbulence model (NTM), as defined in the standards (IEC 61400-1 Ed.3., 2004), with air density ρ=1.225 kg m−3.
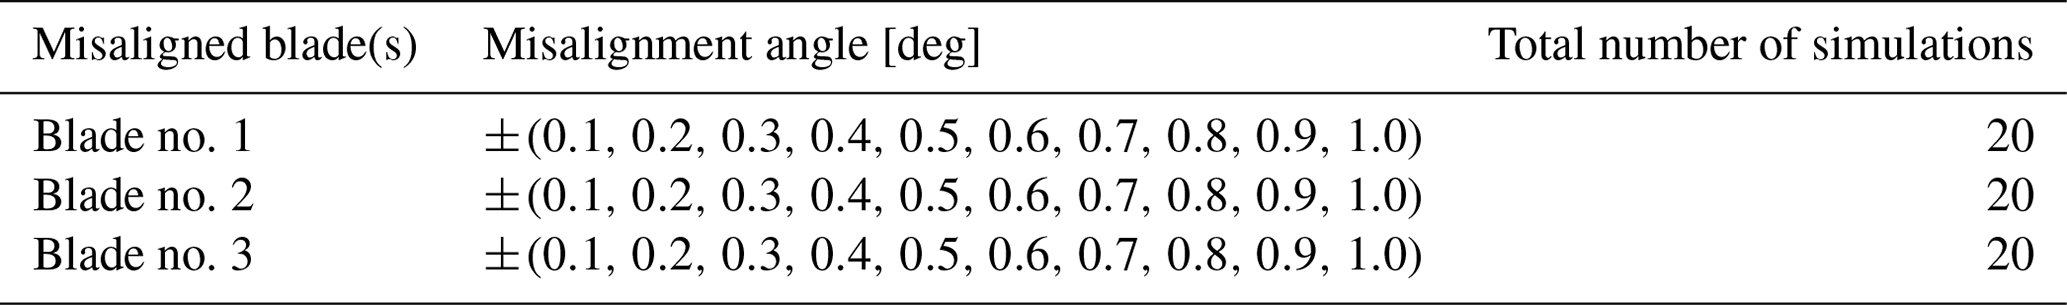
In particular, the whole simulated dataset is divided into 77 cases, 6 of which are considered to be in healthy conditions and 71 are included in the anomaly. Among all anomaly cases, seven consider misalignment in multiple blades, while the remaining ones are related to a single misaligned blade. Each case comprises 12 simulations of 10 min length, conducted at varying averaged wind speeds to cover all operative turbine statuses ranging from cut-in speed at v=3 m s−1 to cut-out at v=25 m s−1. The overall dataset is then divided into two subsets employed for classification and regression analysis. More specifically, the regression analysis is performed on cases featuring a misalignment angle up to 1°, including healthy conditions, whereas classification is performed on cases featuring misalignment angles ranging from 0.1 to 2°.
More details on the dataset can be found in Tables 1 and 2, where the two subsets of the dataset exploited for classification and regression are described.
Moreover, in order to gather realistic information, all scenarios, healthy and anomaly, were simulated using turbulent inflows featuring a different seed. As previously mentioned, a minimal set of sensors is utilized in this study, encompassing the following measurements:
-
flap-wise () and edge-wise () blade root moments (with according to the considered blade), sampled to capture the averaged values over a rotor revolution, providing insights into the loads experienced by the blades;
-
nodding (My) and yawing (Mz) moments at the main bearing, sampled to capture both the amplitude and phase of the oscillation at rotor frequency, allowing for an in-depth analysis of the dynamic behavior of the turbine;
-
wind speed, sampled to capture averaged values over 10 min; and
-
rotor azimuth angle, sampled to perform the demodulation of nodding and yawing moments, enabling the separation of rotor-related periodic effects.
Table 1Overall combinations of simulations exploited in the “misalignment classification”.
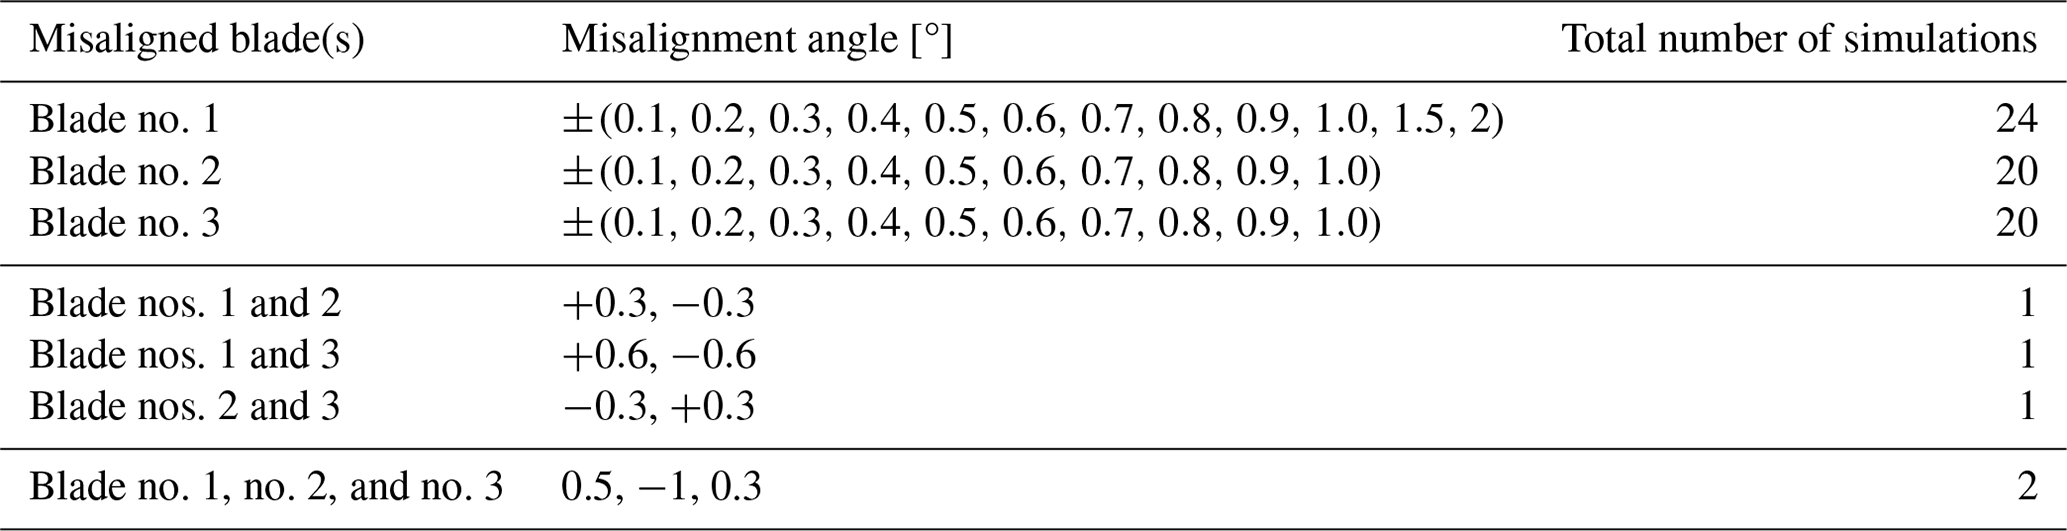
Table 2Overall combinations of simulations exploited in the “misalignment regression”.
2.3 Spectral analysis
The harmonic analysis of the blade moments, when a healthy scenario is considered, exhibits different amplitude peaks according to the spectrum harmonics. As stated previously, only multiples of B are conveyed by the rotor on the fixed reference frame (in the case under study, B=3). Therefore, in the healthy scenario, only harmonic peaks at 3 × Rev, 6 × Rev, 9 × Rev, and so on are expected to be seen in the spectrum. As soon as an anomaly arises, the 1 × Rev harmonic amplitude increases, as shown in the spectrum, with higher amplitude associated with more severe pitch misalignment on the affected blade.
The previous considerations hold in different wind turbulence conditions and at different wind velocities. However, as previously mentioned, it is necessary to deal with the difference in amplitude and position of the peak in the spectrum due to the rotor velocity. To avoid dependency on the wind velocity, Fourier transformation applied to the signals of interest (blade mechanical moments) is performed concerning the azimuth signal. In such a way, the harmonic response is characterized by a dependency on the rotor frequency revolutions only.
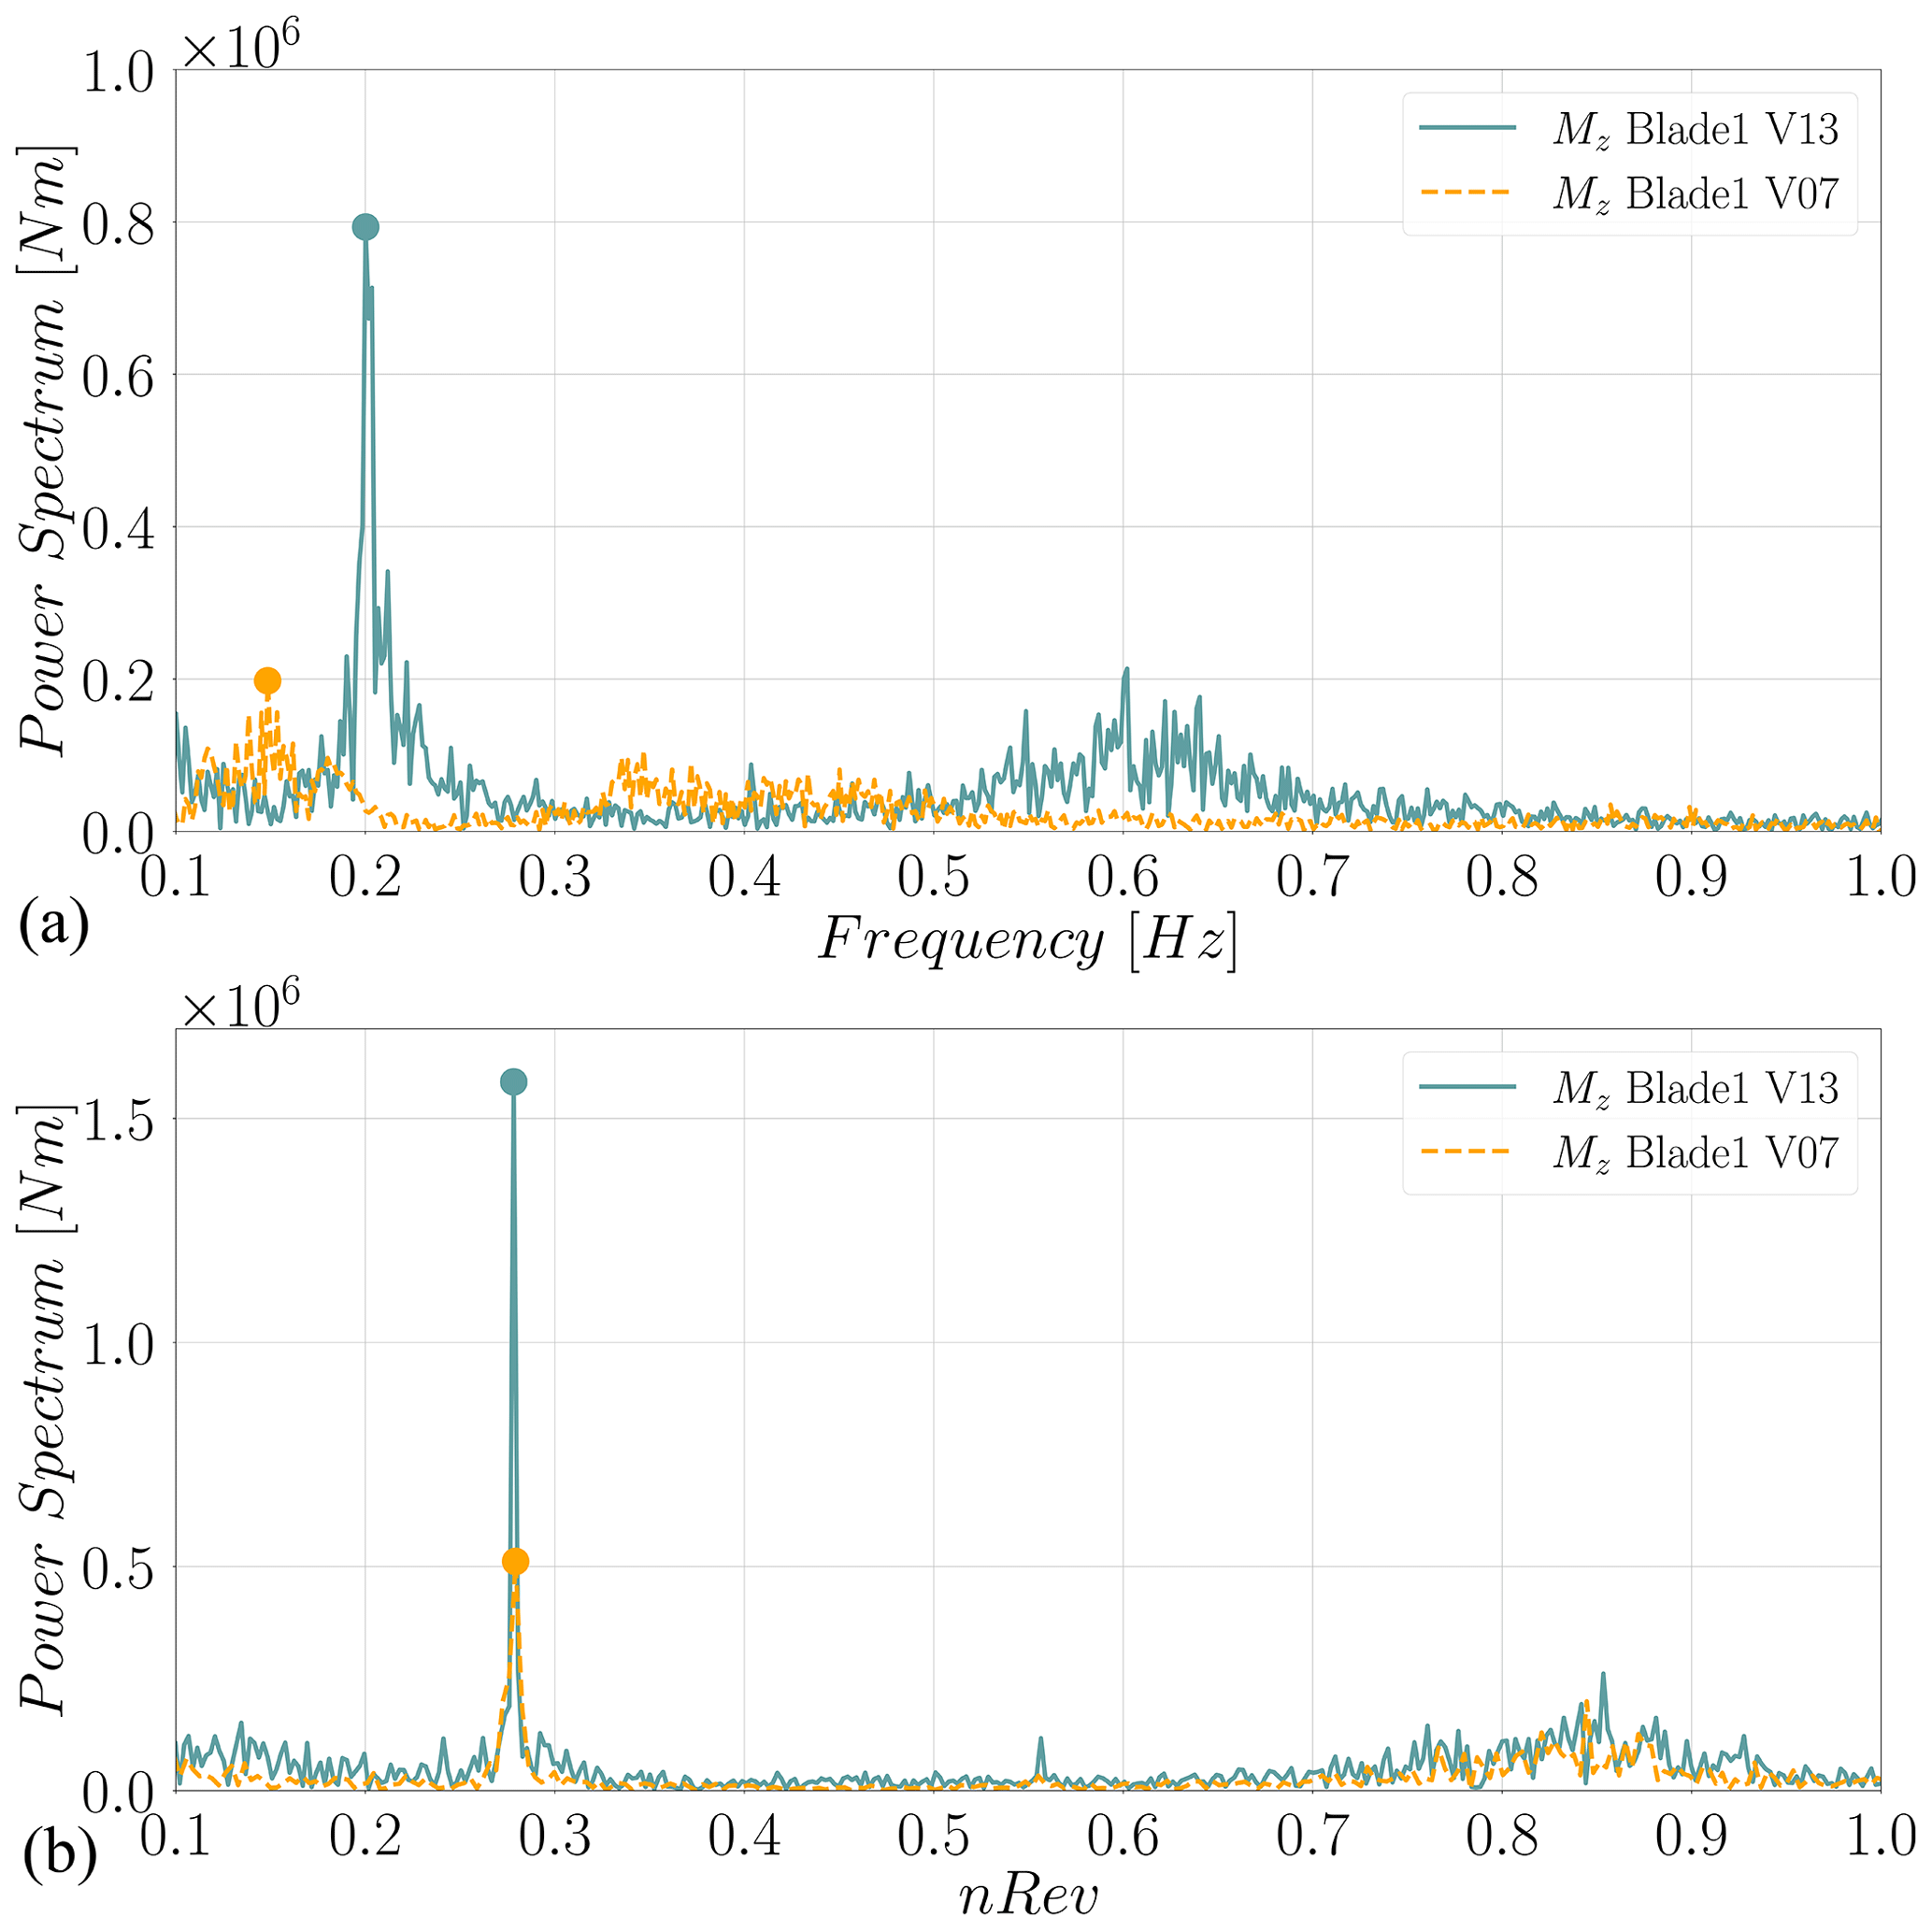
Figure 3In this figure the same signal, namely the yawing moment, is analyzed in the frequency domain when blade no. 1 is misaligned. In panel (a), the expected peak at 0.2 Hz changes position when considering two different wind speeds (V13 refers to a wind speed of V=13 m s−1 and V07 to V=7 m s−1), while it remains centered around the 1 × Rev for the azimuth-based spectrum in panel (b).
Figure 3 displays the spectrum of the yawing moment Mz in a condition where blade no. 1 is misaligned. The two curves refer to the output of two simulations at V=7 m s−1 and V=13 m s−1, respectively associated with a rotor speed equal to 8.1 and 12 RPM. As shown in the upper plot of the figure, when computing the power spectrum using the time-based Fourier transform, the expected peak at the rotor frequency shifts following the average rotor speed. On the other side, computing the azimuth-based transformation the peak associated with the 1 × Rev clearly remains in the same position.
In this context, the area subtended below the peak at the 1 × Rev harmonic is a fundamental indicator to distinguish between healthy and nominal rotor behavior, characterized by a negligible peak amplitude, and the misaligned rotor cases in which the increment of the peak amplitude leads to higher area values. As reported in Fig. 4, the power spectra of the nodding and yawing moments were simulated in three different cases: a nominal one and two affected by misalignment on a single blade and three blades at a time. Each case is simulated for the same wind velocity (a medium wind speed of v=15 m s−1). The healthy case is characterized by no peak at 1 × Rev, while the other two cases show a peak whose amplitude has a dependency on the anomaly magnitude. Indeed, signals reported in the figure refer to the following cases:
-
a case where only blade no. 2 is affected by a misalignment of 0.5° in light blue and
-
a case where all blades are displaced by 1.0, −0.5, and 0.3°, reported in darker blue and as a dashed line.
Indeed, for this latter case, the peak has a greater amplitude than the former one, as shown in the figure.
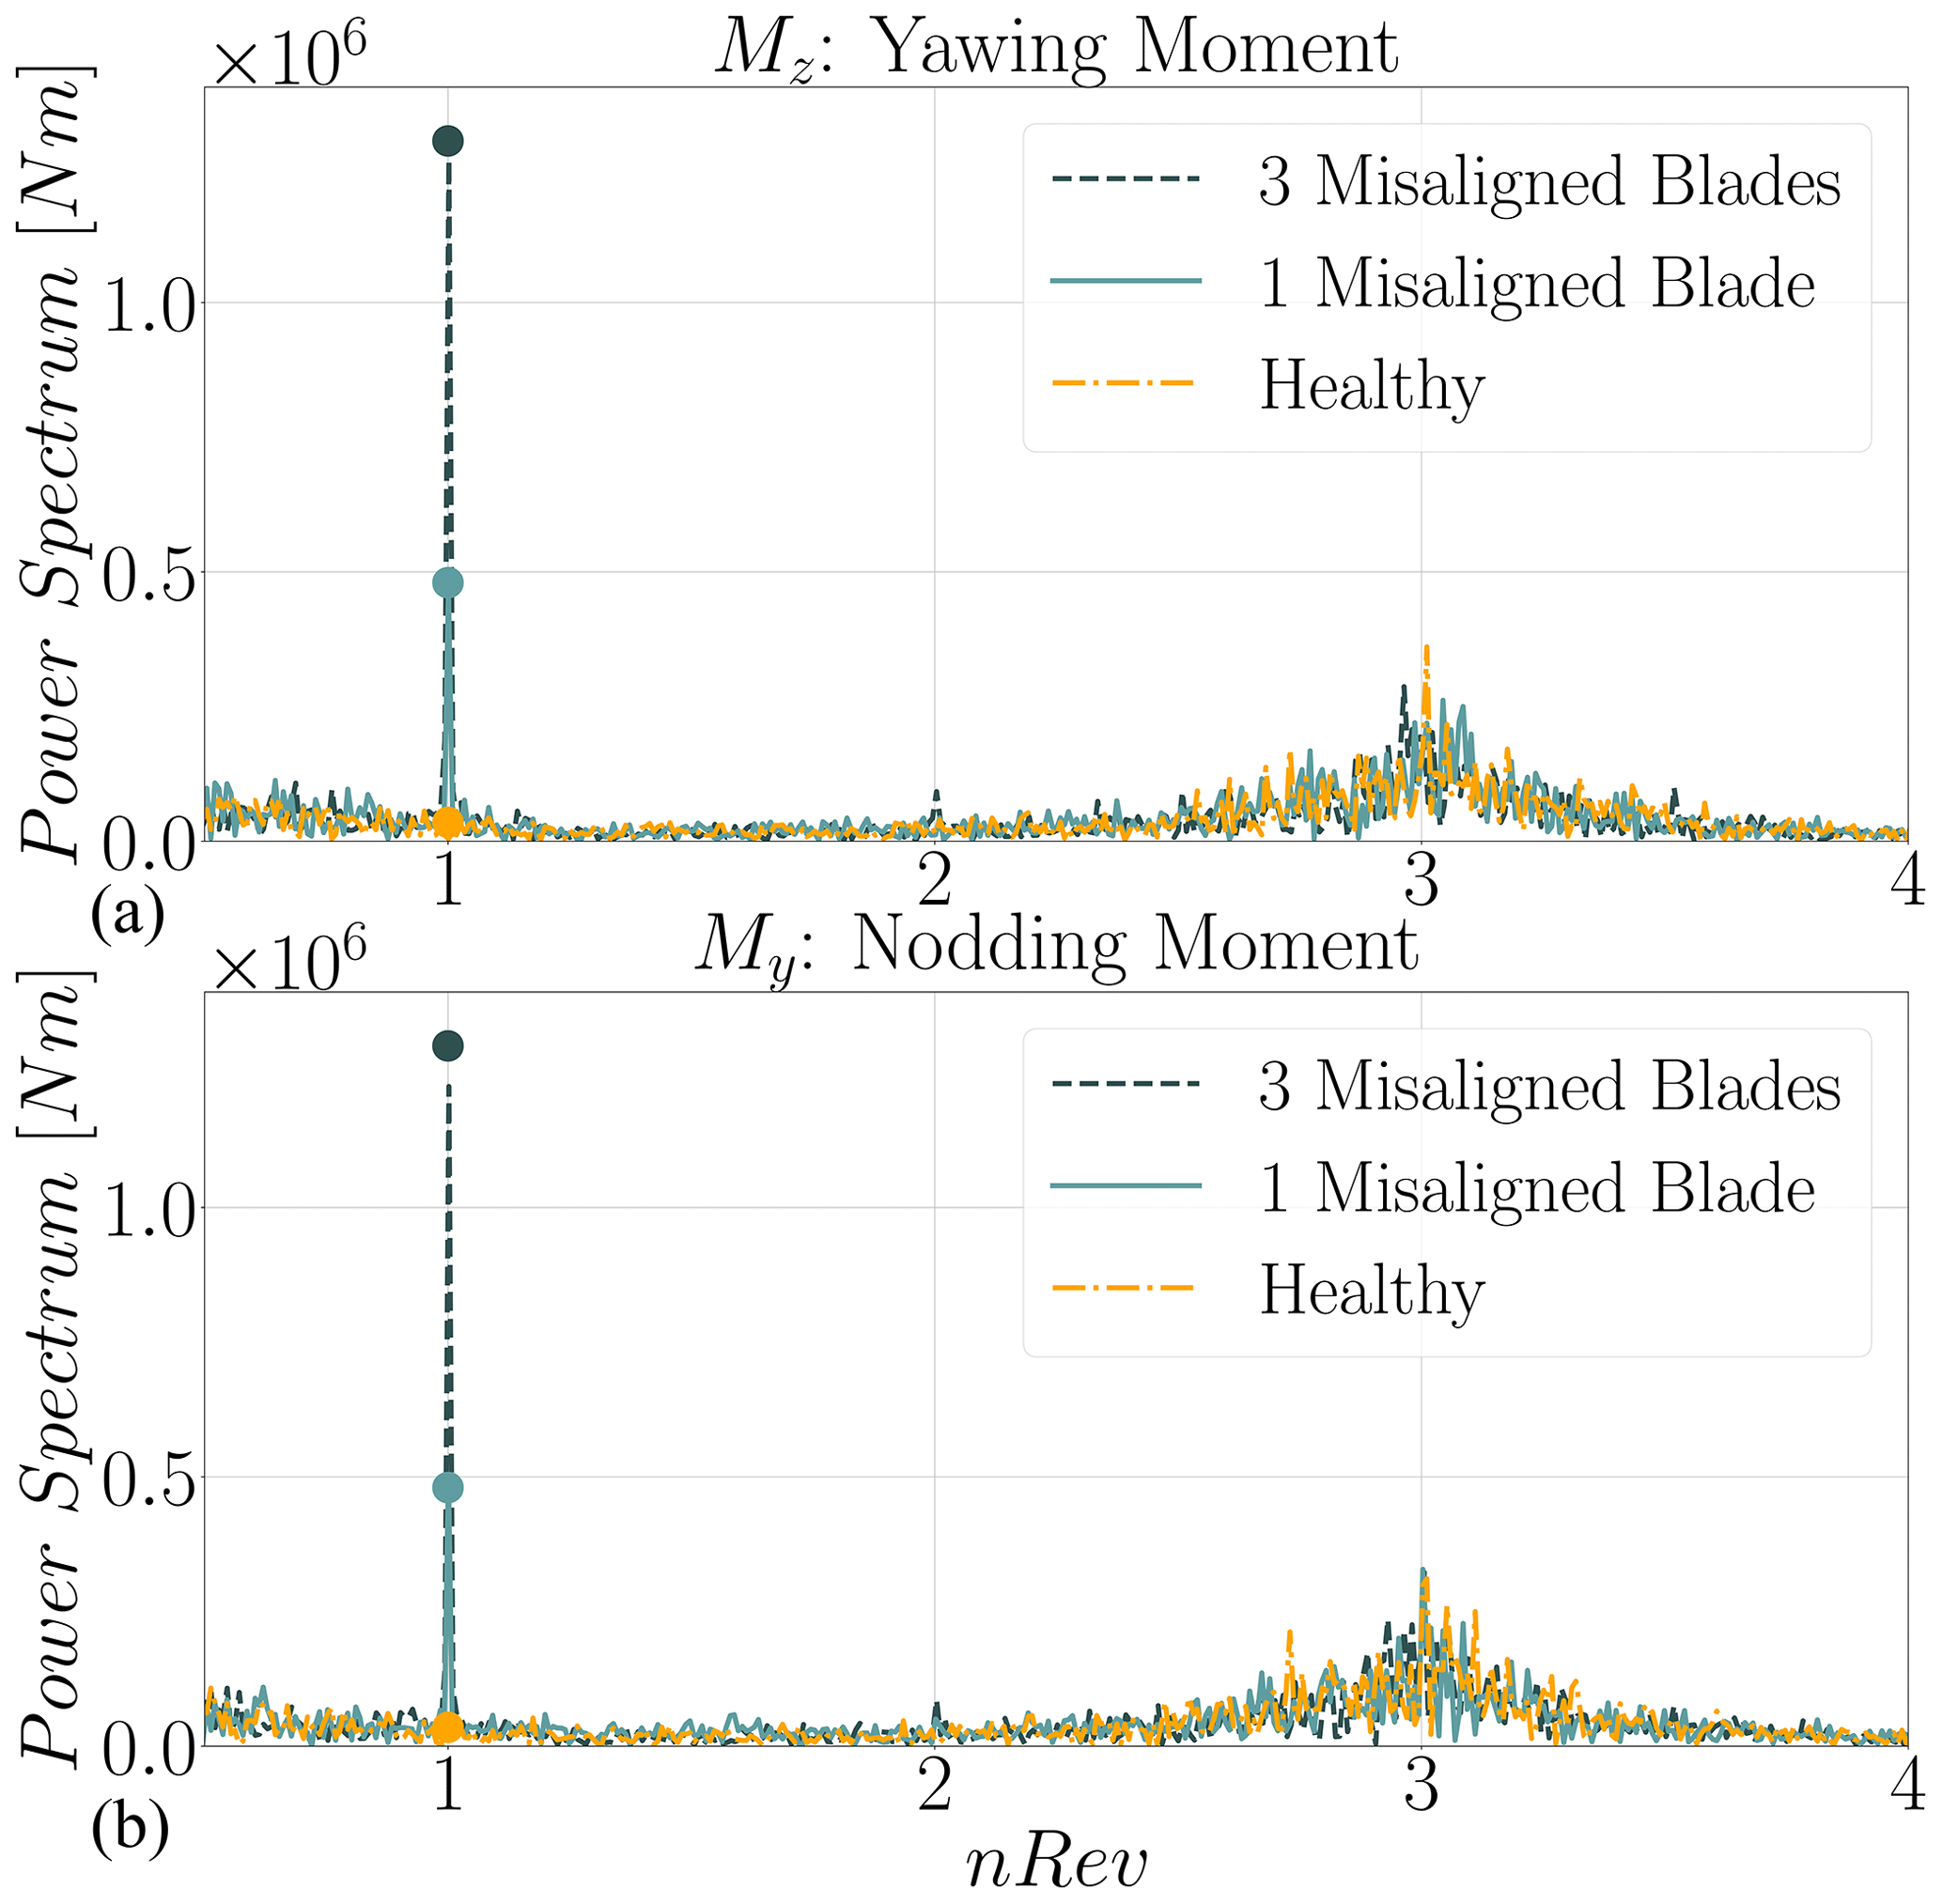
Figure 4In this figure the mechanical moment signal spectra are analyzed in the frequency domain in the case of healthy conditions and two anomaly cases. The peak at 1 × Rev is present only in the anomalous cases.
Moreover, as stated before, the phase of this harmonic is an equivalently important indicator for the location of the pitch misalignment and hence the single blade or multiple blades affected by the anomaly. The phase has been computed by employing a one-revolution moving window to demodulate sine and cosine components at the 1 × Rev component of the signals. Subsequently, a 10 min averaging process has been applied to both components, and then the phase was determined by calculating the arctangent function on the averaged sine and cosine amplitudes.
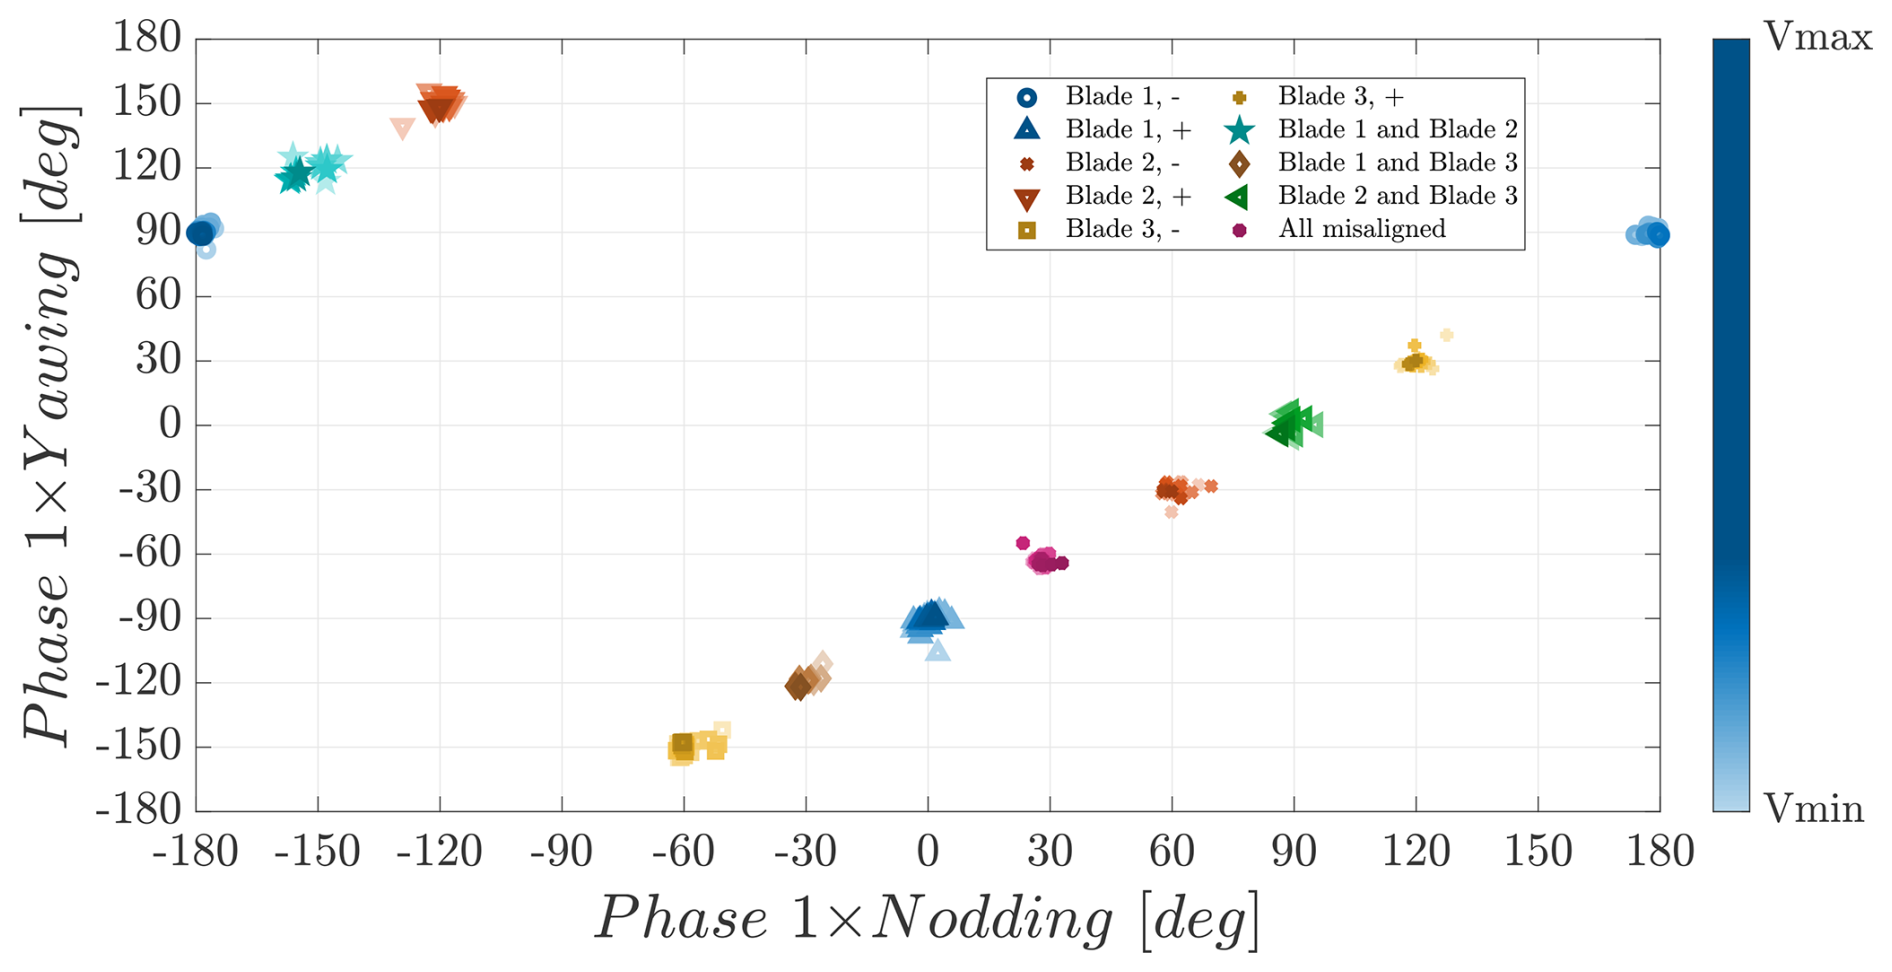
Figure 5In this figure the mechanical moment signal 1 × Rev harmonics phases are reported. Cases in which the same blade is affected by the anomaly are represented with the same color, while a different marker for the same color represents a different misalignment sign for the same blade. Different instances of the same symbol with the same color shading from a lighter to a darker tone represent different phases for the same case but considering different wind velocities. Specifically, the wind velocity increases from the minimum to the maximum considered speed (Vmin=3 m s m s−1) as the bar on the right reports. For the sake of conciseness, the bar is only reported for the case in which blade 1 is misaligned; the same meaning holds for the other cases and colors.
In Fig. 5, the 1 × Rev phase harmonics are displayed for both nodding and yawing moments in each case. As reported in the figure, there are 10 clusters that can be easily grouped. Phases of the cases where blade 1 is affected by a negative misalignment are separated into two different groups on the graph. However, they can be considered a single one as they differ in location on the graph according to the sign of the My signal phase. There are two clusters associated with each single misaligned blade (for both positive and negative pitch misalignment). Additionally, one cluster is dedicated to cases in which two blades are misaligned simultaneously, and lastly, one final group encompasses cases in which all blades are misaligned. Notably, when two blades are simultaneously misaligned, their phase clusters are positioned between the phase clusters related to the individual misalignment of blade cases. In other words, the phases of the cases in which blade no. 1 and blade no. 2 are misaligned fall between the phases of cases in which only blade 1 and only blade 2 are misaligned according to the sign of the misalignment. Hence, the areas subtended below the peak at the 1 × Rev harmonics for both nodding and yawing moments are paramount indicators to be computed as is the phase of these harmonics.
As a further contribution to the isolation of the affected blade, an additional analysis is presented. Considering the blade moment signals on the rotating reference frame when a balanced rotor scenario is considered, the moments are periodic and overall exhibit similar behavior, oscillating around the same average value. As soon as a single blade is affected by the misalignment, the anomalous blade moment outdistances the other signals. The higher the misalignment, the more significant the distance with the other signals. In addition, the direction towards which the anomalous signal shifts is an indicator for the misalignment sign (i.e., positive or negative misalignment). The same considerations hold for the cases when two or more blades are affected by the misalignment, as the overall distribution of the signals in the time domain changes concerning the expected behavior.
Therefore, the average values of the blade moments in the time domain are important indicators as well to identify the affected blades. Furthermore, in the case that more than one blade is affected, the distance between average values is needed as well.
2.4 Features extraction
Given the insight derived from the comparative analysis of the physical system behavior in healthy and misaligned conditions, we define a set of physically informative features to extract from each available simulation. Specifically, we considered the following.
-
Area subtended below the peak at the 1 × Rev for both nodding and yawing moments: A(My),A(Mz)
-
Phases of these harmonics: ϕ(My),ϕ(Mz)
-
Average values of the blade moments in the rotating reference frame and in the time domain: ,, with i being the blade index
-
The absolute difference of the average values , where M stands for the mean values of the considered signal, while i and j are the considered blade indices (e.g., and )
As discussed in Sect. 1, we choose to extract the features using a moving window approach to enable real-time classification. To determine the optimal window size, we conducted a fine-tuning procedure, selecting a fixed number of rotor revolutions N instead of a time duration. This novel approach aligns with our decision to perform the power spectrum analysis based on the azimuth signal. Proper sizing of the window is crucial to prevent extracting irrelevant features. Thus, we perform fine-tuning taking into account both the simulation lengths (600 s each, according to industrial standards; IEC 61400-1 Ed.3., 2004) and wind velocity ranges, resulting in an optimal window size of 40 azimuth revolutions. This size ensures robust Fourier transform performance across varying wind speeds. Along the size of the chosen window, a sliding factor of one azimuth revolution has been selected. In this approach, the sliding factor determines the frequency of shifting the analysis window along the dataset. A smaller sliding factor, such as one revolution, facilitates a more detailed examination of the data, capturing fine-scale variations, while ensuring a continuous and comprehensive analysis.
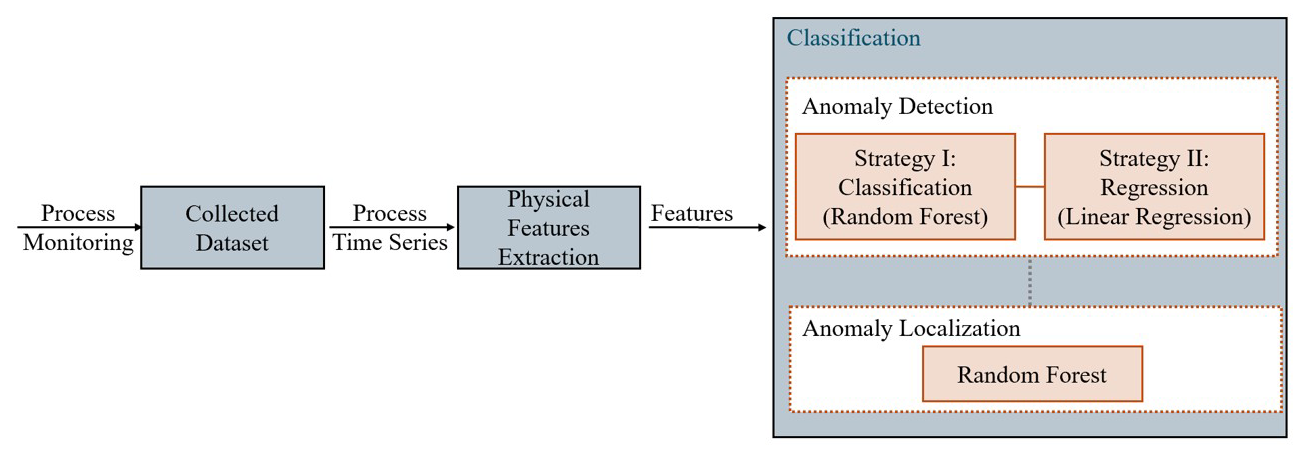
This section outlines the hierarchical classification architecture we designed for detecting and isolating pitch misalignment. As described in Sect. 1, our classification pipeline features two layers: the first identifies misalignment, categorizing its severity as low, medium, or high using the classification model, or precisely predicting the amount using the regression one based on user preferences. The second layer, given that a misalignment is detected, localizes the affected blades. Both layers rely on random forest models for classification, while linear regression is applied for precise estimation of misalignment severity. These models have been chosen for their robustness, accuracy, and interoperability. Specifically, this algorithm combines the output of multiple shallow binary tree classifiers, which splits data according to specific criteria, minimizing the differences in the child nodes at each iteration. Accuracy, precision and Gini index (Ceriani and Verme, 2012) are the most common criteria taken into account when performing the splitting procedure. This structure makes random forest models extremely robust and effective, representing the state of the art considering bagged-tree-based classification techniques. In Fig. 6 a scheme of the employed hierarchical architecture is proposed.
3.1 Pitch misalignment detection
As previously discussed, the first classification layer aims to identify misalignment conditions using the features detailed in Sect. 2. Specifically, this layer considers the areas under the peaks in the spectra of nodding and yawing moments, A(My) and A(Mz), to be key features.
3.1.1 Misalignment classification
In our prior study (Milani et al., 2024), we trained a random forest classifier to learn patterns within the given features to assign each instance, consisting of a set of features corresponding to 40 turbine revolutions, to one of four misalignment conditions:
-
0° misalignment: healthy cases
-
0.1° ° misalignment: anomaly case with low misalignment p
-
0.6° °: anomaly case with medium misalignment p
-
p≥1.5° misalignment: anomaly case with high misalignment p
Here, p is the actual value of detected misalignment. Specifically, this model was composed of four trees, each with depth 10.
3.1.2 Misalignment detection
In this study, we expand upon previous research by introducing and evaluating the performance of a linear regression model. This model, trained using the same set of features employed in the misalignment classification, offers precise quantification of misalignment severity considering default hyperparameters.
Similarly to the random forest classifier, linear regression provides an interpretable decision-making process, enabling users to understand how the model determines the extent of misalignment. However, choosing this regression model instead of the classifier offers users an additional tool for accurately assessing misalignment severity, particularly when precise knowledge of misalignment extent is required. However, it is important to note that classification may be enough unless continuous monitoring of progressive misalignment evolution is required.
3.2 Misaligned blade localization
If a misalignment condition is detected, the instance is passed to the second layer, where another random forest classifier is employed to localize the affected blades. This classifier considers additional features specific to that window frame, specifically the average values of the mechanical moments and their distances (ΔMi,j and M(My), M(Mz)). These indicators have been identified as crucial based on domain expertise and analysis discussed in Sect. 2.
In this case, the possible output classes are as follows.
-
Blade no. 1 misaligned
-
Blade no. 2 misaligned
-
Blade no. 3 misaligned
-
Two blades simultaneously misaligned
-
All blades simultaneously misaligned
In this second instance of random forest, a different selection for the hyperparameters has been set; in particular, the number of trees has been set to 10 with maximum depth 7. Given the higher complexity of this second task, a larger number of trees has been set with respect to the previous instance of the random forest classifier (the higher the number of trees the better in terms of accuracy, yet higher computational time is expected, increasing with the depth of the trees). Therefore, the selected number of trees and the related depth have been chosen as a trade-off between accuracy and computational time.
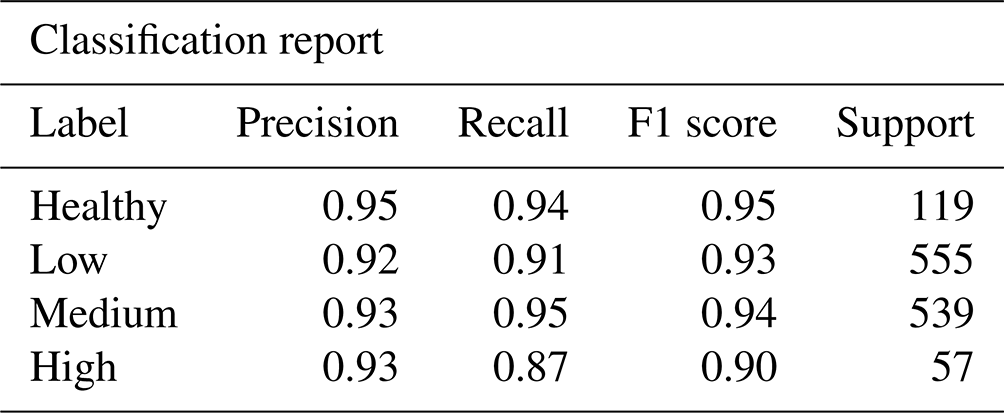
In this section, the experimental results obtained by applying the hierarchical classification architecture described in Sect. 3 to the dataset illustrated in Sect. 2 are discussed. To ensure the robustness and consistency of the reported results, we adopt a hold-out validation approach, using 70 % of the dataset as a training set and the remaining 30 % for the validation. The dataset has been randomly divided. In evaluating our approach, we rely on commonly employed metrics in the machine-learning field. Specifically, for classification, we consider precision, recall, and F1 score. Precision measures the accuracy of predictions within a specific class, while recall (or sensitivity) assesses the proportion of correctly predicted instances within that class out of all instances belonging to the class. Last, the F1 score combines recall and precision, providing a balanced measure that is often regarded as the harmonic mean of the two metrics. Additionally, we report the support, representing the number of instances used to compute the metrics. On the other hand, for evaluating the performance of the regression model, we employ the root mean square error (RMSE), which quantifies the deviation between predicted and actual misalignment for continuous output.
4.1 Misalignment detection results
Initially, we extract the features described in Sect. 2 from the dataset and we provide the resulting instances in the first classification layer. The outcomes provided by the classification model are illustrated in Fig. 7, depicting the normalized area under the peak in the spectra for the test instances and comparing their true and predicted class of misalignment. The normalization scales the data based on the minimum and maximum values within each test of wind velocities from 0 to 1. The presented results indicate that the majority of instances have been correctly classified. These outcomes are further described in Table 3, which highlights the high performance of the first layer based on key metrics in the field, including precision, recall, and F1 score. Specifically, the approach achieves an average F1 score of 93.0 %.
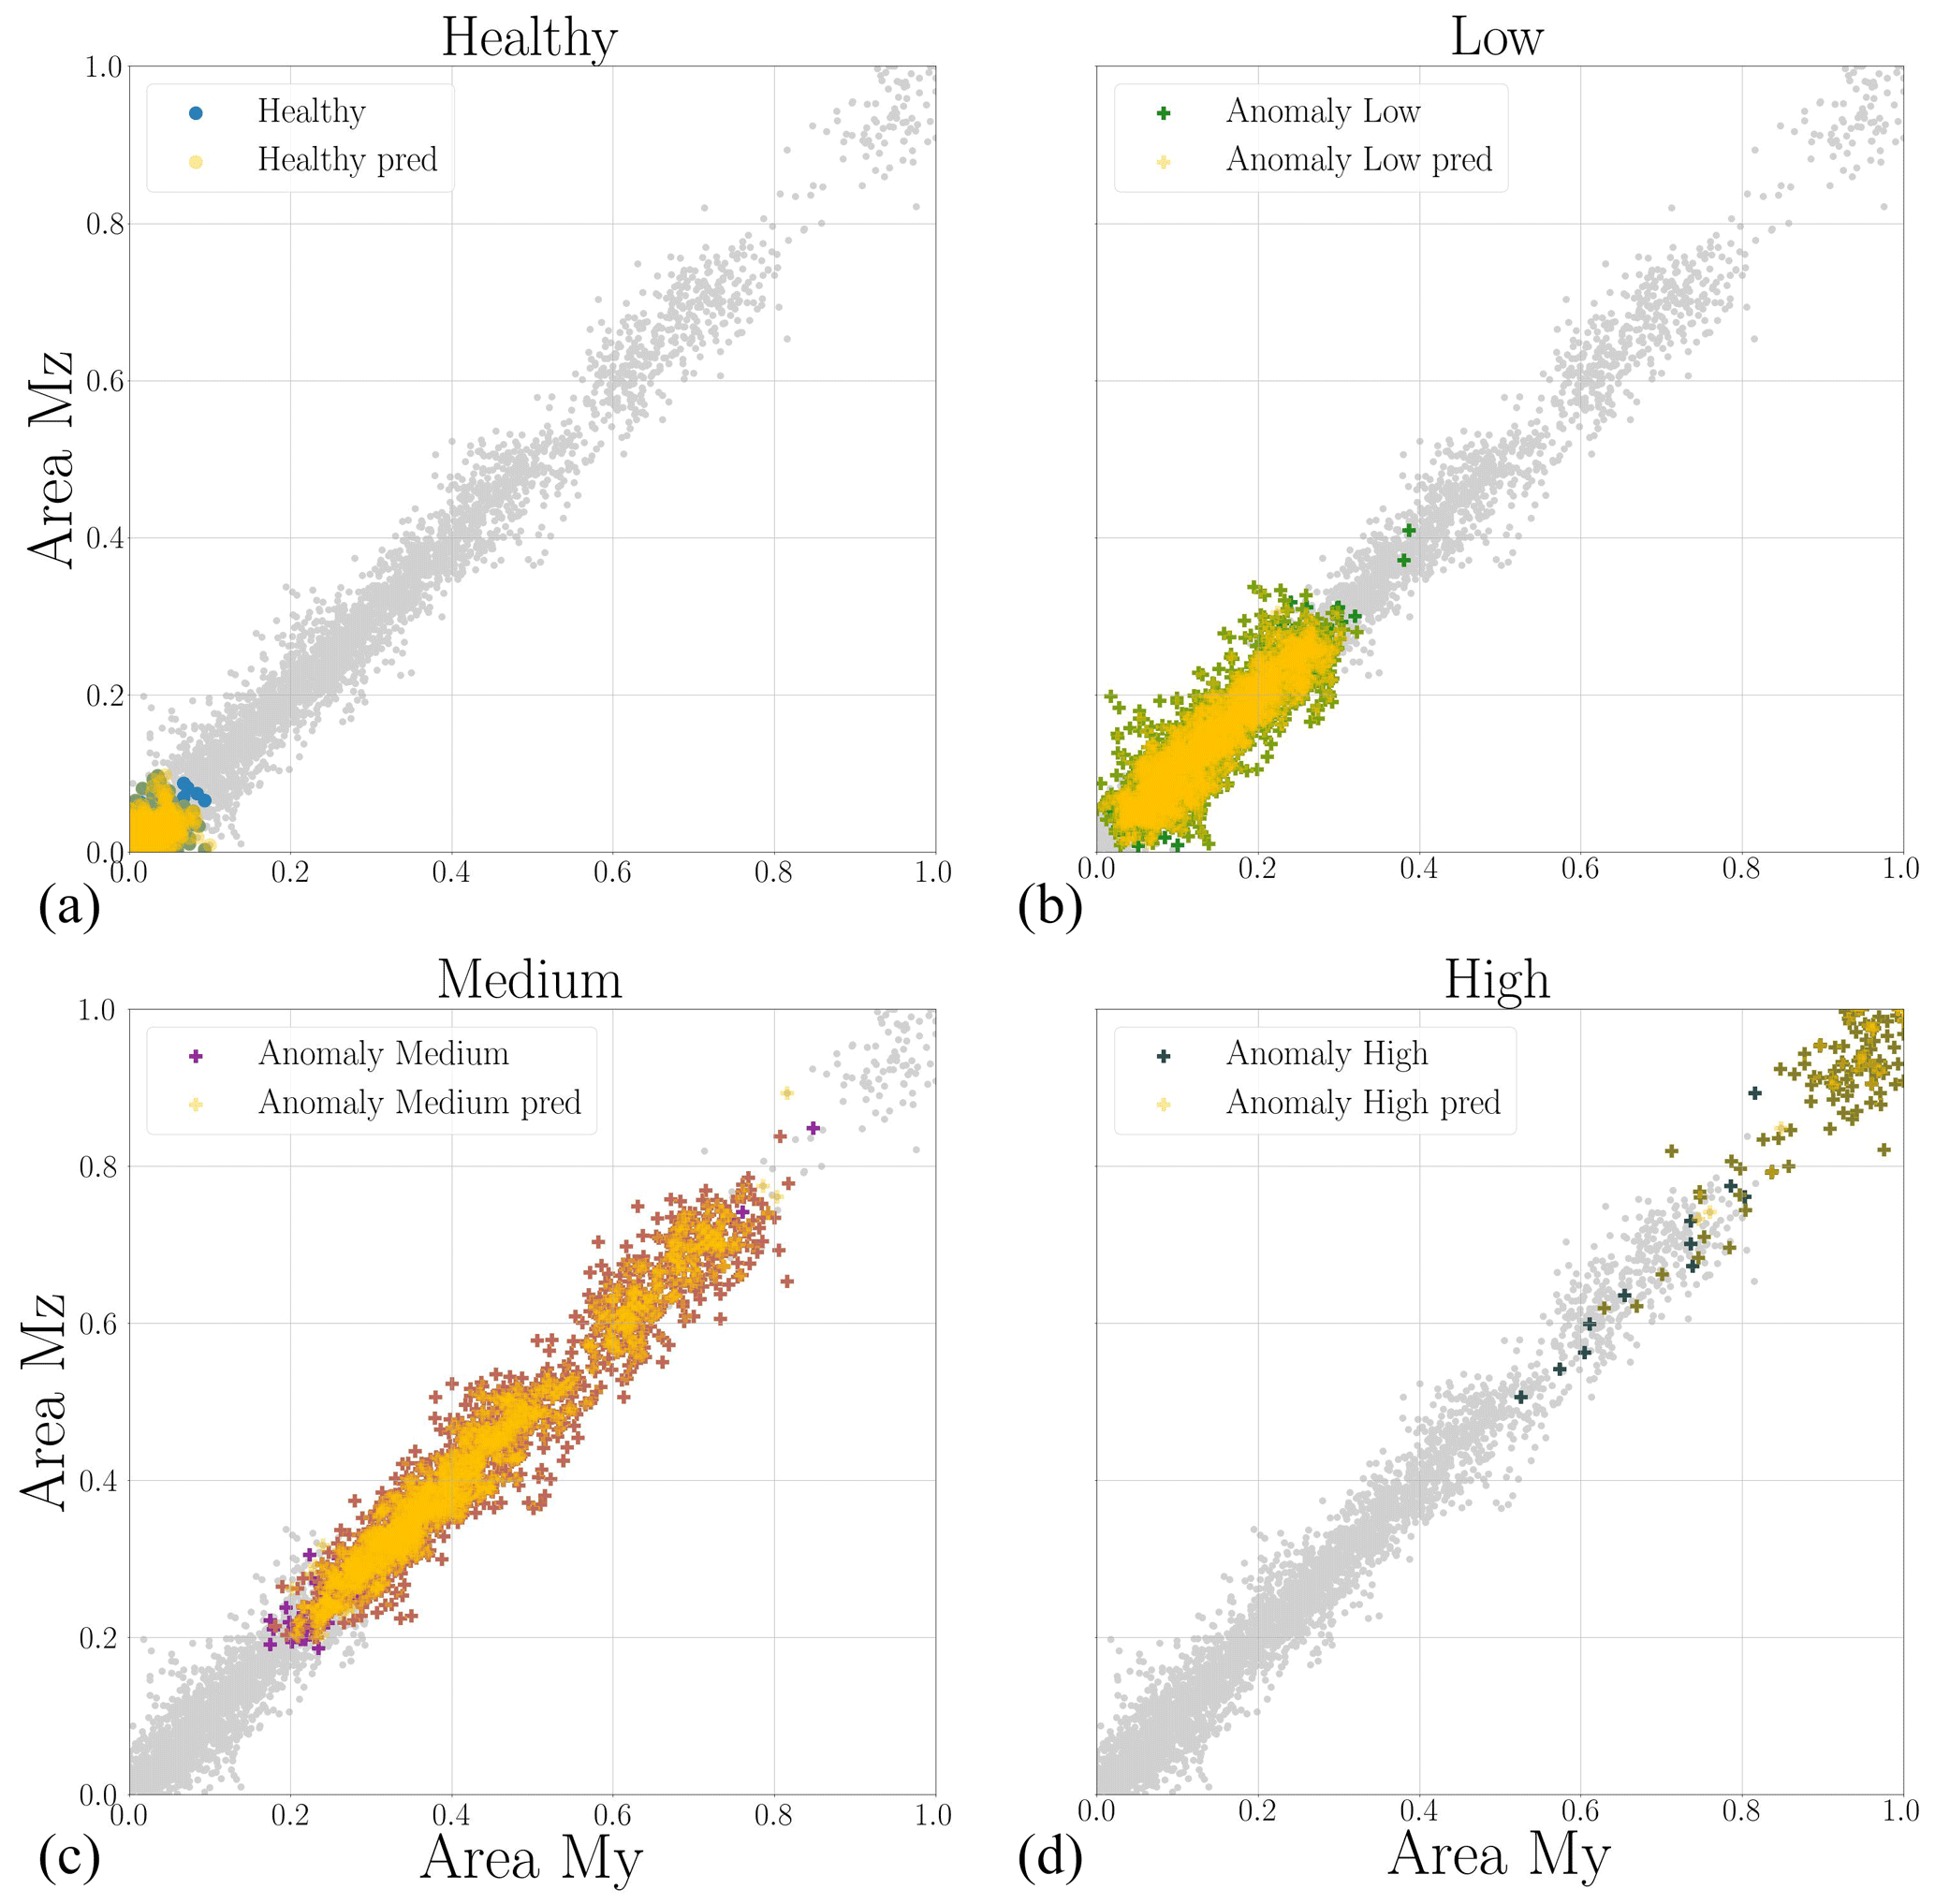
Figure 7Fault and quantification output; in the top left panel are the healthy cases in the dataset and the predicted ones are reported, while in the other panels, low, medium and high misaligned cases are reported, considering both the misaligned cases in the dataset and the predicted ones.
Table 3Metrics computed from the fault and quantification output. Precision focuses on the accuracy of positive predictions, recall emphasizes the ability to capture all positive instances, the F1 score balances precision and recall, and support provides context by indicating the frequency of each class in the dataset.
Concerning the linear regression model, Fig. 8 compares the true and predicted misalignment values. The results demonstrate the accuracy and reliability of the regression model, suggesting it is a viable alternative to the classification model when a more precise diagnosis of misalignment severity is needed. Additionally, Fig. 9 displays the distribution of predicted misalignment values for each degree of true misalignment. Notably, the precision of the regression is remarkable. The average values of the boxes closely align with the diagonal of the graph, indicating that predicted misalignments closely match actual values. Furthermore, the separation of values at the 25th and 75th percentiles in each box plot demonstrates the model's ability to differentiate between various misalignment levels.
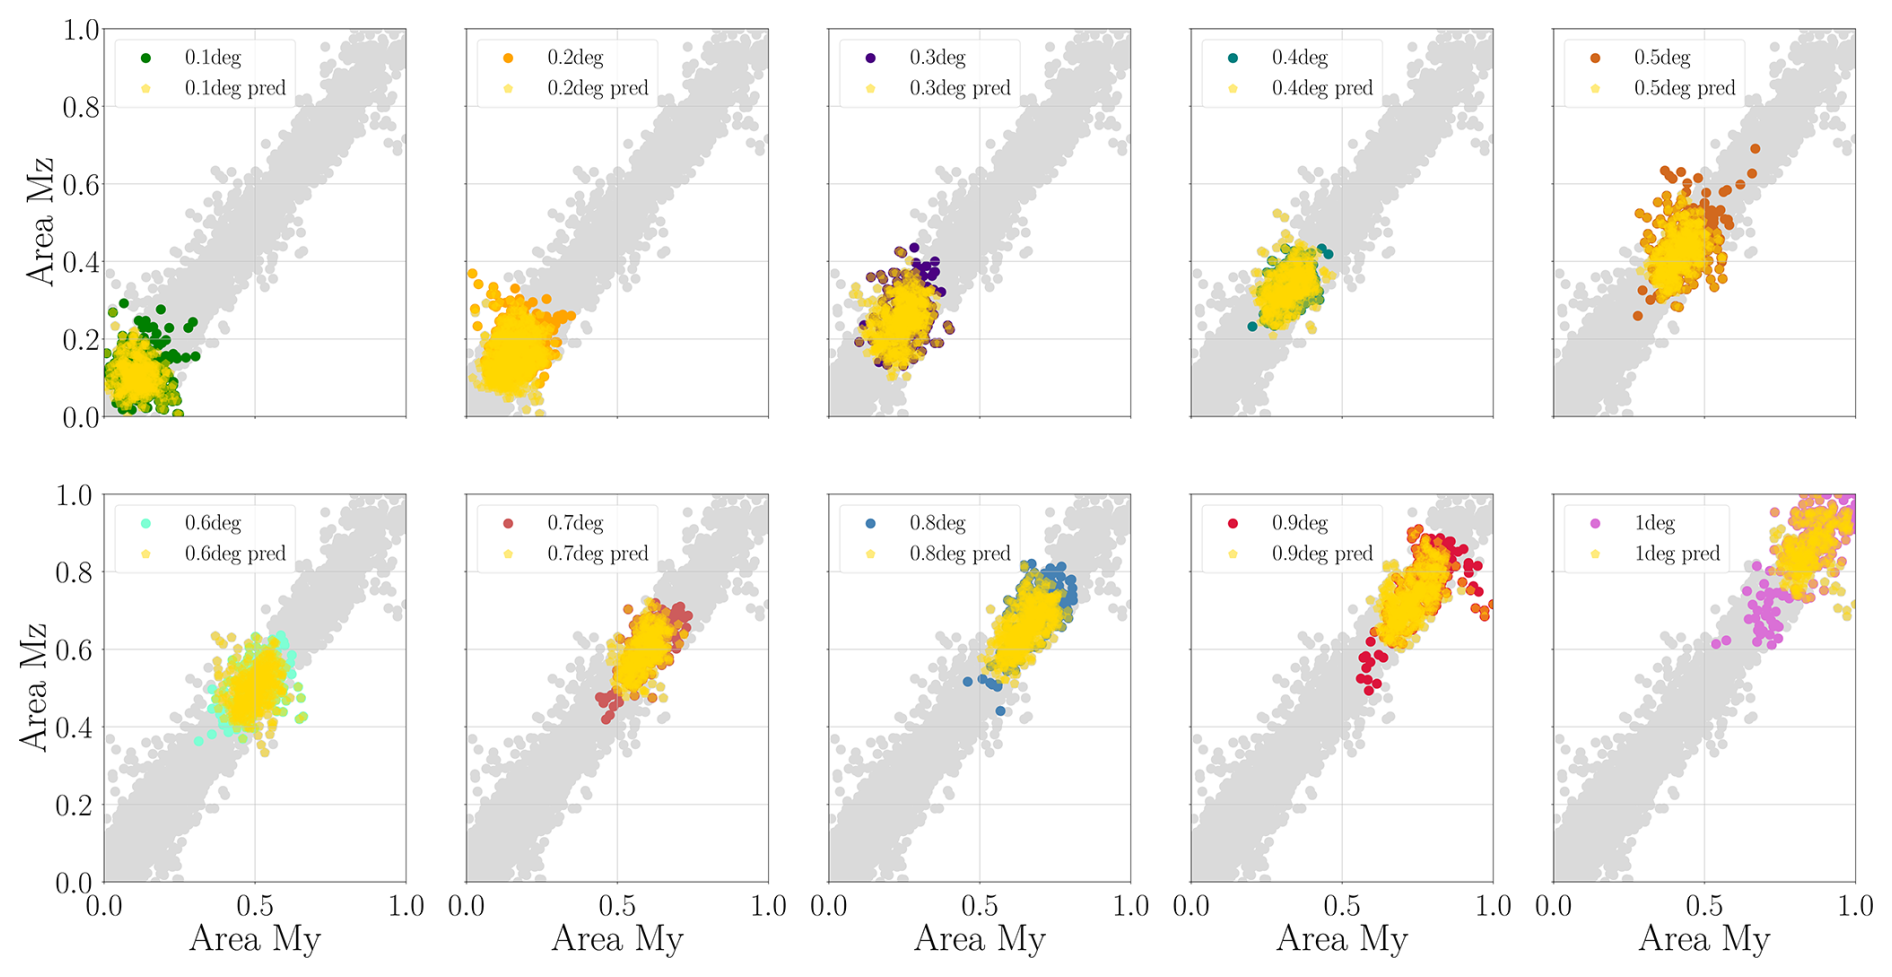
Figure 8Fault and quantification output from linear regression: in each plot a different misalignment instance is considered.
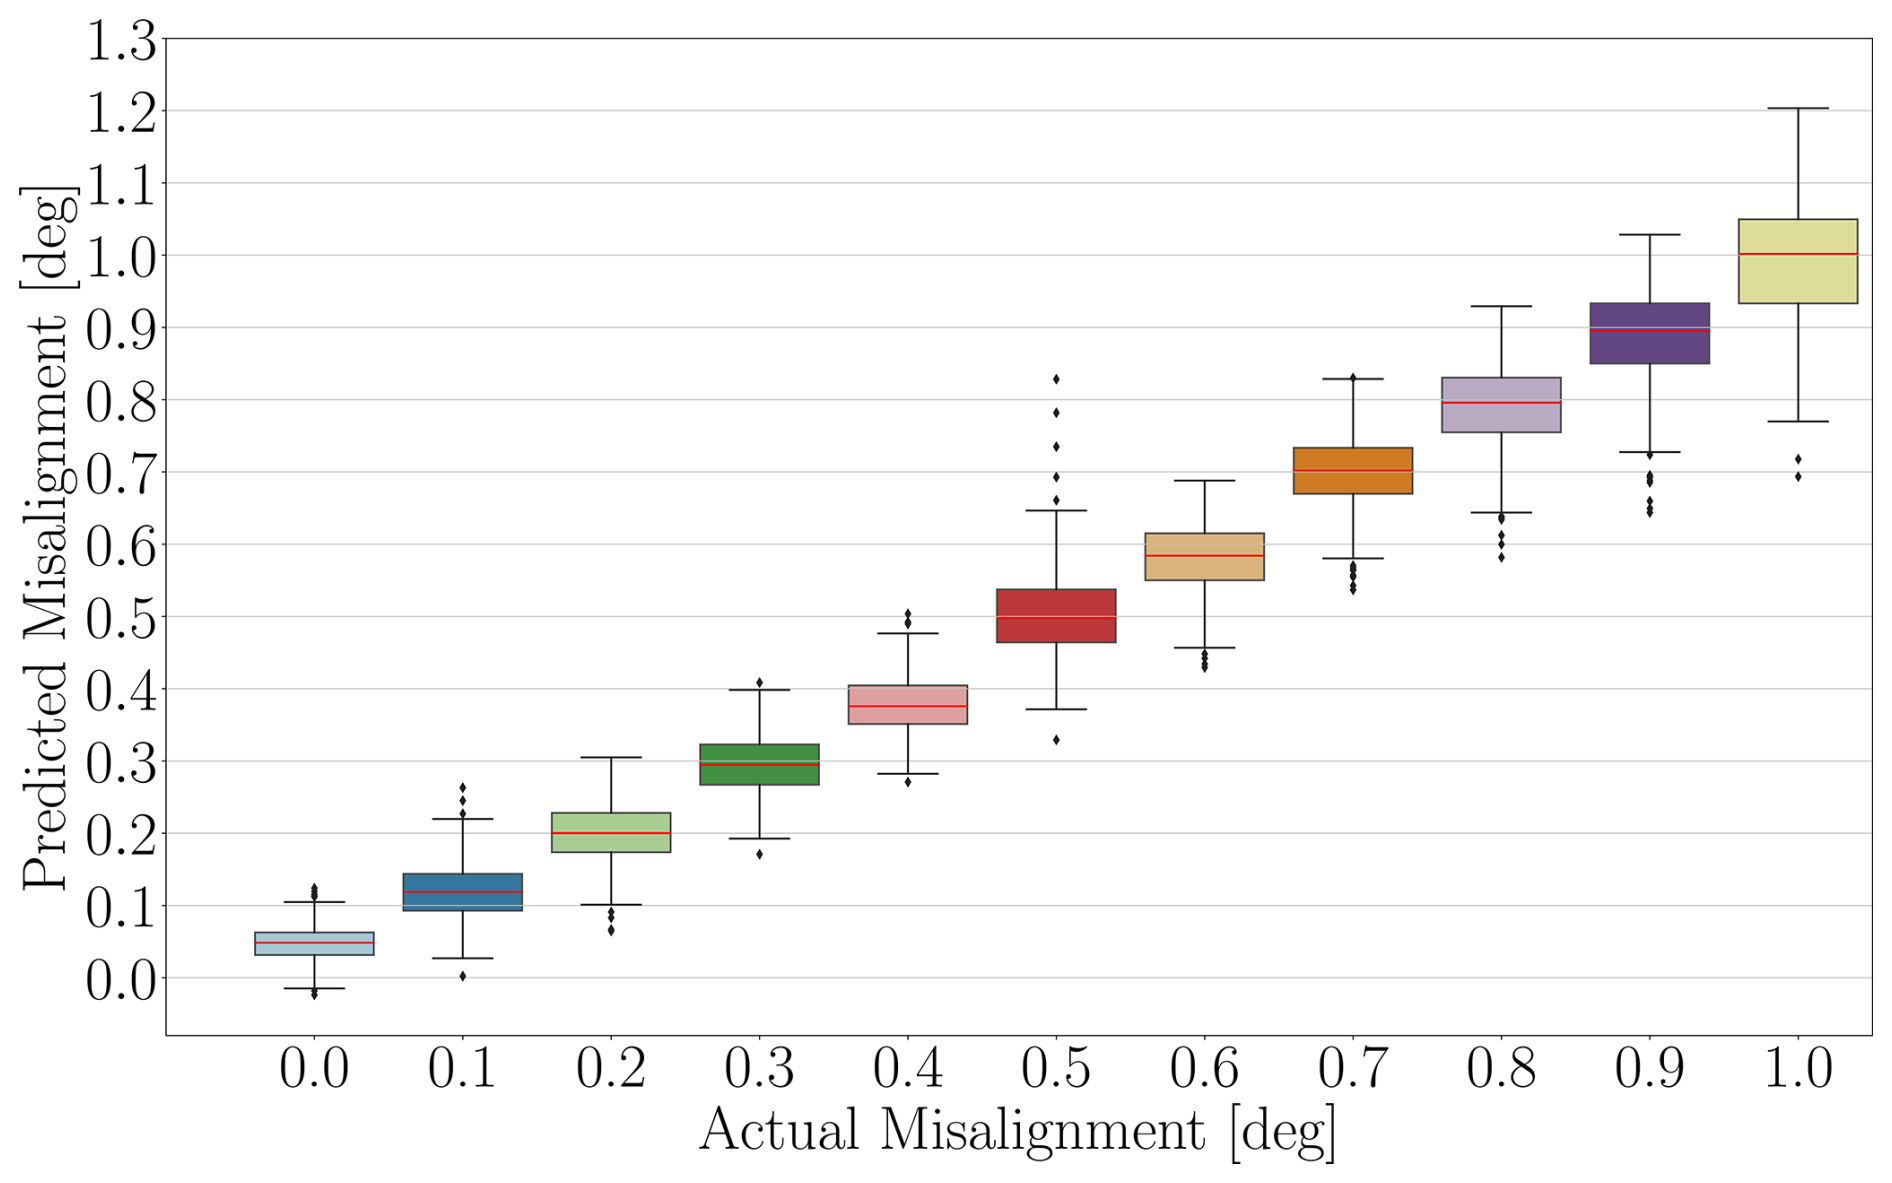
Figure 9Fault and quantification output from linear regression: box plot distribution for nominal and anomaly cases.
4.2 Misaligned blade results
Once misalignment detection is completed, the next step is to localize the misaligned blades. Figure 10 illustrates a comparison between the true condition and predictions made by the second-layer random forest classifier. Instances are reported in the three-dimensional feature space, with each point representing a specific instance based on the distribution along the nodding moment average value distances (ΔM12, ΔM13, ΔM23). These results prove the effectiveness of our approach in accurately localizing the misaligned blades. Additionally, Table 4 provides a quantitative overview of these results, presenting metrics computed for the second classification phase. Specifically, the average F1 score assessed by the model is 97.0 %.
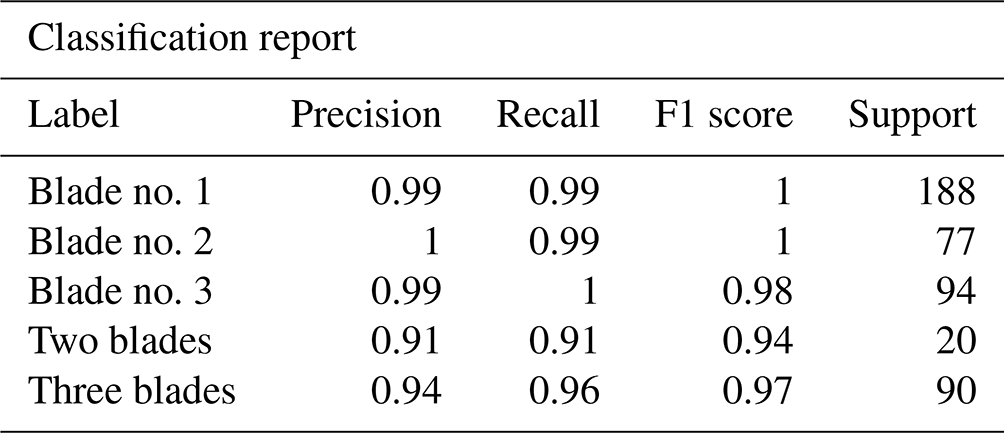
To provide further insights concerning the predictive process underlying the isolation phase, Fig. 10 reports different perspectives of the feature space in the considered cases, along with their actual class of belonging. Notice that the cases where two blades are simultaneously affected by misalignment are placed on the plot between the related single misaligned blade distributions. In other words, as reported in Fig. 11 the points referring to the case in which blade no. 2 and blade no. 3 are simultaneously misaligned are between the cases of single misaligned blade no. 2 and single misaligned blade no. 3. Notice that this behavior is consistent with the considerations previously reported in the phase analysis illustrated in Fig. 5, where phase distributions of cases in which two blades are misaligned are placed in between the related phase groups of the single misaligned blade phases. This study significantly advances the current understanding of pitch misalignment in wind turbines by addressing a critical aspect that has been conspicuously absent in the existing literature. Notably, the issue of misalignment in multiple blades has been historically overlooked in prior research. Our findings bring forth a pioneering perspective, shedding light on the complexities associated with this previously unexplored dimension. By introducing a comprehensive analysis of misalignment in systems with multiple blades, this research fills a notable gap in the current body of knowledge and provides valuable insights that are crucial for industrial applications as well.
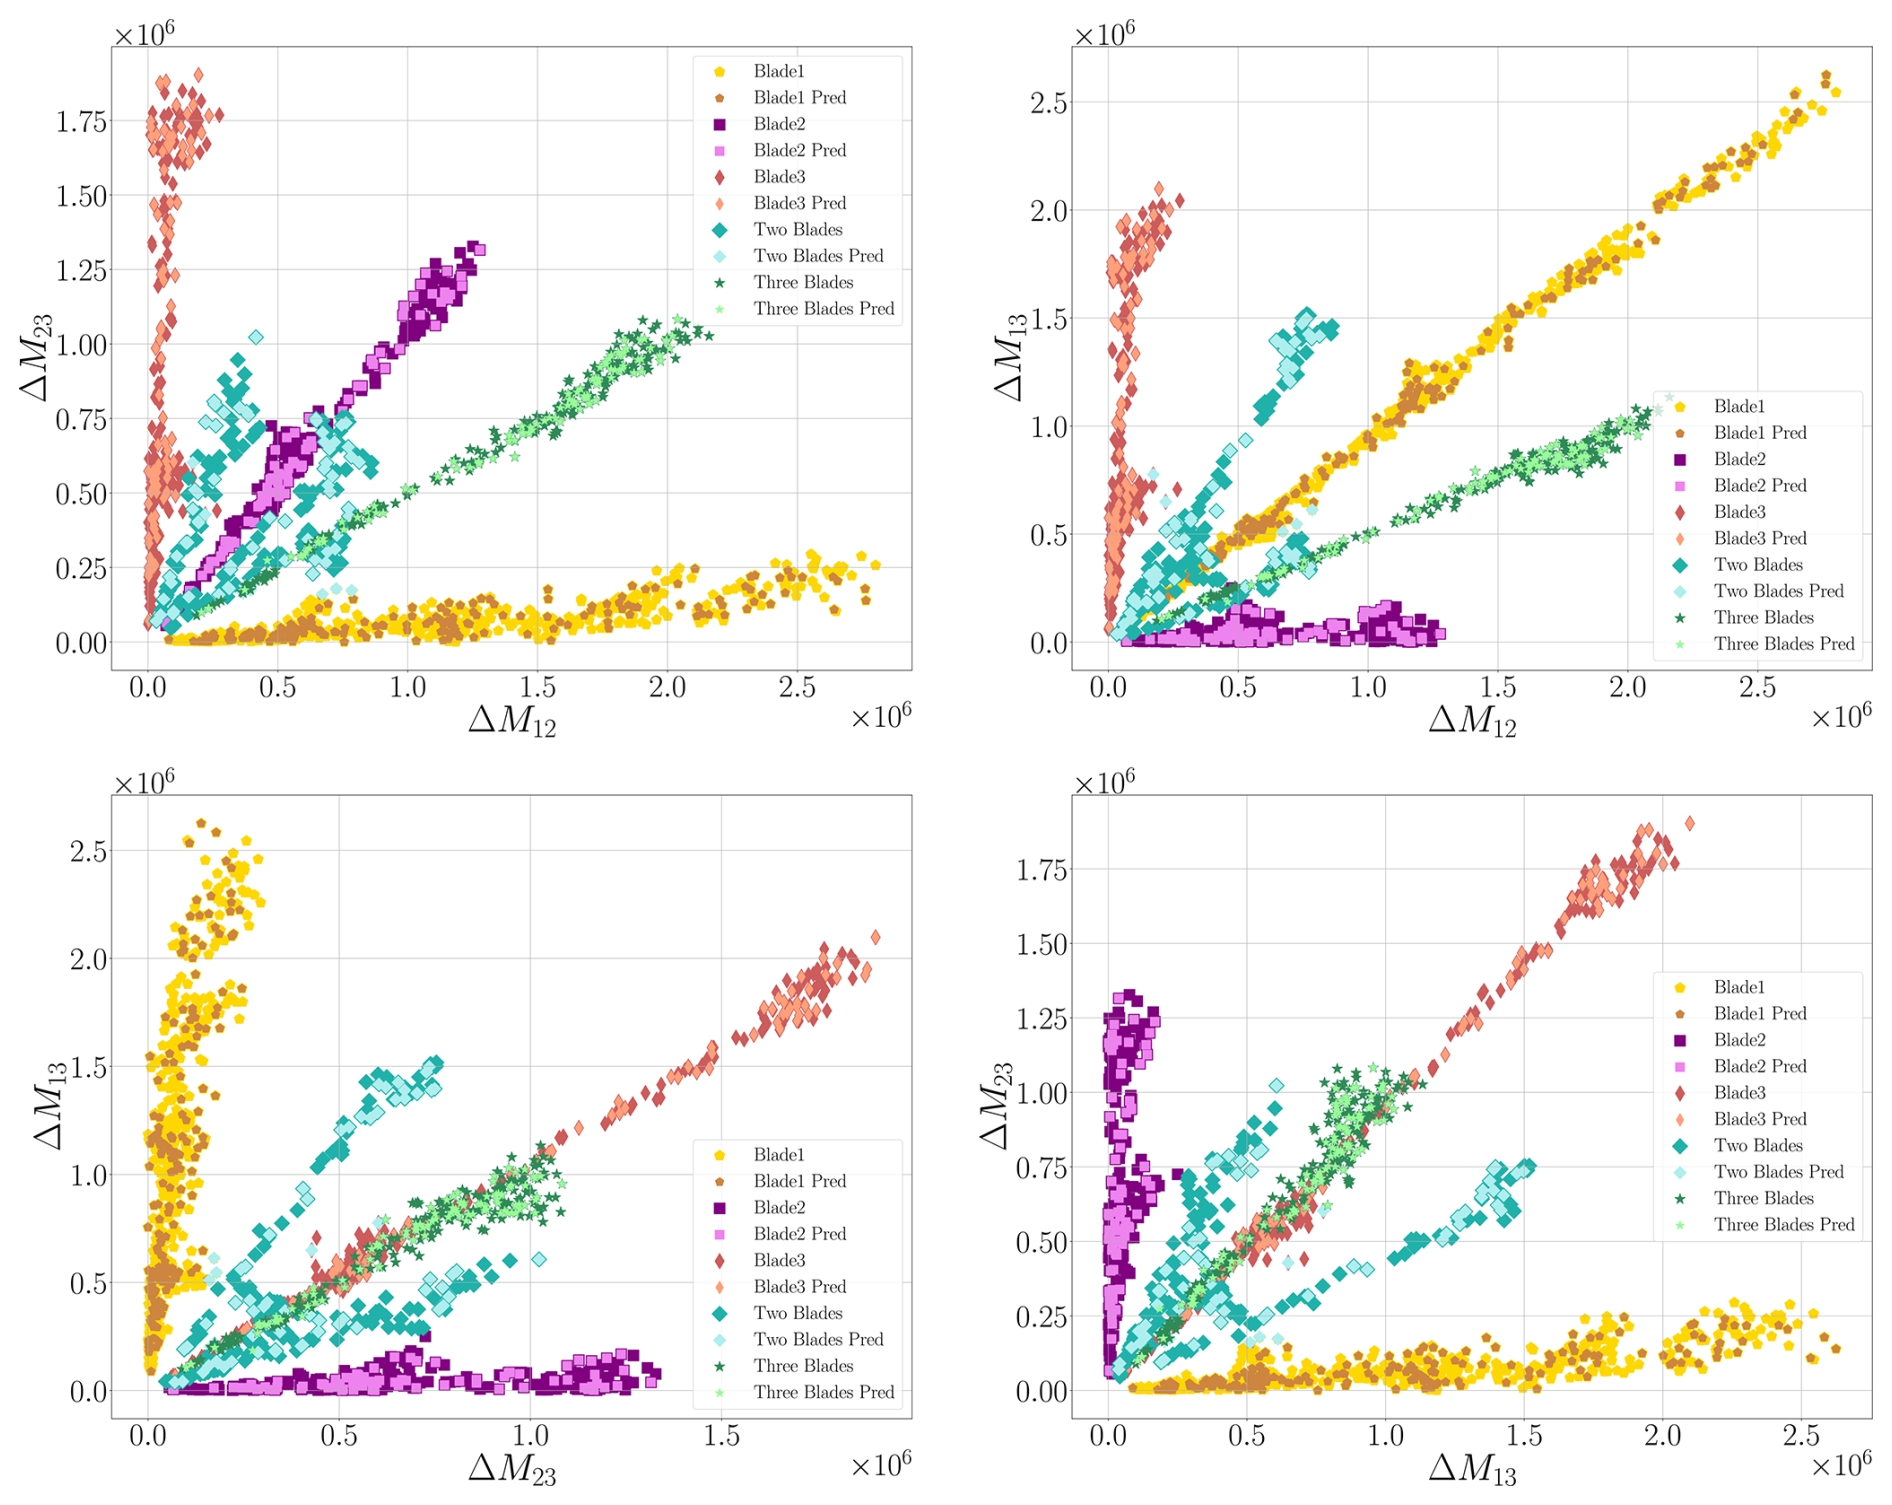
Figure 10Fault isolation output from different perspectives of the feature space for the considered cases. The plots illustrate how cases with two simultaneously misaligned blades (light blue points in the plots) are positioned between the distributions of the outputs related to the corresponding single misaligned blades. For example, the points representing simultaneous misalignment of blade no. 1 and blade no. 3 are placed between the distributions of single misaligned blade no. 1 and single misaligned blade no. 3.
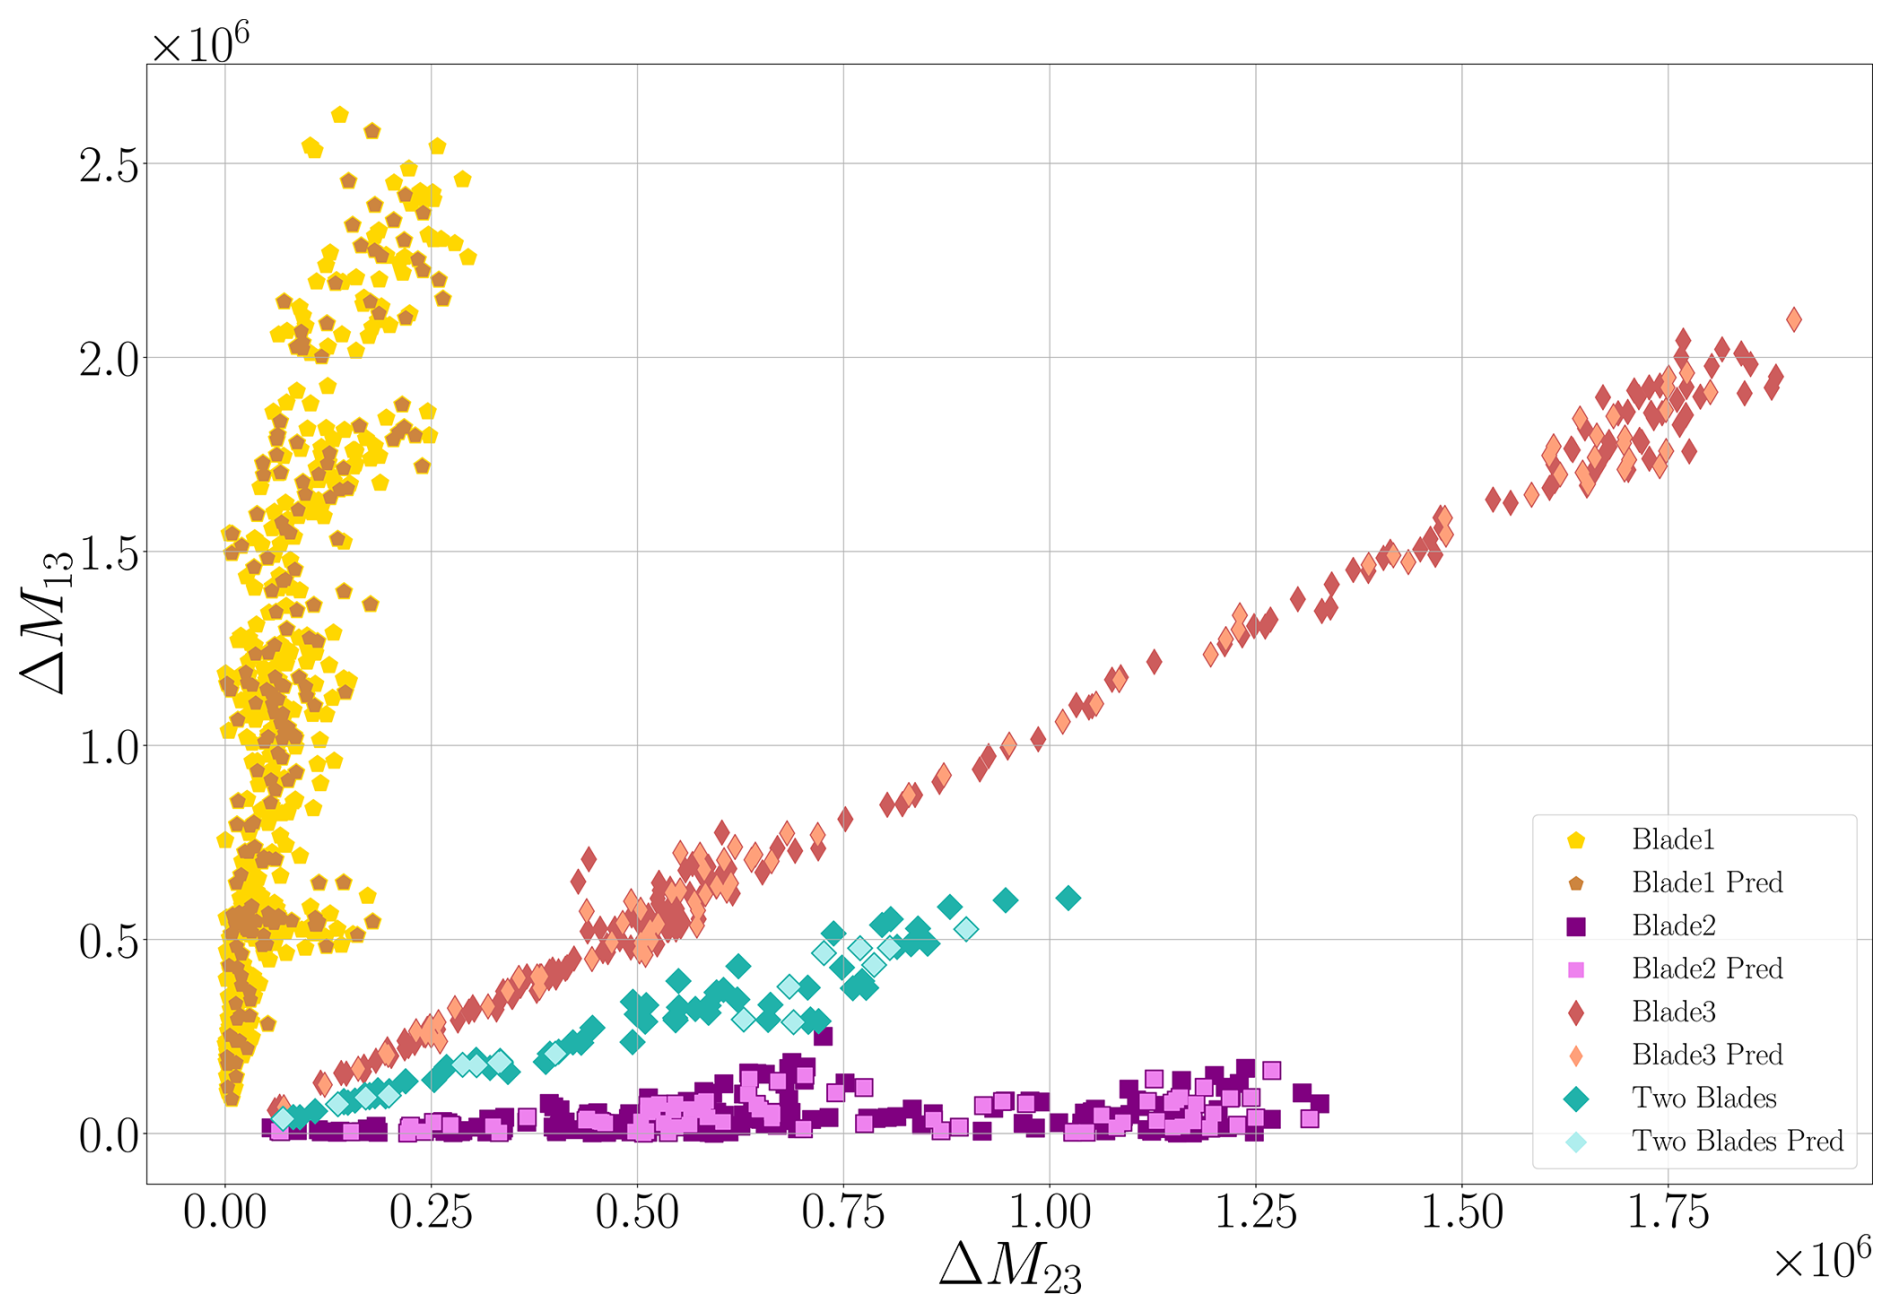
Figure 11Fault isolation output: insights. In this figure, the case where blade no. 2 and blade no. 3 are simultaneously misaligned (light blue points in the plot) is reported. The lines are placed in between the single misaligned blades: blade no. 2 (purple square markers) and blade no. 3 (red diamond markers).
In this work, we propose an automatic machine-learning-based framework for detecting pitch misalignment in wind turbines. Using a minimal set of signals and processing techniques, our framework extracts features tailored to the system's behavior, ensuring robustness across various turbulence conditions and promoting the interpretability of the decision-making process. In more detail, the designed hierarchical classification architecture employs, in the first layer, either a random forest classifier or a linear regression model to detect misalignment. Upon detection, in a second layer, a random forest classifier identifies the misaligned blades.
Validation using data simulated from a state-of-the-art simulator confirms the approach's ability to accurately detect and localize misalignment, even with multiple misaligned blades and in different turbulence conditions, achieving an F1 score exceeding 93 %. Regression outcome analysis also proves the framework's capability to detect misalignments as low as 0.1° with a root mean square error of 5.48 %. This level of precision is significant, especially considering that standards for the design and certification of wind turbines already consider misalignment angles of up to 0.3° in turbine design.
While we recognize the reliability of the simulator used for simulating the data, we acknowledge that a limitation of our work lies in the lack of validation with real data. Therefore, future work will concentrate on assessing the system performance using data gathered from operational turbines, despite the associated challenges, such as the lack of misalignment occurrences and the difficulty of accessing turbine data due to their remote locations. Indeed, we believe that this validation is crucial for assessing the framework's robustness to real-world conditions. At the same time, we are expanding the simulated data conditions by broadening the range of misalignment resolutions and wind degrees considered. This effort aims to further evaluate the robustness of our approach and gain insights into its performance across a wider spectrum of conditions.
Moreover, to practically make the proposed methodology more flexible for real field applications, one may consider the use of acceleration measurements instead of load ones, given the fact that accelerometers are typically more often available and easier to install, calibrate, and maintain than strain gauges. This investigation falls out of the scope of the present paper and will be included in a forthcoming publication.
Finally, the proposed algorithm, relying on imbalance-induced loads, cannot detect situations in which three blades of the same entity are collectively misaligned. To also detect collective misalignment, the ML model could be integrated with additional features, e.g., power data. Such a possibility represents an extension of the proposed methodology, which is currently under investigation.
The software code underlying the work is not publicly accessible due to intellectual property restrictions. Specifically, the research is covered by a patent, which prevents the public release of the code and data. If access to specific parts of the methodology is required for verification or academic collaboration, requests can be evaluated on a case-by-case basis in accordance with institutional policies and intellectual property regulations. For transparency, details regarding the implementation and methodology are thoroughly described within the paper.
All authors provided fundamental inputs to this work through discussions, feedback, and analyses of the obtained results. SM, JL, and MT devised the main idea underlining the machine-learning-based detector. SC and AC identified the physical principles the detector algorithm is anchored on. SC and AC performed the multibody simulations of the wind turbine in healthy and unhealthy conditions. SM, JL, and MT implemented and performed the detection strategy.
At least one of the (co-)authors is a member of the editorial board of Wind Energy Science. The peer-review process was guided by an independent editor, and the authors also have no other competing interests to declare.
Publisher's note: Copernicus Publications remains neutral with regard to jurisdictional claims made in the text, published maps, institutional affiliations, or any other geographical representation in this paper. While Copernicus Publications makes every effort to include appropriate place names, the final responsibility lies with the authors.
This paper was edited by Weifei Hu and reviewed by three anonymous referees.
Astolfi, D.: A Study of the Impact of Pitch Misalignment on Wind Turbine Performance, Machines, 7, 8, https://doi.org/10.3390/machines7010008, 2019. a
Axelsson, U., Bjork, M., and Haag, C.: Method for balancing a wind turbine, International Patent Number WO 2010/133512 A2, 2010. a
Bauchau, O. A.: Flexible Multibody Dynamics, vol. 176 of Solid Mechanics and Its Applications, Springer Netherlands, 1st edn., ISBN 9789400703353, 2011. a
Bertelè, M., Bottasso, C. L., and Cacciola, S.: Automatic detection and correction of pitch misalignment in wind turbine rotors, Wind Energ. Sci., 3, 791–803, https://doi.org/10.5194/wes-3-791-2018, 2018. a, b
Bertelè, M. and Bottasso, C. L.: Automatic detection and correction of aerodynamic and inertial rotor imbalances in wind turbine rotors, J. Phys. Conf. Ser., 2265, 032100, https://doi.org/10.1088/1742-6596/2265/3/032100, 2022. a
Boorsma, K., Schepers, G., Aagard Madsen, H., Pirrung, G., Sørensen, N., Bangga, G., Imiela, M., Grinderslev, C., Meyer Forsting, A., Shen, W. Z., Croce, A., Cacciola, S., Schaffarczyk, A. P., Lobo, B., Blondel, F., Gilbert, P., Boisard, R., Höning, L., Greco, L., Testa, C., Branlard, E., Jonkman, J., and Vijayakumar, G.: Progress in the validation of rotor aerodynamic codes using field data, Wind Energ. Sci., 8, 211–230, https://doi.org/10.5194/wes-8-211-2023, 2023. a
Bottasso, C. L. and Croce, A.: Cp-Lambda user manual, Tech. rep., Dipartimento di Scienze e Tecnologie Aerospaziali, Politecnico di Milano, Milano, Italy, 2009–2018. a
Cacciola, S. and Riboldi, C. E. D.: Equalizing Aerodynamic Blade Loads Through Individual Pitch Control Via Multiblade Multilag Transformation, J. Solar Energ. Eng., 139, 061008, https://doi.org/10.1115/1.4037744, 2017. a
Cacciola, S., Munduate Agud, I., and Bottasso, C. L.: Detection of rotor imbalance, including root cause, severity and location, J. Phys. Conf. Ser., 753, 072003, https://doi.org/10.1088/1742-6596/753/7/072003, 2016. a, b, c
Cacciola, S., Riboldi, C. E. D., and Croce, A.: Monitoring rotor aerodynamic and mass imbalances through a self-balancing control, J. Phys. Conf. Ser., 1037, 032041, https://doi.org/10.1088/1742-6596/1037/3/032041, 2018. a, b
Ceriani, L. and Verme, P.: The origins of the Gini index: extracts from Variabilità e Mutabilità (1912) by Corrado Gini, The Journal of Economic Inequality, 10, 421–443, https://doi.org/10.1007/s10888-011-9188-x, 2012. a
Dalsgaard, S., Blanke, M., and Brath, P.: Diagnosis of pitch and load effects, International Patent Number WO 2009/059606 A3, 2009. a
Desheng, S., Qian, L., Xin, Z., and Minrong, Z.: Wind turbine variable pitch system fault monitoring method and system, Patent Number CN113586366B, 2021. a
IEC 61400-1 Ed.3.: Wind Turbines – Part 1: Design requirements, Tech. rep., Garrad Hassan and Partners Ltd, St Vincent's Works, Silverthorne Lane, Bristol BS2 0QD, UK, 2004. a, b, c
Jonkman, J., Butterfield, S., Musial, W., and Scott, G.: Definition of a 5-mw reference wind turbine for offshore system development. Tech. Rep. TP-500-38060, Tech. rep., National Renewable Energy Laboratory (NREL), Golden, CO, USA, 2009. a
Kusiak, A. and Verma, A.: A Data-Driven Approach for Monitoring Blade Pitch Faults in Wind Turbines, IEEE T. Sustain. Energy, 2, 87–96, https://doi.org/10.1109/TSTE.2010.2066585, 2011. a, b
Kusnick, J., Douglas, E. A., and Griffith, D. T.: Wind Turbine Rotor Imbalance Detection Using Nacelle and Blade Measurements., Wind Energy, 18, 267–276, https://doi.org/10.1002/we.1696, 2015. a
Lei, Y., Yang, B., Jiang, X., Jia, F., Li, N., and Nandi, A. K.: Applications of machine learning to machine fault diagnosis: A review and roadmap, Mech. Syst. Signal Pr., 138, 1–39, https://doi.org/10.1016/j.ymssp.2019.106587, 2020. a
Milani, S., Leoni, J., Cacciola, S., Croce, A., and Tanelli, M.: Automatic Detection and Intensity Classification of Pitch Misalignment of Wind Turbine Blades: a Learning-based Approach, J. Phys. Conf. Ser., 2767, 032010, https://doi.org/10.1088/1742-6596/2767/3/032010, 2024. a, b, c, d
Saathoff, M., Rosemeier, M., Kleinselbeck, T., and Rathmann, B.: Effect of individual blade pitch angle misalignment on the remaining useful life of wind turbines, Wind Energ. Sci., 6, 1079–1087, https://doi.org/10.5194/wes-6-1079-2021, 2021. a
Tang, S., Tian, D., Fang, J., Liu, F., and Zhou, C.: Individual pitch controller characteristics analysis and optimization under aerodynamic imbalanced loads of wind turbines, Energy Reports, 7, 6489–6500, https://doi.org/10.1016/j.egyr.2021.09.114, 2021. a
Wilkinson, M.and Hendriks, B., Spinato, F., and Harman, K.: Methodology and results of the Reliawind reliability field study, in: European Wind Energy Conference (EWEC 2010), Warsaw, Poland, https://durham-repository.worktribe.com/output/1159302 (last access: January 2010), 2010. a
Yang, W., Tavner, P. J., Crabtree, C. J., Feng, Y., and Qiu, Y.: Wind turbine condition monitoring: technical and commercial challenges, Wind Energy, 17, 673–693, https://doi.org/10.1002/we.1508, 2014. a
Zhong, L. and Fei, X.: Fault determination method and system for variable pitch system of wind turbine generator, Patent Number CN113187674, 2022. a
- Abstract
- Introduction
- Preliminary analysis
- Hierarchical misalignment detection and localization classification architecture
- Evaluation and discussion of results
- Final considerations and future work
- Code and data availability
- Author contributions
- Competing interests
- Disclaimer
- Review statement
- References