the Creative Commons Attribution 4.0 License.
the Creative Commons Attribution 4.0 License.
The effects of wind farm wakes on freezing sea spray in the mid-Atlantic offshore wind energy areas
David Rosencrans
Julie K. Lundquist
Mike Optis
Nicola Bodini
The USA is expanding its wind energy fleet offshore where winds tend to be strong and consistent. In the mid-Atlantic, strong winds, which promote convective heat transfer and wind-generated sea spray, paired with cold temperatures can cause ice on equipment when plentiful moisture is available. Near-surface icing is induced by a moisture flux from sea spray, which poses a risk to vessels and crews. Ice accretion on turbine rotors and blades occurs from precipitation and in-cloud icing at temperatures below freezing. Ice accretion induces load and fatigue on mechanical parts, which reduces blade performance and power production. Thus, it is crucial to understand the icing hazard across the mid-Atlantic. We analyze Weather Research and Forecasting model numerical weather prediction simulations at a coarse temporal resolution over a 21-year period to assess freezing sea spray (FSS) events over the long-term record and at finer granularity over the 2019–2020 winter season to identify the post-construction turbine impacts. Over the 2019–2020 winter season, results suggest that sea-spray-induced icing can occur up to 67 h per month at 10 m at higher latitudes. Icing events during this season typically occur during cold air outbreaks (CAOs), which are the introduction of cold continental air over the warmer maritime surface. During the 2019–2020 winter season, CAOs lasted a total duration of 202 h. While not all freezing sea spray events occurred during CAOs over the 21-year period, all CAO events had FSS present. Further, we assess the turbine–atmosphere impacts of wind plant installation on icing using the fine-scale simulation dataset. Wakes from large wind plants reduce the wind speed, which mitigates the initiation of sea spray off white-capped waves. Conversely, the near-surface turbine-induced introduction of cold air in frequent wintertime unstable conditions enhances the risk for freezing. Overall, the turbine–atmosphere interaction causes a small reduction in FSS hours within the wind plant areas, with a reduction up to 15 h in January at the 10 and 20 m heights.
- Article
(7654 KB) - Full-text XML
- BibTeX
- EndNote
This work was authored in part by the National Renewable Energy Laboratory, operated by Alliance for Sustainable Energy, LLC, for the US Department of Energy (DOE) under contract no. DE-AC36-08GO28308. The US government retains and the publisher, by accepting the article for publication, acknowledges that the US government retains a nonexclusive, paid-up, irrevocable, worldwide license to publish or reproduce the published form of this work, or allow others to do so, for US government purposes.
The offshore wind energy industry is undergoing rapid growth to supply emissions-free energy to the electrical grid. In the USA, offshore capacity targets are approaching 40 GW by 2040 (Musial et al., 2022). Capacity expansion into relatively cold offshore regions will subject turbines to harsher wintertime conditions, which necessitate an understanding of the hazards that marine icing poses to offshore wind turbines, service vessels, and crew safety.
Ice accretion reduces the aerodynamic efficiency of the turbine blade, which hinders energy capture and annual energy production (Battisti et al., 2006; Kraj and Bibeau, 2010; Wei et al., 2020). Ice can remain on the rotors even after freezing conditions end, as slow natural processes such as ice shedding and melting extend the limitation to energy yield (Gao and Hong, 2021). One study found that excessive icing induced a power loss of 63 % for a single turbine over a 51 h icing event (Gao and Hu, 2021). Faster winds during cold front passages can enhance wind energy supply during high-load cold weather events, although, following frontal passages, the combination of cold temperatures and slow wind speeds may pose severe challenges for utility grid planners (Novacheck et al., 2021). Despite the energy losses from ice accretion, various strategies can mitigate or even prevent ice accretion altogether (IEA, 2018; Madi et al., 2019). While turbine blade icing is well studied (IEA, 2018; Martini et al., 2021; Contreras Montoya et al., 2022), icing near the turbine base, affecting operations and maintenance activities, is not.
The leading causes for low-level offshore icing are wave-impact and wind-induced sea spray (Dehghani-Sanij et al., 2017). Sea spray provides nuclei for ice clouds at high latitudes where airborne dust is sparse, being lofted by bursting bubbles and droplets from white-capped waves (Russell, 2015; Dehghani-Sanij et al., 2017). Ice accumulation from spray raises the center of gravity of ships, which can cause loss of stability and lead to capsizing (Guest and Luke, 2005). Observations suggest that the liquid droplets torn off of white caps, referred to as spume, experience a marked increase in concentration with strong winds above 9 m s−1 (Ross and Cardone, 1974; Monahan et al., 1983; Monahan and MacNiocaill, 1986). Further, spray particles more easily supercool with cold sea surface temperatures (SST) below 7 °C and at air temperatures below the freezing point for saline ocean water at −1.7 °C (U.S. Navy, 1988; Guest and Luke, 2005). Ice accumulation is believed to have caused the recent losses of three ships, including (1) the Destination, which sank near St. George Island, Alaska, in 2017 (Kraegel, 2018); (2) the Scandies Rose, which sank southeast of Kodiak, Alaska, in 2019 (NTSB, 2021); and (3) the Onega, which sank in the Barents Sea in 2020 (Nilsen, 2020). To mitigate ice-induced accidents, inclement weather forecasts are furnished for coastal waters. A Coastal Waters Forecast, delivered by the National Weather Service (NWS), will contain a “freezing spray advisory” if freezing water droplets can accumulate on vessels due to a combination of SST, wind speed, air temperature, and vessel motion (Glossary – NOAA's National Weather Service, 2023). At accumulation rates greater than 2 cm h−1, the advisory becomes a “heavy freezing spray watch”.
Wind turbines can modify the frequency and severity of icing conditions via competing effects. Enhanced turbulence caused by spinning blades transports heat from aloft to lower altitudes within the rotor-swept region or near the surface. In stable stratification, warmer potential temperatures are transported downward, which introduces a near-surface warming effect, and vice versa in unstable conditions (Fitch et al., 2013; Rajewski et al., 2013; Xia et al., 2016; Siedersleben et al., 2018; Tomaszewski and Lundquist, 2020). However, recent research suggests taller turbines may reverse this phenomenon (Golbazi et al., 2022) depending on the depth of the atmospheric boundary layer (Quint et al., 2024). As the winter months feature more frequent unstable stratification along the US East Coast (Bodini et al., 2019), turbine-induced cooling may increase the potential for near-surface freezing. In contrast, turbines harness momentum from the flow, which reduces the downwind wind speed (Nygaard, 2014; Platis et al., 2018; Schneemann et al., 2020). A reduction in wind speed conversely reduces the potential for icing (Dehghani-Sanij et al., 2017). Thus, it is crucial to understand how large-scale wind deployment across the mid-Atlantic will modify the regularity and intensity of freezing sea spray (FSS) conditions.
Herein, we employ numerical weather prediction modeling to quantify the baseline offshore icing risk and the wind plant post-construction effects. Section 2 outlines the modeling setup and discusses the techniques for discerning icing conditions and cold air outbreak (CAO) events. Section 3 reports results for the spatiotemporal icing risk, causal factors, and the adjustments by wind plants. Section 4 offers concluding remarks and a discussion.
2.1 NOW-23
We explore annual variability in FSS conditions using the 2023 National Offshore Wind (NOW-23) dataset (NREL, 2020; Bodini et al., 2024). This dataset quantifies wind resources spanning all offshore regions of the United States for more than 20 years using the Weather Research and Forecasting (WRF) model version 4.2.1 (Powers et al., 2017). We acquire model output at an hourly temporal resolution for the 21-year period from 1 January 2000 to 31 December 2020. A parent domain feeds into an inner nested domain, with horizontal grid resolutions of 6 and 2 km, respectively. Both domains incorporate a vertical grid resolution of 5 m near the surface stretching to 45 m aloft, using 61 vertical levels up to a 50 hPa top. The European Centre for Medium Range Weather Forecasts Reanalysis v5 (ERA5) dataset supplies hourly initial and boundary conditions at a 30 km resolution to WRF (Hersbach et al., 2020). NOW-23 employs the MYNN2 planetary boundary layer and surface layer (Nakanishi and Niino, 2006) schemes, Eta microphysics (Ferrier et al., 2002), the Noah Land Surface Model (Tewari et al., 2004), the rapid radiative transfer model for shortwave and longwave radiation (Iacono et al., 2008), and the Kain–Fritsch cumulus parameterization (Kain, 2004) in the outmost domain only. For the mid-Atlantic region, NOW-23 was validated against observations from three ZephIR ZX300M floating lidars (Pronk et al., 2022).
2.2 NOW-WAKES
We explore the seasonal variability and impacts of wind plants on icing conditions using high-fidelity numerical weather prediction simulations over the period 1 September 2019 to 31 August 2020. These validated WRF version 4.2.1 simulations are described in detail in Rosencrans et al. (2024) but are summarized here for the reader's convenience. This period is chosen for the availability of lidar measurements for validation of the wind speed profile. A parent domain hosts an inner nest, with horizontal grid resolutions of 6 and 2 km, respectively (Fig. 1). Both domains include a vertical grid resolution of 10 m near the surface with stretching aloft, using 54 vertical levels up to a 50 hPa top. The inner domain outputs data at an instantaneous history file frequency of 10 min. Constant time steps are set to 18 and 6 s in the outer and inner domains, respectively. Initial and boundary conditions are also supplied by the hourly 30 km ERA5 dataset (Hersbach et al., 2020). Lower-boundary conditions are provided as SST by the UK Met Office Operational Sea Surface Temperature and Sea Ice Analysis dataset (Donlon et al., 2012; Copernicus Marine Service, 2024) and show good agreement during validation against Mid-Atlantic Bight buoys (Redfern et al., 2023). Physics parameterizations include the MYNN2 planetary boundary layer and surface layer (Nakanishi and Niino, 2006), the Noah Land Surface Model (Niu et al., 2011), the New Thompson microphysics (Thompson et al., 2008), the rapid radiative transfer model for longwave and shortwave radiative transfer (Iacono et al., 2008), and the Kain–Fritsch cumulus (Kain, 2004) schemes. The Kain–Fritsch cumulus parameterization applies to the parent domain only. We incorporate spectral nudging to relax model output toward the ERA5 boundary conditions in the inner domain. We apply a cutoff wavenumber of 3 (Gómez and Miguez-Macho, 2017), above which model dynamics may resolve freely. No nudging is applied beneath the boundary layer height.
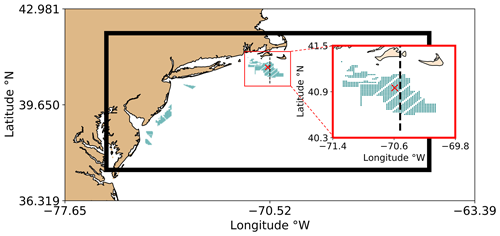
Figure 1Modeling domains. The entirety of the outer domain with the inner domain is shown, outlined by the black rectangle. The red square is zoomed in on the Rhode Island–Massachusetts (RIMA) block to enhance visibility. Turbines are shown as teal dots. The red × indicates the point of interest (POI) where time series are acquired. The dashed black line is a cross section extending through the RIMA block.
We incorporate the effects of wind turbines using the WRF wind farm parameterization (WFP) (Fitch et al., 2012). WFP simulations feature wind plant layouts of the lease areas and include 1418 turbines (Fig. 1, Table 1). The WFP incorporates the effects of turbines by implementing a drag-induced deceleration of wind flow and an addition of turbulence at model levels intersecting the rotor area. We execute WFP simulations adding both 0 % and 100 % turbulent kinetic energy (TKE) (Rosencrans et al., 2024), although a smaller value of 25 % in some cases agrees better with neutrally stratified large-eddy simulations (Archer et al., 2020). Differences in the number of icing hours between 0 % and 100 % added TKE are slight, so we report those from 100 % added TKE only. Thus, for the remainder of this article we refer to the 100 % added TKE simulation as “WFP”. This work utilizes 12 MW GE Haliade wind turbines with a 138 m hub height and 215 m rotor diameter, which are scaled by Beiter et al. (2020) from a 15 MW reference turbine. We carry out separate simulations using both no wind farms (NWF) and wind farms (WFP) for the full year-long period from 1 September 2019 to 31 August 2020 (Table 1).
2.3 Detection of icing hours
Ice accretion occurs when supercooled water freezes upon contact with objects. The largest contributions to sea spray icing are provided by the bursting of bubbles and advection of spray from white-capped waves (Dehghani-Sanij et al., 2017). In the presence of moisture, three key variables dictate offshore freezing conditions: wind speed, SST, and air temperature (Overland et al., 1986; Overland, 1990; Guest and Luke, 2005; Dehghani-Sanij et al., 2017; Line et al., 2022).
We detect FSS conditions following common thresholds defined by the latter studies (Guest and Luke, 2005; Dehghani-Sanij et al., 2017; Line et al., 2022). These criteria require (1) wind speeds in excess of 9 m s−1, (2) air temperatures below −1.7 °C, and (3) SST less than 7 °C. Air temperature and SST thresholds can range between −2 and −1.7 °C and between 5 to 8.9 °C, respectively, as reviewed by Dehghani-Sanij et al. (2017). As such, we provide a sensitivity assessment for the full range (Appendix B). The surface skin temperature (WRF output variable TSK) is assessed because the SST field inherits coarse blocks of missing data around coastlines from the ERA5 dataset. The resulting spatial maps are masked by the land use (WRF output variable LU_INDEX) to ensure that icing conditions over land are not counted. The number of 10 min timestamps where these criteria are met each month are recorded for all simulations. As sea spray often lofts to between 5 and 20 m above sea level (Dehghani-Sanij et al., 2017), we quantify sea-spray-induced icing at the 10 and 20 m heights. For the 20 m conditions, we use 20 m air temperatures but use 10 m wind speeds, as those winds have been linked to the generation of spray off white-capped waves (Dehghani-Sanij et al., 2017; Guest and Luke, 2005; Line et al., 2022; Ross and Cardone, 1974; Monahan et al., 1983; Monahan and MacNiocaill, 1986).
Due to the height constraint of sea spray particles, we consider both precipitation-based and in-cloud icing at the 138 m hub height by assessing different criteria for (1) the nonzero presence of liquid rainwater (WRF variable QRAIN) that may become supercooled at temperatures less than 0 °C, (2) ice (WRF variable QICE), and (3) the aggregation from snow (WRF variable QSNOW) (Parent and Ilinca, 2011; ISO, 2017). Further, we detect cloud or fog formation when (4) the relative humidity (RH) is greater than or equal to 100 %, as follows:
where es is the saturation mixing ratio, e0 is 6.112 mb, b is 17.67, T1 is 273.15 K, T2 is 29.65 K, T is the air temperature, ϵ is 0.622, p is the atmospheric pressure, and w is the mixing ratio (WRF output QVAPOR) (Stull, 1988). None of the aforementioned criteria must occur at the same time for icing to occur. However, we require that one must occur in conjunction with an air temperature of less than 0 °C for an icing event.
2.4 Ice accumulation rate
A predictability function assesses the likelihood for freezing in the presence of sea spray. We assess the predictability of icing conditions at the point of interest (POI) in the Rhode Island–Massachusetts (RIMA) block (Fig. 1) separately from the NOW-WAKES and the NOW-23 datasets. The predictability (PR) for sea-spray-induced ice formation is as follows:
where Va is the wind speed, Tf is the temperature threshold of −1.7 °C, Ta is the air temperature, and Ts is the SST (Guest and Luke, 2005; Overland et al., 1986; Overland, 1990). A humidity variable is not present in Eq. (4) due to the assumption that sea spray introduces a constant source of moisture during fast winds. A group of successive timestamps with nonzero PR are considered the same event. Separate flagged timestamps occurring within 24 h of each other span the same synoptic regime (Winters et al., 2019), and so the entire duration between the two flagged timestamps is considered one event. We additionally tested a threshold of 72 h to account for synoptic conditions spanning a longer duration but found that one FSS event lasted for over a week, and our three FSS criteria were only met 8 % of the time during the event. As such, the 72 h threshold was not justified.
The magnitude of PR can determine the rate of ice accretion (Table 2). The ice accretion rates are a general guideline developed for 20 to 75 m long vessels; specific rates depend on the type of ship, its load, its heading relative to the prevailing wind direction, and its handling characteristics (U.S. Navy, 1988; Guest and Luke, 2005). For instance, a larger ship requires faster winds and taller waves for sea-spray-induced ice to accumulate on a higher deck but is more vulnerable to the prevailing wind direction due to reduced maneuverability. It is not known how these icing rates would apply to wind turbines or to the vehicles used to access offshore wind turbines.
2.5 Cold air outbreak detection
Freezing conditions can be stimulated by the advection of cold continental air over a warmer maritime surface. The resulting temperature profile causes thermal instability, which can induce filamentary convective rolls that align to make cloud “streets” with parallel columns of ascending and descending air that transform into open convective cells further offshore (Geerts et al., 2022). Convective rolls can be used to identify CAOs (Atkinson and Wu Zhang, 1996; Geerts et al., 2022) and may also contribute moisture for in-cloud icing if the lifting condensation level is at or below rotor-swept heights. A quantitative approach proposed by Vavrus et al. (2006) identifies a cold air outbreak (CAO) by the magnitude and duration of anomalous air temperature, which we apply at the POI (Fig. 1). This strategy requires that the near-surface temperature be at least 2 standard deviations below the wintertime average following Eq. (5):
where T is the 2 m temperature, is the average 10 m temperature over the entire wintertime period, and σ is the standard deviation. The wintertime period spans November through March at a 10 min frequency to account for all nonzero-freezing predictability events. Again, successive timestamps with detected CAOs are considered a single event, and separate events occurring within a 24 h span are conglomerated into the same event.
2.6 Atmospheric stability
Turbulence from wind turbines modifies the near-surface temperature based on the atmospheric stability or stratification. We calculate the modeled atmospheric stability using the Obukhov length (L) (Monin and Obukhov, 1954) (Eq. 6), which delineates the height above the surface at which buoyant turbulence equals mechanical shear production of turbulence, at a point centered on the RIMA block of lease areas:
where u∗ (UST in WRF output) is the friction velocity, θv is the virtual potential temperature, κ is the von Kármán constant of 0.4, g is gravitational acceleration of 9.81 m s−1, and (HFX in WRF output) is the surface dynamic heat flux converted into the kinematic heat flux. Negative lengths between 0 and −500 m imply unstable stratification due to a positive heat flux (Gryning et al., 2007; Archer et al., 2016). Conversely, lengths between 0 and 500 m imply stable stratification due to a negative heat flux. Lengths approaching negative or positive infinity imply neutral stratification, as buoyancy is no longer a dominating factor. Each 10 min timestamp from the NWF run is assigned a stability classification from November 2019 to March 2020.
3.1 Spatial variability in icing conditions
The prevalence of icing conditions exhibits regional variability. The commonality of icing increases toward higher latitudes and near the coast where cold continental air advects over the ocean during the winter (Fig. 2). In general, the spatial icing pattern during the 2019–2020 winter season (Fig. 2a) matches well with the pattern over the 21-year period (Fig. 2b), although the 2019–2020 season is relatively mild compared to other winters (Figs. 2 and 3a). Icing conditions shadow the mid-Atlantic coast but occur less often along the New Jersey Bight where wind speeds decrease and air and sea temperatures warm. The prevalence of freezing conditions extends furthest offshore southeast of Nantucket and enhances in the Long Island Sound; both regions feature local minima in mean January 2020 SST less than 5 °C. The Long Island Sound is flanked by land to the north and south, which amplifies the presence of cold air. In addition, mean wind speeds maximize to the east of Cape Cod and Nantucket (Bodini et al., 2024), which increases the number of hours that wind-generated spray is present. Finally, the cyclonic current in the Gulf of Maine transports water southward. East of Cape Cod, this current bifurcates around the Georges Bank, and a branch feeds cold water into the mid-Atlantic (Chapman et al., 1986). The number of icing hours may be further exacerbated when predominant northerly winter winds instigate onshore Ekman transport toward the coast, which is favorable for downwelling (Shcherbina and Gawarkiewicz, 2008b). However, downwelling is not always supported, as the mixed layer stratification is dominated by salinity (Shcherbina and Gawarkiewicz, 2008a), leaving a cold pool near the surface.
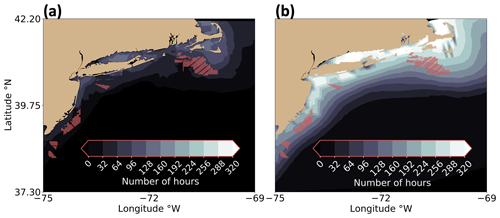
Figure 2The number of hours FSS conditions occur at 10 m during (a) the November 2019 to March 2020 period in NWF and (b) the mean November to March period from 2000 to 2020 in NOW-23. Lighter contouring indicates more freezing hours. Red dots represent turbine locations but do not exist in (a) or (b) and are shown for reference.
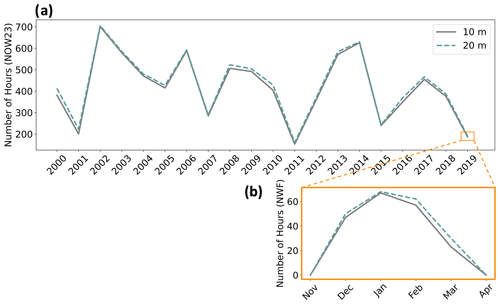
Figure 3The maximum number of FSS hours over the Outer Continental Shelf (OCS) (a) annually and (b) seasonally in NOW-23. The zoomed orange cutout shows the seasonal variation over the 2019–2020 winter.
Icing conditions exhibit seasonal variability in NWF, starting at 0 h in November, increasing through the winter, and falling to 0 again by April at all heights (Fig. 3 and Figs. A1–A3). At the 10 m altitude, FSS conditions occur most often in January, up to 67 h, with an offshore spatial extent of 59 292 km2 or 12.3 times the area of the wind plants. At 20 m, FSS conditions also occur most often in January, up to 68 h, covering a total area of 61 736 km2 or roughly 12.8 times the area of the wind plants (Fig. A2). The 138 m hub height attains the largest maximum of 119 h during January in the Gulf of Maine and to the east Cape Cod (Fig. A3), with an offshore spatial extent of 291 012 km2 or 60.2 times the area of the wind plants.
The 2019–2020 winter season was one of the mildest compared to other winters (Fig. 3a), as assessed using the FSS detection criteria (Sect. 2.3). This winter season had few icing hours compared to other winters over the 21-year period, reaching 194 h in NWF or 187 h in NOW-23 at 10 m. At 20 m, the 2019–2020 winter season contains 210 h in NWF or 191 h in NOW-23. The greatest number of icing hours occurs during the 2002–2003 season, with a total of 701 h at 10 m and 705 h at 20 m. While the 21-year slope shows a decrease, it is not statistically significant using the Mann–Kendall (M–K) test (Hussain and Mahmud, 2019). The p values for the maximum number of icing hours (found across the OCS) (Fig. 3a) and for the number of hours at the POI (Fig. 1) are 0.20 and 0.12, respectively. We additionally applied the seasonal M–K test (Hirsch et al., 1982) to account for upward and downward trends throughout the year on monthly mean PR, monthly maximum PR, and the monthly total number of icing hours at the POI. Neither test returned a statistically significant trend.
3.2 Icing conditions and cold air outbreak
Investigating all events with a nonzero PR at the POI (Fig. 1) reveals similar synoptic trends. We identify seven events with FSS conditions, with a total duration of 253 h from November 2019 to March 2020. All times during the 2019–2020 winter period with nonzero PR contain light ice accumulation of less than 0.7 cm h−1 (Table 2). During each FSS event, higher relative pressure resided to the southwest throughout the Great Plains, Appalachia, or the Great Lakes, with lower relative pressure to the northeast around Nova Scotia and Newfoundland. In the Northern Hemisphere, winds flow with higher pressure to the right and lower pressure to the left (Wallace and Hobbs, 2006). This flow regime results from the balance between the pressure gradient force and the Coriolis force, which is a force introduced into the equations of motion to account for acceleration on a non-inertial rotating reference frame (Ferrel, 1856). The largest pressure gradient forces occurred during the two January events, reaching 4 hPa per 100 km or roughly 4 times the pressure gradient force required for a 10 m s−1 geostrophic wind in the midlatitudes. Most events feature a cold front in the mid-Atlantic. This pressure regime directs quasi-geostrophic flow near the surface toward the southeast, introducing cold continental air offshore. During the winter, the prevailing wind direction is northwesterly across the mid-Atlantic OCS (Bodini et al., 2019) because regions of land mass feature higher surface pressure than the surrounding ocean, and the Bermuda High retreats to the east.
All FSS events, assessed using PR, coincide with CAO. We detect seven CAO events in NWF, with a total duration of 202 h (Fig. 4b). The mean duration of CAO events (29 h) are 7 h shorter than FSS events (36 h), with 80 % of flagged FSS timestamps having CAO present.
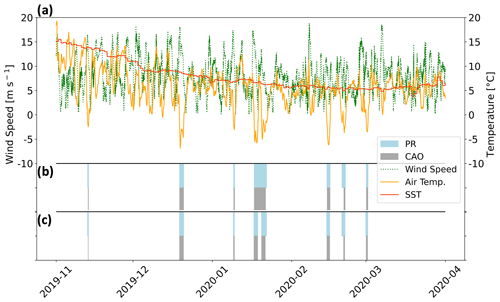
Figure 4(a) Time series of wind speed (dotted green), 10 m air temperature (orange), and SST (red) from November 2019 to April 2020 at the downwind edge of the RIMA block (Fig. 1). Light-blue shading indicates the duration of nonzero PR, and gray shading indicates the duration of detected CAOs from (b) NWF and (c) NOW-23.
Common between events are fast wind speeds and cold 10 m air temperatures; SST plays a secondary role due to its weak temporal variability (Fig. 4a). The average wind speed during FSS events is 10 m s−1, with gusts exceeding 15 m s−1 during four events. Nonzero PR does not occur until after the wind speed peaks, when cold air temperatures sweep in, averaging minimum temperatures of −4.5 °C (Fig. 4a). This wind speed–temperature dynamic can pose a challenge for grid planners if wind energy generation reduces during periods of high demand for residential and commercial heating, especially in a future scenario with electrification of space heating.
During the 2019–2020 winter in the NOW-23 dataset, eight total events are flagged as candidates for FSS because the longest event in January 2020 (Fig. 4b) is split between two separate events; all eight events have a corresponding CAO (Fig. 4c). Over the 21-year period, all CAO events occur in conjunction with an FSS event (positive PR) (Figs. C1–C20). However, many FSS events occur without CAO present meaning that CAO is only one of the drivers, and large interannual variability can exist. For instance, while 100 % of CAO timestamps concur with FSS during the 2011–2012 season, only 10 % do during the 2013–2014 season.
The 2019–2020 winter ice accumulation rate is similar to other winters. The average PR during freezing events from 2019 to 2020 is 4.3, which corresponds to a light ice accumulation rate of less than 0.7 cm h−1 (Table 2). Over the 21-year period, the average PR among events is 8.1, which corresponds to the same accumulation rate. The 2003–2004 winter period features the greatest mean PR of 15.7, which also corresponds to a light ice accumulation rate. During this winter, a moderate risk for icing occurred 18 % of the time, and a heavy risk occurred 3 % of the time, corresponding with icing rates between 0.7–2.0 cm h−1 and 2.0–4.0 cm h−1, respectively, and possibly triggering heavy freezing spray watches in the NWS advisory.
Synoptic-scale teleconnection patterns can impact the likelihood of icing conditions. From December 2003 to March 2004, the Pacific–North American (PNA) cycle was positive. During the positive phase of the PNA, a relative high-pressure anomaly with anticyclonic wind flow exists over the western USA that is conducive to northwesterly transport of cold air over the East Coast (Vavrus et al., 2006). In addition, the entire November 2003 to March 2004 period featured a positive El Niño–Southern Oscillation (ENSO) index. Positive ENSO has been attributed to cooler SSTs across the mid-Atlantic and to northeasterly winds that advect cold air from the north (Alexander and Scott, 2002). Other teleconnection patterns, including the Arctic Oscillation and North Atlantic Oscillation switched signs during this winter and are not discussed in greater detail.
3.3 Modifications by wind plants
The near-surface cooling effect by rotor turbulence provides a subtle effect on freezing conditions. In unstable conditions, which occur 64 % of the time from November 2019 through March 2020 in NWF assessed at the POI, wind turbines introduce near-surface cooling, which could increase the likelihood of freezing. Mean cooling and warming during unstable conditions reach magnitudes up to −0.041 K at the surface and 0.022 K within the rotor-swept region, respectively, along a cross section extending through the RIMA block (Figs. 1–5b). During stable conditions, which occur 25 % of the time from November through March, cooling aloft reaches up to −0.34 K, and near-surface warming reaches 0.26 K (Fig. 5a). Near-surface cooling exists adjacent to the wind plant cluster (Xia et al., 2016).
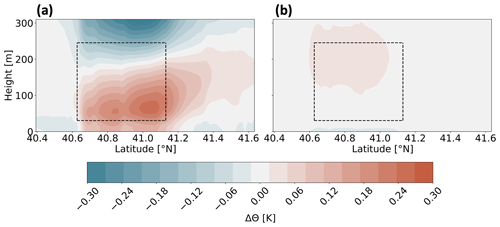
Figure 5The mean (WFP-NWF) potential temperature difference during (a) stable stratification and (b) unstable stratification from November 2019 to March 2020. The cross section spans the RIMA block of lease areas (Fig. 1). Red contouring indicates warming, and blue indicates cooling. Dashed lines outline the wind plant area and rotor-swept region.
The reduction in wind speeds in the wake modifies the chance for icing within the rotor-swept area and near the surface by reducing the production of white-capped waves and the wind-induced tearing of spray off waves. In stable conditions, the mean wake wind speed deficit is largest, reaching −1.4 m s−1 near the top of the rotor-swept plane, reducing the chance for icing. Because vertical motion is suppressed in stable stratification, winds enhance and flow around and under the wind plant area (Fig. 6a), reaching a subtle enhancement near the surface of 0.18 m s−1. In unstable stratification, available buoyant turbulence promotes mixing, which transports momentum from above the rotor-swept region down to within the wake. The injection of momentum allows wake wind speeds to recover, leaving a smaller maximum-averaged wake deficit of −0.57 m s−1 (Fig. 6b). There is no enhancement of wind speeds adjacent to the RIMA block along the cross section in unstable conditions.
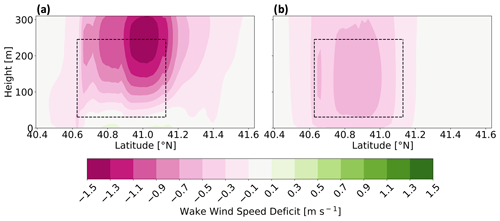
Figure 6The mean (WFP-NWF) wind speed difference during (a) stable and (b) unstable stratification, from November 2019 to March 2020. The cross section spans the RIMA block of lease areas (Fig. 1). Pink contouring indicates a wind speed reduction, and green indicates wind speed enhancement. Dashed lines outline the wind plant area and rotor-swept region. Note the very small enhancement of wind speeds near the surface in stable conditions.
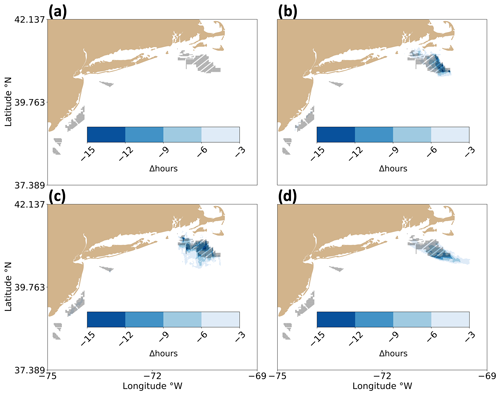
Despite near-surface cooling, net FSS conditions in WFP occur less often than in NWF when diagnosed using wind speed, air temperature, and SST criteria because of the wake wind speed reduction. At 10 m, the turbine–atmosphere interaction alters possible icing conditions the most in February, with a maximum reduction by 15 h (Table 3). At 20 m, wind plants cause a reduction by up to 15 h in January and February. In each case, the reduction in possible icing conditions is spatially coincident with the wind plant areas (Fig. 7). At the 138 m hub height, the change to the number of FSS hours also maximizes in January and February, with a reduction by 9 h.
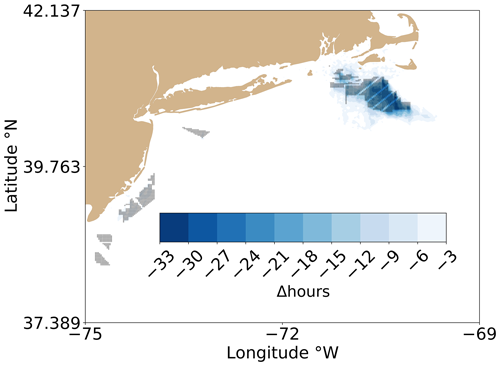
Figure 7The (WFP-NWF) change in number of FSS hours at 10 m November 2019 to March 2020. Darker-blue contours indicate a larger reduction.
Similarly, the presence of wind turbines has a minimal impact on the number of hours FSS conditions occur by means of icing PR at the POI. The duration of nonzero PR over the November through March winter period increases by 3 h or from 253 to 256 h total, at a point centered on the RIMA block. The total duration of CAO does not change after the installation of wind plants and remains at 202 h. The total number of events (seven) does not change in the presence of wind turbines, and all flagged timestamps still cause light icing of less than 0.7 cm h−1.
Herein, we assess the threat of icing conditions at 10 and 20 m due to freezing sea spray and at the hub height due to precipitation and in-cloud icing. The simulation study encompasses the mid-Atlantic Outer Continental Shelf based on a 21-year WRF dataset from 1 January 2000 to 31 December 2020 and another WRF dataset using year-long simulations from 1 September 2019 to 31 August 2020. In each case, we focus on the wintertime period from November through March. We consider the present icing risk from simulations with no wind farms (NOW-23, NWF) and assess the post-construction adjustments by incorporating the effects of turbines (WFP) in a full build-out of the wind plant lease areas.
Using an FSS predictability equation (PR), we detect seven events flagged for FSS conditions in NWF with a total duration of 253 h during the November 2019 to March 2020 period. All times during the period with nonzero icing predictability (PR) contain light ice accumulation of less than 0.7 cm h−1, which is typical of the Mid-Atlantic Bight as assessed from 2000 to 2020. Centered at the RIMA block of lease areas, all seven events have an associated CAO during the 2019–2020 winter. In the NOW-23 dataset from November 2019 to March 2020, eight total events are flagged, and all eight correspond to CAOs. Over the 21-year climatology, every CAO event has a corresponding FSS event, although not all FSS events have attendant CAOs. Thus, offshore icing conditions may be forecast with reasonable fidelity through accompanying CAOs, although other drivers exist. There is strong teleconnection between anomalous arctic sea level pressure and CAO, as 93 % of CAO events in the eastern USA contained an antecedent positive arctic sea level pressure anomaly a week in advance (Vavrus et al., 2006).
The number of FSS hours exhibit spatial variability, as assessed using our detection criteria for low air and sea surface temperatures and strong winds. The hazards intensify toward higher latitudes where air and sea temperatures are colder and wind speeds are faster, near the land surface where cold air advects offshore, and by Nantucket and the Long Island Sound where SSTs are colder. Icing conditions at the hub height, as assessed by low air temperatures and precipitation or saturated air, are more frequent. The icing hazard is greatest during January when wind speeds are fast and temperatures are cold. At 10 m in January, favorable conditions for icing occur up to 67 h. At 20 m in January, the duration of icing conditions is similar, at 68 h. Finally, at the hub height, icing conditions occur for up to 119 h east of Cape Cod. Overall, the 2019–2020 winter period is the mildest winter when considering the 21-year climatology. Although the 2019–2020 winter season has the fewest number of freezing sea spray hours, all winters contain light ice accumulation rates of 0.7 cm h−1.
The introduction of large wind plants makes a small impact on the icing risk within the wind plant clusters. In wintertime unstable conditions, which occur 64 % of the time from November 2019 through March 2020, wind turbines introduce a mean near-surface cooling effect. Despite the enhanced freezing risk from supplementary cooling, slower wind speeds in the wake mitigate the icing hazard. A mean reduction in wind speeds within wakes reaches up to −0.57 m s−1 in unstable stratification, with a mean introduction of cooler air up to −0.041 K. As assessed using wind speed, air temperature, and SST criteria, the change in FSS risk over the 2019–2020 wintertime period is a net reduction by only 15 h at both 10 and 20 m. The alleviation by slower wind speeds is largest within the RIMA block of wind plants, which contains the greatest number of turbines and the greatest number of FSS hours relative to other wind energy areas. When assessed using PR centered on the RIMA block, the number of icing hours increases by 3 with no change to the CAO hours. Although the 2019 through 2020 winter period is the mildest winter and is thus not representative of the 21-year climatology of FSS conditions, this period captures the post-construction effects of wind plants well. We note that such effects may be more significant during harsher winters.
Future OCS winter storm frequency may differ due to climate change. For instance, warming Arctic temperatures, which reduce the meridional geopotential height gradient between the Arctic and midlatitudes, can weaken the jet stream. Slower zonal winds and more pronounced Rossby waves amplify the transport of extreme winter weather to the midlatitudes (Cohen et al., 2020). Future East Coast storm activity and temperature may experience modulations based on large-scale teleconnections such as El Niño and the North Atlantic Oscillation (Hall and Booth, 2017). Further, Arctic amplification may increase the strength of teleconnection found between positive Arctic sea level pressure anomalies and CAO (Vavrus et al., 2006).
Finally, we assume that sea spray provides a consistent moisture flux at 10 and 20 m during fast wind conditions, that the droplet size of spray is homogeneous, and that the number distribution by height is constant. The impingement of waves onto offshore structures provides a larger source of moisture than wind-generated spray that is dependent on the wave height and wave period. Future studies may benefit from coupling WRF with wave models, such as Wave Watch III (Tolman et al., 2019) and Simulating WAves Nearshore (SWAN Team, 2020), for precise modeling of wave characteristics and current dynamics, such as stratified cold pooling around Cape Cod. New satellite methods are being developed to quantify occurrences of freezing sea spray (Line et al., 2022), and future developments could compare the FSS criteria to satellite observations of FSS.
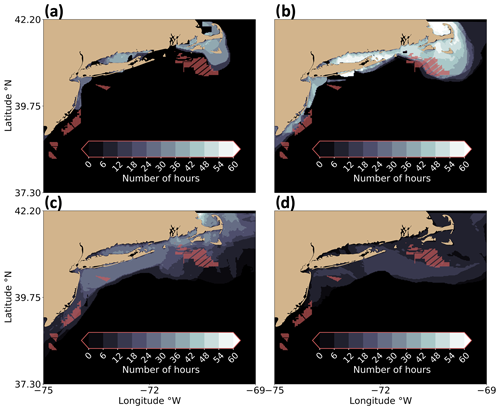
Figure A1The number of freezing hours at 10 m during (a) December 2019, (b) January 2020, (c) February 2020, and (d) March 2020. Lighter contouring indicates higher percentages. Red dots indicate turbine locations.
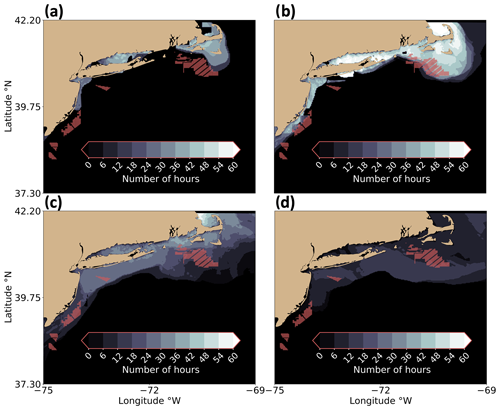
Figure A2The number of freezing hours at 20 m during (a) December 2019, (b) January 2020, (c) February 2020, and (d) March 2020. Lighter contouring indicates higher percentages. Red dots indicate turbine locations.
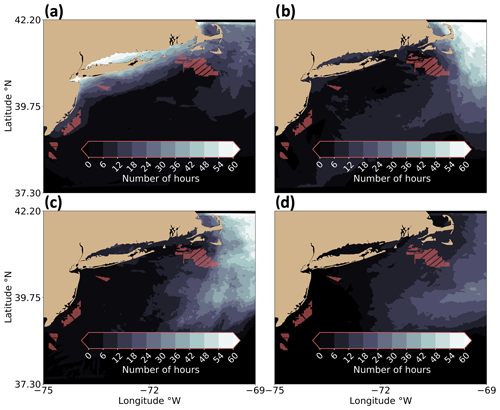
Figure A3The number of freezing hours at hub height during (a) December 2019, (b) January 2020, (c) February 2020, and (d) March 2020. Lighter contouring indicates higher percentages. Red dots indicate turbine locations.
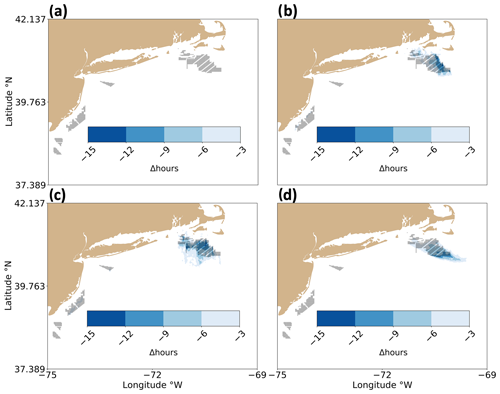
Figure A4The (WFP-NWF) difference in freezing hours at 10 m during (a) December 2019, (b) January 2020, (c) February 2020, and (d) March 2020. Darker-blue contours indicate fewer hours. Gray dots indicate turbine locations.
As discussed in Sect. 2.3, we detect FSS conditions using common thresholds for meteorological conditions (Guest and Luke, 2005; Dehghani-Sanij et al., 2017; Line et al., 2022). These criteria require strong wind speeds greater than 9 m s−1, cold air temperatures below −1.7 °C, and cold SSTs less than 7 °C. As reviewed by Dehghani-Sanij et al. (2017), FSS conditions are promising when the air temperature is below either −1.7 or −2 °C to account for the lower freezing point of saline ocean water: the salt content of which determines this threshold. Although SST thresholds of 5 or 7 °C are prevalent, a threshold up to 8.9 °C has been used (U.S. Navy, 1988). Although these thresholds were derived from observations aboard ships, the observations are sparse and have not been validated in the mid-Atlantic. Using higher air and sea surface temperature thresholds may cause an overestimation of the number of freezing hours when mid-Atlantic waters are more saline, for example, during periods with higher evaporation rates. Further, large water droplets have a higher chance of becoming runoff instead of freezing. Thus, our results may overestimate the number of icing hours when significant wave breaking and bubble bursting occur and underestimate the number of icing hours in calmer waters. As such, we quantify some of the uncertainty by calculating the number of hours that FSS conditions occur using conservative thresholds, which produce fewer icing hours (FEWER), and liberal thresholds, which promote more icing hours (MORE) (Table B1). As there is wider agreement regarding the wind speed threshold (Dehghani-Sanij et al., 2017; Guest and Luke, 2005; Line et al., 2022; Ross and Cardone, 1974; Monahan et al., 1983; Monahan and MacNiocaill, 1986), we hold it constant. Due to computational constraints, we only assess the number of icing hours throughout the domain at 10 m and during January 2020 because it has the greatest number of icing hours.
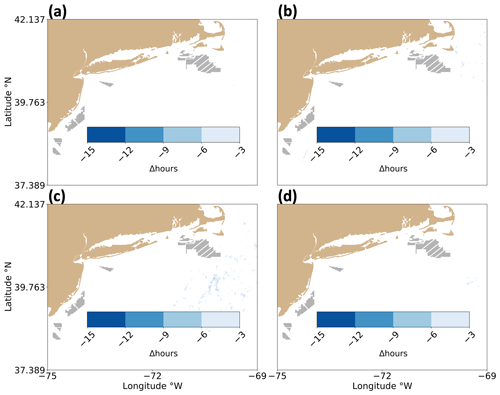
As expected, more conservative thresholds produce fewer FSS hours and vice versa (Fig. B1a–c). In FEWER, the meteorological conditions conducive to icing maximize at 60 h. Using more liberal criteria in MORE, the maximum number of hours increases to 67. Despite the small change in the maximum number of hours FSS occurs, the regional variation is large; the area covered by icing conditions increases from 8924 to 135 244 km2 from FEWER to MORE, roughly 15 times greater than FEWER or 2.2 times greater than our production set of criteria. Regional variability follows SST patterns and only occurs in FEWER when the SST is relatively cold in the Long Island Sound and Nantucket Sound (Fig. B1b), as discussed previously.

Figure B1The number of hours FSS conditions occur during January 2020 at 10 m in NWF using thresholds for (a) FEWER, (b) MORE, and (c) the FEWER-MORE difference. Lighter contouring indicates more freezing hours in (a) and (b). Darker blues represent a larger reduction in number of hours in (c). Turbine locations are shown as red dots in (a) and (b) and as black dots in (c).

Figure C1Time series of CAO and FSS events from November 2000 to April 2001. Light-blue shading indicates the duration of nonzero PR, and gray shading indicates the duration of detected CAO from NOW-23.

Figure C2Time series of CAO and FSS events from November 2001 to April 2002. Light-blue shading indicates the duration of nonzero PR, and gray shading indicates the duration of detected CAO from NOW-23.

Figure C3Time series of CAO and FSS events from November 2002 to April 2003. Light-blue shading indicates the duration of nonzero PR, and gray shading indicates the duration of detected CAO from NOW-23.

Figure C4Time series of CAO and FSS events from November 2003 to April 2004. Light-blue shading indicates the duration of nonzero PR, and gray shading indicates the duration of detected CAO from NOW-23.

Figure C5Time series of CAO and FSS events from November 2004 to April 2005. Light-blue shading indicates the duration of nonzero PR, and gray shading indicates the duration of detected CAO from NOW-23.

Figure C6Time series of CAO and FSS events from November 2005 to April 2006. Light-blue shading indicates the duration of nonzero PR, and gray shading indicates the duration of detected CAO from NOW-23.

Figure C7Time series of CAO and FSS events from November 2006 to April 2007. Light-blue shading indicates the duration of nonzero PR, and gray shading indicates the duration of detected CAO from NOW-23.

Figure C8Time series of CAO and FSS events from November 2007 to April 2008. Light-blue shading indicates the duration of nonzero PR, and gray shading indicates the duration of detected CAO from NOW-23.

Figure C9Time series of CAO and FSS events from November 2008 to April 2009. Light-blue shading indicates the duration of nonzero PR, and gray shading indicates the duration of detected CAO from NOW-23.

Figure C10Time series of CAO and FSS events from November 2009 to April 2010. Light-blue shading indicates the duration of nonzero PR, and gray shading indicates the duration of detected CAO from NOW-23.

Figure C11Time series of CAO and FSS events from November 2010 to April 2011. Light-blue shading indicates the duration of nonzero PR, and gray shading indicates the duration of detected CAO from NOW-23.

Figure C12Time series of CAO and FSS events from November 2011 to April 2012. Light-blue shading indicates the duration of nonzero PR, and gray shading indicates the duration of detected CAO from NOW-23.

Figure C13Time series of CAO and FSS events from November 2012 to April 2013. Light-blue shading indicates the duration of nonzero PR, and gray shading indicates the duration of detected CAO from NOW-23.

Figure C14Time series of CAO and FSS events from November 2013 to April 2014. Light-blue shading indicates the duration of nonzero PR, and gray shading indicates the duration of detected CAO from NOW-23.

Figure C15Time series of CAO and FSS events from November 2014 to April 2015. Light-blue shading indicates the duration of nonzero PR, and gray shading indicates the duration of detected CAO from NOW-23.

Figure C16Time series of CAO and FSS events from November 2015 to April 2016. Light-blue shading indicates the duration of nonzero PR, and gray shading indicates the duration of detected CAO from NOW-23.

Figure C17Time series of CAO and FSS events from November 2016 to April 2017. Light-blue shading indicates the duration of nonzero PR, and gray shading indicates the duration of detected CAO from NOW-23.

Figure C18Time series of CAO and FSS events from November 2017 to April 2018. Light-blue shading indicates the duration of nonzero PR, and gray shading indicates the duration of detected CAO from NOW-23.

Figure C19Time series of CAO and FSS events from November 2018 to April 2019. Light-blue shading indicates the duration of nonzero PR, and gray shading indicates the duration of detected CAO from NOW-23.
The dataset and files that support this work are publicly available. The ERA5 initial and boundary conditions can be downloaded from the ECMWF Climate Data Store at https://doi.org/10.24381/cds.bd0915c6 (Hersbach et al., 2023). Shapefiles including the bounds for the wind energy lease areas are at https://www.boem.gov/renewable-energy/mapping-and-data/renewable-energy-gis-data (last access: 21 October 2019, BOEM, 2024). Wind turbine coordinates and their power and thrust curves are provided at https://doi.org/10.5281/zenodo.7374283 (Rosencrans, 2022). WRF namelists for the NWF and WFP simulations may be acquired from https://doi.org/10.5281/zenodo.10476276 (Rosencrans, 2024). The NOW-23 simulation output data are available in HDF5 format at https://doi.org/10.25984/1821404 (National Renewable Energy Laboratory, 2020).
Conceptualization – JKL. Resources – MO, NB. Methodology – DR, JKL. Software – DR. Formal analysis and visualization – DR. Investigation – DR and JKL. Writing (original draft) – DR and JKL. Writing (review and editing) – all co-authors. Supervision – JKL.
At least one of the (co-)authors is a member of the editorial board of Wind Energy Science. The peer-review process was guided by an independent editor. Furthermore, Mike Optis co-authored the submitted paper while an employee of the National Renewable Energy Laboratory. He has since founded Veer Renewables, which recently released a wind modeling product, WakeMap, which is based on a similar numerical weather prediction modeling framework to the one described in this paper. Data from WakeMap is sold to wind energy stakeholders for profit. Public content on WakeMap includes a website (https://veer.eco/wakemap/, last access: 11 January 2024), a white paper (https://veer.eco/wp-content/uploads/2023/02/WakeMap_White_Paper_Veer_Renewables.pdf, last access: 6 January 2024), and several LinkedIn posts promoting WakeMap. Mike Optis is the founder and president of Veer Renewables, a for-profit consulting company. Mike Optis is a shareholder of Veer Renewables and owns 92 % of its stock.
The views expressed in the article do not necessarily represent the views of the DOE or the US government.
Publisher's note: Copernicus Publications remains neutral with regard to jurisdictional claims made in the text, published maps, institutional affiliations, or any other geographical representation in this paper. While Copernicus Publications makes every effort to include appropriate place names, the final responsibility lies with the authors.
This work utilized the Alpine high-performance computing resources at the University of Colorado Boulder. Alpine is jointly funded by the University of Colorado Boulder, the University of Colorado Anschutz, and Colorado State University. Data storage was supported by the University of Colorado Boulder PetaLibrary. A portion of this research was performed using computational resources sponsored by the DOE's Office of Energy Efficiency and Renewable Energy and located at NREL. Funding was provided by the US Department of Energy Office of Energy Efficiency and Renewable Energy Wind Energy Technologies Office.
The authors wish to thank Louis Bowers and Sarah McElman for their questions that led to this line of inquiry.
This research has been supported by the New York State Energy Research and Development Authority (grant no. CRD-19-16351) and the National Renewable Energy Laboratory (grant no. APUP UGA-0-41026-125).
This paper was edited by Andrea Hahmann and reviewed by two anonymous referees.
Alexander, M. and Scott, J.: The influence of ENSO on air-sea interaction in the Atlantic, Geophys. Res. Lett., 29, 46-1–46-4, https://doi.org/10.1029/2001GL014347, 2002.
Archer, C. L., Colle, B. A., Veron, D. L., Veron, F., and Sienkiewicz, M. J.: On the predominance of unstable atmospheric conditions in the marine boundary layer offshore of the U.S. northeastern coast, J. Geophys. Res.-Atmos., 121, 8869–8885, https://doi.org/10.1002/2016JD024896, 2016.
Archer, C. L., Wu, S., Ma, Y., and Jiménez, P. A.: Two Corrections for Turbulent Kinetic Energy Generated by Wind Farms in the WRF Model, Mon. Weather Rev., 148, 4823–4835, https://doi.org/10.1175/MWR-D-20-0097.1, 2020.
Atkinson, B. W. and Wu Zhang, J.: Mesoscale shallow convection in the atmosphere, Rev. Geophys., 34, 403–431, https://doi.org/10.1029/96RG02623, 1996.
Battisti, L., Fedrizzi, R., Brighenti, A., and Laakso, T.: Sea ice and icing risk for offshore wind turbines, Proceedings of the OWEMES, Civitavecchia, Italy 22 April 2006, 20–22, https://www.researchgate.net/publication/228552784_Sea_ice_and_icing_risk_for_offshore_wind_turbines (last access: 8 November 2023), 2006.
Beiter, P., Musial, W., Duffy, P., Cooperman, A., Shields, M., Heimiller, D., and Optis, M.: The Cost of Floating Offshore Wind Energy in California Between 2019 and 2032, Technical Report, National Renewable Energy Laboratory NREL/TP-5000-77384, https://doi.org/10.2172/1710181, 2020.
Bodini, N., Lundquist, J. K., and Kirincich, A.: U.S. East Coast Lidar Measurements Show Offshore Wind Turbines Will Encounter Very Low Atmospheric Turbulence, Geophys. Res. Lett., 46, 5582–5591, https://doi.org/10.1029/2019GL082636, 2019.
Bodini, N., Optis, M., Redfern, S., Rosencrans, D., Rybchuk, A., Lundquist, J. K., Pronk, V., Castagneri, S., Purkayastha, A., Draxl, C., Krishnamurthy, R., Young, E., Roberts, B., Rosenlieb, E., and Musial, W.: The 2023 National Offshore Wind data set (NOW-23), Earth Syst. Sci. Data, 16, 1965–2006, https://doi.org/10.5194/essd-16-1965-2024, 2024.
BOEM: Renewable Energy GIS Data, BOEM [data set], https://www.boem.gov/renewable-energy/mapping-and-data/renewable-energy-gis-data, (last access: 13 October 2019), 2024.
Chapman, D. C., Barth, J. A., Beardsley, R. C., and Fairbanks, R. G.: On the Continuity of Mean Flow between the Scotian Shelf and the Middle Atlantic Bight, J. Phys. Oceanogr., 16, 758–772, https://doi.org/10.1175/1520-0485(1986)016<0758:OTCOMF>2.0.CO;2, 1986.
Cohen, J., Zhang, X., Francis, J., Jung, T., Kwok, R., Overland, J., Ballinger, T. J., Bhatt, U. S., Chen, H. W., Coumou, D., Feldstein, S., Gu, H., Handorf, D., Henderson, G., Ionita, M., Kretschmer, M., Laliberte, F., Lee, S., Linderholm, H. W., Maslowski, W., Peings, Y., Pfeiffer, K., Rigor, I., Semmler, T., Stroeve, J., Taylor, P. C., Vavrus, S., Vihma, T., Wang, S., Wendisch, M., Wu, Y., and Yoon, J.: Divergent consensuses on Arctic amplification influence on midlatitude severe winter weather, Nat. Clim. Change, 10, 20–29, https://doi.org/10.1038/s41558-019-0662-y, 2020.
Copernicus Marine Service: Global Ocean OSTIA Sea Surface Temperature and Sea Ice Analysis, Copernicus Marine Service [data set], https://doi.org/10.48670/moi-00165, 2024.
Contreras Montoya, L. T., Lain, S., and Ilinca, A.: A Review on the Estimation of Power Loss Due to Icing in Wind Turbines, Energies, 15, 1083, https://doi.org/10.3390/en15031083, 2022.
Dehghani-Sanij, A. R., Dehghani, S. R., Naterer, G. F., and Muzychka, Y. S.: Sea spray icing phenomena on marine vessels and offshore structures: Review and formulation, Ocean Eng., 132, 25–39, https://doi.org/10.1016/j.oceaneng.2017.01.016, 2017.
Donlon, C. J., Martin, M., Stark, J., Roberts-Jones, J., Fiedler, E., and Wimmer, W.: The Operational Sea Surface Temperature and Sea Ice Analysis (OSTIA) system, Remote Sens. Environ., 116, 140–158, https://doi.org/10.1016/j.rse.2010.10.017, 2012.
Ferrel, W: An essay on the winds and the currents of the ocean, Nashv. J. Med. Surg., 11, 288–375, https://empslocal.ex.ac.uk/people/staff/gv219/classics.d/ferrel-nashville56.pdf (last access: 5 April 2024), 1856.
Ferrier, B. S., Jin, Y., Lin, Y., Black, T., Rogers, E., and DiMego, G.: Implementation of a new grid-scale cloud and precipitation scheme in the NCEP Eta model, Amer. Meteor. Soc. Conf. on Weather Analysis and Forecasting, San Antonia, Texas, 19, https://www.researchgate.net/publication/284777388_Implementation_of_a_new_grid-scale_cloud_and_precipitation_scheme_in_the_NCEP_Eta_model (last access: 16 November 2023), 2002.
Fitch, A. C., Olson, J. B., Lundquist, J. K., Dudhia, J., Gupta, A. K., Michalakes, J., and Barstad, I.: Local and Mesoscale Impacts of Wind Farms as Parameterized in a Mesoscale NWP Model, Mon. Weather Rev., 140, 3017–3038, https://doi.org/10.1175/MWR-D-11-00352.1, 2012.
Fitch, A. C., Lundquist, J. K., and Olson, J. B.: Mesoscale Influences of Wind Farms throughout a Diurnal Cycle, Mon. Weather Rev., 141, 2173–2198, https://doi.org/10.1175/MWR-D-12-00185.1, 2013.
Gao, L. and Hong, J.: Wind turbine performance in natural icing environments: A field characterization, Cold Reg. Sci. Technol., 181, 103193, https://doi.org/10.1016/j.coldregions.2020.103193, 2021.
Gao, L. and Hu, H.: Wind turbine icing characteristics and icing-induced power losses to utility-scale wind turbines, P. Natl. Acad. Sci. USA, 118, e2111461118, https://doi.org/10.1073/pnas.2111461118, 2021.
Geerts, B., Giangrande, S. E., McFarquhar, G. M., Xue, L., Abel, S. J., Comstock, J. M., Crewell, S., DeMott, P. J., Ebell, K., Field, P., Hill, T. C. J., Hunzinger, A., Jensen, M. P., Johnson, K. L., Juliano, T. W., Kollias, P., Kosovic, B., Lackner, C., Luke, E., Lüpkes, C., Matthews, A. A., Neggers, R., Ovchinnikov, M., Powers, H., Shupe, M. D., Spengler, T., Swanson, B. E., Tjernström, M., Theisen, A. K., Wales, N. A., Wang, Y., Wendisch, M., and Wu, P.: The COMBLE Campaign: A Study of Marine Boundary Layer Clouds in Arctic Cold-Air Outbreaks, B. Am. Meteorol. Soc., 103, E1371–E1389, https://doi.org/10.1175/BAMS-D-21-0044.1, 2022.
Glossary – NOAA's National Weather Service: https://forecast.weather.gov/glossary.php?letter=f, last access: 12 April 2023.
Golbazi, M., Archer, C. L., and Alessandrini, S.: Surface impacts of large offshore wind farms, Environ. Res. Lett., 17, 064021, https://doi.org/10.1088/1748-9326/ac6e49, 2022.
Gómez, B. and Miguez-Macho, G.: The impact of wave number selection and spin-up time in spectral nudging, Q. J. Roy. Meteor. Soc., 143, 1772–1786, https://doi.org/10.1002/qj.3032, 2017.
Gryning, S.-E., Batchvarova, E., Brümmer, B., Jørgensen, H., and Larsen, S.: On the extension of the wind profile over homogeneous terrain beyond the surface boundary layer, Bound.-Lay. Meteorol., 124, 251–268, https://doi.org/10.1007/s10546-007-9166-9, 2007.
Guest, P. and Luke, R.: The Power of Wind and Water, Mariners Weather Log, https://www.vos.noaa.gov/MWL/dec_05/ves.shtml (last access: 2 April 2024), 2005.
Hall, T. and Booth, J. F.: SynthETC: A Statistical Model for Severe Winter Storm Hazard on Eastern North America, J. Climate, 30, 5329–5343, https://doi.org/10.1175/JCLI-D-16-0711.1, 2017.
Hersbach, H., Bell, B., Berrisford, P., Hirahara, S., Horányi, A., Muñoz-Sabater, J., Nicolas, J., Peubey, C., Radu, R., Schepers, D., Simmons, A., Soci, C., Abdalla, S., Abellan, X., Balsamo, G., Bechtold, P., Biavati, G., Bidlot, J., Bonavita, M., De Chiara, G., Dahlgren, P., Dee, D., Diamantakis, M., Dragani, R., Flemming, J., Forbes, R., Fuentes, M., Geer, A., Haimberger, L., Healy, S., Hogan, R. J., Hólm, E., Janisková, M., Keeley, S., Laloyaux, P., Lopez, P., Lupu, C., Radnoti, G., de Rosnay, P., Rozum, I., Vamborg, F., Villaume, S., and Thépaut, J.-N.: The ERA5 global reanalysis, Q. J. Roy. Meteor. Soc., 146, 1999–2049, https://doi.org/10.1002/qj.3803, 2020.
Hersbach, H., Bell, B., Berrisford, P., Biavati, G., Horányi, A., Muñoz Sabater, J., Nicolas, J., Peubey, C., Radu, R., Rozum, I., Schepers, D., Simmons, A., Soci, C., Dee, D., and Thépaut, J.-N.: ERA5 hourly data on pressure levels from 1940 to present, Copernicus Climate Change Service (C3S) Climate Data Store (CDS) [data set], https://doi.org/10.24381/cds.bd0915c6, 2023.
Hirsch, R. M., Slack, J. R., and Smith, R. A.: Techniques of trend analysis for monthly water quality data, Water Resour. Res., 18, 107–121, https://doi.org/10.1029/WR018i001p00107, 1982.
Hussain, M. M. and Mahmud, I.: pyMannKendall: a python package for non parametric Mann Kendall family of trend tests, Journal of Open Source Software, 4, 1556, https://doi.org/10.21105/joss.01556, 2019.
Iacono, M. J., Delamere, J. S., Mlawer, E. J., Shephard, M. W., Clough, S. A., and Collins, W. D.: Radiative forcing by long-lived greenhouse gases: Calculations with the AER radiative transfer models, J. Geophys. Res.-Atmos., 113, D13103, https://doi.org/10.1029/2008JD009944, 2008.
IEA: Available Technologies for Wind Energy in Cold Climates – report, https://iea-wind.org/wp-content/uploads/2021/09/ Lehtomaki-et-al.-2018-Available-Technologies-for-Wind-Energy-in-Cold-Climates-report-2-nd-edition-2018.pdf (last access: 8 March 2024), 2018.
ISO: Atmospheric Icing of Structures, Geneva, Switzerland, ISO-12494:2017, https://cdn.standards.iteh.ai/samples/72443/ 2fb2033c3f844304b66281607516ec58/ISO-12494-2017.pdf (last access: 24 April 2024), 2017.
Kain, J. S.: The Kain–Fritsch Convective Parameterization: An Update, J. Appl. Meteorol. Clim., 43, 170–181, https://doi.org/10.1175/1520-0450(2004)043<0170:TKCPAU>2.0.CO;2, 2004.
Kraegel, L.: Destination likely sank after accumulating ice in heavy freezing spray, report says, https://www.ktoo.org/2018/07/16/destination-likely-sank- after-accumulating-ice-in-heavy-freezing-spray-report-says/ (last access: 12 April 2023), 2018.
Kraj, A. G. and Bibeau, E. L.: Phases of icing on wind turbine blades characterized by ice accumulation, Renew. Energ., 35, 966–972, https://doi.org/10.1016/j.renene.2009.09.013, 2010.
Line, W. E., Grasso, L., Hillger, D., Dierking, C., Jacobs, A., and Shea, S.: Using NOAA Satellite Imagery to Detect and Track Hazardous Sea Spray in the High Latitudes, Weather Forecast., 37, 351–369, https://doi.org/10.1175/WAF-D-21-0137.1, 2022.
Madi, E., Pope, K., Huang, W., and Iqbal, T.: A review of integrating ice detection and mitigation for wind turbine blades, Renew. Sust. Energ. Rev., 103, 269–281, https://doi.org/10.1016/j.rser.2018.12.019, 2019.
Martini, F., Contreras Montoya, L. T., and Ilinca, A.: Review of Wind Turbine Icing Modelling Approaches, Energies, 14, 5207, https://doi.org/10.3390/en14165207, 2021.
Monahan, E. C. and MacNiocaill, G.: Oceanic Whitecaps And Their Role in Air-Sea Exchange Processes, D Reidel Publishing Company, e-ISBN-13: 978-94-009-4668-2, https://doi.org/10.1007/978-94-009-4668-2, 1986.
Monahan, E. C., Fairall, C. W., Davidson, K. L., and Boyle, P. J.: Observed inter-relations between 10 m winds, ocean whitecaps and marine aerosols, Q. J. Roy. Meteor. Soc., 109, 379–392, https://doi.org/10.1002/qj.49710946010, 1983.
Monin, A. S. and Obukhov, A. M.: Basic laws of turbulent mixing in the surface layer of the atmosphere, Tr. Akad. Nauk SSSR Geophiz. Inst., 24, 163–187, 1954.
Musial, W., Spitsen, P., Duffy, P., Beiter, P., Marquis, M., Hammond, R., and Shields, M.: Offshore Wind Market Report, 2022 edn., NREL/TP-5000-83544, National Renewable Energy Laboratory, Golden, CO, United States, https://doi.org/10.2172/1893268, 2022.
Nakanishi, M. and Niino, H.: An Improved Mellor–Yamada Level-3 Model: Its Numerical Stability and Application to a Regional Prediction of Advection Fog, Bound.-Lay. Meteorol., 119, 397–407, https://doi.org/10.1007/s10546-005-9030-8, 2006.
National Renewable Energy Laboratory: 2023 National Offshore Wind data set (NOW-23), Open Enegy Data Initiative [data set], https://doi.org/10.25984/1821404, 2020.
Nilsen, T.: Icing believed to cause sinking of fishing boat in Barents Sea, 17 missing, https://thebarentsobserver.com/en/2020/12/ icing-believed-cause-sining-fishing-boat-barents-sea-17-missing (last access: 12 April 2023), 2020.
Niu, G.-Y., Yang, Z.-L., Mitchell, K. E., Chen, F., Ek, M. B., Barlage, M., Kumar, A., Manning, K., Niyogi, D., Rosero, E., Tewari, M., and Xia, Y.: The community Noah land surface model with multiparameterization options (Noah-MP): 1. Model description and evaluation with local-scale measurements, J. Geophys. Res.-Atmos., 116, D12109, https://doi.org/10.1029/2010JD015139, 2011.
NTSB: NTSB announces the probable cause of the sunken Scandies Rose, https://www.alaskasnewssource.com/2021/06/29/ntsb-announce-probable-cause-sunken-scandies-rose/ (last access: 12 April 2023), 2021.
Novacheck, J., Sharp, J., Schwarz, M., Donohoo-Vallett, P., Tzavelis, Z., Buster, G., and Rossol, M.: The Evolving Role of Extreme Weather Events in the U.S. Power System with High Levels of Variable Renewable Energy, NREL/TP-6A20-78394, 1837959, MainId:32311, https://doi.org/10.2172/1837959, 2021.
NREL: 2023 National Offshore Wind data set (NOW-23), https://doi.org/10.25984/1821404, 2020.
Nygaard, N. G.: Wakes in very large wind farms and the effect of neighbouring wind farms, J. Phys. Conf. Ser., 524, 012162, https://doi.org/10.1088/1742-6596/524/1/012162, 2014.
Overland, J. E.: Prediction of Vessel Icing for Near-Freezing Sea Temperatures, Weather Forecast., 5, 62–77, https://doi.org/10.1175/1520-0434(1990)005<0062:POVIFN>2.0.CO;2, 1990.
Overland, J. E., Pease, C. H., Preisendorfer, R. W., and Comiskey, A. L.: Prediction of Vessel Icing, J. Appl. Meteorol. Clim., 25, 1793–1806, https://doi.org/10.1175/1520-0450(1986)025<1793:POVI>2.0.CO;2, 1986.
Parent, O. and Ilinca, A.: Anti-icing and de-icing techniques for wind turbines: Critical review, Cold Reg. Sci. Technol., 65, 88–96, https://doi.org/10.1016/j.coldregions.2010.01.005, 2011.
Platis, A., Siedersleben, S. K., Bange, J., Lampert, A., Bärfuss, K., Hankers, R., Cañadillas, B., Foreman, R., Schulz-Stellenfleth, J., Djath, B., Neumann, T., and Emeis, S.: First in situ evidence of wakes in the far field behind offshore wind farms, Sci. Rep.-UK, 8, 2163, https://doi.org/10.1038/s41598-018-20389-y, 2018.
Powers, J. G., Klemp, J. B., Skamarock, W. C., Davis, C. A., Dudhia, J., Gill, D. O., Coen, J. L., Gochis, D. J., Ahmadov, R., Peckham, S. E., Grell, G. A., Michalakes, J., Trahan, S., Benjamin, S. G., Alexander, C. R., Dimego, G. J., Wang, W., Schwartz, C. S., Romine, G. S., Liu, Z., Snyder, C., Chen, F., Barlage, M. J., Yu, W., and Duda, M. G.: The Weather Research and Forecasting Model: Overview, System Efforts, and Future Directions, B. Am. Meteorol. Soc., 98, 1717–1737, https://doi.org/10.1175/BAMS-D-15-00308.1, 2017.
Pronk, V., Bodini, N., Optis, M., Lundquist, J. K., Moriarty, P., Draxl, C., Purkayastha, A., and Young, E.: Can reanalysis products outperform mesoscale numerical weather prediction models in modeling the wind resource in simple terrain?, Wind Energ. Sci., 7, 487–504, https://doi.org/10.5194/wes-7-487-2022, 2022.
Quint, D., Lundquist, J. K., Bodini, N., and Rosencrans, D.: Meteorological Impacts of Offshore Wind Turbines as Simulated in the Weather Research and Forecasting Model, Wind Energ. Sci. Discuss. [preprint], https://doi.org/10.5194/wes-2024-53, in review, 2024.
Rajewski, D. A., Takle, E. S., Lundquist, J. K., Oncley, S., Prueger, J. H., Horst, T. W., Rhodes, M. E., Pfeiffer, R., Hatfield, J. L., Spoth, K. K., and Doorenbos, R. K.: Crop Wind Energy Experiment (CWEX): Observations of Surface-Layer, Boundary Layer, and Mesoscale Interactions with a Wind Farm, B. Am. Meteorol. Soc., 94, 655–672, https://doi.org/10.1175/BAMS-D-11-00240.1, 2013.
Redfern, S., Optis, M., Xia, G., and Draxl, C.: Offshore wind energy forecasting sensitivity to sea surface temperature input in the Mid-Atlantic, Wind Energ. Sci., 8, 1–23, https://doi.org/10.5194/wes-8-1-2023, 2023.
Rosencrans, D.: mid-Atlantic_turbines, Zenodo [data set], https://doi.org/10.5281/zenodo.7374283, 2022.
Rosencrans, D.: mid-Atlantic_namelists, Zenodo [data set], https://doi.org/10.5281/zenodo.10476276, 2024.
Rosencrans, D., Lundquist, J. K., Optis, M., Rybchuk, A., Bodini, N., and Rossol, M.: Seasonal variability of wake impacts on US mid-Atlantic offshore wind plant power production, Wind Energ. Sci., 9, 555–583, https://doi.org/10.5194/wes-9-555-2024, 2024.
Ross, D. B. and Cardone, V.: Observations of oceanic whitecaps and their relation to remote measurements of surface wind Speed, J. Geophys. Res., 79, 444–452, https://doi.org/10.1029/JC079i003p00444, 1974.
Russell, L. M.: Sea-spray particles cause freezing in clouds, Nature, 525, 194–195, https://doi.org/10.1038/525194a, 2015.
Schneemann, J., Rott, A., Dörenkämper, M., Steinfeld, G., and Kühn, M.: Cluster wakes impact on a far-distant offshore wind farm's power, Wind Energ. Sci., 5, 29–49, https://doi.org/10.5194/wes-5-29-2020, 2020.
Shcherbina, A. Y. and Gawarkiewicz, G. G.: A coastal current in winter: 2. Wind forcing and cooling of a coastal current east of Cape Cod, J. Geophys. Res.-Oceans, 113, C10014,https://doi.org/10.1029/2008JC004750, 2008a.
Shcherbina, A. Y. and Gawarkiewicz, G. G.: A coastal current in winter: Autonomous underwater vehicle observations of the coastal current east of Cape Cod, J. Geophys. Res.-Oceans, 113, C07030, https://doi.org/10.1029/2007JC004306, 2008b.
Siedersleben, S. K., Lundquist, J. K., Platis, A., Bange, J., Bärfuss, K., Lampert, A., Cañadillas, B., Neumann, T., and Emeis, S.: Micrometeorological impacts of offshore wind farms as seen in observations and simulations, Environ. Res. Lett., 13, 124012, https://doi.org/10.1088/1748-9326/aaea0b, 2018.
Stull, R. B.: An Introduction to Boundary Layer Meteorology, Springer Science & Business Media, https://books.google.com/books?hl=en&lr=&id=2PjrCAAAQBAJ&oi=fnd&pg=PR10&dq=An+Introduction+to+Boundary+Layer+Meteorology+stull&ots=BdY_2W6EQ2&sig=eLIi5IVaua4aeHUWQt-NfG0IkTM#v=onepage&q=An%20Introduction%20to%20Boundary%20Layer%20Meteorology%20stull&f=false (last access: 18 August 2022), 1988.
SWAN Team: Scientific and Technical Documentation (SWAN Cycle III version 41.31A), Delft University of Technology, https://swanmodel.sourceforge.io/download/zip/swantech.pdf (last access: 25 October 2023), 2020.
Tewari, M., Chen, F., Wang, W., Dudhia, J., LeMone, M., Mitchell, K., Ek, M., Gayno, G., Wegiel, J., and Cuenca, R. H.: (PDF) Implementation and verification of the united NOAH land surface model in the WRF model, Proceedings of the 20th conference on weather analysis and forecasting/16th conference on numerical weather prediction, Seattle, Washington, 14 January 2004, 14, https://www.researchgate.net/publication/286272692_Implementation_and_verification_of_the_united_NOAH_land_surface_model_in_the_WRF_model (last access: 12 April 2023), 2004.
Thompson, G., Field, P. R., Rasmussen, R. M., and Hall, W. D.: Explicit Forecasts of Winter Precipitation Using an Improved Bulk Microphysics Scheme. Part II: Implementation of a New Snow Parameterization, Mon. Weather Rev., 136, 5095–5115, https://doi.org/10.1175/2008MWR2387.1, 2008.
Tolman, H., Abdolali, A., Accensi, M., Alves, J.-H., Ardhuin, F., Babanin, A., Barbariol, F., Benetazzo, A., Bidlot, J., Booij, N., Boutin, G., Bunney, C., Campbell, T., Chalikov, D., Chawla, A., Cheng, S., Collins III, C., Filipot, J.-F., Flampouris, S., and Liang, Z.: User manual and system documentation of WAVEWATCH III (R) version 6.07, https://www.researchgate.net/publication/336069899_User_manual_and_system_documentation_of_WAVEWATCH_III_R_version_607 (last access: 5 October 2023), 2019.
Tomaszewski, J. M. and Lundquist, J. K.: Simulated wind farm wake sensitivity to configuration choices in the Weather Research and Forecasting model version 3.8.1, Geosci. Model Dev., 13, 2645–2662, https://doi.org/10.5194/gmd-13-2645-2020, 2020.
U.S. Navy: U.S. Navy Cold Weather Handbook for Surface Ships, Surface Ship Survivability Office, https://media.defense.gov/2021/Feb/25/2002588484/-1/-1/0/CG%20070%20-%20US%20NAVY%20COLD%20WEATHER%20HANDBOOK.PDF (last access: 18 April 2024), 1988.
Vavrus, S., Walsh, J. E., Chapman, W. L., and Portis, D.: The behavior of extreme cold air outbreaks under greenhouse warming, Int. J. Climatol., 26, 1133–1147, https://doi.org/10.1002/joc.1301, 2006.
Wallace, J. M. and Hobbs, P. V.: Atmospheric Science: An Introductory Survey, 2nd edn., Elsevier, University of Washington, ISBN: 978-0-12-732951-2, 2006.
Wei, K., Yang, Y., Zuo, H., and Zhong, D.: A review on ice detection technology and ice elimination technology for wind turbine, Wind Energy, 23, 433–457, https://doi.org/10.1002/we.2427, 2020.
Winters, A. C., Bosart, L. F., and Keyser, D.: Antecedent North Pacific Jet Regimes Conducive to the Development of Continental U.S. Extreme Temperature Events during the Cool Season, Weather Forecast., 34, 393–414, https://doi.org/10.1175/WAF-D-18-0168.1, 2019.
Xia, G., Zhou, L., Freedman, J. M., Roy, S. B., Harris, R. A., and Cervarich, M. C.: A case study of effects of atmospheric boundary layer turbulence, wind speed, and stability on wind farm induced temperature changes using observations from a field campaign, Clim. Dynam., 46, 2179–2196, https://doi.org/10.1007/s00382-015-2696-9, 2016.


