the Creative Commons Attribution 4.0 License.
the Creative Commons Attribution 4.0 License.
 | 21 Apr 2026
Enhanced approach to match damage-equivalent loads in rotor blade fatigue testing
David Melcher
Peter Berring
Kim Branner
Enno Petersen
In the design process of current wind turbine blades, certification testing is a critical step to confirm design assumptions and requirements. To demonstrate reliability in fatigue testing, the blade will be loaded in all areas of interest to the load levels, which, at the end of such a test campaign, adequately represent the blade's lifetime. These loads are typically derived from aero-elastic load calculations with a combination of different design load cases in the form of accumulated bending moment distributions. The current practice includes two fatigue test sequences, which are aligned with the first flapwise and lead-lag modes, with the aim of reaching defined target bending moment distributions. However, these two test sequences combined may not cover all areas of interest, and some areas could be insufficiently tested. Also, in some areas, the conventional target bending moment formulation does not correctly represent fatigue damage of the material, as it is not derived from stress- or strain-based damage calculations and does not allow for mean load correction. The aim of this work is to demonstrate these shortcomings on a particular test case and to propose an enhanced method to derive representative target loads, which cover all areas of interest and are strain proportional, allowing for correct material damage accumulation and mean load correction. It is shown for the test case that, compared to conventional methods, the enhanced target loads require 16 % higher test loads at certain positions along the blade within the four main load directions and even more for load directions in between.
- Article
(5215 KB) - Full-text XML
- BibTeX
- EndNote


The design and certification processes of wind turbine rotor blades are essential for ensuring their operational reliability and performance over a lifespan typically ranging from 20 to 30 years. A critical and time-consuming component of the certification is fatigue testing of first-manufactured instances of a new blade type, which is aimed at validating design assumptions and ensuring that blades can endure the fatigue loads encountered throughout their operational life. As current blades are designed closer to the limits of the materials and thus have lower reserves to resist overloading than older generations, representative fatigue testing gains more importance. These tests subject the blades to cyclic loading conditions derived from a collection of design load cases, primarily based on bending moment distributions, which are combined to represent the blade's lifetime.
Nowadays fatigue test campaigns are mostly executed according to the current IEC 61400-23:2014 (2014) and DNV ST-0376:2024 (2024) standards and typically consist of two consecutive test sequences in the flapwise and lead-lag directions. Each fatigue test involves mounting the blade root to a test block and exciting the blade in resonance at or near its corresponding natural frequency for a defined number of cycles. Test loads are introduced along the blade and must match or exceed the required target loads. To adjust the load distribution along the blade, additional masses are attached to the blade by using load frames.
The target loads are derived from transient aero-elastic load simulations considering different operational conditions and design load cases (DLCs) of the wind turbine (IEC 61400-1:2019, 2019; DNV-ST-0437:2024, 2024). The IEC 61400-5:2020 (2020) (Sect. 6.6.2.2) recommends generally using strain-proportional loads but allows the use of bending moments as well. Therefore, typically, the simulated time series are evaluated and accumulated, resulting in target bending moment distributions.
This approach with test sequences in separate loading directions, while established, may not adequately cover all critical areas of the blade. As only the main flapwise and lead-lag directions are loaded and compared to the target loads, the regions in between are not examined and are at risk of under-testing.
Furthermore, conventional target bending moment formulations may not accurately represent material fatigue damage, as they do not consider stress or strain distributions and neglect the influence of mean loads on fatigue behavior. This leads to fatigue testing procedures that misrepresent the fatigue damage, even in the four main directions of the blade.
Both DNV and the IEC are continuously working on improving their standards. DNV published a new version of DNV ST-0376:2024 (2024) in April 2024, and the IEC committee TC 88/MT 23 is currently working on the second revision of IEC 61400-23:2014 (2014), with a forecast release date in June 2026.
DNV ST-0376:2024 (2024) requires including the calculation method for the theoretical fatigue damage evaluation in the blade test specification and using an equivalent load amplitude whose associated fatigue damage equals the fatigue damage calculated from the design load spectrum to obtain test loads. The draft of the IEC 61400-23:2026(CD) (2024) calls for the tests to be designed for fatigue damage, in contrast to the current IEC 61400-23:2014 (2014) standard, which uses “fatigue-damage-equivalent loads” as a test design criterion. These developments show the importance of advancing fatigue testing to achieve more representative loading.
One of the first attempts to load a wind turbine blade more realistically was made by van Delft et al. (1988). They used two slanted hydraulic actuators to apply biaxial bending moments simultaneously, which were derived from real wind speed time series. The next known biaxial test campaign was performed by Hughes et al. (1999) with forced excitation via a bell-crank mechanism. Such forced excitation approaches are widely used in the aerospace and automotive industries. Although they can produce the most realistic loading, as well as damage initiation and development, they quickly became unfeasible for wind turbine blades due to the size of equipment and energy required for excitation. Therefore, further development of test methods was focused on partially or fully utilizing resonance of the system for both uniaxial and biaxial excitation at controlled and phase-locked frequency ratios (e.g., 1:1, 1:2) or at arbitrary frequency ratios resulting from the system's natural frequencies (see White, 2004; White et al., 2005, 2011; Bürkner and van Wingerde, 2011; Greaves et al., 2012; Greaves, 2013; Snowberg et al., 2014; Post and Bürkner, 2016; Melcher et al., 2020a, b, c; Bürkner, 2020; Castro et al., 2021a, 2022, 2024). Most of these works focused on the testing method and its practical application while still using conventional bending-moment-based approaches to derive target loads. Melcher et al. (2020b) used sectorial bending-moment-based target loads in 30° steps for designing biaxial fatigue tests but still allowed under-loading for sectors between the main directions. Sectorial equivalent fatigue loads based on transfer functions were used by Previtali and Eyb (2021) as well. Greaves et al. (2012) and Greaves (2013) used strain-based methods and included mean load correction (MLC) for multiple points along the circumference for test evaluation but considered only loads in the main directions as target loads. Freebury and Musial (2000) and Ma et al. (2018) proposed a way to incorporate mean load corrections into the derivation of target bending moments. Castro et al. (2021b, 2024) proposed a bending-moment-based but strain-proportional method for deriving target loads for biaxial testing including any desired load direction. However, they did not include strain-proportional mean load considerations. In summary, some proposed test methods became unfeasible, and the publications on equivalent target strains each lacked certain important aspects.
Therefore, the current work proposes an approach for deriving target loads which cover all loading directions. The derived target loads are proportional to strains and include the possibility of performing MLC by combining corresponding methods. This study aims to demonstrate the effect of considering strain-based fatigue behavior and taking the mean load influence into account. This is done on a specific test case to show potential improvements of the conventional target loads to better represent the material fatigue behavior. An enhanced method based on the work of Castro et al. (2021b, 2024) is proposed for deriving these representative target loads. The proposed approach emphasizes strain proportionality, facilitating accurate material damage accumulation and enabling mean load corrections. The derived target loads provide the option to be converted into strains/stresses directly or after using rainflow counting and/or damage accumulation, allowing for correct utilization of the methods used. As the proposed approach can be used for any load direction, it enables the derivation of target loads for any fatigue test method, including biaxial testing. In light of these considerations, this work seeks to refine the understanding of wind turbine blade fatigue testing methodologies and aims to enhance the safety and reliability of blades through improved post-processing of aero-elastic simulations and testing practices. The proposed enhancements of strain proportionality and MLC are expected to set a new standard for future certification processes. This research is relevant to anyone who works with blade testing, blade design, load calculations, and certification.
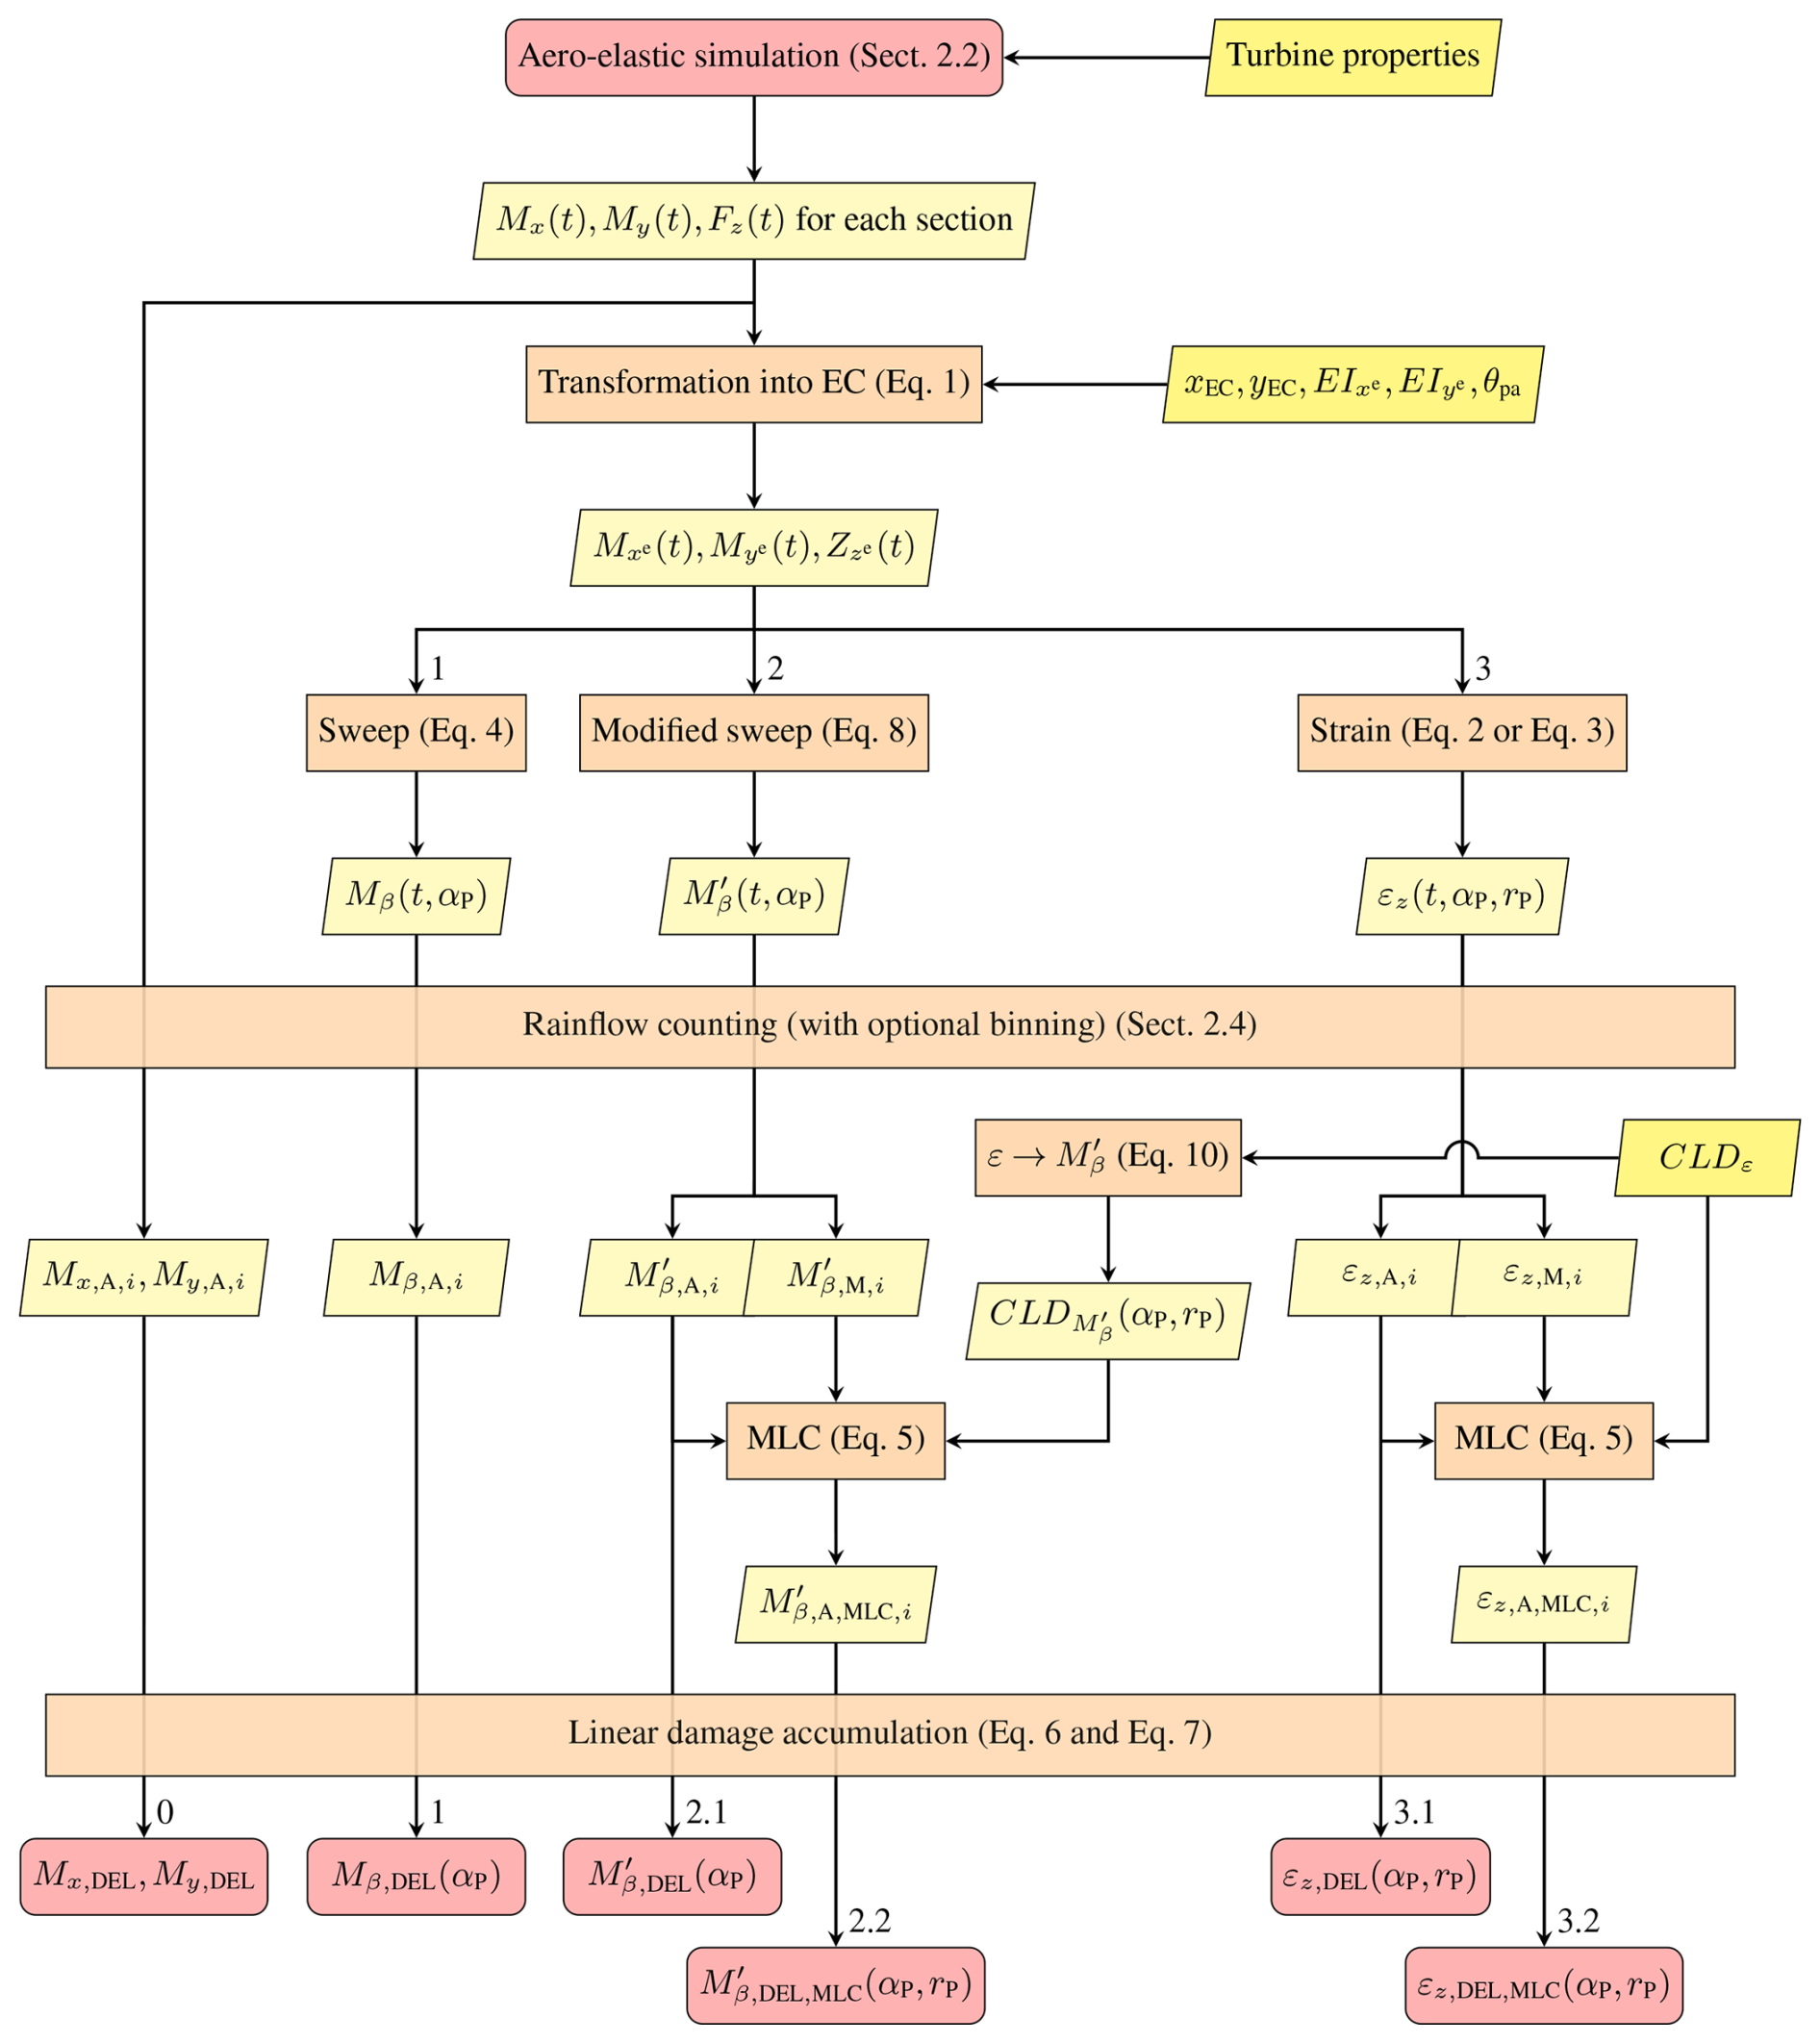
Figure 1Flow diagram of procedures for processing load time series resulting in alternative DELs.
As every original equipment manufacturer (OEM) has different procedures to derive their target loads for rotor blade fatigue tests and there is no exact procedure in the standards described, here a conventional procedure is assumed. The different processing procedures described in this work are visualized as a flow diagram in Fig. 1. All processing steps and the corresponding nomenclature shown in Fig. 1 are described in Sects. 2.2 to 2.7. Processing path 0 is the minimum procedure necessary to derive damage-equivalent loads (DELs) in the main directions of the blade. However, it is not recommended as it does not take into account any stiffness properties of the blade sections. Processing path 1, resulting in Mβ,DEL, represents the assumed conventional procedure. The results from processing paths 3.1 and 3.2 are used here as a reference because they best represent the actual material fatigue behavior. Processing path 2.1 describes the procedure proposed by Castro et al. (2021b), and processing path 2.2 describes the enhanced approach proposed in this work.
To evaluate these target load distributions for rotor blade fatigue testing, the procedure described in the following sections is followed.
2.1 Underlying assumptions
To follow industrial standards, certain safety factors must be considered in the design of fatigue tests, which are omitted in this work for simplification.
All procedures described in this work follow certain simplifying assumptions, which are listed below. If any of these assumptions are considered non-applicable, the methods described here would need to be adjusted accordingly:
-
The validity of Timoshenko (1921) beam theory with small deformations is assumed, i.e., negligible in-plane warping of blade sections and negligible Brazier effect (Brazier, 1927). Otherwise, sectional stiffness components would become dependent on these deformations (e.g., Brazier effect reduces outer dimensions, which in turn reduces the bending stiffness).
-
Only longitudinal strain is considered; i.e., shear, through thickness, and transverse strains are assumed negligible. See Appendix A1 for more details.
-
Longitudinal strain is affected only by bending moments and axial force; i.e., the influence of torque or shear loads (e.g., via bend–twist coupling) is assumed negligible. See Appendix A2 for details.
-
Prismatic beam response is assumed; i.e., tapering or other longitudinal changes (e.g., ply drops) do not affect the strains.
-
Stress and strain are assumed proportional.
-
Material fatigue damage adheres to linear damage accumulation (Palmgren, 1924; Miner, 1945).
-
Material fatigue damage adheres to a linear stress–life relationship; i.e., the Basquin curve exponent (Basquin, 1910) is independent of load level and cycle number.
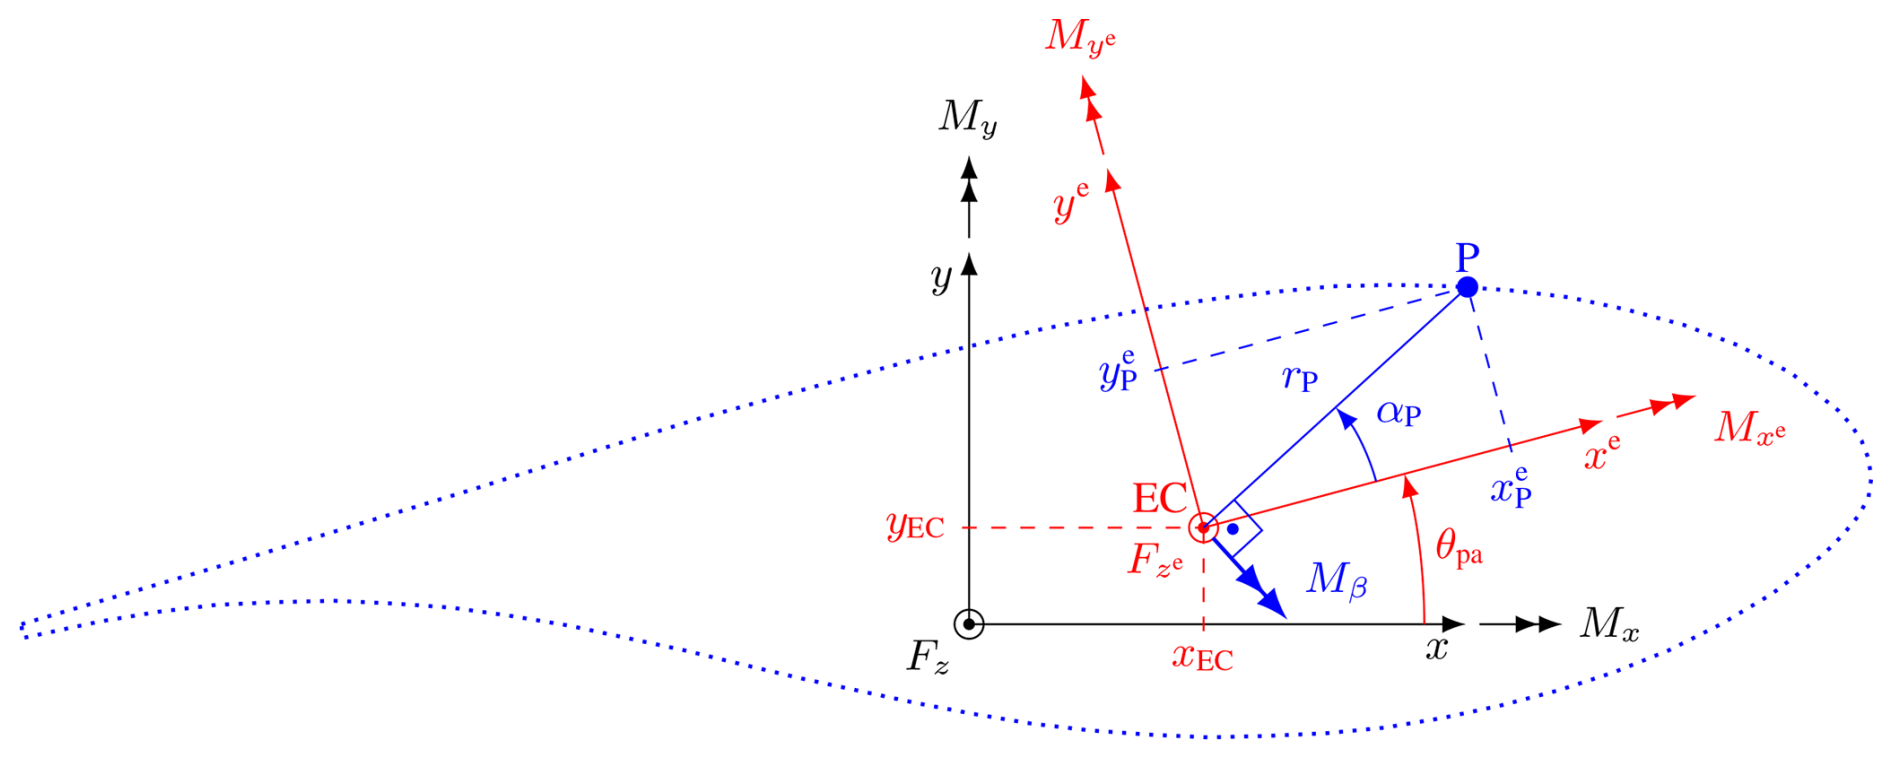
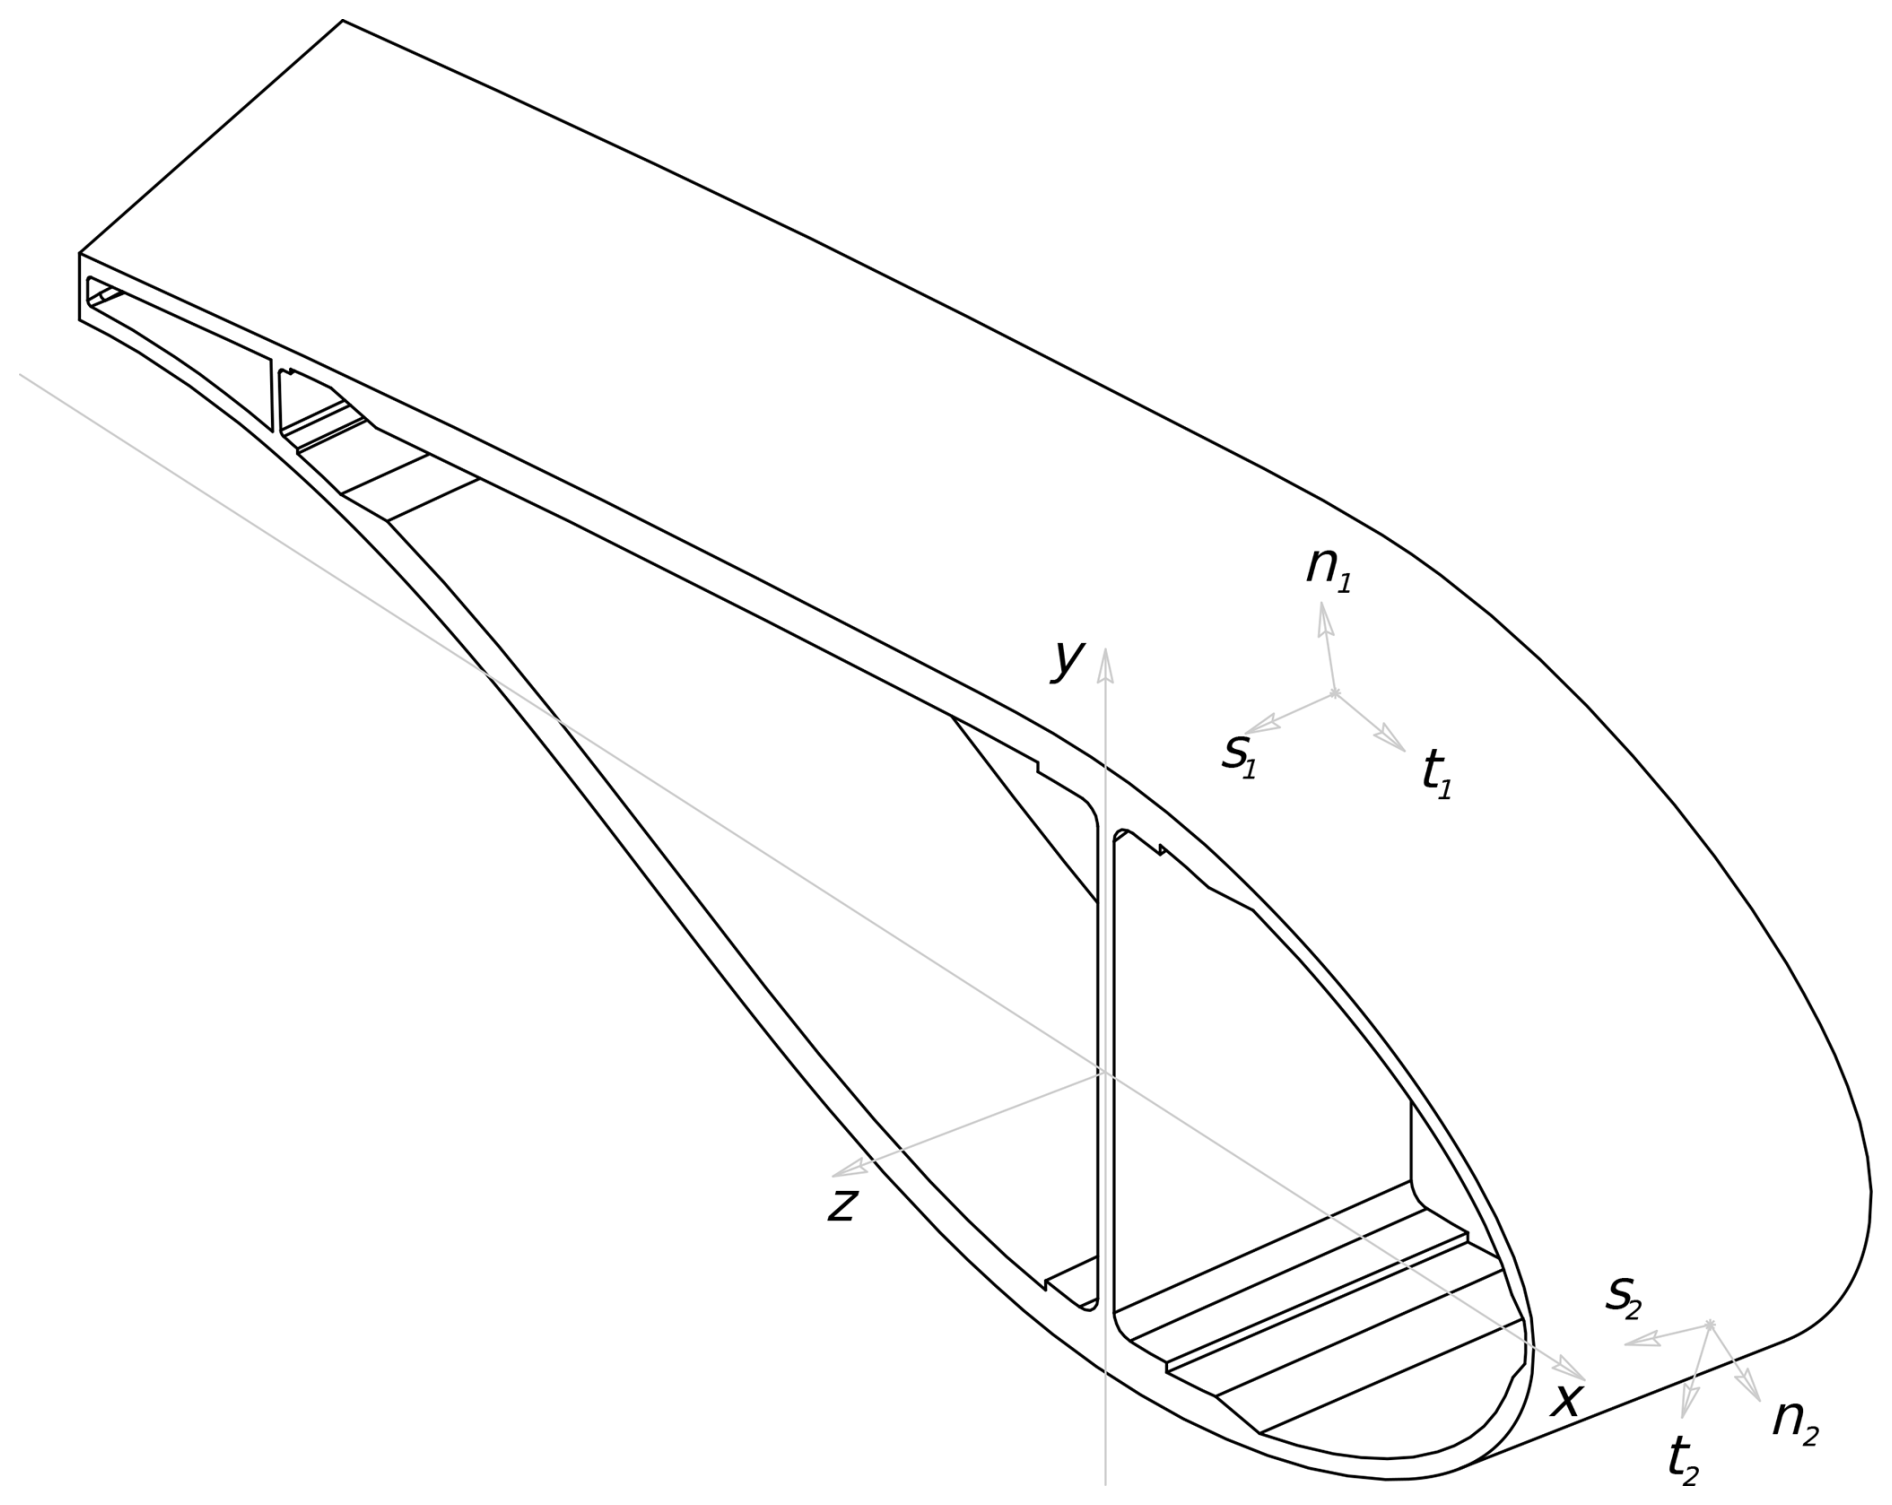
Figure 2Relations between local reference coordinate system (black), EC coordinate system in principal orientation (red), and point P on the blade surface at angle αP (blue) with corresponding variables and loads.
2.2 Load simulation
First, the DLCs which are to be considered are chosen (e.g., from IEC 61400-1:2019, 2019). Corresponding aero-elastic turbine simulations are performed, resulting in sets of time series f(t) for load distributions along the blade length, i.e., sectional bending moments Mx(t) and My(t) and longitudinal force Fz(t). These loads are derived for a local reference coordinate system in which the x–y plane of the section is perpendicular to the blade's beam axis, which includes following the orientation of any curvature of the blade reference line (e.g., pre-bend). The coordinate system's position and orientation in which the loads are reported must follow the blade deformation during simulation. Otherwise, the longitudinal z axis would not be perpendicular to the cross-section plane, and the beam theory formulas used subsequently would not be valid. Here, it is assumed that, in the undeformed state, the projection of this local coordinate system's x axis onto the blade's root section is parallel to the global lead-lag direction of the blade for any section and does not follow the blade's twist angle. Following the twist angle or other orientations is also possible. For the same sections along the blade, for which the loads are derived, the following properties are computed (see Fig. 2):
-
coordinates of the elastic center (EC), i.e., the point where a force applied normal to the cross-section produces no bending curvatures, xEC and yEC;
-
angle of principal stiffness axis orientation, θpa (also known as structural pitch);
-
principal bending stiffnesses about the xe and ye axes relative to EC, and ; and
-
axial stiffness, EA.
2.3 Transformation of load time series
The load time series are transformed into the EC and into the principal axis orientation of the corresponding section of the blade according to Eq. (1):
This load transformation is necessary as the following equations for strain are only valid for the EC in the principal orientation (see Appendix A2).
From this, the longitudinal strain at any given point of interest P within the corresponding blade section (see Fig. 2) can be computed:
Assuming the longitudinal force contribution is negligible compared to the bending moment contribution, i.e., , and utilizing the distance rP from EC to P and its angle αP, the strain can be written as
In this work, the strain time series εz(P,t) are used as reference because they are assumed to be the most realistic representation of material fatigue behavior.
The bending moment Mβ perpendicular to the direction of rP, which is usually assumed to contribute the most to the strain εz,M, can be calculated through coordinate transformation:
In the assumed conventional procedure, only the bending moment Mβ is considered, particularly for the global blade main directions, i.e., flapwise and lead-lag, which, under the assumed coordinate system orientation, correspond to and , respectively.
2.4 Rainflow counting
Any given load (e.g., bending moment, strain) must be further processed. In the following, L is used as a placeholder for any available load measure. To accumulate the load time series L(t) from simulations into corresponding DELs, the time series are converted via the rainflow counting algorithm (, ) into a list of occurring load amplitudes LA,i with corresponding mean loads LM,i and cycle numbers ni. This list can be compressed further into so-called Markov matrices by sorting the loads into discrete intervals (binning). Here, no binning was applied.
2.5 Mean load correction
Only after rainflow counting and before the next processing step can mean load correction (MLC) be applied. This step accounts for the effect of the mean load on material fatigue. It entails changing a load amplitude LA,i, which corresponds to a specific mean load LM,i, to a corrected load amplitude , which in turn corresponds to the mean load . This corrected amplitude is computed such that it contributes the same material fatigue damage as the original LA,i-LM,i pair. This correction requires the use of constant-life diagrams (CLDs), which are material-specific.
The simplest form of this is a linear symmetric CLD (also known as the Goodman or Goodman–Haigh diagram), which only requires one ultimate load LU and assumes symmetric behavior in tension and compression. For this, the MLC can be performed according to Eq. (5a):
As most composite materials have different properties in tension and compression, a shifted Goodman diagram is proposed in DNV ST-0376:2024 (2024). This uses different ultimate loads for tension LUt and compression LUc, which results in Eq. (5b) for the MLC:
More complex CLDs, as proposed by Sutherland and Mandell (2005), can also be employed. In that case, the implementation of Eq. (5) in the load evaluation would need to be replaced by corresponding methods.
Since the required material properties for MLC are only available for stress or strain data, this correction is not possible for bending moments. Therefore, when employing the conventional bending-moment-based approach, the impact of the mean load cannot be taken into account and must be neglected, resulting in Eq. (5c):
2.6 Linear damage accumulation
After MLC, the corrected load amplitudes for each simulation are accumulated into a single DEL amplitude LDEL with an arbitrary cycle number NDEL, using linear damage accumulation according to Palmgren (1924) and Miner (1945), assuming a linear stress–life relationship according to Basquin (1910):
where m denotes the negative inverse Basquin curve exponent of the material under investigation.
There are several approaches to defining this arbitrary number of cycles nDEL. Some research has suggested using the dominant frequency of the blade if contained in the load spectrum or otherwise the zero or mean crossing frequency (Veers, 1982). Another approach is to pick a frequency of 1 Hz, which is representative of a turbine size of the time (Madsen et al., 1984). The latter approach was widely adopted because simulation time t in seconds is equal to the number of cycles nDEL, and nowadays a 1 Hz equivalent load is the commonly accepted practice, resulting in nDEL=t.
After the loads for each separate simulation j are accumulated into one damage-equivalent load LDEL,j, each with according to Eq. (6), the loads from different simulations are accumulated into one total damage-equivalent load amplitude LDEL,total with a cycle number of NDEL,total using probabilities of occurrence as weighting factors:
where LT denotes the total expected turbine design lifetime; tj is the duration of the time series; nts,j is the number of turbulence seeds (i.e., the number of simulations with the same conditions); and pws,j, pyaw,j, and pDLC,j are the probabilities of the simulation's wind speed, yaw angles, and design load case (DLC), respectively. If further variables are differentiated with more simulations, the probabilities need to be adapted accordingly. As each simulation contains three blades, the loads from each blade can be regarded as separate simulation runs. This effectively triples the number of turbulence seeds nts,j if loads for all three blades are evaluated and accumulated.
Note that this damage accumulation is only valid for a linear stress–life relationship (Assumption 7 in Sect. 2.1). To consider more complex fatigue behavior (e.g., Stüssi, 1955; Rosemeier and Antoniou, 2022), the damage accumulation (Eqs. 6 and 7) must be adjusted accordingly.
The resulting load DELs can then be used as target loads for blade fatigue testing. Depending on the scope of the fatigue test, the number of investigated angles αP and blade sections must be chosen correspondingly. The fatigue tests then have to be designed to match or exceed these target loads.
2.7 Methods for the enhanced procedure
From Eqs. (3) and (4), it can be seen that the strain and the swept bending moment are generally not proportional, . There are only two cases when they are proportional: (i) when the two principal stiffnesses of the section are equal (), which is usually only the case at the cylindrical root of the rotor blade, or (ii) when the position of interest P is on the principal axes, i.e., αP = 0°, ± 90°, and 180°. As conventional target loads are usually based on these bending moments and material fatigue damage is based on stresses or strains, this non-proportionality leads to discrepancies between the fatigue loads in blade fatigue testing and material fatigue damage arising from the design loads.
Further discrepancies can arise if the moments are converted into DELs while omitting the load transformation into the EC (see path 0 in Fig. 1). The impact of this is outside the scope of this work as it is highly dependent on the arbitrary position of the coordinate systems used.
To mitigate the non-proportionality of bending moments and strain, Castro et al. (2021b, 2024) proposed the modified bending moment to be used as the basis for target loads instead of the regular bending moments Mβ (see path 2.1 in Fig. 1). In this work, has been slightly modified compared to in Castro et al. (2021b) to more closely represent strain values:
Translating the loads into for the test design instead of transforming data directly into strains has the benefit that the data required for the translation do not contain sensitive blade design data, which helps with data transfer between the OEM and test center, as highlighted by Castro et al. (2021b). With information on geometry and stiffness properties, can be transformed into the following corresponding strain:
This transformation is only valid if the assumption holds that the longitudinal force contribution to strain is negligible. Therefore, the impact of this assumption is investigated in Sect. 3.1.
For the MLC of , Castro et al. (2021b) proposed an approach based on the symmetric Goodman–Haigh diagram but without the use of material data; instead, unspecified ultimate loads derived from the test institution's experience were used. Moreover, the symmetry which only requires angles αP = 0°…180° does not hold anymore once the MLC is applied, and angles αP = −180°…180° are required. As Eq. (9) allows for simple conversion between strain εz,M and , material-based MLC can be used in the domain by converting CLD data into the domain (see Fig. 1, path 2.2). For example, to enable Eq. (5b), the ultimate tension and compression loads must be evaluated:
However, this requires the derivation of individual CLD data for every position of interest along the blade. Moreover, after MLC is no longer independent of rP and is only valid for the position for which the corresponding CLD data are derived. If multiple positions along the αP direction with different rP are of interest, multiple CLDs must be considered for the same . The confidentiality benefit still holds because no direct material data need to be disclosed for MLC.
To demonstrate the differences between the methods described above, the 138 m long reference blades of the IEA 22 MW offshore reference wind turbine (Zahle et al., 2024) are used as a test case. Load time series are generated from aero-elastic simulations using HAWC2 (Larsen and Hansen, 2024) for different design load cases of this turbine. The simulations cover wind speeds from 3–25 m s−1 in 1 m s−1 steps, with yaw misalignment of 0, 8, and 352° and six turbulence seeds each while considering all three blades (nts=18). These simulations represent the power production design load case with the normal turbulence model (DLC 1.2) according to IEC 61400-1:2019 (2019). For the design and certification, further load cases of the turbine concerning power loss during production (DLC 2.4), start-up (DLC 3.1), shut-down (DLC 4.1), and parked conditions (DLC 6.4) need to be considered. However, the standard does not specify individual contributions of these load cases to turbine lifetime and leaves this decision to the designer. All service and emergency load cases are design dependent, whereas DLC 1.2 mainly depends on the probability distribution of wind speeds between cut-in and cut-out and is considered to occur in approximately 95 % of the turbine lifetime (Gözcü and Verelst, 2020). Therefore, for simplification, the other DLCs are not considered in this study. This results in a total number of 1242 load time series of t = 600 s, each with a resolution of 0.01 s. These load time series are computed at 49 sections along the blade span, for which cross-sectional stiffness properties are derived from the structural design described by Zahle et al. (2024) and evaluated using the BECAS cross-sectional tool (Blasques and Stolpe, 2012).
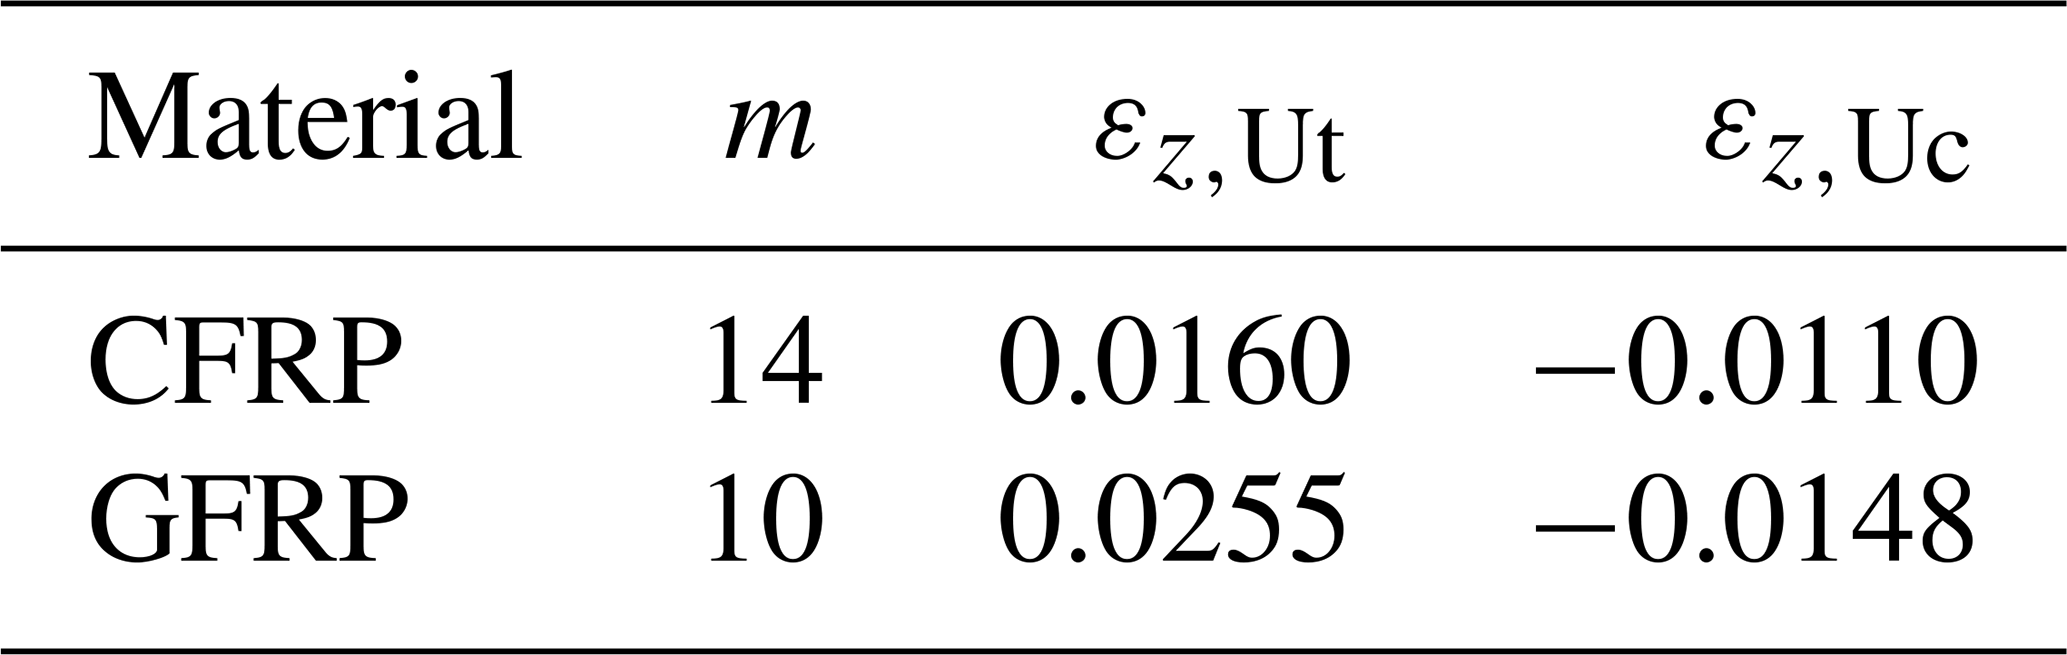
These time series are evaluated as described above. For the fatigue evaluation of the load time series (i.e., mean load correction and linear damage accumulation) in this case study, the material properties used are simplified. The materials of the blade are assumed to be uniaxial carbon-fiber-reinforced polymer (CFRP) on the spar caps and uniaxial glass-fiber-reinforced polymer (GFRP) elsewhere. The fatigue evaluation of biaxial and triaxial GFRP, as well as foam and adhesive material, is omitted in this study. However, the proposed method would allow for any number of materials to be considered if the corresponding material properties are available. The assumed material parameters for the fatigue evaluation towards fiber fracture are listed in Table 1. The MLC in this study is performed utilizing Eq. (5b).
Table 1Fatigue properties of materials (IEC 61400-5:2020, 2020; Zahle et al., 2024; Camarena et al., 2022).
In this example, the local reference coordinate systems of the sections have the same orientation as the global blade coordinate system, only following the blade's pre-bend and deformation. The sweep angle φ in the following result plots is defined as , measured from the EC.
Here, the loads were evaluated as described above for all sweep angles φ between −180 and 180° in 0.5° steps. For each angle, the largest rP, i.e., the outermost shape of the blade, was used as this has the highest strain and is assumed to be the most critical.
The loads for each separate simulation j are accumulated individually according to Eq. (6), with . As only DLC 1.2 is used in this study, Eq. (7) is adjusted here, as shown in Eq. (11), to combine the different simulation results into one damage-equivalent load amplitude:
with a turbine lifetime of LT = 20 years and NDEL,total = 2 million. For the wind speed probabilities pws, a Weibull distribution with a shape parameter of 2 and a scale parameter of 11.28 is used. For the yaw angle probabilities, pyaw(0°)=0.5, pyaw(8°)=0.25, and pyaw(352°)=0.25 are assumed based on empirical values commonly used for reference turbines by DTU. In the following, the impact of several optional components of the evaluation procedure on the results is investigated.
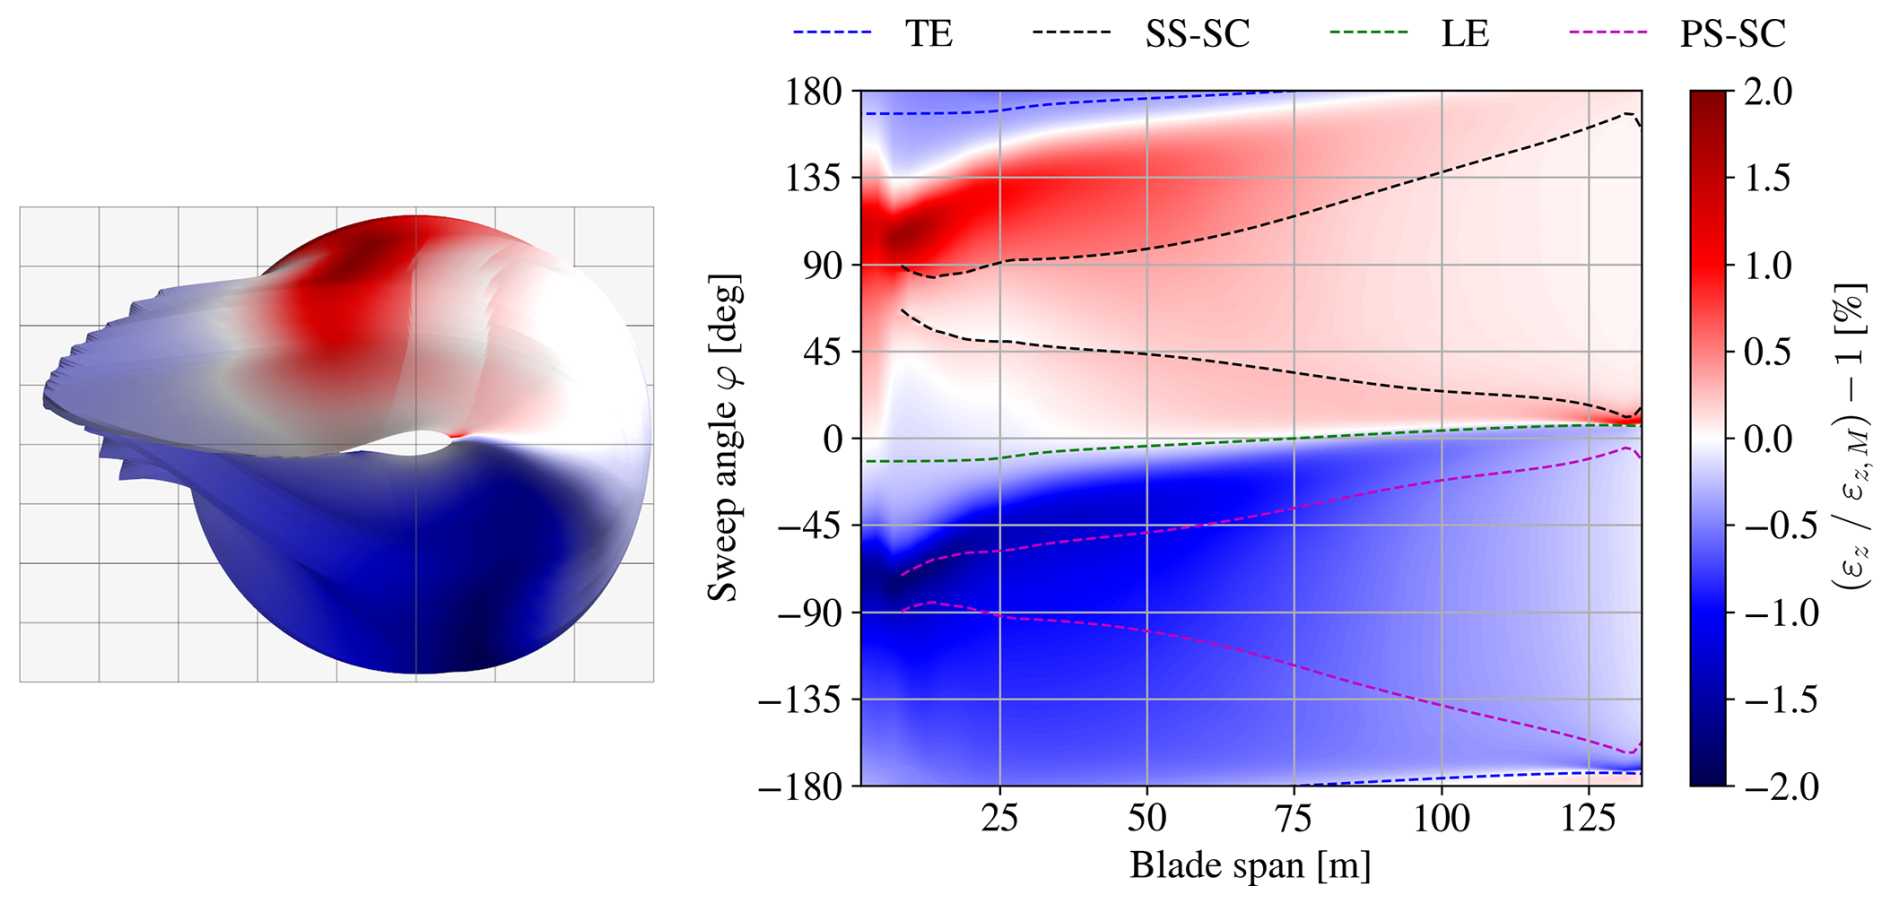
3.1 Impact of longitudinal force contribution
The first study investigates the assumption that the longitudinal force is negligible. Therefore, the resulting strain DELs including MLC without the longitudinal force contribution, , and with it, , are compared. These measures are evaluated exactly as shown in Fig. 1 (path 3.2) with the only difference of utilizing Eqs. (3) or (2), respectively. The relative differences between them are shown in Fig. 3, where they are projected on the blade geometry (left) and plotted over blade span and angle. The trailing edge (TE), the leading edge (LE), and the boundaries of the spar caps on the suction side (SS-SC) and pressure side (PS-SC) are marked for reference. The results show that considering the influence of the longitudinal force, compared to neglecting it, raises the accumulated DELs on the suction side by a maximum of 1.8 % and lowers them by a minimum of −1.8 % on the pressure side, especially close to the root. This deviation is deemed small enough to be neglected and confirms the assumption that the longitudinal force does not need to be considered in the fatigue test target loads. For cases when the longitudinal force should be considered anyway, target loads can be evaluated based on strains first (Fig. 1, path 3.2 using Eq. 2) and then be translated into using Eq. (8).
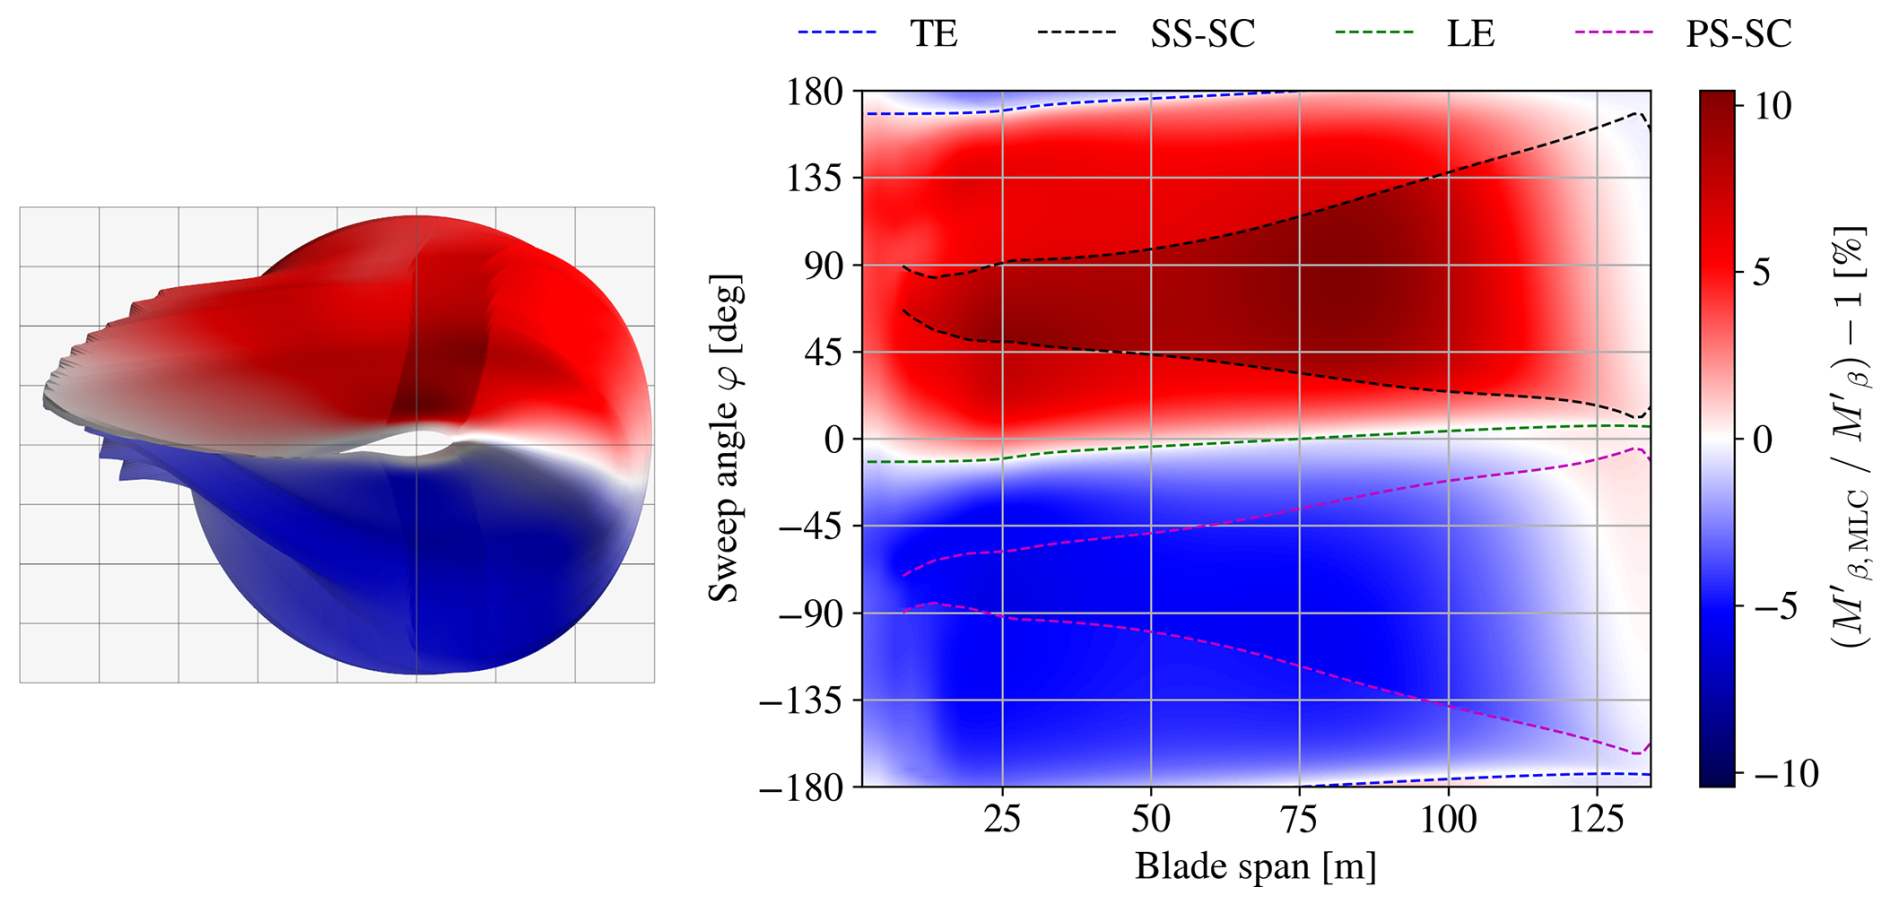
3.2 Impact of mean load correction
The next study investigates the impact of the MLC on the accumulated DELs. Therefore, the DELs are evaluated with and without MLC, utilizing Eqs. (5b) and (5c) (Fig. 1 paths 2.2 and 2.1), respectively. The relative differences between the modified bending moment DELs are shown in Fig. 4. Due to their proportionality, the same differences are found for the strain; i.e., . The results show that the DELs along the LE and TE are not affected by the MLC. However, on the SS panels, the MLC raises the DELs by up to 7.5 %, and on the whole SS-SC between 20 and 100 m, they range from about 8 % to up to 10.4 % around the 80 m span. On the PS, up to the 110 m span, the DELs are lowered by at least −3 %, with the lowest of −6.1 % on the spar cap around the 25 m span. These deviations are considered significant, and the increased load in particular confirms the necessity of MLC. Using the conventional methods without MLC to define the target loads would therefore lead to an insufficiently tested SS-SC: a 9.4 % decrease (opposite to a 10.4 % increase) of DELs leads to a 75 % decrease in applied fatigue damage (with m=14), which is missing compared to the predicted fatigue damage from the time series with MLC. This would lead to a fatigue test confirming only 25 % of the intended design fatigue life. The 10.4 % discrepancy shown in this study may also be exceeded when using different material properties or different CLD formulations.
3.3 Impact of modified bending moment
To investigate the impact of using the modified bending moments instead of the regular bending moments Mβ for defining target loads for fatigue testing, these measures cannot be simply compared by values because their formulations are inherently different. Hence, for comparison, multiple sets of simplified uniaxial fatigue test loads for flapwise and lead-lag are computed here. These are designed to satisfy the different target loads, respectively, i.e., to match or exceed the corresponding field loads. As these are uniaxial tests, only the loads in the global main directions (i.e., φ = 180, 0, 90, −90°) are considered targets. In conventional fatigue test designs, the blade is fixed at the root with the blade axis horizontal and with the suction side facing downwards. Therefore, the blade's self-weight generates tension in the pressure side and compression in the suction side, which is assumed to be the mean load for the simplified test loads (neglecting any additional masses used in real fatigue tests, e.g., load frames). The cycle number for both tests is set to ntest = 2 × 10⁶. As test amplitude, the scaled load vectors resulting from the first two natural bending mode shapes of the blade are considered (assuming Fz=0), as fatigue tests are usually excited in resonance:
where LM is the mean load vector, and LA,f and LA,l are the amplitude load vectors for the flapwise and lead-lag tests, respectively, with the corresponding scaling factors Sf and Sl. The amplitude load vectors are scaled for both tests such that the accumulated loads from both tests satisfy the target loads. Therefore, the test loads are evaluated in the same way as the field loads starting from Eq. (1). This is done for each section along the blade individually and independently. To find the scaling factors for each section, an optimization problem is solved:
The optimization problem is solved using the Nelder–Mead algorithm (Gao and Han, 2012). This results in load amplitude distributions for each test. Note that these load distributions do not represent actual fatigue tests that could be performed in reality but rather the best-case scenario, where the target loads are matched as closely as possible along the whole blade span. This optimization is executed to generate test loads designed for three different cases (cases 1, 2.1, and 2.2, corresponding to the paths in Fig. 1) to match the corresponding field load data for (case 1), (case 2.1), or (case 2.2).
From this, the impact of using these different approaches can be determined by evaluating the test loads in terms of damage-equivalent strain amplitude . Figure 5 shows the difference in the test loads for case 2.1 and case 2.2, each relative to case 1. Designing the test loads for (case 2.1) compared to Mβ,DEL (case 1) requires higher loads to achieve the target. In the lead-lag direction, the load needs to be raised by up to 14 % around 25 m blade length, which corresponds to the maximum chord length. Toward the tip outboard of 107 m, the load needs to be raised even more, though this area is usually not within the area of interest for fatigue testing. Only in the area between 77 and 96 m does the load need to be lowered. In the flapwise direction, the load only needs to be raised by up to 3 % close to the root around 15 m. Between 60 and 90 m, the flapwise loads for case 1 and case 2.1 are almost identical. Designing the loads for (case 2.2), i.e., considering MLC, requires even higher loads. In the lead-lag direction, the loads are similar to those in case 2.1 and need to be raised by up to 16 % around 25 m compared to case 1. In the flapwise direction, the load is raised by 5 %–8 % almost along the whole blade (8–115 m) compared to case 1.
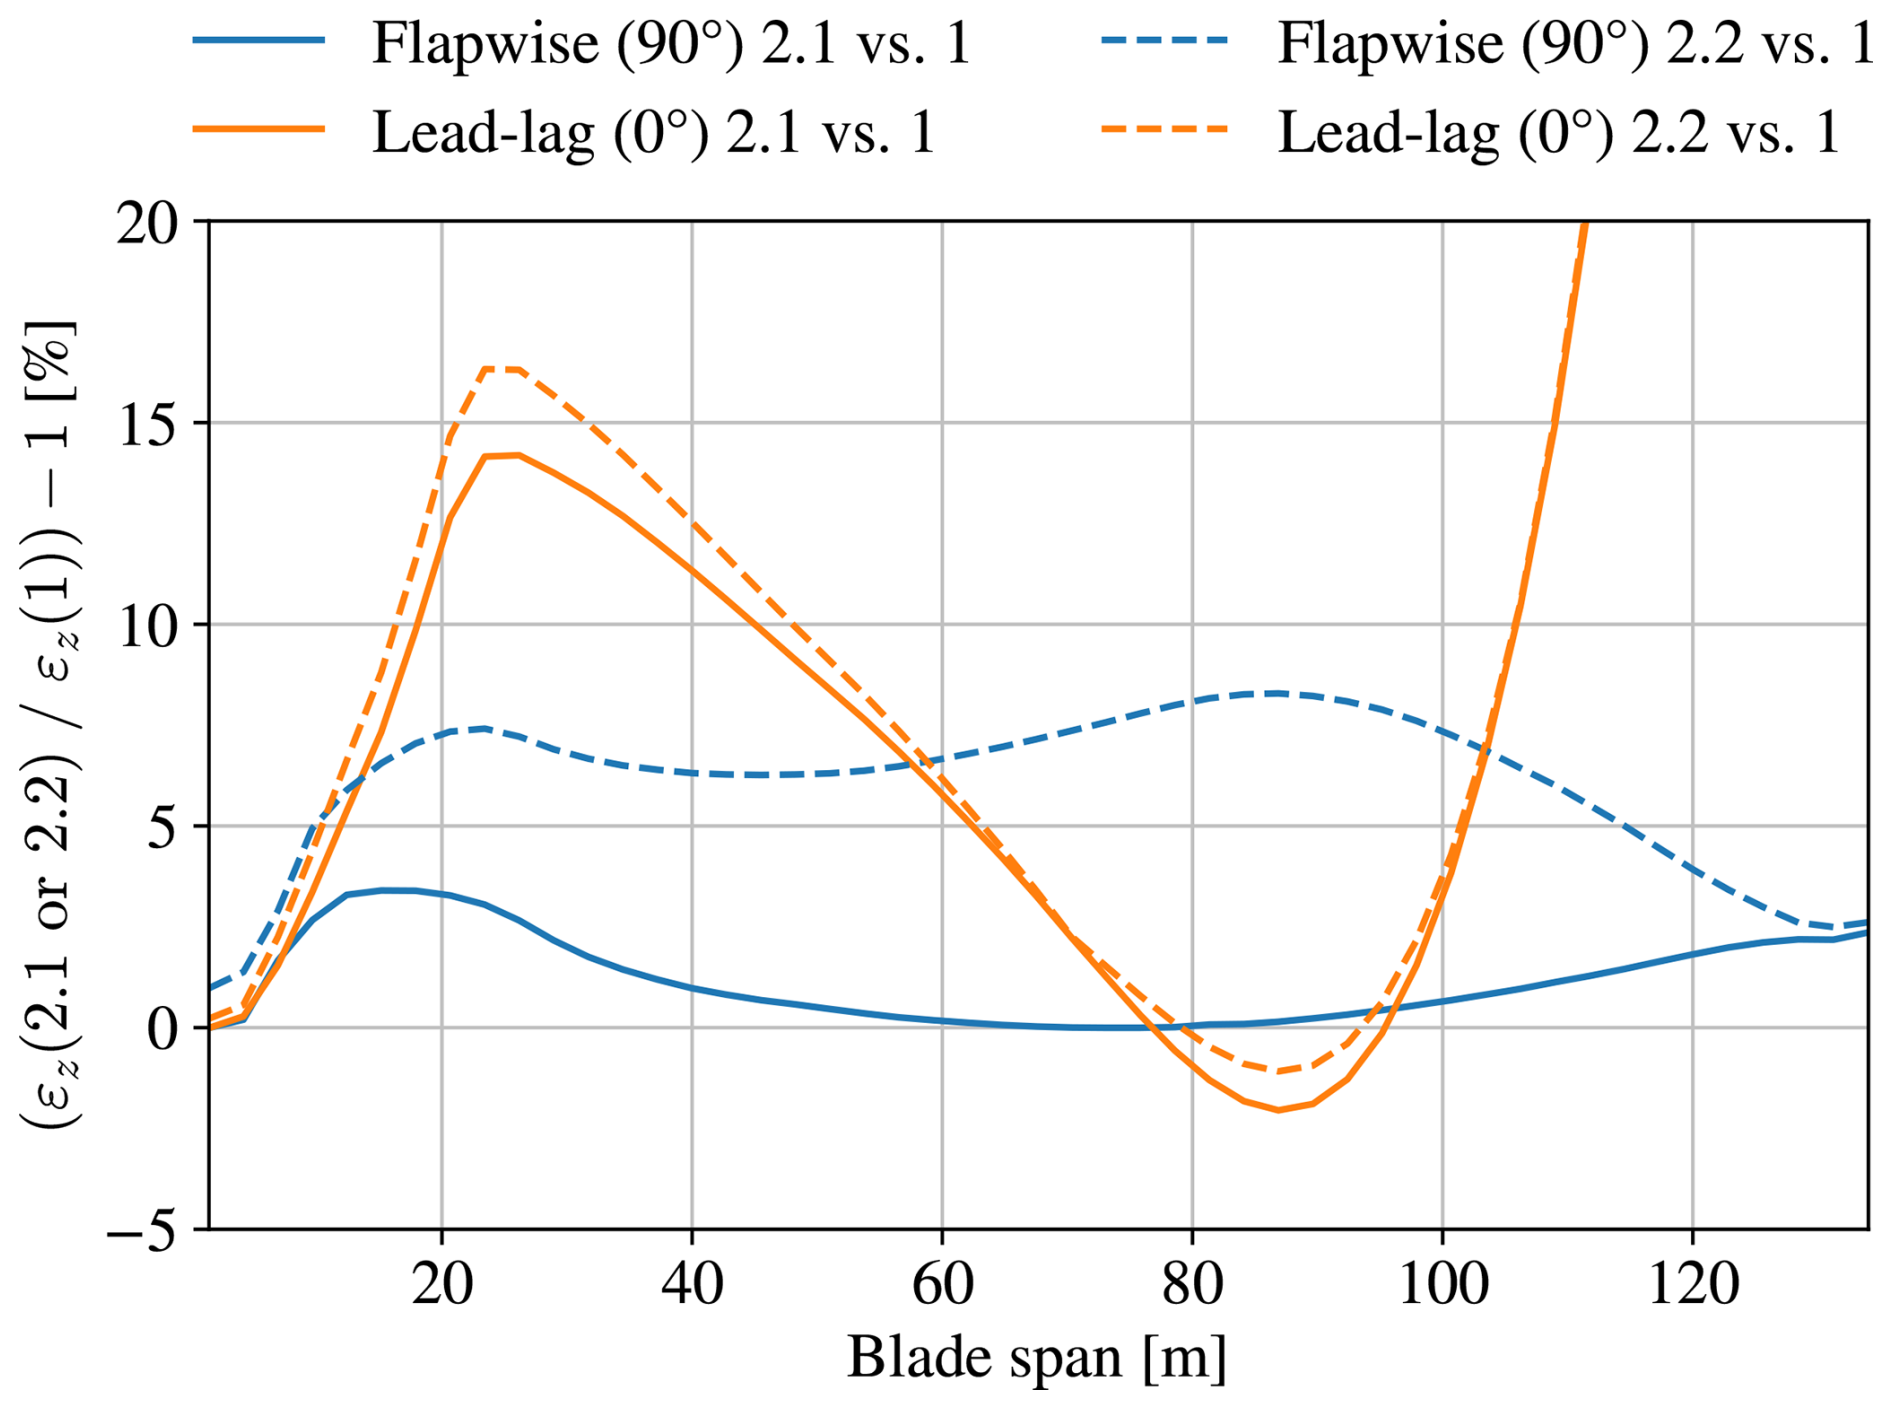
Figure 5Distribution of relative difference between damage-equivalent accumulated longitudinal strain amplitude (including MLC) for test loads designed for case 1, case 2.1, and case 2.2.
This shows that the assumed conventional method used to design fatigue test loads (case 1) can lead to severe under-testing of the blade, as the more detailed methods (cases 2.1 and 2.2) require up to 16 % higher loads.
To elaborate further on these differences, Fig. 6 shows the fatigue damage from case 1 relative to the damage from case 2.1 and case 2.2. This damage ratio is derived from the load ratio and m for the corresponding material: . This reveals that the 16 % required load raise in the lead-lag direction corresponds to a fatigue damage deficit of just under 80 %. In the flapwise direction between 15 and 105 m, case 1 produces only 33 %–43 % of the fatigue damage of case 2.2.
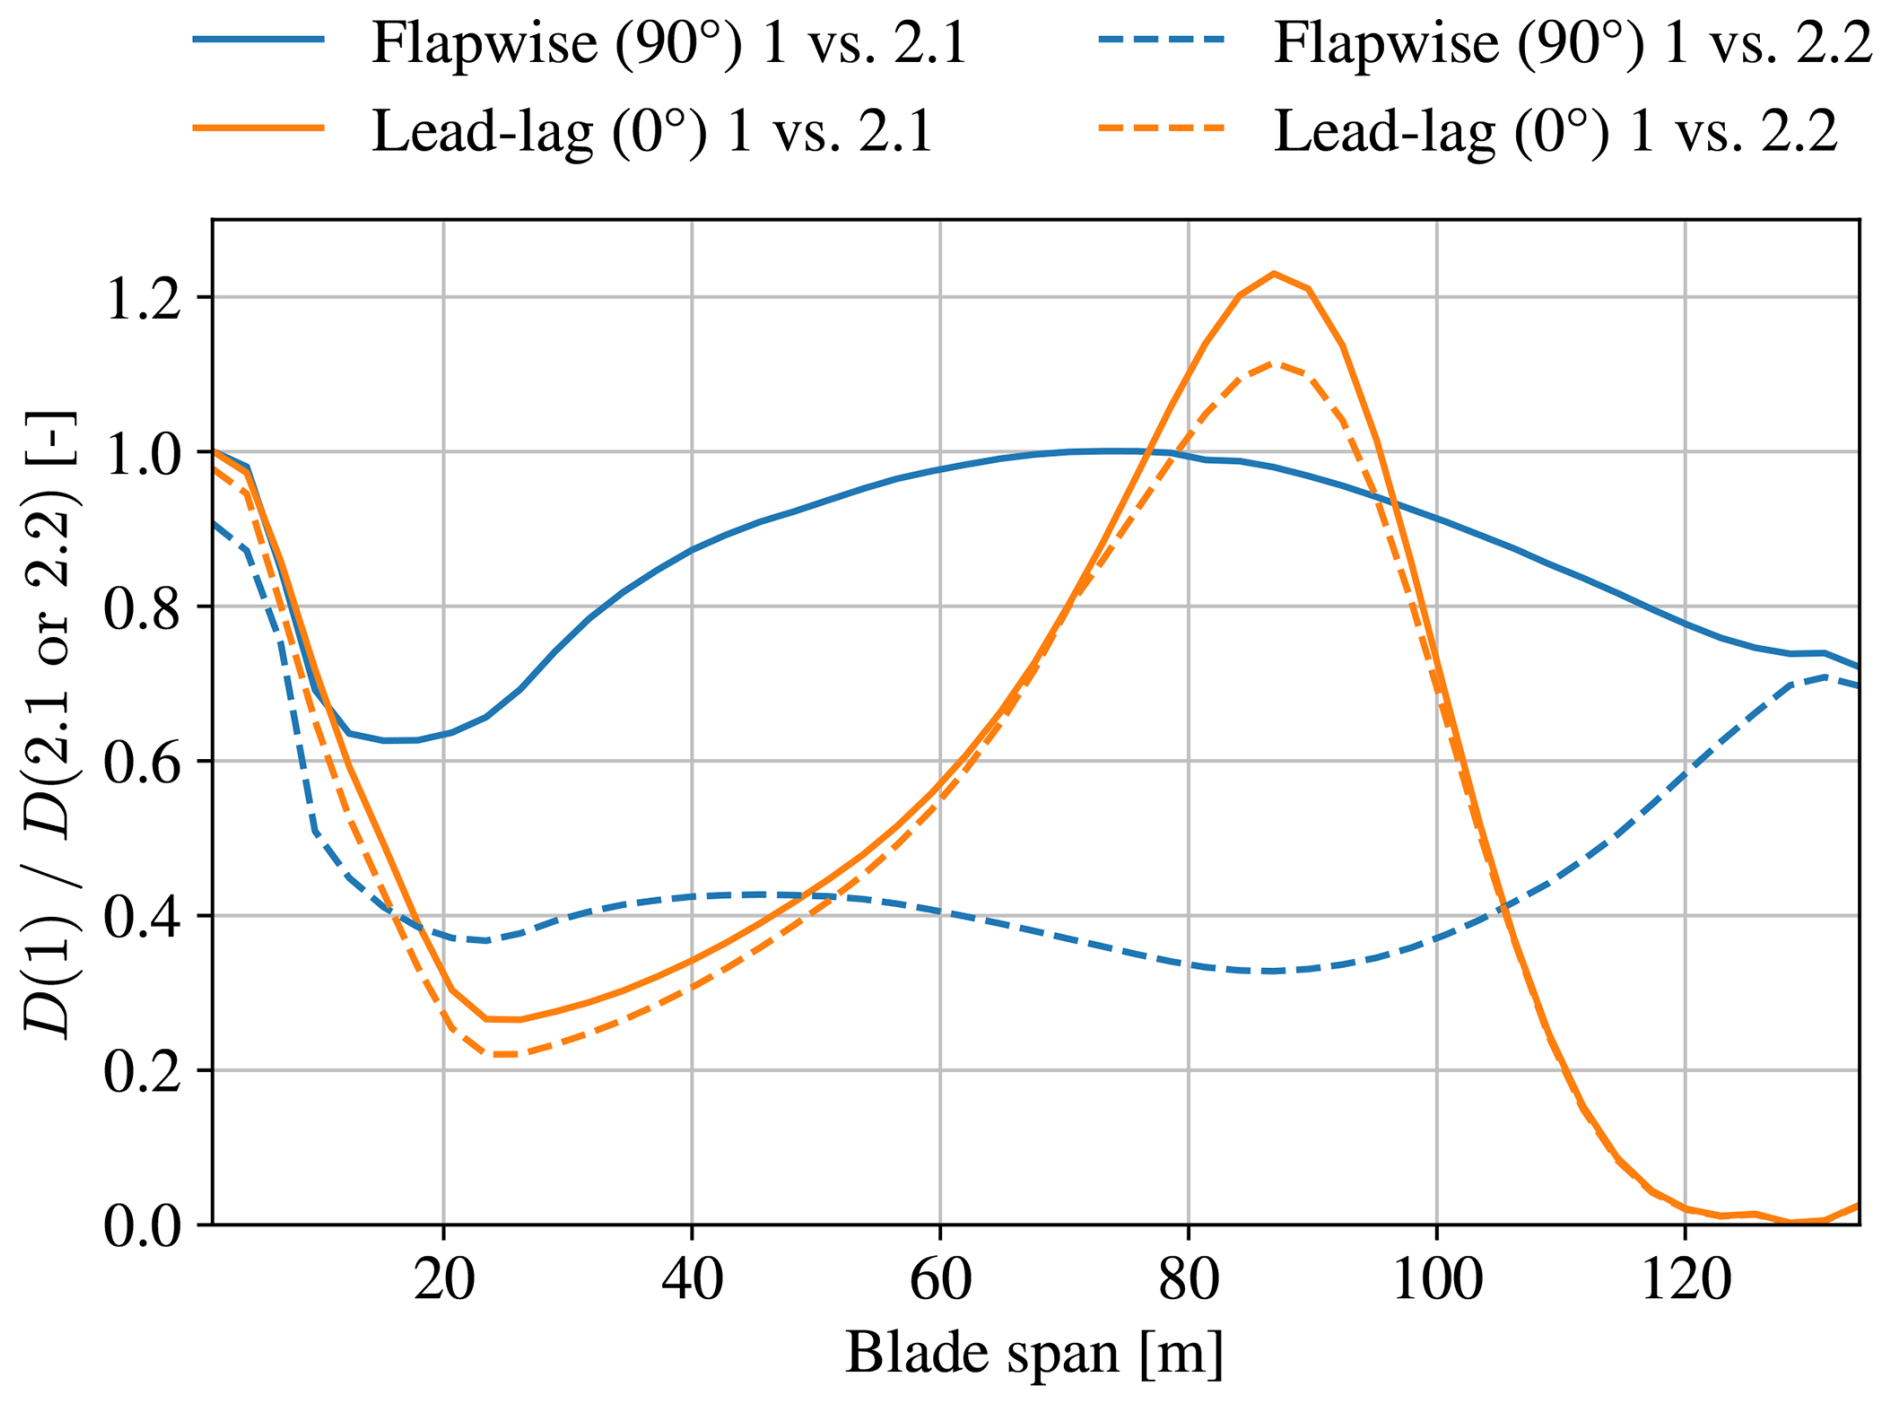
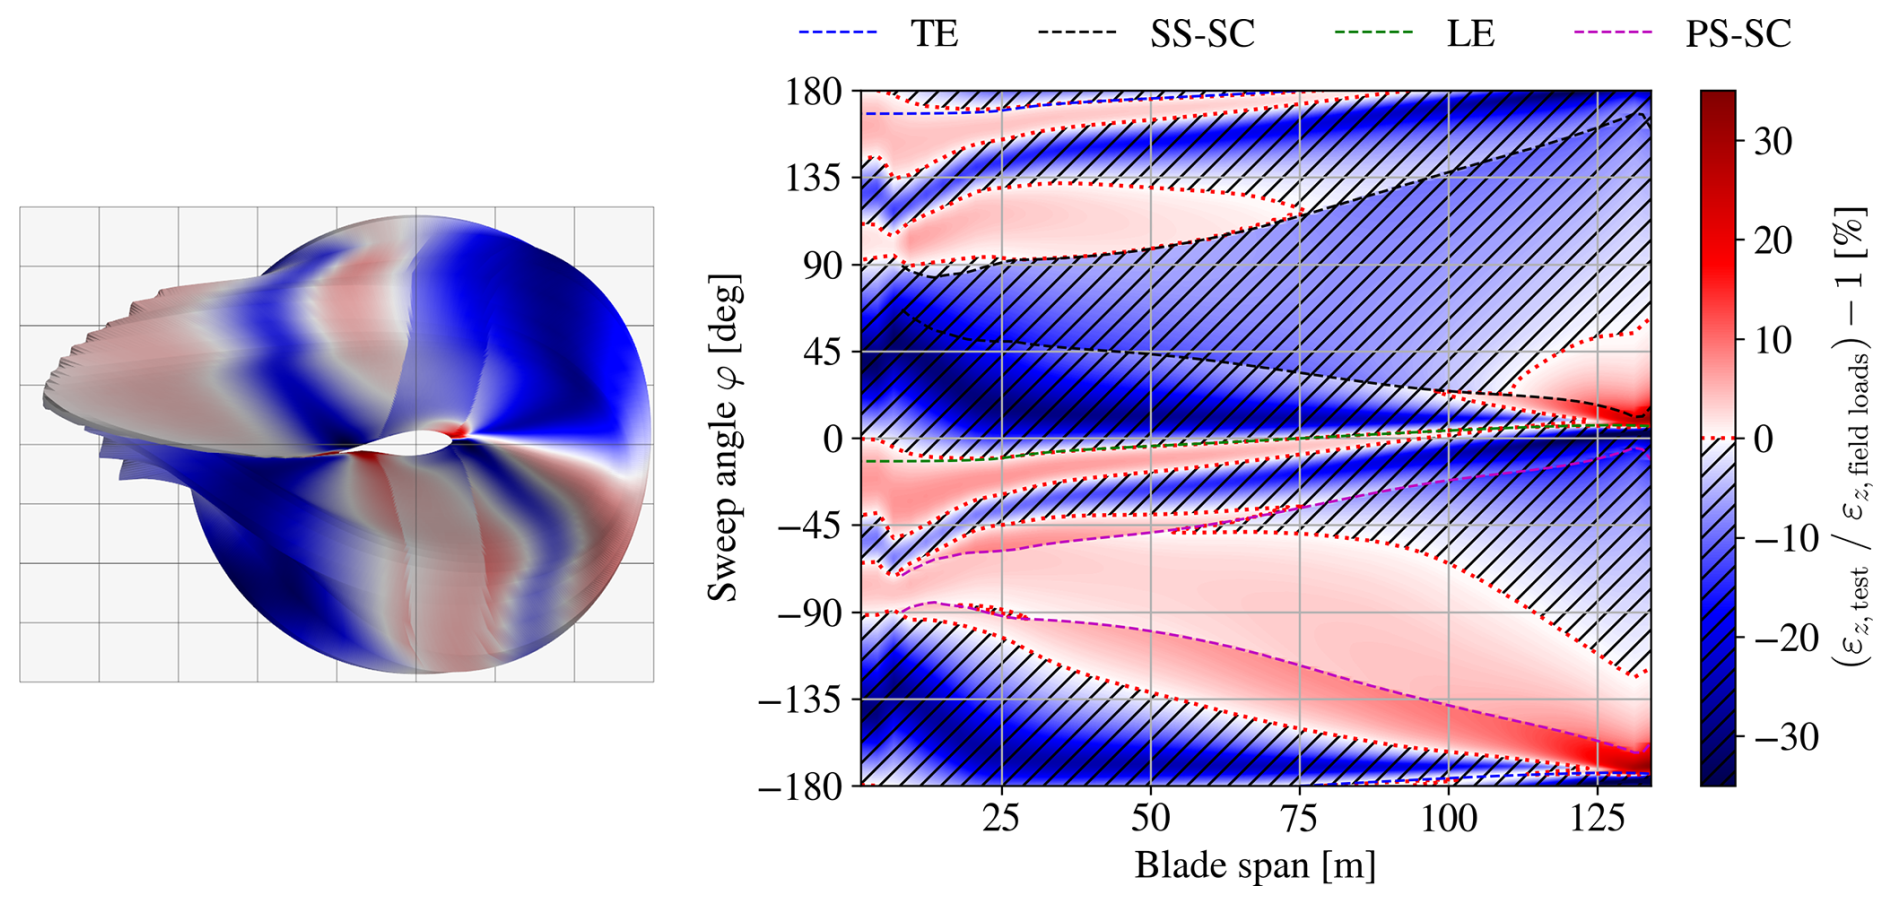
Figure 7Distribution of relative difference between damage-equivalent accumulated longitudinal strain amplitude (including MLC) for conventional approach test loads (case 1) and field loads.
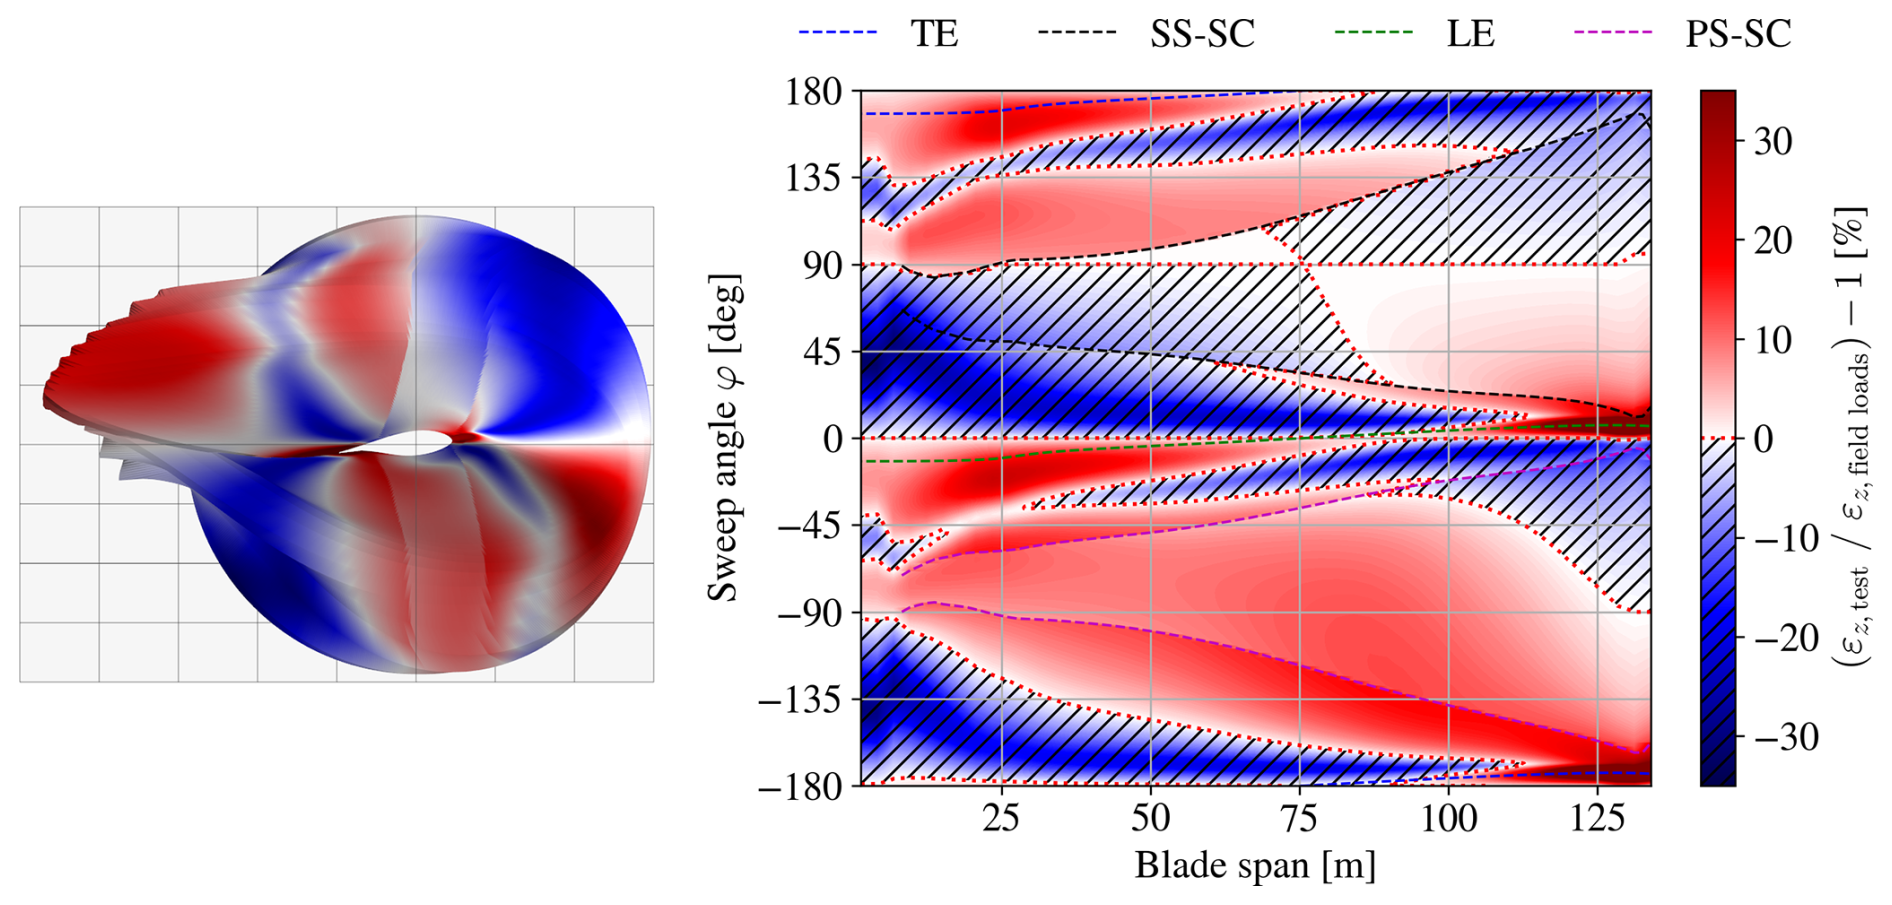
Figure 8Distribution of relative difference between damage-equivalent accumulated longitudinal strain amplitude (including MLC) for enhanced approach test loads (case 2.2) and field loads.
However, this method only considered the main flapwise and lead-lag blade directions; i.e., φ = 180, 0, 90, −90°. If other directions are also considered, the test loads compared to field loads for case 1 and case 2.2 are shown in Figs. 7 and 8, respectively. For case 1, the loads along the main directions are not matched as suggested above, but for case 2.2, the loads along the main directions are tested sufficiently. But both test scenarios show large areas that are loaded less from the test than from the field loads (hatched areas in Figs. 7 and 8). These areas may include features which should be tested, such as critical structural details or significant load transitions between design elements. This suggests that uniaxial fatigue testing is insufficient to test the whole blade, and more sophisticated testing methods (e.g., biaxial testing) will be required to test the whole blade sufficiently.
Any of the described accumulated loads (bottom row in Fig. 1) can be used as target loads for fatigue testing. Therefore, the test loads must be transformed and evaluated in the same manner as the chosen target loads. These evaluated test loads can then be checked to confirm that they meet or exceed the corresponding target loads within the areas of interest along the blade. This load evaluation must be performed during the fatigue test execution and also in the test design to enable comparison against the targets.
The conventional bending-moment-based approach (Fig. 1, path 0) for uniaxial fatigue test execution does not require extensive processing as only the constant bending moment amplitude in the main directions with the corresponding cycle number needs to be evaluated. However, as shown above, the error of this method can be significant. To adopt the proposed approach of this work (Fig. 1, path 2.2) for a test method with constant amplitude, the bending moments measured during testing need to be transformed and processed according to Eqs. (1), (8), and (5), the same as the target loads with accumulation (Eq. 6) of the different sequential tests (e.g., flapwise and lead-lag test). Live rainflow counting with the corresponding accumulation of the test loads is required only for testing methods involving constantly changing load amplitudes, such as biaxial testing with an arbitrary frequency ratio.
Using strains εz including MLC (Fig. 1, path 3.2) as target loads will lead to the same results as the proposed approach, but it requires more potentially confidential data. In order for the testing facility to design and evaluate the test, detailed geometric data and strain-based CLDs would need to be shared by the OEM. Castro et al. (2024) showed that using the modified bending moment reduces the amount of confidential data required. Using the proposed modified bending moment including MLC (Fig. 1, path 2.2) requires different transformed CLDs for each target load, which can be provided solely for the expected load levels of the corresponding and are therefore more anonymized than the strain-based data.
This work demonstrated that conventional methods for separate flapwise and lead-lag fatigue test sequences and target load evaluation (Fig. 1, path 1) can lead to substantial under-testing across major areas of rotor blades, potentially compromising the intended design validation. It is proposed to employ the modified bending moment as described by Castro et al. (2021b) (Fig. 1, path 2.1), in combination with a suitable mean load correction (MLC) (Fig. 1, path 2.2), to achieve realistic load representation. This enhanced approach can be utilized to define necessary test loads that result in sufficient fatigue damage throughout the blade. The findings of the case study suggest that applying this methodology can require increases in target loads of up to 16 % for uniaxial testing compared to conventional methods. This highlights the drawbacks of conventional methods and the importance of better representation of material fatigue behavior.
Future research should focus on practical implementation of the proposed methodologies in the processing of aero-elastic simulation results and in standardized testing practices. It should also explore additional testing techniques, such as biaxial testing, to apply the required loads around the whole blade circumference. Furthermore, incorporating additional materials and more detailed CLDs may affect the case study results. Therefore, the proposed method should be applied to state-of-the-art industrial blades with higher-resolution material modeling to further examine the observed impacts. The impact of other simplifying assumptions used in this work (e.g., a linear stress–life relationship or the negligibility of bend–twist coupling) should also be investigated to further enhance the understanding of blade fatigue behavior.
A1 Relevant strain tensor components
The local strain tensor (spanwise, transverse, normal) at any position in a material consists of six components. Considering these components for a rotor blade section, these are the spanwise strain εs, the through-thickness and transverse normal strains εn and εt, and the in- and out-of-plane shear strains εtn and εst, εsn.
In reality, only εs, εt, and εst can be directly measured by strain gauges on outer and inner blade surfaces. For tapered regions, the strain tensor should be transformed, but there are not enough measured components. Therefore, with composite anisotropy in mind and assuming that blade tapering is modest in practice, εz=εs. This local longitudinal strain εz is mainly influenced by the bending curvatures and the longitudinal strain of a blade section (see Appendix A2). It is the main object of interest in this work.
The transverse and through-thickness strains εt,εn result from cross-sectional in-plane deformation, which usually comes from the Poisson effect, the Brazier effect, local instability (e.g., panel buckling), or local bending. Transverse panel bending is the main contributor to εt, and reaction forces in the shear webs are the main contributor to εn in the outer shell. The latter should occur only at very high longitudinal strain levels; therefore it is only relevant for ultimate load cases, not for fatigue. The in-plane shear strain εtn can only be caused by in-plane warping deformations and can usually be found in cross-sectional geometries with open cells. As these in-plane deformations are assumed to be negligible in beam theory (Assumption 1 in Sect. 2.1), the transverse and through-thickness strains are also assumed to be negligible: εt=0, εn=0, and εtn=0.
The out-of-plane shear strains εsn and εst are caused by transverse shear forces and torsion of the blade. These cannot generally be assumed to be zero, but they are not considered in this study for simplification because their recovery from load signals is complex, and only limited information on shear and multiaxial fatigue of composites is available.
A2 Strain derivation for fully populated beam element
The symmetric 6 × 6 stiffness matrix of a beam cross-section, denoted K, couples the cross-sectional load and deformation vectors L and ξ (see Eq. A1). It contains the stiffness terms and can be fully populated for a composite beam. The coupling of (non-diagonal) terms can come from the geometry and the layup of the beam structure. In practice, several of the coupling's terms are zero or very small. This 6 × 6 matrix is applied to generate the 12 × 12 beam element utilized in aero-elastic codes, such as HAWC2 (Larsen and Hansen, 2024).
For the 6 × 6 cross-sectional stiffness matrix of rotor blades, it is usually assumed that there are no couplings between longitudinal strain and shear forces, no couplings between bending curvatures and shear forces, and no coupling between longitudinal strain and torsional moment. From classical laminated plate theory (CLPT) according to Reddy (2003), it is known that a laminate stacking sequence that is balanced, unidirectional, or consists of cross-plies has no extension–shear couplings (A16 and A26 become zero in the extensional stiffness matrix, denoted A). A laminate with extension–shear couplings will become distorted in the curing process, which is undesirable.
The bending–extension coupling stiffness matrix, denoted B, contains the coupling of bending and twisting curvature with both extension and shear loads. In symmetric laminates, all terms in the B matrix are zero. Symmetric laminates are almost always used as these effects are usually undesirable, as laminates with a non-zero B matrix will also become distorted in the curing process due to internal stresses, compromising the geometry of the blade surface (Jones, 2018). Furthermore, when fiber mats or plies are placed at an angle, the stiffness and load-carrying capacity toward the dominant longitudinal loading/strain are reduced. Therefore, wind turbine blades are typically designed without placing fiber mats or plies in an off-axis orientation; however, when placing the fiber mats in the mold during manufacturing, smaller angles can arise from draping effects, mainly where the mold has double curvatures (normally in the region of maximum chord length). With the considerations above concerning A and B, the corresponding coupling terms in the stiffness matrix K can be assumed to be zero: K13=0, K14=0, K15=0, K23=0, K24=0, K25=0, and K36=0.
Furthermore, bend–twist couplings are also assumed to be negligible. From CLPT it is known that these result from a part of the laminate bending stiffness matrix denoted D (D16 and D26), if plies are oriented off-axis (in this case, off-axis with respect to the blade axis) (Jones, 2018). Assuming their negligibility leads to K46=0 and K56=0.
Combining the above assumptions leads to a reduced stiffness matrix K:
Translating both the load vector L and the deformation vector ξ to the cross-sectional EC as reference point and rotating them to the principal bending axis orientation eliminate further coupling terms , , and :
Inverting this reduced stiffness matrix Ke leads to a reduced compliance matrix Ce:
From this, the longitudinal strain equation for all surface points P (,) can be derived as
where K33=EA, , and .
The code can be accessed upon request to the corresponding authors.
The data used can be accessed under https://doi.org/10.11583/DTU.31634977 (Barlas et al., 2026).
DM prepared the code and conducted the analysis. SS and PB supported development of the methods and the preparation of the case study. KB supervised and guided the conception of the methods. EP supervised DM and acquired funding. DM prepared the paper with contributions from all co-authors.
The contact author has declared that none of the authors has any competing interests.
Publisher's note: Copernicus Publications remains neutral with regard to jurisdictional claims made in the text, published maps, institutional affiliations, or any other geographical representation in this paper. The authors bear the ultimate responsibility for providing appropriate place names. Views expressed in the text are those of the authors and do not necessarily reflect the views of the publisher.
We acknowledge the support by Frederick Zahle and Athanasios Barlas from DTU with the load simulation and generation of load time series for the reference turbine test case.
This work was financially supported by the German Federal Ministry for Economic Affairs and Energy (BMWE) within the SmarTestBlade project (grant no. 03EE2037) and by the Danish Energy Agency through the Energy Technology Development and Demonstration Program (EUDP) within the BLATIGUE-2 project (grant no. 64021-1031).
This paper was edited by Amir R. Nejad and reviewed by three anonymous referees.
ASTM E1049-85: Standard Practices for Cycle Counting in Fatigue Analysis, Standard, American Society for Testing and Materials, West Conshohocken, Pennsylvania, USA, https://doi.org/10.1520/E1049-85R17, 2017. a
Barlas, A., Zahle, F., and Semenov, S.: IEC 22MW reference turbine DLC 1.2, Technical University of Denmark [data set], https://doi.org/10.11583/DTU.31634977, 2026. a
Basquin, O.: The exponential law of endurance tests, in: Proc. ASTM, vol. 10, p. 625, 1910. a, b
Blasques, J. P. and Stolpe, M.: Multi-material topology optimization of laminated composite beam cross sections, Composite Structures, 94, 3278–3289, https://doi.org/10.1016/j.compstruct.2012.05.002, 2012. a
Brazier, L. G.: On the flexure of thin cylindrical shells and other “thin” sections, Proceedings of the Royal Society of London. Series A, Containing Papers of a Mathematical and Physical Character, 116, 104–114, https://doi.org/10.1098/rspa.1927.0125, 1927. a
Bürkner, F.: Biaxial Dynamic Fatigue Tests of Wind Turbine Blades, PhD thesis, Leibniz University Hannover, https://doi.org/10.15488/10903, 2020. a
Bürkner, F. and van Wingerde, A.: Testing of Rotor Blades, in: Proceedings of the 8th International Conference on Structural Dynamics, EURODYN 2011, https://bwk.kuleuven.be/apps/bwm/eurodyn2011/papers/MS25-1473.pdf (last access: 20 February 2026), 2011. a
Camarena, E., Anderson, E., Paquette, J., Bortolotti, P., Feil, R., and Johnson, N.: Land-based wind turbines with flexible rail-transportable blades – Part 2: 3D finite element design optimization of the rotor blades, Wind Energ. Sci., 7, 19–35, https://doi.org/10.5194/wes-7-19-2022, 2022. a
Castro, O., Belloni, F., Stolpe, M., Yeniceli, S. C., Berring, P., and Branner, K.: Optimized method for multi-axial fatigue testing of wind turbine blades, Composite Structures, 257, 113358, https://doi.org/10.1016/j.compstruct.2020.113358, 2021a. a
Castro, O., Berring, P., Branner, K., Hvejsel, C. F., Yeniceli, S. C., and Belloni, F.: Bending-moment-based approach to match damage-equivalent strains in fatigue testing, Engineering Structures, 226, 111325, https://doi.org/10.1016/j.engstruct.2020.111325, 2021b. a, b, c, d, e, f, g, h
Castro, O., Yeniceli, S. C., Berring, P., Semenov, S., and Branner, K.: Experimental demonstration of strain-based damage method for optimized fatigue testing of wind turbine blades, Composite Structures, 293, 115683, https://doi.org/10.1016/j.compstruct.2022.115683, 2022. a
Castro, O., Yeniceli, S. C., Nielsen, S. K., and Branner, K.: How to design and execute multiaxial fatigue tests for wind turbine blades without sensitive design data?, Engineering Structures, 301, 117297, https://doi.org/10.1016/j.engstruct.2023.117297, 2024. a, b, c, d, e
DNV ST-0376:2024: Rotor blades for wind turbines, Standard, Det Norske Veritas, Høvik, Norway, https://www.dnv.com/energy/standards-guidelines/dnv-st-0376-rotor-blades-for-wind-turbines (last access: 20 February 2026), 2024. a, b, c, d
DNV-ST-0437:2024: Loads and site conditions for wind turbines, Standard, Det Norske Veritas, Høvik, Norway, https://www.dnv.com/energy/standards-guidelines/dnv-st-0437-loads-and-site-conditions-for-wind-turbines/ (last access: 20 February 2026), 2024. a
Freebury, G. and Musial, W.: Determining equivalent damage loading for full-scale wind turbine blade fatigue tests, in: 2000 ASME Wind Energy Symposium, pp. 287–296, https://doi.org/10.2514/6.2000-50, 2000. a
Gao, F. and Han, L.: Implementing the Nelder–Mead simplex algorithm with adaptive parameters, Computational Optimization and Applications, 51, 259–277, https://doi.org/10.1007/s10589-010-9329-3, 2012. a
Gözcü, O. and Verelst, D. R.: The effects of blade structural model fidelity on wind turbine load analysis and computation time, Wind Energ. Sci., 5, 503–517, https://doi.org/10.5194/wes-5-503-2020, 2020. a
Greaves, P. R.: Fatigue analysis and testing of wind turbine blades, PhD thesis, Durham University, http://etheses.dur.ac.uk/7303/ (last access: 20 February 2026), 2013. a, b
Greaves, P. R., Dominy, R. G., Ingram, G. L., Long, H., and Court, R.: Evaluation of dual-axis fatigue testing of large wind turbine blades, Proceedings of the Institution of Mechanical Engineers, Part C: Journal of Mechanical Engineering Science, 226, 1693–1704, https://doi.org/10.1177/0954406211428013, 2012. a, b
Hughes, S. D., Musial, W. D., and Stensland, T.: Implementation of a Two-Axis Servo-Hydraulic System for Full-Scale Fatigue Testing of Wind Turbine Blades, National Renewable Energy Lab. (NREL), Golden, CO (United States), https://www.osti.gov/biblio/12200 (last access: 20 February 2026), 1999. a
IEC 61400-1:2019: Wind energy generation systems – Part 1: Design requirements, Standard, International Electrotechnical Commission, Geneva, Switzerland, 2019. a, b, c
IEC 61400-23:2014: Wind turbines – Part 23: Full-scale structural testing of rotor blades, Standard, International Electrotechnical Commission, Geneva, Switzerland, 2014. a, b, c
IEC 61400-23:2026(CD): Wind turbines – Part 23: Full-scale structural testing of rotor blades. Committee Draft, Standard draft, International Electrotechnical Commission, Geneva, Switzerland, https://www.iec.ch/dyn/www/f?p=103:38:414585481663836::::FSP_ORG_ID,FSP_APEX_PAGE,FSP_PROJECT_ID:1282,23,124692 (last access: 20 February 2026), 2024. a
IEC 61400-5:2020: Wind energy generation systems – Part 5: Wind turbine blades, Standard, International Electrotechnical Commission, Geneva, Switzerland, 2020. a, b
Jones, R. M.: Machanics of Composite Materials, Second Edition, Taylor & Francis, https://doi.org/10.1201/9781498711067, 2018. a, b
Larsen, T. and Hansen, A.: How 2 HAWC2, the user's manual, no. 1597 (ver. 13.1)(EN) in Denmark, Forskningscenter Risoe, Risoe-R, Technical University of Denmark, https://tools.windenergy.dtu.dk/home/HAWC2/ (last access: 20 February 2026), 2024. a, b
Ma, Q., An, Z.-W., Gao, J.-X., Kou, H.-X., and Bai, X.-Z.: A method of determining test load for full-scale wind turbine blade fatigue tests, Journal of Mechanical Science and Technology, 32, 5097–5104, https://doi.org/10.1007/s12206-018-1006-y, 2018. a
Madsen, P., Frandsen, S., Holley, W., and Hansen, J.: Dynamics and Fatigue Damage of Wind Turbine Rotors during Steady Operation, no. 512 in Denmark, Forskningscenter Risoe, Risoe-R, Danmarks Tekniske Universitet, Risø Nationallaboratoriet for Bæredygtig Energi, 1984. a
Melcher, D., Bätge, M., and Neßlinger, S.: A novel rotor blade fatigue test setup with elliptical biaxial resonant excitation, Wind Energ. Sci., 5, 675–684, https://doi.org/10.5194/wes-5-675-2020, 2020a. a
Melcher, D., Petersen, E., and Neßlinger, S.: Off-axis loading in rotor blade fatigue tests with elliptical biaxial resonant excitation, Journal of Physics: Conference Series, 1618, 052010, https://doi.org/10.1088/1742-6596/1618/5/052010, 2020b. a, b
Melcher, D., Rosemann, H., Haller, B., Neßlinger, S., Petersen, E., and Rosemeier, M.: Proof of concept: elliptical biaxial rotor blade fatigue test with resonant excitation, IOP Conference Series: Materials Science and Engineering, 942, 012007, https://doi.org/10.1088/1757-899X/942/1/012007, 2020c. a
Miner, M. A.: Cumulative damage in fatigue, Journal of Applied Mechanics, 12, A159–A164, 1945. a, b
Palmgren, A.: Die Lebensdauer von Kugellagern, Zeitschrift des Vereins Deutscher Ingenieure, 68, 339–341, 1924. a, b
Post, N. and Bürkner, F.: Fatigue Test Design: Scenarios for Biaxial Fatigue Testing of a 60-Meter Wind Turbine Blade, Tech. rep., National Renewable Energy Laboratory, Golden, CO, (United States), https://doi.org/10.2172/1271941, 2016. a
Previtali, F. and Eyb, E.: An improved approach for the fatigue calculation of rotor blades based on sector loads, Wind Engineering, 45, 1479–1490, https://doi.org/10.1177/0309524X20985320, 2021. a
Reddy, J.: Mechanics of Laminated Composite Plates and Shells – Theory and Analysis, 2. edn., CRC Press, Boca Raton, https://doi.org/10.1201/b12409, 2003. a
Rosemeier, M. and Antoniou, A.: Probabilistic Approach for the Fatigue Strength Prediction of Polymers, AIAA Journal, 60, 951–961, https://doi.org/10.2514/1.J060444, 2022. a
Snowberg, D., Dana, S., Hughes, S., and Berling, P.: Implementation of a biaxial resonant fatigue test method on a large wind turbine blade, Tech. rep., National Renewable Energy Lab.(NREL), Golden, CO (United States), https://doi.org/10.2172/1155105, 2014. a
Stüssi, F.: Tragwerke aus Aluminium, Springer Berlin Heidelberg, Berlin, Heidelberg, https://doi.org/10.1007/978-3-642-92661-7, 1955. a
Sutherland, H. and Mandell, J.: Optimised Goodman diagram for the analysis of fiberglass composites used in wind turbine blades, in: A Collection of the 2005 ASME Wind Energy Symposium: Technical Papers Presented at the 43rd AIAA Aerospace Sciences Meeting and Exhibit, Reno, Nevada 10, pp. 18–27, https://doi.org/0.2514/6.2005-196, 2005. a
Timoshenko, S.: On the correction for shear of the differential equation for transverse vibrations of prismatic bars, The London, Edinburgh, and Dublin Philosophical Magazine and Journal of Science, 41, 744–746, https://doi.org/10.1080/14786442108636264, 1921. a
van Delft, D., van Leeuwen, J., Noordhoek, C., and Stolle, P.: Fatigue testing of a full scale steel rotor blade of the WPS-30 wind turbine, Journal of Wind Engineering and Industrial Aerodynamics, 27, 1–13, https://doi.org/10.1016/0167-6105(88)90019-0, 1988. a
Veers, P. S.: Blade Fatigue Life Assessment With Application to VAWTS, Journal of Solar Energy Engineering, 104, 106–111, https://doi.org/10.1115/1.3266281, 1982. a
White, D.: New Method for Dual-Axis Fatigue Testing of Large Wind Turbine Blades Using Resonance Excitation and Spectral Loading, Tech. rep., National Renewable Energy Lab., Golden, CO (United States), https://doi.org/10.2172/15007390, 2004. a
White, D., Musial, W., and Engberg, S.: Evaluation of the B-REX fatigue testing system for multi-megawatt wind turbine blades, in: 43rd AIAA Aerospace Sciences Meeting and Exhibit, p. 199, https://doi.org/10.2514/6.2005-199, 2005. a
White, D., Desmond, M., Gowharji, W., Beckwith, J. A., and Meierjurgen, K. J.: Development of a dual-axis phase-locked resonant excitation test method for fatigue testing of wind turbine blades, in: ASME 2011 International Mechanical Engineering Congress and Exposition, American Society of Mechanical Engineers Digital Collection, pp. 1163–1172, https://doi.org/10.1115/IMECE2011-63724, 2011. a
Zahle, F., Barlas, A., Lønbæk, K., Bortolotti, P., Zalkind, D., Wang, L., Labuschagne, C., Sethuraman, L., and Barter, G.: Definition of the IEA Wind 22-Megawatt Offshore Reference Wind Turbine, dTU Wind Energy Report E-0243 IEA Wind TCP Task 55, Technical University of Denmark, https://doi.org/10.11581/DTU.00000317, 2024. a, b, c
- Abstract
- Introduction
- Data processing methods to derive target loads
- Case studies – investigation of assumptions and methods
- Implementation of target loads in testing
- Conclusions
- Appendix A: Load assumption details
- Code availability
- Data availability
- Author contributions
- Competing interests
- Disclaimer
- Acknowledgements
- Financial support
- Review statement
- References