the Creative Commons Attribution 4.0 License.
the Creative Commons Attribution 4.0 License.
 | 19 May 2026
A two-stage framework for identifying and characterizing wind turbine noise data and its validation by listening tests
Susanne Könecke
Clemens Jonscher
Tobias Bohne
Raimund Rolfes
The reliable identification of acoustically dominant wind turbine noise in field measurements is essential for analysing source-specific noise characteristics and sound propagation under real atmospheric conditions. Long-term acoustic data sets typically contain mixtures of wind turbine noise and competing environmental sounds, which makes robust automated identification challenging. This paper presents a two-stage framework for identifying wind-turbine-noise-dominated periods and specific wind turbine noise components in large acoustic data sets. In the first stage, time periods dominated by wind turbine noise are identified by combining statistical preselection criteria, turbine operating data, and a physics-based signal analysis that relates detected modulation frequencies to blade passing harmonics. In the second stage, the selected periods are further examined to identify specific wind turbine noise components, including rotor-induced amplitude modulation, tonal components, and high-frequency whistling noise. The framework is validated against a perceptual reference derived from a structured listening test in which wind turbine noise components and relevant competing noise sources are classified into predefined categories. A total of 15 participants evaluated audio segments, resulting in a reference with 166 classified minutes. The listening test shows good intrarater reliability (mean Jaccard index: 0.87) and moderate, category-dependent interrater agreement (mean: 0.56). Validation of the first stage demonstrates high performance for identifying dominant wind turbine noise (precision: 0.99, recall: 0.96). Component-specific validation of the second stage shows physically plausible detection behaviour, with deviations primarily attributable to subjective perception and masking effects in the listening test. The validated framework enables reliable and effective identification of wind turbine noise and its components, as demonstrated by its application to a 1-month acoustic data set containing interfering environmental noise.
- Article
(5481 KB) - Full-text XML
- BibTeX
- EndNote


Ongoing climate change and associated energy policy requirements are leading to a significant expansion of wind energy worldwide. As modern wind turbines are increasingly installed in closer proximity to residential areas, wind turbine noise (WTN) remains a topic of sustained scientific and societal relevance. A comprehensive understanding of WTN requires long-term free-field measurements that capture atmospheric and operational variability. Corresponding measurements have been carried out in recent years in various climate regions, for example in Germany (Martens et al., 2020; Blumendeller et al., 2023), Sweden (Larsson and Öhlund, 2014; Conrady et al., 2020), and Australia (Hansen et al., 2019; Hansen, 2021). Between 2018 and 2020, a total of 13 months of acoustic, meteorological, and operational data were collected in northern Germany (Martens et al., 2020), enabling the validation of a parabolic-equation sound propagation model (Könecke et al., 2023a) and comprehensive analyses of sound propagation effects (Martens et al., 2019b). A central prerequisite for such analyses is the reliable identification of time periods dominated by WTN while excluding periods affected by extraneous sound sources.
In the literature, a few approaches meeting this prerequisite exist and differ in temporal resolution, computational effort, and robustness against masking noise. For long-term studies with limited temporal resolution, such as analyses based on 1 to 10 min averaged data, statistical criteria based on A-weighted sound pressure levels (LA) and level percentiles (L5, L95) have proven to be practical because of their straightforward applicability. Building on earlier work by van den Berg (2004), Öhlund and Larsson (2015) proposed three criteria for identifying periods with dominant WTN: (i) L5–L95 ≤ 4 dBA, reflecting the comparatively low temporal variability of wind turbine noise relative to most background sources; (ii) the A-weighted third-octave band levels above 800 Hz increase the overall A-weighted level by less than 1.5 dB for total levels exceeding 25 dBA; and (iii) the combined free-field contribution of all turbines results in an A-weighted sound pressure level of at least 30 dBA at the receiver location. These criteria were subsequently adopted by other researchers and partly adapted to measurement environments in several studies (Conrady et al., 2018; Martens et al., 2019b; Bolin et al., 2020). However, analysis of several data sets conducted by the authors indicates that these criteria may be susceptible to misclassification when background sources exhibit similar statistical or spectral behaviour, such as aircraft overflights or wind-induced vegetation noise.
For high-resolution data, starting from sampling rates of approximately 8 Hz and above, more advanced methods can be used, which primarily relate to the characteristic fluctuations in WTN, known as amplitude modulation (AM). The Institute of Acoustics (IOA) defines AM as “a periodic fluctuation in the level of audible noise from a wind turbine (or wind turbines), the frequency of the fluctuations being related to the blade passing frequency of the turbine rotor (s)” (IOA, 2016). Numerous methods for detecting and quantifying AM in WTN data have been proposed and reviewed in detail in IOA (2015). Herein, the approaches are categorized into time-domain approaches (Fukushima et al., 2013), frequency-domain approaches (Lundmark, 2011; Larsson and Öhlund, 2014; Conrady et al., 2020), and hybrid approaches (IOA, 2016).
One of the most intensively researched methods here is the hybrid “reference method” developed by IOA (2016). It analyses 100 ms equivalent sound pressure levels LA,eq in three summarized frequency bands (50–200, 100–400, 200–800 Hz), performs a fast Fourier transform (FFT) to identify the fundamental modulation frequency, and examines the prominence of the peak at the blade passing frequency (BPF). The filtered modulation signal is then reconstructed by inverse FFT, and the AM depth is determined by L5−L95, according to Fukushima et al. (2013). The method is primarily aimed at the detection and quantification of pronounced amplitude modulation and was developed with the objective of assessing modulation in wind turbine noise rather than characterizing wind turbine noise as a whole (IOA, 2016).
More recently, machine learning (ML) approaches have been explored to automate AM detection. In Nguyen et al. (2021), a benchmark data set was created containing 6000 audio sequences of a duration of 10 s with wind farm noise and a background noise. The classification of AM presence was performed by an experienced acoustician on a five-point scale ranging from certain absence (1) to certain presence (5). To determine intra- and interrater reliability, 100 samples were additionally assessed by the same acoustician and a second acoustician. Based on this data set, a random-forest-based AM detection method was developed. Part of the data was also used to validate the ML approach and the mentioned methods. However, ML-based approaches require large training data sets and are often difficult to interpret.
Although numerous detection approaches exist, many of them have not been validated against structured listening tests explicitly designed for method validation under real-field conditions. Moreover, existing approaches focus on statistical dominance criteria or on individual acoustic phenomena such as AM. To the best of the authors' knowledge, a validated and computationally efficient framework that systematically identifies WTN-dominated time periods in long-term field measurements and subsequently identifies specific WTN components is currently not available. Such a framework becomes particularly relevant when analysing large measurement data sets containing interfering environmental noise and spanning several months with sampling rates of the order of tens of kilohertz. Due to high data volumes, practical long-term applications require an automated and easily applicable framework with a limited number of input parameters and moderate computational effort. At the same time, the approach must ensure robustness under real-field conditions and enable reliable identification in the presence of varying environmental noise.
The detection framework proposed in this study is designed to meet these requirements and comprises two stages. In the first stage, time periods dominated by WTN are identified by combining statistical criteria adapted from Öhlund and Larsson (2015) and turbine operating constraints with a physics-based modulation analysis in individual third-octave bands. In this analysis, detected modulation frequencies are related to the BPF derived from SCADA rotor-speed data, adapting the approach of IOA (2016). In the second stage, the identified periods are examined in more detail to determine specific WTN components, including rotor-induced AM according to IOA (2016), whistling noise, and tonal components in accordance with IEC 61400-11 (International Electrotechnical Commission, 2006). For the systematic validation of the proposed framework, a structured, source-specific listening test was conducted that was explicitly designed for the assessment of WTN detection methods. A total of 15 participants evaluated approximately 1200 audio segments of 10 s duration and provided minute-wise classifications of WTN and competing sound sources, including wind-induced noise and bird calls. Finally, the detection framework was applied to a 1-month measurement data set to demonstrate its effectiveness.
In summary, the main contributions of this paper are the following:
-
development, validation, and application of a two-stage framework for identifying WTN-dominated time periods and specific WTN components;
-
design, application, and evaluation of a structured, source-specific listening test providing perceptual classifications for the validation of WTN detection methods;
-
provision of the proposed framework, the listening-test platform, and anonymized audio signals to support further research in accordance with findable, accessible, interoperable, and reusable (FAIR) data principles.
The paper is structured as follows. Section 2 presents the proposed detection framework. Section 3 describes the listening test, including its design, the derivation of the validation data set, and the corresponding analyses and results. Section 4 provides the validation of the detection framework against the listening-test reference. Section 5 presents the application of the framework to a 1-month measurement data. Conclusions and an outlook are given in Sect. 6.
An overview of the two-stage detection framework is given in Fig. 1. The required input data consist of acoustic time series sampled at a rate of at least 20 Hz, as well as time-synchronized operating data from the turbine, in particular the rotor speed and wind speed at hub height. The acoustic time series must be divided into 1 min segments, and the required variables, including level percentiles () and sound pressure levels LA,eq, must be derived.
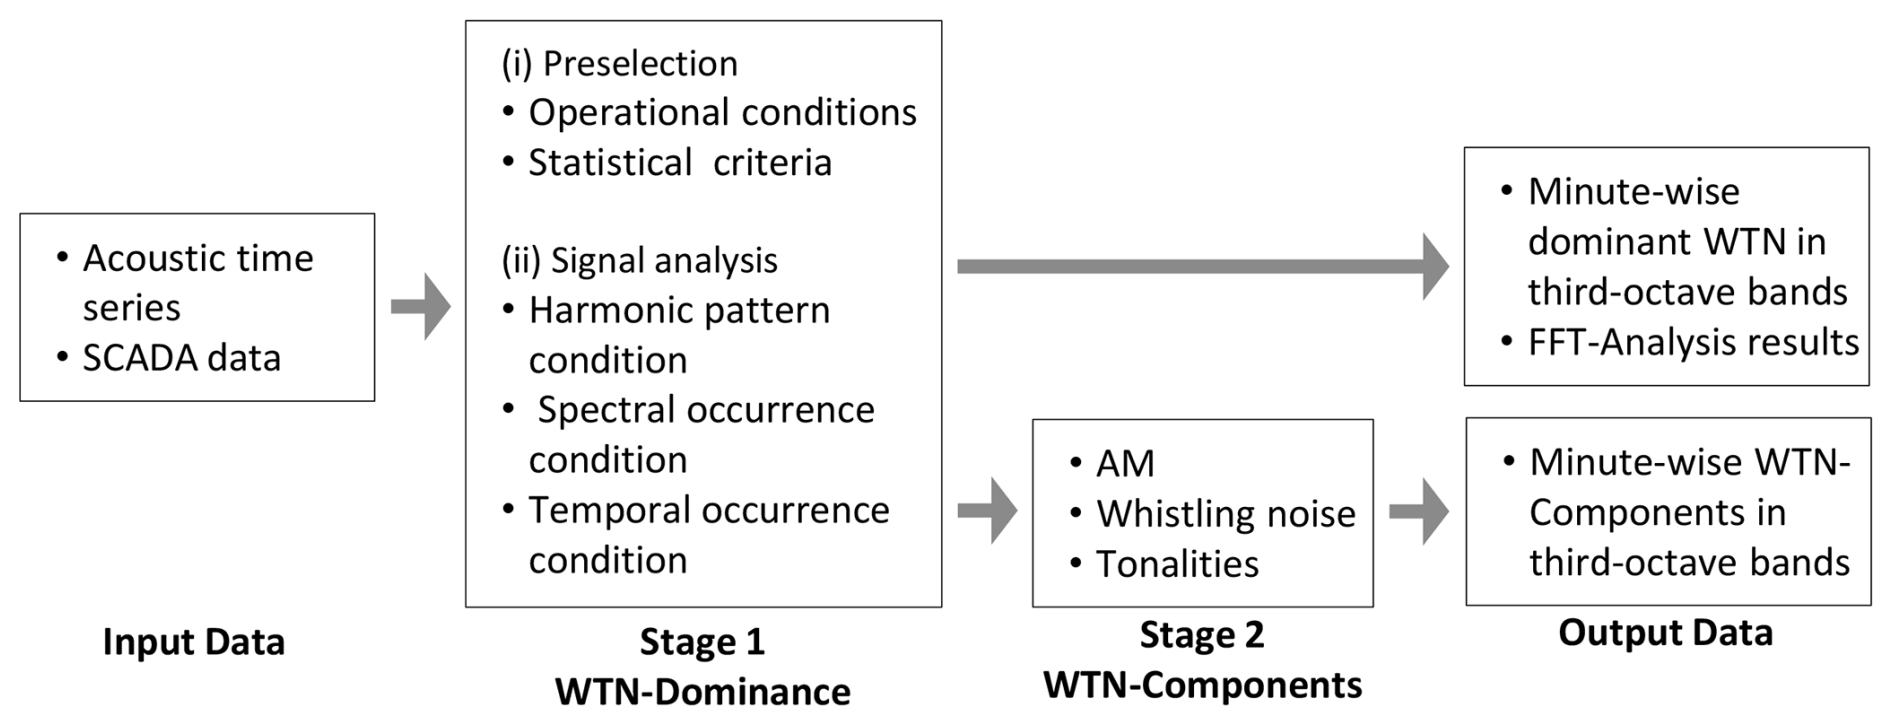
Figure 1Two-stage detection framework for identifying WTN-dominated periods and WTN components.
2.1 Stage 1: identification of WTN-dominated time periods
2.1.1 Preselection
In the preselection process, 1 min averaged acoustic data are filtered in combination with 10 min averaged wind turbine data. The latter are typically available as standard 10 min SCADA averages and are rarely provided at higher temporal resolution. For the acoustic data, a shorter averaging time of 1 min is applied, as 10 min averaging is not suitable for acoustic assessments due to the loss of short-term variability in wind turbine noise. The aim of the preselection is to identify time periods with a high likelihood of containing dominant WTN. First of all, periods in which the data set, i.e. acoustic and/or turbine-specific data, is incomplete are excluded. Moreover, only periods in which the wind turbine in focus operates (WT > 6.5 rpm) while neighbouring turbines remain inactive are selected. In addition, time periods are excluded when atmospheric or acoustic conditions indicate the presence of extraneous noise. The wind speed at hub height must remain below 15 m s−1 to avoid contamination by wind-induced microphone and vegetation noise, which is known to increase with wind speed (e.g. NSW DPHI, 2024; Bolin, 2006; Martens et al., 2019a). Furthermore, the equivalent sound pressure level is restricted to a range between 25 and 60 dB(A), covering wind turbine sound emission levels from large residential distances down to locations close to the turbine, as reported in field measurements (Evans and Cooper, 2012) and emission-related reports conducted in accordance with IEC 61400-11. Finally, the acoustic data must satisfy the statistical criteria dB(A) and dB(A), where Ln (with ) denotes the statistical A-weighted percentile sound pressure level. These limits are based on the assumption that WTN is relatively constant compared to ambient noise. Although a more conservative limit of 4 dB has been proposed in the literature (e.g. Öhlund and Larsson, 2015), a less restrictive value was chosen to avoid the premature exclusion of potentially relevant WTN-dominated periods. After the preselection, 1 min segments with a high probability of WTN are retained for subsequent signal analysis. Note that depending on the turbine type and measurement setup, individual preselection criteria, in particular thresholds related to turbine operation and wind-induced background noise, may require adaptation.
2.1.2 Signal analysis
In the second step, the time-domain signal of the preselected periods is analysed. Herein, it is assumed that noise from wind turbines is likely to be amplitude modulated. The procedure identifying time periods with dominant WTN is shown schematically in Fig. 2. It is oriented towards the detection of AM published by IOA (2016) and is explained below.
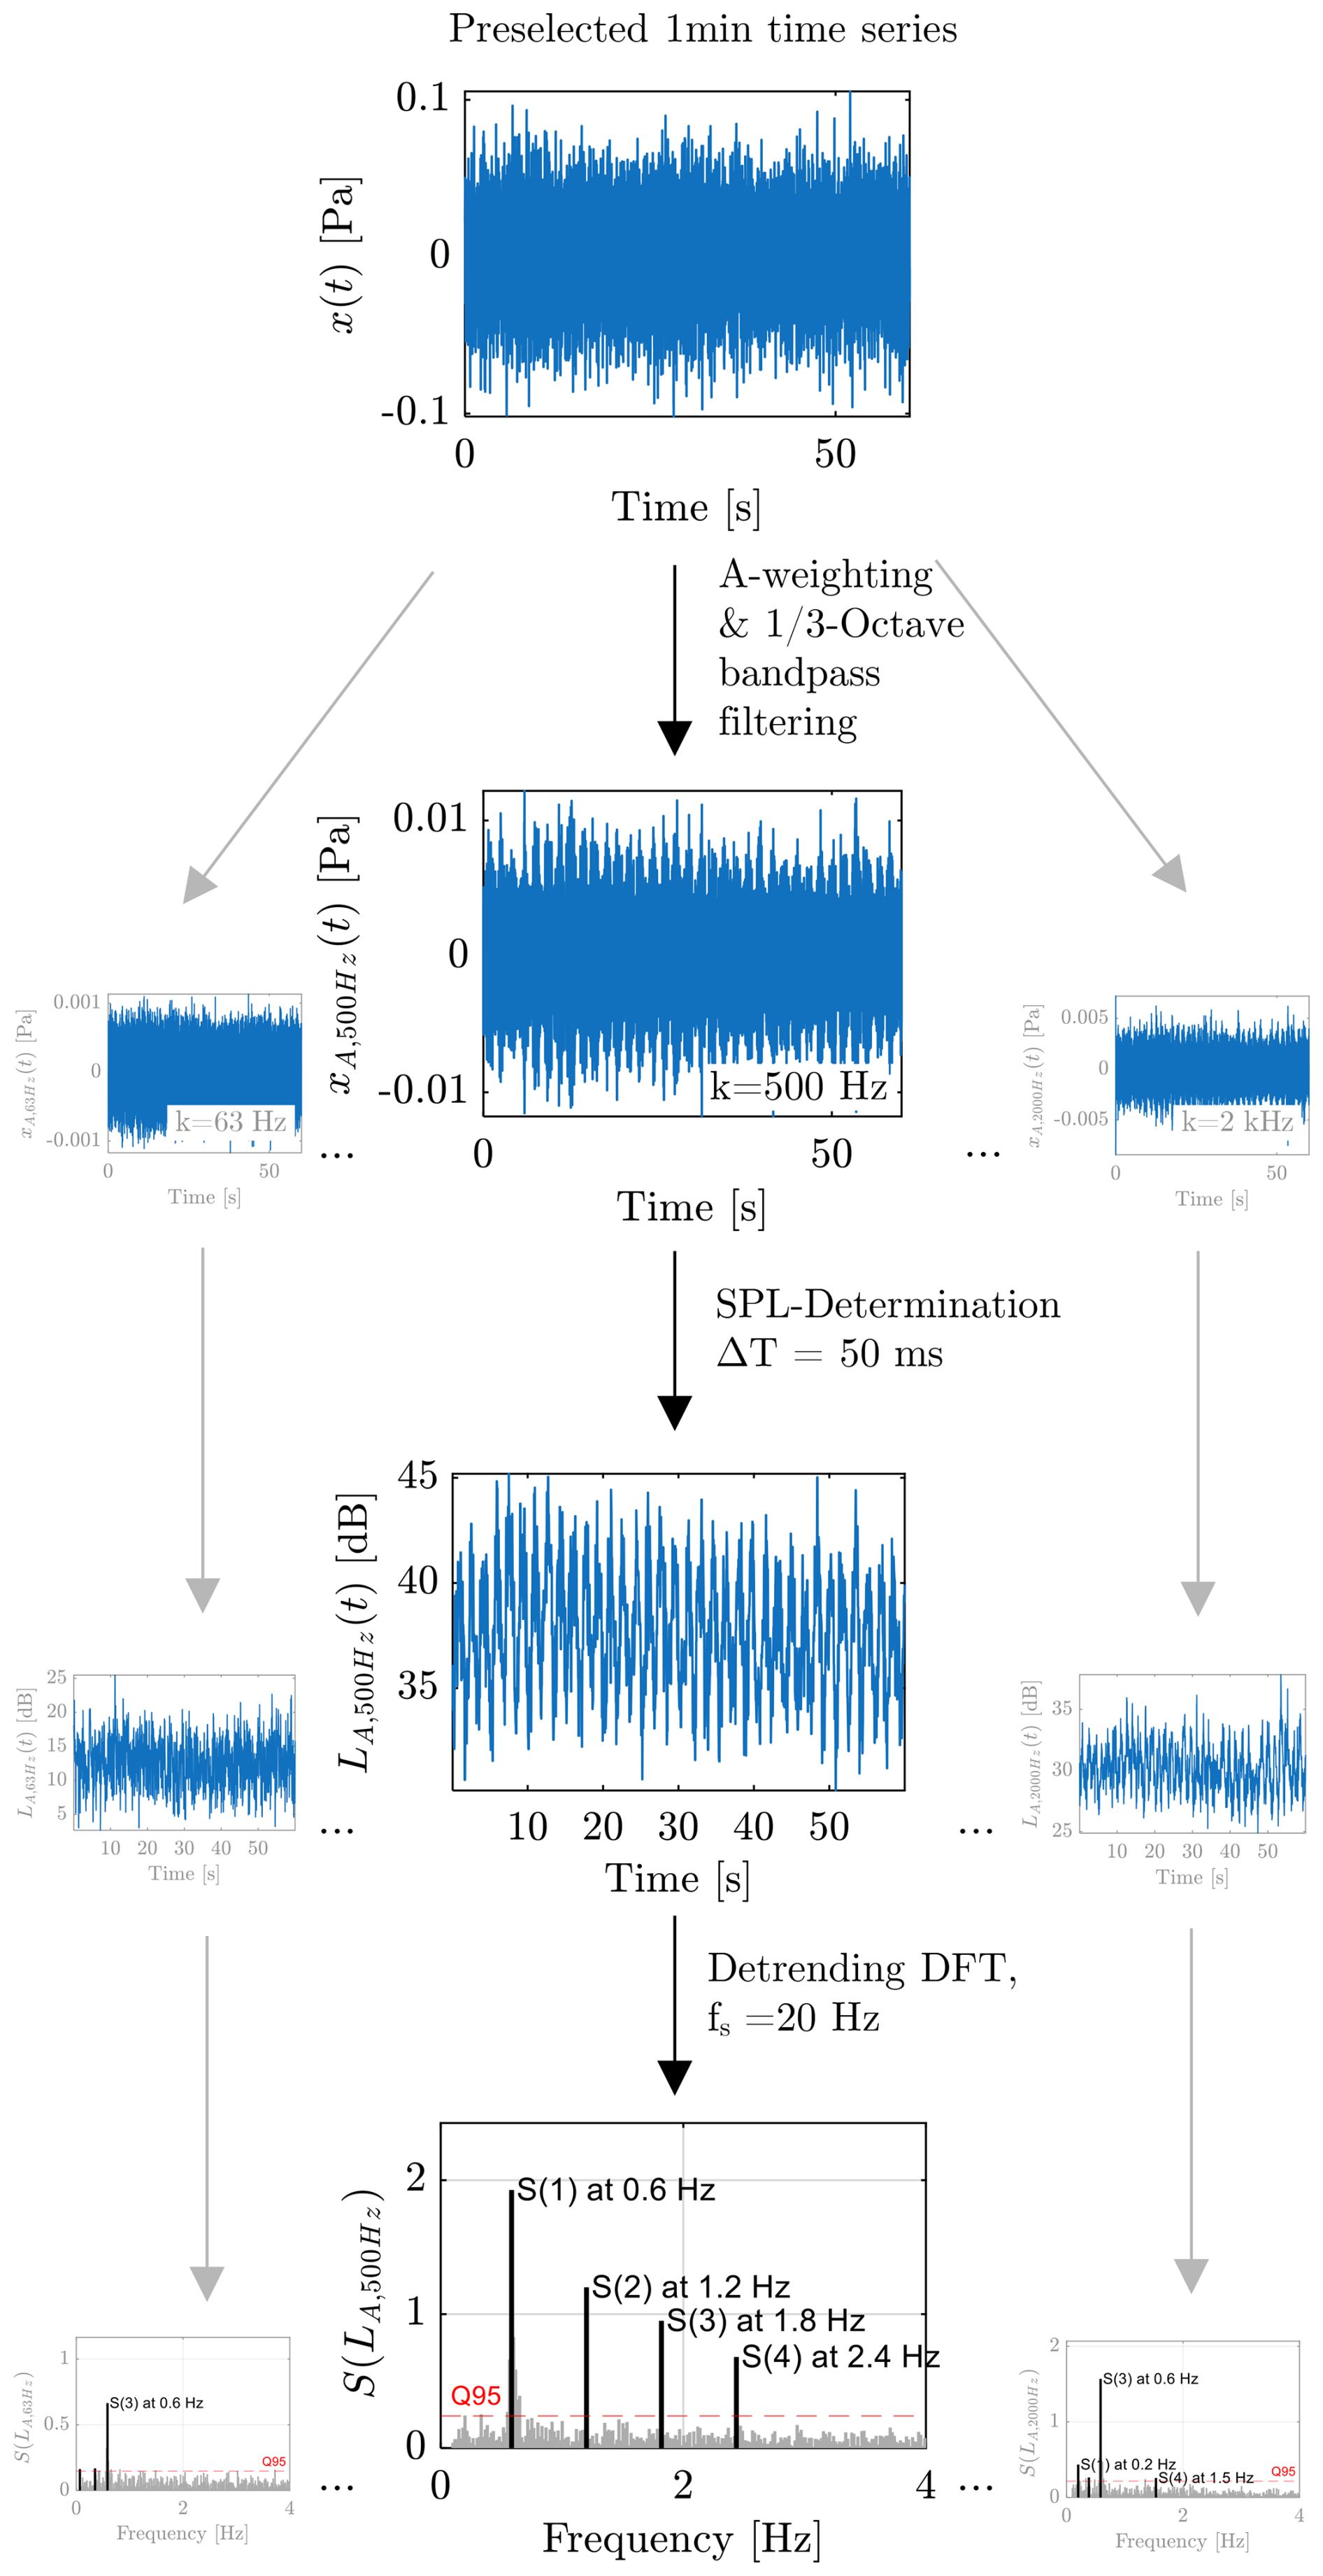
Figure 2Schematic overview of the signal analysis for identifying dominant WTN. The third-octave levels are computed using time windows of ΔT = 50 ms, yielding third-octave-level time series sampled at fs = 20 Hz for the subsequent DFT. To improve the visual clarity of peaks S1–S4, the amplitude values have been adjusted. The highlighted frequencies correspond to a rotational speed of 12 rpm, resulting in a BPF of 0.6 Hz.
Initially, the time series x(t) of each preselected 1 min period is A weighted in accordance with IEC 61672-1 (International Electrotechnical Commission, 2013) and subsequently bandpass filtered into third-octave bands with centre frequencies k defined in IEC 61260-1 (International Electrotechnical Commission, 2014). In contrast to IOA (2016), which evaluates aggregated frequency bands, the present analysis is conducted on individual third-octave bands between 63 and 2000 Hz to enable a frequency-resolved source classification. Frequencies below 56.2 Hz are excluded, as these are dominated by wind-induced noise at the microphone. Due to frequency-dependent air absorption, high-frequency components are strongly attenuated in the free field. Consequently, third-octave bands above 2239 Hz are also not taken into account.
From A-weighted, band-limited time series xA,k(t), equivalent sound pressure levels LA,k are computed using 50 ms windows, resulting in time series of third-octave levels with a sampling rate of 20 Hz. To analyse periodic components, the LA,k time series is detrended using a third-order polynomial, reducing the influence of slow level fluctuations unrelated to rotor-induced modulation. Afterwards, a discrete Fourier transform (DFT) is performed using a sampling rate of 20 Hz, with no window function and no padding (see also IOA, 2016, for analysed parameters). The power spectrum amplitude of the time series of the third-octave levels is then determined by
where F{LA,k} denotes the single-sided DFT amplitude of the third-octave levels, and n is the number of samples.
Within the relevant frequency range of 0.09–4 Hz, up to four dominant spectral peaks are identified for each third-octave band. In the presence of WTN, these peak frequencies represent the modulation frequency, i.e. the frequency at which the sound pressure level fluctuates periodically. This modulation frequency is directly related to the blade passing frequency (BPF), defined as
and its harmonics. Characteristic frequencies include p1 (single rotor blade), p3 (three rotor blades), p6, p9, p12, p15, and p18. In particular, p3 represents the BPF of a three-bladed wind turbine and therefore constitutes the primary characteristic frequency associated with aerodynamic rotor noise. Explicit consideration of p1 also enables the identification of whistling noise associated with a single rotor blade. In addition, the 95th quantile (Q95) of the power amplitude distribution within the frequency range of 0.09 to 4 is determined. This frequency range was chosen in order to consider the frequency of one rotor blade (p1) and the fifth harmonic of three rotor blades (p18). Following IOA (2016), a prominence ratio C is determined by dividing the spectrum amplitude at the detected peak by the mean amplitude of two spectral lines on either side of the peak, excluding the immediately adjacent bins (see Fig. 4.6.1 in IOA, 2016).
Finally, a third-octave-band time series is classified as WTN dominated if the following dominance criteria are satisfied:
-
Harmonic pattern condition (including rotational consistency and spectral prominence). To determine whether a third-octave band contains rotor-synchronous components, each detected modulation frequency is first assigned to the closest theoretical rotor frequency or its harmonics . Each detected modulation frequency is then evaluated with respect to rotational consistency and spectral prominence.
Rotational consistency is fulfilled if the relative deviation between the detected modulation frequency and the corresponding rotor frequency is below 10 %. An analysis of 10 min averaged SCADA data from a representative wind turbine, for which mean values and standard deviations were available, showed rotor speed variations of up to approximately 15 % within a 10 min period. A tolerance range of 10 % is therefore considered conservative.
Spectral prominence is satisfied if the amplitude peaks at the modulation frequency S(fmod,i) exceed the 95th percentile Q95 of the total power spectrum distribution Stotal:
A third-octave-band time series satisfies the harmonic pattern requirement if the detected modulation frequency corresponding to p3 fulfils both the rotational consistency criterion and the spectral prominence criterion or if at least two other detected modulation frequencies (e.g. 1st, 6th, 9th, 12th, 15th, or 18th order) fulfil both the rotational consistency criterion and the spectral prominence criterion. Requiring at least two higher harmonics ensures that random spectral coincidences are avoided. This criterion reduces the likelihood that isolated peaks caused by background noise or transient events are misclassified as rotor-related components. Moreover, these conditions ensure that cases where higher-order harmonics dominate (e.g. p6, p9) are retained, enabling later investigation of the specific situations in which different acoustic phenomena occur.
-
Spectral occurrence condition. At least five of seven third-octave bands in the range 200–800 Hz meet the harmonic pattern condition. Close to the wind turbine, this frequency range is associated with dominant wind turbine noise and is commonly linked to aerodynamic trailing-edge noise (Moorhouse et al., 2007; IOA, 2016). For turbines with differing spectral source characteristics, such as future turbine types, the frequency range may require adjustment.
-
Temporal occurrence condition. At least two valid 1 min periods are detected within a 10 min period (±5 min). This requirement reduces the likelihood of spurious or random single events.
A time period is generally classified as WTN-dominated when both the spectral occurrence condition, which verifies the presence of a harmonic pattern in the mid-frequency range, and the temporal occurrence condition are simultaneously fulfilled. Consequently, WTN may be classified as dominant even if individual third-octave bands do not satisfy the dominance criterion. For the evaluation of individual third-octave bands, however, all dominance criteria must be met.
2.2 Stage 2: identification of wind turbine noise components
Stage 2 examines the 1 min periods identified in Stage 1 in order to determine specific WTN components. These include AM, whistling noise, and tonal components.
2.2.1 Identification of AM
In the literature, several forms of AM from wind turbines are distinguished. These include normal amplitude modulation (NAM), which occurs close to the source, as well as more distant AM phenomena such as other amplitude modulation (OAM) and tonal amplitude modulation (TAM). In accordance with the IOA reference method, a prominence ratio C>4 is used to indicate the presence of AM. As outlined in IOA (2016), this represents a pragmatic and conservative threshold value for separating robust AM segments from disturbed or contaminated time periods. AM is evaluated for individual third-octave bands during WTN-dominated minutes.
2.2.2 Identification of whistling noise
Whistling noise is a high-frequency, narrowband sound that can arise from local aerodynamic disturbances at blade edges or small openings. In the present data set, it is associated with partially blocked drainage holes on one rotor blade. Whistling noise is not part of the typical broadband aerodynamic emission mechanisms of modern wind turbines, but it is of particular relevance due to its often disturbing perceptual character (Persson Waye and Öhrström, 2002). The identification of whistling noise is based on the detection of a pronounced single-blade modulation component. Specifically, whistling noise is identified when the prominence ratio of the single-blade modulation peak exceeds C>4, indicating a strong and isolated one-blade signature in the modulation spectrum.
2.2.3 Identification of tonal signal components
Tonal components are identified based on narrowband spectral analysis following the principles of IEC 61400-11, with minor adaptations to the present data and objectives. In IEC 61400-11, 10 s averaged narrowbands including frequencies from 50 Hz to 10 kHz are analysed. However, the results of Stage 1 are 1 min periods which are dominated by WTN. Hence, for those periods, the time series x(t) is transformed into a narrowband frequency spectrum with a resolution of 2 Hz using DFT (Hanning window, 50 % overlap, no padding). The spectrum is evaluated for local maxima, and masking noise is estimated within the corresponding critical band. A tone is classified as present when the spectral line exceeds the masking noise by more than 6 dB, and its perceptual relevance is assessed using the frequency-dependent audibility correction defined in the standard. Note that the unfiltered broadband time series is used for tonal analysis, as filtering into third-octave bands would distort the narrowband spectral structure and bias the tonality assessment.
For the validation of the framework, a listening test was designed in which short acoustic recordings were assessed with respect to their dominant noise source. The aim was to create a manually labelled reference data set that can be used to validate methods for identifying WTN and its source-specific components.
The conduction of the listening test and hence the validation of the detection framework are based on acoustic, meteorological, and turbine-specific data recorded during a 1-month measurement campaign in northern Germany in flat and homogeneous terrain. The measurement site is shown in Fig. 3. For the examinations, the acoustic recordings from a sound level meter positioned at a height of 1.70 m and at a distance of 178 m from the wind turbine are used. The acoustic time series are sampled at a rate of 32 kHz. SCADA data from the wind turbine in focus and neighbouring wind turbines, as well as meteorological data from a 100 m high mast, are provided as 10 min averages. The data set, its recording, and its processing are described in detail in Martens et al. (2020) and Schössow et al. (2024). It has also been published and is freely accessible (Könecke et al., 2023b).
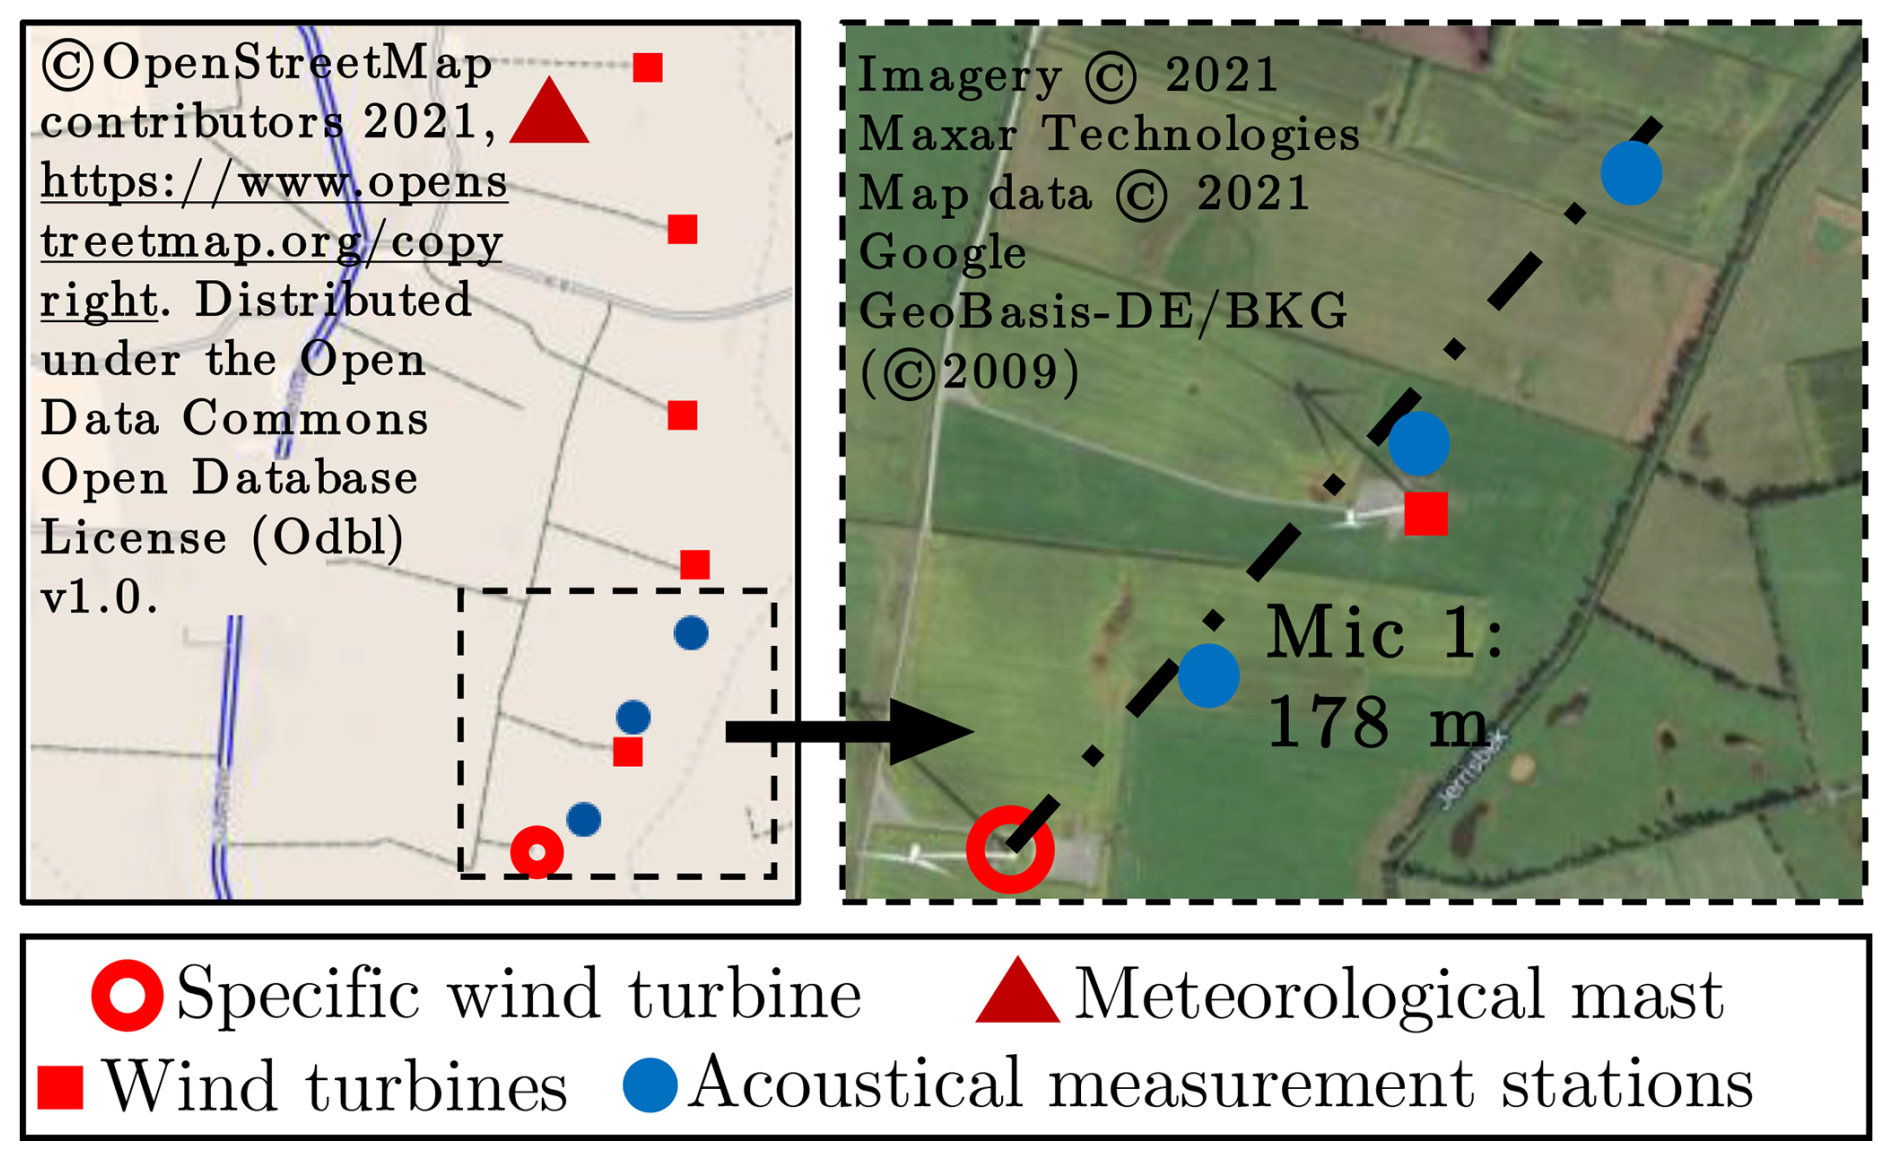
Figure 3Overview of the measurement site showing the wind turbine under investigation, the acoustic measurement position(s), and the 100 m meteorological mast. Adapted from Könecke et al. (2023a) (OpenStreetMap).
3.1 Design and structure of the listening test
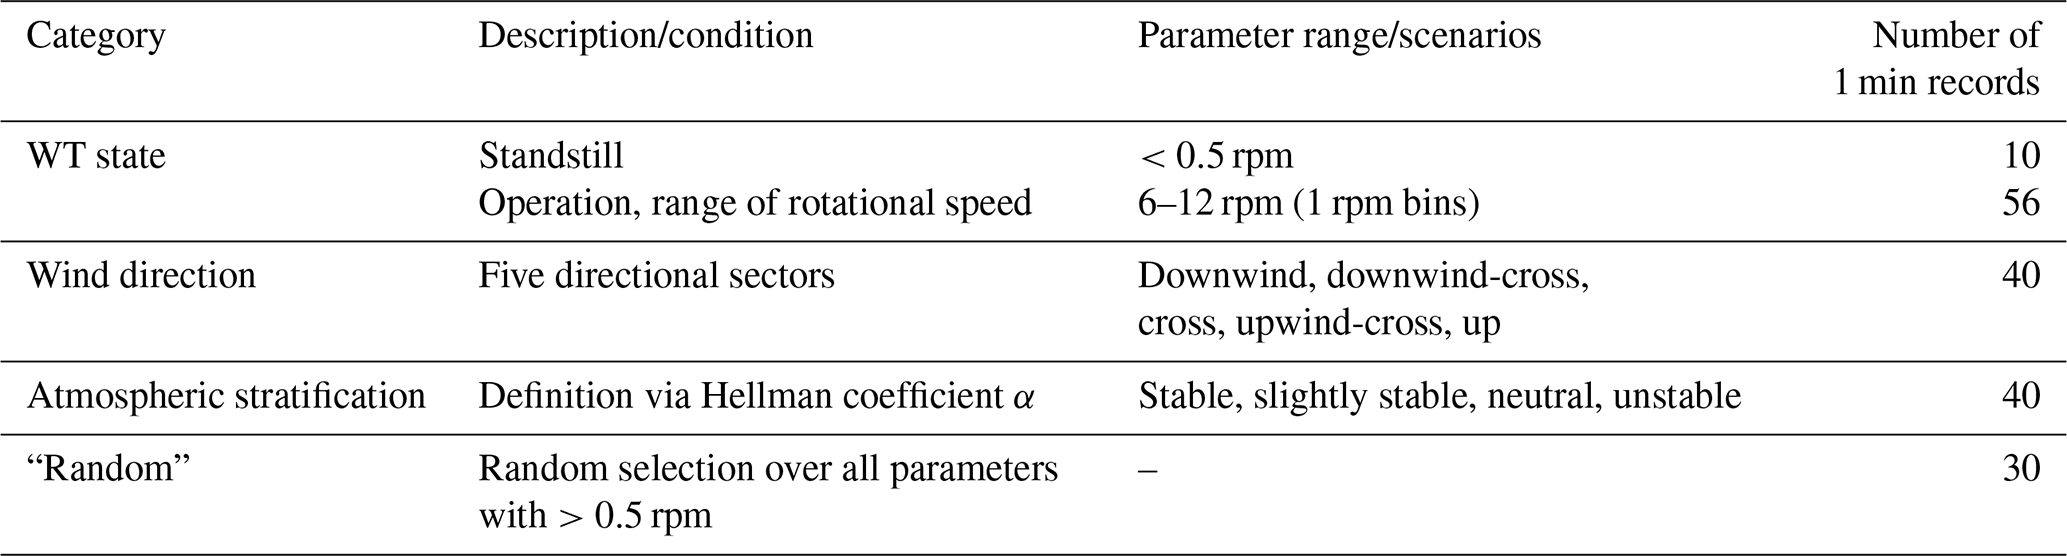
For validation of the proposed framework, an assessment based on 1 min sound recordings was required. The recordings were selected under reference conditions expected to yield representative WTN characteristics. These conditions were derived by systematically categorizing the measurement data set and are mostly aligned with the preselection criteria in Sect. 2.1. They comprise rotor speeds above 11 rpm, wind speeds below 11 m s−1, and downwind or downwind–crosswind wind directions. The A-weighted equivalent sound pressure level was restricted to dB(A), low temporal variability of percentile sound levels was required, and stable stratification was assumed (α>0.2, where α describes the vertical wind shear according to the power-law wind profile). These reference conditions formed the baseline scenario for all subsequent systematic parameter variations, which are summarized in Table 1. For each parameter combination, 10 data sets of 1 min duration were randomly selected, if available, with each data set being used only once. In total, the listening-test data set comprised 194 individual 1 min recordings, including approximately 10 % blinded repetitions to assess intrasubject consistency, i.e. the extent to which the same participant provided consistent responses when evaluating two identical recordings. Since the perceptual evaluation of continuous 1 min recordings is cognitively demanding, each recording was subdivided into six consecutive 10 s segments, which were evaluated individually. For each 10 s audio segment, participants could select nine response categories: uncertain, no WTN, WTN in combination with disturbance noise (wind-induced noise, birds, or other sources), and specific WTN components (rotor noise, tonality, machine noise, or whistling noise). The playback and evaluation were performed using a graphical user interface (GUI) implemented in MATLAB (Fig. A1 in the Appendix).
Table 1Overview of the parameters considered and selection criteria for the listening test. For each parameter combination, a maximum of 10 recordings of 1 min duration were selected where available.
Prior to the test, WTN was defined explicitly as periodic aerodynamic noise generated by the rotating rotor blades. Machine noise, such as sounds caused by nacelle yaw movements, was explicitly distinguished from tonal components. Participants were also able to provide free-text comments, for example to indicate partial masking of WTN by wind noise.
The listening test comprised three standardized phases. In the introduction phase, participants received a guided presentation of the test environment and listened to 16 representative audio examples illustrating typical WTN characteristics and common extraneous noise sources. The training phase included a test run with comparison to a reference solution; in the case of deviations, audio segments were replayed, and open questions were discussed. In the main test phase, participants evaluated randomly ordered audio segments. After every 3 min of playback, a neutral audio signal (elevator music) was presented to neutralize the hearing. Breaks were optional after 15 min and mandatory after 60 min.
The entire listening test comprised 3 h and 14 min of pure audio material and was conducted by 15 participants, all employees of the Institute of Structural Analysis. Three of them work directly in the field of wind turbine acoustics and are experienced in WTN. The remaining test participants work in other wind-energy-related fields. All participants used identical headphones, namely Real Blue NC from Teufel.
3.2 Derivation of validation data
To validate the developed framework, a reference data set is required that provides a reliable classification of each 1 min segment. Since the listening test was based on 10 s audio segments, the listener responses are aggregated to a minute-level consensus.
For each participant and each category, six binary evaluations corresponding to the consecutive 10 s segments of a 1 min period are available. To derive a clear minute-level classification for each category and participant, these six judgements are aggregated using a strict majority rule. Based on the number of positively rated 10 s segments , the minute-level classification is defined as follows:
-
category present, if s≥4;
-
category not present, if s≤1;
-
unclear, if s = 2 or 3.
Minute-level evaluations without a clear majority (i.e. two or three positive 10 s ratings), as well as minutes for which the category “uncertain” is present, are classified as unclear and excluded from subsequent consensus formation for the respective category. Consequently, when determining a consensus across all listeners for each minute and category, only participants providing a clear minute-level judgement (present or not present) are considered. The approval rate
is calculated as the ratio of the number of positive minute ratings N1 to the number of valid persons Nval. The minute classification for each category is based on the following consensus thresholds:
-
category present, if q≥0.70;
-
category not present, if q≤0.30;
-
unclear, if .
If none of the evaluated categories reaches the threshold for being classified as present, a minute is defined as unclear at the consensus level.
3.3 Analysis of listening test
3.3.1 Plausibility
To assess the plausibility of the participants' responses, the results of the listening test are compared with the rotor speed derived from SCADA data. For this purpose, the data sets are classified into the categories “wind turbine on” (rotor speed > 6.5 rpm) and “wind turbine off” (rotor speed < 6.5 rpm). Under conditions of very high wind speeds or strong gusts, wind-induced noise may mask the acoustic characteristic of the wind turbine. In such cases, the participants were instructed to add the comment “WTN covered” in the free-text field. These cases were manually reclassified to enable a consistent comparison with the SCADA-based turbine state.
The percentage agreement between the listening-test ratings and the SCADA turbine state for all participants is given in the Appendix (Table A1). With overall agreement between 93.3 % and 99.4 % and a mean agreement of 96.8 %, the ratings of the audio signals are considered plausible. Noticeably lower agreement values of down to 56.3% are observed when the WT state is off. In Fig. 4, the correct and incorrect classifications depending on rotor speed and wind speed are illustrated. A total of 26 and 23 misclassifications occur at low rotor speeds (6.5, 8 rpm). At such low rotor speeds, the emitted sound pressure levels are small, and the periodic character of WTN becomes increasingly difficult to perceive. Another reason is the limited temporal resolution of the SCADA data. Since the rotor speed is only available as a 10 min average, short-term operating conditions, especially during starting and stopping processes, cannot be resolved. One participant did not use the comment function. As a result, situations in which WTN was masked by wind noise were presumably classified as “no WTN” and could not be corrected during the plausibility check. Accordingly, the deviations at higher rotor speeds seen in Fig. 4 are due to an individual mistake.
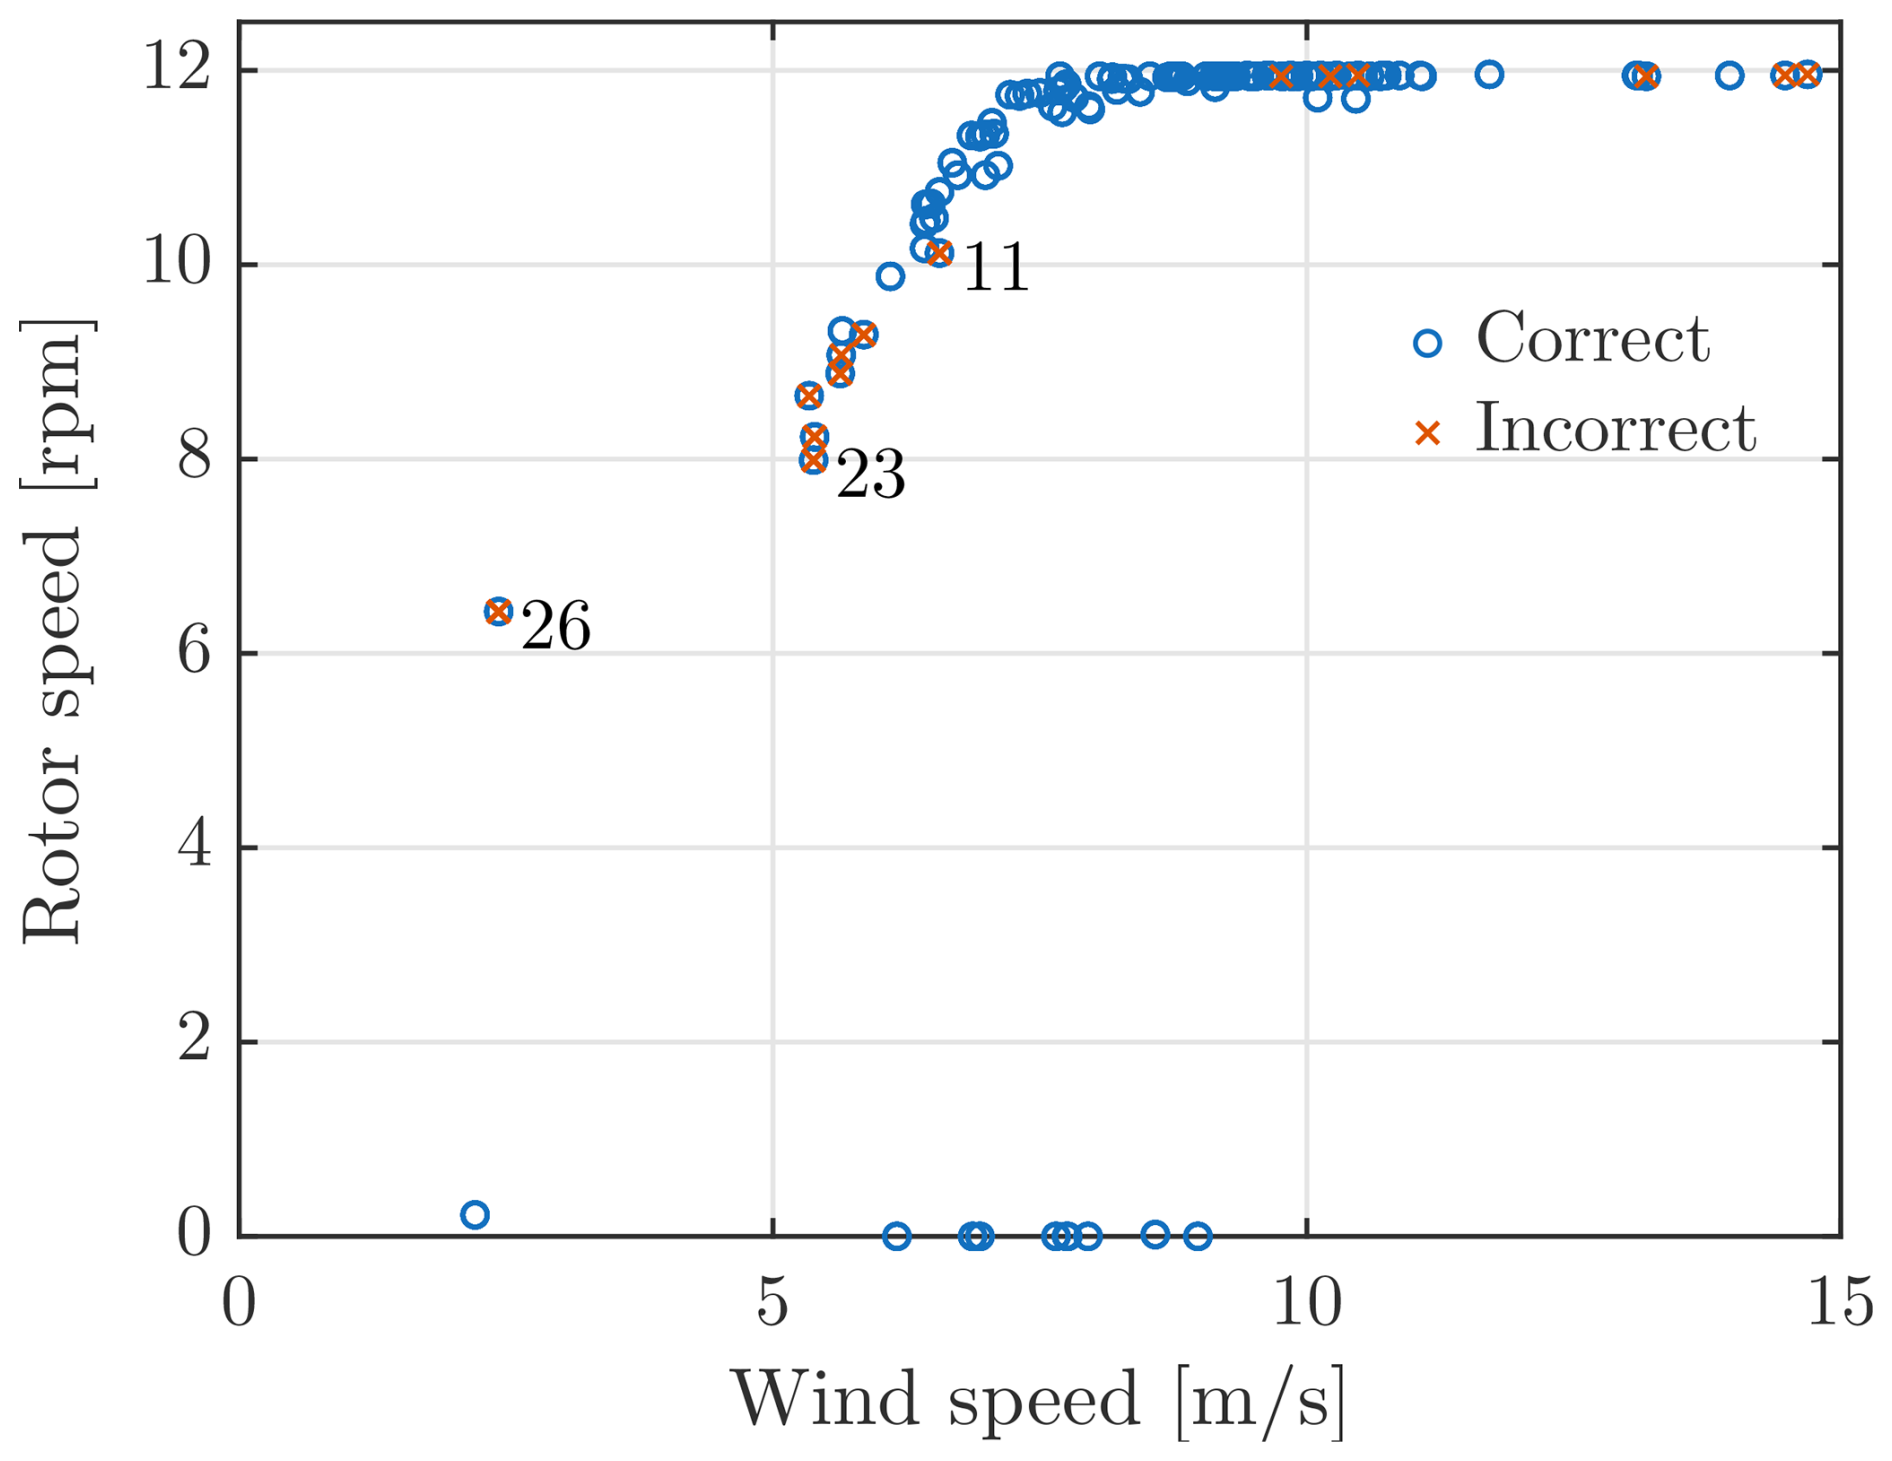
Figure 4Rotor speed versus wind speed showing correctly and incorrectly classified 1 min periods across all participants. Numbers indicate the respective number of misclassifications at the corresponding operating point and are shown only when more than five misclassifications occur.
3.3.2 Reliability
The reliability of the assessments is evaluated in terms of intrarater and interrater reliability. Intrarater reliability describes the consistency of repeated judgements and is determined using 10 % blinded repetitions of the audio files. Interrater reliability reflects the agreement among all raters. As a measure of reliability, the Jaccard index is used, which is defined as the ratio of the number of common elements to the number of unique elements of the sets A and B:
The index specifically captures agreement in those cases where an event was positively identified. Accordingly, only minutes in which the respective category was classified as present are included in the calculation. For the reliability analysis, only categories relevant for subsequent validation are considered. A method identifying machine noise is not included in the framework, and thus, the category machine noise is excluded. In addition, the responses “uncertain” and “no response” are omitted from the analysis.
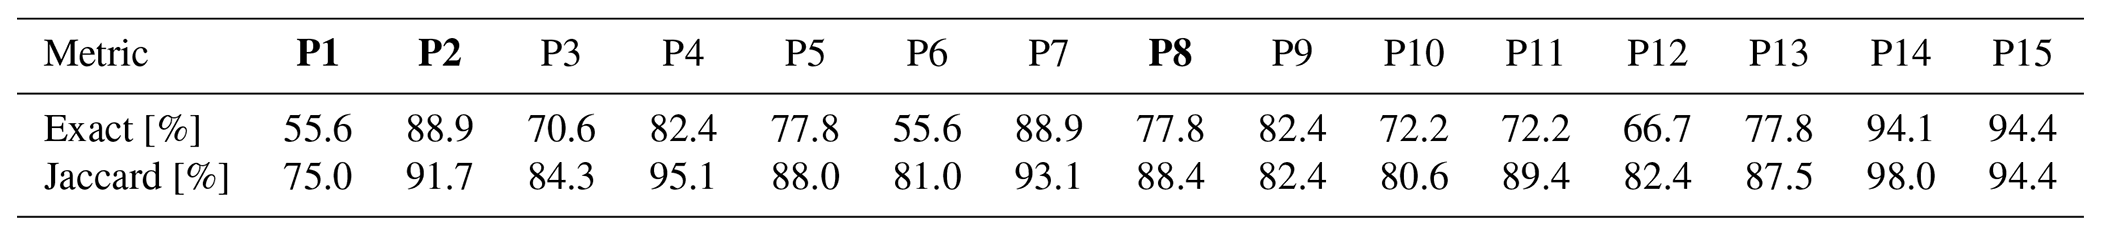
The calculated intrarater Jaccard values range between 0.75 and 0.98 (mean 0.87), indicating good to excellent repeatability across participants. The corresponding exact-match values, defined as the proportion of cases with complete agreement between repeated ratings, are slightly lower (0.56–0.94, mean 0.77). For the global consensus, the intrarater Jaccard value reaches 0.95, with an exact-match value of 0.88, demonstrating excellent internal consistency. The intrarater Jaccard and exact-match values for all participants are listed in the Appendix (Table A2).
For interrater reliability, the pairwise Jaccard index was computed for each noise category. The interrater reliability of a category is defined as the average Jaccard index calculated across all possible pairs of participants. The overall interrater Jaccard index across all relevant categories is 0.56, representing a moderate level of agreement. This comparatively low value reflects that individual categories were identified with varying degrees of accuracy, as illustrated by the category-specific interrater reliability in Fig. 5. The categories “WTN, rotor” (0.81) and “WTN, birds” (0.62) exhibit relatively high agreement and can therefore be identified with moderate reliability. In contrast, low agreement occurs for tonality (0.24), wind-induced noise (0.25), and other sources (0.04), indicating that these categories are subjective and difficult to assess. Moreover, the prevalence of these categories is low (e.g. nother source = 18; nwind-induced noise = 85) so that even a few disagreements disproportionately reduce the overlap, resulting in a lower Jaccard index. The category “no WTN” shows a medium interrater value (0.49). This unexpectedly moderate agreement is likewise a consequence of the small number of available segments (nNo WTN = 50) so that individual misclassification, illustrated in Fig. 4, has a comparatively strong impact on the resulting Jaccard value.
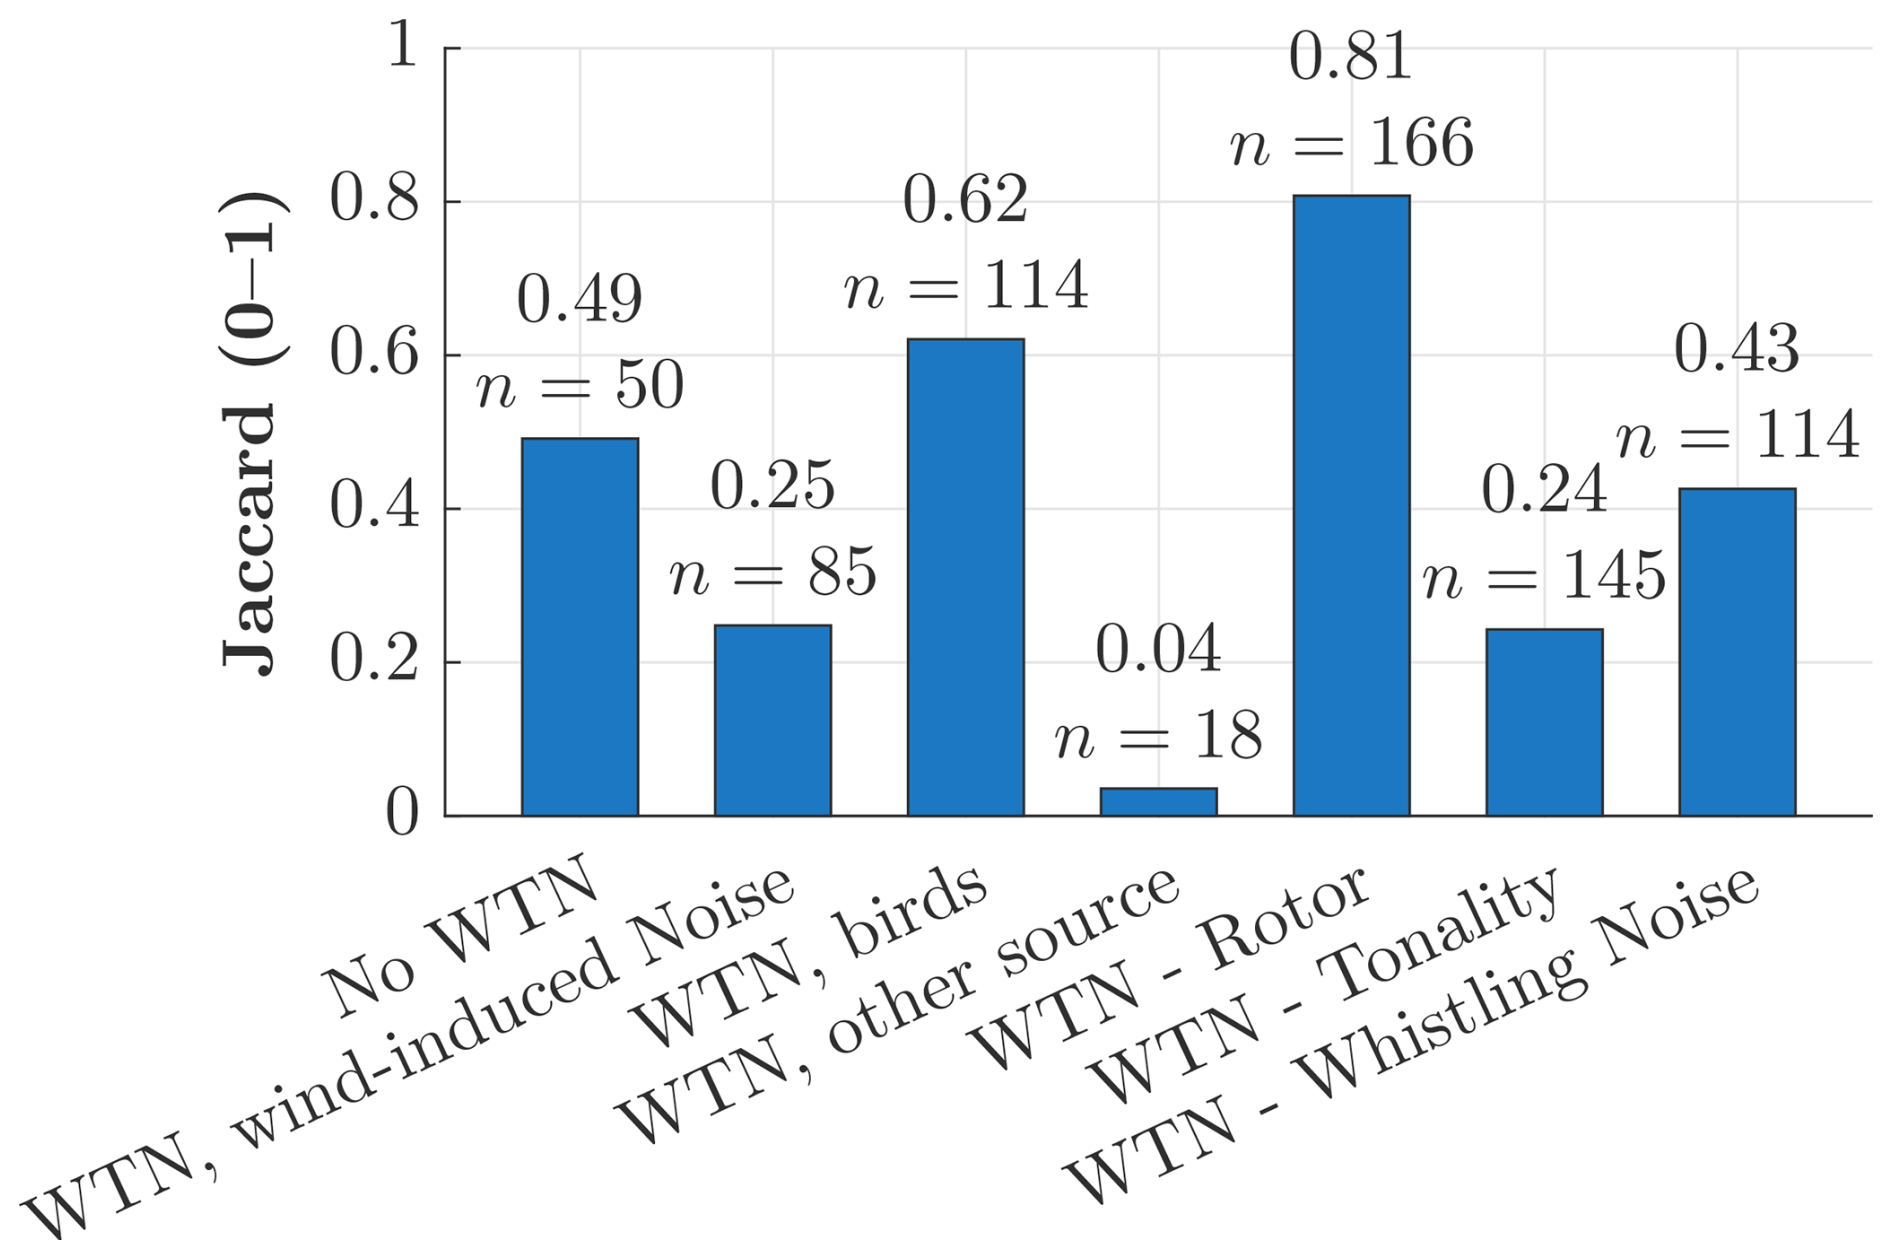
Figure 5Category-wise interrater reliability measured using the Jaccard index. n indicates the number of minutes that contained at least one positive rating for the respective category and thus contributed to the interrater reliability calculation.
The uncertainties associated with individual categories are addressed through the strict consensus rules, which aggregate the individual judgements into a more robust representation. The high intrarater reliability of the global consensus (Jaccard: 0.95) confirms the stabilizing effect of this aggregation approach.
The validation is performed on a 1 min basis by comparing the framework output with the listening-test reference. This comparison yields the numbers of true positives (TPs), false positives (FPs), false negatives (FNs), and true negatives (TNs). Based on these quantities, precision (TP (TP + FP)), recall (TP (TP + FN)), specificity (TN (TN + FP)), accuracy ((TP + TN) (TP + TN + FP + FN)), and the F1 score (2TP (2TP + FP + FN)) are calculated.
Within this validation, dominant WTN itself is evaluated first, followed by the assessment of individual acoustic components. In this context, it is important to note that the listening test did not explicitly distinguish between general WTN and AM. In the listening test, WTN was defined as periodic noise caused by the rotor blades, which perceptually corresponds to AM. However, according to the IOA reference method, AM is only classified as such if the prominence ratio exceeds a defined threshold (C>4). Since the listening test did not include a survey on the AM strength or an explicit evaluation of its significance, the algorithmic AM identification cannot be directly validated against the listening-test data. However, these aspects have already been investigated and validated in Nguyen et al. (2021). Therefore, the validation related to AM is restricted to the identification of dominant WTN at the first processing stage (Stage 1).
4.1 Validation of identifying dominant wind turbine noises (Stage 1)
To validate the results from Stage 1, i.e. the identification of dominant WTN, the minute-wise consensus label from the listening test for the category “WTN, rotor” is used as a reference classification.
A period of 10 min was classified as “uncertain” in the listening test and is excluded from validation, as there is no clear reference for these periods. Minutes labelled “no WTN” (label 2) are considered valid negative examples. Validation is performed on a minute-by-minute basis by comparing the algorithmic classification with the reference labels using standard classification performance metrics. The results are summarized in Table 2.
Table 2Validation results for dominant WTN detection using minute-wise consensus classifications from the listening test as reference.
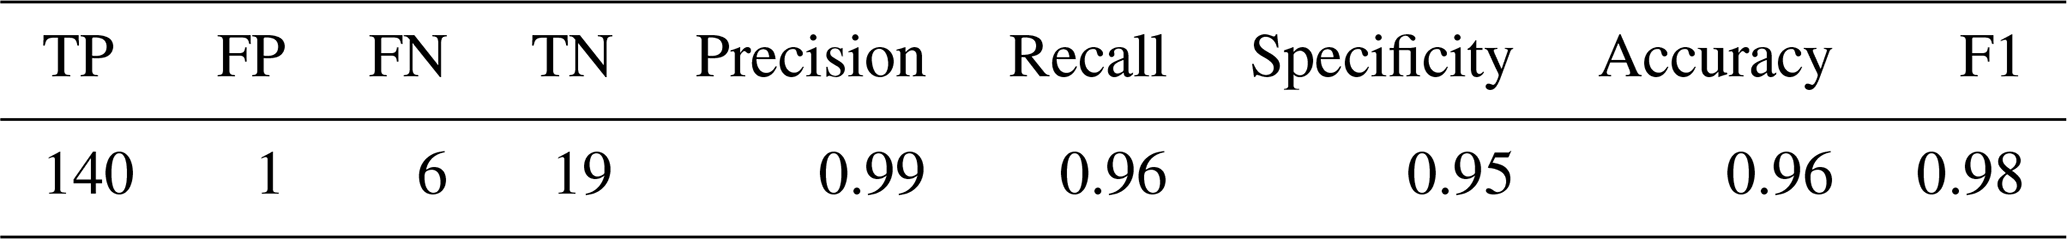
For the 166 valid minutes, the algorithmic classification and the listening test agree very well (TP: 140, TN: 19). The number of false positives is extremely low (FP: 1). This misclassification occurs at a low rotor speed of 7.99 rpm and was discussed as a special case in the plausibility check (Sect. 3.3.1, Fig. 4). A possible explanation is the limited temporal resolution of the available SCADA data, as short-term operating conditions cannot be captured by 10 min averages. Most misclassifications correspond to false negatives (FNs: 6). In three out of these six cases, the WTN occurs together with other noise categories, such as wind-induced noise and bird calls. From a methodological point of view, this behaviour is intended. The aim of Stage 1 is not to detect all perceptible WTN, but to identify acoustically dominant WTN. In situations with a high level of background noise, WTN is therefore intentionally not classified as dominant. The high precision (0.99) shows that a positive methodological classification nearly consistently corresponds to the perception of a WTN in the listening test. False positive decisions therefore only occur in exceptional cases. The recall (0.96) illustrates that the majority of actually perceived wind turbine noises are correctly identified, while the remaining false negatives occur primarily in acoustically complex situations. The high specificity (0.95) also confirms that time periods without WTN are reliably recognized as such.
In addition to a global decision on the dominance of WTN, Stage 1 provides a band-resolved assessment of whether WTN is identified as dominant in individual third-octave bands. As part of the validation, the following analysis examines whether this band-specific methodological assessment is consistent with the disturbing noises identified in the listening test. Since the listening test is not frequency resolved and does not provide an explicit assessment of individual third-octave bands, it cannot serve as direct reference for validating the band-specific results. Instead, it is used as an independent reference to contextually verify the Stage 1 results and assess their physical plausibility. Minutes are grouped according to the presence of specific interfering noise sources identified in the listening test, and the band-wise Stage 1 results are compared across these groups.
Wind-induced noise (category 3) and birds (category 4) are grouped exclusively in order to isolate the influence of a single source of interference. This means that only minutes in which both WTN and the respective interfering source were identified are included in the respective group. A strictly defined reference group (“pure WTN”) is constructed from minutes in which only WTN was identified and no additional disturbing noise was reported. This reference represents WTN under minimally disturbed acoustic conditions and enables a comparison with specific interference scenarios.
Figure 6 illustrates the results in terms of the proportion of non-detected third-octave bands, i.e. the fraction of bands in which Stage 1 does not classify WTN as dominant. The following results should not be understood as a major validation of the band-wise assessment, but rather as a supplementary plausibility and consistency check. For minutes with wind-induced noise (category 3, n = 7), an increase in band-wise non-validity is observed compared to the pure WTN reference (n=63). In the third-octave bands between 63 and 125 Hz, the proportion of non-detected minutes increases strongly, reaching differences of up to 0.85 in the 63 Hz band. The effect is also noticeable in higher third-octave bands (1000–2000 Hz). The resulting pattern indicates a systematic influence of wind-induced noise on the band-wise dominance assessment. Wind-induced noise can occur in both the low- and the high-frequency ranges, depending on its source. Wind-induced noise at the microphone primarily affects low frequencies, while wind-induced noise generated by vegetation can contribute to higher-frequency components.
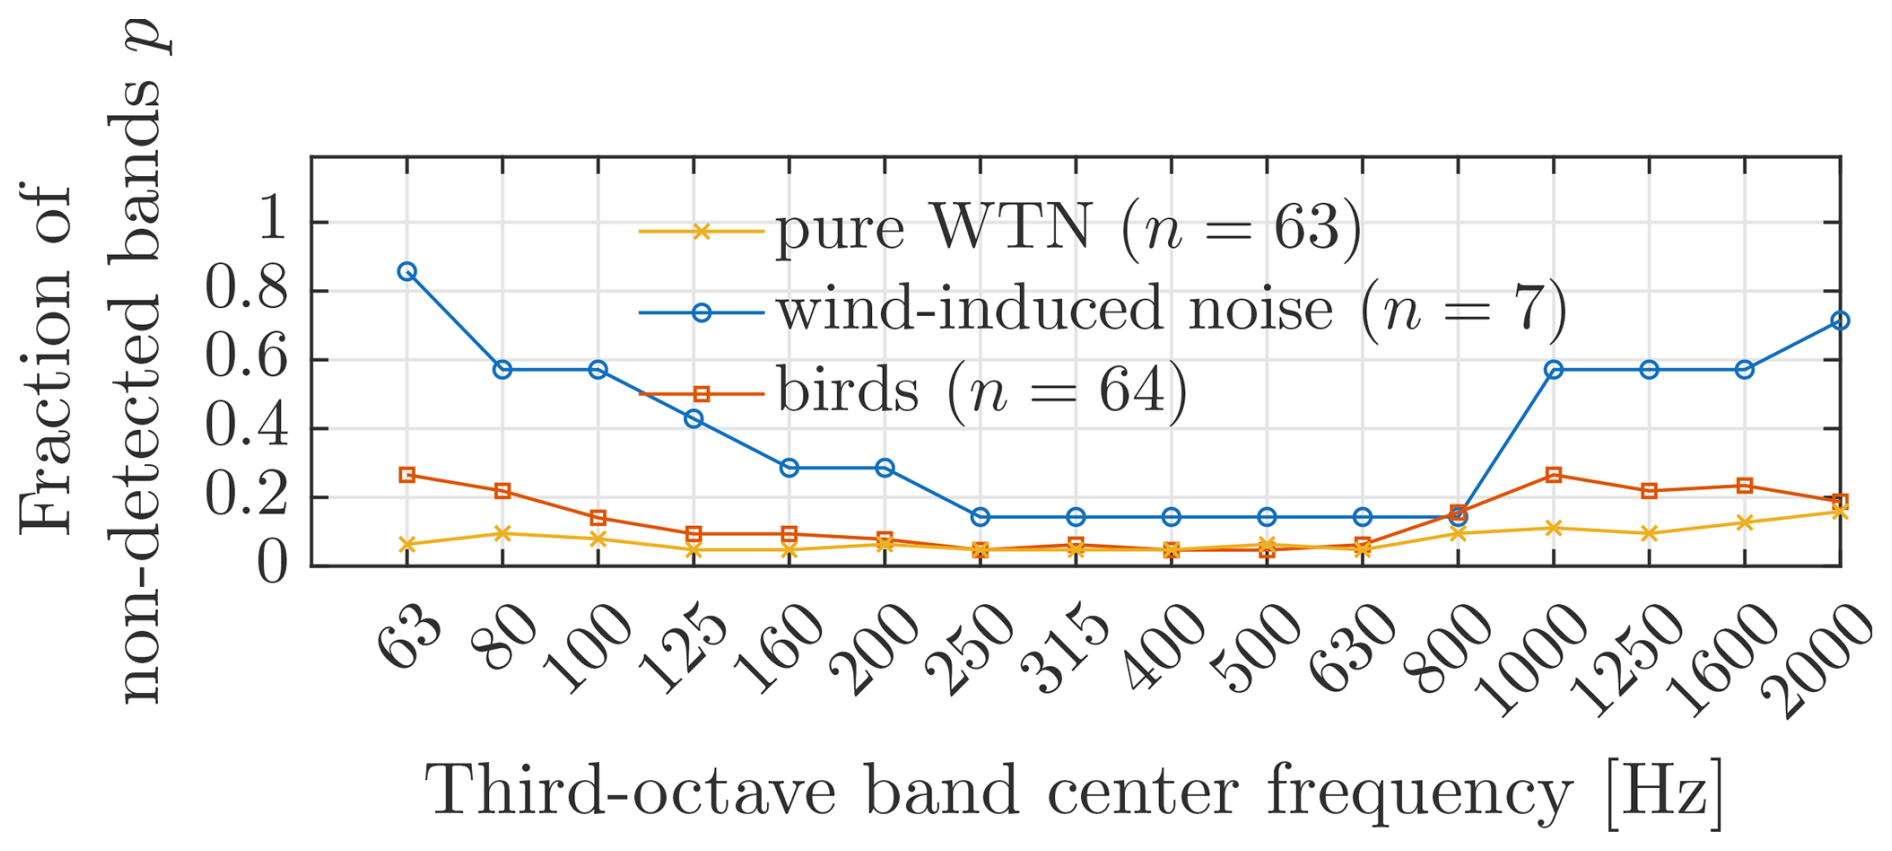
Figure 6Band-by-band analysis of Stage 1 dominance assessment for pure WTN (reference), wind-induced noise (category 3), and birds (category 4). The figure shows the proportion of non-detected third-octave bands.
For bird sounds (category 4, n = 64), the effects are considerably weaker than for wind-induced noise. Although the band-wise non-detection is generally higher than in the pure WTN reference, no pronounced frequency-specific pattern is observed. Deviations occur in both low and high third-octave bands, but their magnitude remains well below that observed for wind-induced noise. Since bird calls predominantly occur at frequencies above approximately 2 kHz, no exclusively high-frequency pattern is discernible in the present analysis. However, the presence of deviations in both low- and high-frequency bands during bird-dominated minutes indicates that additional low-frequency components contribute to the observed non-detection. These findings suggest that weak low-frequency wind-induced noise components are not always classified in the listening test. Particularly when they are weak, such components can apparently be perceived as part of the WTN or overheard. In this context, it can also be assumed that even in the reference minutes (pure WTN), residual low-frequency noise components may be present but are not perceived as independent noise.
4.2 Validation of identifying whistling noise (Stage 2)
As in the previous validation steps, the minute-wise consensus classification from the listening test is used as a reference classification for validating the detection of whistling noise. Validation is performed on a minute-by-minute basis. With respect to the methodological results, only the 2000 Hz third-octave band is considered for validation.
Below 1600 Hz, no whistling noise was detected by the framework during the listening-test periods. Although individual detections occur in the 1600 Hz band, these are predominantly observed concurrently with detections at 2000 Hz. In addition, the corresponding C values at 1600 Hz are usually only slightly above the threshold value (C = 4), while the 2000 Hz band shows higher C values. Consequently, whistling noise detection is validated exclusively for the 2000 Hz band.
The validation results, expressed in terms of derived classification metrics, are summarized in Table 3. In the listening test, 59 out of 166 min was rated as whistling noise by consensus. Using the proposed method, whistling noise was detected in 31 out of 166 min. The validation results show a high precision of 0.78, indicating that the detections are generally correct. The recall is in a lower range of 0.42.
Table 3Validation results for whistling noise detection using minute-wise consensus classifications from the listening test as reference.

Of the 59 min classified as whistling noise in the listening test, 35 min is not detected by the method (FN: 35). A detailed analysis of these false negatives shows that 4 min is already excluded in Stage 1 because no dominant WTN is identified. In 2 additional minutes, Stage 1 is fulfilled, but no dominant WTN is detected in the 2000 Hz band. In 10 min, the single-blade frequency p1 is not among the four strongest modulation frequencies determined in Stage 2. In the remaining 18 min, both Stage 1 and the p1 condition are satisfied, but the prominence ratio remains below the defined threshold (C<4).
A total of 7 min is incorrectly classified as positive (FP: 7), which corresponds to 4.0 % of all listening-test minutes or 21.9 % of the method-detected whistling noise events. Further analysis of the false positive data shows a clear correlation with the listening category “birds”. While this category accounts for 45 % of the total data set, it is likely overrepresented in the false positives at 71 %. In 5 of the 7 false positive minutes, bird song was clearly annotated. Due to the high-frequency spectral content of bird vocalizations, perceptual discrimination between bird sounds and whistling noise can be challenging. Re-listening to these minutes confirms this statement. In the remaining 2 false positive minutes, whistling noise is only weakly perceptible. Further investigations showed no consistent correlation with the prominence ratio C or other hearing categories.
4.3 Validation of identifying tonalities (Stage 2)
The detection of tonal components based on IEC 61400-11 can be validated directly using the minute-wise consensus classification of listening-test category 7 (“WTN – tonality”), which serves as the reference classification in the following analysis. It should be noted that the listening test did not include an explicit assessment of tonal frequencies or audibility levels. Instead, tonality was evaluated as binary, i.e. with respect to its presence or absence. The validation results are summarized in Table 4. A total of 17 out of 166 min (i.e. 10.2 %) was rated as tonal in the listening test. Thus, the reference data set is comparatively low.
Table 4Validation results of the audible tonality detection using minute-wise consensus classifications from the listening test as reference.
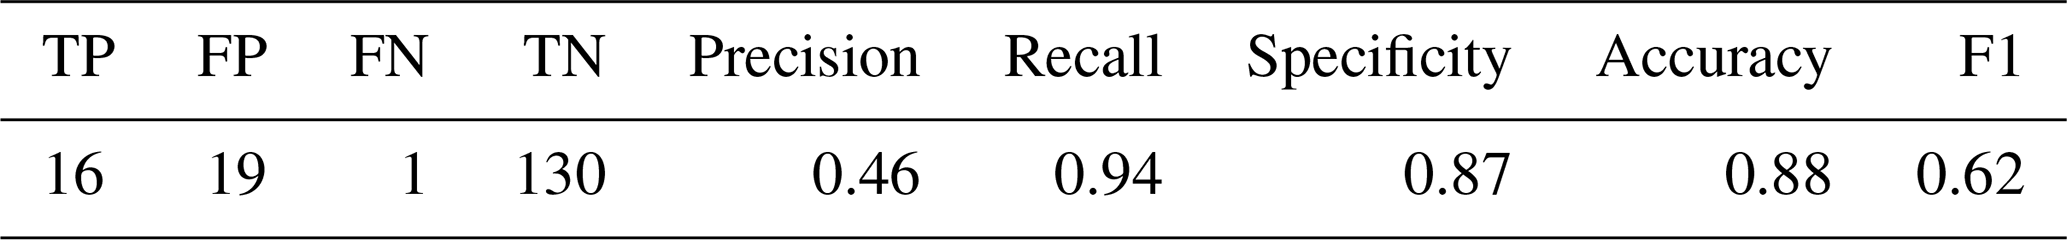
Out of the 17 min classified as tonal in the listening test, 16 min is correctly identified by the method, resulting in a high recall of 0.94. This indicates that almost all perceptually identified tonal events are detected by the algorithm. At the same time, the majority of minutes not classified as tonal in the listening test are correctly recognized as non-tonal (TN: 130), corresponding to a specificity of 0.87. However, tonal components are detected methodologically in 19 min that was not classified as tonal in the listening test, resulting in a moderate precision of 0.46.
In the only false negative minute, tonal components are detected in the third-octave bands with centre frequencies of 250 and 500 Hz. The corresponding frequency-corrected audibility values are dB (250 Hz) and dB (500 Hz). While the value at 500 Hz lies close to the audibility threshold of −3 dB, the value at 250 Hz is clearly below this threshold. Re-listening to this minute showed that the tonal components are only marginally perceptible, indicating a borderline perceptual case. With 19 min, the number of false positives is significantly higher so that correlations between tonality detection, detected sound frequencies, and environmental and perception conditions are considered. In 12 of these minutes, tonal components are detected in the low-frequency range (3 min at fc=63 Hz, 6 min at fc=80 Hz, and 1 min at fc=100 Hz). The majority of these detected tones have frequency-corrected audibility values close to the audibility threshold (dLA between −3 and 3 dB) and are therefore only weakly audible. One exception is a single event in the 80 Hz third-octave band with a high audibility value of dLA=12.66 dB. It is therefore plausible that low-frequency tonal components with low to moderate audibility were not consistently recognized by the participants in the listening test. In this frequency range, wind-induced noise cannot be excluded as a confounding factor. Furthermore, bird sounds occur frequently in the false positive minutes, indicating context-dependent perception by the test persons.
In the mid- and high-frequency third-octave bands (fc=250 Hz: 3 FP, fc=400 Hz: 1 FP, fc=500 Hz: 5 FP), false positives occur almost exclusively near the audibility threshold. The detected tonal components are therefore not sufficiently audible to be classified as dominant tonality by the majority of test participants in the listening test. In these cases, the low audibility provides a plausible explanation for the discrepancy between algorithmic detection and listening-test classification.
The false positives observed can be interpreted less as a shortcoming of the method and more as a consequence of the subjective and context-dependent evaluation in the listening test. The method evaluates tonality strictly according to physical-psychoacoustic criteria, whereas the listening test reflects a dominance-based perceptual decision in the presence of competing sound sources. The reliability analyses in Sect. 3.3.2 already showed that tonality exhibits comparatively low interrater consistency. To conclude, the deviations can primarily be explained by perception effects.
The proposed two-stage framework was applied to the 1-month data set described in Sect. 2. The framework outputs, i.e. the identified WTN and its specific components, are first analysed in terms of detection rates, including their dependence on turbine operating conditions and environmental parameters.
In this subsection, statistics of the individual methodological steps are presented, and the detection rates of dominant WTN and source-specific noise components are discussed. Furthermore, detection results are analysed in relation to environmental conditions and turbine operating parameters.
The results of Stage 1, i.e. the identification of time periods dominated by WTN, and the results of the subsequent Stage 2, i.e. the detection of specific wind turbine noise (WTN) components, are evaluated. For Stage 2, amplitude modulation (AM) and tonal components are considered. Whistling noise is not analysed further, as in the present measurement campaign it was attributable to temporary contamination of drainage holes and is therefore not linked to turbine operating parameters.
5.1 Statistic of Stage 1
The amount of available data and the percentage of minutes excluded in each step of Stage 1 are summarized in Table 5. Initially, 17.29 % of the measurement data exhibit incomplete recordings, with parts of the acoustic time series missing. These minutes are excluded from further analysis.
Table 5Data reduction across the individual methodological steps in Stage 1. Shown are the number of minutes entering each step, the number of minutes excluded, and the relative share with respect to the input of the respective step.
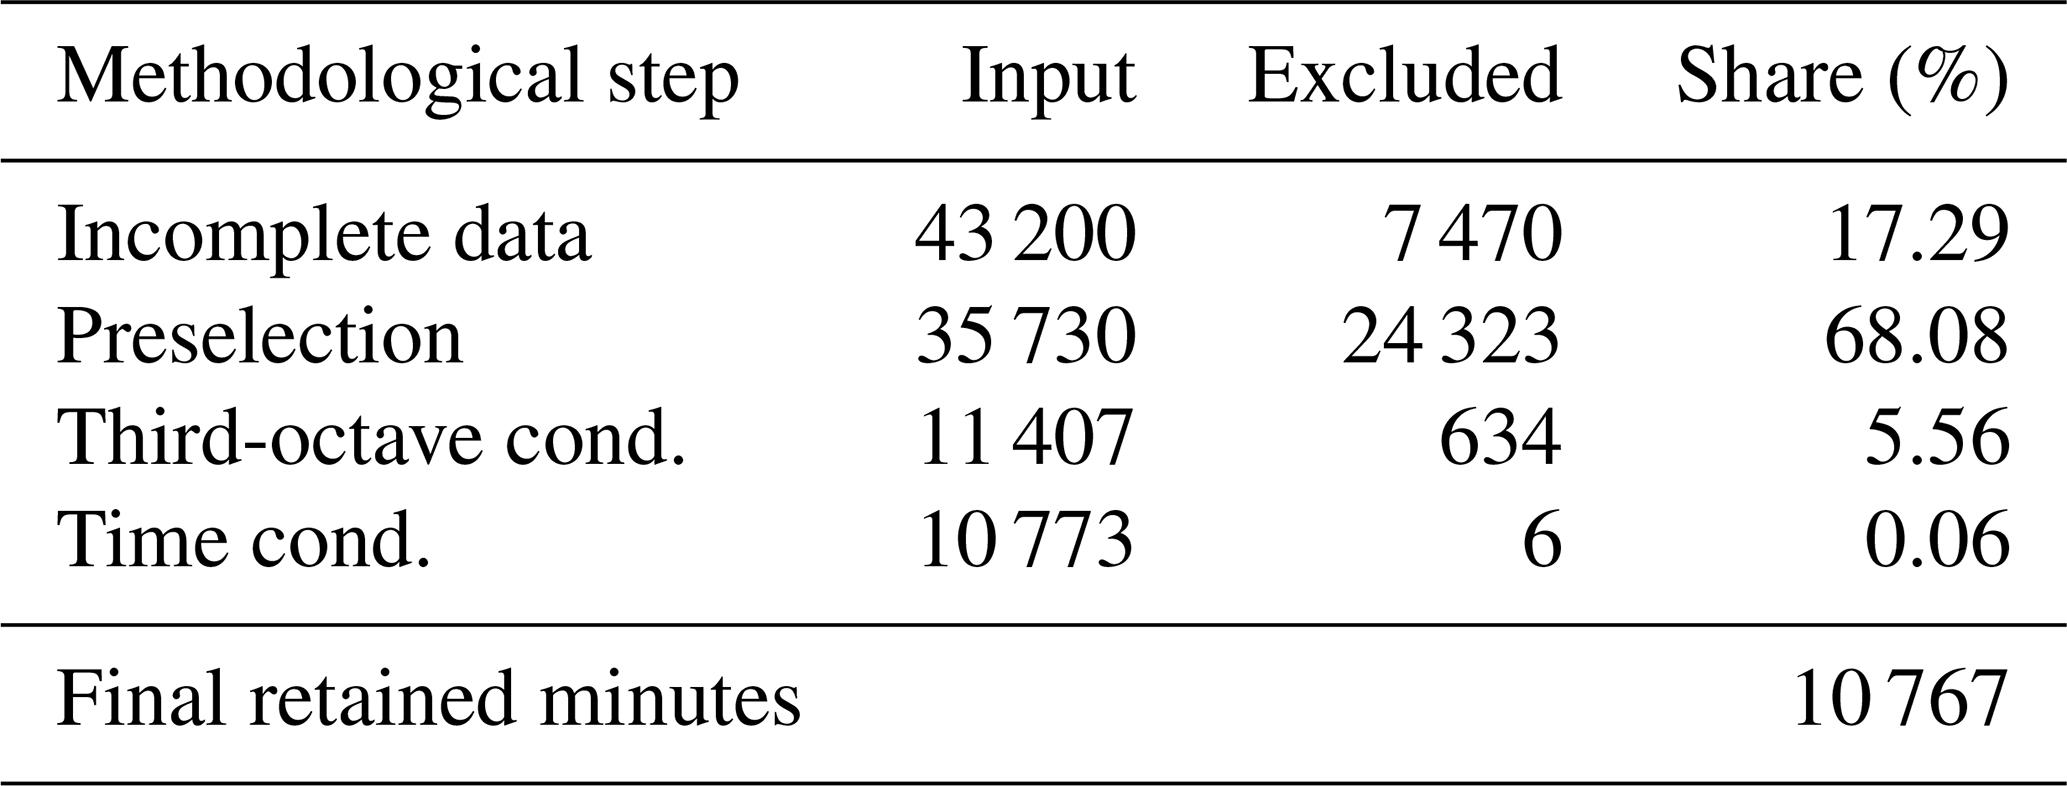
Preselection has by far the largest impact on data reduction. After applying this step, 11 407 min remains, corresponding to 26.4 % of the initially available 43 200 min. A major reason for this high exclusion rate is the requirement that neighbouring wind turbines must be inactive to enable the evaluation of an individual turbine. These results demonstrate that preselection is an effective filtering step, removing a large fraction of data that is unlikely to contain dominant noise from one WT prior to the computationally intensive signal analysis. As a result, only time periods with potentially dominant WTN are considered in the subsequent, significantly more complex analysis steps. Compared to preselection, the signal pattern conditions applied in Stage 1 have a smaller impact on further data reduction. The combined application of the harmonic pattern and spectral occurrence conditions results in the exclusion of only 634 additional minutes, corresponding to 5.56 % of the initially data. With only 6 min excluded, the temporal occurrence condition has a negligible impact on the data set considered here. In total, dominant noise from the wind turbine under investigation is detected in 10 767 of 43 200 min, corresponding to 24.9 % of the total measurement time.
The detection rates for the individual third-octave bands, based on the 10 767 WTN-dominated minutes, are shown in Fig. 7. The detection rate exhibits a frequency dependence, with a pronounced maximum in the mid-frequency range and a decrease towards both lower and higher third-octave bands. The reduced detection rate in the 63 Hz third-octave band (detection rate of 0.75) is due to wind-induced noise at the microphone. A decreasing detection rate is also observed at frequencies above 1 kHz. This is primarily attributed to wind-induced vegetation noise in the vicinity of the measurement position. Due to the relatively short distance of 178 m between the microphone and the wind turbine, atmospheric absorption is expected to have only a minor influence overall. Under standard conditions (20 °C, 50 % relative humidity), attenuation at 2 kHz is about 1.4 dB per 100 m. Atmospheric absorption may reduce the detection at 2 kHz, while its effect is not pronounced at lower frequencies. However, at greater propagation distances and across a wider range of atmospheric conditions, particularly under low humidity and higher temperatures, atmospheric absorption becomes more significant.
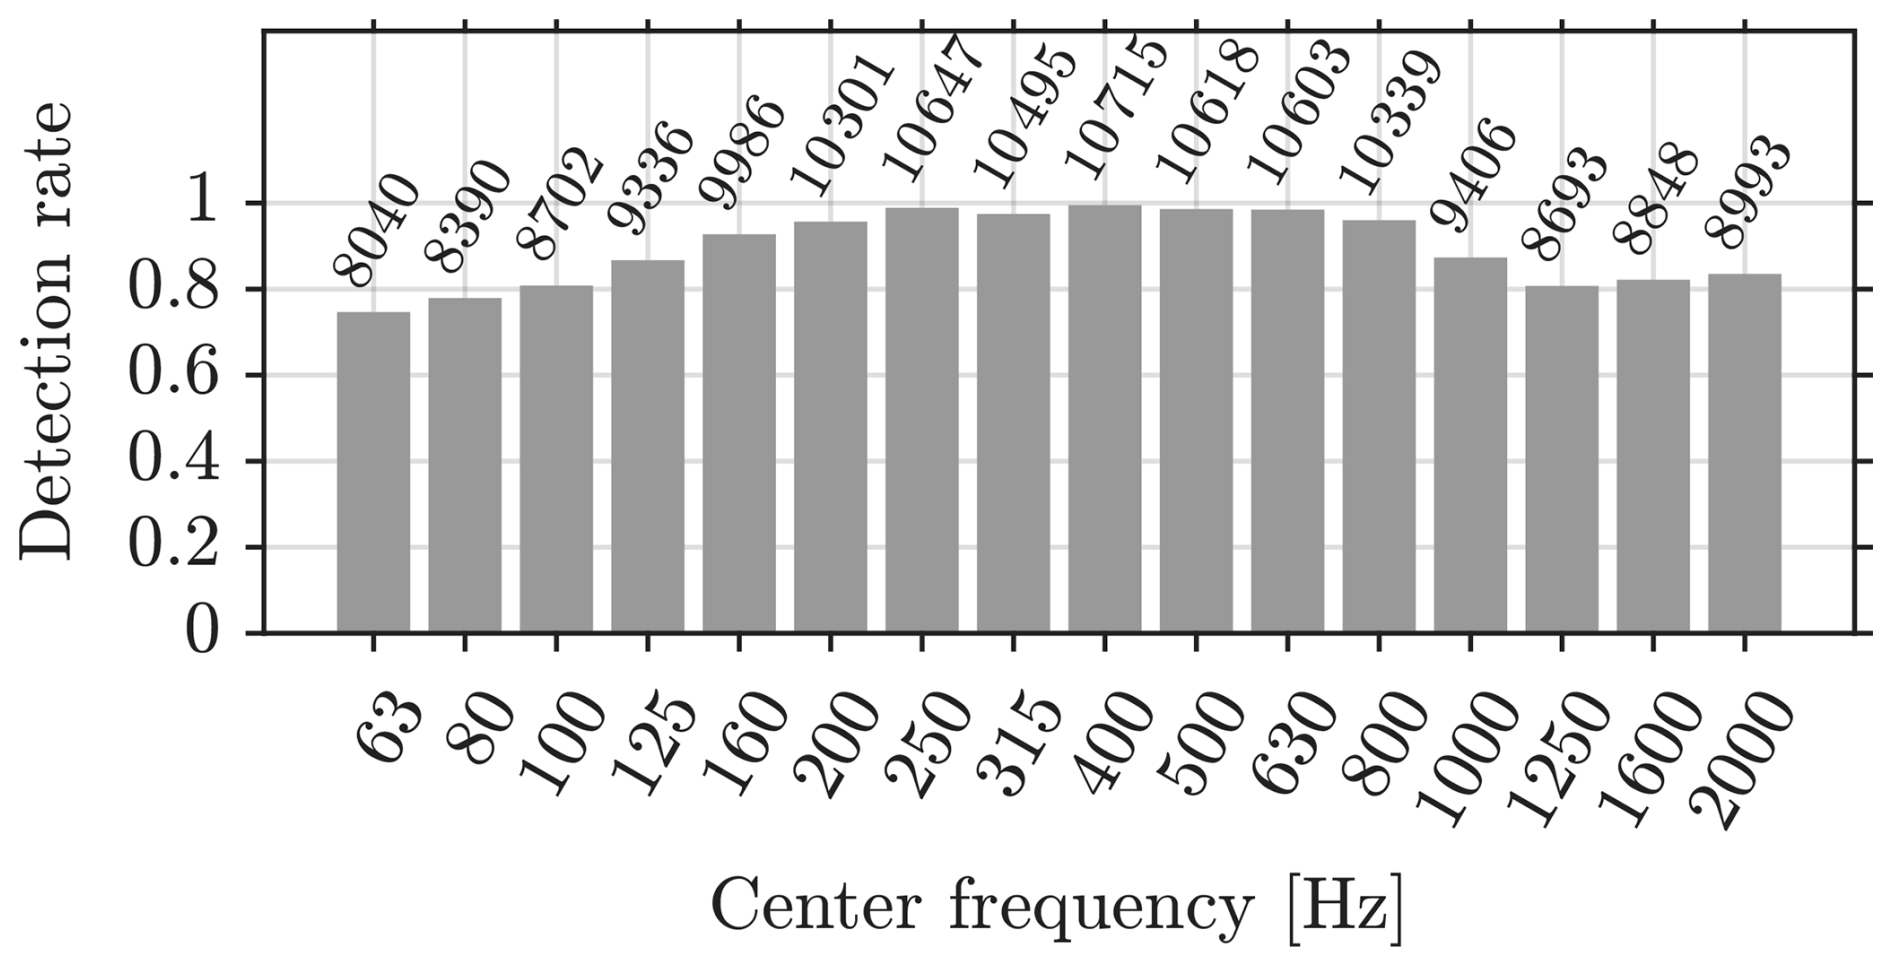
Figure 7Detection rate per one-third-octave band. The number of valid minutes with dominated WTN is written above the bars.
The highest detection rates, ranging from 0.96 to 0.995, occur in the mid-frequency third-octave bands between 200 and 800 Hz. This frequency range corresponds to the A-weighted dominant range of wind turbine emissions. It should also be noted that, due to the spectral occurrence condition applied, only minutes in which at least five of seven third-octave bands between 200 and 800 Hz show a simultaneous detection are classified as WTN.
The Stage 1 detection results are subsequently analysed with respect to environmental and turbine operating conditions, namely rotor speed, wind speed, propagation direction, and atmospheric stability. The corresponding detection rates are shown in Fig. 8 and are defined as the fraction of minutes classified as wind turbine noise dominant relative to the total number of available minutes in the respective class, considering only periods in which the turbine under investigation is operating while all other turbines are inactive. The detection rate increases as the rotor rotational speed increases. This behaviour is physically plausible due to increasing emission levels with rotor speed and hence higher signal-to-noise ratio. Regarding wind speed, the detection rate exhibits a maximum in the range of approximately 7–11 m s−1. At lower wind speeds, rotor speeds are reduced, leading to lower detection rates, consistent with the correlation described above. At higher wind speeds, however, the detection rate decreases significantly, which is consistent with increasing wind-induced noise and enhanced masking of wind turbine sound. Furthermore, the detection rate increases with greater atmospheric stability. This is also physically plausible, as stable stratification is associated with less atmospheric turbulence and usually occurs at night. As a result, background noise is lower. With respect to the propagation direction, lower detection rates in downwind conditions are consistent with reduced AM characteristics reported in Okada et al. (2019). Since the method used here is based on the correlation between the BPF and detected harmonics, and thus evaluates an AM-consistent feature, a possible explanation for the reduced detection rate is a lower incidence of amplitude-modulated characteristics in the downwind direction.
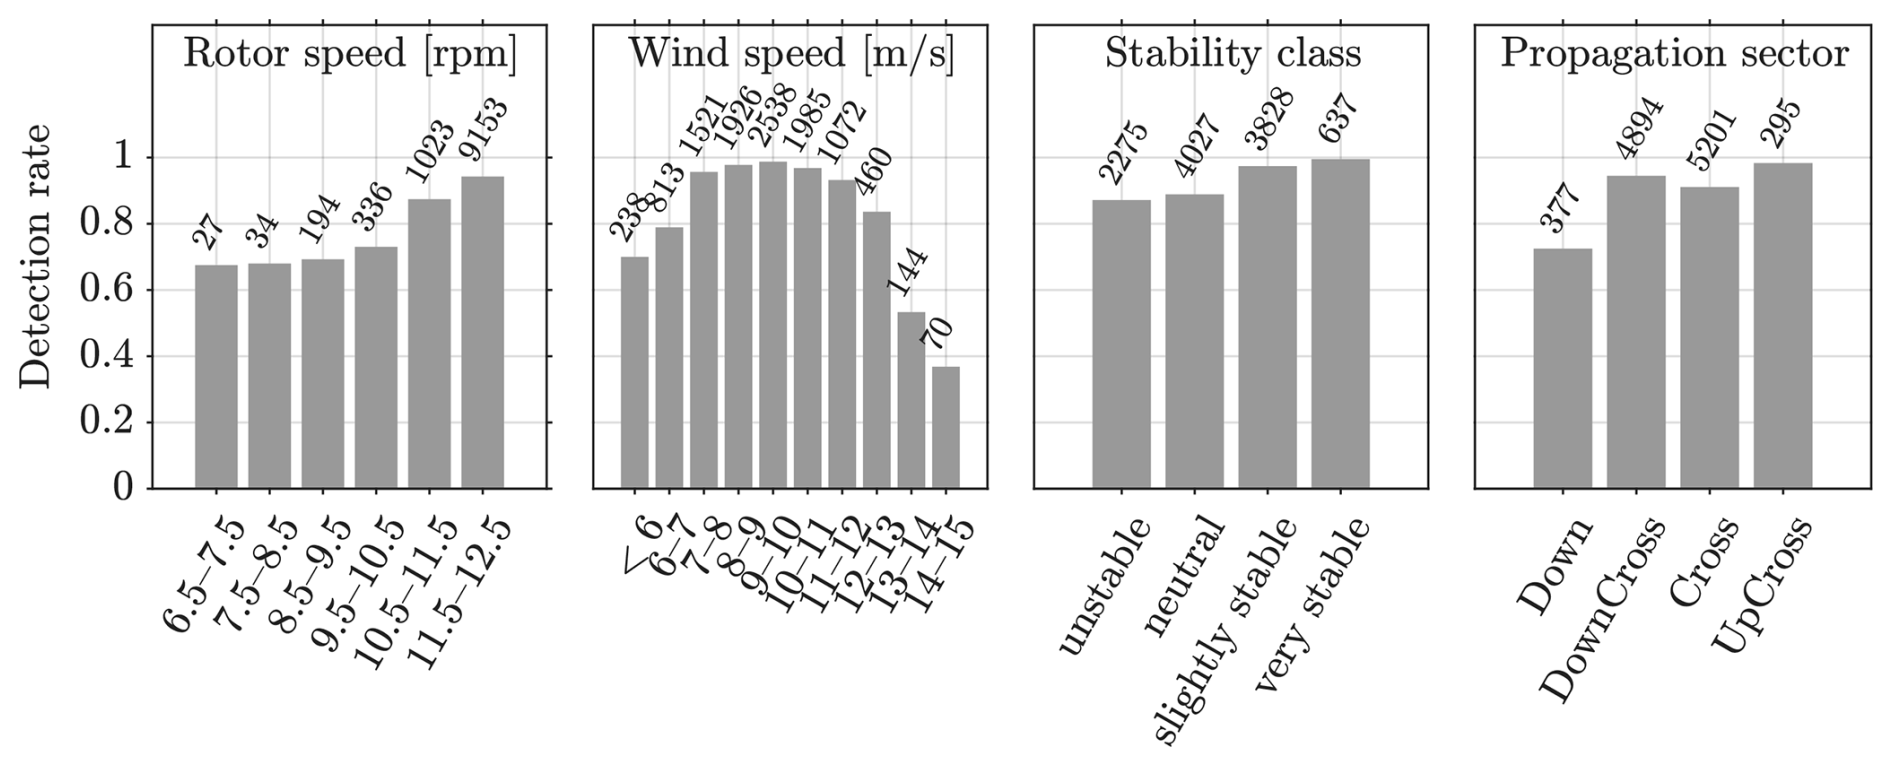
Figure 8Detection rate as a function of rotor speed, wind speed, atmospheric stability, and propagation direction. The number of detected minutes with dominated WTN is written above the bars.
5.2 Statistic of Stage 2
5.2.1 Amplitude modulation
Since the measuring point is located in the near field of the wind turbine (178 m), it is assumed that predominantly source-related NAM is detected, which typically occurs in mid-frequency bands. Figure 9 shows the detection rate, referenced to the number of third-octave bands classified as WTN dominated, together with the mean prominence ratio for each third-octave band. Both parameters show their maximum in the mid-frequency range (approximately 160–800 Hz). The global maximum occurs at 400 Hz, with a detection rate of about 79 % and a mean prominence ratio of . As expected, low (<160 Hz) and higher (>800 Hz) third-octave bands show reduced detection rates and, in most cases, lower prominence ratio values. At 63 and 80 Hz, a prominence ratio of approximately 6.5 is calculated, which is relatively high for low frequencies. One plausible explanation is the presence of amplitude-modulated tonal components. A specific cause could not be identified within the scope of this study. However, the observed frequency dependence of NAM detection supports the IOA-recommended focus on the mid-frequency range for the evaluation of NAM in near-field conditions.
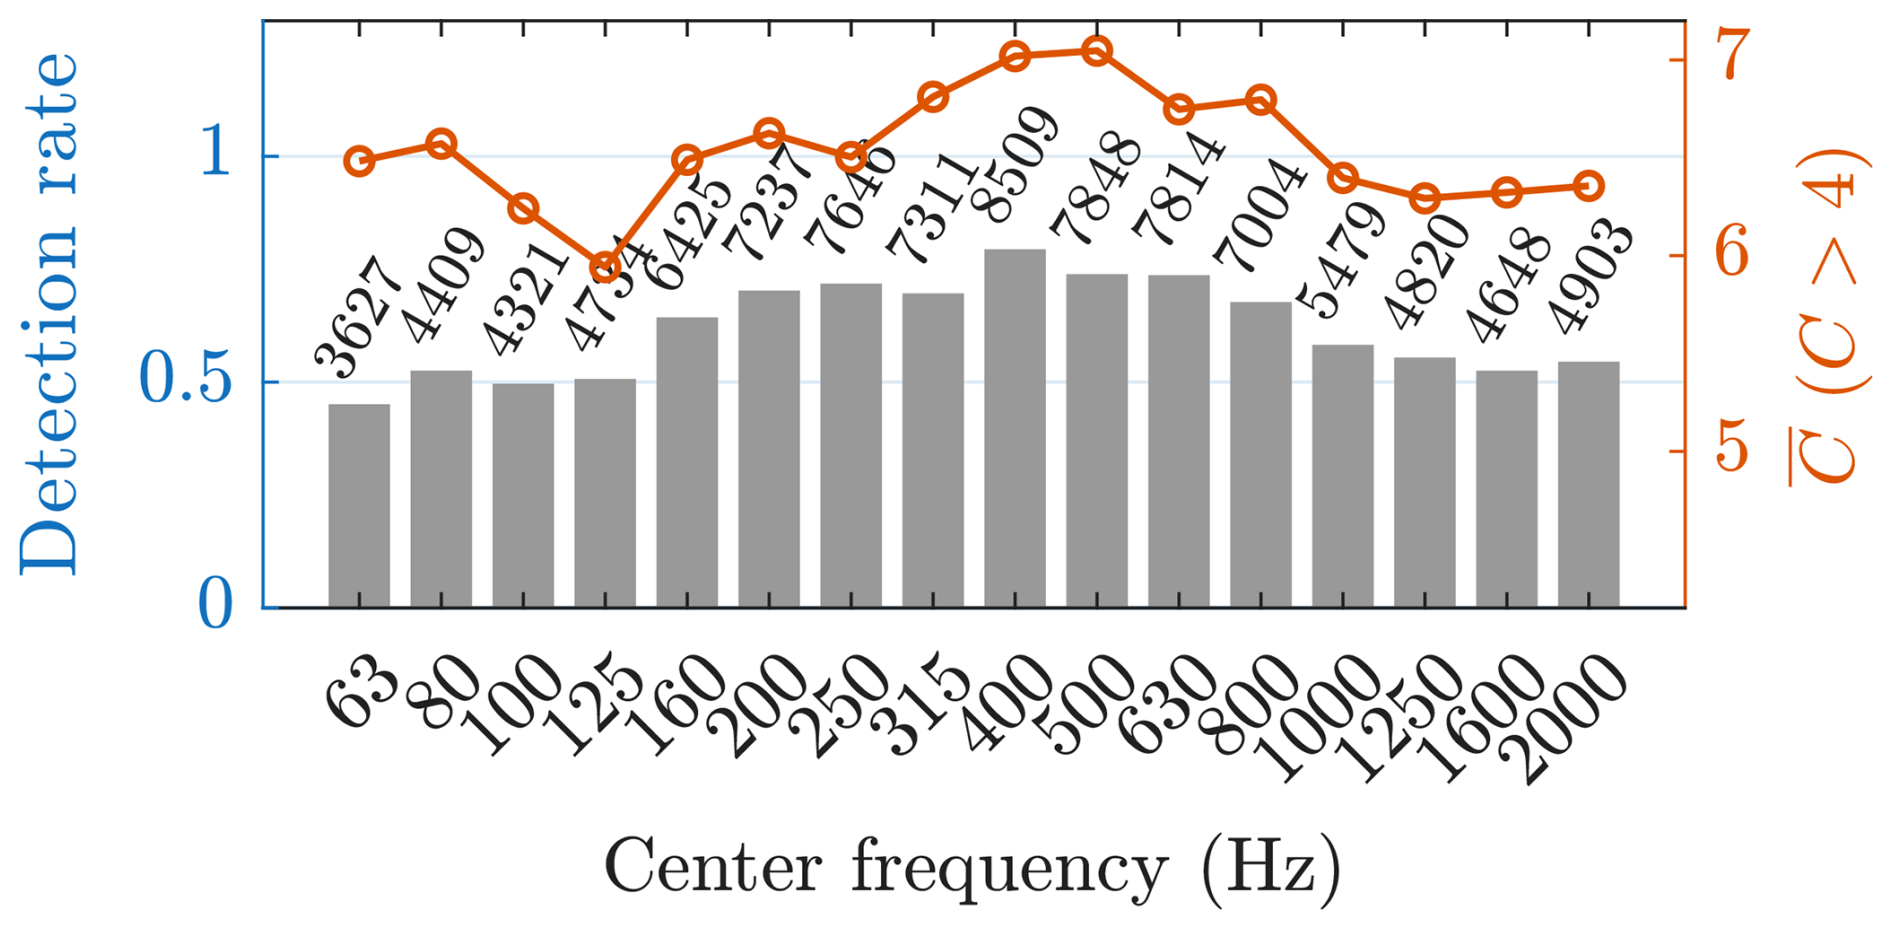
Figure 9Detection rate per third-octave band referenced to band-valid minutes (bars, left axis). The line indicates the mean prominence ratio , calculated for C>4 using band-valid samples (right axis). Numbers above the bars denote the number of valid samples per band.
The dependencies between AM occurrence and operating and propagation parameters reported in the literature are largely consistent with the present results. Figure 10 illustrates the detection rate of AM as a function of rotor speed, wind speed, propagation direction, and atmospheric stability, resolved for selected third-octave bands. As rotor speed and wind speed increase, the detection rate increases across all third-octave bands. The highest detection probabilities are observed at medium to high wind speeds (approximately 7–10 m s−1), whereas at very high wind speeds the detection rate decreases again. Notably, the 2000 Hz third-octave band shows increased detection probabilities despite overall declining rates. This indicates the presence of additional high-frequency noise components, such as whistling noise, which cannot be attributed to the typical AM spectrum. Moreover, the detection rate increases with increasing atmospheric stability, with slightly and very stable conditions showing the highest values. The relative propagation direction is also decisive for the detection rate. Downwind directions showed comparatively low detection rates, whereas the highest rates occurred under oblique upwind (upcross) conditions. This agrees with previous studies from Okada et al. (2019) reporting maximum AM levels at approximately 60° relative to the nacelle direction, i.e. under oblique upwind propagation. For upwind conditions, no reliable conclusions can be drawn since no valid samples were identified.
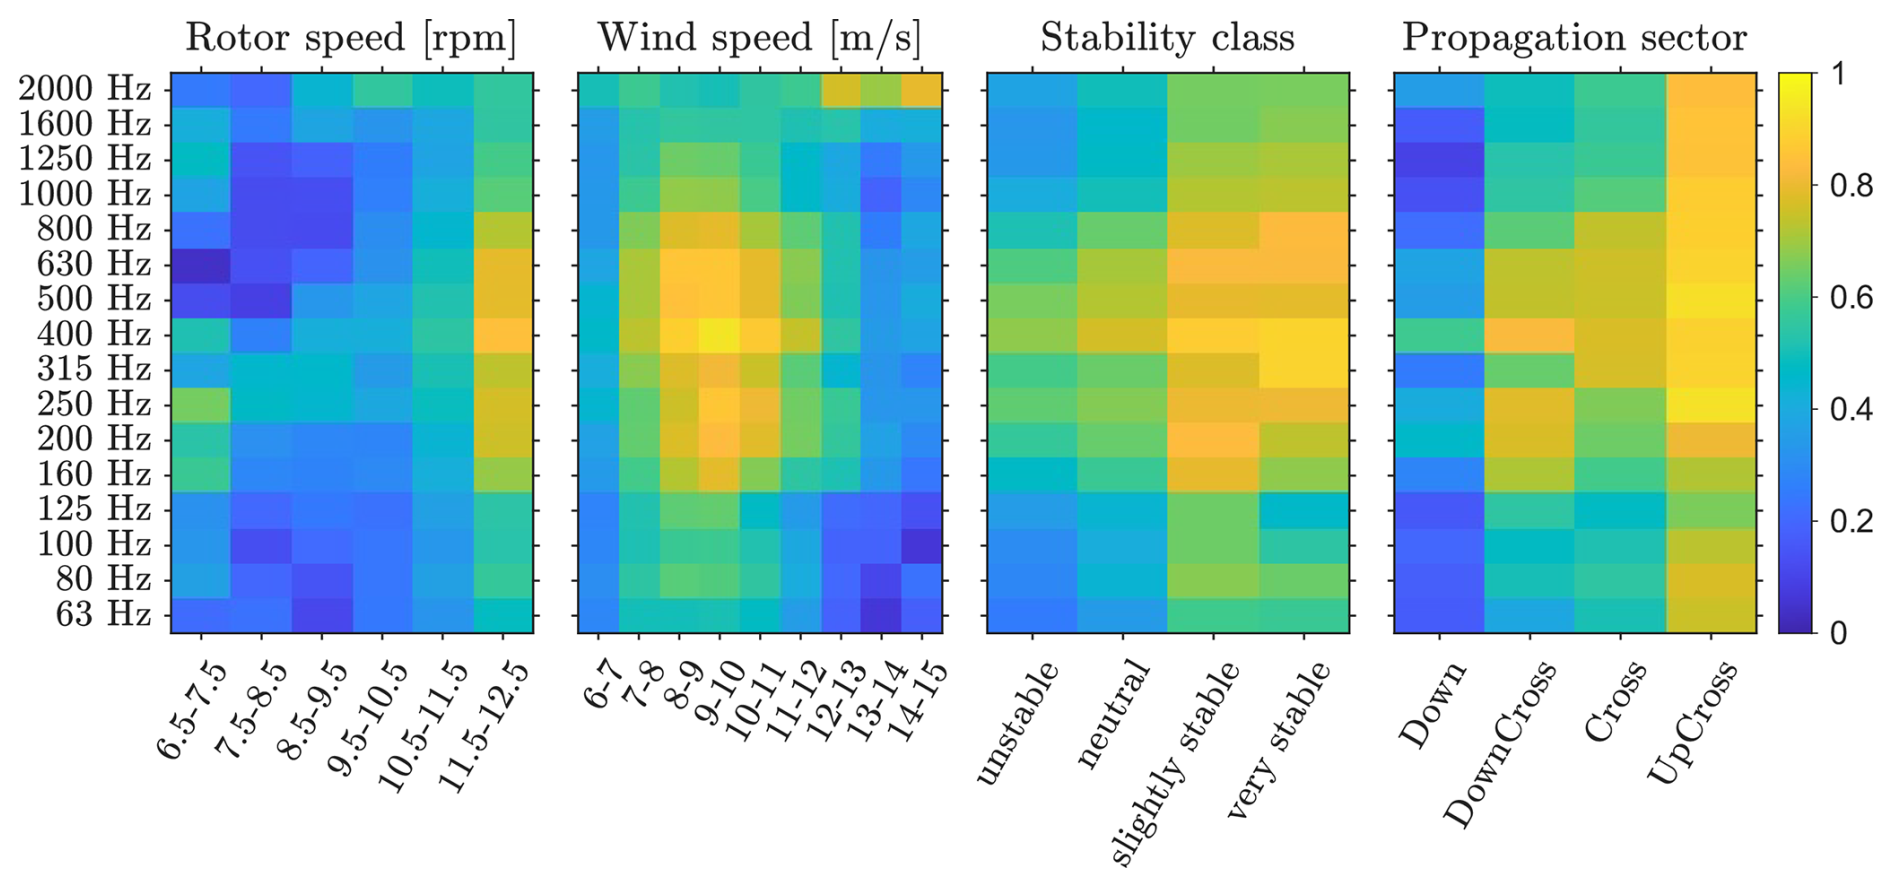
Figure 10Detection rate of NAM as a function of environmental and operational parameters. Heatmaps show the detection rate per third-octave band for rotor speed, wind speed, atmospheric stability, and propagation sector. Detection rates are referenced to band-valid minutes in the respective categories. The colour scale for the detection rate is identical for all panels.
No concrete correlation between prominence ratio and the investigated parameters was identified. Only atmospheric stability showed a weak tendency but no pronounced dependence. Here, the prominence ratio increased slightly with increasing atmospheric stability.
5.2.2 Tonal components
A total of 4989 audible tone events were detected in 10 767 WTN-dominated minutes, with 4583 min (≈43 %) containing at least one tone event. The detected sound frequencies range from 65 to 1990 Hz and show a pronounced clustering in a few discrete frequency bands. At rotational speeds higher than 11 rpm, three dominant frequency groups can be clearly identified at approximately 60, 240, and 520 Hz, with the group around 520 Hz contributing the majority of tonal events (approximately 79 %). Overall, approximately 96 % of all detected tonal events can be clearly assigned to one of these three frequency groups.
In Fig. 11, the detected tone frequencies are shown as a function of gearbox speed for rotor speeds above 11 rpm. Here, the dominant frequency groups (60, 240, and 520 Hz) are highlighted. For this operating range, the tonal frequencies appear to cluster around values that are approximately proportional to the fundamental gearbox rotation frequency , where ngear denotes the gearbox rotational speed in revolutions per minute. For rotor speeds above 11 rpm, the average value is Hz. The dominant tonal frequencies are observed at approximately 60, 240, and 520 Hz, which corresponds approximately to the 3rd, 12th, and 26th orders of the fundamental gearbox frequency. This proportional relationship suggests a harmonic structure and indicates a mechanical origin of the induced tonal components within the wind turbine drivetrain. However, a detailed investigation of the underlying excitation mechanisms was beyond the scope of the present study.
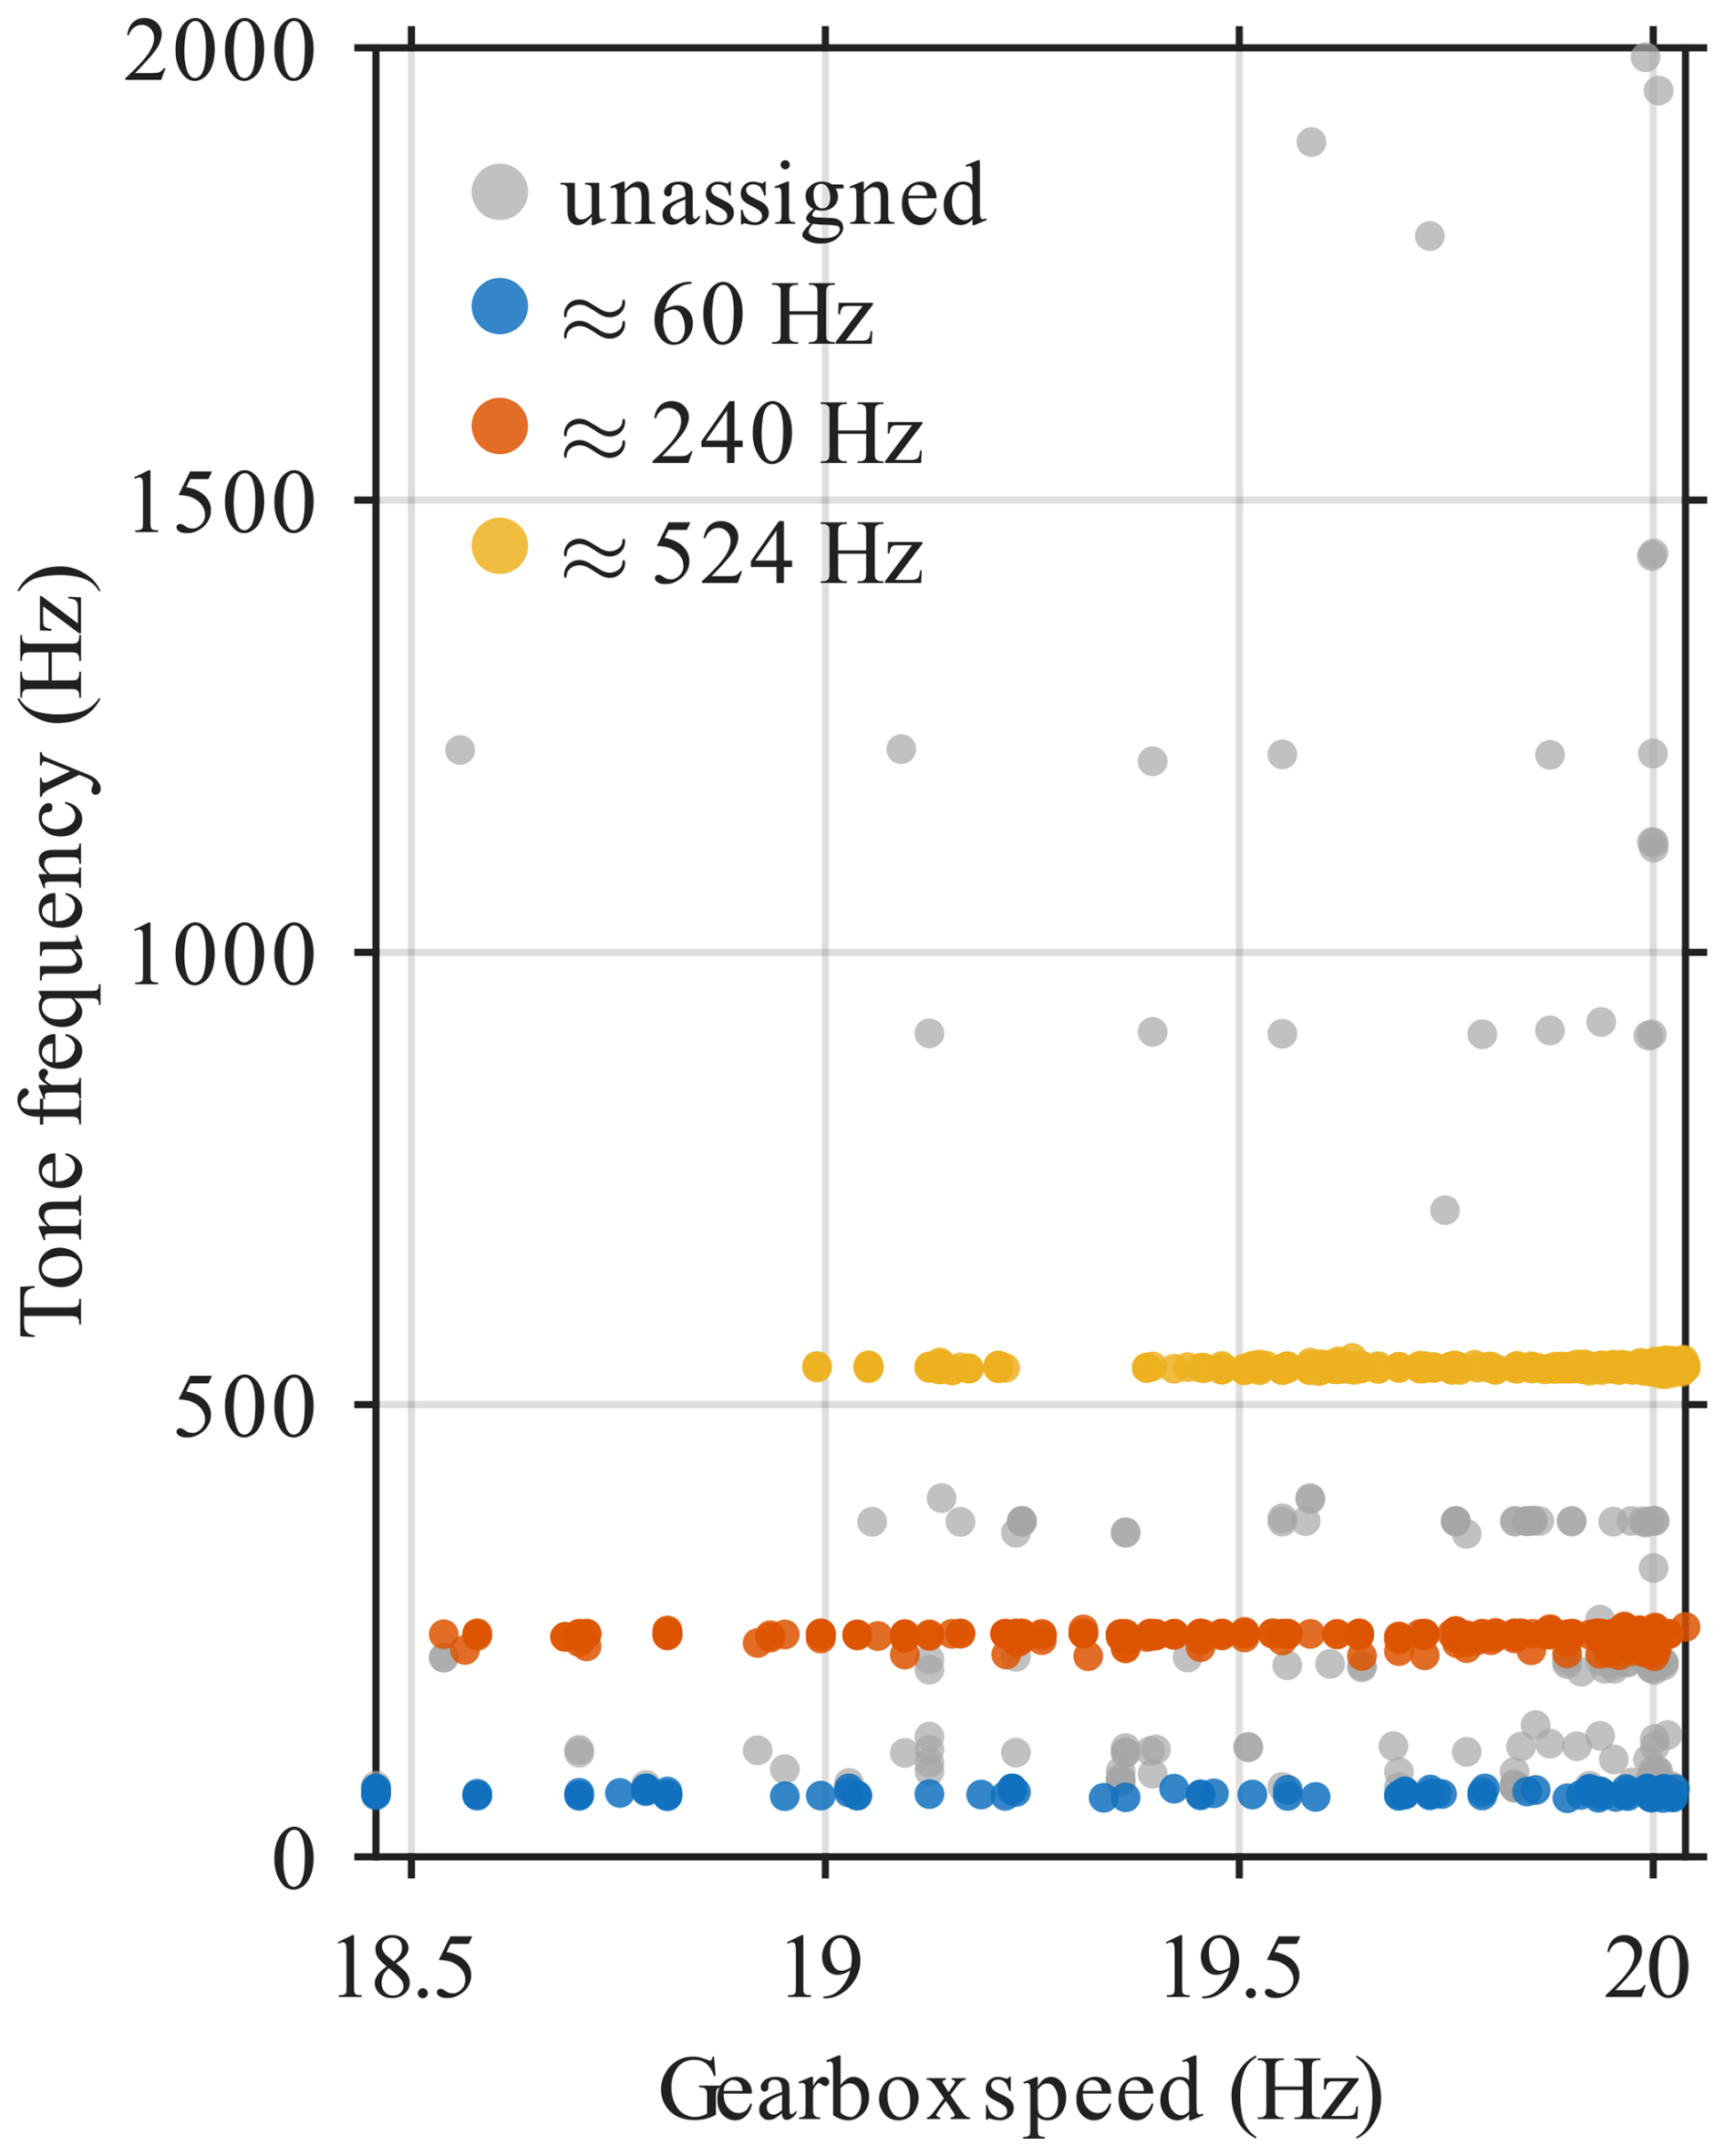
Figure 11Scatter plot of detected tonal frequency versus gearbox speed for rotor speeds above 11 rpm. Coloured symbols represent tonal events associated with dominant frequency groups, whereas grey symbols indicate unassigned events outside the dominating groups.
The aim of this paper was to develop, validate, and apply a two-stage detection framework for identifying dominant wind turbine noises (Stage 1) and source-specific wind turbine noise (WTN) components (Stage 2) in long-term field measurements. To validate the framework, a structured listening test was designed that enables minute-wise classification of specific WTN components (rotor noise, whistling noise, tonality) and relevant background noise (wind-induced noise, bird calls, other sources). The results of the listening test show high overall agreement of around 97 % when compared with the operating status of the wind turbine (on/off) and can therefore be classified as plausible. Deviations between the listening-test results and the turbine operating status can mainly be explained by the limited temporal resolution of the SCADA data (10 min averages), reduced perceptibility of WTN at low rotor speeds in the listening test, and masking effects from competing noise sources that influenced the listeners' assessments. Intrarater reliability is rated as good to excellent, with an average Jaccard index of 0.87. Interrater reliability is moderate at 0.56 and is strongly dependent on the prevalence of the respective categories. While rotor noises were detected consistently and reliably by the listeners, tonal events proved to be more subjective and more difficult for the listeners to perceive.
To validate the individual stages of the framework, a robust consensus was formed from the listening-test data based on strict majority rules. Comparing the WTN-dominated time periods identified in Stage 1 with this listening-test consensus yields very high performance metrics (precision: 0.99, recall: 0.96, specificity: 0.95). The few misclassifications consist mainly of false negatives, which can again be explained by the temporal SCADA resolution and by masking sources. In contrast to the listening test, the method does not identify every perceptible WTN but specifically identifies dominant WTN. This interpretation is supported by a third-octave-band analysis, which shows a systematic correlation between third-octave bands not classified as dominant and wind-induced noise sources perceived in the listening test. The validation of Stage 2 involves tonality and whistling noise. Direct validation of rotor-induced amplitude modulation (AM) was not possible because AM was not explicitly evaluated in the listening test. The validation of tonality detection shows high sensitivity (recall: 0.94) with moderate precision (0.46). The latter is mainly due to tonalities that are barely perceptible, masking effects, and the low number of perceived tonal events in the listening test. In the data set used, high-frequency whistling noise can be attributed to contaminated drainage holes on one rotor blade. A comparison of the listening test consensus with the framework detection in the 2000 Hz third-octave band shows medium to high precision (≈0.78) with low recall (≈0.41). The false positives can mainly be explained by disruptive bird calls, which meant that whistling noise was not always perceived in the listening test. Overall, there is good agreement between framework detection and perception-based reference. The deviations observed can be explained by subjective assessments in the listening test and masking. For this reason, the listening test does not represent the ground truth but rather a consensus-based reference.
The validated framework was applied to a 1-month data set to demonstrate its effectiveness and to analyse the detection of WTN components and their dependence on turbine operating conditions and environmental parameters. The entire data set was processed within approximately 12 h. In particular, the efficient pre-selection stage and the parallelized FFT implementation in Stage 1 ensure high computational efficiency. In the 1-month data set, the highest AM detection rates occur in the mid-frequency range between 160 and 800 Hz, which corresponds to the relevant frequency range for near-field measurements specified in the IOA recommendations (IOA, 2016). The detection rate increases significantly with increasing rotor speed and decreases at high wind speeds due to increased wind-induced masking. The highest rates were observed for upcross conditions. These dependencies are consistent with the literature (e.g. Paulraj and Välisuo, 2017; Okada et al., 2019; Hansen et al., 2019). The detected tone frequencies in the 1-month data set show a correlation with the rotational speeds contained in the SCADA data, which suggests a mechanical origin within the wind turbine drive train.
The two-stage framework and the listening-test platform are publicly available and provide a solid basis for further research in the field of WTN. The framework can be used to effectively select dominant WTN data segments in researchers' own measurement data sets and to analyse the presence of specific WTN components. The listening-test platform can be used to conduct additional listening tests with user-provided audio data. Depending on the research objective, the listening test can be extended, for example by allowing participants to assess the perceived AM strength in the comment field. Due to legal restrictions, the authors are not permitted to publish the original measured sound pressure levels or unmodified audio recordings. However, anonymized and level-modified audio signals are provided for demonstration purposes (Könecke et al., 2026).
In future work, the framework will be applied to long-term measurements from four measurement campaigns at two sites with microphone distances of up to approximately 1500 m. The detection capability of the framework will be evaluated with explicit consideration of sound propagation effects, including atmospheric and ground effects. The measurements conducted so far have been limited to flat terrain and grassland environments. Further investigations under more complex propagation conditions, such as complex topography and forested areas, are therefore of interest. In such environments, additional effects, including scattering and shielding, may become more significant and may alter the emission characteristics at the receiver such that adjustments of method parameters may be necessary.
The analysis of long-term measurements will further enable the investigation of distance-dependent correlations between atmospheric conditions and detected WTN phenomena. At present, measurement data can be classified into the categories “WTN”, “WTN – AM”, “WTN – tonality”, and “WTN – whistling noise”. The framework is designed in a modular manner and can be extended in future studies to include additional factors, for example, tonal amplitude modulation.
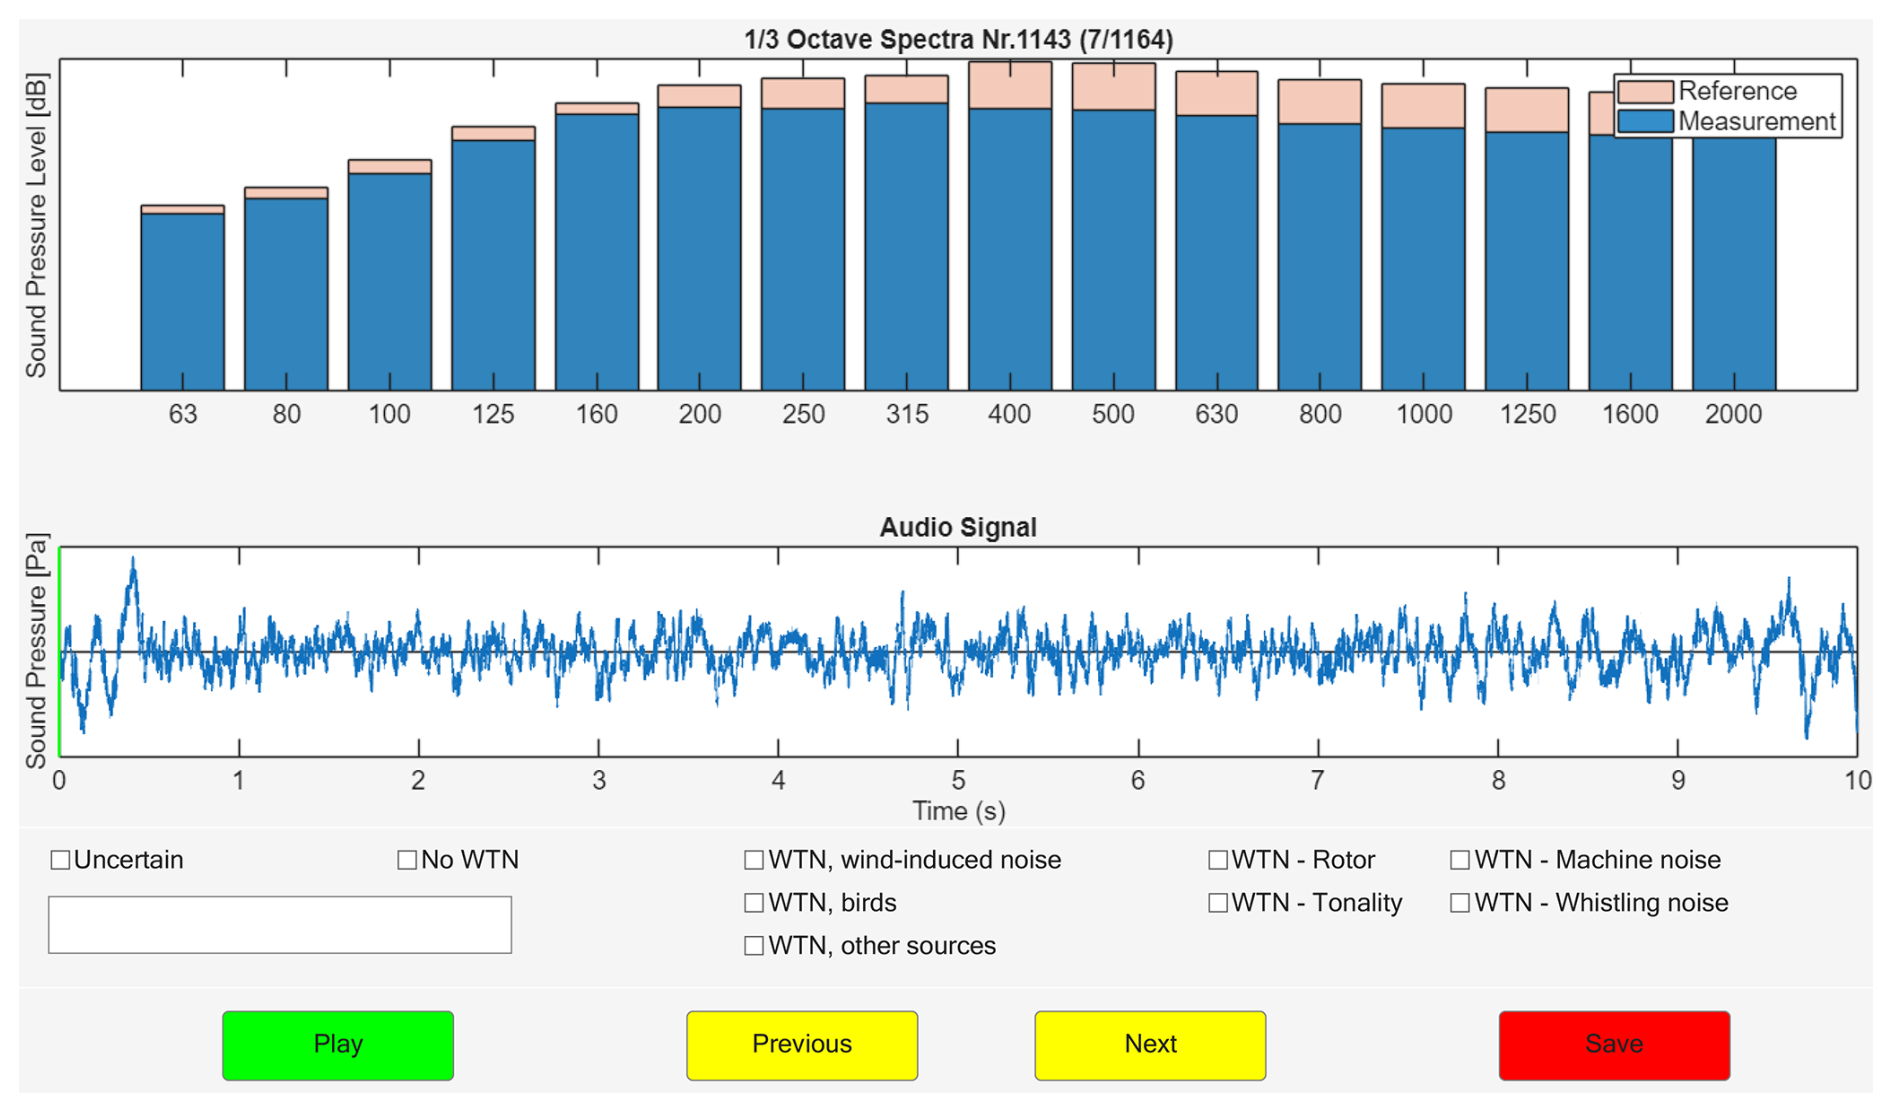
Figure A1Graphical user interface (GUI) of the listening test used for the evaluation of wind turbine sounds. The GUI displays the time course of the audio signal and the corresponding sound spectrum, together with a reference spectrum characterizing WTN.
Table A1Percentage agreement between the listening-test ratings and the SCADA turbine state for all participants. The overall agreement, as well as the agreement for the individual states “WT on” and “WT off”, is reported. Values in parentheses denote the number of valid 1 min observations. The participants in bold have experience in the field of wind turbine noise.
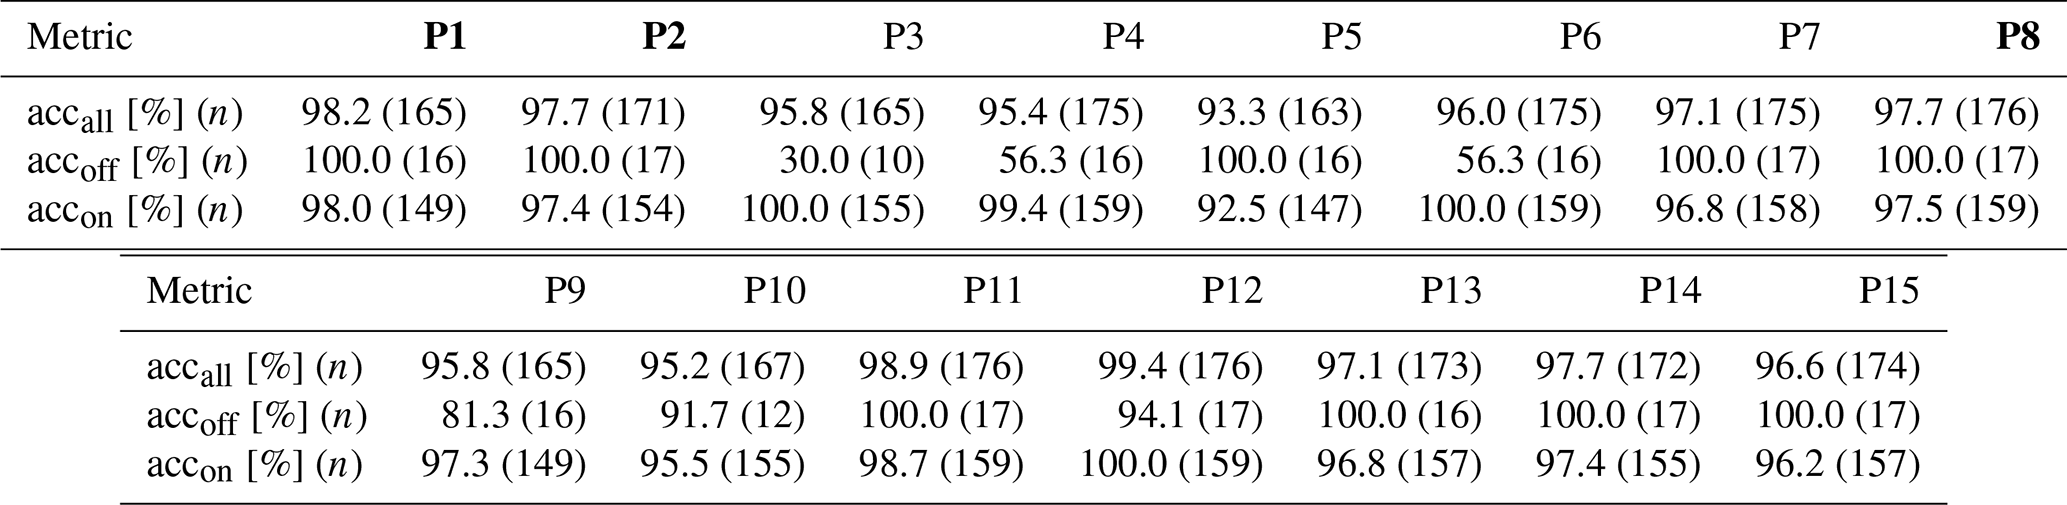
Table A2Intrarater agreement for the 1 min labels. Exact match and Jaccard similarity index are reported for all participants. The participants in bold have experience in the field of wind turbine noise.
The two-stage framework, listening-test platform, and anonymized audio signals are publicly available for further research (https://doi.org/10.25835/nu70ehxy, Könecke et al., 2026).
SK did the main research work, performed field measurements, developed the methods/framework, conducted the validation/application, and wrote the paper. Through discussions and feedback, CJ, TB, and RR contributed to the development of the methods and the interpretation and discussion of the results. The paper was revised and improved by all authors.
At least one of the (co-)authors is a member of the editorial board of Wind Energy Science. The peer-review process was guided by an independent editor, and the authors also have no other competing interests to declare.
Publisher's note: Copernicus Publications remains neutral with regard to jurisdictional claims made in the text, published maps, institutional affiliations, or any other geographical representation in this paper. The authors bear the ultimate responsibility for providing appropriate place names. Views expressed in the text are those of the authors and do not necessarily reflect the views of the publisher.
The Institute of Structural Analysis is part of the Center for Wind Energy Research ForWind. The authors gratefully acknowledge the financial support from the research funding organisation. The authors also thank all volunteers who participated in the listening test for their valuable contribution. ChatGPT was used as a supportive tool for assistance in programming tasks, and both ChatGPT and DeepL were used to improve text clarity, grammar, and overall readability.
This research has been supported by the Bundesministerium für Wirtschaft und Energie (grant nos. 0324134A and 03EE3062).
The publication of this article was funded by the open-access fund of Leibniz Universität Hannover.
This paper was edited by Alessandro Bianchini and reviewed by two anonymous referees.
Blumendeller, E., Gaßner, L., Müller, F. J. Y., Pohl, J., Hübner, G., Ritter, J., and Cheng, P. W.: Quantification of amplitude modulation of wind turbine emissions from acoustic and ground motion recordings, Acta Acust., 7, 55, https://doi.org/10.1051/aacus/2023047, 2023. a
Bolin, K.: Masking of Wind Turbine Sound by Ambient Noise, Licentiate thesis, KTH Royal Institute of Technology, School of Engineering Sciences (SCI), Stockholm, Sweden, https://kth.diva-portal.org/smash/get/diva2:11339/FULLTEXT01.pdf (last access: 16 February 2026), 2006. a
Bolin, K., Conrady, K., Karasalo, I., and Sjöblom, A.: An investigation of the influence of the refractive shadow zone on wind turbine noise, J. Acoust. Soc. Am., 148, EL166–EL171, https://doi.org/10.1121/10.0001589, 2020. a
Conrady, K., Sjöblom, A., and Larsson, C.: Impact of snow on sound propagating from wind turbines, Wind Energy, 21, 1282–1295, https://doi.org/10.1002/we.2254, 2018. a
Conrady, K., Bolin, K., Sjöblom, A., and Rutgersson, A.: Amplitude modulation of wind turbine sound in cold climates, Appl. Acoust., 158, 107024, https://doi.org/10.1016/j.apacoust.2019.107024, 2020. a, b
Evans, T. and Cooper, J.: Influence of wind direction on noise emission and propagation from wind turbines, in: Proceedings of Acoustics 2012, Australian Acoustical Society, Fremantle, Australia, https://www.acoustics.asn.au/conference_proceedings/AAS2012/papers/p139.pdf (last access: 6 February 2026), 2012. a
Fukushima, A., Yamamoto, K., Sueoka, S., Takahashi, H., Sakamoto, S., and Tachibana, H.: Study on the amplitude modulation of wind turbine noise: Part 1 – Physical investigation, in: Proceedings of InterNoise 2013 – 42nd International Congress and Exposition on Noise Control Engineering, pp. 1–10, International Institute of Noise Control Engineering (I-INCE), Innsbruck, Austria, https://docs.wind-watch.org/Fukushima-Internoise-2013.pdf (last access: 16 February 2026), 2013. a, b
Hansen, K.: Long-term investigation into wind farm amplitude modulation and annoyance, in: Acoustics 2021, Australian Acoustical Society, Wollongong, NSW, Australia, 1–15, https://acoustics.asn.au/conference_proceedings/AAS2021/papers/p100.pdf (last access: 16 February 2026), 2021. a
Hansen, K. L., Nguyen, P., Zajamšek, B., Catcheside, P., and Hansen, C. H.: Prevalence of wind farm amplitude modulation at long-range residential locations, J. Sound Vib., 455, 136–149, https://doi.org/10.1016/j.jsv.2019.05.008, 2019. a, b
International Electrotechnical Commission: IEC 61400-11: Wind turbine generator systems – Part 11: Acoustic noise measurement techniques, Edition 2.1. Genf., ISBN 2831886821, 2006. a
International Electrotechnical Commission: IEC 61672-1: Electroacoustics – Sound level meters – Part 1: Specifications, Edition 2.0. Geneva, https://doi.org/10.31030/2154580, 2013. a
International Electrotechnical Commission: IEC 61260-1: Electroacoustics – Octave-band and fractional-octave-band filters – Part 1: Specifications, Edition 1.0. Geneva, https://doi.org/10.31030/2231136, 2014. a
IOA: Methods for Rating Amplitude Modulation in Wind Turbine Noise: Discussion Document, Tech. rep., Institute of Acoustics (IOA), St Albans, Hertfordshire, UK, https://www.ioa.org.uk/sites/default/files/AMWG Discussion Document.pdf (last access: 16 February 2026), 2015. a
IOA: A Method for Rating Amplitude Modulation in Wind Turbine Noise: Final Report, Tech. rep., Institute of Acoustics (IOA), St Albans, Hertfordshire, UK, https://www.ioa.org.uk/sites/default/files/AMWG Final Report-09-08-2016_0.pdf (last access: 16 February 2026), 2016. a, b, c, d, e, f, g, h, i, j, k, l, m, n
Könecke, S., Hörmeyer, J., Bohne, T., and Rolfes, R.: A new base of wind turbine noise measurement data and its application for a systematic validation of sound propagation models, Wind Energ. Sci., 8, 639–659, https://doi.org/10.5194/wes-8-639-2023, 2023a. a, b
Könecke, S., Schössow, D., Preihs, S., Bohne, T., Grießmann, T., Peissig, J., and Rolfes, R.: WEA-Acceptance Data: Wind Turbine Dataset Including Acoustical, Meteorological and Turbine Parameters (Version 2.0), LUIS [data set], https://doi.org/10.25835/c2mv3d7z, 2023b. a
Könecke, S., Jonscher, C., Bohne, T., and Rolfes, R.: Detection Framework and Listening-Test Platform for the Identification of Wind Turbine Noise in Long-Term Field Measurements, LUIS [data set], https://doi.org/10.25835/nu70ehxy, 2026. a, b
Larsson, C. and Öhlund, O.: Amplitude modulation of sound from wind turbines under various meteorological conditions, J. Acoust. Soc. Am., 135, 67–73, https://doi.org/10.1121/1.4836135, 2014. a, b
Lundmark, G.: Measurement of swish noise, a new method, in: Proceedings of the Fourth International Meeting on Wind Turbine Noise, INCE/Europe, Rome, Italy, https://www.windturbinenoise.eu/files/wtn2011_portfolio_of_papers.pdf (last access: 12 May 2026), 2011. a
Martens, S., Boas, M., Bohne, T., and Rolfes, R.: Towards the use of secondary windscreens to improve wind turbine sound measurements, in: Proceedings of 15th EAWE PhD Seminar on Wind Energy, Nantes, France, https://www.researchgate.net/publication/338834113_Towards_the_use_of_secondary_windscreens_to_improve_wind_turbine_sound_measurements (last access: 16 February 2026), 2019a. a
Martens, S., Bohne, T., and Rolfes, R.: Measuring and Analysing the Sound Propagation of Wind Turbines, in: Proceedings of the 8th International Conference on Wind Turbine Noise, 1–12, Lisbon, Portugal, https://www.windturbinenoise.eu/files/wtn2019-papers-alphabetical.pdf (last access: 12 May 2026), 2019b. a, b
Martens, S., Bohne, T., and Rolfes, R.: An evaluation method for extensive wind turbine sound measurement data and its application, Proceedings of Meetings on Acoustics, Acoustical Society of America, 41, https://doi.org/10.1121/2.0001326, 2020. a, b, c
Moorhouse, A. T., Hayes, M., von Hunerbein, S., and Adams, M.: Research into aerodynamic modulation of wind turbine noise: Final report, Tech. rep., Salford University, https://salford-repository.worktribe.com/output/1469379/research-into-aerodynamic-modulation-of-wind-turbine-noise-final-report (last access: 12 May 2026), 2007. a
Nguyen, P. D., Hansen, K. L., Lechat, B., Catcheside, P., Zajamsek, B., and Hansen, C. H.: Benchmark characterisation and automated detection of wind farm noise amplitude modulation, Appl. Acoust., 183, 108286, https://doi.org/10.1016/j.apacoust.2021.108286, 2021. a, b
NSW DPHI: Wind Energy – Technical Supplement for Noise Impact Assessment, Tech. Rep. DOC24/867420, NSW Department of Planning, Housing and Infrastructure, https://www.planning.nsw.gov.au/sites/default/files/2024-11/wind-energy-guideline-noise-technical-supplement.pdf (last access: 16 February 2026), 2024. a
Öhlund, O. and Larsson, C.: Meteorological effects on wind turbine sound propagation, Appl. Acoust., 89, 34–41, https://doi.org/10.1016/j.apacoust.2014.09.009, 2015. a, b, c
Okada, Y., Yoshihisa, K., and Hyodo, S.: Directivity of amplitude modulation sound around a wind turbine under actual meteorological conditions, Acoustical Science and Technology, 40, 1–10, https://doi.org/10.1250/ast.40.1, 2019. a, b, c
Paulraj, T. and Välisuo, P.: Effect of wind speed and wind direction on amplitude modulation of wind turbine noise, in: INTER-NOISE and NOISE-CON Congress and Conference Proceedings, 255, 5479–5489, https://lipas.uwasa.fi/~pvs/Effect of wind speed and wind direction on amplitude modulation of wind turbine noise.pd (last access: 12 May 2026), 2017. a
Persson Waye, K. and Öhrström, E.: Psycho-acoustic characters of relevance for annoyance of wind turbine noise, J. Sound Vib., 250, 65–73, https://doi.org/10.1006/jsvi.2001.3905, 2002. a
Schössow, D., Preihs, S., and Peissig, J.: WEA-Acceptance Data – A Dataset of Acoustic, Meteorological, and Operational Wind Turbine Measurements, Data, 9, 46, https://doi.org/10.3390/data9030046, 2024. a
van den Berg, G. P.: Effects of the wind profile at night on wind turbine sound, J. Sound Vib., 277, 955–970, https://doi.org/10.1016/j.jsv.2003.09.050, 2004. a
- Abstract
- Introduction
- Detection framework
- Listening test
- Validation of the detection framework
- Application of the detection framework
- Conclusion and outlook
- Appendix A
- Code and data availability
- Author contributions
- Competing interests
- Disclaimer
- Acknowledgements
- Financial support
- Review statement
- References