
the Creative Commons Attribution 4.0 License.
the Creative Commons Attribution 4.0 License.
 | 03 Aug 2026
Impact of atmospheric stability and turbulence on wind turbine wake characteristics: a nacelle lidar study
Norman Wildmann
Wind turbine wakes reduce the generated power and increase loads on downstream turbines. Their characteristics depend strongly on the atmospheric conditions in the boundary layer. This study addresses the turbine–atmosphere interaction specifically in the near-wake region up to 4 rotor diameters downstream of a utility-scale wind turbine. We utilize an exceptionally large database of concurrent measurements of inflow conditions and wake characteristics collected from November 2023 to June 2024 at the WiValdi research wind farm in northern Germany. The dataset comprises measurements from a downstream-looking Doppler wind lidar mounted on the nacelle, a meteorological inflow mast, and wind turbine operational data. Wake characteristics and near-wake lengths are deduced from the lidar scanning at multiple horizontal planes and are analyzed across a wide range of atmospheric conditions, including stability, wind shear, veer, and turbulence. The wake velocity deficit is observed to be reduced with stronger turbulence and enhanced under stable conditions. Stronger wind veering across the rotor layer, in the absence of yaw misalignment, correlates to intensified lateral wake center deflection and to stronger vertical skewness. A high shear exponent and potential temperature gradient are associated with increased lateral asymmetry of the velocity deficit's double-Gaussian peaks at 1 rotor diameter downstream. We find that the near wake extends on average 2.0 rotor diameters downstream, with a standard deviation of 0.42 rotor diameters. The near-wake length exhibits greater sensitivity to atmospheric conditions than to turbine operational parameters, with the strongest correlations found for turbulence intensity and static stability. Under strongly stable conditions and weak turbulence, near-wake lengths are particularly long, reaching up to 3.8 rotor diameters downstream.
- Article
(4661 KB) - Full-text XML
- BibTeX
- EndNote


The wake of a wind turbine is a region characterized by reduced wind speed and increased turbulence that forms behind the rotor as the wind turbine extracts energy from the flow (Porté-Agel et al., 2019). Wind turbine wakes impact the efficiency of wind farms by not only reducing energy production due to lower wind speeds in the farm (Barthelmie et al., 2009; El-Asha et al., 2017) but also by increasing the loads on downwind turbines, which can lead to fatigue and a reduced lifespan (Thomsen and Sørensen, 1999; Kim et al., 2015). To mitigate these effects, research has focused on understanding wake dynamics and integrating this knowledge into wake models, which serve as useful tools for layout optimization, wind resource assessment, and wind farm control (Archer et al., 2018; Fleming et al., 2014; Pedersen and Larsen, 2020). To maintain computational efficiency, these models are often of low-order complexity (Amiri et al., 2024). However, this leads to a simplification of complex real-world characteristics, including the near-wake region and the variability of atmospheric inflow conditions (Abkar and Porté-Agel, 2015; Meyers et al., 2022).
Wind turbines operate within the atmospheric boundary layer (ABL), where wake characteristics are affected by stability-dependent flow parameters such as turbulence, wind shear, and wind veer. ABL stability is often described using canonical regimes, although real-world ABL conditions frequently deviate from this idealized state, e.g., during low-level jets or frontal passages. In a canonical stable ABL, wind veers clockwise (Northern Hemisphere), wind speed increases with height, and turbulence is typically low. By contrast, in a convective boundary layer, both wind veer and wind shear are close to zero, and turbulence shows large variations due to buoyancy. In a neutral ABL, wind shear generally follows the logarithmic wind profile, and turbulence is primarily shear driven (Stull, 1988). The impact of ABL stability on wakes under veered and sheared inflow has been investigated through large-eddy simulations (LESs) (Bhaganagar and Debnath, 2015; Vollmer et al., 2016; Abkar and Porté-Agel, 2015; Englberger et al., 2020) and field measurements (Iungo and Porté-Agel, 2014; Bodini et al., 2017; Brugger et al., 2019; Zhan et al., 2019). Under stable conditions, longer wakes with stronger velocity deficits (Abkar and Porté-Agel, 2015) and higher wake-added turbulence (Klemmer and Howland, 2024) emerge. Stronger veer induces a stretching of the wake from a circular into an elliptical shape in the vertical plane. Nacelle lidar measurements (Brugger et al., 2019; Sengers et al., 2023) and ground-based lidar data (Bodini et al., 2017) confirm stronger vertical skewness with higher veer, although demonstrating that wake stretching approaches but does not fully correspond to the magnitude of inflow veer.
A LES study by Zhou et al. (2015) demonstrates that inflow shear induces an asymmetric velocity deficit. This asymmetry can be observed in field data as well (Bromm et al., 2018; Carbajo Fuertes et al., 2018). A more recent study by Onnen et al. (2026) indicates a more asymmetric wake with higher shear exponents. Additionally, interactions between the turbine tower and wake contribute to the asymmetry in the wake deficit. Wind tunnel and LES studies by Pierella and Sætran (2017) and De Cillis et al. (2020), respectively, present the impact of the wind turbine tower on the near wake. They show that the tower causes asymmetry in the wake deficit, resulting in increased loads and reduced efficiency for downstream turbines. Despite these findings, the precise mechanisms causing the wake flow asymmetry remain unclear, and the relative contributions of wind shear, turbine-induced vortices, and their dynamics continue to be the subject of ongoing research.
Apart from meteorological quantities, turbine operation conditions impact the evolution and dispersion of the wake. Yaw misalignment receives increasing attention due to its potential to enhance wind farm performance by steering wakes away from downstream turbines. Experimental studies by Bromm et al. (2018) and Brugger et al. (2020) demonstrate the lateral deflection of the wake with a yawed wind turbine, although the observations are affected by wind veer as well. Furthermore, a curl-shaped velocity deficit in the vertical plane of the wake is consistently reported in numerical simulations (Vollmer et al., 2016), wind tunnel experiments (Howland et al., 2016; Bartl et al., 2018; Zong and Porté-Agel, 2020), and field measurements (Sengers et al., 2023).
The downstream region of the wake is often divided into the near wake and the far wake (Porté-Agel et al., 2019). The near wake is defined as the region immediately behind the turbine, where tip, hub, and root vortices impact the wake structure. In the far wake, the impact of the turbine itself becomes weaker, and the velocity deficit resembles a Gaussian shape as the wake recovers. The transition between the two regions is often vaguely defined as typically occurring within a distance of 1 to 4 rotor diameters (D) downstream. Several studies define the transition based on the point at which the mean velocity profile resembles a Gaussian (Vahidi and Porté-Agel, 2022b; Robey and Lundquist, 2024), while other definitions are based on turbulent kinetic energy content (Wu and Porté-Agel, 2012; De Cillis et al., 2020; Gambuzza and Ganapathisubramani, 2023) or the decay of the tip vortices' strength (Biswas and Buxton, 2024). The factors influencing the length of the near wake include the number of rotor blades, tip speed ratio, and thrust coefficient (Sørensen et al., 2015), as well as the background turbulence intensity (Wu and Porté-Agel, 2012; Trujillo et al., 2016). However, the influence of atmospheric conditions on the length of the near wake remains unclear, particularly with regard to the impact of stability, wind veer, and wind shear. The accurate estimation of the near-wake length is crucial for the optimization of turbine spacing and the development of wake mitigation strategies.
Field experiments conducted in and around wind farms improve our understanding of wake dynamics and their interaction with the ABL, thereby contributing to the improvement and validation of numerical and analytical wake models. Wind lidars, both ground based and nacelle mounted, capture wind fields over large areas with high spatial and temporal resolution. These lidars have been demonstrated to provide detailed information on wind and turbulence and measure wake dynamics of single (Aitken and Lundquist, 2014), multiple, and interacting wakes. Studies by Trujillo et al. (2016), Brugger et al. (2020), and Bromm et al. (2018) demonstrate the lateral deflection of the wake in a neutral ABL using nacelle lidar measurements during wake steering with yaw misalignment of up to 20°, and Sengers et al. (2023) use nacelle lidar data as validation of a data-driven wake model considering wake steering. Trujillo et al. (2016) investigated the relationship of the near-wake length and turbulence intensity and provided a calibration for analytical near-wake length estimation. Other studies explore wake meandering (Machefaux et al., 2014; Brugger et al., 2022), calibrate models (Trabucchi et al., 2017; Reinwardt et al., 2020), or validate analytical wake models (Carbajo Fuertes et al., 2018; Brugger et al., 2019). Additionally, uncrewed aerial systems (UASs) are emerging as an alternative measurement tool for measuring wakes with comparatively higher resolution than lidar (Wildmann et al., 2014; Mauz et al., 2019; Wetz and Wildmann, 2023; Wildmann and Kistner, 2024, 2025).
However, nacelle lidar measurements typically focus on the far-wake region, which some studies attribute to the limited opening angle of the lidar that makes it extremely difficult to capture the entire wake close to the turbine (Bromm et al., 2018; Angelou et al., 2023). Other studies primarily focus on wake steering experiments or are limited to a small number of cases, which make a detailed investigation of the impact of the ABL on the wake challenging. Therefore, in this study, we will investigate the near wake and its transition to far wake downstream of a wind turbine using a rearward-facing nacelle lidar, addressing the following research questions:
-
What is the impact of stability and turbulence on wake characteristics derived from a nacelle lidar, with a focus on the near-wake region?
-
Can we observe lateral asymmetry in the near wake? And how does the ABL affect this asymmetry?
-
How far downstream does the near wake extend? And how does its length depend on atmospheric and turbine variables?
Wake characteristics will be studied under various atmospheric and turbine operating conditions by applying a wake detection algorithm to lidar scans from a nacelle-mounted lidar on a utility-scale turbine at the research wind farm WiValdi in Germany. The focus will be on wake characteristics such as velocity deficit, wake width, lateral wake center deflection, and vertical curl and slope in the near wake (≤4 D), including examination of the lateral wake asymmetry in the proximity of the westernmost turbine. The near-wake length will be determined, and its relation to atmospheric stability and inflow turbulence will be statistically investigated. The measurement site and the wind farm are described in Sect. 2. The data processing, including the wake detection of the nacelle lidar data and the determination of the near-wake length, is given in Sect. 3. Wake characteristics, including near-wake length and its relation to atmospheric and turbine parameters, are described in Sect. 4 and discussed in Sect. 5. We provide a summary and propose future work in Sect. 6.
The research wind farm WiValdi in northern Germany features two 4.2 MW Enercon E115 wind turbines with a rotor diameter, D, of 116 m and hub height of 92 m. One of them (OPUS2) is located 4.3 D downstream of the first turbine (OPUS1) in the primary west-southwest wind direction (Wildmann et al., 2022), as shown in Fig. 1. High-frequency data are available from the two turbines at 100 Hz, which are aggregated to 10 min periods for this analysis. The data include measurements of power P, rotor speed ω, yaw angle ψ, turbine status, and power limitation information. The last two are used to filter normal operations without power curtailment of OPUS1.
The two wind turbines are accompanied by a meteorological mast of 150 m height 2 D upstream of the first turbine, which provides the atmospheric inflow conditions. A set of three measurement masts is located between the two wind turbines at about 3.3 D downstream of the first turbine taking measurements in the wind turbine wake. All masts are equipped with ultrasonic and cup anemometers and weather vanes at different heights across the rotor layer, and the inflow mast (conforming to IEC-61400) (IEC, 2017) additionally has sensors to measure further atmospheric parameters, like temperature, humidity, and rainfall.
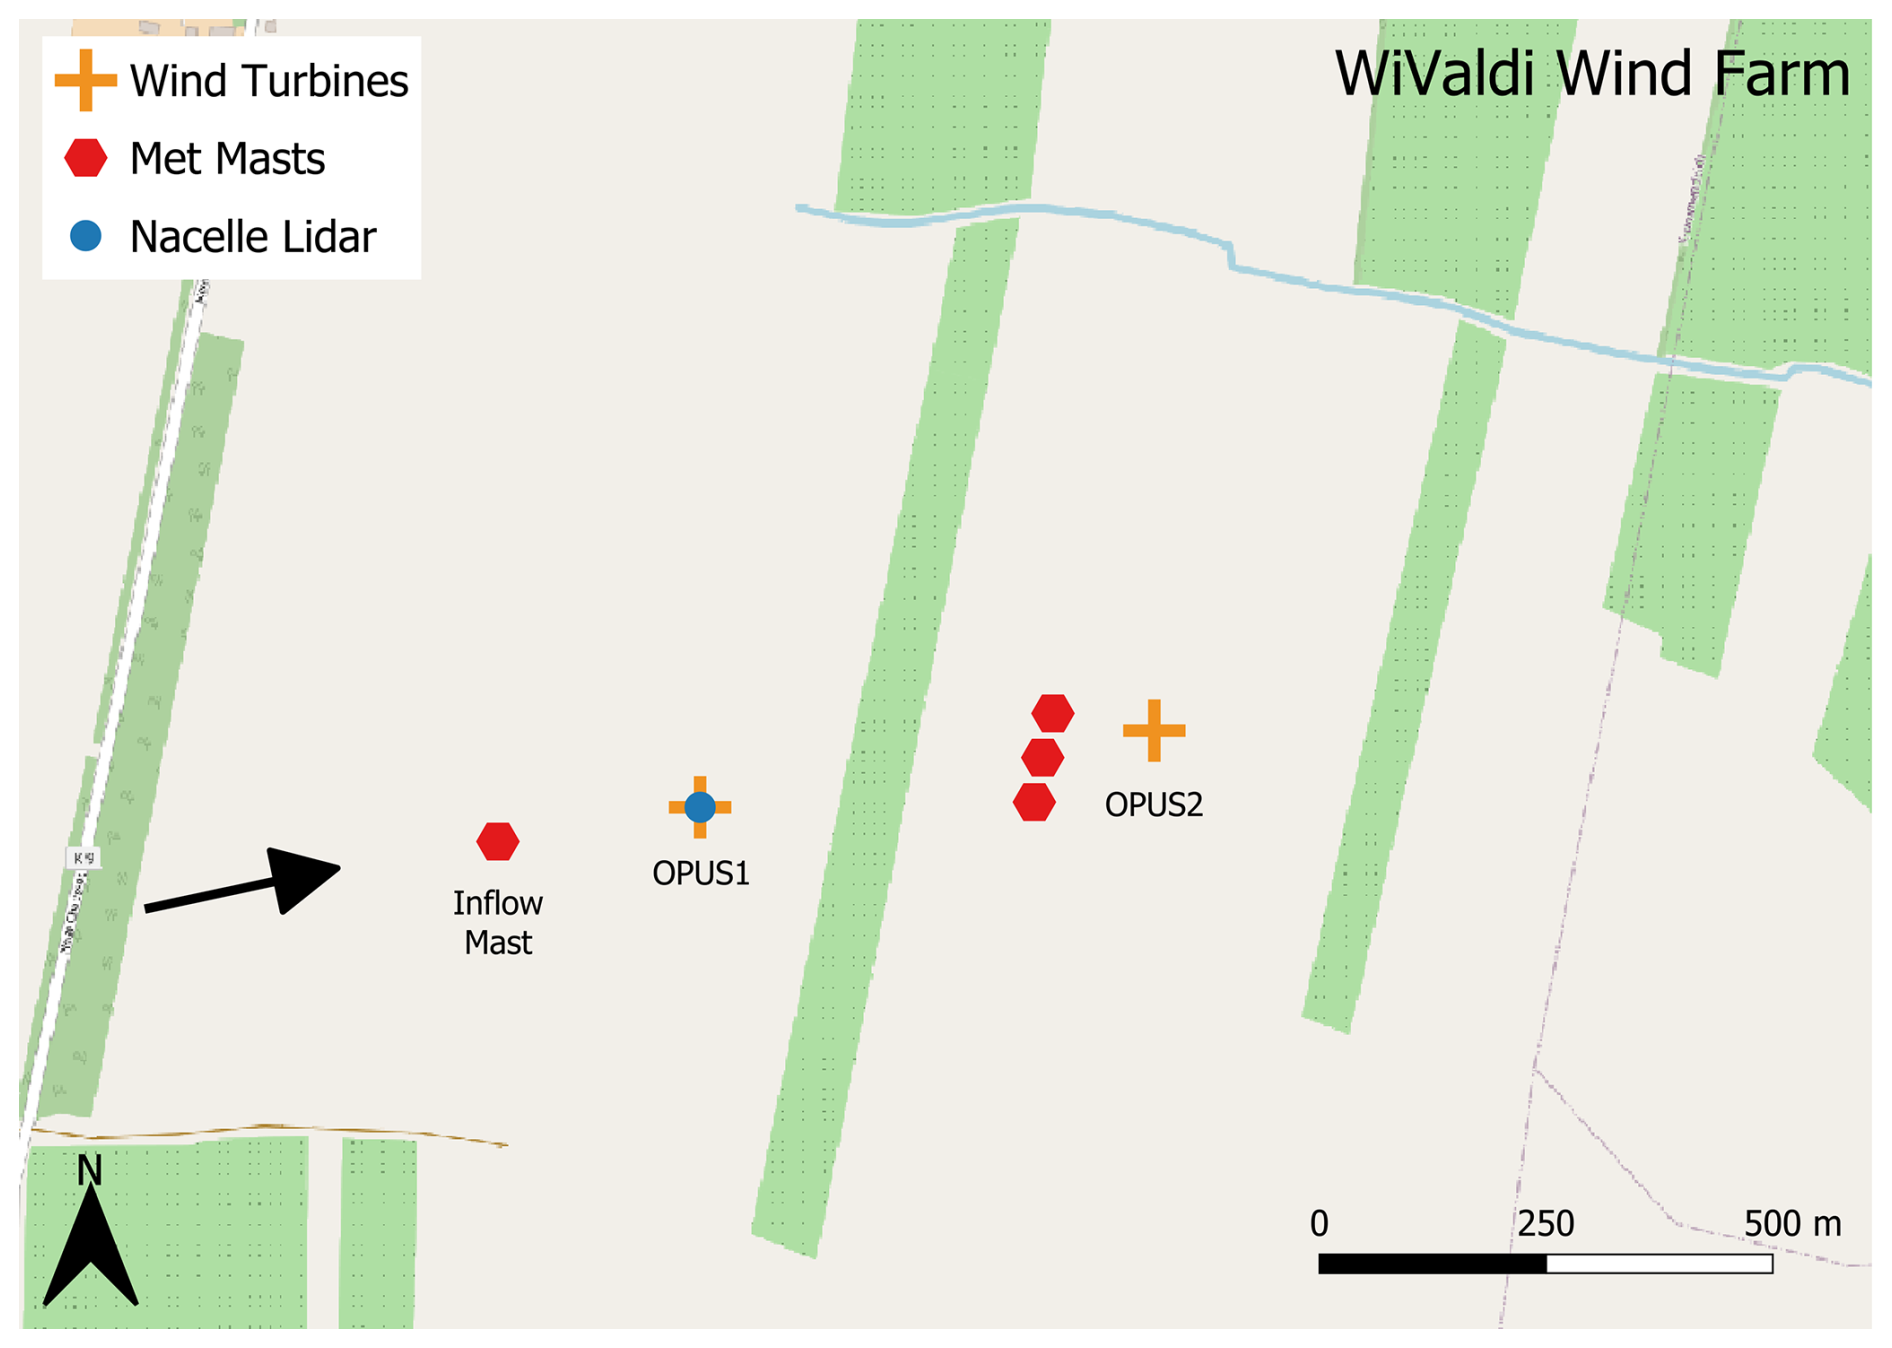
Figure 1Layout of WiValdi, adapted from Thayer et al. (2025), showing the locations of the wind turbines, meteorological masts, and nacelle-mounted lidar. The black arrow indicates the primary west-southwesterly wind direction. Background map: © OpenStreetMap contributors 2025. Distributed under the Open Data Commons Open Database License (ODbL) v1.0.
2.1 Inflow mast and turbine data
This study uses 10 min averages of the inflow mast data to describe the atmospheric state of the flow experienced by OPUS1. Wind direction δ and wind speed U are provided by a sonic anemometer installed at 85 m, representing the closest available sonic measurements to hub height (92 m). From these measurements, turbulence intensity TI and turbulent kinetic energy e are derived. Further sonic anemometers are installed at 33, 62, 120, and 149 m. Wind veer Δδ, wind shear ΔU, and wind shear exponent α across the rotor layer are calculated from the measurements taken at 33 and 149 m. While wind shear is a common metric in meteorology, the shear exponent is more frequently used in wind energy applications. In this study, we therefore use both vertical wind shear and the shear exponent to capture comprehensive information about the ABL state. Although the height difference of 7 m between the sonic at 85 m and hub height introduces minor discrepancies, the observed wind shear values over the rotor layer (mean: 0.029 s−1, max: 0.086 s−1) suggest that the differences in wind speed are small, of the order of 0.203 m s−1 on average and up to 0.602 m s−1 at maximum shear. Similar considerations apply to wind direction, where the mean difference is 0.371° and the maximum difference is 3.465° based on observed veer between 33 and 149 m. However, the sonic measurements at 85 m are affected by the wake of the mast structure itself for wind directions between 145 and 185°. To minimize potential obstruction from the mast structure, two sonic anemometers are installed at 33 m on two separate booms, allowing for combined wind measurements that are not affected by the mast. The sonic at 149 m is installed at the top of the mast, where no impact from the mast is expected.
Static stability is quantified based on vertical gradients of potential temperature θ. Temperature sensors are installed at 2, 11, 34, 63, 85, 121, and 144 m on the inflow mast, and extrapolating pressure to these heights from a pressure sensor at 10 m using the hypsometric equation yields potential temperature values. In our study, we use the gradient closest to the rotor layer, i.e., 34 to 144 m. As a measure of dynamic stability of the atmosphere, the bulk Richardson number Ri is estimated using θ at 34 and 144 m and wind speed measurements from sonic measurements at 33 and 149 m from the inflow mast.
The turbine's operational parameters are determined using a combination of measured meteorological quantities and turbine data. The yaw misalignment ϕ of the turbine is defined as the angular deviation between the incoming wind direction and the turbine's yaw angle. This value is considered positive when the turbine is rotated clockwise relative to the inflow wind direction; i.e., . The tip speed ratio λ is the ratio between the speed of the blade tip, calculated from ω and U; i.e., . The power coefficient cP of the turbine is calculated through
with P being the actual produced power of the turbine, Arot the rotor area, and ρ the density of the air (calculated using temperature and humidity values from sensors at 85 m). Then the induction factor a is calculated through solving
and, finally, the thrust coefficient cT is approximated through
Here, the calculation of cT relies on the induction factor derived from power extraction and does not account for electrical losses or drag from components not contributing to power production, such as the tower, nacelle, and blade roots. Consequently, cT may be lower than the turbine's actual aerodynamic loading (Iungo et al., 2018).
2.2 Nacelle-mounted lidar
A Doppler wind lidar of the type Leosphere Windcube 200S is mounted on the nacelle of OPUS1 and measures the wind field behind the rotor, which is affected by the turbine wake. Plan position indicator (PPI) scans have been performed as the scanning strategy since November 2023 to capture the main wake properties. Three elevation angles of −7, 0, and 7° have been selected in order to cover the vertical extent of the wake across the rotor area at 4 D downstream (Fig. 2b). The azimuth angle has a total opening angle of 90° and a resolution of 2°, as illustrated for the horizontal PPI in Fig. 2a. The lidar measurements are acquired with an accumulation time of 200 ms and for range gates from 100 to 4080 m at a separation of 20 m and a physical resolution of 50 m. As the lidar provides volume-averaged velocities, this can lead to underestimation of wind speeds, especially in spatially inhomogeneous regions with steep gradients such as turbine wakes. At an elevation of −7°, the lidar beams reach the ground at a distance of 751 m, where they are blocked due to the pulse width starting at range gates of 700 m. This strategy does a full scan cycle with three different elevation angles every 27 s. Until 31 December 2024, a total of 19 804 periods of 10 min duration with a turbine wake (detection algorithm; see Sect. 3.2) have been collected using this scanning pattern. The data used in this study are restricted to conditions with winds from the main wind direction sector (225–315°). This selection ensures that the inflow mast is located upstream of OPUS1, providing inflow measurements at 2 D upstream. Additionally, it guarantees that OPUS1 is not operating within the wake of OPUS2. While OPUS2 is located downstream of OPUS1 under these conditions, wake interactions begin at 4.3 D, which is not relevant to this study as it focuses on characterizing the wake of OPUS1 up to 4 D downstream, as measured by the nacelle lidar. Applying this wind direction filter results in 6171 periods of 10 min duration. Further filtering for OPUS1 operation without power curtailment reduces the dataset to 4964 periods of 10 min duration. Finally, restricting the data to periods with available inflow mast measurements at various heights results in 1396 periods of 10 min duration as mast data are unavailable from 11 June 2024 onward. Statistics of the dataset are presented in Sect. 4.
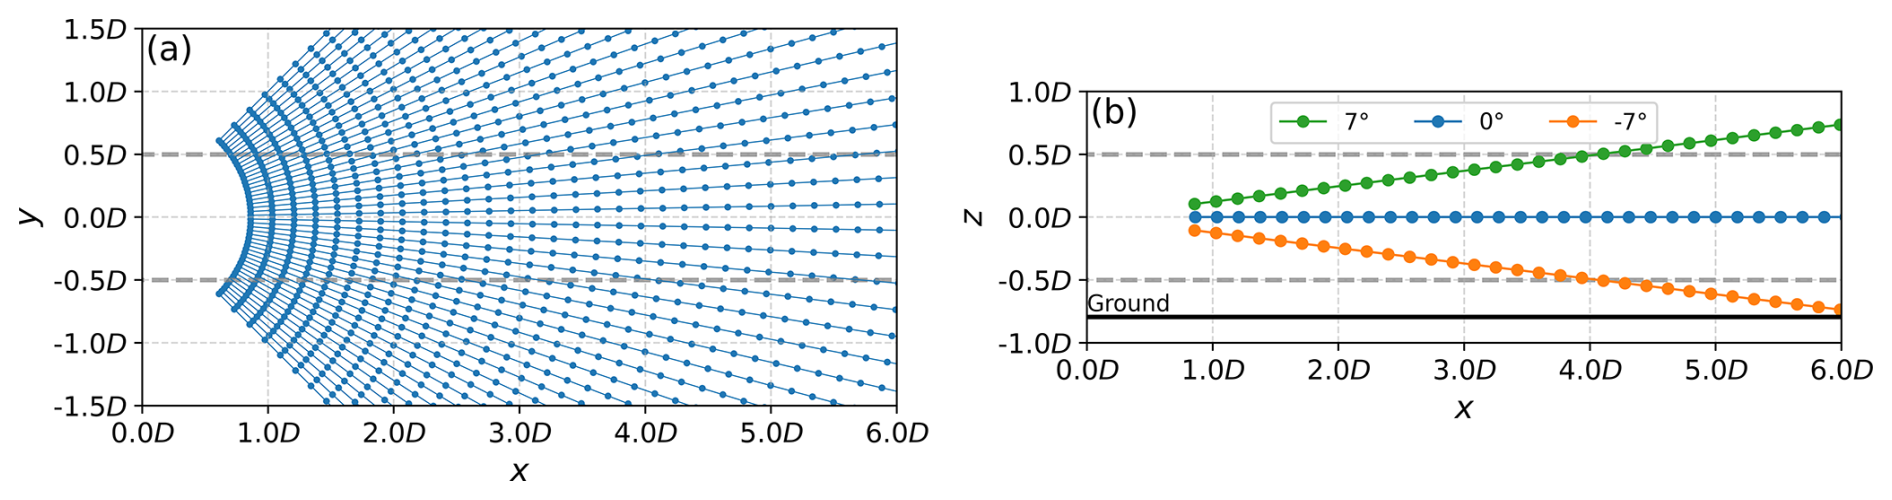
Figure 2Scan pattern of the nacelle-mounted lidar. View from the top on the 0° elevation angle scan (a) and from the side on the 89° azimuth scans (b). Lines are lidar beams with range gates as points. The wind turbine is located at the origin. The rotor area is shown through gray dashed lines. The ground is indicated through the thick black line in (b).
The movement of the turbine influences the precision of the lidar beam, making accurate motion measurement necessary. To account for this, an inertial measurement unit (IMU) is installed accompanying the nacelle lidar. The IMU uses GPS data to record the pitch, roll, and yaw angles of the lidar, thereby providing a comprehensive assessment of its movement. IMU data aggregated to 1 min from 9 November 2023 until 29 February 2024 for periods when OPUS1 is operating and the wind direction is between 185 and 360° are used to calculate average roll and pitch orientation angles. The turbine's movement, particularly its pitch, is highly dependent on the hub height wind speed. Additionally, a systematic roll angle is observed over the measurement period. Therefore, the average roll and pitch values are used to quantify the corresponding lidar beam displacement for the horizontal scan in the streamwise (x), lateral (y), and vertical (z) (Fig. 3). The displacement in the x direction shows values up to −0.009 m within the area of up to 4 D in x and ±2 D in y, while in the y direction the displacement ranges up to 0.05 m. In the z direction, the roll and pitch cause the largest displacements of up to −6 m. The observed displacements are relatively small compared to the rotor diameter of the turbine and the corresponding wake features. This indicates that turbine motion has a minimal impact on the lidar wake measurements for this study.
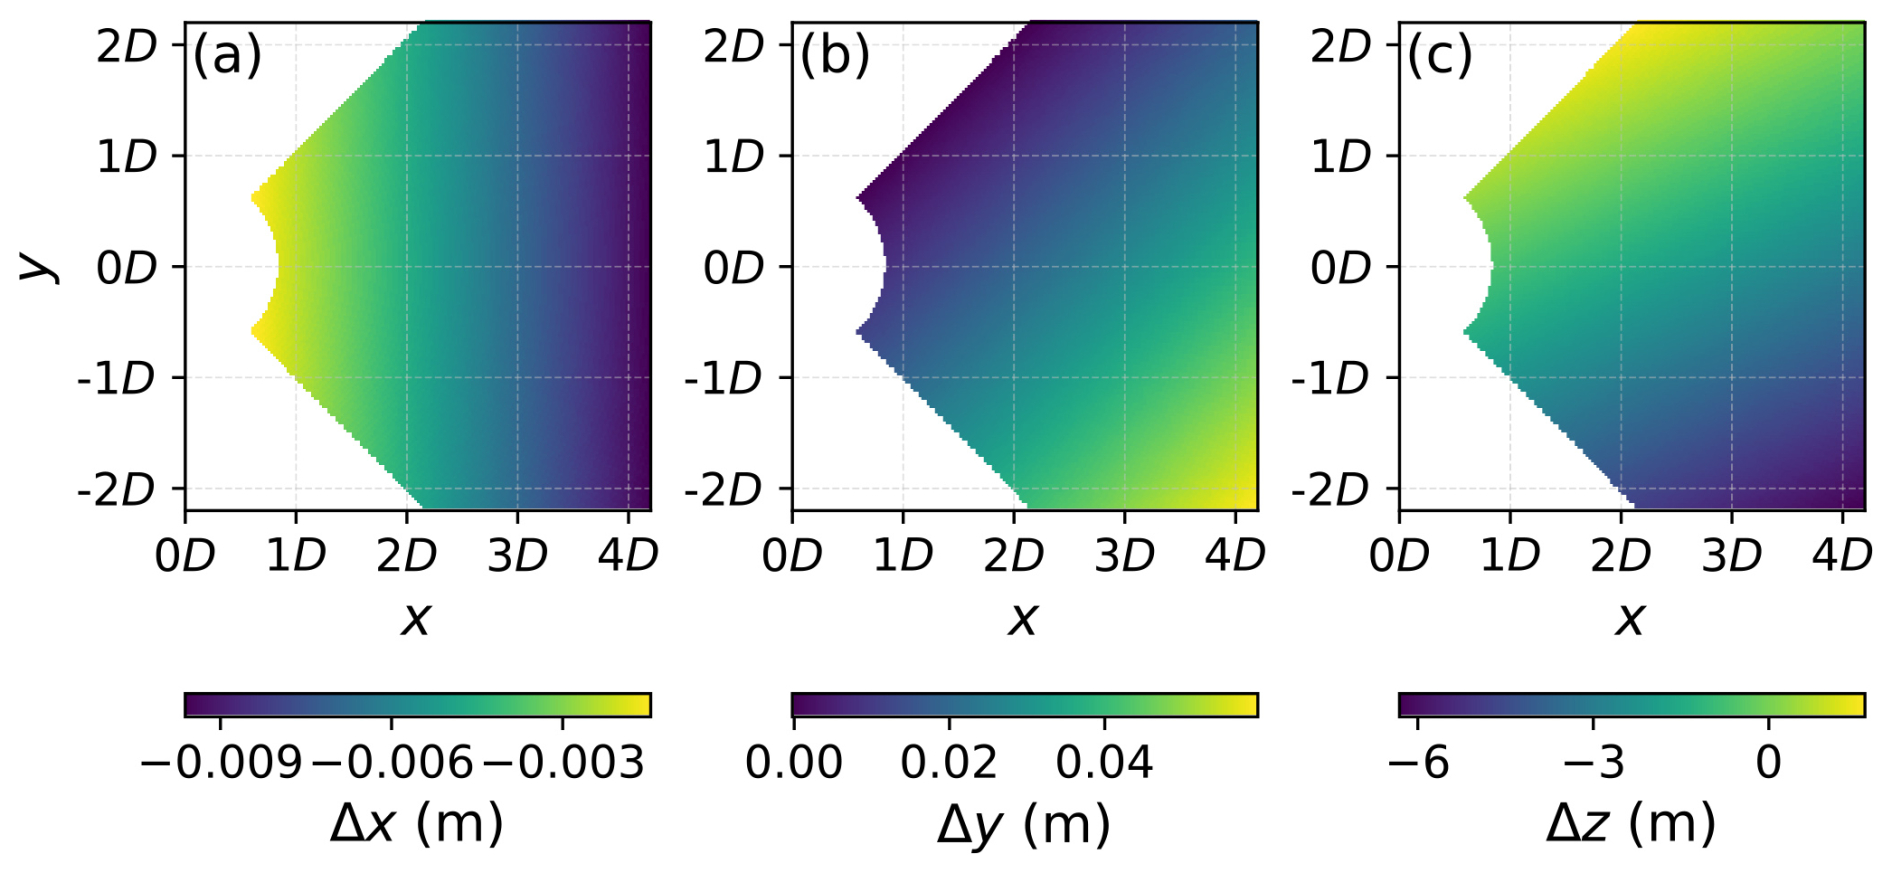
Figure 3The displacement errors in x (a), y (b), and z (c) for an average roll of 0.73° and pitch of 0.36°.
While the IMU measurements account for the motion of the turbine, the pointing accuracy of the lidar is another critical factor for reliable wake measurements. The azimuth pointing accuracy is verified using hard-target scans toward the meteorological masts, which reveals a systematic offset of 0.3°, by which the lidar data are corrected. Overall, the uncertainty in the lidar's azimuth pointing is estimated to be of the order of 1° due to the scanning head's inherent accuracy (Vasiljevic, 2014) and the uncertainty in the turbine's yaw angle. At 4 D downstream, this corresponds to a lateral uncertainty of 8 m, which is smaller than the observed wake features and thus does not significantly affect their interpretation.
3.1 Nacelle lidar data filtering and processing
Several methods have been proposed for filtering lidar data to improve data quality, e.g., by Krishnamurthy et al. (2012), Beck and Kühn (2017), and Alcayaga (2020). To reduce noisy and erroneous measurements, the nacelle lidar data are filtered to retain only data with carrier-to-noise ratio (CNR) values between −25 and 5 dB. For enhanced robustness, a median filter, similar to that of Alcayaga (2020), who used a median-like filter on radial velocities, is applied to each individual scan to first CNR values and second radial velocities. Instead of using two one-dimensional moving windows like Alcayaga (2020), we apply two-dimensional windows considering radial and azimuth direction at once. This filter evaluates each data point by computing the median of CNR or radial velocity values within its local two-dimensional window, which encompasses 11 points in the radial direction and 5 points in the azimuth direction. Measurements that deviate beyond a predefined threshold from the local median are excluded as outliers. Specifically, for the CNR median filter, the threshold is set to 2 standard deviations of the CNR values of the scan, while for the radial velocities, the threshold is 3 standard deviations of the radial velocities of the scan. These thresholds were determined through manual optimization using a test set of scans, effectively removing hard targets and artifacts while preserving the wind field structures, including wind turbine wakes.
The scans are averaged over 10 min, and for each point on the azimuth/range gate grid, the data points are removed if 20 % or more of the single-scan data points are invalid.
The horizontal velocity is estimated from the line-of-sight velocity observed by the lidar under the assumption of perfect yaw alignment of the turbine and the bulk incoming wind direction through
where vLOS is the line-of-sight velocity measured by the lidar and γ the azimuth angle of the beam, with 90° pointing downstream of the turbine.
3.2 Wake detection algorithm
A robust algorithm for detecting and describing wakes is essential for investigating wake characteristics under different atmospheric conditions. As has been shown before (Aitken et al., 2014; Aitken and Lundquist, 2014), the horizontal structure of a wake can be described by a Gaussian function in the far wake, where the impact of the rotor is less relevant for the shape of the wake, by
vh(y) is the function of horizontal wind speeds depending on the lateral position y, A is the amplitude, μ is the lateral wake center position, σ is the standard deviation yielding the wake width σw=4σ, and d is an additional offset.
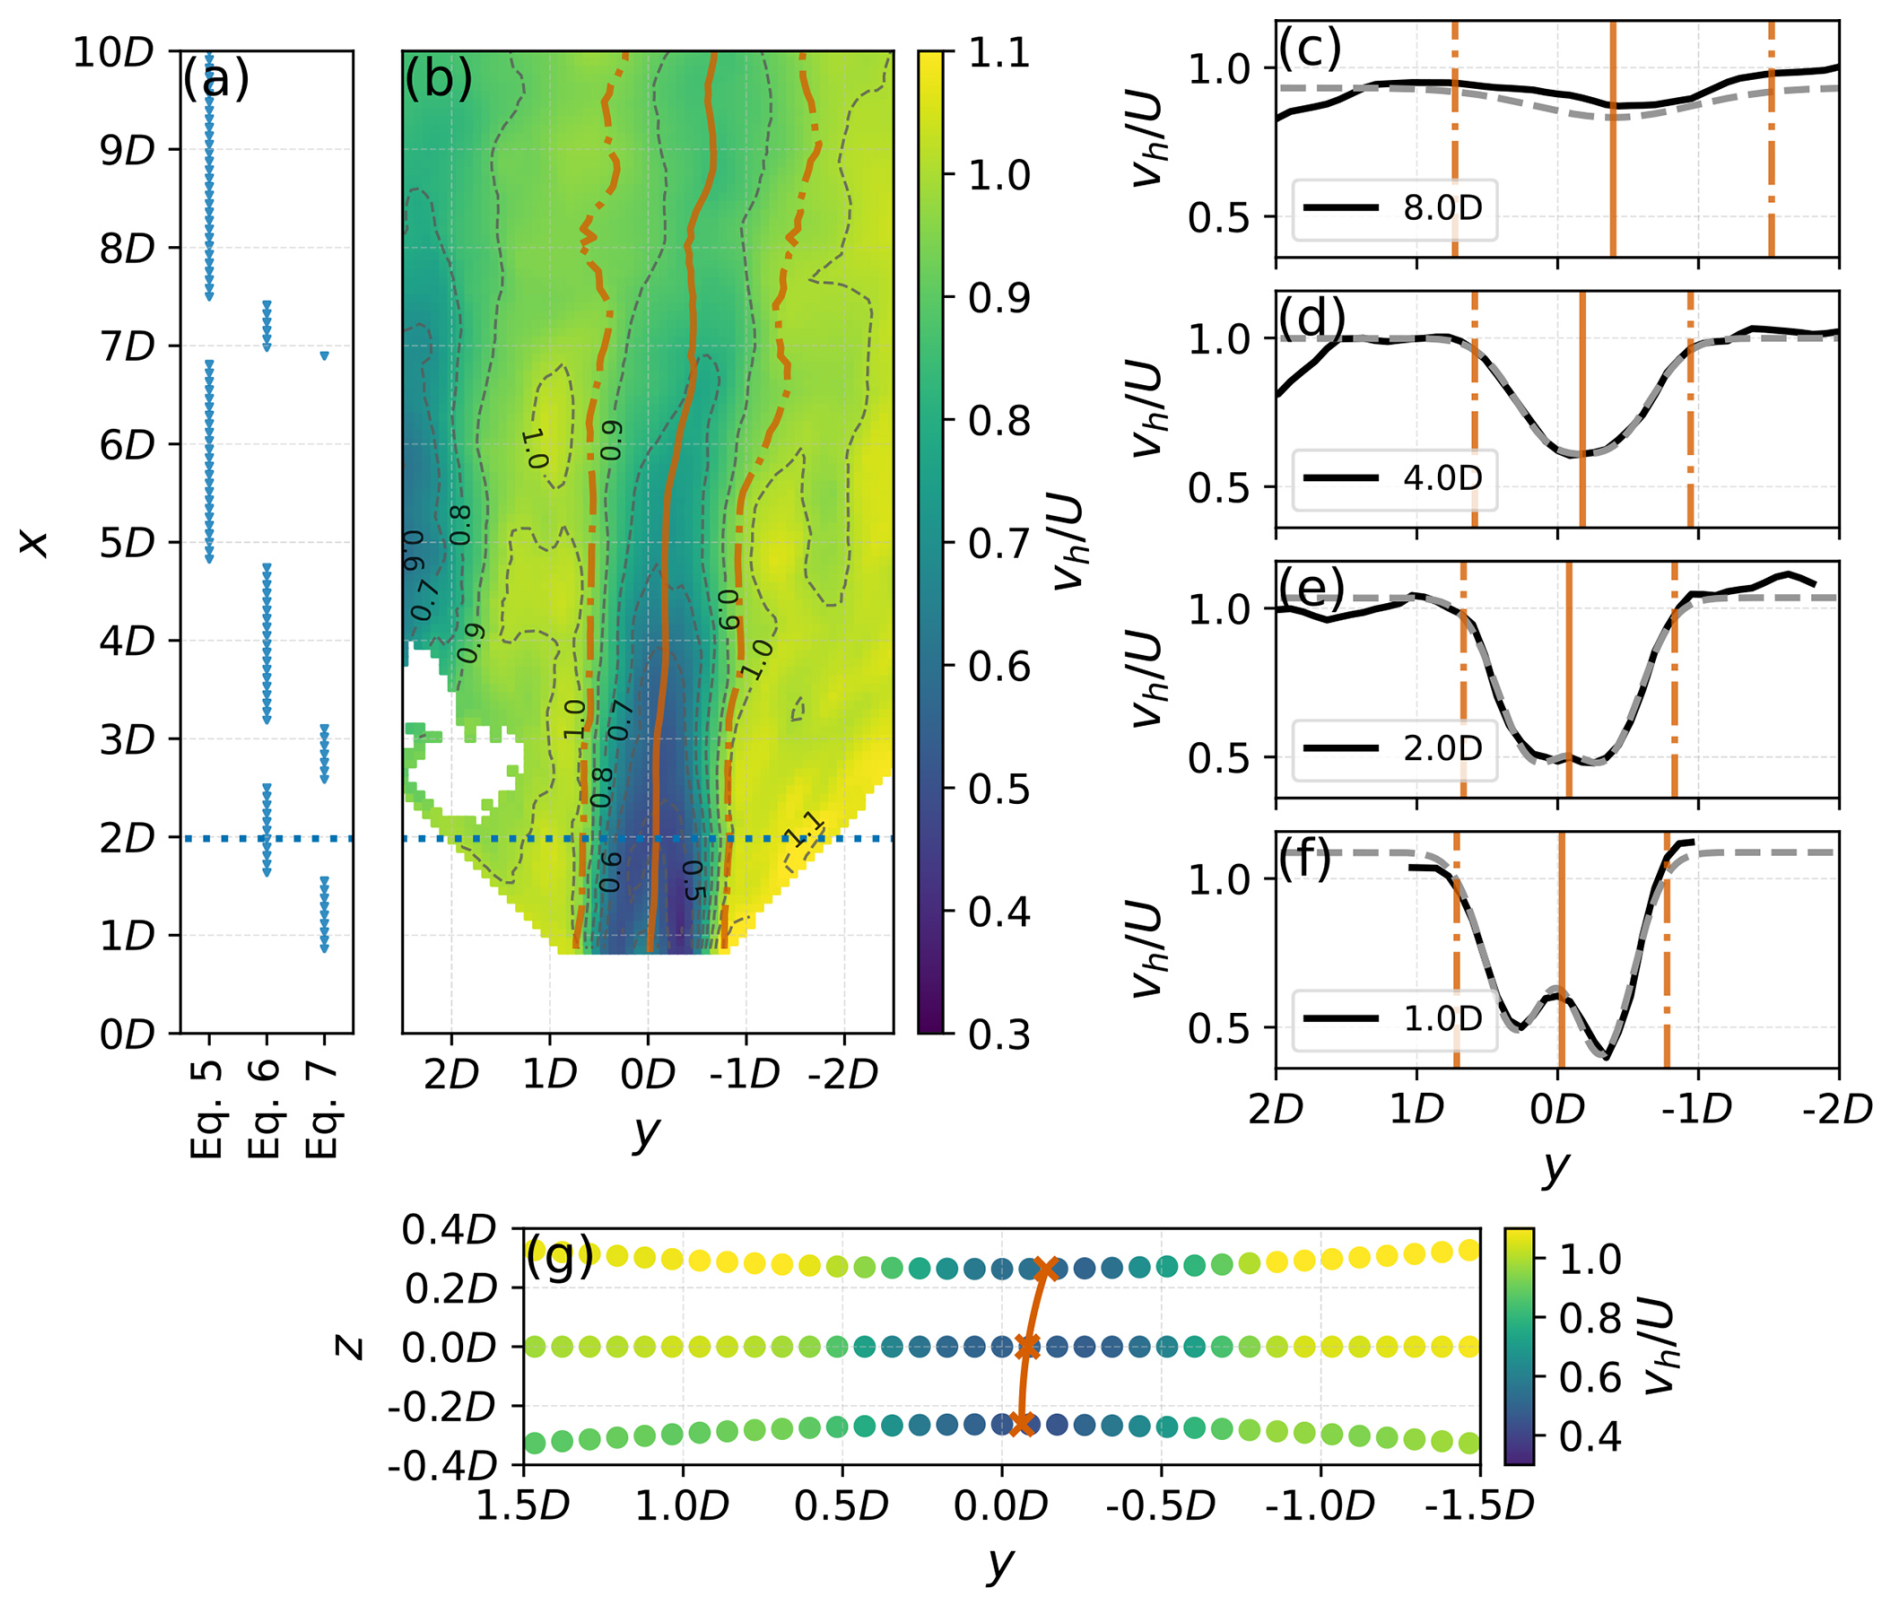
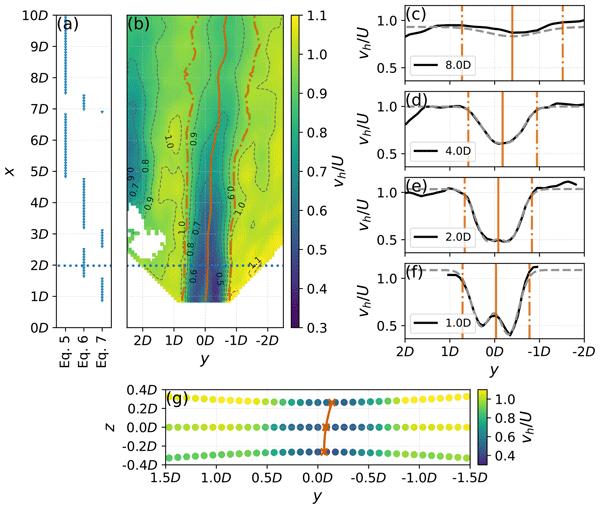
Figure 4Example of wake detection on 20 February 2024 at 03:00 UTC (wind direction: 298°), indicating the best-fitting function in (a) with downstream distance x. of the 0° elevation scan (colors and 0.1 contour lines, gray dashed), together with the wake center line (orange solid) and the wake edges (orange dashed-dotted) resulting from the wake detection algorithm, is shown in (b). Lateral cross-sections of (black lines), the Gaussian fit (gray dashed), vertical lines indicating the wake center (orange solid), and wake width (orange dashed-dotted) at 1 (f), 2 (e), 4 (d), and 8 D (c) downstream. Wake center points (orange crosses) for the three different elevation scans at 1 D downstream with the polynomial fit through the wake centers (orange line), with scatter points colored according to , are shown in (g).
Closer to the wind turbine, in the near wake, the rotor shape is important for the structure of the wake, and it can typically be approximated by a double-Gaussian shape as
where μ1 and μ2 are the respective center positions, and σ is the standard deviation for both overlapping functions. The wake center is then at , and the wake width is given by .
Observations suggest that the wake deficits have different intensities to the left and right of the hub in the near wake, resulting in an asymmetric shape (Onnen et al., 2026). To account for this asymmetry, we modify the double-Gaussian shape by introducing a double Gaussian with two distinct amplitudes A1 and A2, thus expanding Eq. (6) to
The wake center is the center point weighted by the amplitudes; i.e., . This formulation ensures that the wake center represents the centroid of the velocity deficit distribution and thus effectively captures the lateral asymmetry of the wake intensity. Thereby, this method reflects the influence of the velocity deficit on a downstream turbine. The other wake characteristics are calculated the same as for the double Gaussian. Additionally, the asymmetry parameter ΔA is computed as the difference between the two amplitudes relative to the inflow wind speed, specifically, if μ1<μ2, then ; otherwise .
The 10 min averaged vh scans are interpolated to a Cartesian grid spanning −500 to 500 m in the y direction and the minimum range gate of 100 to 2000 m in the x direction with a resolution of 10 m in both directions. For each downstream location (x), all three Gaussian functions are fitted to the gridded velocity data. To decide which function best fits the wake structure, an extra-sum-of-squares F test is used comparing the fits from the least complex to the most complex function (Aitken et al., 2014). At the first downstream position, the initial guess of the wake center location is set to be at the wind turbine position itself, and for subsequent distances, the wake center from the prior distance is used (Wildmann et al., 2018). The wake detection terminates once fitting to Eqs. (5), (6), and (7) fails or one of the following conditions is met:
-
the detected wake center plus its width exceeds the grid in the y direction
-
the difference between two consecutive wake centers is greater than 3 times the grid distance (30 m)
-
the amplitude A is greater than 0.1U
-
σ is greater than 2 D or becomes negative.
The first wake detection must be valid close to the wind turbine (x≤ 200 m), and cases with invalid wake detection up to this distance are discarded from further analysis. To ensure sufficient wake length, a wake must be detected at least at 20 locations in the x direction per timestamp. If the wake detection becomes invalid at a distance of 200 m or further downstream, all subsequent wake detections are also considered invalid, thereby preventing the downstream propagation of unreliable fitting.
An example of a processed horizontal PPI scan is shown in Fig. 4b. A nighttime case with stable conditions is selected, where the wake's velocity deficit is strongly pronounced and persists far downstream, even beyond 10 D. Lateral cross-sections (Fig. 4c–f) demonstrate the evolution from resembling a double Gaussian with asymmetric amplitudes in the near wake, through a double Gaussian, to a single Gaussian in the far wake. Complementarily, Fig. 4a indicates the best-fitting Gaussian function. The wake centerline moves away from the turbine hub towards y<0 further downstream. Further, the filtering of the scans is represented by the exclusion of spurious measurements around the locations of the three masts and OPUS2, i.e., around in Fig. 4b.
To investigate vertical wake characteristics, we followed the recommendations of Sengers et al. (2020) and performed the wake detection at each elevation angle separately at downstream distances of 1, 2, 3, and 4 D. The scan data are first interpolated along the beam to the required downstream distance and then to a vertical plane with y ranging from −500 to 500 m with 10 m spacing, with z calculated for each point in y for the different elevations, resulting in a pattern as shown in Fig. 4g. Interpolation on the vertical plane produced a curved line for the −7 and 7° elevation scans. Points on this plane are vertically further away viewed from the nacelle with increasing and decreasing lateral distance. However, since the maximum difference in z across −1 to 1 D in the lateral direction is 5.9 m at 1 D, 3.36 m at 2 D, and even less further downstream, we assume this curvature can be neglected for determining the wake center position. For the 7 and −7° elevation scans, an initial estimation for the wake center position is provided by the wake center of the 0° elevation fit, resulting from the wake detection described above. Otherwise, the fitting procedure applied to the horizontal elevation scan is followed as well. The wake center positions at different heights μ(z) are then fitted to a second-order polynomial , yielding the curl C and slope S of the wake in the vertical (Sengers et al., 2020), see as an example the orange line in Fig. 4g.
3.3 Determination of near-wake length
The transition point from the near to far wake is the distance where no coherent tip and root vortices can be detected and the flow resembles a self-similar Gaussian shape. This near-wake length is an important quantity for wake model fitting (Neunaber et al., 2024) and estimating the velocity deficit and turbulence characteristics within the wake.
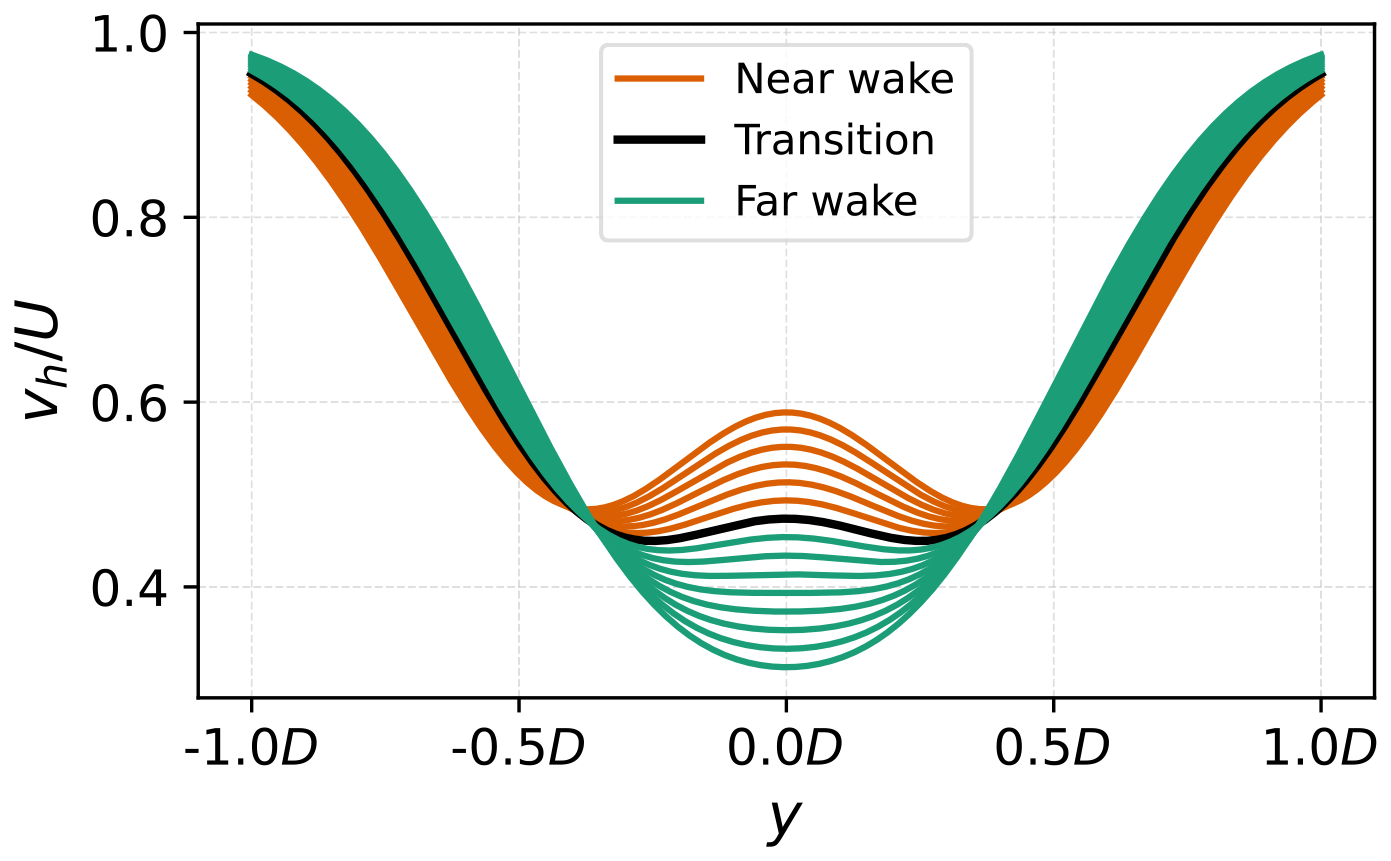
Figure 5Double-Gaussian curves (Eq. 6) in the near-wake region (brown) at the transition point to the far wake (black) and in the far wake (green) for A=0.5, σ=0.3, and d=1 and reducing from 0.4 to 0.26 across y from −1 to 1 D.
The nacelle lidar scans provide high-resolution measurements at hub height and are therefore used in this study to determine the length of the near wake. However, assuming the closest distance where a single Gaussian fits the velocity profile of the nacelle lidar better would tend to overestimate the near-wake length. The increased degrees of freedom of the double Gaussian allow for better fits to the data even when μ1 and μ2 converge, resulting in two barely distinguishable minima. At this point, the velocity ratio, i.e., , at the wake center, which is determined in the Gaussian fitting, is close to the minimum of the double-Gaussian function. Therefore, we introduce an additional criterion for determining the near-wake length: the transition occurs where the difference between the wake center and the minimum velocity ratio is less than 5 %. This concept is illustrated in Fig. 5 for a theoretical example, where μ1 and μ2 in Eq. (6) are successively moved closer together, and eventually the threshold for the transition from the near to far wake is reached (black line). This threshold is established through manual testing across multiple cases. It captures the moment when the two velocity peaks begin to merge, indicating significant overlap and the loss of clear separation between the two regions of reduced wind speed. Hence, this criterion is based on physical behavior rather than statistical model preference. This approach is an alternative to other formulations, such as that proposed by Robey and Lundquist (2024), who defined the near-wake length based on the distance of μ1 and μ2 () in range height indicator (RHI) scans of a turbine wake. Additionally, our approach considers that if the best fit switches to a single Gaussian at a closer distance, then this distance will be considered the near-wake length. If the near-wake length is detected at the first distance where a wake is identified for this 10 min period, the case is discarded because the transition may have occurred before. Such undetected early transitions can result either from failed detection near the turbine or from the lidar's minimum measurement distance being too far downstream. Another reason for a failed determination of the near-wake length is the termination of the wake detection inside the near-wake region.
Following the described data processing and the determination of wake characteristics (Sect. 3), the results of the analysis are presented in this section. The analysis includes wake data of OPUS1 derived from 10 min averaged lidar scans, measured as described in Sect. 2.2, as well as turbine operational parameters of OPUS1 and meteorological parameters, provided by the inflow mast located west of OPUS1; the latter two are described in Sect. 2.1. Only cases with westerly wind conditions and turbine operation without power curtailment are considered. The dataset is limited by the availability of meteorological data from the inflow mast, reducing the number of measured wake periods to 1396 from 15 November 2023 to 9 June 2024. The characterization of the meteorological and turbine parameters of the dataset is presented in Fig. 6. The data cover a wind speed range between 2.9 and 18.9 m s−1; turbulence intensities between 0.017 and 0.3; and a wide range of shear, veer, and stability conditions. Turbine operational parameters show typical variations covering different regions of the power curve, which are displayed in median-centered histograms (Fig. 6i–l) to highlight deviations without disclosing absolute values. Yaw misalignment exhibits a small systematic offset from zero, while thrust coefficient, power coefficient, and tip speed ratio fluctuate around their respective typical operating points.
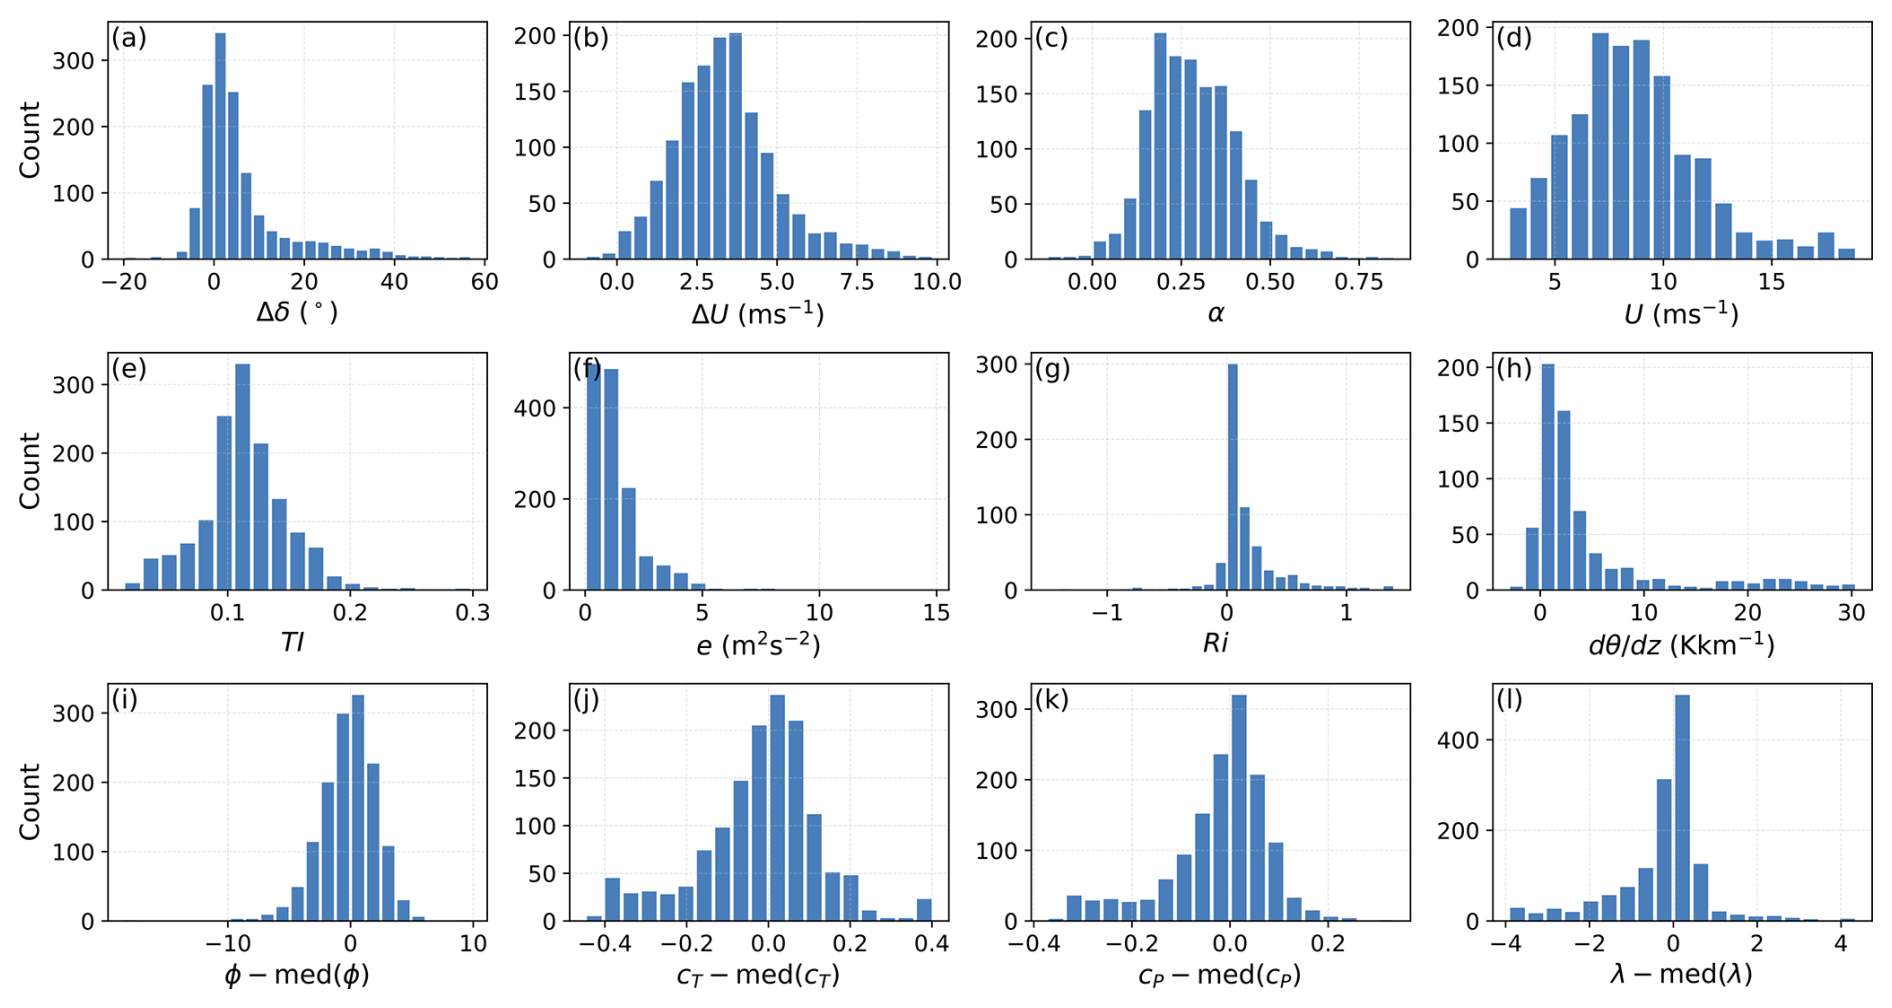
Figure 6Histograms for the selected 1396 periods of 10 min duration of vertical veer Δδ (a), shear ΔU (b), and shear exponent α (c) across the rotor layer, hub height wind speed U (d), turbulence intensity TI (e), turbulent kinetic energy e (f), bulk Richardson number Ri (g), and vertical potential temperature gradient (h) across the rotor layer. Histograms of turbine operational parameters for yaw misalignment ϕ (i), thrust coefficient cT (j), power coefficient cP (k), and tip speed ratio λ (l) are shown relative to their median values.
First, an overview of the mean characteristics of the measured wakes is given. Then, the impact of all turbine and meteorological variables is investigated, using correlations as a basis, and the dataset is reduced to focus the analysis more closely on meteorological conditions. Afterwards, the near-wake length and its dependence on meteorological and turbine conditions are studied using the full dataset.
4.1 Mean wake characteristics
Figure 7 shows the mean values and standard deviations of the velocity deficit (VD), which is defined as , with Umin being the minimum velocity in the wake region (wake center ), as well as of the lateral wake center deflection, μ, and wake width, σw, both of which are derived from Gaussian fitting for all 1396 cases from 1 to 10 D downstream. It should be noted that each detected wake is not necessarily present at all downstream distances, as they could end before 10 D. The mean velocity deficit is the strongest at 1 D downstream (0.57) and decreases to an average of 0.21 at 10 D (Fig. 7a). Around the location of the second turbine (approx. 4.3 D depending slightly on the wind direction), the velocity deficit increases again. At this distance, the wakes of the two turbines start to overlap. However, OPUS2 is not located in the wake of OPUS1 in all cases due to the width of the chosen wind direction sector; i.e., the wakes of the two turbines will not always overlap. Consequently, the effect of OPUS2 wakes on the wake characteristics seen from OPUS1, e.g., on the velocity deficit, is smoothed out. Further downstream of OPUS2, the velocity deficit weakens again. Furthermore, the wake center is deflected on average towards the right side behind the rotor (μ<0) with a maximum average deflection of 0.56 D at 10 D (Fig. 7b). The wake width, representing lateral wake expansion, increases with downstream distance as the wake expands from a mean of 1.48 D at 1 D to almost double with 2.78 D at 10 D (Fig. 7c). For the estimation of lateral asymmetry ΔA, two different amplitudes from the Gaussian fit are required. As described in Sect. 3, only the best-fitting function is evaluated; therefore, only cases in which the best-fitting function is the double Gaussian with two amplitudes (Eq. 7) can be considered for estimating the lateral asymmetry. This covers 68 % of cases at 1 D, 32 % at 2 D, 19 % at 3 D, and 16 % at 4 D, indicating insufficient data for a comprehensive analysis further downstream. Therefore, the analysis of wake asymmetry is restricted to the distance of 1 D. The distribution of asymmetry ΔA at 1 D downstream shows predominantly positive values, indicating a more pronounced velocity deficit on the right-hand side (facing downstream) on average (0.11) (Fig. 7d). The vertical wake parameters slope and curl are evaluated at 1 and 2 D. The slope at 1 D downstream varies from negative to positive, with a slight negative average of −0.09 (Fig. 7e). Thus, on average the wake center is shifted aloft to the right and down to the left. The values of the curl are mainly positive at 1 D downstream, i.e., 0.004 m−1 (Fig. 7f). To investigate near-wake features and consider the wake of the first turbine solely, the following analysis will cover distances up to 4 D downstream.
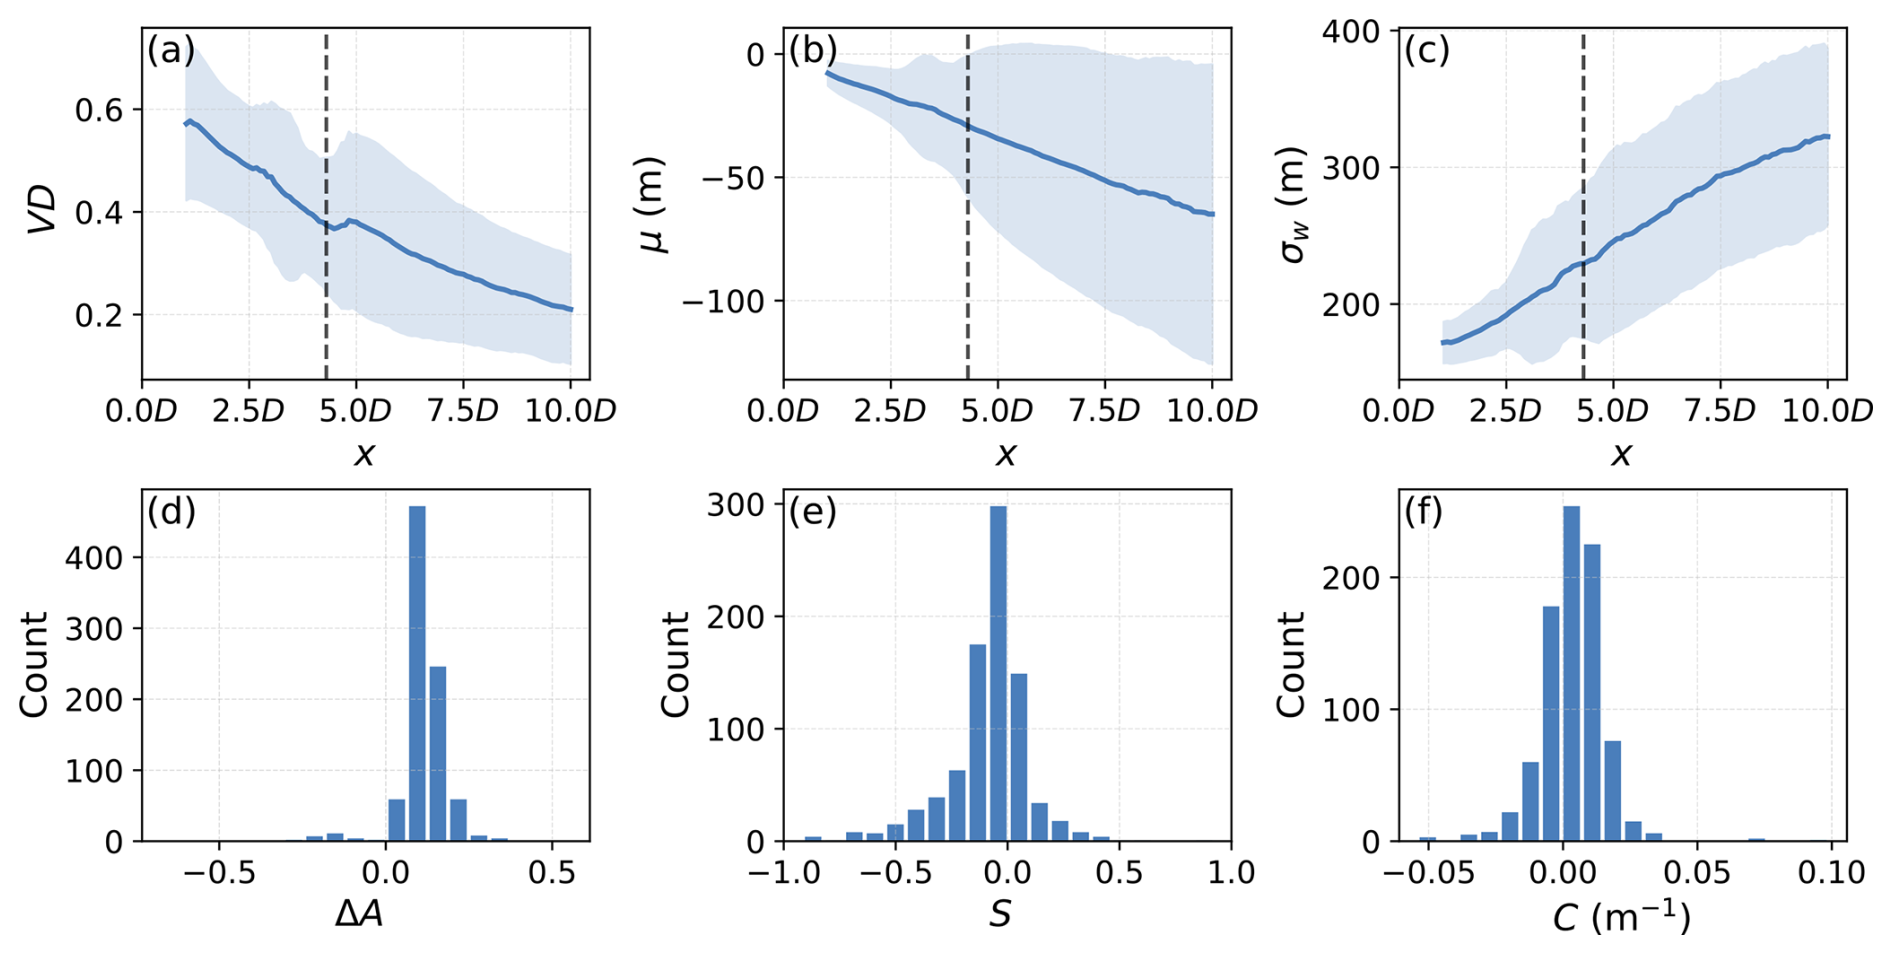
Figure 7Mean (lines) and region of ±1 standard deviation (shades) of the velocity deficit (VD) (a), lateral wake center deflection μ (b), and wake width σw (c) from 1 to 10 D downstream deduced from lidar data with 20 m range gate separation. Histograms of asymmetry ΔA (d), vertical slope S (e), and vertical curl C (f) at 1 D. In (a)–(c), the vertical black dashed line indicates the location of OPUS2 at 4.3 D.
4.2 Correlation with turbine conditions
The correlations of the wake characteristics to the inflow and turbine conditions are displayed in Fig. 8 for downstream distances from 1 to 4 D for VD, μ, and σw; 1 D for ΔA; and 1 to 2 D for slope and curl. Correlation strengths are classified as weak (≤ 0.3), moderate (0.3–0.7), or strong (> 0.7). Statistical significance is assessed using p values, with p≥ 0.05 considered insignificant.
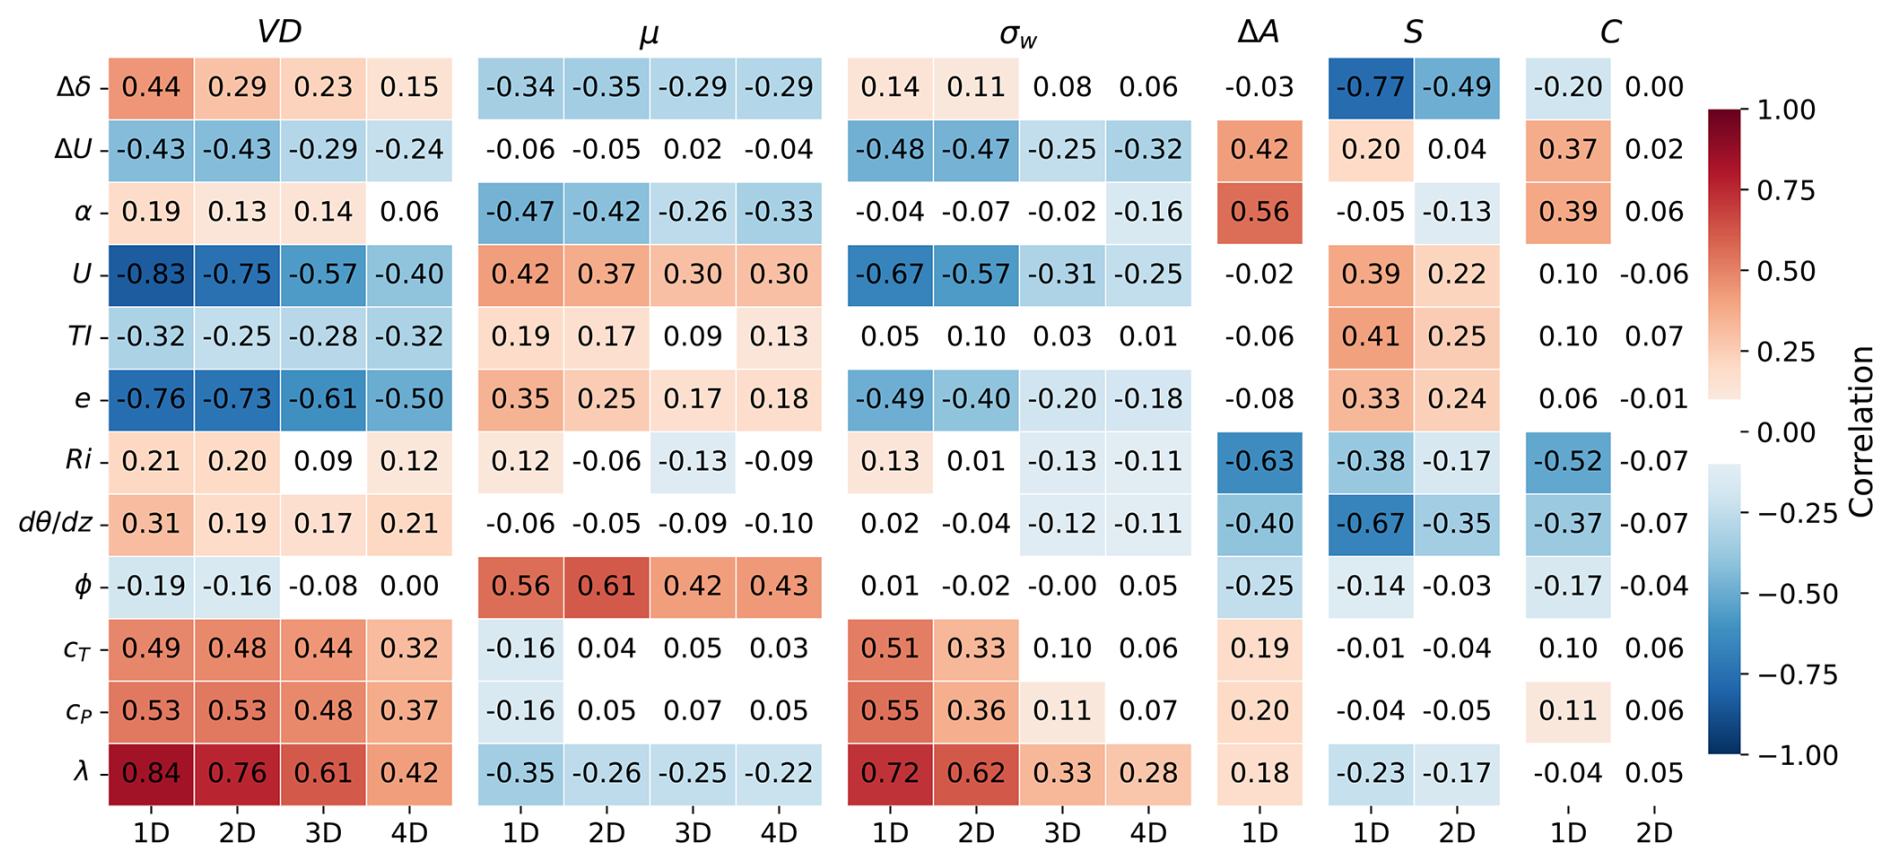
Figure 8Heatmap showing Pearson correlations of wake characteristics (columns) against meteorological and turbine variables (rows) for downstream distances 1–4 D, with correlations for ΔA solely at 1 D and S and C at 1–2 D.
The velocity deficit shows a strong negative correlation with wind speed, which can primarily be attributed to the reduced energy extraction above rated power. Consequently, velocity deficits are lower at higher wind speeds. Above rated wind speed, the turbine operational parameters cP, cT, and λ are reduced, leading to overall moderate-to-strong positive correlations with VD. It is important to note that these turbine operational parameters are related to the inflow wind speed to optimize power production of the wind turbine. Therefore, it is likely that only one of these parameters has a dominant impact on the wake characteristics due to their intercorrelations. Overall, the correlations get weaker with increasing distance from the turbine, illustrating that the impact of the turbine features is the highest close to the turbine in the near wake.
The lateral wake center deflection μ is most strongly correlated with yaw misalignment for 1 to 4 D downstream. However, even when yaw misalignment is positive, the wake center is still deflected to the right of the rotor in almost all cases (89.24 % at 1 D), indicating that yaw misalignment alone does not explain the lateral wake center deflection, and interaction with the ABL becomes determinant.
The wake width exhibits similar correlation patterns to those of the velocity deficit. σw is the most correlated with wind speed and turbine conditions cT, cP, and λ at 1 D, with these correlations diminishing further downstream. The negative correlation between σw and U can be explained by the significant reduction in wake width above rated wind speed. Therefore, the positive correlations with cT, cP, and λ are predominantly caused by the fact that these parameters, like σw, decrease above rated power.
The asymmetry of the velocity deficit in the near wake is positively correlated to cT, cP, and λ mainly due to cases with negative amplitude, which distort the correlations here. Yaw misalignment shows a negative correlation; i.e., asymmetry is weaker for a clockwise-rotated turbine.
The correlations of turbine parameters to the vertical shape of the wake, i.e. slope and curl, are overall weak or statistically insignificant. Tip speed ratio and slope are slightly negatively correlated. In particular, this negative correlation is due to more positive slopes (inclined to the left at the top) for low tip speed ratios, which correspond to high wind speeds above rated power.
4.3 Correlation with meteorological conditions
To minimize the influence of turbine parameters, which significantly impact wake characteristics (Sect. 4.2), and to allow for a clearer examination of the effects of atmospheric parameters, the wake dataset is refined. We filter our dataset to include only turbine operation between cut-in and rated power, where turbines maintain an optimal tip speed ratio under varying wind speeds to maximize power output. Accordingly, the filtering conditions are and . Under these operating conditions, wake effects are the strongest due to the highest energy extraction from the wind. This effect is illustrated in Fig. 9, showing VD as a measure of wake strength versus wind speed, where energy extraction between Umin and Umax is the largest. These wind speed limits are used as filter criteria as well. Additionally, only conditions with near-perfect turbine alignment with the incoming wind are considered; i.e. .
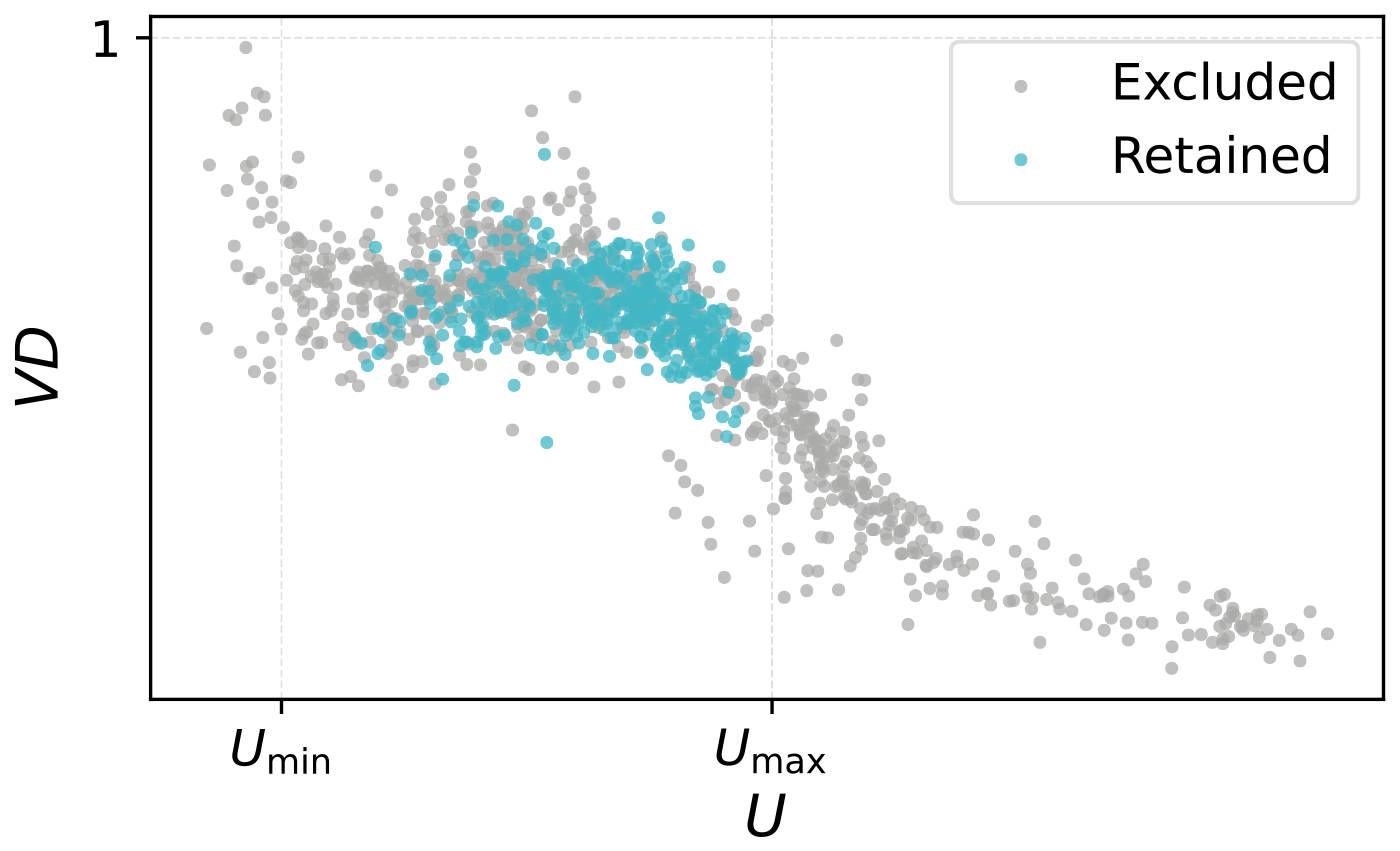
Figure 9Velocity deficit (VD) at 1 D downstream against hub height wind speed. The x axis shows minimum and maximum U values used for filtering. Cases retained after the filtering for turbine operation conditions are colored in blue, and data points that are filtered out are shown in grey.
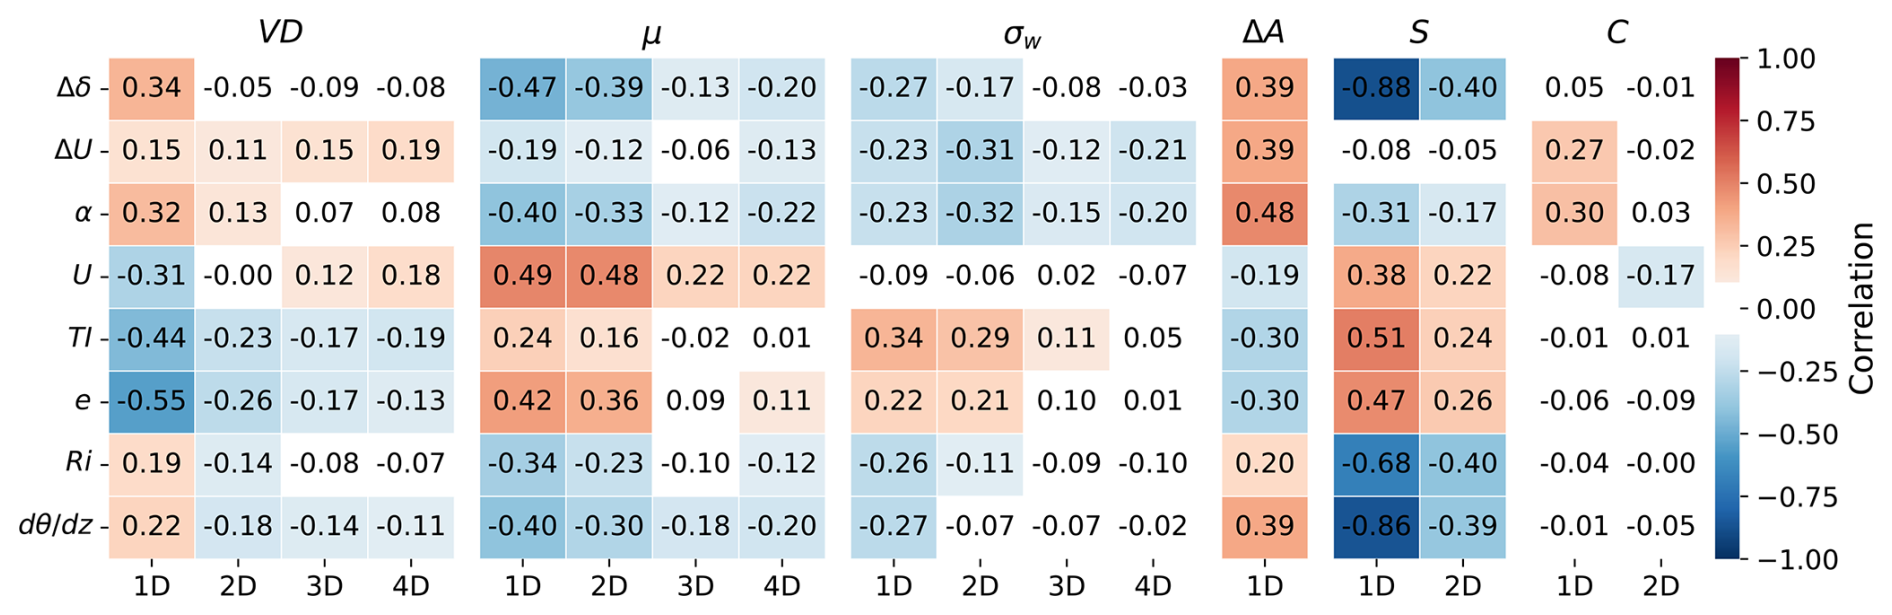
Figure 10Same as Fig. 8 but filtered for turbine operation conditions and showing only meteorological parameters.
Correlations are calculated for meteorological parameters with wake characteristics for this filtered dataset and shown in Fig. 10. The velocity deficit is more pronounced under stable conditions, as indicated by weak positive correlations to stability parameters Ri and at 1 D downstream. As shown, e.g., in a LES study by Abkar and Porté-Agel (2015), stable stratification suppresses turbulent mixing, leading to stronger, more persistent wakes. The highest correlations between VD and the stability parameters Ri and occur at 1 D. At 2 D, the correlation drops and becomes negative, becoming statistically insignificant from 2–4 D for Ri and at 3 and 4 D for . In stable ABLs, turbulence, here represented by TI and e, is usually lower. Consequently, negative correlations of VD with turbulent characteristics TI and e support the fact that wake velocity deficits are stronger under stable conditions. These negative correlations are the strongest at 1 D and remain statistically significant further downstream. Positive correlations are observed with stability-related parameters such as veer, shear, and shear exponent. However, only the positive correlations with wind shear remain statistically significant up to 4 D downstream. Overall, the correlation values between shear and the shear exponent may differ. Shear is closely related to the inflow wind speed, as higher gradients typically occur at higher wind speeds. Thus, shear is an indicator of the velocity change experienced by the rotating blades, providing a link to asymmetric turbine loading and fatigue. In contrast, α is less dependent on the inflow wind speed and yields information about the shape of the vertical wind profile and thus to some extent about ABL stability. Notably, α is well-defined in a neutral ABL, where a logarithmic wind profile usually prevails.
The wake center is displaced further to the right downstream with increasing veer, shear, shear exponent, Ri, and (negative correlations) for all four downstream distances analyzed. These parameters are strongly connected to the stability of the ABL. With yaw misalignment close to zero, this behavior strongly indicates the effect of varying atmospheric stability on the wake center position. This implies that the wake center is more greatly deflected towards the right under stable conditions than under neutral and unstable conditions. The strongest negative correlations appear with the veer of the inflow, suggesting that higher veering, a feature commonly linked to a stable ABL, is a primary cause of the lateral wake center deflection. On the other hand, quantities representing turbulence and wind speed exhibit positive correlations, implying reduced deflection under stronger turbulence in the inflow usually associated with rather unstable conditions. Conversely, higher deflection is associated with less turbulent conditions generally linked to stable, turbulence-suppressing conditions.
For the wake width, correlations with characteristics of more stable conditions, such as shear, veer, Ri, and , are negative, whereas correlations with turbulence parameters are positive, indicating narrower wakes during stable conditions and wider wakes during unstable conditions. However, significantly high correlation values (≥ 0.1) are observed from 1 to 4 D only for shear and the shear exponent. The correlation values for wake width and atmospheric parameters are rather low in total, suggesting that other wake characteristics depend more strongly on the ABL.
The lateral asymmetry in the near wake, a phenomenon that has received limited attention in the literature, exhibits a complex relationship with atmospheric stability and turbulence characteristics. After filtering for turbine operation conditions, only positive asymmetry values are observed in the data. Thus the correlation values here are not distorted by negative cases. The asymmetry is most strongly correlated with and the shear exponent, both indicators of atmospheric stability, showing more pronounced asymmetry under stronger static stability. Shear, veer, and the Richardson number are also positively correlated because they are linked to the stability of the ABL as well. Conversely, asymmetry is negatively correlated with turbulence quantities, including TI and e, as turbulence is generally weaker in stable atmospheres, and similarly negatively correlated to wind speed.
A strong-to-moderate correlation is observed between the wake slope and stability quantities, such as veer, the Richardson number, and . Specifically, the correlations are negative as the slope is negative when the wake center at the upper levels is displaced to the right and at the lower heights to the left. The correlations with veer and are particularly high (−0.88 and −0.86 respectively at 1 D), indicating that stronger veering during a more stable ABL directly leads to stronger vertical skewness of the wake in the vertical. Further, the slope of the wake is therefore positively correlated with turbulence values, as stable conditions are typically characterized by lower turbulence levels.
By contrast, the curl of the wake shows generally weaker correlations with atmospheric conditions, with statistical significance restricted to specific meteorological parameters and distances. At 1 D, significant positive correlations are observed with wind shear and the shear exponent, suggesting stronger curl with more stable conditions. However, turbulence quantities and stability measures, Ri and , do not show significant correlations with curl at either distance. Therefore, the impact of stability on the curl remains unconfirmed, likely due to the reduced data availability for Ri and (n=126 at 1 D, n=186 at 2 D) compared to other meteorological variables.
Compared to the unfiltered dataset, the largest differences in the correlations of VD appear apart from U with ΔU. This results from low VD occurring above Umax, which relates to higher ΔU values and skews the correlation towards negative values. After filtering the data, however, ΔU is more closely associated with stability and therefore positively correlated with VD. This effect is similar for correlations of σw with e. In the unfiltered data, the correlation is dominated by small wake widths at high wind speeds above rated power with higher e, while this effect vanishes in the filtered data, resulting in weak positive correlations between σw and e. Additionally, major deviations occur for the correlations between ΔA and Ri, , and Δδ after filtering. This change is primarily driven by a few cases with negative lateral asymmetry present in the unfiltered dataset. These cases occur under stable conditions with high , Ri, and Δδ values and low turbulence, cT, and U levels (some even below Umin). These conditions distort the distribution at high values of , Ri, and Δδ, leading to negative correlations in the unfiltered dataset. After filtering, where only positive asymmetry values remain, these meteorological parameters become positively correlated to ΔA. For U, TI, and e, the effect is different, as in the unfiltered dataset the negative amplitudes at low U, TI, and e distort the correlations to be closer to zero than in the filtered case, showing weak-to-moderate negative correlations. For the slope and curl of the wake, the correlations remain comparable between the unfiltered and filtered datasets, with the exception of the correlations of curl to and Ri. These shift from moderately negative values in the unfiltered data to statistically insignificant after filtering. The other correlations are unchanged, suggesting that the data points removed during filtering align with the general correlation trends. This indicates that the vertical skewness of the wake is not predominantly impacted by turbine operating conditions but rather by atmospheric conditions.
4.4 Near-wake length
The near-wake length is determined using the approach described in Sect. 3.3 for all 1396 cases, without filtering the dataset for specific turbine operation. Particularly, the near-wake length is defined as the downstream location either at which the difference between the wake center and the minimum velocity ratio of the double-Gaussian fit is within 5 % (green bars in Fig. 11a) or at the onset where the single Gaussian provides a better fit to the wake velocity profile (yellow bars in Fig. 11a). In this way, the near-wake length is determined for 1266 of the 1396 cases. In the remaining cases, the far wake has either already evolved at the first wake detection point (123 cases) or the wake detection is too short, not reaching into the far wake (7 cases). Overall, the transition from the near to far wake is detected in 95.10 % of the cases using the criterion of 5 % difference between the wake center and minimum velocity ratio rather than the single-Gaussian fit onset. This shows the importance of including additional conditions beyond relying solely on changes in the best-fitting functions.
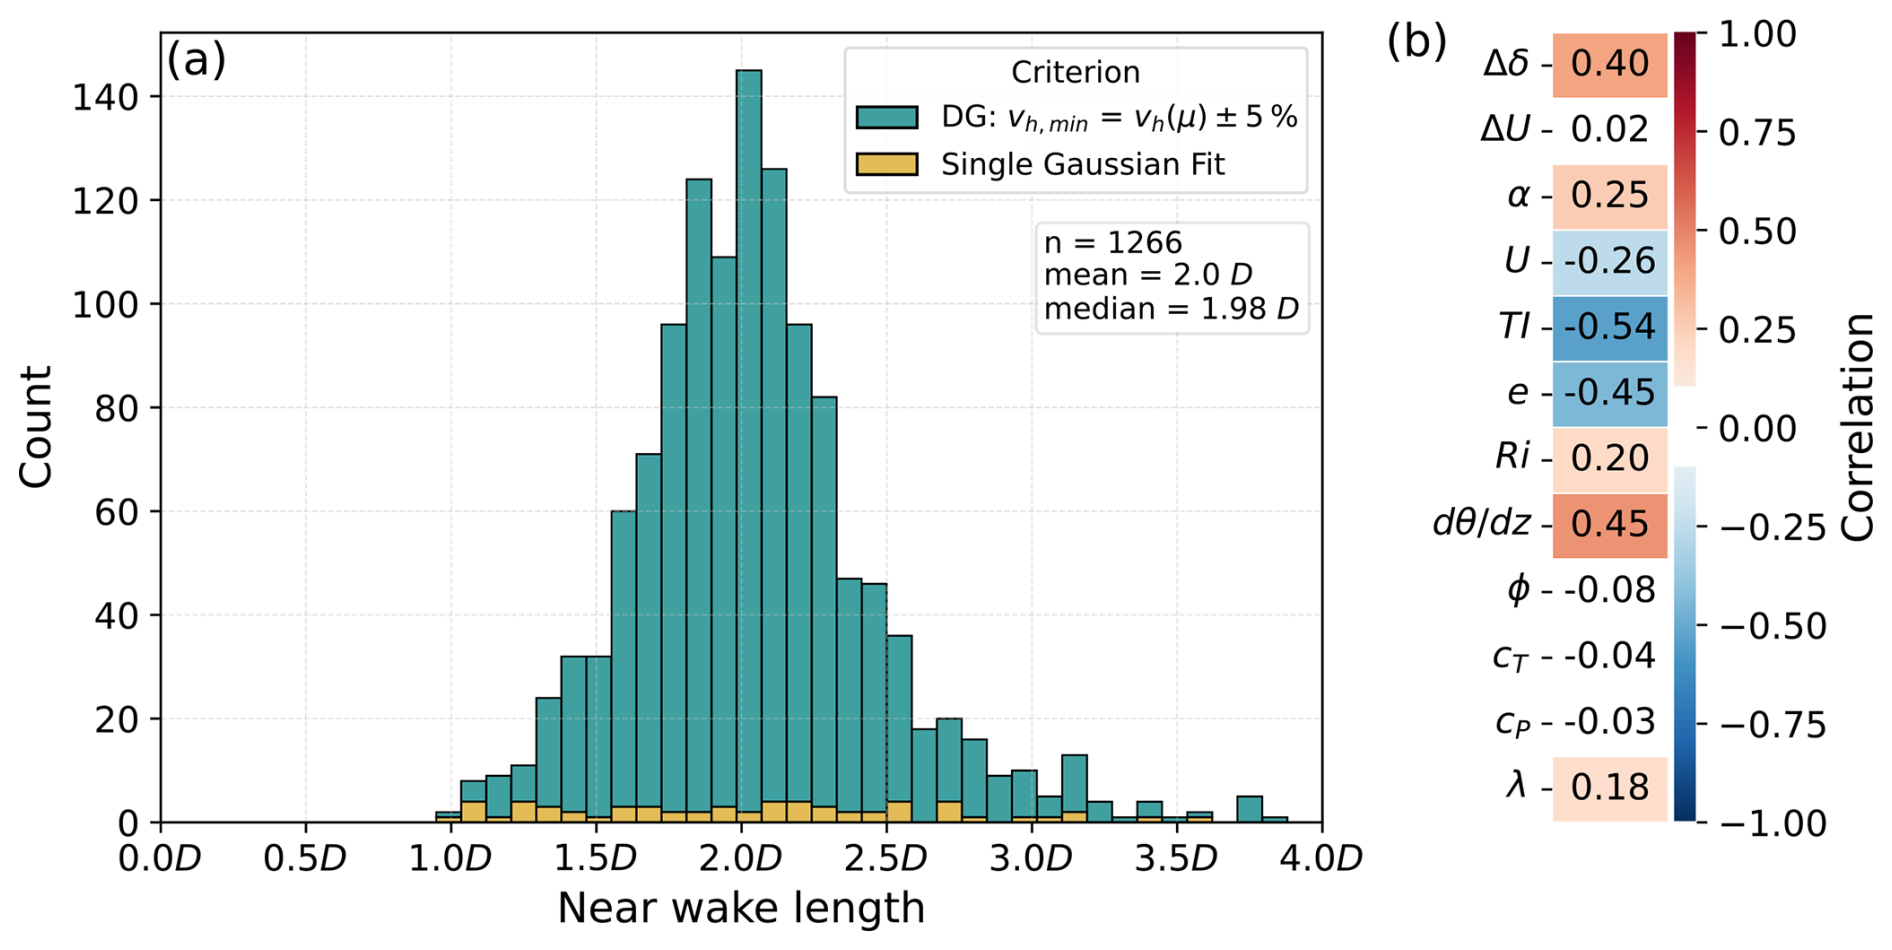
Figure 11Histogram of detected near-wake lengths in (a) with stacked bars, with colors indicating the choice of the criterion for near-wake length determination and the heatmap indicating Pearson correlations of the near-wake length against meteorological and turbine variables (b).
The histogram of all valid cases shows an approximately normal distribution of near-wake lengths. The lengths range from 110 to 440 m with a mean of 232.04 m (2.0 D) and a standard deviation of 49.18 m (0.42 D) (Fig. 11a). However, the distribution is truncated at a minimum near-wake length of 110 m, since the lidar measurements begin at 100 m. Generally, shorter near-wake lengths correspond to conditions that feature faster wake recovery. This is reflected in the strongest negative correlations with turbulence quantities TI and e (Fig. 11b), indicating that higher turbulence levels enhance wake mixing and consequently result in shorter near-wake lengths. Additionally, wind speed shows a weak negative correlation, as it is generally associated with higher turbulence. In contrast, characteristics related to atmospheric stability show positive correlations to the near-wake length. The vertical potential temperature gradient shows the strongest positive correlation, followed by wind veer, Ri, and α, suggesting the near-wake length persists over longer distances under stable ABL conditions with weaker mixing and stronger stratification. The distinction between α and shear is important here as their correlations with near-wake length differ significantly. From our data, shear shows correlation close to zero, while the shear exponent exhibits a weak positive correlation. Shear is sensitive to absolute wind speed and can vary substantially under similar stability conditions. In contrast, the shear exponent is more robust across different stability regimes, since it is normalized by wind speed and thus dimensionless. Therefore, it better reflects the shape of the wind profile and is thus to some extent linked to atmospheric stability. As such, higher values of α are associated with a more stable ABL and reduced mixing, which in turn prolongs the near-wake region.
Correlations with turbine operating parameters are generally weak and close to zero. The tip speed ratio shows a slight positive correlation, while yaw misalignment, thrust coefficient, and power coefficient exhibit negligible correlations with near-wake length.
In summary, the strongest correlations with near-wake length are observed for TI, , e, and Δδ, highlighting that meteorological conditions are the dominant factors in determining the near-wake extent. Turbine parameters show minimal influence, with all correlations remaining below 0.18.
5.1 Impact of stability and veer on wake characteristics
In this study, we observe that apart from traditional parameters used in analytical wake models, such as turbulence intensity and shear exponent, ABL characteristics like wind veer and the vertical potential temperature gradient exhibit high or even stronger correlations with wake characteristics.
Specifically, vertical wind veer shows a strong correlation with lateral wake center deflection, exceeding that of α and TI. This effect is particularly pronounced in a stable ABL, where vertical wind shear and wind veer across the rotor layer develop and turbulence is reduced, resulting in low mixing of the wake with the environment. While yaw misalignment has been shown to significantly impact the wake center position in previous studies, including LES by Vollmer et al. (2016), a combination of LES and observations by Bromm et al. (2018), and an observational study by Brugger et al. (2020), our results show that even when yaw misalignment is positive, the wake center is still deflected to the right of the rotor in almost all cases (89.24 % at 1 D). This indicates that yaw misalignment alone cannot explain the majority of observed lateral wake center deflection, as positive yaw misalignment would typically result in a wake center deflection to the left. Additionally, the lateral asymmetry of the velocity deficit contributes to the lateral wake deflection in the near wake. By calculating the wake center as a weighted average of the two Gaussian amplitudes, the centroid of the velocity deficit is captured, which reflects the asymmetry of the wake. This effect is most pronounced close to the turbine (at 1 D) and decreases with downstream distance as the wake transitions to a single-Gaussian shape. Together, these aspects suggest that the dominant mechanism causing lateral wake center deflection appears to be the interaction between the turbine and the veering flow in the stable ABL. This is shown by the negative correlation of veer and deflection for the full dataset in Fig. 8 and for the refined dataset in Fig. 10. This mechanism is supported by the LES study from Vollmer et al. (2016), which demonstrates that in a stable ABL with strong veering across the rotor layer, wake center deflection to the right occurs without yaw misalignment or even with yaw misalignment up to 10°, whereas in a neutral ABL with weak veering, there is no significant wake center deflection observed without yaw misalignment, and leftwards deflection occurs with 10° yaw misalignment. This effect has implications for wind farm control, like wake steering, where accurate predictions of wake center positions are essential for optimizing wake–turbine interactions. Therefore, incorporating veering into such a wake model could significantly improve accuracy.
According to our study, veer is the primary meteorological factor not only for lateral deflection of the wake center, but also for the wake's vertical skewness in the cross-stream plane. Strong correlations are observed between the vertical slope of the wake and veer as well as , while the correlations to turbulence and shear exponent are significantly lower. Experimental studies by Bodini et al. (2017) and Sengers et al. (2023) provide support for this relation, reporting a correlation coefficient of approximately 0.75 between wake slope and veer. Notably, Bodini et al. (2017) further demonstrated that the angular change of the wake centerlines across different heights almost mirrors that of the wind veer, though it remains slightly smaller. Nevertheless, vertical wind veer is not considered in simple engineering models, such as those proposed by Bastankhah and Porté-Agel (2014), King et al. (2021), and Keane (2021) and advancements thereof. The inclusion of veer in wake models has been shown to significantly improve accuracy, reducing prediction errors to levels comparable to that of circular wakes (Brugger et al., 2019).
The simple wake models assume a constant wind direction across the rotor layer and calculate lateral wake center deflection dependent on yaw misalignment. Therefore, they insufficiently depict the deflection of the wake center under veering conditions. This would have an impact on the wind resource estimation at downstream positions for wind farm assessment, especially at locations with strong diurnal veer cycles and strong stable boundary layer evolution during nighttime, such as in continental regions and flat terrain. We suggest that lateral wake center deflection and vertical wake skewness due to veer represent a significant mechanism that should be incorporated into wake modeling, particularly in a stable or transitional ABL. Future wake model developments could benefit from including lateral wake center deflection and vertical skewness terms dependent on veer, e.g., through (semi-)empirical adjustments or by extending vortex-based approaches to account for the rotational effects of veering flow. These improvements could enhance the accuracy of wake predictions in scenarios where veer is a prominent factor, leading to more robust wind farm simulations for layout optimization and wake control during turbine operation.
5.2 Lateral asymmetry of velocity deficit in near wake
The asymmetry of the double-Gaussian velocity ratio in the near wake of the turbine is observed to be most strongly and positively correlated to the shear exponent and the potential temperature gradient, indicating that the difference between the two velocity minima is higher in a stable ABL, i.e., positive and higher α.
Lateral asymmetry can be attributed to the counterclockwise rotation of the wake induced by the clockwise rotation of the turbine. This motion transports slower wind velocities from below hub height upward towards the right and higher wind speeds from aloft toward the left side, resulting in a stronger velocity deficit on the right-hand side. Recent field experiments, including those by Onnen et al. (2026), confirm this wake behavior under sheared inflow, supporting the relationship between the shear exponent and wake asymmetry. Drone-based observations (Wildmann and Kistner, 2025) further demonstrate that tip vortices are stronger and remain coherent for a longer distance on the right side, indicating that vortex dynamics significantly contribute to sustaining the asymmetry. This suggests an interplay between stability of the ABL and vortex dynamics, which impact the evolution and persistence of a stronger velocity deficit on the right side. The asymmetry is mainly observed close to the turbine, at 1 D, whereas at 2 D the wake structure mainly fits better to a simple double Gaussian with the same amplitude magnitudes or a single Gaussian, suggesting that the asymmetry decreases quickly downstream in the velocity signal. Most simple analytical models neither employ a double-Gaussian representation in the near wake nor account for lateral asymmetry. Future models for wind farm layout and control optimization could benefit from accounting for this asymmetry under stable conditions.
These findings highlight the need for future observational studies that resolve near-wake dynamics including tip vortices and the wake swirl, such as by drone measurements, to investigate the interaction between the stability of the inflow and vortex dynamics around utility-scale wind turbines. Consequently, measurements across a range of atmospheric conditions, particularly under varying atmospheric stability regimes, are essential. Apart from vortex-resolved and three-dimensional wind velocity observations, measuring and investigating turbulence in the near wake and its potential asymmetries, as well as its development further downstream, would enable a more accurate understanding and modeling of wake-added turbulence.
5.3 Near-wake length
In this study, we observe an average near-wake length of 2.0 D and its dependence on meteorological and turbine conditions. The range of near-wake lengths aligns with findings from prior studies. Vermeer et al. (2003) reported the near wake extending up to 2–4 D downstream, while Zhan et al. (2020) observed a near-wake length of 1.75 D downstream.
Meteorological conditions show a partly strong correlation to the near-wake length, while turbine operating conditions show weaker correlations. It is essential to note that the influence of turbine operating conditions, including the thrust coefficient, which is often considered in engineering models such as that of Vahidi and Porté-Agel (2022a), on the near-wake length cannot be conclusively determined from this study. To isolate the dependency on cT, it would be necessary to conduct a controlled analysis where inflow parameters are kept constant while varying cT. Furthermore, the minimum detectable near-wake length of 110 m may limit the sensitivity to differences in near-wake length in general, as shorter near-wake lengths may not be captured. Thereby, the wake deficit may already transition from a double-Gaussian shape to a single Gaussian close to the turbine (<1 D) in cases where the wake is not as strong and mixed out more rapidly.
Prolonged near-wake lengths are observed under a stable ABL, where turbulence is suppressed, while higher turbulence is linked to an earlier transition to the far wake through turbulent mixing from outside the wake. Parinam et al. (2023) demonstrate that increasing shear values lead to a more rapid breakdown of tip vortices, which tilt, roll up, and pair before dissipating into smaller scales. However, this effect appears to be secondary compared to the influence of higher static stability, stronger veer, and lower turbulence during stable conditions, which usually coexists with higher shear. Notably, our analysis reveals no correlation between shear and near-wake length, which initially seems to contradict the findings of Parinam et al. (2023). This discrepancy is resolved when regarding shear as a parameter dependent on atmospheric stability. In a dynamically stable ABL, the suppression of turbulent mixing appears to have a more significant stabilizing impact on tip vortices than the destabilizing effect of shear-induced instabilities. Additionally, veering of the wind is usually associated with a stable atmosphere, which is positively correlated to the near-wake length. More simulations and measurements of different veering of the inflow wind while resolving the tip vortices would be useful to better understand the interplay in the near wake. Therefore it is necessary to adapt current wake models to treat shear, veer, and turbulence as variables that are also dependent on atmospheric stability and not as independent drivers of near-wake evolution. Capturing these interactions can help predict wake behavior accurately in diverse atmospheric regimes.
We compare our near-wake length determination to the method proposed by Robey and Lundquist (2024). Their method identifies the near-wake length as the point where the distance between the two Gaussian minima normalized by the wake width falls below 2.2 (), assuming the two peaks of reduced velocities merge there. We assume this criterion is applicable in the same way in the horizontal direction as in the vertical direction. This methods yields a mean near-wake length of 2.17 D (standard deviation: 0.53 D), which is on average 0.17 D or 19.87 m longer than our approach. This difference shows only minor sensitivity of the near-wake length determination to the specific implementation of the merging criterion for the two Gaussian peaks.
Moreover, the near-wake length is compared to the analytical formulation by Bastankhah and Porté-Agel (2016) (Eq. 6.16 with 4α= 3.6 from Carbajo Fuertes et al., 2018, and 2β= 0.154 from Bastankhah and Porté-Agel, 2016), which yields an average near-wake length of 2.89 D (standard deviation: 1.10 D). The observed near-wake length in this study is 0.89 D shorter than proposed by Bastankhah and Porté-Agel (2016) and Carbajo Fuertes et al. (2018), showing that their analytical formula overestimates the actual length of the near wake. The largest overestimation occurs under stable atmospheric conditions and low TI, whereas the analytical result aligns more closely with observed near-wake lengths for high TI. This suggests that the formulation should be carefully used and interpreted as it is not designed to locate the breakdown of the tip vortices but instead provides an estimate of the hypothetical potential core length employed in far-wake modeling (Bastankhah and Porté-Agel, 2016), which could explain the discrepancies.
Therefore, comparisons of near-wake length estimations should be performed carefully, and multiple determination methods, such as those based on velocity deficit profiles, wake turbulence evolution, or the decay of tip vortices, should be evaluated in a future study using field measurements to ensure robust and consistent interpretation. Alternatively, data-driven approaches could be applied to this extensive wake dataset to enhance the characterization and prediction of near-wake behavior.
This study presents a comprehensive statistical analysis of the impact of observed atmospheric conditions on wind turbine wake dynamics. The wake dataset analyzed herein includes measurements from a rearward-facing nacelle lidar, a meteorological mast, and wind turbine operational data at the WiValdi research wind farm, spanning approximately 7 months of field observations. Previous studies focused on single seasons, i.e., summer for Bodini et al. (2017) and spring for Sengers et al. (2023), while we utilize a significantly larger database covering multiple seasons. The data capture wake characteristics across a broad range of atmospheric states, from stable to unstable conditions, and under varying levels of wind shear, veer, and turbulence. The findings demonstrate that wind turbine wake dynamics, especially in the near-wake region, are not only influenced by turbine operation parameters but also fundamentally shaped by the atmospheric inflow.
We analyzed the wake characteristics derived from nacelle lidar data and their relationships with atmospheric parameters. Velocity deficits in the wake are reduced under high turbulence and enhanced under stable conditions, particularly when the shear exponent is high. This effect is caused by suppressed turbulent mixing, which decelerates wake recovery. In addition to the well-studied effect of yaw misalignment, inflow wind veer significantly affects the lateral deflection of the wake center, consistently steering the wake to the right facing downstream. Wake width exhibits only moderate sensitivity to meteorological factors, with higher wind shear correlating with narrower wakes. However, for other meteorological parameters, no consistent trend is observed across the 1–4 D downstream distances. The vertical skewness of the wake is linked to both the veer and the stability of the atmospheric inflow. Under stable conditions with strong veer, the wake develops a more pronounced slope, shifting the wake center towards the right at the top and towards the left at the bottom.
Lateral asymmetry in the near wake (at 1 D), observed as an asymmetric double-Gaussian velocity deficit, is strongly linked to atmospheric stability, in terms of vertical potential temperature gradient and shear exponent. In conditions with a high shear exponent and a strong potential temperature gradient, asymmetry is more pronounced in our dataset, suggesting that stratification stabilizes the two velocity deficits that are characteristic of the distribution of axial induction along the blade. Thus, the observed asymmetry likely results from the effects of vertical wind shear and wake rotation. While recent observations suggest that the characteristics of tip vortices may contribute to this asymmetry (Wildmann and Kistner, 2025), the exact interaction between tip vortices and the asymmetric mean flow requires further studies to fully understand the near-wake dynamics. This asymmetry can have practical implications for downstream turbines, potentially increasing mechanical loads and reducing power output, particularly in closely spaced wind farms.
The near-wake length is affected more strongly by turbulence intensity and atmospheric stability with longer near wakes under stable and less turbulent conditions than by turbine-operation-specific quantities, such as thrust coefficient or tip speed ratio. This indicates that near-wake length is not a fixed property of the turbine and that wake models should incorporate atmospheric parameters for more accurate depictions. This is particularly relevant because the accuracy of far-wake models can be improved by explicitly accounting for the near-wake length as a virtual origin (Neunaber et al., 2024). Additionally, repowering of wind farms often results in densely spaced turbines, especially in secondary wind directions, making near-wake interaction critical for performance and load assessments on downstream turbines. Comparing near-wake lengths among various approaches remains challenging due to different definitions of the far-wake onset, e.g., deducing it from the shape of the velocity deficit, the amount of turbulence in the wake, or the decay of the coherence of tip vortices.
Future work will extend these derived wake characteristics to include wake-added turbulence from the nacelle lidar data to further investigate the turbulent structure of the near wake and refine the criteria for the transition to the far wake. In spring 2025, a drone fleet was deployed at WiValdi to capture tip vortices and measure wake deficits and turbulence in situ at several downstream distances up to 4 D. Complementary data from a ground-based lidar, performing vertical cross sections in the wake, will further enhance the three-dimensional characterization of the wake, enabling a more detailed analysis of the circular double-Gaussian shape in the near wake and its dependence on atmospheric conditions. Meanwhile, our wake database is continuously growing, extending its potential for deriving data-driven wake models in the future. These additional measurements will contribute to a more thorough understanding of wake dynamics under real-world atmospheric conditions and will be used to validate and improve engineering models and large-eddy simulations of wind turbine wakes.
All data that are used in this study are part of the research infrastructure WiValdi. For cooperation and data access, please reach out to the contact as given on the project website (https://windenergy-researchfarm.com/cooperation (last access: 29 July 2026). Parts of the data, especially wind turbine data, are subject to confidentiality agreements within the NearWake project.
All authors contributed to the conception of the paper and collected and processed the lidar data. JM developed the wake detection and near-wake length algorithms, building on prior work by NW. JM performed the data analyses and primarily wrote the manuscript, both with constructive input and edits from NW.
At least one of the (co-)authors is a member of the editorial board of Wind Energy Science. The peer-review process was guided by an independent editor, and the authors also have no other competing interests to declare.
Publisher's note: Copernicus Publications remains neutral with regard to jurisdictional claims made in the text, published maps, institutional affiliations, or any other geographical representation in this paper. The authors bear the ultimate responsibility for providing appropriate place names. Views expressed in the text are those of the authors and do not necessarily reflect the views of the publisher.
We would like to thank everyone who helped build and implement the WiValdi research wind farm. Additionally, we acknowledge Jeffrey Thayer for his support and helpful comments on this article.
This research was performed within the NearWake project (FKZ 03EE3097B) funded by the German Federal Ministry for Economic Affairs and Energy (BMWE) based on a resolution of the German Bundestag.
The article processing charges for this open-access publication were covered by the German Aerospace Center (DLR).
This paper was edited by Etienne Cheynet and reviewed by two anonymous referees.
Abkar, M. and Porté-Agel, F.: Influence of atmospheric stability on wind-turbine wakes: A large-eddy simulation study, Phys. Fluids, 27, 035104, https://doi.org/10.1063/1.4913695, 2015. a, b, c, d
Aitken, M. L. and Lundquist, J. K.: Utility-Scale Wind Turbine Wake Characterization Using Nacelle-Based Long-Range Scanning Lidar, J. Atmos. Ocean. Tech., 31, 1529–1539, https://doi.org/10.1175/jtech-d-13-00218.1, 2014. a, b
Aitken, M. L., Banta, R. M., Pichugina, Y. L., and Lundquist, J. K.: Quantifying Wind Turbine Wake Characteristics from Scanning Remote Sensor Data, J. Atmos. Ocean. Tech., 31, 765–787, https://doi.org/10.1175/jtech-d-13-00104.1, 2014. a, b
Alcayaga, L.: Filtering of pulsed lidar data using spatial information and a clustering algorithm, Atmos. Meas. Tech., 13, 6237–6254, https://doi.org/10.5194/amt-13-6237-2020, 2020. a, b, c
Amiri, M. M., Shadman, M., and Estefen, S. F.: A review of physical and numerical modeling techniques for horizontal-axis wind turbine wakes, Renew. Sust. Energ. Rev., 193, 114279, https://doi.org/10.1016/j.rser.2024.114279, 2024. a
Angelou, N., Mann, J., and Dubreuil-Boisclair, C.: Revealing inflow and wake conditions of a 6 MW floating turbine, Wind Energ. Sci., 8, 1511–1531, https://doi.org/10.5194/wes-8-1511-2023, 2023. a
Archer, C. L., Vasel-Be-Hagh, A., Yan, C., Wu, S., Pan, Y., Brodie, J. F., and Maguire, A. E.: Review and evaluation of wake loss models for wind energy applications, Appl. Energ., 226, 1187–1207, https://doi.org/10.1016/j.apenergy.2018.05.085, 2018. a
Barthelmie, R. J., Hansen, K., Frandsen, S. T., Rathmann, O., Schepers, J. G., Schlez, W., Phillips, J., Rados, K., Zervos, A., Politis, E. S., and Chaviaropoulos, P. K.: Modelling and measuring flow and wind turbine wakes in large wind farms offshore, Wind Energy, 12, 431–444, https://doi.org/10.1002/we.348, 2009. a
Bartl, J., Mühle, F., Schottler, J., Sætran, L., Peinke, J., Adaramola, M., and Hölling, M.: Wind tunnel experiments on wind turbine wakes in yaw: effects of inflow turbulence and shear, Wind Energ. Sci., 3, 329–343, https://doi.org/10.5194/wes-3-329-2018, 2018. a
Bastankhah, M. and Porté-Agel, F.: A new analytical model for wind-turbine wakes, Renew. Energ., 70, 116–123, https://doi.org/10.1016/j.renene.2014.01.002, 2014. a
Bastankhah, M. and Porté-Agel, F.: Experimental and theoretical study of wind turbine wakes in yawed conditions, J. Fluid Mech., 806, 506–541, https://doi.org/10.1017/jfm.2016.595, 2016. a, b, c, d
Beck, H. and Kühn, M.: Dynamic Data Filtering of Long-Range Doppler LiDAR Wind Speed Measurements, Remote Sensing, 9, 561, https://doi.org/10.3390/rs9060561, 2017. a
Bhaganagar, K. and Debnath, M.: The effects of mean atmospheric forcings of the stable atmospheric boundary layer on wind turbine wake, J. Renew. Sustain. Ener., 7, https://doi.org/10.1063/1.4907687, 2015. a
Biswas, N. and Buxton, O. R.: Effect of tip speed ratio on coherent dynamics in the near wake of a model wind turbine, J. Fluid Mech., 979, https://doi.org/10.1017/jfm.2023.1095, 2024. a
Bodini, N., Zardi, D., and Lundquist, J. K.: Three-dimensional structure of wind turbine wakes as measured by scanning lidar, Atmos. Meas. Tech., 10, 2881–2896, https://doi.org/10.5194/amt-10-2881-2017, 2017. a, b, c, d, e
Bromm, M., Rott, A., Beck, H., Vollmer, L., Steinfeld, G., and Kühn, M.: Field investigation on the influence of yaw misalignment on the propagation of wind turbine wakes, Wind Energy, 21, 1011–1028, https://doi.org/10.1002/we.2210, 2018. a, b, c, d, e
Brugger, P., Fuertes, F. C., Vahidzadeh, M., Markfort, C. D., and Porté-Agel, F.: Characterization of Wind Turbine Wakes with Nacelle-Mounted Doppler LiDARs and Model Validation in the Presence of Wind Veer, Remote Sensing, 11, 2247, https://doi.org/10.3390/rs11192247, 2019. a, b, c, d
Brugger, P., Debnath, M., Scholbrock, A., Fleming, P., Moriarty, P., Simley, E., Jager, D., Roadman, J., Murphy, M., Zong, H., and Porté-Agel, F.: Lidar measurements of yawed-wind-turbine wakes: characterization and validation of analytical models, Wind Energ. Sci., 5, 1253–1272, https://doi.org/10.5194/wes-5-1253-2020, 2020. a, b, c
Brugger, P., Markfort, C., and Porté-Agel, F.: Field measurements of wake meandering at a utility-scale wind turbine with nacelle-mounted Doppler lidars, Wind Energ. Sci., 7, 185–199, https://doi.org/10.5194/wes-7-185-2022, 2022. a
Carbajo Fuertes, F., Markfort, C. D., and Porté-Agel, F.: Wind Turbine Wake Characterization with Nacelle-Mounted Wind Lidars for Analytical Wake Model Validation, Remote Sensing, 10, 668, https://doi.org/10.3390/rs10050668, 2018. a, b, c, d
De Cillis, G., Cherubini, S., Semeraro, O., Leonardi, S., and De Palma, P.: POD‐based analysis of a wind turbine wake under the influence of tower and nacelle, Wind Energy, 24, 609–633, https://doi.org/10.1002/we.2592, 2020. a, b
El-Asha, S., Zhan, L., and Iungo, G. V.: Quantification of power losses due to wind turbine wake interactions through SCADA, meteorological and wind LiDAR data, Wind Energy, 20, 1823–1839, https://doi.org/10.1002/we.2123, 2017. a
Englberger, A., Dörnbrack, A., and Lundquist, J. K.: Does the rotational direction of a wind turbine impact the wake in a stably stratified atmospheric boundary layer?, Wind Energ. Sci., 5, 1359–1374, https://doi.org/10.5194/wes-5-1359-2020, 2020. a
Fleming, P. A., Gebraad, P. M. O., Lee, S., van Wingerden, J.-W., Johnson, K., Churchfield, M., Michalakes, J., Spalart, P., and Moriarty, P.: Evaluating techniques for redirecting turbine wakes using SOWFA, Renew. Energ., 70, 211–218, https://doi.org/10.1016/j.renene.2014.02.015, 2014. a
Gambuzza, S. and Ganapathisubramani, B.: The influence of free stream turbulence on the development of a wind turbine wake, J. Fluid Mech., 963, https://doi.org/10.1017/jfm.2023.302, 2023. a
Howland, M. F., Bossuyt, J., Martínez-Tossas, L. A., Meyers, J., and Meneveau, C.: Wake structure in actuator disk models of wind turbines in yaw under uniform inflow conditions, J. Renew. Sustain. Ener., 8, https://doi.org/10.1063/1.4955091, 2016. a
IEC: IEC 61400-12-1 Ed2: Wind energy generation systems – Part 12-1: Power performance measurements of electricity producing wind turbines, https://webstore.iec.ch/en/publication/26603 (last access: 29 July 2026), 2017. a
Iungo, G. V. and Porté-Agel, F.: Volumetric Lidar Scanning of Wind Turbine Wakes under Convective and Neutral Atmospheric Stability Regimes, J. Atmos. Ocean. Tech., 31, 2035–2048, https://doi.org/10.1175/jtech-d-13-00252.1, 2014. a
Iungo, G. V., Letizia, S., and Zhan, L.: Quantification of the axial induction exerted by utility-scale wind turbines by coupling LiDAR measurements and RANS simulations, J. Phys. Conf. Ser., 1037, 072023, https://doi.org/10.1088/1742-6596/1037/7/072023, 2018. a
Keane, A.: Advancement of an analytical double-Gaussian full wind turbine wake model, Renew. Energ., 171, 687–708, https://doi.org/10.1016/j.renene.2021.02.078, 2021. a
Kim, S.-H., Shin, H.-K., Joo, Y.-C., and Kim, K.-H.: A study of the wake effects on the wind characteristics and fatigue loads for the turbines in a wind farm, Renew. Energ., 74, 536–543, https://doi.org/10.1016/j.renene.2014.08.054, 2015. a
King, J., Fleming, P., King, R., Martínez-Tossas, L. A., Bay, C. J., Mudafort, R., and Simley, E.: Control-oriented model for secondary effects of wake steering, Wind Energ. Sci., 6, 701–714, https://doi.org/10.5194/wes-6-701-2021, 2021. a
Klemmer, K. S. and Howland, M. F.: Momentum deficit and wake-added turbulence kinetic energy budgets in the stratified atmospheric boundary layer, Phys. Rev. Fluids, 9, 114607, https://doi.org/10.1103/PhysRevFluids.9.114607, 2024. a
Krishnamurthy, R., Choukulkar, A., Calhoun, R., Fine, J., Oliver, A., and Barr, K.: Coherent Doppler lidar for wind farm characterization, Wind Energy, 16, 189–206, https://doi.org/10.1002/we.539, 2012. a
Machefaux, E., Larsen, G. C., Troldborg, N., Gaunaa, M., and Rettenmeier, A.: Empirical modeling of single-wake advection and expansion using full-scale pulsed lidar-based measurements, Wind Energy, 18, 2085–2103, https://doi.org/10.1002/we.1805, 2014. a
Mauz, M., Rautenberg, A., Platis, A., Cormier, M., and Bange, J.: First identification and quantification of detached-tip vortices behind a wind energy converter using fixed-wing unmanned aircraft system, Wind Energ. Sci., 4, 451–463, https://doi.org/10.5194/wes-4-451-2019, 2019. a
Meyers, J., Bottasso, C., Dykes, K., Fleming, P., Gebraad, P., Giebel, G., Göçmen, T., and van Wingerden, J.-W.: Wind farm flow control: prospects and challenges, Wind Energ. Sci., 7, 2271–2306, https://doi.org/10.5194/wes-7-2271-2022, 2022. a
Neunaber, I., Hölling, M., and Obligado, M.: Leading effect for wind turbine wake models, Renew. Energ., 223, 119935, https://doi.org/10.1016/j.renene.2023.119935, 2024. a, b
Onnen, D., Larsen, G. C., Lio, A. W. H., Hulsman, P., Kühn, M., and Petrović, V.: Field comparison of load-based wind turbine wake tracking with a scanning lidar reference, Wind Energ. Sci., 11, 175–193, https://doi.org/10.5194/wes-11-175-2026, 2026. a, b, c
Parinam, A., Benard, P., Terzi, D. v., and Viré, A.: Large-Eddy Simulations of wind turbine wakes in sheared inflows, J. Phys. Conf. Ser., 2505, 012039, https://doi.org/10.1088/1742-6596/2505/1/012039, 2023. a, b
Pedersen, M. M. and Larsen, G. C.: Integrated wind farm layout and control optimization, Wind Energ. Sci., 5, 1551–1566, https://doi.org/10.5194/wes-5-1551-2020, 2020. a
Pierella, F. and Sætran, L.: Wind tunnel investigation on the effect of the turbine tower on wind turbines wake symmetry, Wind Energy, 20, 1753–1769, https://doi.org/10.1002/we.2120, 2017. a
Porté-Agel, F., Bastankhah, M., and Shamsoddin, S.: Wind-Turbine and Wind-Farm Flows: A Review, Bound.-Lay. Meteorol., 174, 1–59, https://doi.org/10.1007/s10546-019-00473-0, 2019. a, b
Reinwardt, I., Schilling, L., Dalhoff, P., Steudel, D., and Breuer, M.: Dynamic wake meandering model calibration using nacelle-mounted lidar systems, Wind Energ. Sci., 5, 775–792, https://doi.org/10.5194/wes-5-775-2020, 2020. a
Robey, R. and Lundquist, J. K.: Influences of lidar scanning parameters on wind turbine wake retrievals in complex terrain, Wind Energ. Sci., 9, 1905–1922, https://doi.org/10.5194/wes-9-1905-2024, 2024. a, b, c
Sengers, B., Steinfeld, G., Heinemann, D., and Kühn, M.: A new method to characterize the curled wake shape under yaw misalignment, J. Phys. Conf. Ser., 1618, 062050, https://doi.org/10.1088/1742-6596/1618/6/062050, 2020. a, b
Sengers, B. A. M., Steinfeld, G., Hulsman, P., and Kühn, M.: Validation of an interpretable data-driven wake model using lidar measurements from a field wake steering experiment, Wind Energ. Sci., 8, 747–770, https://doi.org/10.5194/wes-8-747-2023, 2023. a, b, c, d, e
Stull, R. B.: An introduction to boundary layer meteorology, no. 13 in Atmospheric sciences library, Kluwer, Dordrecht, 1 edn., ISBN 9027727686, https://doi.org/10.1007/978-94-009-3027-8, 1988. a
Sørensen, J. N., Mikkelsen, R. F., Henningson, D. S., Ivanell, S., Sarmast, S., and Andersen, S. J.: Simulation of wind turbine wakes using the actuator line technique, Philos. T. R. Soc. A, 373, 20140071, https://doi.org/10.1098/rsta.2014.0071, 2015. a
Thayer, J. D., Kilroy, G., and Wildmann, N.: How do convective cold pools influence the atmospheric boundary layer near two wind turbines in northern Germany?, Wind Energ. Sci., 10, 2237–2255, https://doi.org/10.5194/wes-10-2237-2025, 2025. a
Thomsen, K. and Sørensen, P.: Fatigue loads for wind turbines operating in wakes, J. Wind Eng. Ind. Aerod., 80, 121–136, https://doi.org/10.1016/S0167-6105(98)00194-9, 1999. a
Trabucchi, D., Trujillo, J.-J., and Kühn, M.: Nacelle-based Lidar Measurements for the Calibration of a Wake Model at Different Offshore Operating Conditions, Energy Proc., 137, 77–88, https://doi.org/10.1016/j.egypro.2017.10.335, 2017. a
Trujillo, J. J., Seifert, J. K., Würth, I., Schlipf, D., and Kühn, M.: Full-field assessment of wind turbine near-wake deviation in relation to yaw misalignment, Wind Energ. Sci., 1, 41–53, https://doi.org/10.5194/wes-1-41-2016, 2016. a, b, c
Vahidi, D. and Porté-Agel, F.: A physics-based model for wind turbine wake expansion in the atmospheric boundary layer, J. Fluid Mech., 943, https://doi.org/10.1017/jfm.2022.443, 2022a. a
Vahidi, D. and Porté-Agel, F.: A New Streamwise Scaling for Wind Turbine Wake Modeling in the Atmospheric Boundary Layer, Energies, 15, 9477, https://doi.org/10.3390/en15249477, 2022b. a
Vasiljevic, N.: A time-space synchronization of coherent Doppler scanning lidars for 3Dmeasurements of wind fields, PhD thesis, DTU Wind Energy, https://backend.orbit.dtu.dk/ws/portalfiles/portal/102963702/NVasiljevic_Thesis.pdf (last access: 27 July 2026), 2014. a
Vermeer, L. J., Sørensen, J. N., and Crespo, A.: Wind turbine wake aerodynamics, Prog. Aerosp. Sci., 39, 467–510, https://doi.org/10.1016/S0376-0421(03)00078-2, 2003. a
Vollmer, L., Steinfeld, G., Heinemann, D., and Kühn, M.: Estimating the wake deflection downstream of a wind turbine in different atmospheric stabilities: an LES study, Wind Energ. Sci., 1, 129–141, https://doi.org/10.5194/wes-1-129-2016, 2016. a, b, c, d
Wetz, T. and Wildmann, N.: Multi-point in situ measurements of turbulent flow in a wind turbine wake and inflow with a fleet of uncrewed aerial systems, Wind Energ. Sci., 8, 515–534, https://doi.org/10.5194/wes-8-515-2023, 2023. a
Wildmann, N. and Kistner, J.: An evaluation of different measurement strategies to measure wind turbine near wake flow with small multicopter UAS, J. Phys. Conf. Ser., 2767, 042004, https://doi.org/10.1088/1742-6596/2767/4/042004, 2024. a
Wildmann, N. and Kistner, J.: In situ measurements of near wake dynamics with a fleet of multicopter drones, J. Phys. Conf. Ser., 3016, 012011, https://doi.org/10.1088/1742-6596/3016/1/012011, 2025. a, b, c
Wildmann, N., Hofsäß, M., Weimer, F., Joos, A., and Bange, J.: MASC – a small Remotely Piloted Aircraft (RPA) for wind energy research, Adv. Sci. Res., 11, 55–61, https://doi.org/10.5194/asr-11-55-2014, 2014. a
Wildmann, N., Kigle, S., and Gerz, T.: Coplanar lidar measurement of a single wind energy converter wake in distinct atmospheric stability regimes at the Perdigão 2017 experiment, J. Phys. Conf. Ser., 1037, 052006, https://doi.org/10.1088/1742-6596/1037/5/052006, 2018. a
Wildmann, N., Hagen, M., and Gerz, T.: Enhanced resource assessment and atmospheric monitoring of the research wind farm WiValdi, J. Phys. Conf. Ser., 2265, 022029, https://doi.org/10.1088/1742-6596/2265/2/022029, 2022. a
Wu, Y.-T. and Porté-Agel, F.: Atmospheric Turbulence Effects on Wind-Turbine Wakes: An LES Study, Energies, 5, 5340–5362, https://doi.org/10.3390/en5125340, 2012. a, b
Zhan, L., Letizia, S., and Iungo, G. V.: LiDAR measurements for an onshore wind farm: Wake variability for different incoming wind speeds and atmospheric stability regimes, Wind Energy, 23, 501–527, https://doi.org/10.1002/we.2430, 2019. a
Zhan, L., Letizia, S., and Iungo, G. V.: Optimal tuning of engineering wake models through lidar measurements, Wind Energ. Sci., 5, 1601–1622, https://doi.org/10.5194/wes-5-1601-2020, 2020. a
Zhou, N., Chen, J., Adams, D. E., and Fleeter, S.: Influence of inflow conditions on turbine loading and wake structures predicted by large eddy simulations using exact geometry, Wind Energy, 19, 803–824, https://doi.org/10.1002/we.1866, 2015. a
Zong, H. and Porté-Agel, F.: A point vortex transportation model for yawed wind turbine wakes, J. Fluid Mech., 890, https://doi.org/10.1017/jfm.2020.123, 2020. a