
the Creative Commons Attribution 4.0 License.
the Creative Commons Attribution 4.0 License.
 | 15 Sep 2026
Review and quantification of major risks in wind farm development and operation

Azélice Ludot
Matt Shields
Athanasios Kolios
Rajasekhar Pulikollu
Nikolay Dimitrov
With declining subsidies and tightening project margins, wind energy investments are increasingly exposed to a wide range of technical, operational, market, and system-level risks. Understanding how these risks interact across project life cycle phases is essential for translating them into economic impact metrics. This study combines expert elicitation, structured survey results, and targeted literature review to identify and categorize the major risks affecting wind energy projects during both development and operation. These risks are clustered into four overarching sector challenges spanning long-term asset viability, component reliability, operation and maintenance performance, and rapid technology upscaling. To illustrate the potential economic relevance of these challenges, simplified scenario-based techno-economic impact assessments are conducted using a representative offshore wind farm case study. The analysis offers order-of-magnitude insights into how different risk categories propagate into economic performance indicators such as net present value (NPV) and levelized cost of energy (LCOE). The results demonstrate that different risks exhibit distinct economic signatures: some primarily shift mean outcomes, whereas others produce losses that are skewed towards worst-case outcomes, with rare but severe events dominating the overall risk profile. This work does not propose a complete solution for capturing the full complexity of wind energy risks. Instead, it demonstrates the limitations of fragmented risk treatment and provides a starting point for developing integrated de-risking frameworks.
- Article
(2259 KB) - Full-text XML
- BibTeX
- EndNote


With decreasing or non-existent subsidy levels, continued wind energy project investments are conditional on securing project profitability at low risk. The wind energy value chain often operates on small margins, and the economic feasibility of wind power under such conditions is sensitive to risks leading to unexpected costs or other disruptions. Over the last year, there have been multiple failed auctions in Germany, France, the Netherlands, Denmark, and Lithuania. At the same time, many projects that won auctions over the last 3 years are now struggling to get the necessary investments approved (WindEurope, 2025b).
Recent industry assessments underscore the urgent need to de-risk the wind energy sector. The latest Global Wind Energy Council (GWEC) report highlights growing exposure to market and system-level risks, including a sharp increase in hours with negative electricity prices and persistent supply chain disruptions (GWEC, 2025). Without appropriate market design and effective de-risking instruments, these developments risk undermining investor confidence and increasing financing costs. The report further emphasizes the critical role of grid infrastructure in mitigating bottlenecks, reducing congestion and curtailment, enhancing energy security, and improving the economic viability of new projects. In parallel, supply chain uncertainties are identified as a major source of cost, schedule, and performance risk for wind energy projects (Global Wind Energy Council and Boston Consulting Group, 2023).
It is therefore essential for investors to systematically identify and quantify the risks that can affect wind energy projects. These risks span technical, regulatory, environmental, socio-economic, and financial dimensions, and are characterized by multidisciplinary interactions and feedback involving multiple actors and decision layers (Abba et al., 2022). While existing studies have provided reviews of risk sources, there remains a gap in linking identified risk drivers to quantitative modelling parameters that allow for a systematic assessment of their economic impacts. In this study, we move beyond risk identification from literature by explicitly translating risk categories into modelling assumptions within a quantitative impact assessment tool chain and by evaluating their implications through scenario-based economic indicators.
The present study employs expert elicitation; a structured survey of wind energy experts from industry and academia; and an analysis of publicly available data to identify, categorize, and quantify the major risks affecting wind energy projects across both development and operational phases. The objectives of this paper are
-
to identify and categorize the major risks currently facing the wind energy industry during the development and operation of wind energy projects;
-
to review the identified risk categories and provide an overview of the most significant risks and their interdependencies; and
-
to quantify the economic impacts of these risks using a dedicated impact assessment tool chain, i.e. a sequence of coupled computational models that together translate technical assumptions into economic performance metrics.
Through this contribution, we aim to highlight the interconnected nature of wind energy risk drivers across research domains and project life cycle phases. For example, supply chain risks may interact with the technical aspects of turbine design and propagate into construction, operation, and maintenance outcomes. By demonstrating how such interactions can be quantified, this study provides a first step towards developing de-risking tools that capture risk interdependencies.
The approach combines a structured expert survey, a targeted literature review, and a scenario-based quantitative impact assessment. Risk identification is initiated through a structured survey targeting experts from industry and academia. The survey captures perceptions of dominant risks for both currently operating and future wind farms, as well as perceived priorities for risk mitigation and research. Responses are analysed quantitatively to identify dominant risk drivers and qualitatively to understand emerging themes and shifts in risk relevance as we move from operating wind energy assets to developing new ones. Survey results are complemented by expert judgement and targeted consultations to cluster individual risk drivers into four sector challenges. We use the term “sector challenge” to denote industry-wide risk themes that are not specific to a single project, site, or technology. Regional differentiation of risk perceptions (e.g. across US and European markets) is not attempted here but would be a relevant direction for future work. Although the risk categories identified in this study are applicable to both onshore and offshore wind energy, the survey did not distinguish between the two contexts, and the quantitative case study is based on an offshore wind farm. The relative importance and specific manifestation of individual risks, particularly regarding maintenance logistics and access constraints, will differ for onshore projects.
For each identified sector challenge, a literature review is conducted to summarize the current state of knowledge, data availability, and known sources of uncertainty. Building on this review, the economic relevance of each challenge is explored through scenario-based impact assessments. These assessments are not intended to provide detailed, project-specific risk quantification but rather to estimate the order of magnitude of potential economic impacts and to illustrate how uncertainties, data limitations, and knowledge gaps propagate into project-level economic metrics. Scenarios are designed to span plausible ranges of uncertainty and structural change, grounded in literature, empirical evidence, and forward-looking assumptions.
2.1 Quantitative impact assessment
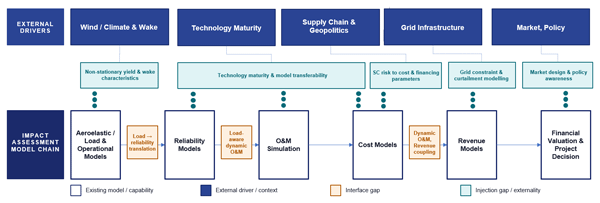
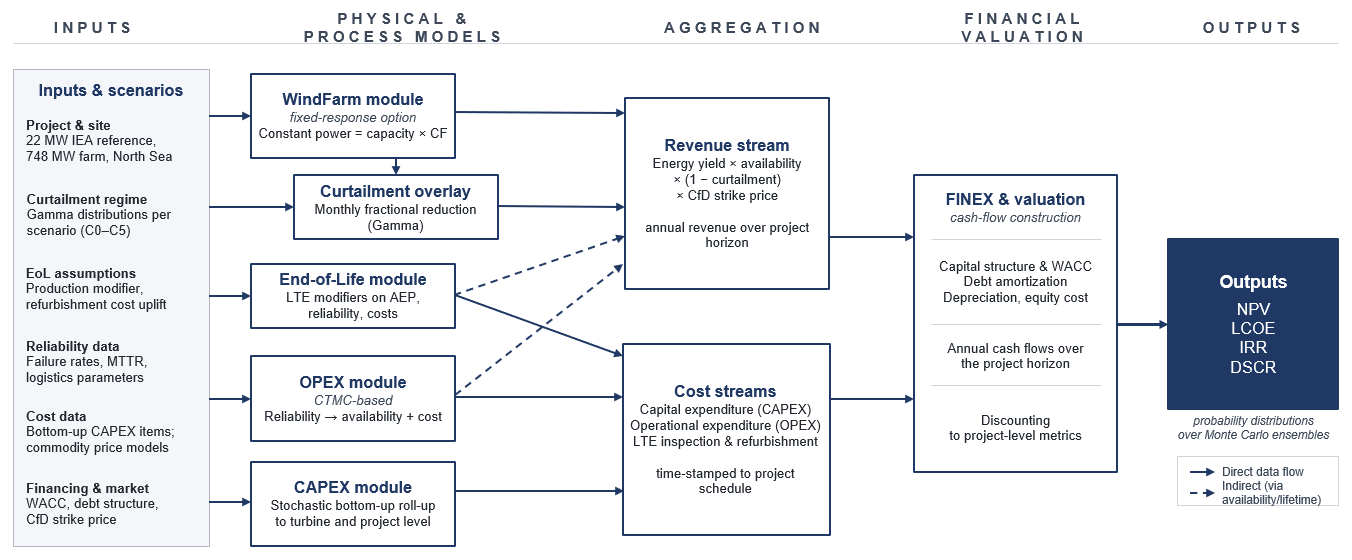
For the quantification of risks in terms of aggregated economic metrics, we use the wind energy project impact assessment tool WINPACT (full documentation at https://hipersim.pages.windenergy.dtu.dk/winpact/, last access: 14 September 2026) (Gräfe et al., 2025a, 2026; Pettas et al., 2026). WINPACT is a modular, scenario-based framework that quantifies how uncertainties in wind energy projects propagate through the full project life cycle to affect economic value. Alternative assumptions are introduced as scenario overrides and evaluated across all modules, enabling coupled effects (e.g. reliability changes influencing operations and maintenance (O&M) costs, revenues, and ultimately LCOE or NPV) to be captured. Simulations are executed as scenario ensembles with stochastic replicates.
Several established tools address individual parts of this assessment chain, such as stochastic O&M simulation (e.g. WOMBAT, Hammond and Cooperman, 2022), bottom-up cost modelling (e.g. ORBIT, Nunemaker et al., 2020), and integrated design-to-cost frameworks (e.g. WISDEM, National Renewable Energy Laboratory, 2021). These tools quantify uncertainty within their respective domains. The feature of the analysis presented here is not any individual module but the consistent propagation of risk categories through a single model chain to project-level financial metrics, enabling comparisons and combined-risk experiments.
Figure 1 provides a schematic overview of the module chain. The modules used in this study are:
-
Capital expenditure (CAPEX) module. Assembles total capital expenditure from a bottom-up cost structure. Material-dependent costs are linked to stochastic commodity price models with configurable correlation, propagating supply chain uncertainty into project cost.
-
WindFarm module. Provides the baseline production time series. In this study, a fixed capacity factor is used, isolating economic risk drivers from wind resource variability.
-
Operational expenditure (OPEX) module. Links component reliability and maintenance processes to availability and operational cost using an analytic continuous-time Markov chain (CTMC) formulation. It also captures failures, scheduled maintenance, weather-driven access constraints (i.e. inability to dispatch vessels and crews due to excessive wave heights or wind speeds), logistics delays, and repair activities. Uncertainty in failure rates and process parameters is sampled stochastically.
-
End-of-life module. Represents continued operation beyond the nominal design life by modifying production, reliability, and cost assumptions for the extension period. Performance degradation during the design life is implicitly captured in the baseline capacity factor; this module applies additional modifiers for accelerated ageing beyond the design envelope.
-
Curtailment module. Applies fractional production reductions to represent market-driven, grid-related, or externally imposed curtailment. Epistemic uncertainty in long-term curtailment regimes and aleatory variability in short-term conditions are represented separately.
-
FINEX and valuation modules. Translate all upstream outputs into project-level financial metrics such as net present value (NPV), internal rate of return (IRR), debt service coverage ratio (DSCR), and levelized cost of energy (LCOE) via cash flow construction over the full project horizon.
3.1 Survey results
To identify the dominant risk drivers affecting wind energy projects across different life cycle stages, a targeted survey was conducted as part of this study. The survey was conducted during multiple conference events organized by the Electrical Power Research Institute (EPRI) and included participants from both industry and academia. In total, 59 experts responded, primarily from the US and Europe, with additional representation from South America, Asia, and Australia, providing a snapshot of current expert judgements across different markets.
The survey was designed around three complementary questions addressing (i) risks affecting currently operational wind projects, (ii) risks expected to affect future wind projects, and (iii) research directions and innovations perceived as most effective for risk mitigation. Each participant was asked to select up to three predefined answers per question to avoid a bias towards the single most important issue. No weighting is applied: each selection counts as one vote, and the reported percentages are shares of all selections cast per question. Participants who selected fewer options therefore contribute fewer votes; the polling tool did not strictly enforce the three-selection limit, so some responses contain more. Together, these questions allow the identification of dominant risk categories and an assessment of how risk perceptions evolve when changing the perspective from operational to new projects, along with how these risks are expected to be addressed. Given the sample size and the workshop-based collection setting, the survey does not claim statistical representativeness; the results should be read as a directional picture of risk perceptions within a group of experts active in the wind energy industry and research.
Figure 2 presents the distribution of responses to the first question, focusing on operational wind energy projects. The results show a clear dominance of reliability-related concerns. In total, 49 % of responses identify reliability as the primary economic risk driver, comprising reliability of major non-redundant components (26 %), reliability of replaceable components (8 %), and premature degradation of components (17 %).
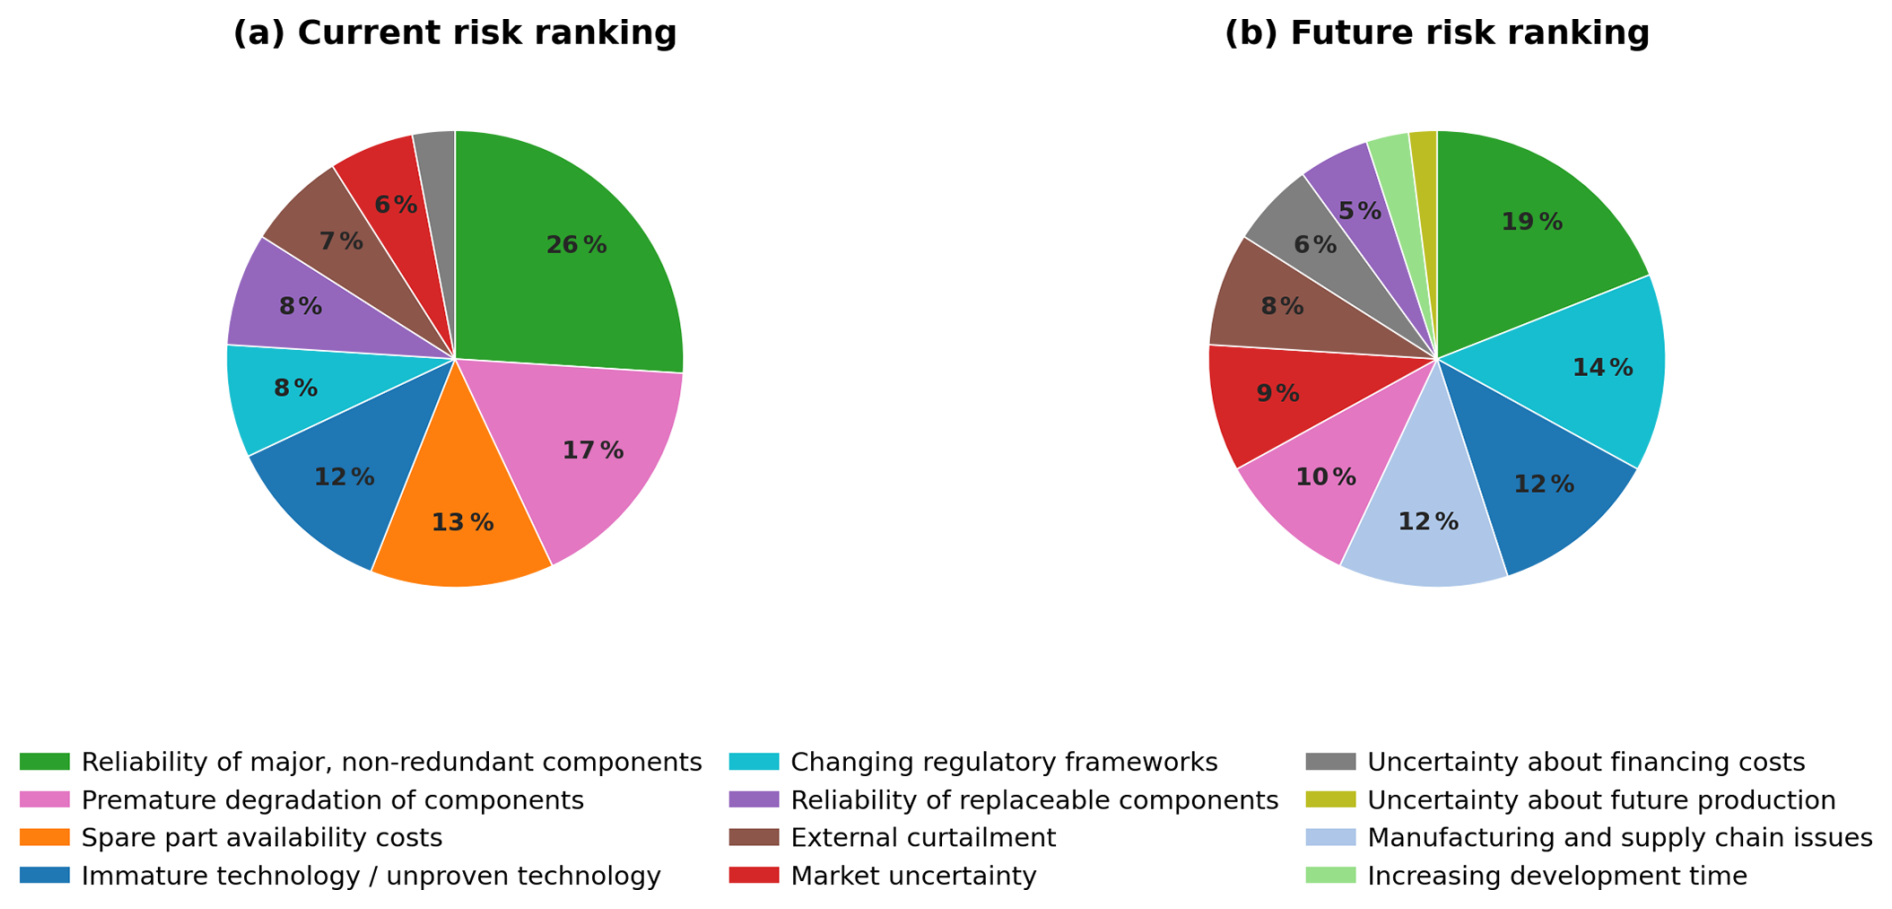
Figure 2Survey responses to the question: What are the biggest risks for the economy of (a) operational and (b) future wind energy projects? (a): n=177 selections from 53 respondents; (b): n=185 selections from 51 respondents.
An additional 12 % of respondents cite immature technology leading to unexpected costs, a concern that is closely linked to reliability and operational robustness. Other risk categories – including market and curtailment uncertainty, regulatory changes, and financing conditions – receive noticeably lower shares. Notably, uncertainty in future production receives no votes, indicating that wind resource uncertainty is generally perceived as well understood and adequately managed for existing projects.
Taken together, these results indicate that for operational wind farms, economic risk is dominated by asset-level performance and reliability rather than by external system or market factors.
Figure 2 (right) shows the responses to the second question, addressing future wind energy projects. Reliability-related issues remain the most prominent risk category, accounting for 34 % of responses. Although the relative weight is lower than for operational projects, concerns about major component reliability, replaceable components, and premature degradation continue to dominate experts' perceptions.
However, in contrast to operational projects, the survey reveals a broader risk landscape for future developments. Unproven or immature technology again accounts for 12 % of responses, reflecting concerns about larger turbines, accelerated upscaling, and reduced operational experience at the time of deployment. In addition, external and system-level risks gain substantially more importance. Market uncertainty and curtailment (together accounting for approximately 17 %), changing regulatory frameworks (14 %), financing uncertainty (6 %), and manufacturing and supply chain constraints (12 %) are all perceived as significant contributors to future project risk.
This shift highlights a temporal distinction: operational projects are primarily exposed to technical and O&M-related risks, while future projects are increasingly affected by system integration, market evolution, regulatory stability, and supply chain robustness.
The responses to the third survey question, summarized in Fig. 3, provide a direct link between the identified risks and perceived mitigation pathways. The prioritization of research and innovation areas closely mirrors the challenges identified in the first two questions. Reliability-focused solutions dominate the responses. Advanced digital solutions for failure prediction (19 %) and advanced sensing technologies for component health assessment (16 %) underscore the perceived need for improved understanding and prediction of degradation processes, and remaining useful lifetime during operation. These technologies are seen as essential enablers for more effective maintenance planning and risk-informed O&M strategies. Closely related, advanced O&M decision-making tools (16 %) are highlighted as a key priority, emphasizing the need to translate diagnostic and prognostic information into economically optimal operational decisions.
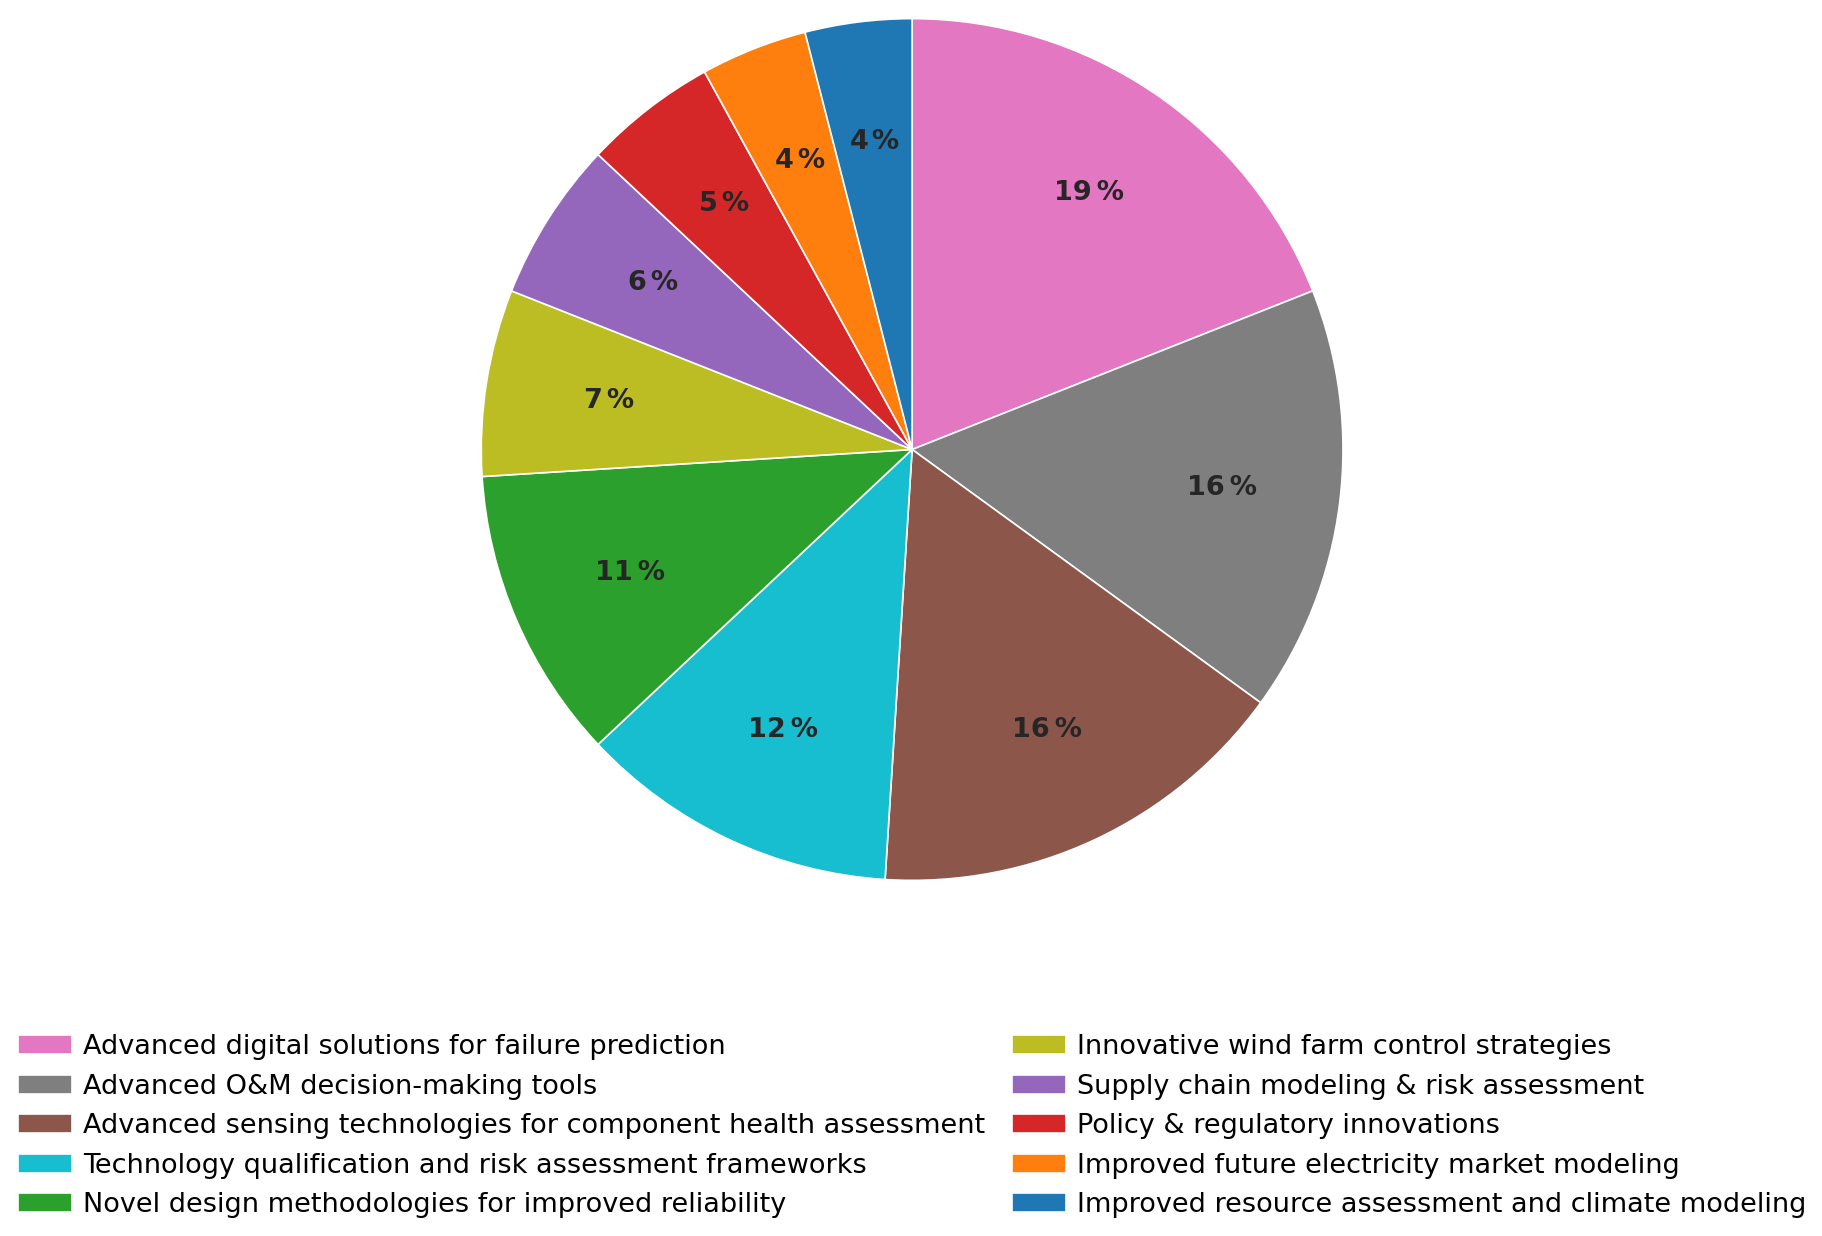
Figure 3Survey results: What research areas or innovations could most effectively help mitigate risks in wind energy projects? n=202 selections from 53 respondents.
Beyond operational mitigation, respondents also highlight the importance of upstream interventions. Novel design methodologies for improved reliability (11 %) point to the need to explicitly integrate reliability objectives into turbine and wind farm design. Technology qualification and risk assessment frameworks (12 %) are identified as critical tools for managing uncertainty associated with rapid technology upscaling and deployment. Supply chain modelling and risk assessment (6 %) address vulnerabilities identified for future projects, while market modelling, resource assessment, and policy innovation receive smaller but non-negligible attention.
Overall, the survey results reveal a consistent pattern: reliability emerges as the dominant risk driver across project phases, while the relative importance of external, system-level risks increases for future projects.
3.2 Risk categorization
While the survey responses identify individual risk drivers and mitigation priorities, they also reveal consistent clusters of challenges that affect wind energy projects across life cycle stages. Building on the survey results, targeted consultations with experts from industry and academia, and the judgement of the authors, we identify four overarching sector challenges. These challenges are summarized in this section.
3.2.1 Sector challenge 1: long-term asset viability under environmental and market dynamics
This challenge arises primarily from responses to future wind energy projects, where external and system-level risks become more important. While reliability remains a relevant concern, market uncertainty and curtailment, changing regulatory frameworks, financing uncertainty, and supply chain constraints are identified as key risk drivers. These factors are inherently long-term and interdependent, influencing revenue stability, cost structures, and investment decisions over the project lifetime. The survey results indicate a shift from predominantly technical and physical uncertainties towards system-level uncertainties driven by external conditions and institutional factors.
3.2.2 Sector challenge 2: reliability gaps in major non-redundant components
The dominance of reliability-related responses across both operational and future projects motivates this challenge. Reliability remains the single largest risk category for both project phases. In particular, failures of major non-redundant components are critical due to their potential to cause long outages, high repair costs, and significant reductions in availability and revenue.
3.2.3 Sector challenge 3: inefficiencies in operation and maintenance (O&M)
While reliability determines failure occurrence, the survey responses also highlight the importance of how failures are managed. The strong prioritization of advanced sensing, failure prediction, and O&M decision-support tools indicates recognition that operational inefficiencies and limited predictability in O&M processes materially affect project economics. This challenge captures issues that are not reflected in failure behaviour alone, including uncertainty in repair times, logistics delays, access constraints, data availability for operational and end-of-life decisions, and the difficulty of translating condition-monitoring information into effective operational actions.
3.2.4 Sector challenge 4: design and operational risks from rapid technology upscaling
The identification of immature or unproven technology as a risk across both operational and future projects motivates the fourth sector challenge. Risks associated with technology novelty include unexpected costs, reduced availability, delayed commissioning, and increased uncertainty in performance and maintenance behaviour. These risks are amplified by rapid upscaling trends, including increasing turbine size, new drivetrain concepts, evolving grid-code requirements, and associated changes in turbine operating modes.
In this section, each sector challenge is examined in more detail. For each challenge, existing literature on the underlying risk categories is reviewed, and the order of magnitude of economic impacts arising from uncertainty in modelling assumptions and data availability is quantified.
4.1 Wind farm and scenario definition
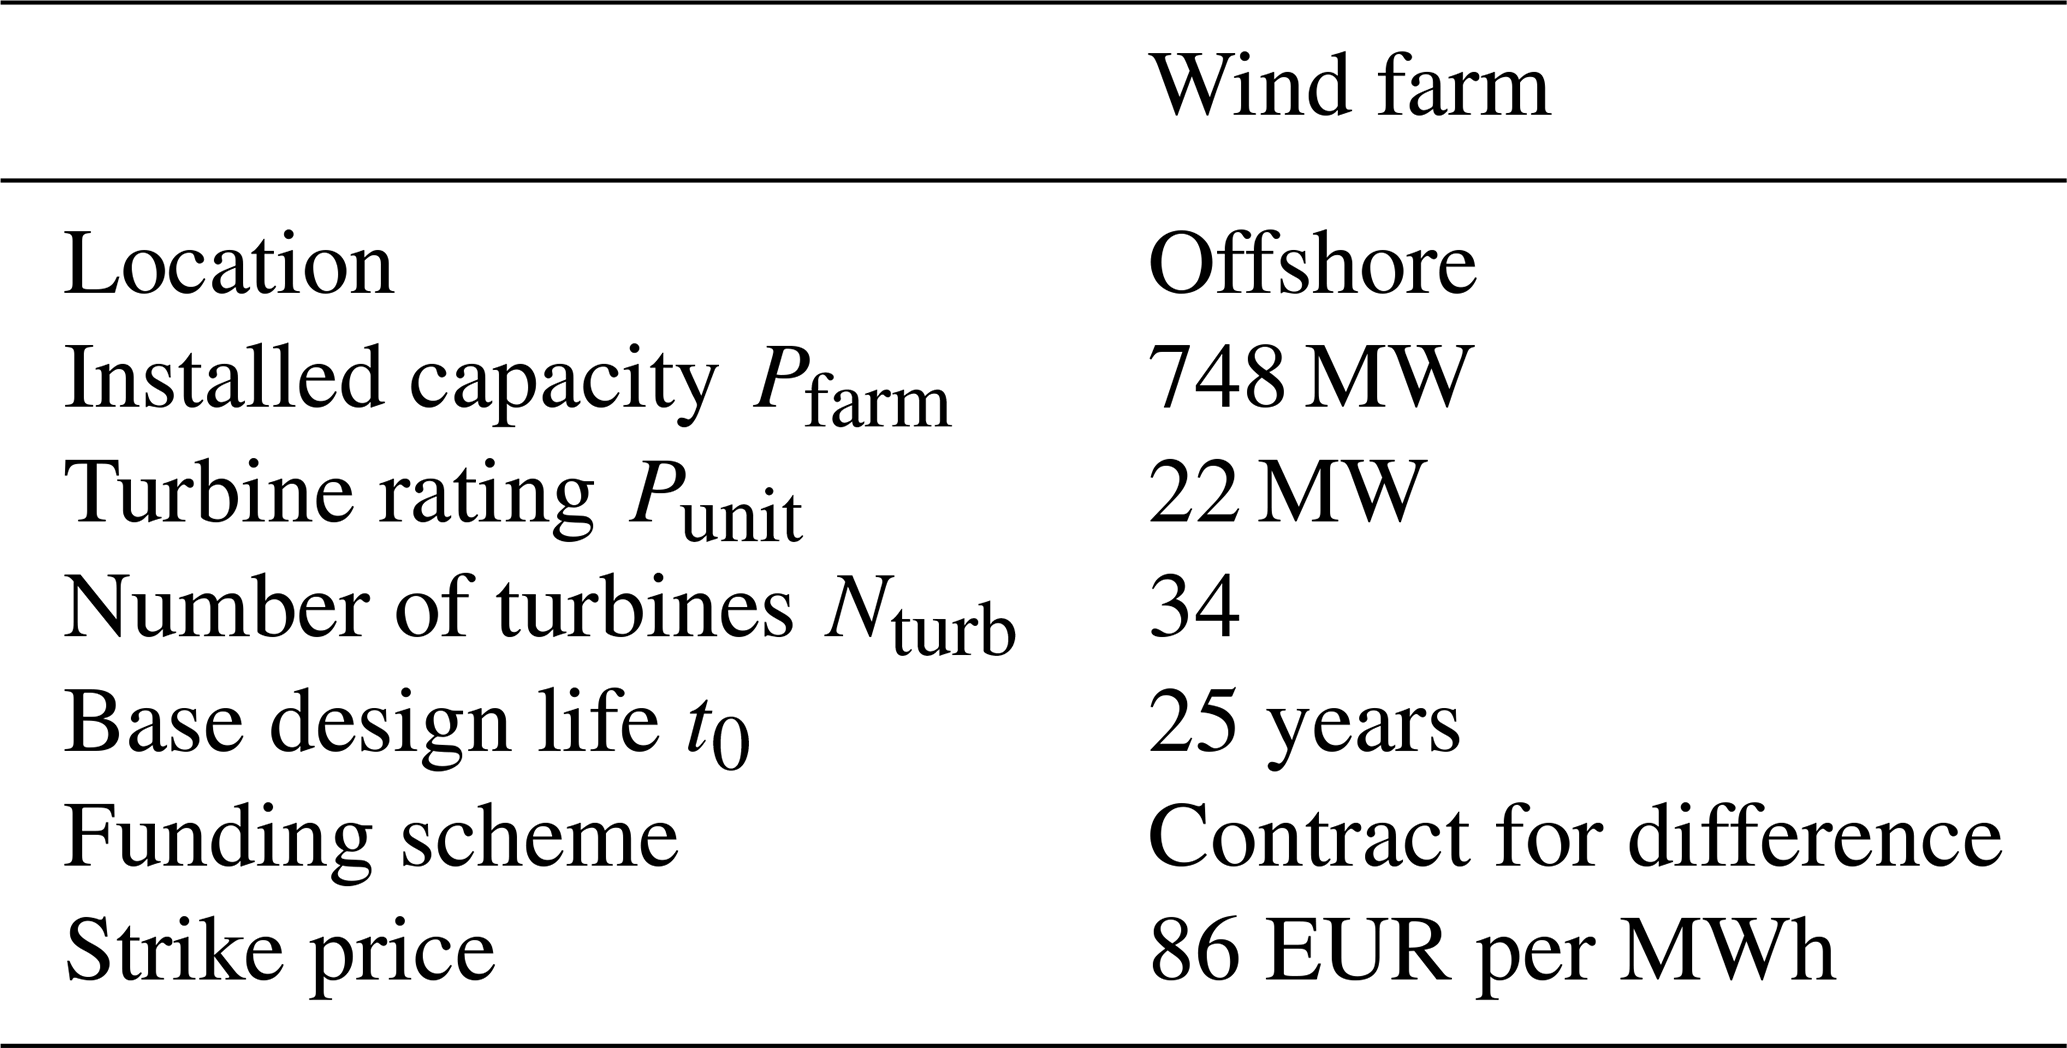
As a basis for the quantitative impact analysis in the individual risk categories, we define a generic wind farm representing a large-scale next-generation European offshore wind farm project. The wind farm is assumed to consist of thirty-four 22 MW wind turbines located in the North Sea. Table 1 summarizes the main characteristics of the wind farm.
The risk categories examined in this study affect different phases of the project life cycle, from early development and financing through construction, operation, late-life assessment, and potential lifetime extension to end-of-life decisions. To establish a consistent terminology for these phases across all subsequent sections, Fig. 4 provides a schematic overview of the project life cycle as adopted in this study, together with the mapping of the sector challenges defined in the previous section to the phases they predominantly affect.
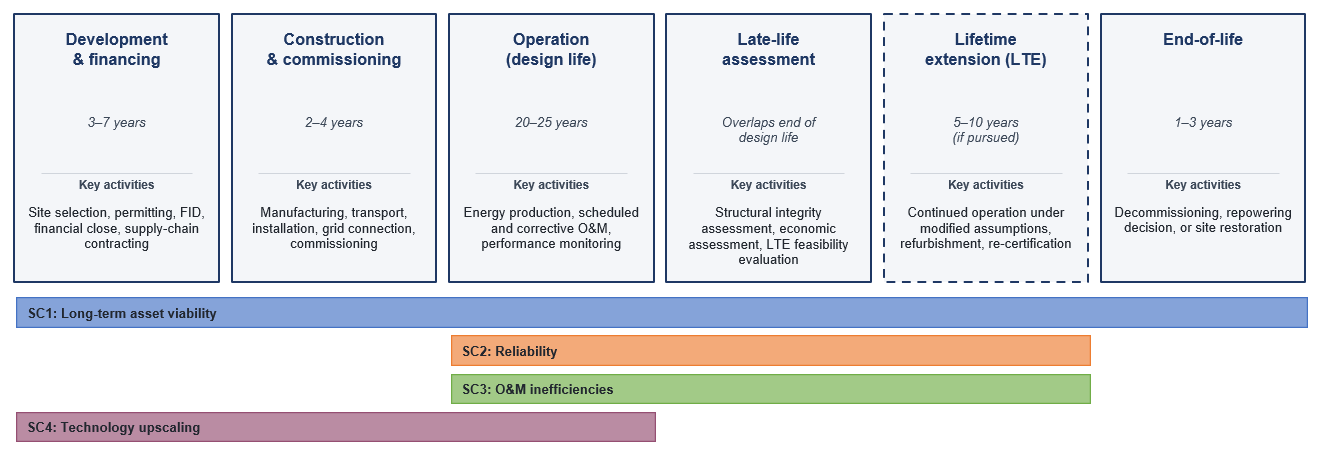
Figure 4Schematic overview of the project life cycle phases adopted in this study. Coloured bars indicate the phases predominantly affected by each of the four sector challenges.
In the impact assessment subsections below, scenarios are defined to represent different parameter ranges governing each modelled process. For each risk category, multiple scenarios are developed based on literature, available data, and the judgement of the authors. The scenarios are evaluated in a Monte Carlo manner, with the tool chain run 3000 times for each experiment. To ensure comparability across risk categories, a common baseline scenario is defined, representing the operation of the reference wind farm (34 turbines, 748 MW installed capacity, based on the 22 MW International Energy Agency (IEA) reference turbine) under deterministic assumptions for all cost, production, and financial parameters, without stochastic variation. Scenario labels are defined within each risk category. For example, “SC1” denotes the first scenario within the supply chain risk category.
4.2 Long-term asset viability: supply chain uncertainty
4.2.1 Review
The growth of the wind energy industry has been enabled by a robust and globalized supply chain that supported the installation of around 100 GW of capacity per year from 2020 to 2024 (IRENA, 2025). However, this existing supply chain is inadequate to support growth targets that require higher deployment rates, expansion into new markets, diversifying suppliers to mitigate geopolitical risks, and meeting the needs of evolving technologies such as floating offshore wind (Costanzo et al., 2025). Although many of these challenges could be mitigated by expanding networks of manufacturers, infrastructure, and skilled labour, investors remain cautious due to market volatility, inconsistent policy signals, and trade-offs between local capacity building and reliance on established global suppliers (Shields et al., 2023; Global Wind Energy Council and Boston Consulting Group, 2023). This uncertainty slows supply chain investment, which subsequently limits the ability of future wind energy projects to source and install components in a timely, cost-effective, and politically acceptable manner.
The elements of a global supply chain that are relevant for wind energy projects include raw materials, manufactured components, specialized infrastructure, and a skilled workforce (Shields et al., 2023). These present themselves as risks to wind energy projects primarily as follows:
-
Material and component bottlenecks. The construction of a wind turbine requires specialized materials, products, and manufacturing processes. Manufacturing facilities are designed only to produce components that are specific to the wind industry (and often, specific to a single manufacturer) and cannot easily diversify their production base. Installing wind turbines – particularly offshore – requires specialized logistics and facilities that have a limited global supply. The constrained supply of these components or capabilities can drive higher costs and delays for wind projects that compete for a scarce set of resources.
-
Geopolitical and trade risks. In recent years, policy-makers have emphasized the need for supply chain localization to increase reliability and to stimulate economic growth (Shields et al., 2023; Global Wind Energy Council and Boston Consulting Group, 2023). Strategically critical materials, such as rare earth elements (used in generators) and balsa wood (used in blades), have highly concentrated supplier networks and limited global manufacturing capacity. Governments have used industrial policy to create import barriers (i.e. tariffs), limiting the availability of global supply chain components (Baranowski et al., 2022; Shields et al., 2023).
Supply chain uncertainties affect project design and decision-making through a complex network of interrelated factors, which we summarize in Table 2.
Table 2Key uncertainty dimensions in decision-making based on supply chain risk, mapped to uncertainty type, decision risk, and time aspects. A: aleatory, E: epistemic, R: regime.
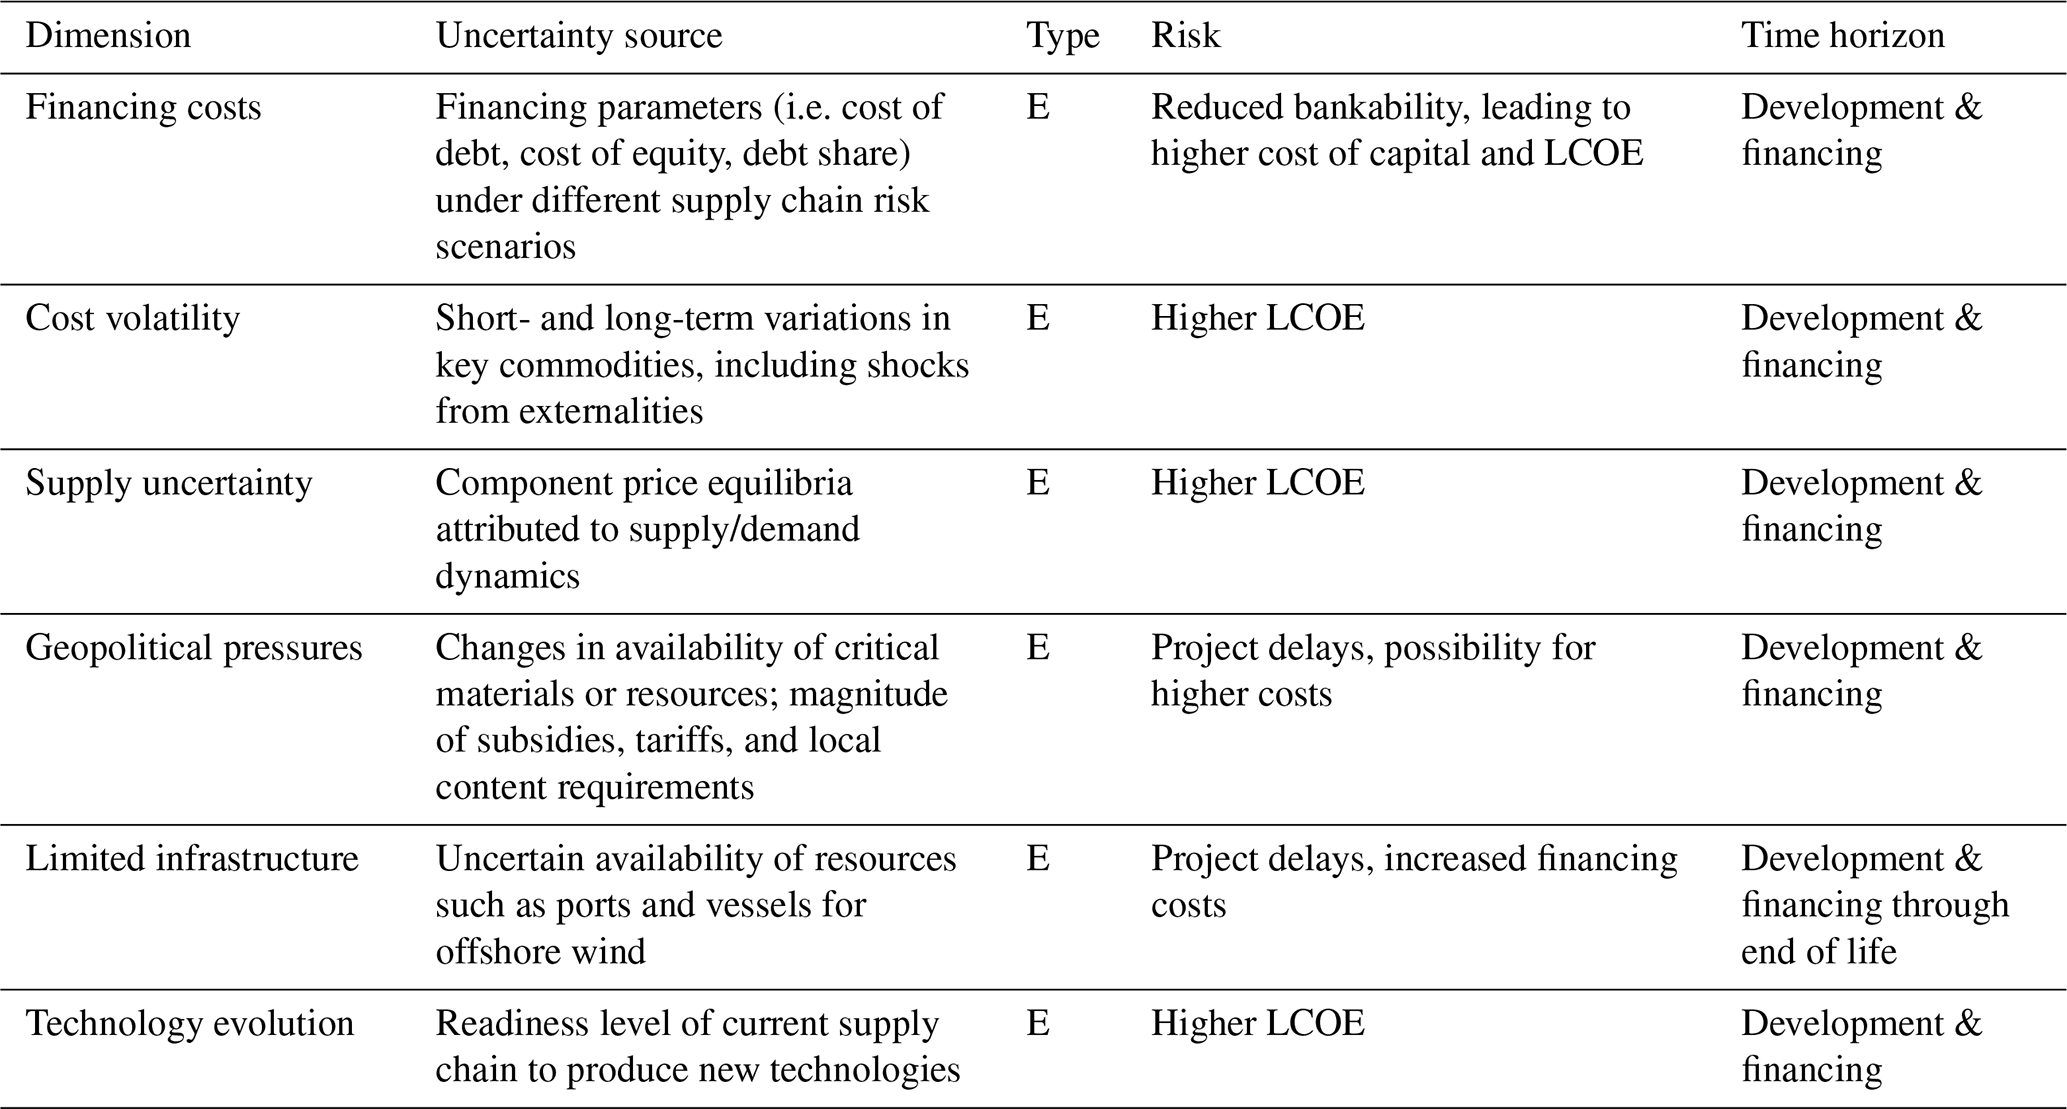
In this study, we provide a simple assessment of the first two uncertainty dimensions to demonstrate the potential impact on LCOE driven by supply chain uncertainty. Further research is required to fill the knowledge gap of how future supply chain risks impact project design and cost decisions, such as developing dynamic supply chain investment models, causal relationships between perceived risks and financing costs, detailed accounting of industrial policies, and readiness levels of existing supply chain infrastructure.
4.2.2 Impact assessment
We evaluate the impact of supply chain risks on the LCOE of representative wind projects through two coupled mechanisms: (i) stochastic uncertainty in key commodity prices, propagated through the CAPEX calculation, and (ii) variation in the cost of capital reflecting different levels of perceived geopolitical and supply chain risk. All other parameters – including OPEX, annual energy production, and project lifetime – are held at baseline values, so that the resulting LCOE variation is attributable solely to supply chain and financing risk. Because LCOE scales with the product of these factors, their combination can produce non-linear impacts on project economics.
The commodity prices that have the greatest impact on the variance of capital costs of a wind project are steel, copper, and carbon fibre which contribute some of the highest mass fractions to onshore and offshore wind projects (Eberle et al., 2023). Although there are other key commodities that are notable supply chain risks for wind energy projects, such as rare earth elements and iron ore, these commodities are a relatively minor part of the capital stack of a project, and price fluctuations will not greatly affect CAPEX (availability risk will be addressed through the cost of capital). Other commodities such as fibreglass used in blades have higher mass fractions but relatively low historic volatility, making them less relevant for stochastic modelling (US Bureau of Labor Statistics, 2026a). Therefore, we primarily assess stochastic CAPEX uncertainty due to the variability in these primary cost drivers.
We obtain long-term price indices for these commodities from the US Bureau of Labor Statistics (US Bureau of Labor Statistics, 2026b, c). Because steel and copper are globally traded commodities, these indices serve as proxies for global market dynamics. Although regional price levels may differ, it is assumed that volatility structure and jump behaviour are broadly consistent across major markets. From the historical data, we derive the following stochastic parameters:
-
the drift (long-term trend) of commodity prices,
-
the volatility (short-term uncertainty),
-
the jump intensity (frequency of large, discrete price shocks).
We fit these parameters using a Merton jump-diffusion model (Merton, 1976), which augments geometric Brownian motion with a compound Poisson jump process to capture sudden price shocks. This is necessary because the frequency of short-term shocks to commodity prices produces heavy tails in the log returns that are poorly captured by Gaussian models. The linear correlations between the commodity price parameters are low (under 0.1) but are still included in the Monte Carlo simulation. The historical stochastic parameters for the three commodities are summarized in Table 3.
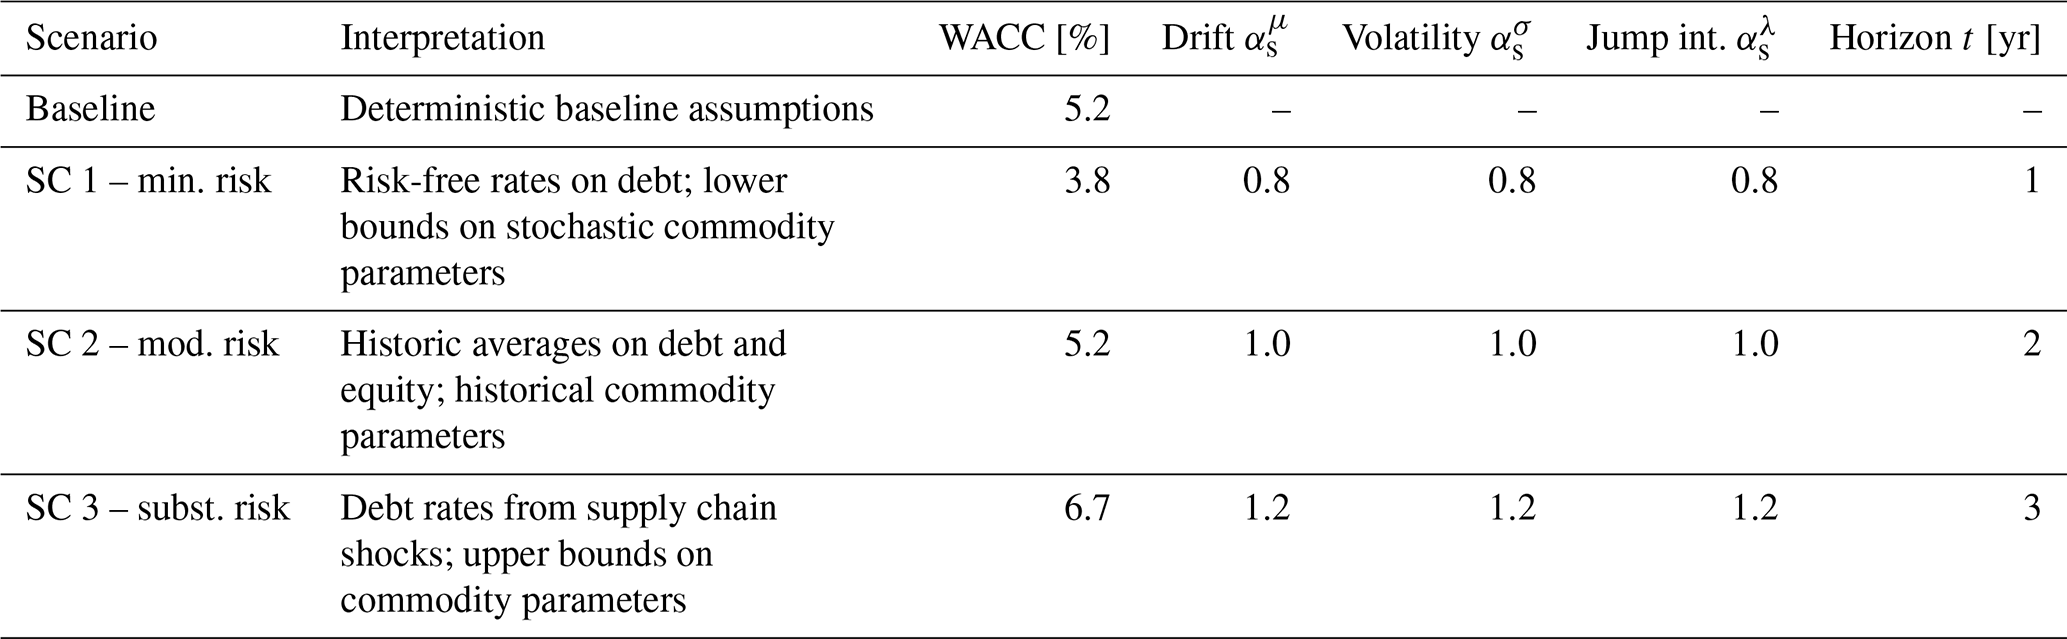
Table 3Supply chain risk scenarios, and associated financial and commodity price parameters. Stochastic commodity parameters are expressed as multipliers on the historical values for steel (0.258, 0.288, 1.96), copper (0.422, 0.422, 0.915), and carbon fibre (0.521, 0.250, 1.05), derived from US Bureau of Labor Statistics price indices (US Bureau of Labor Statistics, 2026b, c).
Financing risk is one of the most significant drivers of LCOE, although the causal relationship between supply chain disruptions and financial parameters is not well established in the public literature. We therefore select values of the weighted average cost of capital (WACC) that correspond to different levels of project risk, without attempting to draw a direct causal link with specific geopolitical or supply chain factors. Modelling these dependencies is a promising direction for future research.
WACC is calculated from the debt–equity ratio, tax rate, and cost of debt and equity, keeping the first two constant across scenarios. The cost of debt and equity are set relative to a risk-free rate using historical spreads from US wind project data (Mirletz et al., 2024). During 2017–2020, a period of relatively stable deployment, the debt premium over the risk-free rate was 1.73 % (Wiser et al., 2021); in 2023, amid global supply chain constraints, this premium rose to 3.5 % (Wiser et al., 2024). Both premiums are measured relative to the 10-year US Treasury yield (Board of Governors of the Federal Reserve System (US), 2026). The cost of equity is estimated at approximately 5 percentage points above the cost of debt. A German 10-year bond yield of 2.7 % serves as the risk-free baseline1 (Deutsche Finanzagentur, 2026), with debt premiums increasing across scenarios to reflect rising risk profiles. WACC is then obtained from the after-tax weighted average of these rates; for example, the moderate-risk scenario combines a debt rate of 4.43 % (2.7 % risk-free + 1.73 % premium) and a cost of equity of 9.43 % with a 70/30 debt–equity split and a 25 % tax rate, yielding the 5.2 % reported in Table 3.
The scenario definitions, combining WACC assumptions with stochastic commodity price multipliers and exposure time horizons, are provided in Table 3. The multipliers , , and scale the historical drift, volatility, and jump intensity of the commodity price processes, respectively; α=1 recovers the historical estimate, while values below or above 1 dampen or amplify the corresponding parameter. The time horizon represents the period over which stochastic cost pathways evolve, reflecting commodity price volatility exposure (Ury et al., 2024).
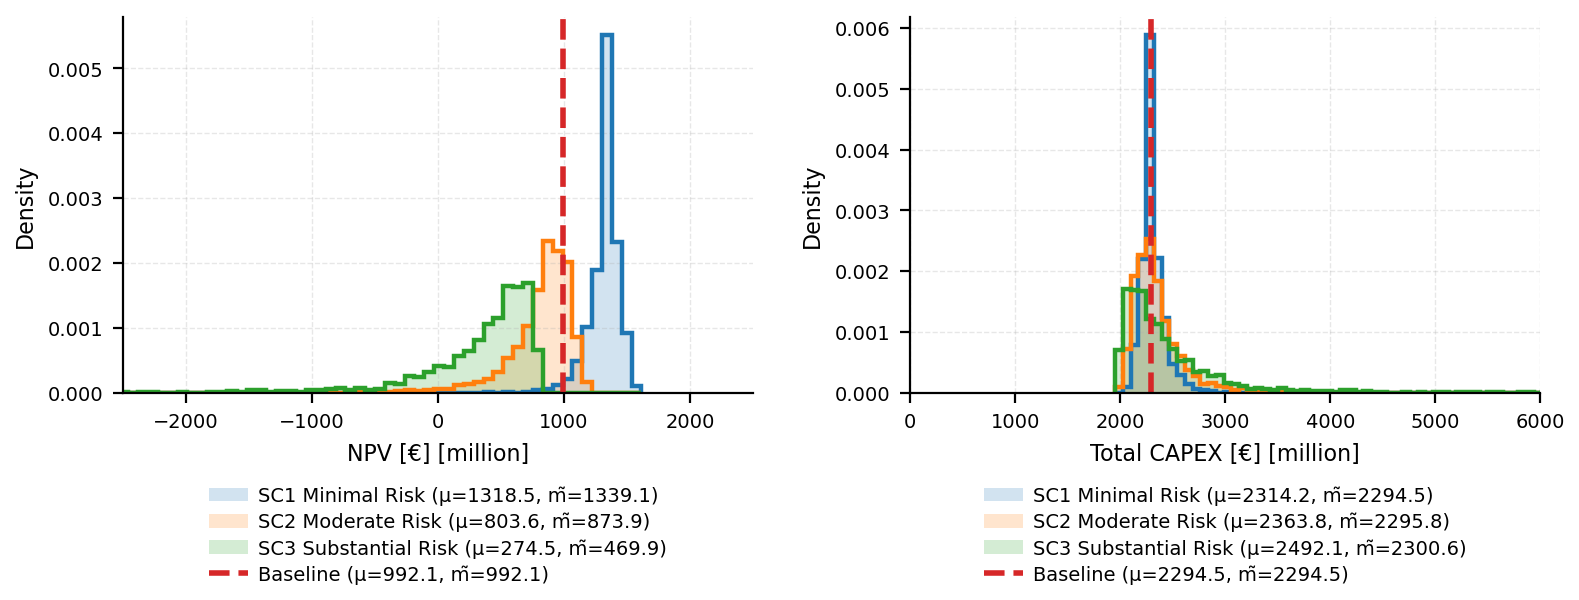
Figure 5NPV (left) and total CAPEX (right) distributions for different scenarios. μ denotes the mean, the median.
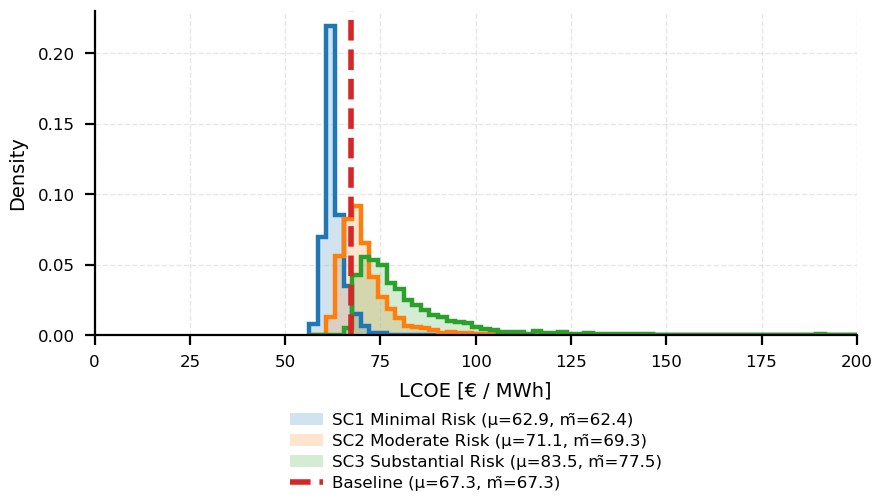
The NPV, total CAPEX, and LCOE simulation results for the scenarios in Table 3 are provided in Figs. 5 and 6, respectively. The effects of the commodity price volatility and increasing time exposure increase the tails of the distribution while slightly reducing the peak cost. A greater impact is noticeable in NPV, which shows a clear shift in the mean of the distribution driven by favourable or unfavourable financing costs coupled with increasing negative tails for the SC3 scenario. When combined into the LCOE calculation, it is clear that increasing risk profiles drive a fundamental shift in the cost structure of the project. The median of the SC 2 scenario is near the (deterministic) baseline LCOE of EUR 67.3 per MWh, with a mean value of EUR 69.3 per MWh. By comparison, essentially the entire distribution of the higher risk SC 3 scenario is above the baseline value of LCOE, with the mean now at EUR 77.5 per MWh. This increase of around 12 % is on the lower end of the reported 10 %–50 % cost increases faced by offshore wind projects between 2021 and 2023 that directly led to cancellations of projects in Europe and the US (and does not include effects from additional macroeconomic factors or the remaining uncertainty sources in Table 2) (Fuchs et al., 2024). Supply chain risk can therefore create a step change in project feasibility.
4.3 Long-term asset viability – end-of-life decision-making
4.3.1 Review
Wind turbines are typically designed for a nominal lifetime of 20 years for onshore installations and 25 years for offshore installations, in accordance with International Electrotechnical Commission (IEC) standards (IEC, 2019a, b). In Europe, between approximately 60 GW (WindEurope, 2025c) and 80 GW (WindEurope, 2025a) of installed capacity will reach the end of design life in the coming years. The nominal design lifetime, however, does not necessarily define the actual end of operational life. End-of-life decision-making encompasses a set of interrelated technical, regulatory, and economic considerations that determine whether assets are decommissioned, repowered, refurbished, or operated under a lifetime extension (LTE) framework. The underlying uncertainties are relevant throughout the asset lifetime, even though they become most consequential in late-life phases.
From a technical perspective, structural integrity frequently permits continued operation beyond the design lifetime, because actual site-specific loads are often less severe than the conservative assumptions used in design. The monitoring of operational conditions and accumulated loads can reduce this uncertainty and support the verification of safe continued operation (Nielsen et al., 2019). If structural integrity can be ensured, component reliability becomes the key determinant: ageing mechanisms such as wear, corrosion, and fatigue lead to increasing failure probabilities (Carroll et al., 2016; Donnelly et al., 2024; Dinwoodie et al., 2013), and epistemic uncertainty in post-design-life failure rates can substantially influence maintenance costs and availability. Aerodynamic performance may further degrade due to blade erosion (Malik and Bak, 2025). Beyond the asset itself, changing site conditions introduce additional uncertainty through climate-change-induced annual energy production (AEP) shifts of approximately −2 % to −5 % (Hahmann et al., 2022; Larsén et al., 2024) and evolving wake effects that may reduce AEP by 5 %–18 % under future high-deployment scenarios (van der Laan et al., 2023; Borgers et al., 2025).
Regulatory conditions represent a regime-level uncertainty. Lifetime extension is not governed by a harmonized framework in Europe; national regulations differ in scope, stringency, and enforcement, and may evolve over time (Ziegler et al., 2018). Requirements for permitting, inspecting, certifying, and documenting directly affect technical feasibility, while decommissioning and removal obligations, particularly for offshore assets, introduce additional economic risk that can influence lifetime extension decisions independently of the technical condition of the asset.
Economic uncertainty in late-life phases is driven by refurbishment scope and costs, which are typically identified only after detailed inspections and vary widely across turbines, sites, and regulatory contexts (Ziegler et al., 2018). The absence of standardized refurbishment pathways renders cost estimates highly project specific. During extended operation, OPEX is further subject to the ageing-related reliability and spare-part uncertainties described above, limiting the applicability of deterministic cost assumptions.
IEC 61400-28 (IEC, 2025) provides a technical framework covering load accumulation, inspection strategies, and certification but does not prescribe an economic decision model. Several studies have addressed LTE risk quantification, including Bayesian decision frameworks (Nielsen et al., 2019), probabilistic fatigue-economic optimization (Nielsen and Sørensen, 2021), and techno-economic frameworks integrating structural degradation with economic evaluation (Yeter et al., 2022). These approaches demonstrate that moderate reductions in target reliability may be economically acceptable, but they typically address limited subsets of the relevant uncertainties.
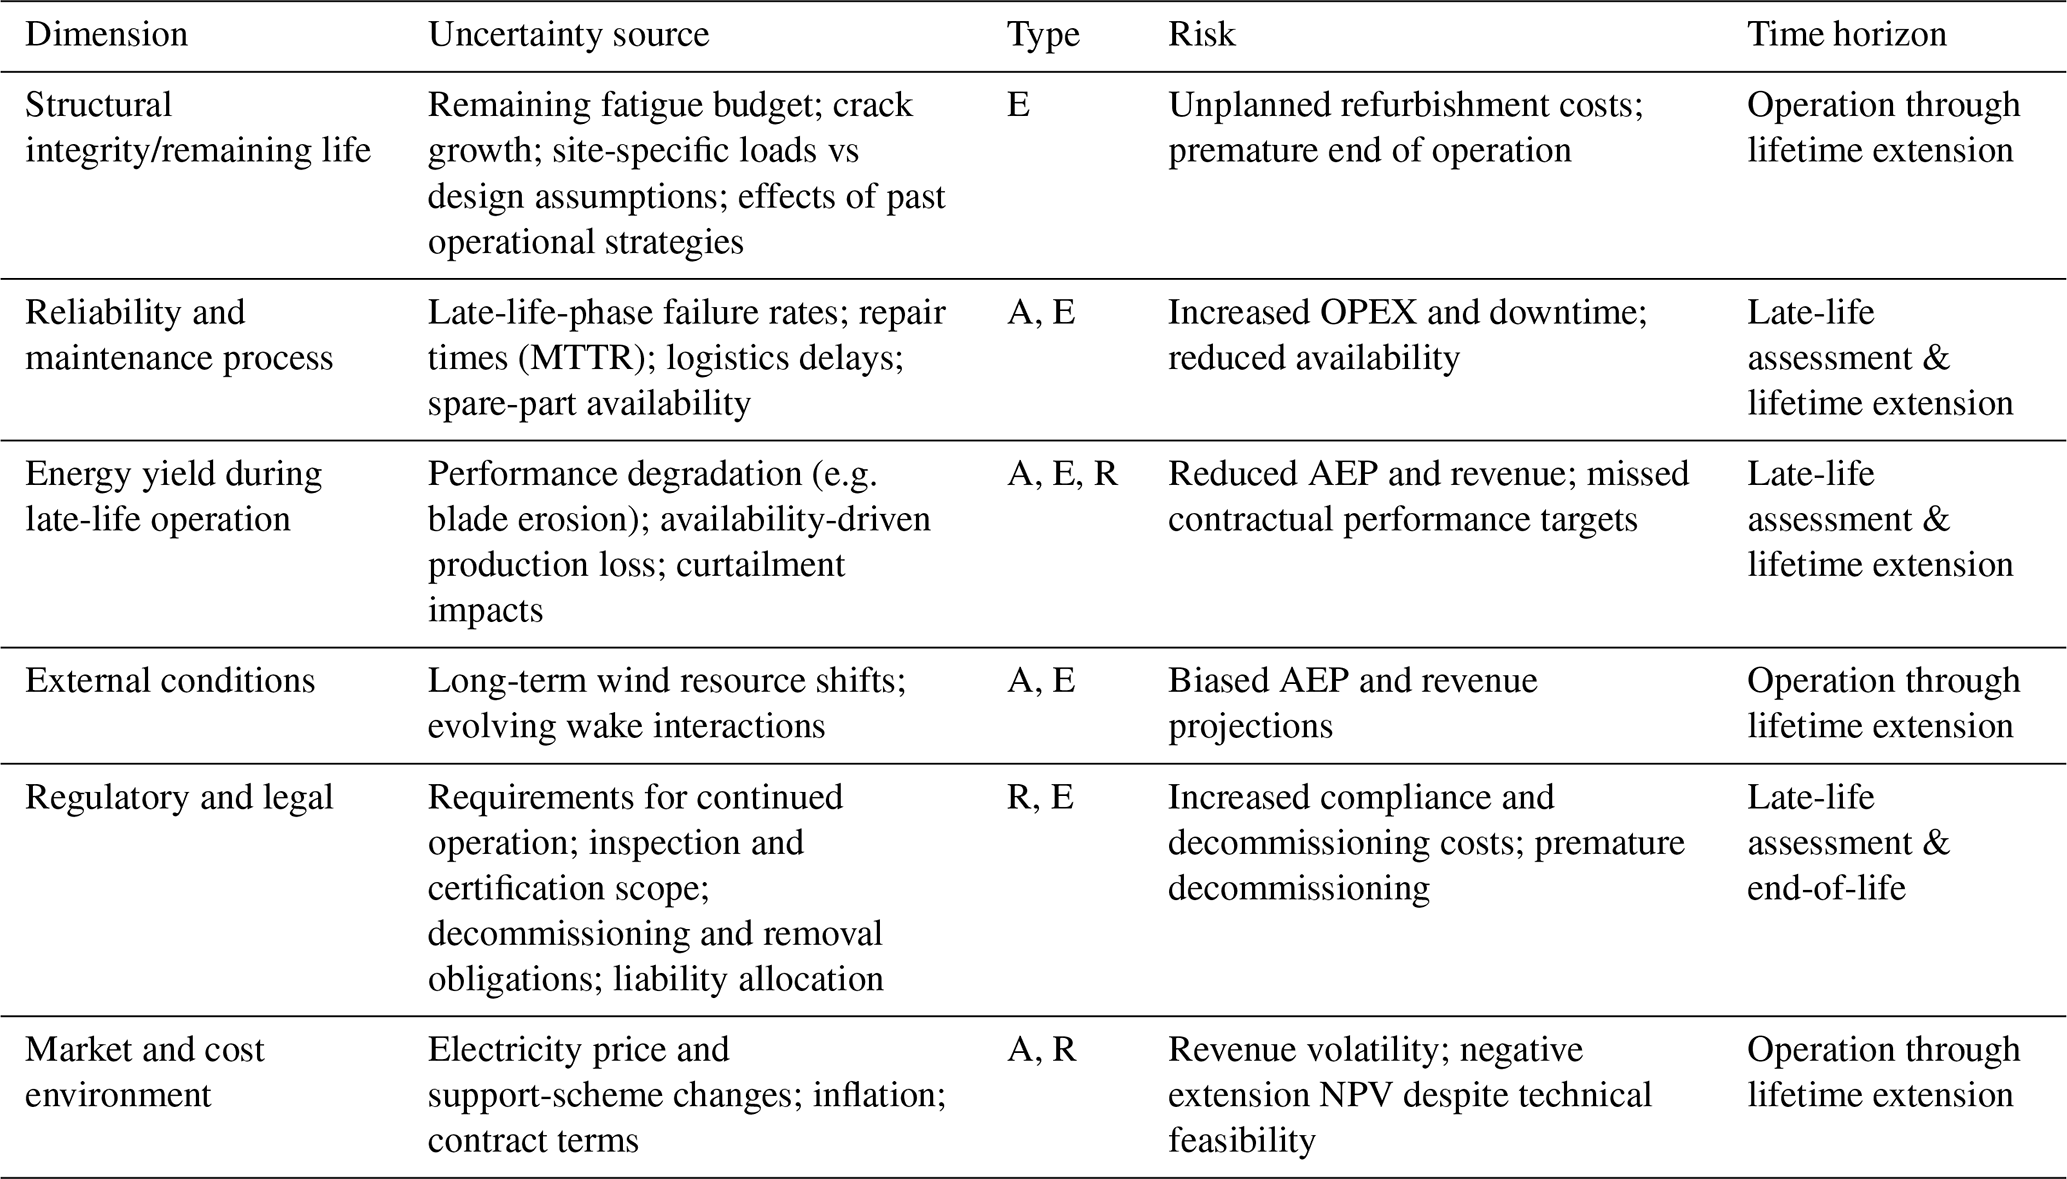
Table 4 summarizes the key uncertainty domains, their associated risks, and relevant time horizons. Late-life decision-making spans aleatory, epistemic, and regulatory uncertainty across multiple time horizons, from early-life fatigue accumulation to short-term operational decisions and long-term financing risk, and existing frameworks typically address these dimensions in isolation rather than jointly.
Table 4Key uncertainty dimensions in end-of-life decision-making, becoming most relevant in late-life phases, mapped to uncertainty type, decision risk, and time aspects. A: aleatory, E: epistemic, R: regime.
4.3.2 Impact assessment
Building on the uncertainty dimensions in Table 4, we adopt a scenario-based impact assessment using lifetime extension as the central end-of-life decision. The analysis demonstrates how plausible variations in energy yield, refurbishment effort, and system reliability during extended operation propagate to project-level NPV and LCOE.
Each scenario defines:
-
a stochastic production modifier applied uniformly across the LTE period,
-
a stochastic refurbishment cost uplift applied as a one-off cost at the start of LTE,
-
a deterministic shift in system reliability parameters during the extended lifetime.
Production and refurbishment uncertainties are modelled as aggregated normal distributions, representing scenario-level uncertainty rather than individual risk realizations. For a given scenario s:
The sampled modifiers are applied as
In each Monte Carlo iteration, one random draw from and is applied uniformly across all LTE years, reflecting scenario-level uncertainty in energy yield and refurbishment costs. The corresponding assumptions for production loss, refurbishment uplift, and extension duration are summarized in Table 5.
Table 5Lifetime extension scenarios and associated quantitative assumptions.
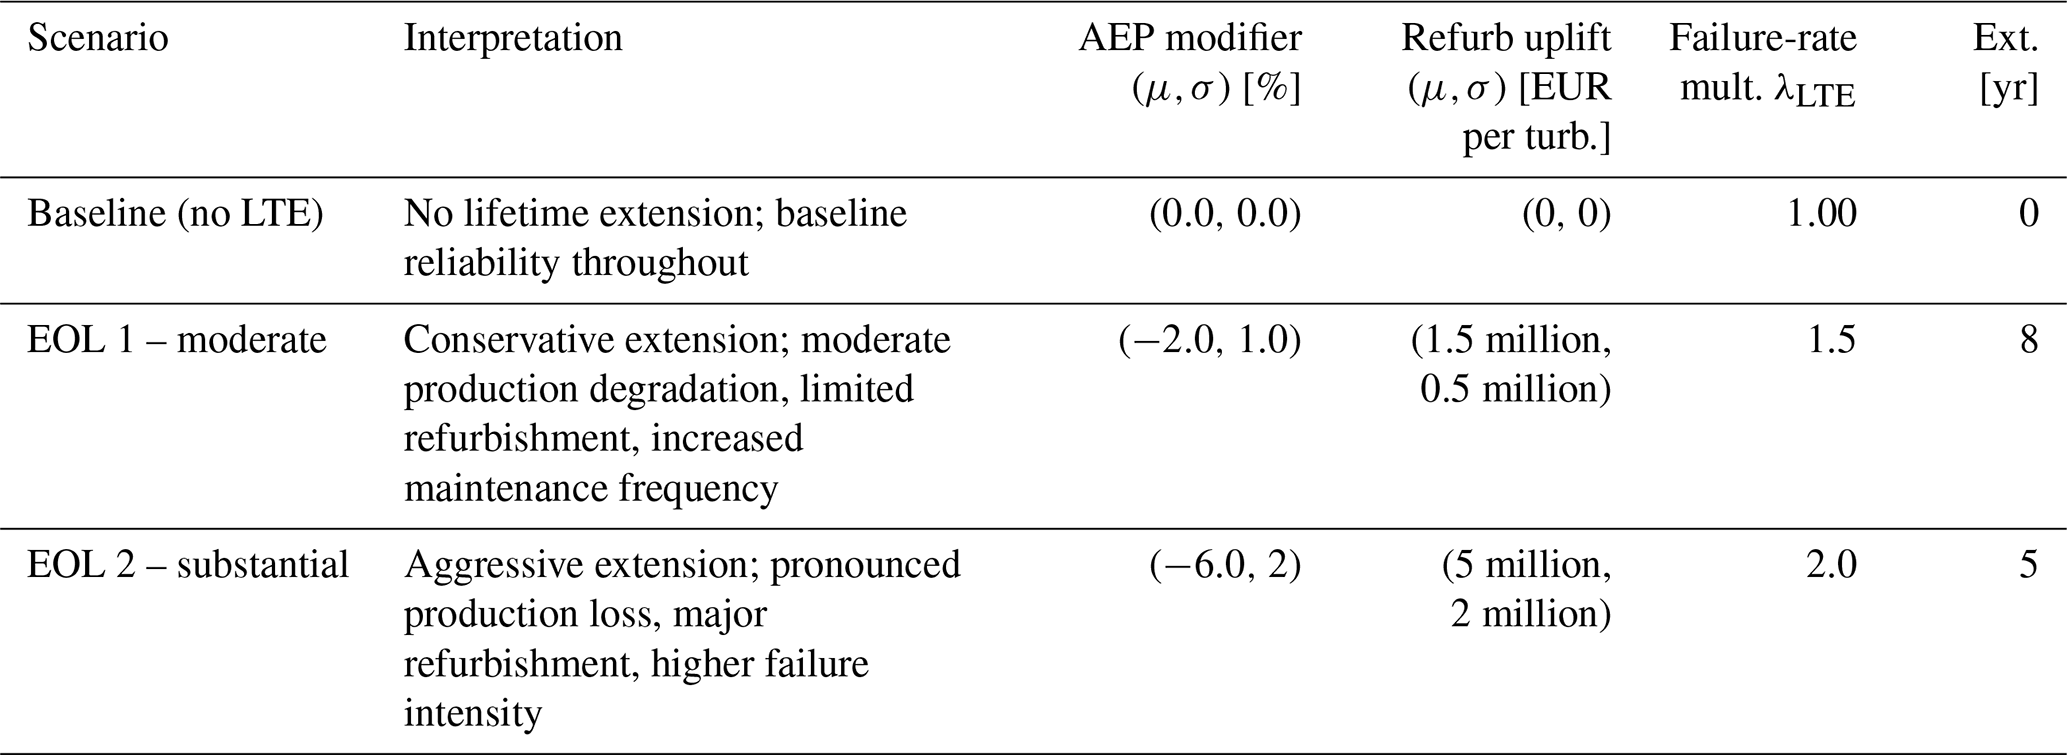
Uncertainty in future reliability is captured through deterministic, scenario-dependent multipliers on baseline component failure rates, applied only during the LTE period. This reflects the expectation that ageing mechanisms (wear, fatigue, corrosion, blade erosion) become increasingly relevant beyond the design life. Failure rates during the original design life remain unchanged. The complete scenario definitions – including production, refurbishment, reliability, and extension duration assumptions – are summarized in Table 5.
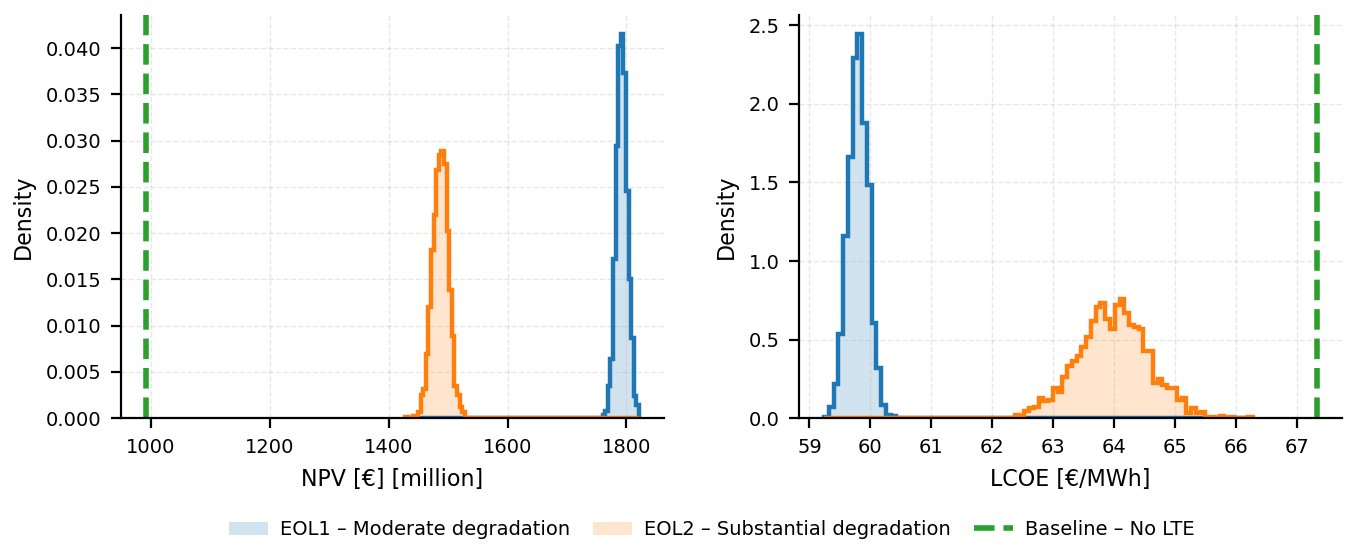
Figure 7 shows the distribution of total project NPV and LCOE for both the baseline case and the lifetime extension scenario. As expected, extending the operational lifetime of a wind farm is a powerful lever to increase project value and reduce the levelized cost of energy. Continued operation of an already depreciated asset allows additional production at comparatively low marginal cost, thereby lowering LCOE and increasing cumulative revenues. In addition, the postponement of typically substantial decommissioning costs further improves project economics. This should not be interpreted as an absence of risk in late-life phases but as an illustration of how the end-of-life decision can redistribute risk across time. The results indicate that LTE outcomes can vary substantially, with a spread on the order of EUR 100 million in NPV or about EUR 4 per MWh in LCOE for the considered case. This illustrative experiment does not account for electricity price volatility, inflation, regulatory risk, or catastrophic failures; future work should therefore address the end-of-life decision under the combined uncertainty dimensions summarized in Table 4, as well as load-managed operational strategies that actively shape the damage budget available for extended operation (Requate et al., 2023).
4.4 Long-term asset viability – curtailment
4.4.1 Review
With the increasing share of variable renewable energy (VRE) in power systems, the curtailment of wind and solar generation is a growing concern (GWEC, 2025). Curtailment reduces energy production, erodes revenues, and introduces uncertainty that is difficult to anticipate at the project level. Curtailed operation can also alter the turbine loading regime, which can influence fatigue life. This structural interaction is not considered in the present assessment. We distinguish three main types: (i) transmission-constraint curtailment, arising from insufficient grid capacity; (ii) market-driven curtailment, triggered by negative electricity prices; and (iii) wildlife-related curtailment, imposed to protect birds and bats.
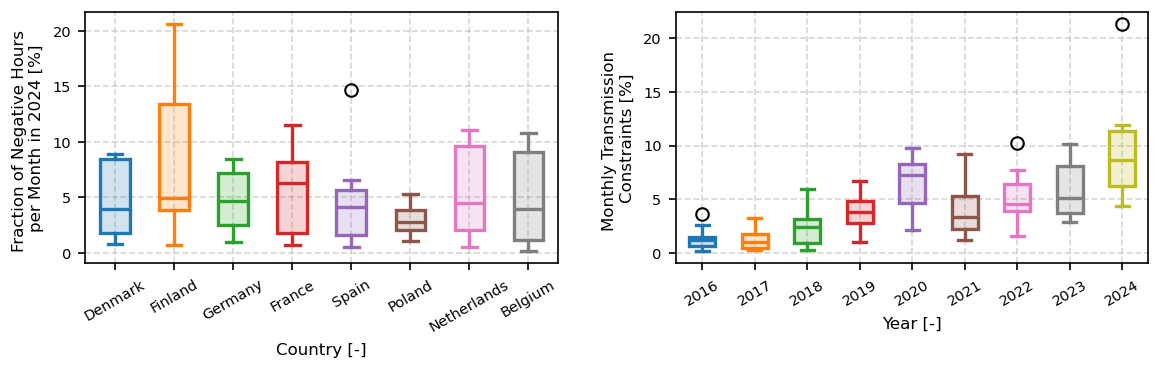
Transmission-constraint curtailment occurs when local or regional generation exceeds the capacity of the grid (Agbonaye et al., 2022; EirGrid TSO and SONI TSO, 2024). Grid capacity must develop in pace with renewable deployment, yet uncertainties in the timing and scope of reinforcement remain a critical challenge: projected European redispatch volumes range from 165 to 809 TWh by 2040, depending on the expansion scenario (Thomaßen et al., 2024), and congestion is already acute in several countries (International Energy Agency, 2025; SMARD – German Electricity Market Data, 2024). The spatial heterogeneity of constraint levels is illustrated by Irish transmission system operator (TSO) data (EirGrid TSO and SONI TSO, 2024): in 2023, grid-driven curtailment ranged from 0.3 % in South East Ireland to 11.4 % in North West Ireland (Fig. 8, right). Compensation mechanisms vary by country, from full cost-based reimbursement (e.g. Germany) to limited or no compensation (e.g. Ireland until recently), and frequent curtailment can lead to high system-balancing costs (Kerr, 2025).
Market-driven curtailment arises when wholesale electricity prices turn negative during periods of high VRE production (Tselika, 2022; Bird et al., 2016; Biber et al., 2022). Oversupply alone, however, does not push prices below zero: production-based support schemes such as feed-in premiums and contracts for difference (CfDs) remunerate per unit of energy produced and thereby incentivize generation even at negative prices. Their frequency has increased across high-penetration markets such as Germany, Denmark, and the Netherlands (Fig. 8, left; Ember, 2025), making curtailment an economically rational response. Market-driven curtailment can significantly impact project NPV and bankability, and may affect the ability to secure power purchase agreements (PPAs) or CfDs (Gonzalez-Aparicio et al., 2022).
Wildlife-related curtailment is imposed to mitigate bat and bird fatalities from blade collisions and barotrauma, particularly during seasonal migration and low-wind conditions (Cryan and Barclay, 2009; Friedenberg and Frick, 2021). Regulatory frameworks mandate operational restrictions such as raised cut-in speeds or seasonal shutdowns (European Commission, Directorate-General for Environment, 2010), although smart curtailment strategies using real-time bat activity indicators can reduce AEP losses relative to blanket shutdowns (Hayes et al., 2023; Gottlieb et al., 2024). Reported AEP losses are typically <1 %–3 % (Hayes et al., 2023; Whitby et al., 2021; Behr et al., 2017). As wildlife curtailment affects a different operational regime (low wind speeds) than transmission or market curtailment (high wind speeds), it is not included in the quantitative assessment below.
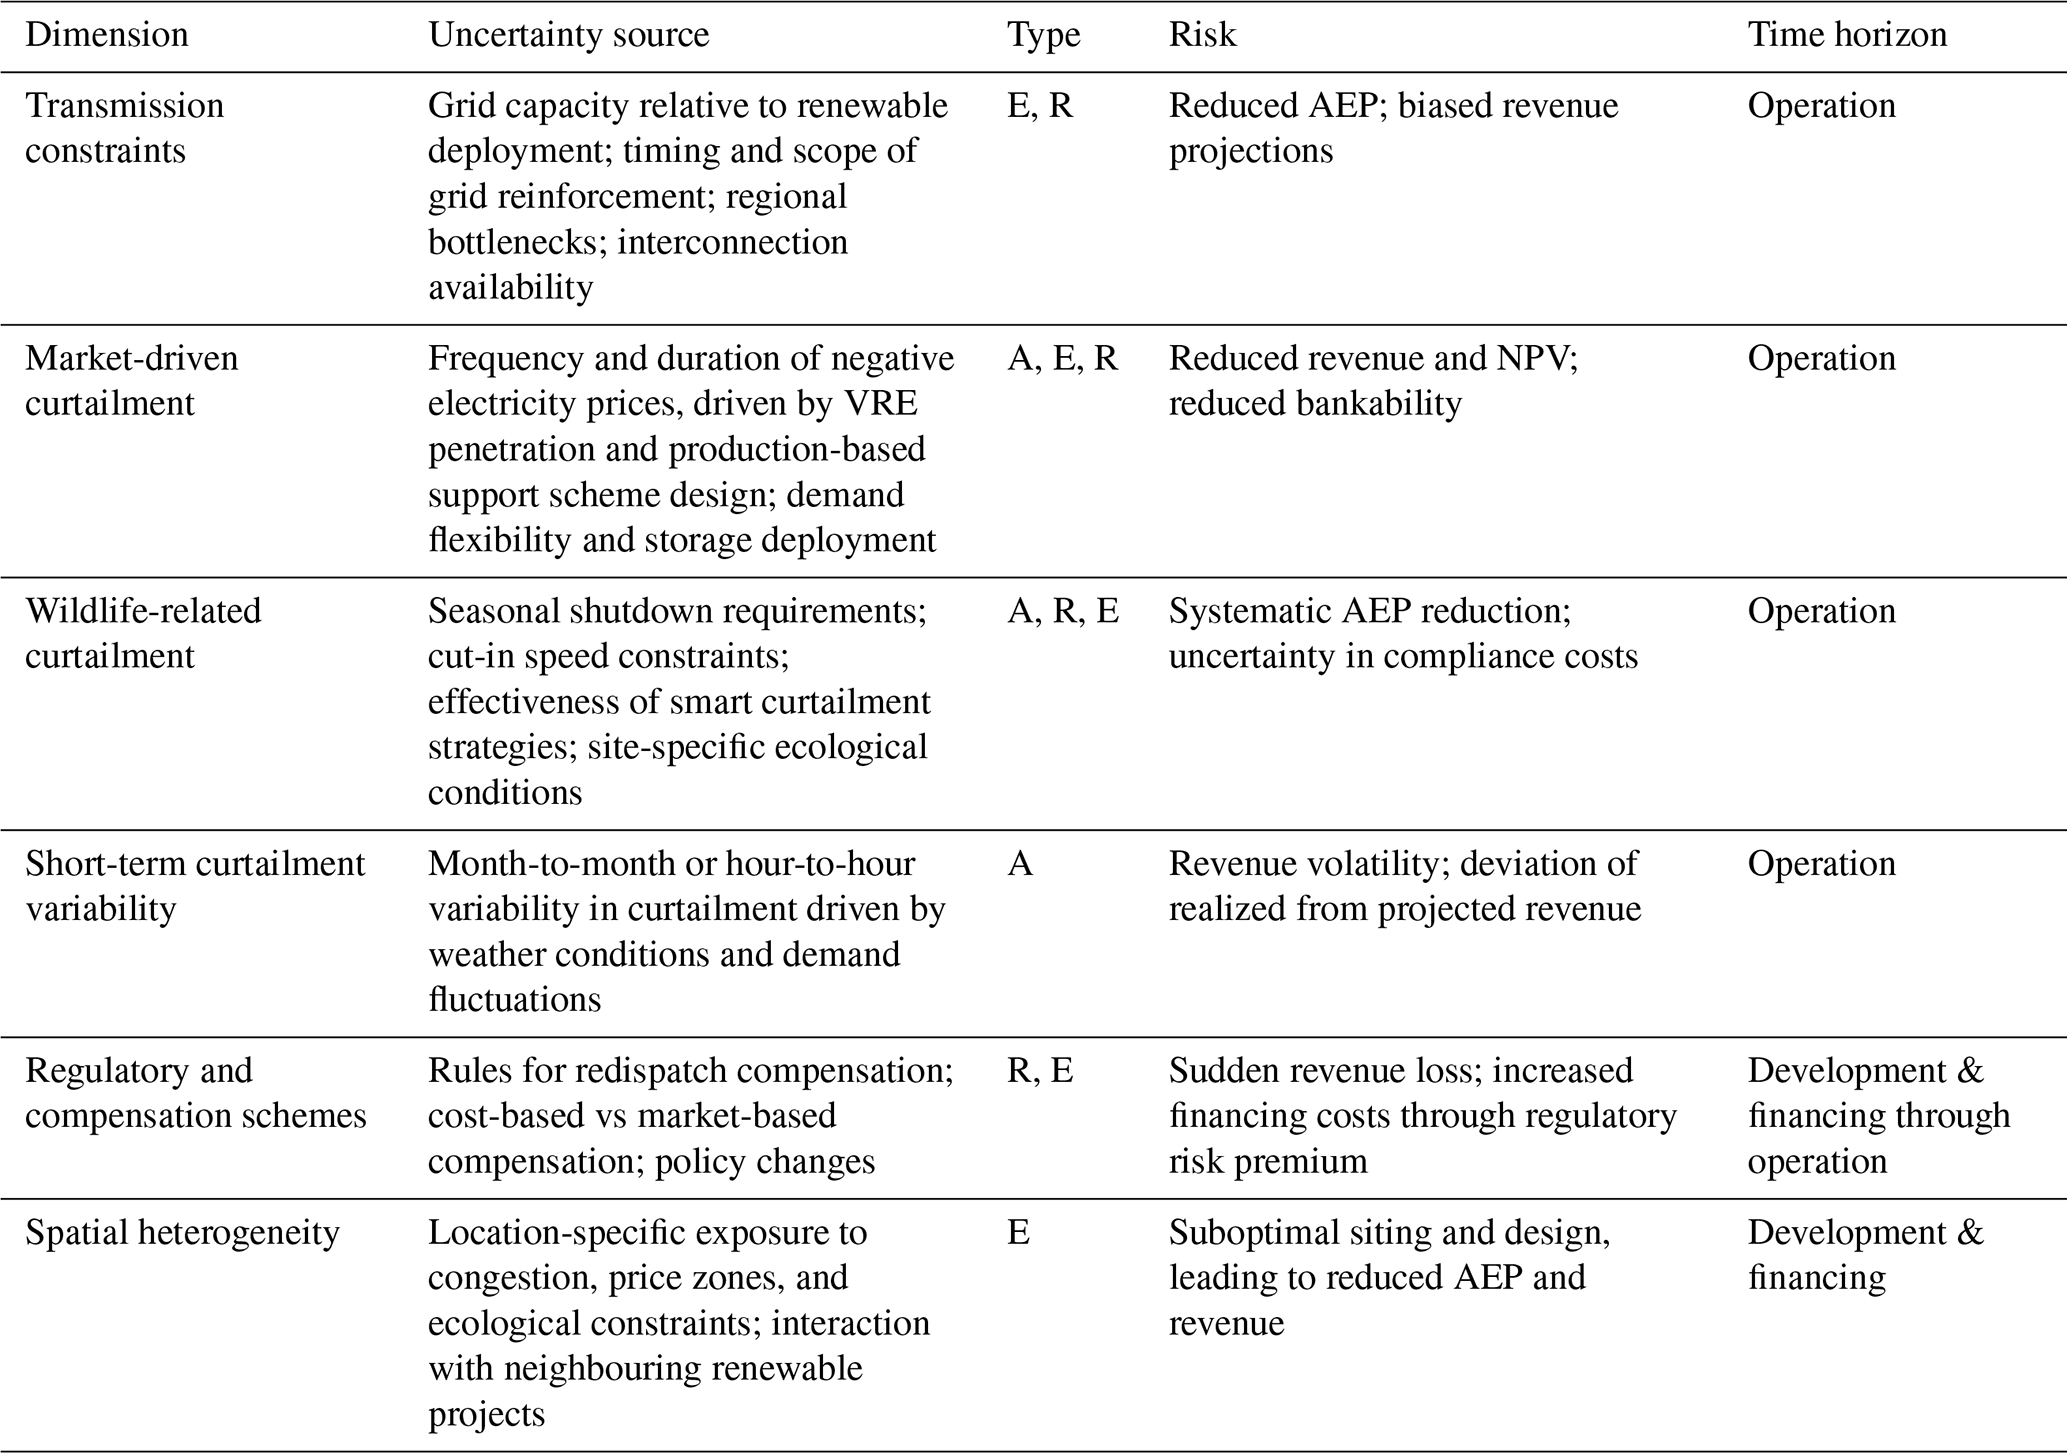
Table 6 summarizes the curtailment uncertainty dimensions discussed.
Table 6Key uncertainty dimensions in wind energy curtailment, mapped to uncertainty type, decision risk, and time aspects. A: aleatory, E: epistemic, R: regime.
4.4.2 Impact assessment
Curtailment is modelled as a system-level loss mechanism reflecting both persistent structural conditions and short-term operational variability. For a given month m, curtailed production is computed as
where Pm is the uncurtailed production and denotes the fraction of energy curtailed during month m. Depending on the case, cm either represents the transmission constraint level or the ratio of hours with negative electricity prices per month.
The curtailment fraction is modelled using a hierarchical stochastic formulation:
The model separates two uncertainty sources. Epistemic uncertainty in the long-term curtailment regime is represented through predefined ranges of the Gamma parameters (α,θ), sampled once per simulation and held fixed over the project lifetime (variation ranges of ±10 % around scenario values). Conditional on this regime, aleatory uncertainty captures irreducible month-to-month variability through Eq. (6). The Gamma distribution is chosen for its ability to represent positively skewed loss processes.
Five curtailment regimes are defined, informed by two empirical drivers: (i) spatially heterogeneous transmission constraints, derived from Irish TSO data for 2021–2024 (EirGrid TSO and SONI TSO, 2024), motivating three regimes of low, medium, and high grid constraints; and (ii) cross-country variability in negative electricity price frequency across Europe, motivating two market-driven regimes with contrasting price volatility. The resulting scenario definitions are summarized in Table 7.
Table 7Curtailment regimes representing epistemic uncertainty in system-level curtailment conditions. Distribution parameters were derived from data detailed in Fig. 8, where the monthly number of hours has been converted in monthly % of time, and the monthly curtailment level is expressed in %.
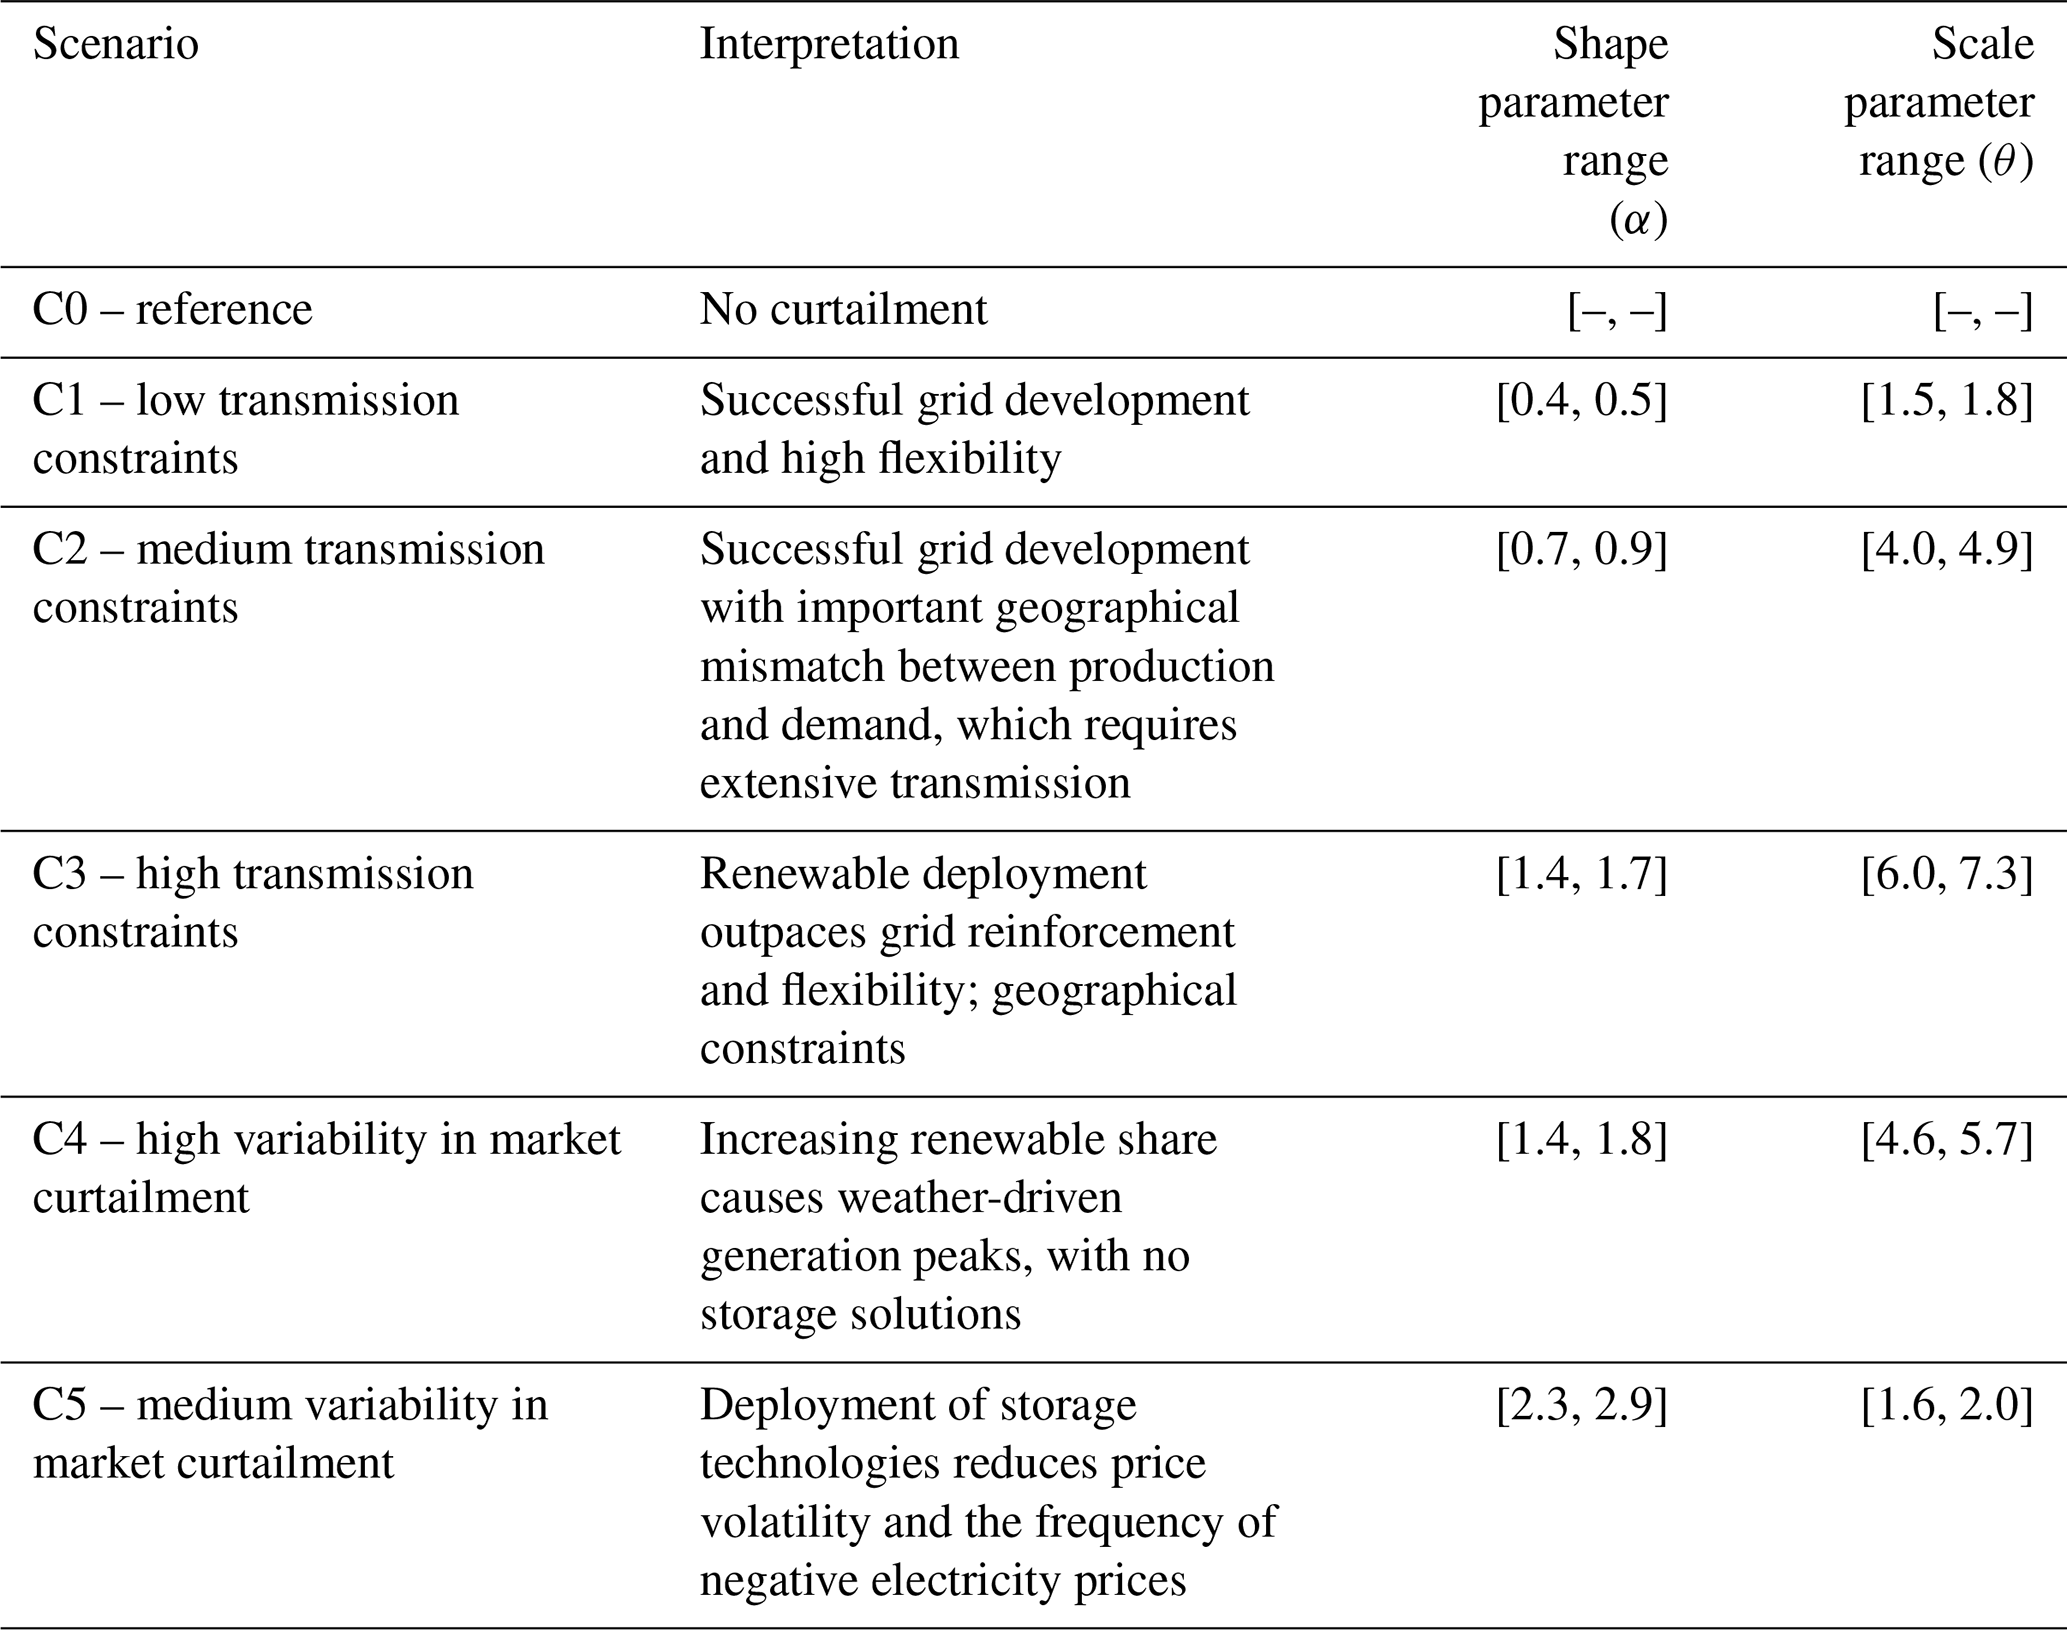
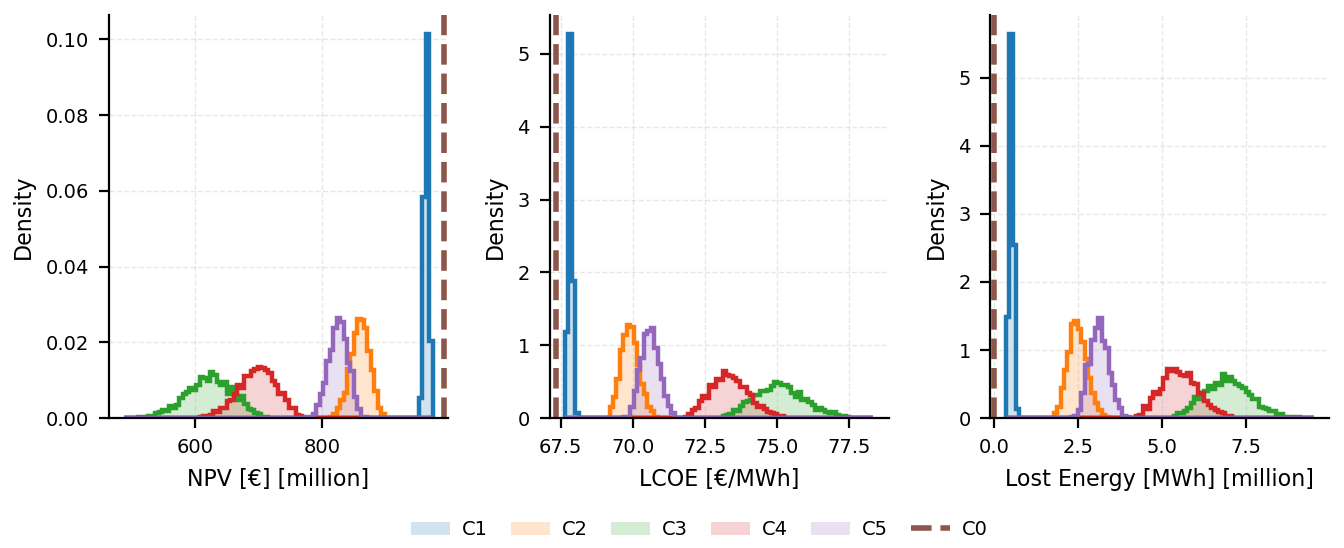
Figure 9 shows the distribution of project NPV, LCOE, and total lost energy for each curtailment scenario. The results are based on the assumption that curtailed energy leads to lost revenue for the project owner, with no compensation scheme considered. As a result, the analysis primarily reflects the economic loss, which in practice would not necessarily be carried by the operator alone.
The results indicate that curtailment introduces substantial economic risk. Project NPVs are shifted by several hundred million euros across scenarios and exhibit a wide spread within individual scenarios. Depending on the compensation mechanism, curtailment at these levels can render projects economically unviable. From an energy system perspective, curtailed production also represents a significant inefficiency, as this energy could have been generated at near-zero marginal cost.
4.5 Reliability gaps in major non-redundant components
4.5.1 Review
Wind turbine reliability is central to performance optimization and cost control, yet various indicators are used in the literature to assess it at both system and component level (Walgern et al., 2026). Despite efforts to develop consistent data collection practices and taxonomies (Hahn et al., 2017), there is still no uniform standardization in the definition of reliability indicators, failure events, or component classifications across turbine types (van Kuik et al., 2016; Cevasco et al., 2021).
Among the reliability indicators used in wind turbine studies, the average annual failure rate per turbine is the most widely reported, due to its simplicity and direct applicability in O&M analyses. However, reliance on this parameter may hide substantial epistemic uncertainty associated with its estimation. Identical average failure rates can arise from datasets of different sizes. For example, an annual failure rate of 0.5 may be derived from 500 failures observed over 1000 turbine years or from 15 000 failures over 30 000 turbine years. While the mean is the same in both cases, the statistical confidence in the estimate differs. Methods to quantify this uncertainty through confidence intervals or similar measures have been proposed in the literature (Fischer et al., 2019; Walgern et al., 2026), yet this information is rarely reported in publicly available reliability databases. As a result, failure rates are often treated as deterministic inputs in O&M models, despite being derived from limited or heterogeneous datasets. A compilation of average failure rates reported in 12 publicly available databases (Table A1) shows values spanning from 0.434 to 46.856 failures WT−1 yr−1, with the highest value likely an outlier due to supervisory control and data acquisition (SCADA) alarm usage. Following the approach of Dao et al. (2019), the datasets were clustered by location, observation period, and mean rating; the resulting coefficients of variation (Table 10) illustrate how these factors contribute to variability. This lack of uncertainty characterization introduces epistemic uncertainty that can propagate into biased estimates of intervention frequency, downtime, and O&M costs (Gräfe et al., 2025b; Donnelly et al., 2024).
Beyond statistical uncertainty in failure-rate estimation, a major source of epistemic uncertainty arises from heterogeneity across turbine fleets and study contexts. Reported failure behaviour has been shown to depend systematically on turbine technology, drivetrain concept, rated power, manufacturer, and site conditions. Walgern et al. (2026) analyses large multi-fleet datasets and demonstrate original equipment manufacturer (OEM)-specific differences in average annual failure frequencies normalized by installed capacity. Reported values range from approximately ∼1.5 to ∼2.5 failures MW−1 yr−1 for onshore turbines and from ∼0.7 to ∼1.6 failures MW−1 yr−1 for offshore installations, highlighting substantial differences even after capacity normalization. These differences are attributed to a combination of design characteristics, component selection, operational environment, and maintenance strategy rather than random variation. Similarly, Reder et al. (2016) report systematic variations in failure rates at both system and component levels as a function of turbine power rating (Table 11), while Tavner et al. (2013) show that turbines of identical design installed at different sites can show different failure behaviour. Despite this evidence, in practice O&M modelling, especially in research contexts, often relies on publicly available datasets that aggregate observations across manufacturers, sites, and operational contexts, due to the limited availability of homogeneous fleet-specific data. Owing to the commercial sensitivity of reliability data, few recent large-scale datasets are publicly available, and many studies continue to rely on data collected prior to 2015, such as Carroll et al. (2016). The transfer of this aggregated failure-rate assumptions to a specific project therefore introduces epistemic uncertainty. This can lead to misaligned maintenance strategies and biased O&M cost estimates.
In addition to uncertainty in the overall frequency of failure events, substantial epistemic uncertainty exists in how failures are distributed across major wind turbine assemblies. Artigao et al. (2018) conducted a comparative analysis of 13 reliability studies and failure databases, and developed a unified turbine taxonomy to enable consistent comparison across datasets. Large discrepancies were observed in the relative contribution of individual components to total failure counts. For example, the reported share of generator-related failures varies from approximately 3 % to 23 % across the analysed studies. Similar variability is reported for other major assemblies, indicating that the component-level failure distribution is highly sensitive to dataset composition and study context. This uncertainty is particularly relevant for O&M decision-making, as different components are connected to different repair times, logistics requirements, and costs. Consequently, two systems with similar overall failure rates may exhibit substantially different OPEX and availability outcomes, depending on how failures are distributed across components.
The bathtub curve is frequently used as a conceptual model for failure-rate evolution (Kapur and Pecht, 2014), but empirical data from wind fleets do not confirm a clearly defined bathtub shape at the system level. Component-specific analyses reveal non-stationary behaviour, including elevated early-life failure frequencies and age-dependent trends, which differs substantially between subsystems (Walgern et al., 2026; Faulstich et al., 2011), as illustrated by the WinNER database (Fig. 10; Electric Power Research Institute (EPRI), 2024).
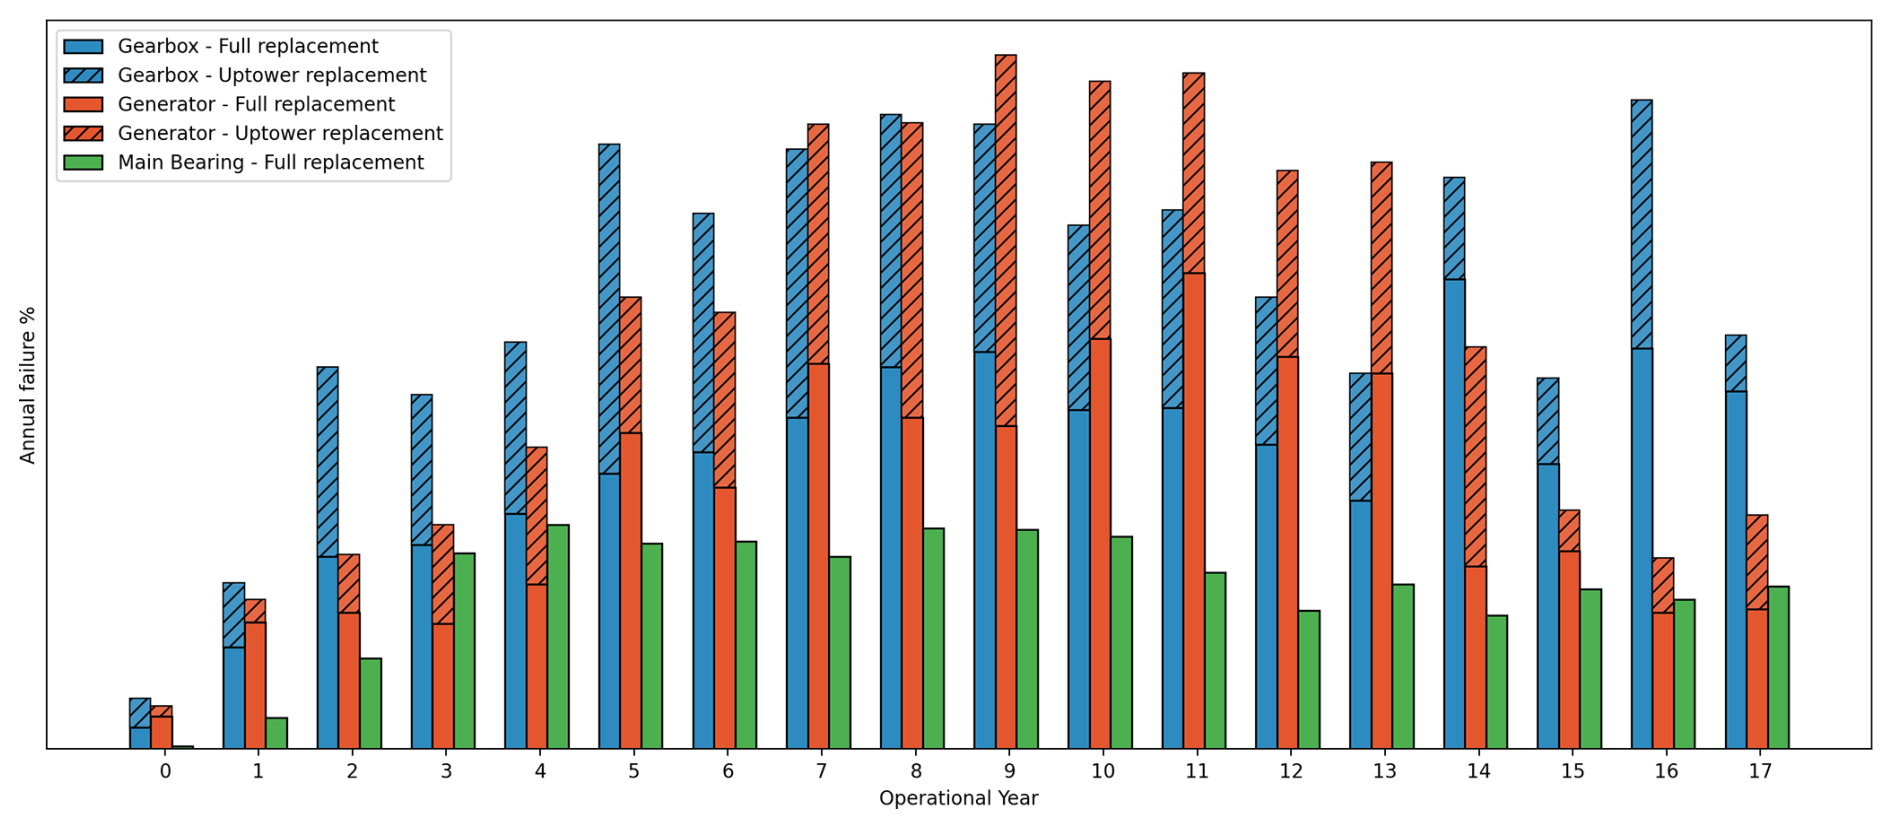
Figure 10Key component failure rates from the WinNER database (Pulikollu et al., 2023, 2024, 2021).
In O&M modelling, failure occurrence is typically represented using assumed statistical distributions, most commonly Weibull formulations, which implicitly impose assumptions on the temporal structure of failures. As shown by Scheu et al. (2017), these distributional choices can have a significant impact on model outcomes: even when average failure rates are identical, different failure-time distributions lead to substantial differences in simulated wind farm availability. This demonstrates that these models should be interpreted as simplifying representations under uncertainty rather than as empirically validated descriptions of failure mechanisms. Consequently, assumptions about the temporal distribution of failures constitute an important source of epistemic uncertainty in O&M simulations.
In addition to epistemic uncertainty, aleatory variability in failure occurrence means that otherwise identical projects may experience substantially different maintenance histories and costs, purely due to random variation. Reliability-driven O&M assessments must therefore be interpreted in probabilistic terms.
Table 8Key uncertainty dimensions in wind turbine reliability, mapped to uncertainty type, decision risk, and time aspects. A: aleatory, E: epistemic.
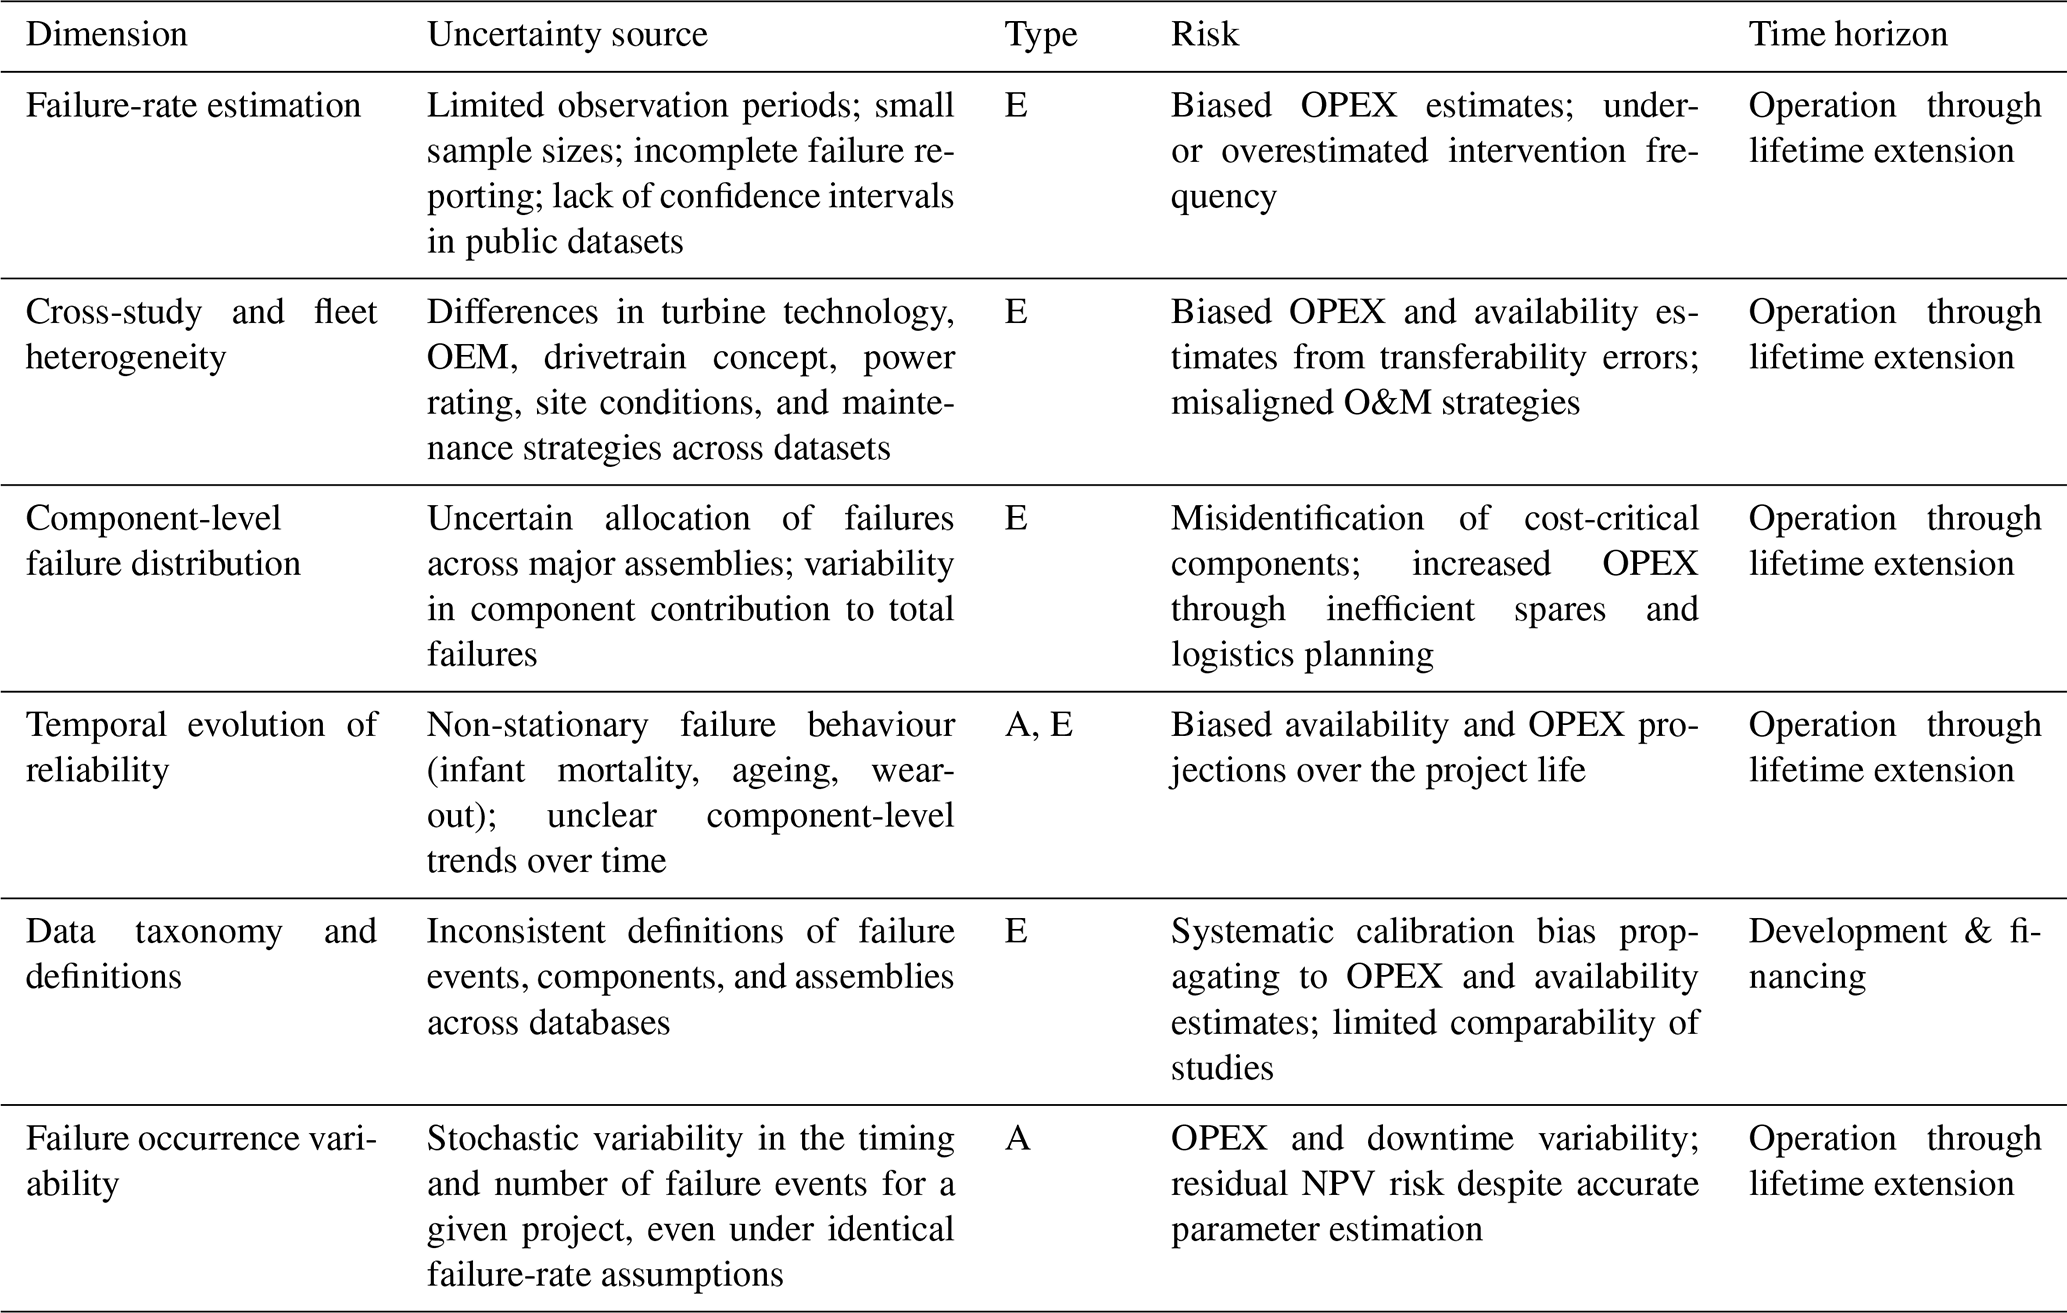
As summarized in Table 8, wind turbine reliability is affected by multiple interrelated sources of uncertainty, predominantly epistemic in nature. Uncertainty in failure rates, their allocation across components, and their temporal structure propagates directly into intervention frequency, downtime, and O&M expenditures.
4.5.2 Impact assessment
We model the impact of uncertainty around the reliability of wind turbine components using the Markov-chain-based OPEX module of WINPACT. The scope is limited to turbine-level components (drivetrain, blades, electrical systems, etc.); substructure and cable system failures are not included in the current model, which is acknowledged as a limitation. Failure occurrence is modelled using a two-level uncertainty framework that explicitly separates aleatory variability in the timing of failures from epistemic uncertainty in the underlying failure rates. Aleatory uncertainty reflects the inherently random nature of failure events given a fixed failure rate, while epistemic uncertainty captures imperfect knowledge of the true mean failure rate arising from limited observation periods, inconsistent failure definitions and reporting, and the transfer of reliability evidence across turbine generations, sites, and operational contexts. In the model, this epistemic uncertainty is represented by treating failure rates as random variables rather than fixed parameters, with uncertainty described using Gamma distributions, which provide a flexible and non-negative representation commonly used for rate parameters.
Epistemic uncertainty in failure rates is implemented through a structured decomposition of the coefficient of variation (CV) into a shared and an independent component. The shared component captures coherent effects – systematic biases in data sources, modelling assumptions, or limited transferability – through a single multiplicative factor sampled once per simulation and held constant over the lifetime. The independent component captures residual component-specific heterogeneity. A target CV is specified at the turbine level for each scenario, and the combined effect of shared and independent terms reproduces this target at system level.
The scenarios presented in Table 9 represent different levels of uncertainty about failure-rate assumptions. Scenarios represent different assumptions about epistemic uncertainty, not properties of a specific turbine or project. We define three main scenarios based on evidence from literature:
-
Scenario R1 [low variability]. Mature turbine model in a large homogeneous fleet with established O&M processes. The CV reflects within-fleet heterogeneity, informed by site-to-site differences reported by Tavner et al. (2013) for Enercon turbines across three German wind farms.
-
Scenario R2 [medium variability]. Representative of public or mixed-source reliability data, where variability arises from heterogeneous sites, contracting practices, and non-uniform failure definitions. The CV is informed by the CIRCE database (Reder et al., 2016; Table 11).
-
Scenario R3 [high variability]. Representative of new turbine models in early deployment with limited operational experience. The CV is informed by the spread observed in datasets with short observation periods (<5 years) and ratings above 1 MW (Table A1; Table 10).
Table 9Failure-rate uncertainty scenarios grounded in offshore wind reliability literature and implemented as Gamma uncertainty on λ.
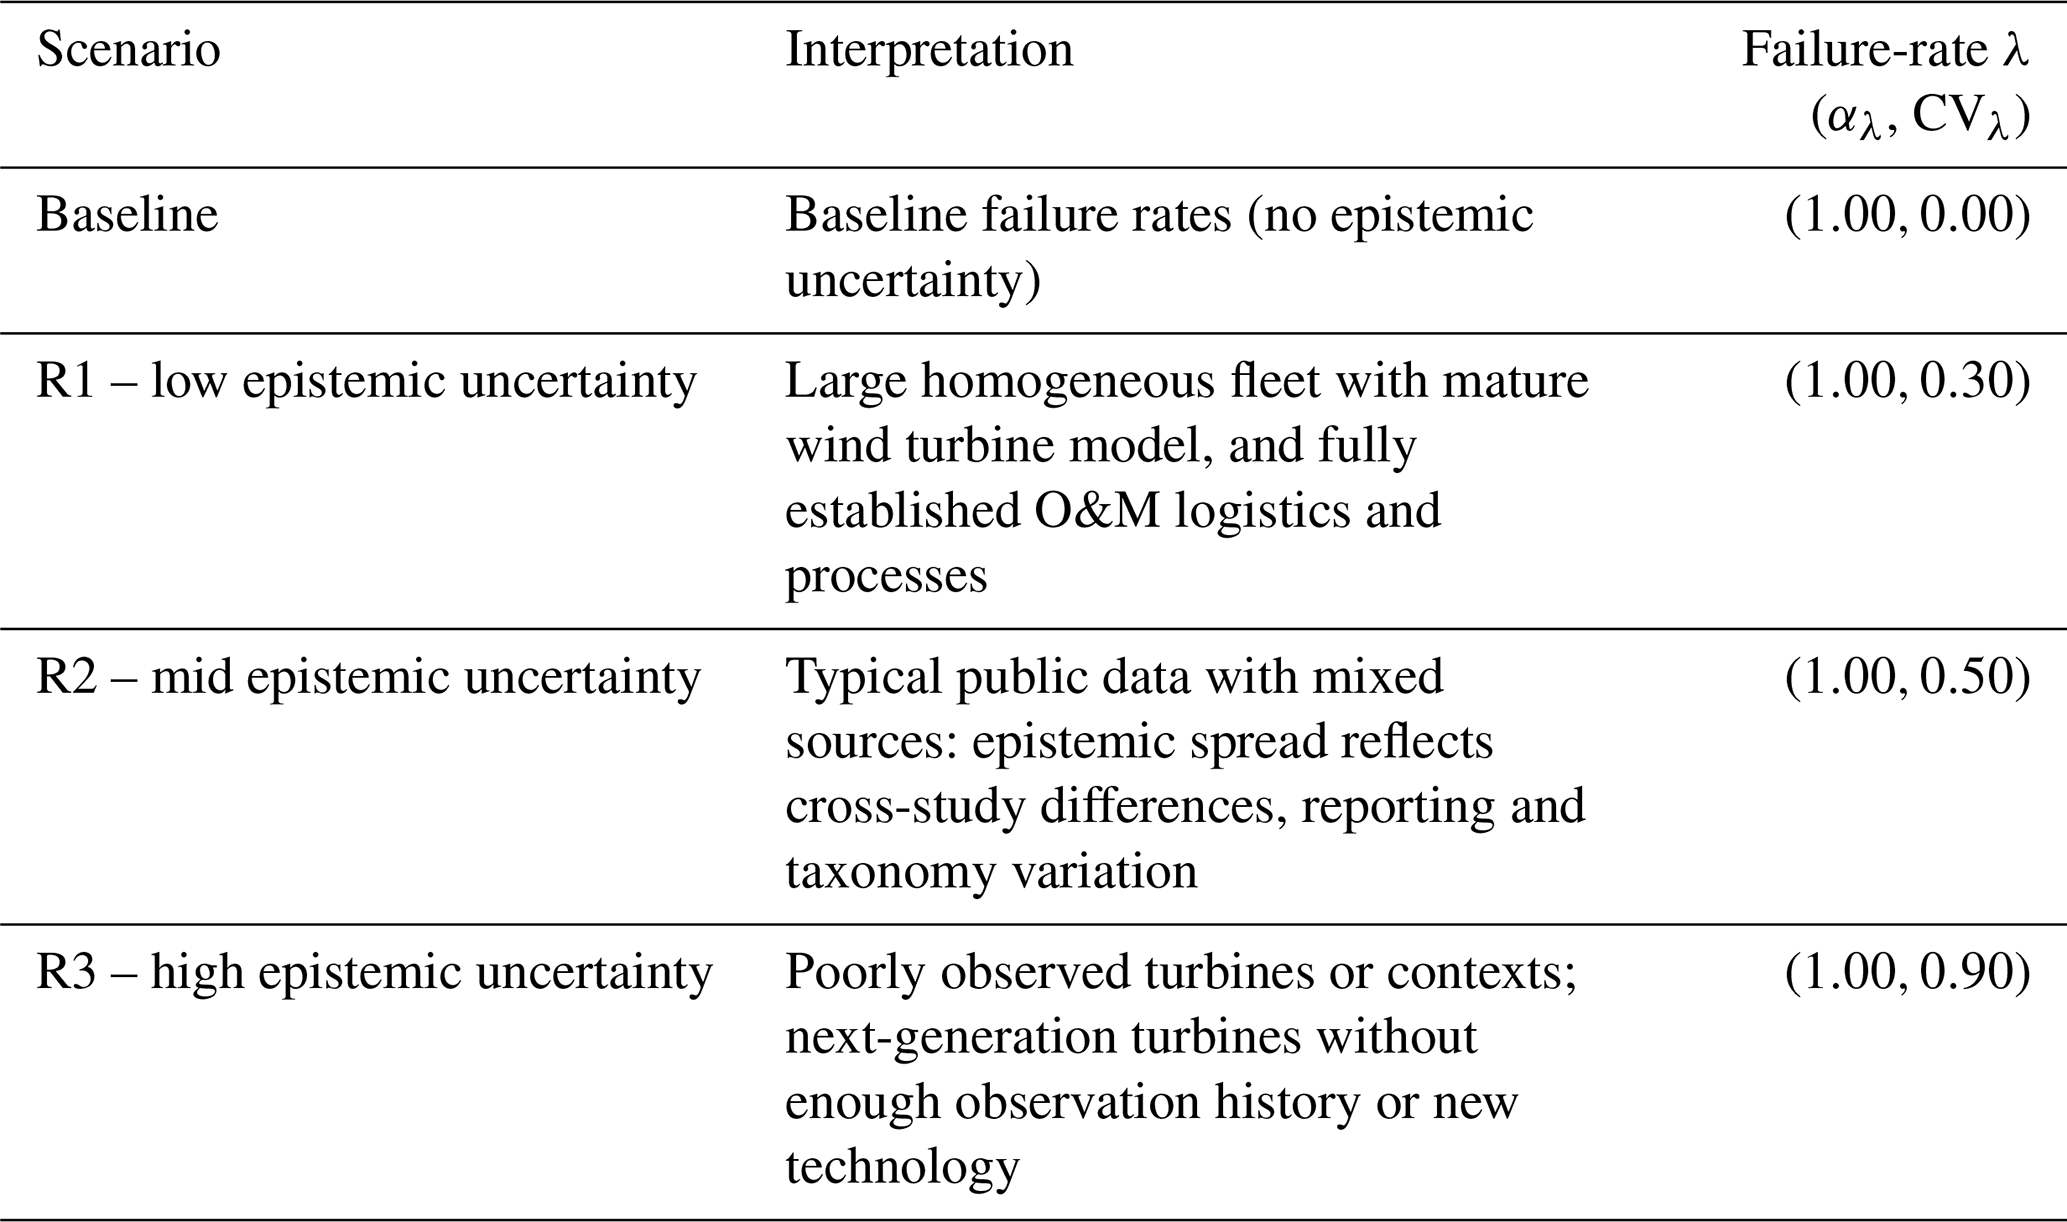
Table 10Coefficient of variation of failure rates by category.
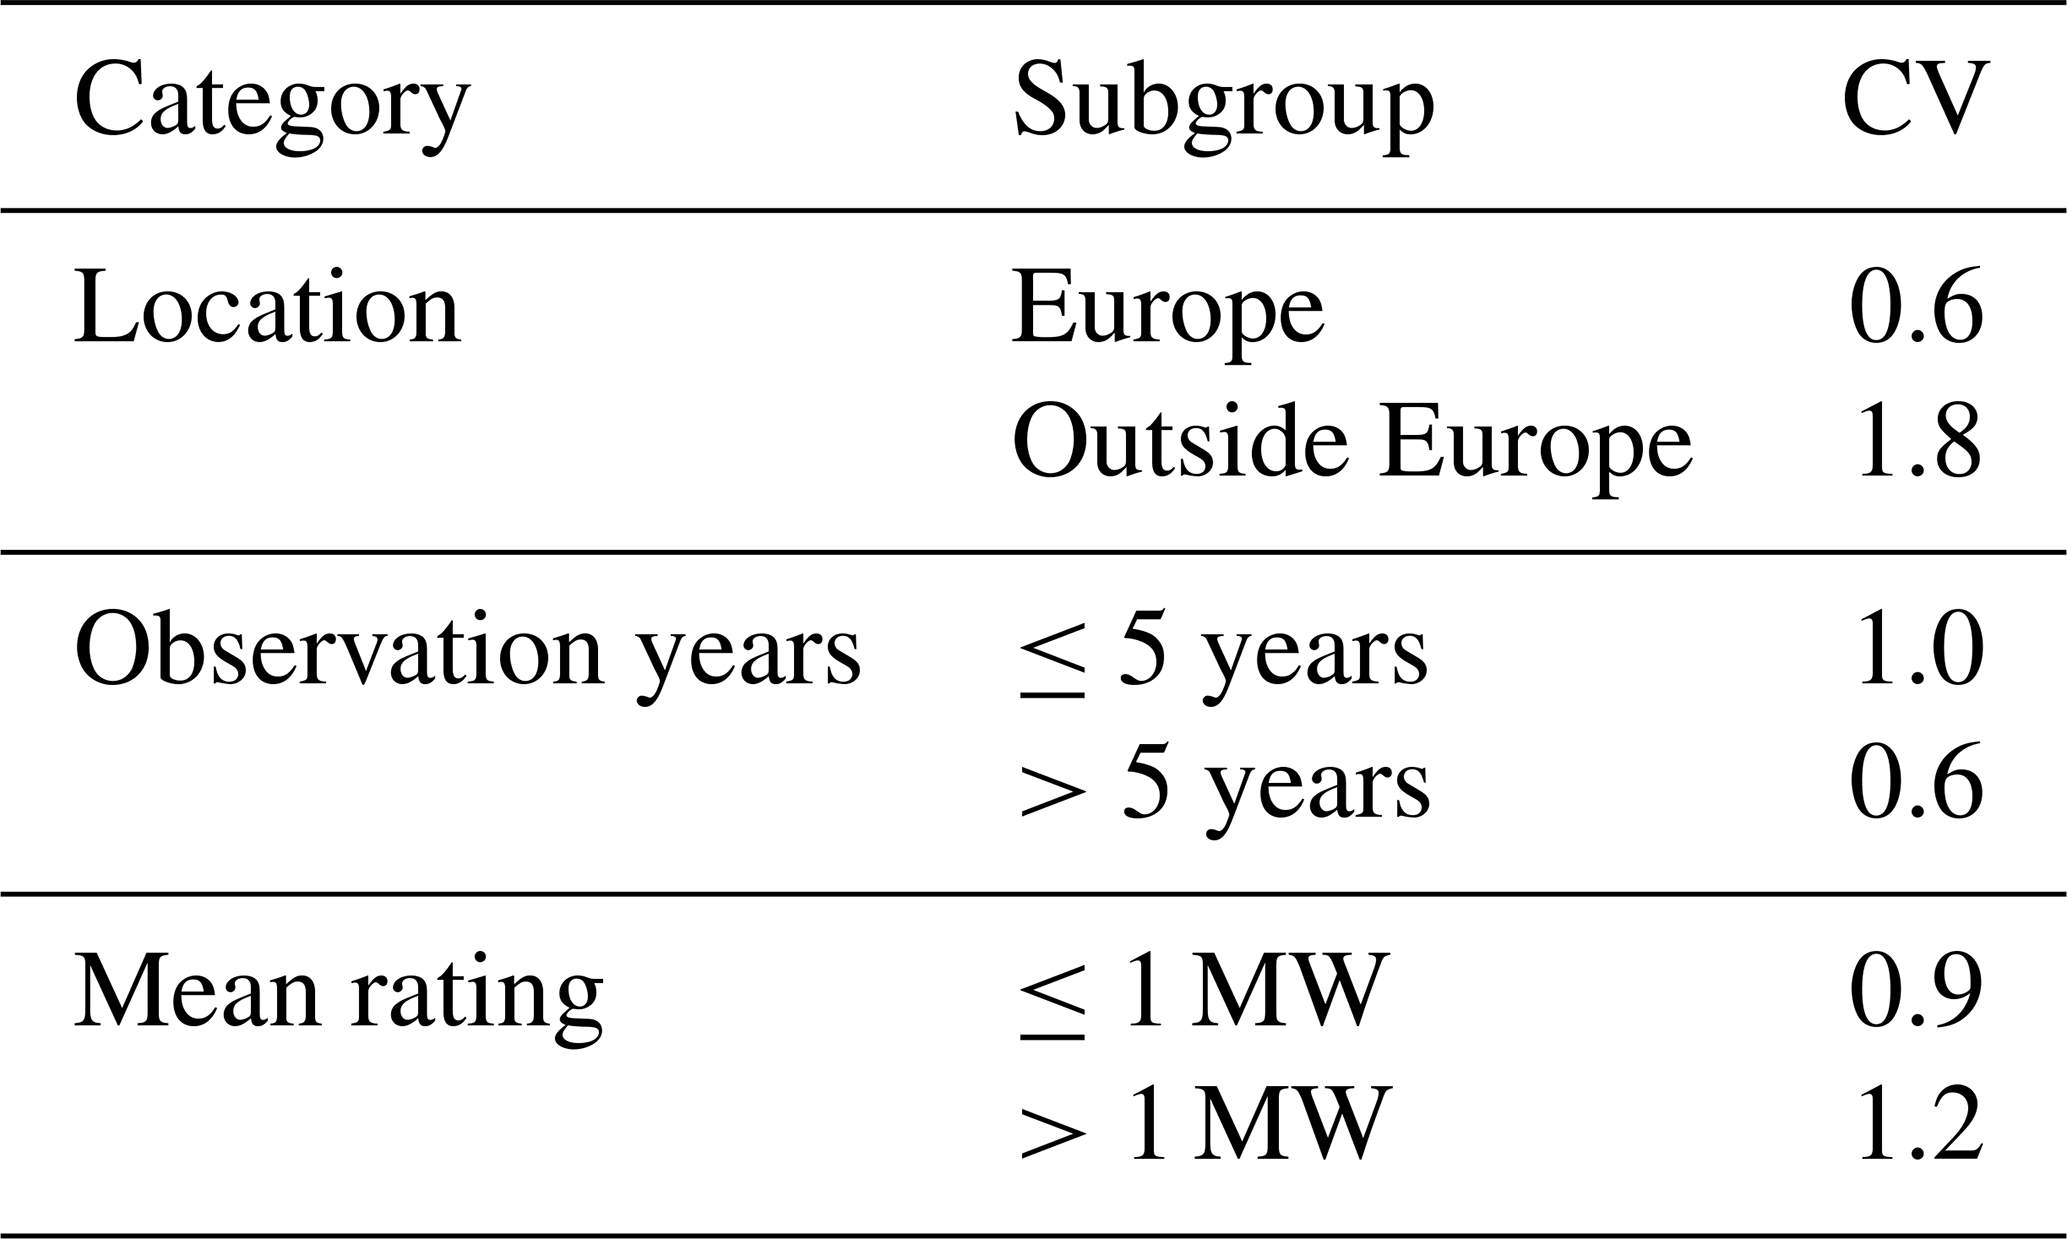
Table 11Data used for the SCADA alarms and failure analysis (Reder et al., 2016).

Figure 11 illustrates the distributions of NPV, LCOE, and operational expenditure obtained for the different failure-rate uncertainty scenarios. The results demonstrate that epistemic uncertainty in the specification of failure rates has a pronounced impact on project economics. Even under the low-uncertainty scenario (R1), the spread of economic outcomes remains substantial, with a range on the order of EUR 400 million. With increasing epistemic uncertainty, the spread of outcomes grows and the distributions exhibit pronounced long tails. Although such adverse outcomes are unlikely, they imply that unfavourable combinations of assumptions can lead to very low or even negative project values. Ignoring epistemic uncertainty would therefore lead to a systematic underestimation of downside risk in investment decision-making and an overly optimistic assessment of project robustness.
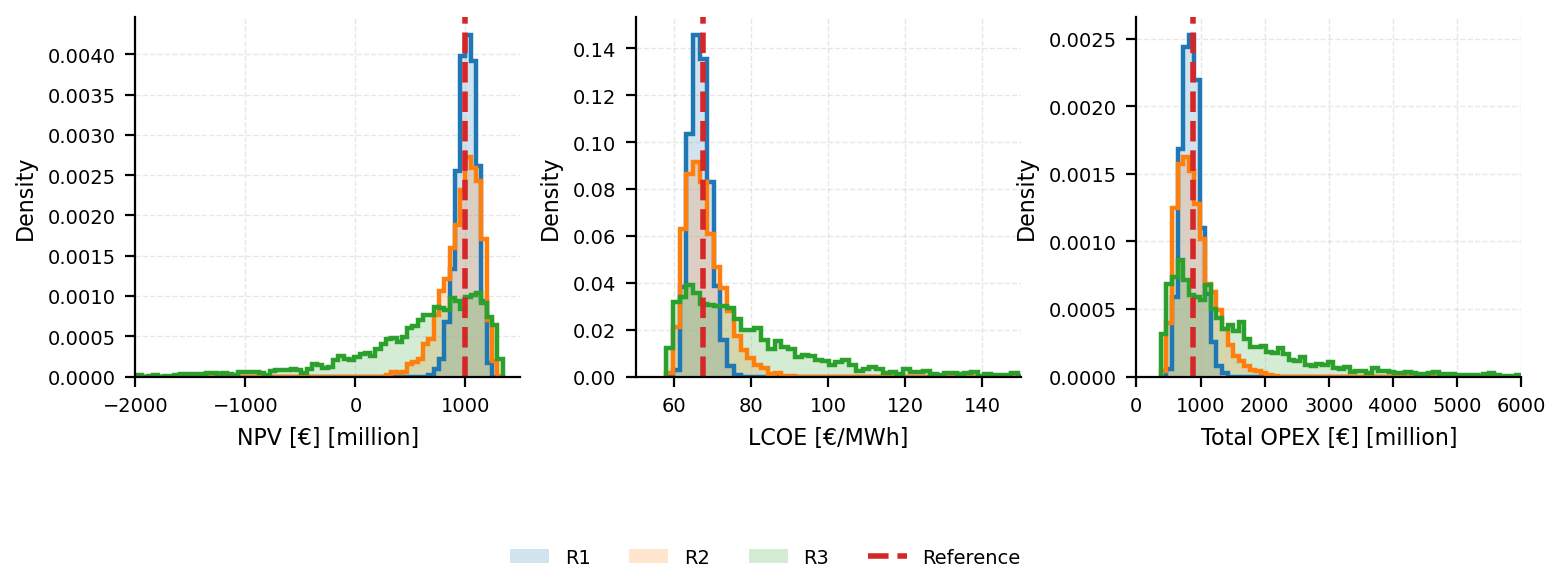
Figure 12 shows the corresponding distributions of farm availability and the number of corrective maintenance activities. These results indicate that uncertainty in reliability assumptions propagates beyond economic metrics to technical performance indicators. In higher-uncertainty scenarios, availability may decrease substantially, while the number of corrective maintenance actions can increase sharply in extreme cases. This reflects a system-level impact, combining lost energy production with potential stress on maintenance resources and supporting infrastructure.
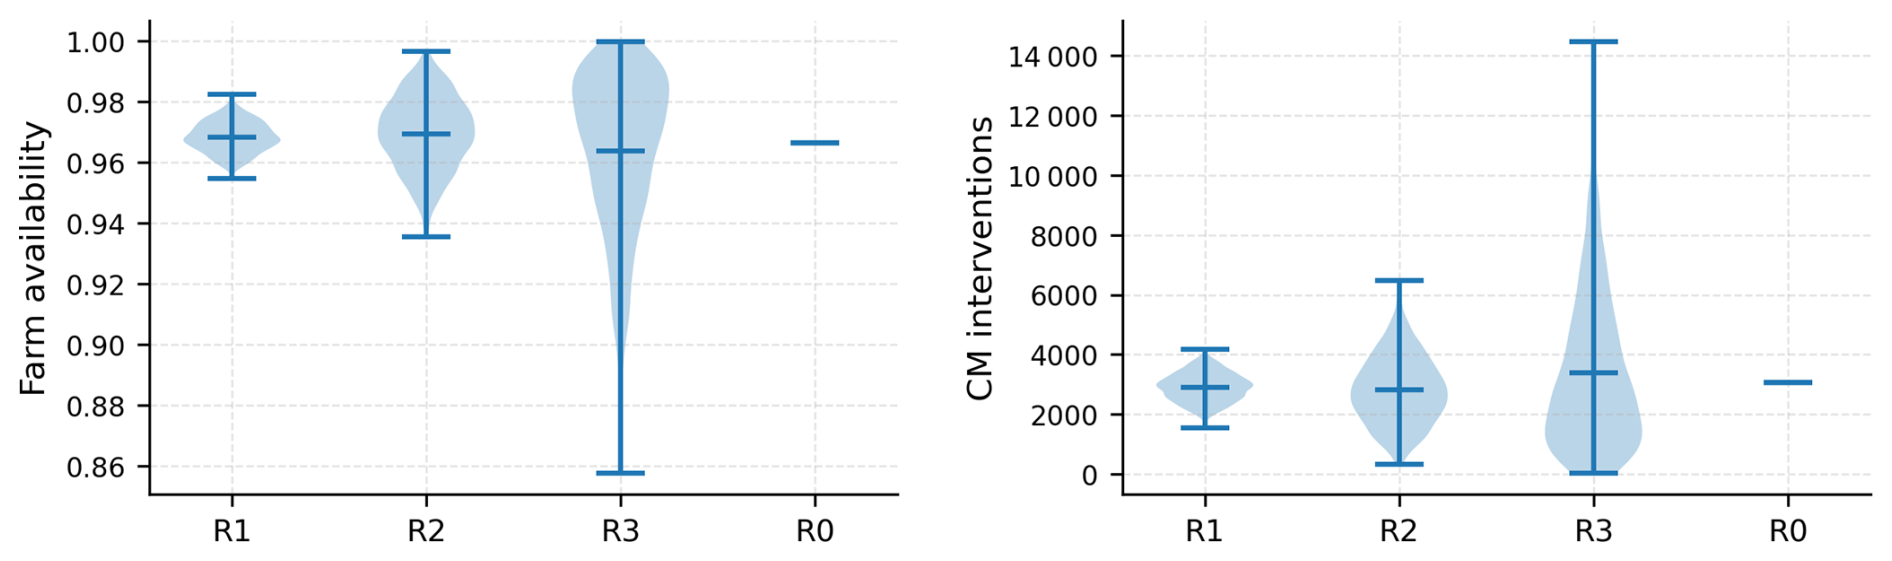
Figure 12Availability (left) and absolute number of corrective maintenance interventions (right) across scenarios. Shaded areas represent kernel density estimates of the simulated distributions; wider regions indicate higher probability density.
The presence of uncertainty-driven long-tail risks is particularly relevant for financing, insurance, and contractual risk allocation, for example, in the context of O&M guarantees or availability-based contracts.
4.6 Inefficiencies in operations and maintenance
4.6.1 Review
O&M costs and downtime are fundamentally driven by two coupled factors: the reliability and maintenance requirements of the physical asset and the effectiveness of the organizational processes responsible for detecting failures, planning interventions, and restoring operation. The reliability characteristics of wind turbine components and their associated uncertainties were introduced in the previous section. In the following, we focus on inefficiencies in the O&M process itself and the uncertainties that arise from them.
For offshore wind turbines, a generic corrective maintenance process can be described as a sequence of partly overlapping steps. Following the occurrence of a failure, the turbine transitions from normal operation to a down state. This event initiates a chain of activities including fault detection and diagnosis (performed remotely or manually), the identification and procurement of spare parts and specialized equipment, waiting for suitable weather windows, the mobilization of crews and logistics, transport to site, the execution of the repair, and finally the return of the turbine to normal operation. Each step introduces delays and uncertainty, and the overall downtime is typically dominated by access, logistics, and organizational constraints rather than by the repair action itself.
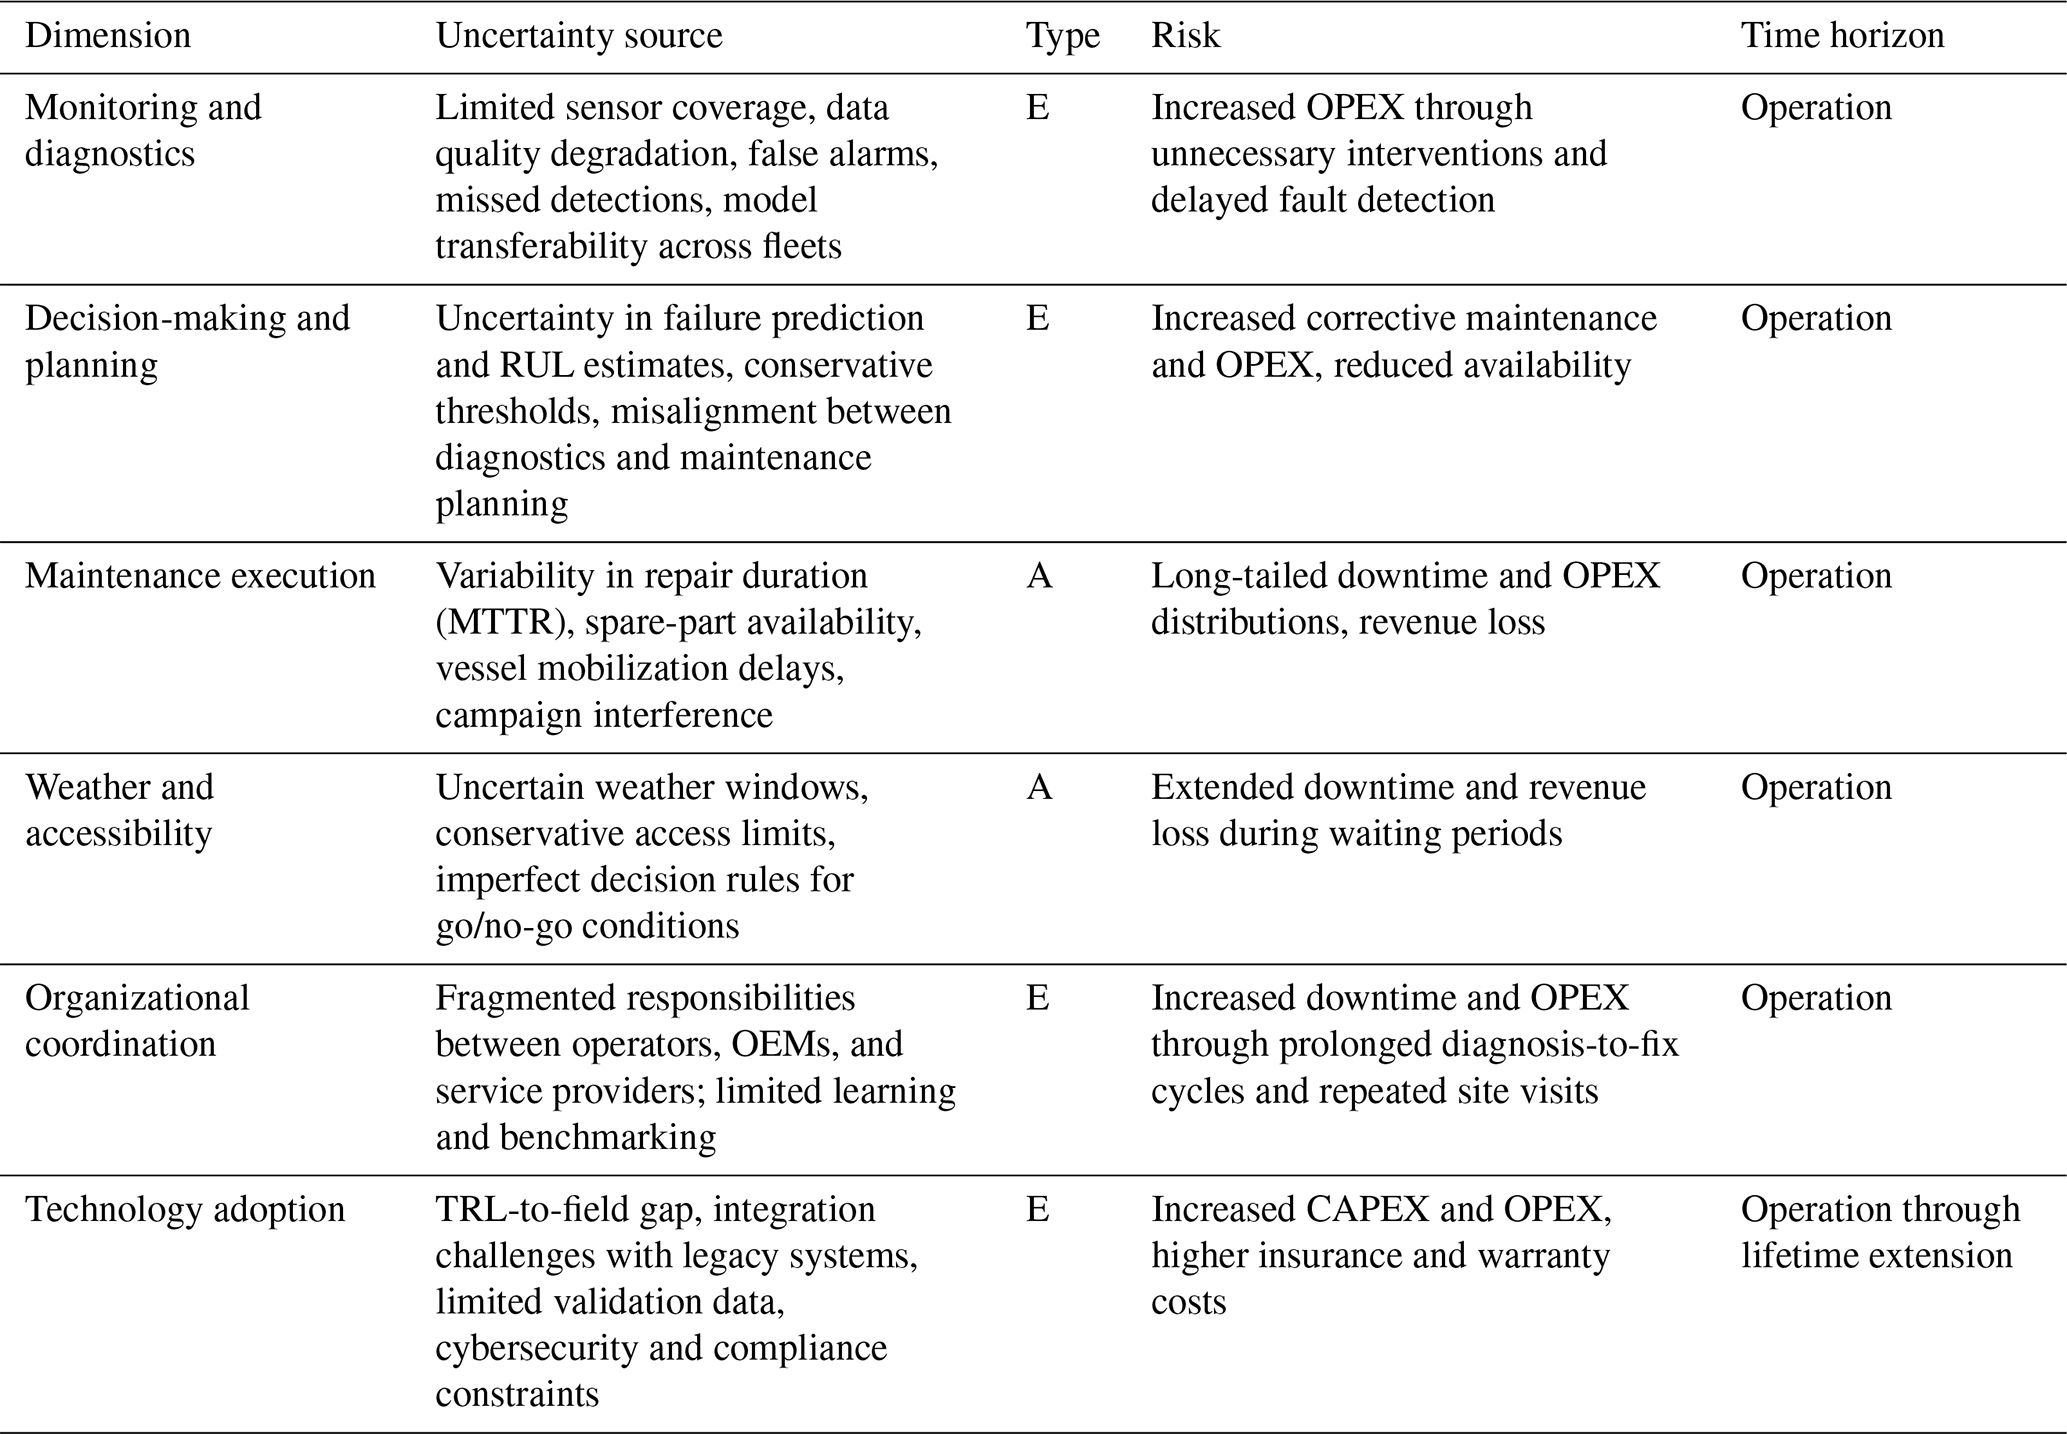
Technological and process-oriented advances have been developed to reduce the time between failure and return to operation. These include advanced monitoring, diagnostics, prognostics, and, more recently, preventive and prescriptive maintenance concepts. While such approaches have the potential to improve O&M performance (Jardine et al., 2006), their impact is not uniform across the maintenance process. We therefore review the uncertainties and risks associated with these approaches from a system-level O&M perspective. Table 12 provides an overview of these risks.
Table 12Sources of inefficiency in wind farm O&M processes, mapped to dominant uncertainty types and economic impacts. A: aleatory, E: epistemic.
Multiple monitoring and diagnostic systems, including SCADA-based condition inference (Tautz-Weinert and Watson, 2017; Wang et al., 2026; Chesterman et al., 2023), dedicated vibration and oil-condition CMS (Kestel et al., 2026), and structural health monitoring (Haseeb and Krawczuk, 2025), aim to represent the true health state of turbine components. Their practical value depends not only on diagnostic accuracy but also on how uncertainty propagates from data collection to decision-making and operational actions.
Uncertainty arises at sensing, modelling, and integration levels: sensor noise, limited coverage, and partial observability (Haseeb and Krawczuk, 2025); data gaps and reliance on aggregated 10 min SCADA statistics that may miss transient faults (Wang et al., 2026; Kestel et al., 2026); and sensor degradation over time, which erodes diagnostic accuracy unless the condition-monitoring and diagnostic models are actively recalibrated.
Model-based and data-driven approaches introduce additional uncertainty through modelling simplifications, limited fidelity, and poor transferability across turbines, sites, and control configurations (Gräfe et al., 2024). At the operational level, algorithmic detection latency compounds with system-level latency from weather, vessel, and contractual delays, so that faster diagnostics do not translate linearly into reduced downtime.
Failure detection uncertainty affects process performance in two ways: false positives trigger unnecessary interventions and availability losses, whereas false negatives enable secondary damage or catastrophic failures. Because logistics and access constraints continue to dominate total downtime, diagnostics constitute a necessary but not sufficient condition for reducing O&M risk.
Diagnostic outputs are typically provided as alarms, health indices, or remaining useful life (RUL) estimates rather than as decision-relevant risk metrics linking fault probabilities to consequence severity. Confidence bounds are rarely propagated into the decision layer, so maintenance planning continues to rely on static thresholds and heuristic rules (Borsotti et al., 2026). Decision-theoretic frameworks, notably Bayesian pre-posterior models (Nielsen and Sørensen, 2011), address this gap in principle but have been demonstrated only for idealized single-component cases; their extension to full wind farms with realistic logistics and organizational boundaries remains an open challenge.
Maintenance execution and weather-dependent accessibility introduce aleatory uncertainty. Empirical studies show strongly right-skewed repair-duration distributions (Dao et al., 2019), where rare events (weather lock-in, vessel unavailability, campaign interference) dominate cumulative downtime (Faulstich et al., 2011). Vessel mobilization ranges from days to months, and waiting for access frequently exceeds actual repair time (Kolios et al., 2023). These interactions produce heavy-tailed downtime distributions that cannot be captured by mean process parameters. Process maturity and advanced access concepts can compress but not eliminate these tails, implying that modelling approaches must explicitly represent this stochasticity.
Organizational coordination is a significant source of epistemic uncertainty. Fragmented responsibilities among owners, OEMs, and service providers lead to coordination delays, repeated site visits, and prolonged diagnosis-to-fix cycles (Borsotti et al., 2026; Hadjoudj and Pandit, 2023). The contractual misalignment of incentives and separate management of turbines, balance of plant, and marine operations further increase system-level downtime (Hawker and McMillan, 2015).
The absence of widely adopted failure taxonomies and maintenance standards, a limitation already noted for reliability data in Appendix A, restricts cross-farm learning and benchmarking (Hahn et al., 2017). Information asymmetries between OEMs, owners, and service providers further limit the availability of integrated failure, operational, and cost datasets (Paquette et al., 2024; Shafiee and Sørensen, 2019), so that epistemic process uncertainty persists across projects.
Finally, the adoption of advanced O&M technologies itself introduces uncertainty. Despite promising results in research settings, many condition monitoring, predictive maintenance, and digital twin concepts face a persistent gap between demonstrated technology readiness and operational deployment (Paquette et al., 2024). Integration with legacy SCADA and control infrastructure, limited field validation data, and emerging cybersecurity risks from increased connectivity represent additional barriers that can delay or diminish the expected benefits of digitalization in O&M practice.
4.6.2 Impact assessment
To evaluate the uncertainty arising from inefficiencies in O&M processes, we use the OPEX module of WINPACT.
This experiment isolates inefficiencies in wind farm O&M execution while holding component reliability constant. The aim is to quantify the influence of operational processes on availability and OPEX, and thus on economic project performance, independently of component failure behaviour. The scenarios represent (i) variability in mean time to repair (MTTR), (ii) mean time to wait for logistics and spare parts (MTTW), and (iii) access limitations driven by sea state operability and weather-window decision-making. Failure rates are fixed at baseline values across all scenarios. In the model, these parameters determine the transition rates between the states of the underlying Markov model.
Baseline process parameters are read from the O&M input data and modified per scenario using a multiplicative mean-shift factor α and a lognormal uncertainty term with standard deviation σ:
where . Accessibility is represented by an hourly access probability paccess and modified via a scenario factor αp:
Table 13Process-focused O&M inefficiency scenarios. Failure rates are fixed at baseline values.
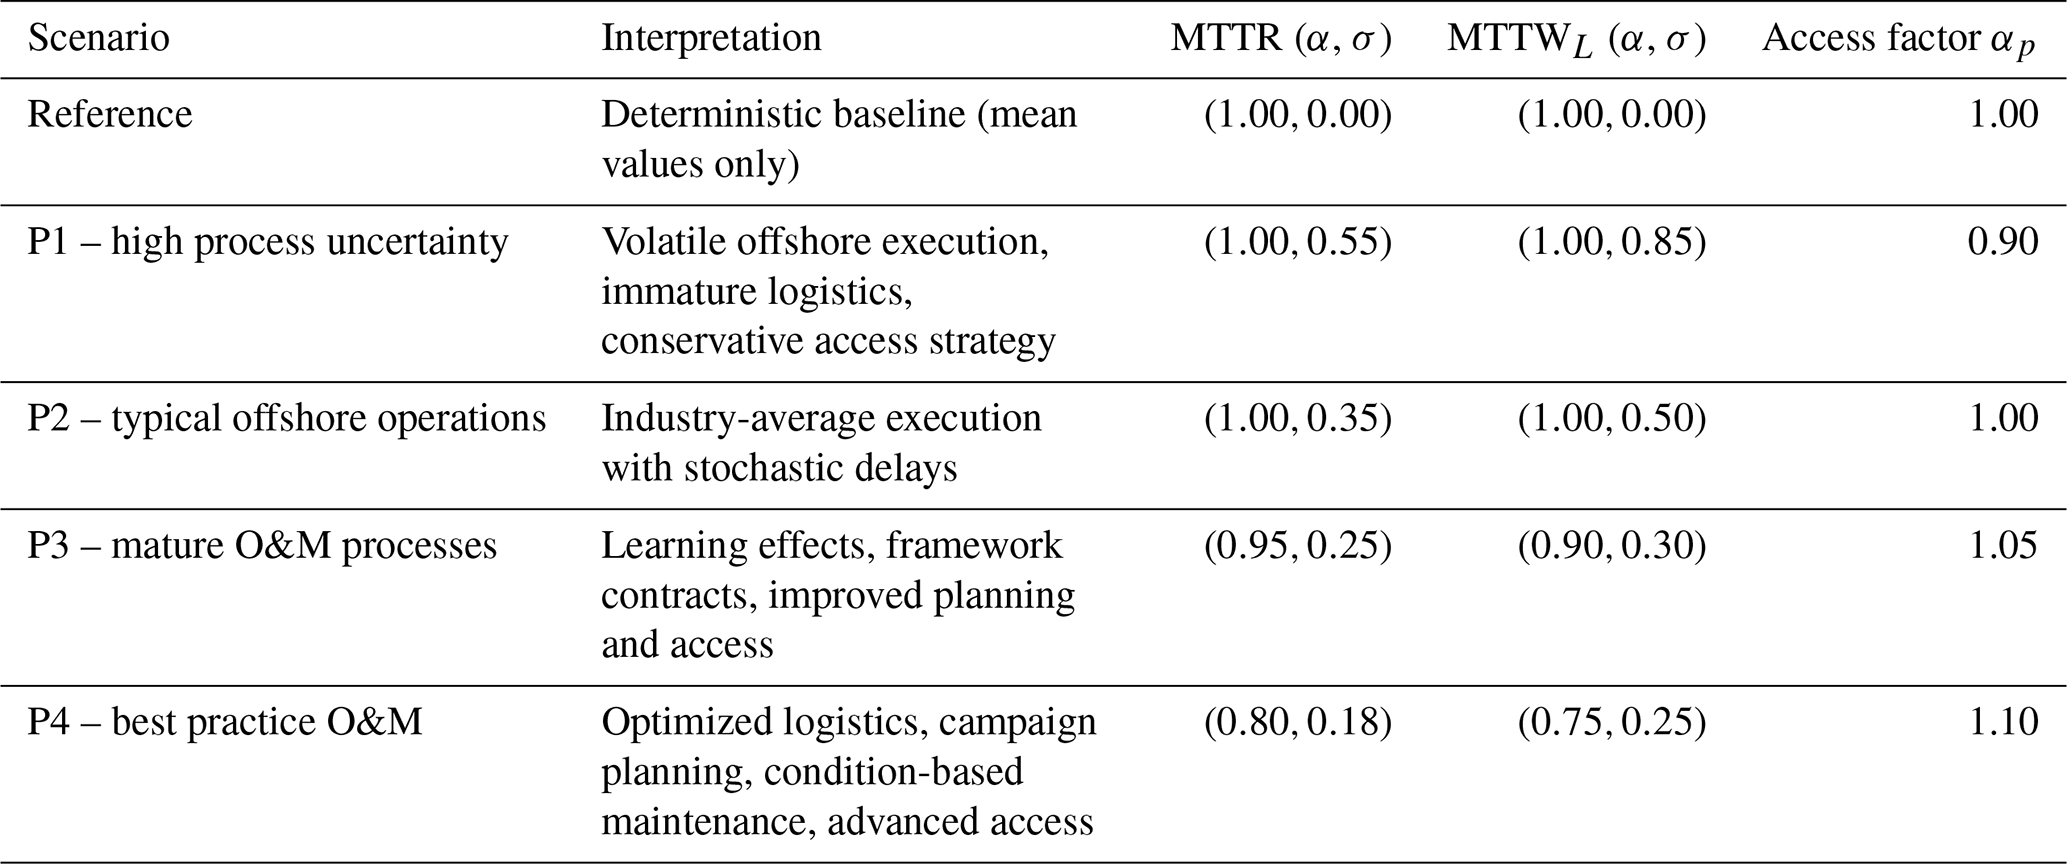
Scenario assumptions are summarized in Table 13. The reference scenario represents the baseline without variation of O&M process parameters.
The P1 (high process uncertainty) scenario reflects immature or highly volatile offshore operations where repair execution and logistics are strongly weather- and market-driven. Empirical downtime data show highly right-skewed distributions with many short repairs but a small number of very long events that dominate average downtime (Faulstich et al., 2011), while vessel mobilization times of 30–60 d for offshore support and jack-up vessels indicate that logistics waiting can be extremely variable (Donnelly et al., 2024). The reduced access factor in P1 represents conservative access strategies dominated by crew transfer vessel (CTV) limits (1.5 m significant wave height), which constrain operability to these conditions.
The P2 (typical offshore operations) scenario reflects industry-average practice in which mean repair and logistics times remain unchanged, but stochastic variability persists due to weather, coordination delays, and campaign interference.
The P3 (mature O&M processes) scenario represents learning effects, standardization, and contractual maturity, leading to modest reductions in mean repair and logistics delays, and lower variability. These improvements are consistent with the gap identified by Carroll et al. (2016) between conservative expert-assumed repair times and more efficient data-informed practices, and with reduced exposure to high mobilization delays.
Finally, the P4 (best practice O&M) scenario reflects optimized logistics, campaign planning, condition-based maintenance, and advanced access concepts. Literature shows that moving from CTV-based access to strategies supported by a field service vessel (FSV) or jack-up expands the operability envelope through higher allowable wave heights (3–4 m versus 1.5 m), justifying a moderate increase in access probability (Donnelly et al., 2024).
Figure 13 shows the NPV distributions for the different O&M efficiency scenarios and demonstrates that economic risk is driven not only by mean O&M performance but also, to a large extent, by variability in operational execution. Projects with similar expected repair and waiting times can exhibit markedly different risk profiles when downtime distributions differ in shape. In particular, heavier-tailed distributions lead to substantially higher downside risk, even if mean performance is comparable. Variance reduction in O&M processes is therefore at least as important as reducing mean repair or logistics times.
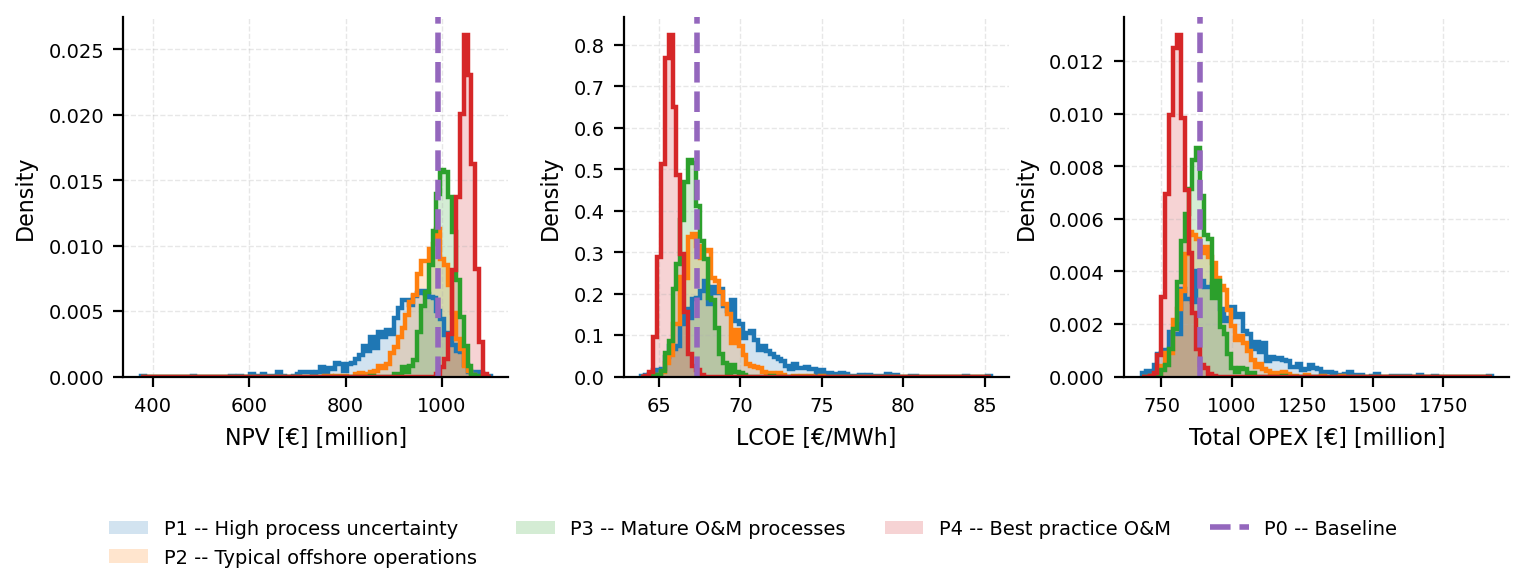
Scenarios characterized by high process uncertainty display pronounced right-skewed NPV distributions with long downside tails. These tails arise from rare but severe events such as extended logistics delays, prolonged weather inaccessibility, or coordination failures, which dominate cumulative downtime and revenue loss. While such events are infrequent, their economic impact is large and not symmetrically compensated by shorter-than-average interventions. As a result, downside deviations are not offset by upside outcomes to the same degree, leading to an asymmetry in economic risk.
Even with identical component failure rates across scenarios, differences in O&M process uncertainty result in substantial differences in NPV. Improving component reliability alone is therefore insufficient in stabilizing project economics unless accompanied by parallel improvements in organizational coordination, logistics planning, and access strategies.
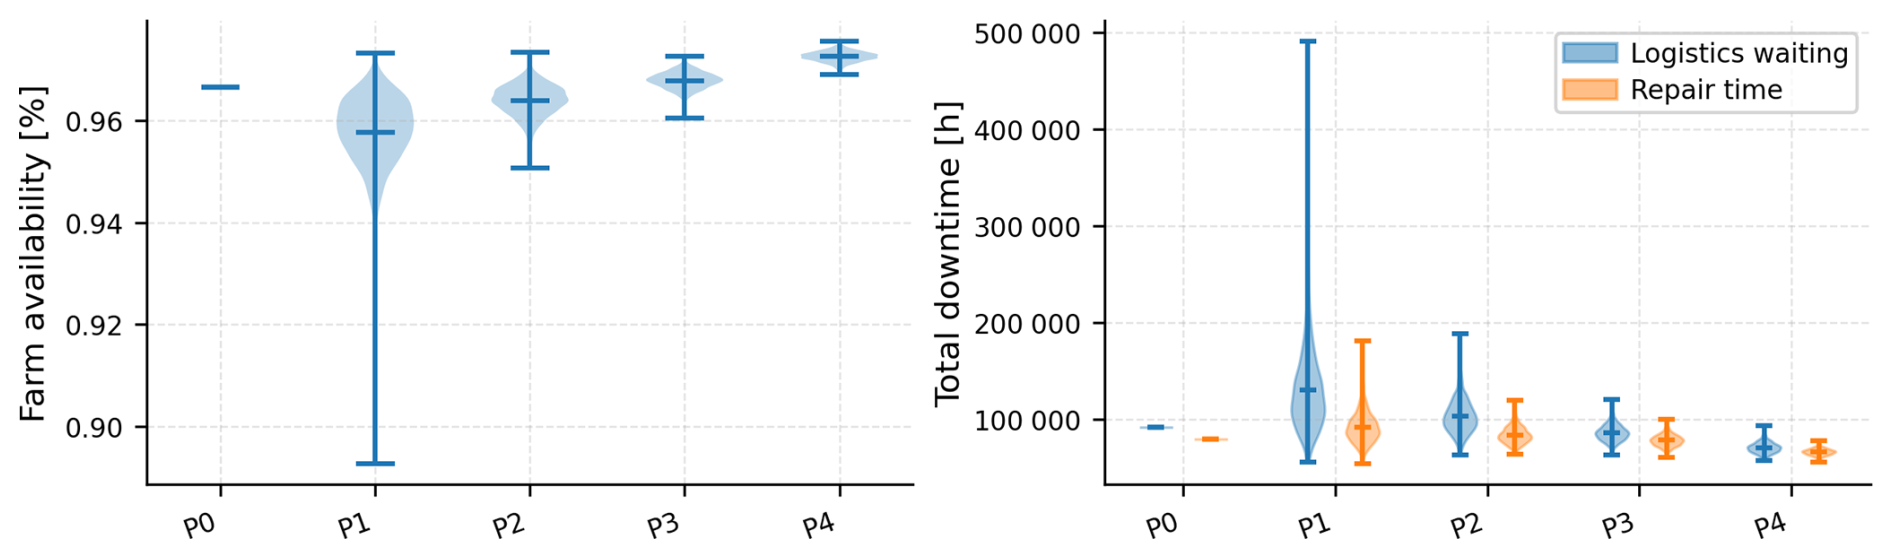
Figure 14Availability (left) and downtime (right) distributions across O&M scenarios. Shaded areas represent density estimates; wider regions indicate higher probability density.
Figure 14 illustrates the corresponding technical effects: increased process uncertainty directly reduces farm availability and increases downtime hours, translating into economic risk through lost production and increased OPEX.
4.7 Operational risk from rapid technology upscaling
4.7.1 Review
The wind energy sector is undergoing a period of rapid technology upscaling, characterized by unprecedented increases in turbine rated power, rotor diameter, hub height, and system complexity. Offshore wind has been at the forefront of this trend, with commercial turbines exceeding 15 MW, and rotor diameters approaching or surpassing 230 m, while onshore turbines have also seen steady increases in size and complexity. Upscaling is primarily driven by the objective of reducing LCOE, as larger turbines increase energy capture per unit and reduce the number of turbines required for a given plant capacity, lowering balance-of-system costs such as substructures/foundations and electrical infrastructure (Shields et al., 2021). However, the acceleration of turbine scaling has introduced a distinct class of operational risk rooted in technology novelty and limited empirical operating experience (Moverley Smith et al., 2022).
Rapid upscaling differs from incremental technological evolution in that multiple design parameters are pushed simultaneously beyond previously validated ranges. These include structural dimensions, drivetrain torque levels, blade flexibility, power electronic ratings, and control-system complexity. New materials (e.g. high-modulus composites), drivetrain concepts (e.g. direct-drive or hybrid medium-speed systems), and advanced grid-support functionalities are often introduced concurrently. As a result, new turbine platforms enter service with limited field data, compressed prototype testing cycles, and restricted opportunities for iterative design refinement (Siddiqui et al., 2023). This creates a dominance of epistemic uncertainty, as the true long-term behaviour of critical components and systems is not yet well understood.
Operational risk from rapid upscaling propagates through several interconnected pathways. A primary concern is reliability: newer turbine generations exhibit elevated early-life failure rates in blades, main bearings, power electronics, and cable systems (Mishnaevsky, 2022; Pelka and Fischer, 2023; Strang-Moran, 2020). Critically, these failures tend to be systemic: design or manufacturing deficiencies may affect entire fleets, triggering serial failures and large-scale retrofit campaigns (Veers et al., 2023). This challenges the stationarity and independence assumptions underlying conventional reliability models discussed above.
Upscaling also amplifies the O&M logistics uncertainties discussed in the preceding section. Larger turbines require heavier lifting equipment and specialized vessels with limited availability, prolonging corrective maintenance waiting times (Stålhane et al., 2019). Because fewer turbines represent a larger fraction of farm capacity, single-turbine outages have a disproportionate impact on revenue (Mehta et al., 2024).
Supply chain risks, discussed in the context of commodity and financing uncertainty above, are further compounded by upscaling (Carrara et al., 2023). Manufacturing concentration among few suppliers (Shields et al., 2023), non-linear quality-control challenges at extreme component scales (Kong et al., 2023), and long lead times for bespoke replacement parts amplify both delivery risk and operational downtime.
Financial and insurance dimensions reflect the systemic nature of upscaling risk. Higher repair costs per event (Mikindani et al., 2025) and increased single-loss exposure lead insurers to raise premiums and tighten coverage for first-of-a-kind platforms (Ioannou et al., 2019). OEM warranty provisions have risen to 5 %–6 % of revenues (Vestas Wind Systems A/S, 2024), and technology novelty affects bankability and financing terms during due diligence (Guillet, 2022).
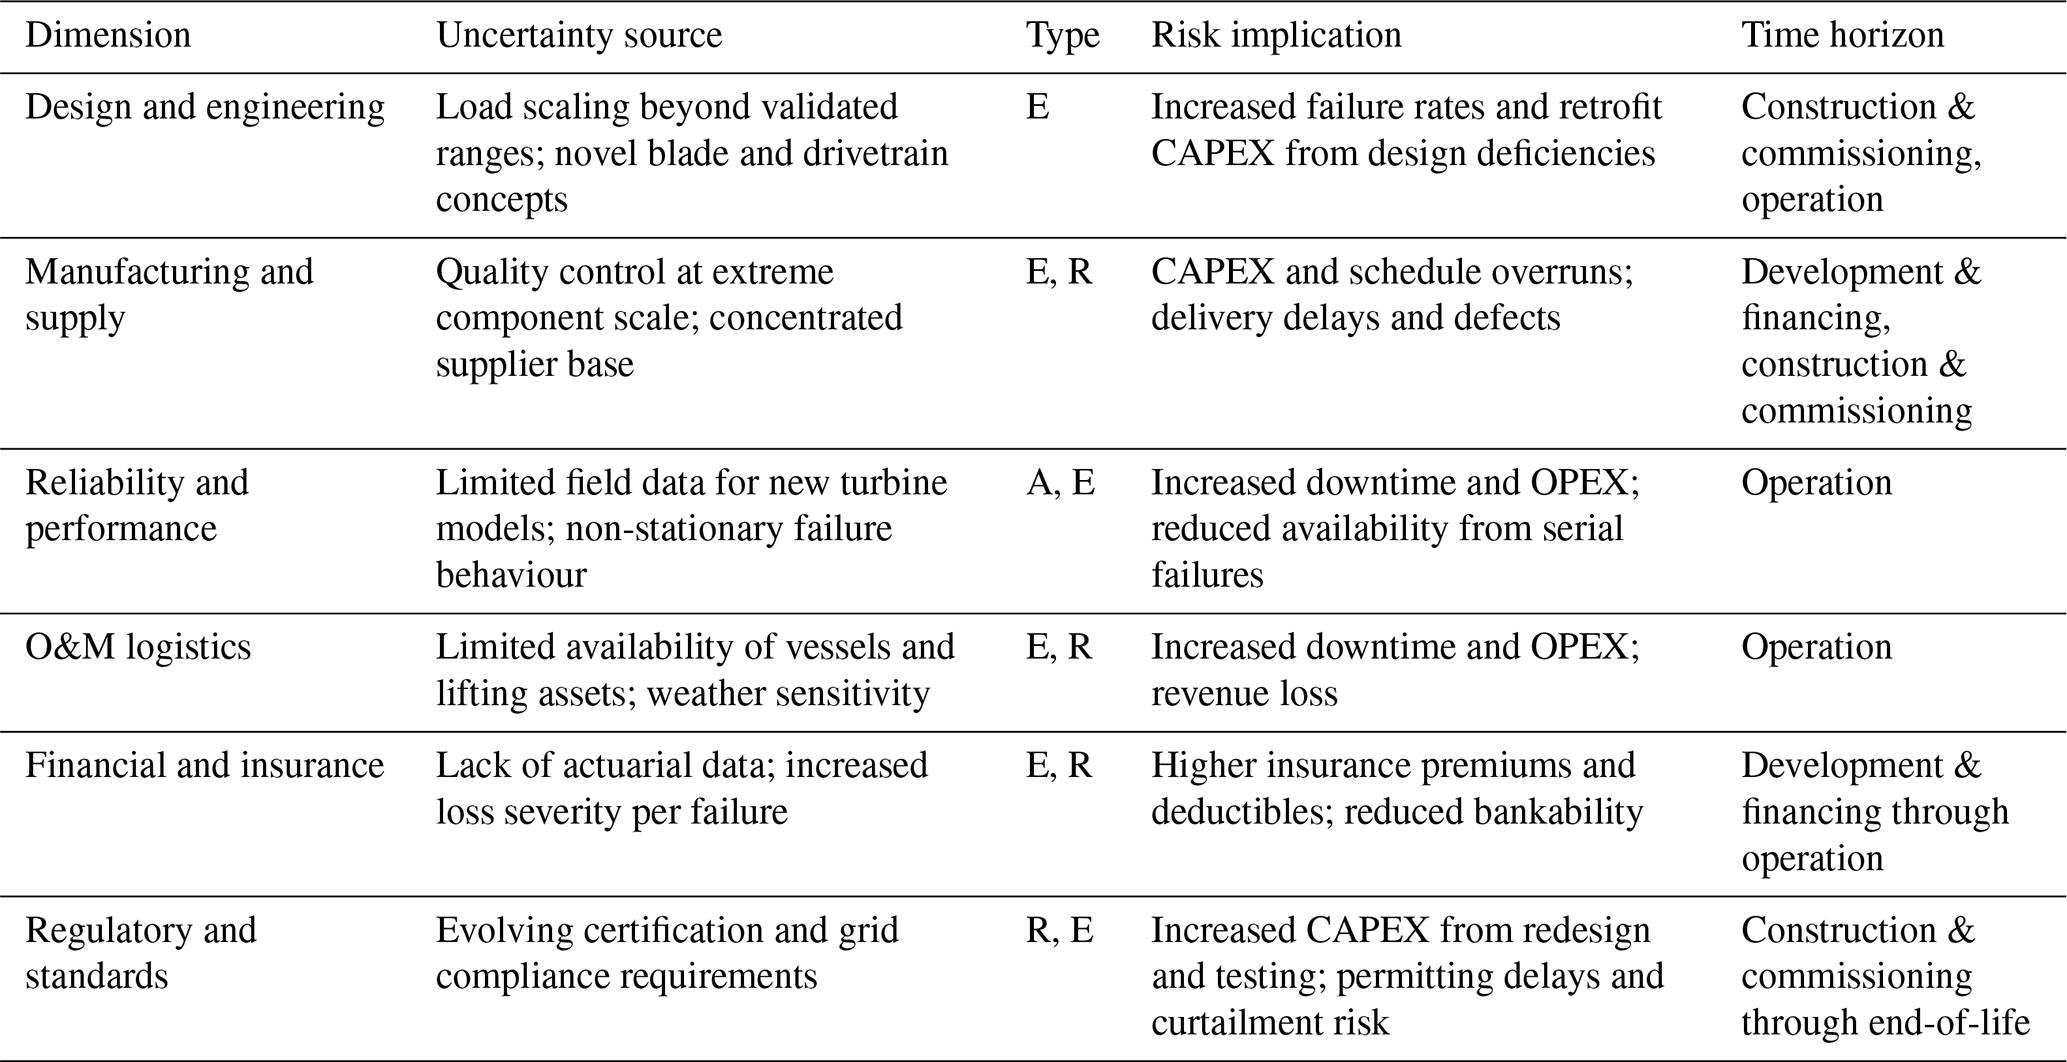
Table 14 summarizes the key uncertainty dimensions associated with rapid technology upscaling, their dominant uncertainty types, principal operational risk implications, and relevant time horizons.
Table 14Key uncertainty domains introduced by rapid turbine upscaling, mapped to uncertainty type (A: aleatory, E: epistemic, R: regulatory/external).
4.7.2 Impact assessment
Traditional quantitative risk models rely on historical failure statistics from mature fleets and are not readily transferable to novel turbine designs operating outside established envelopes (Dao et al., 2019). Because upscaling-related risks are epistemic, path dependent, and coupled across the domains discussed above (Dao et al., 2020), a fully quantitative impact assessment is currently not feasible without speculative assumptions. This risk category is therefore best addressed through structured qualitative analysis and scenario-based reasoning (Scheu et al., 2019; Lopez and Kolios, 2022). Closing the gap between technology upscaling and its propagation to economic risk is identified as a research priority.
5.1 Combined-risk experiment
The impact assessments in Sect. 4.2–4.6 each activate one risk category while holding all others at baseline values. To test whether individually moderate risks compound into jointly severe outcomes, we simultaneously activate moderate-level scenarios from four categories: supply chain uncertainty (SC2), transmission-constraint curtailment (C2), epistemic reliability uncertainty (R2), and O&M process uncertainty (P2). The scenario parameters are identical to those used in the isolated assessments. Critically, in the isolated experiments, reliability (R2) and O&M process (P2) uncertainties were activated with mutually exclusive flags on the same OPEX module. In the combined scenario, both are simultaneously active, so that epistemic failure-rate uncertainty compounds with stochastic repair and waiting times.
Figure 15 shows the results of the combined experiment. At the level of expected values, losses are roughly additive: the combined mean NPV loss (Δ= EUR −381 M) is close to the sum of individual deltas (EUR −356 M), with an interaction term of only EUR −25 M (∼7 %). However, tail risk is super-additive, i.e. the combined spread exceeds the sum of the individual contributions: the combined P10–P90 band (EUR 867 M) exceeds the quadrature-sum expectation under independence (EUR 696 M) by EUR 170 M, or ∼24 %. This comparison is visualized in panel (c): the hatched bar marks the range expected under independence, constructed from the additive mean shift and the quadrature sum of the individual P10–P90 half-bands; the combined bar visibly exceeds it on the downside. The probability of negative NPV is nearly a property of combination: individually, only SC2 produces non-negligible P(NPV<0) (2.3 %); the combined scenario yields 7.0 %. The likely driver of super-additivity is the intra-module coupling between reliability and O&M process uncertainty: higher-than-expected failure frequency (R2) compounds with longer-than-expected repair campaigns (P2), amplifying downside outcomes beyond what either risk produces alone.
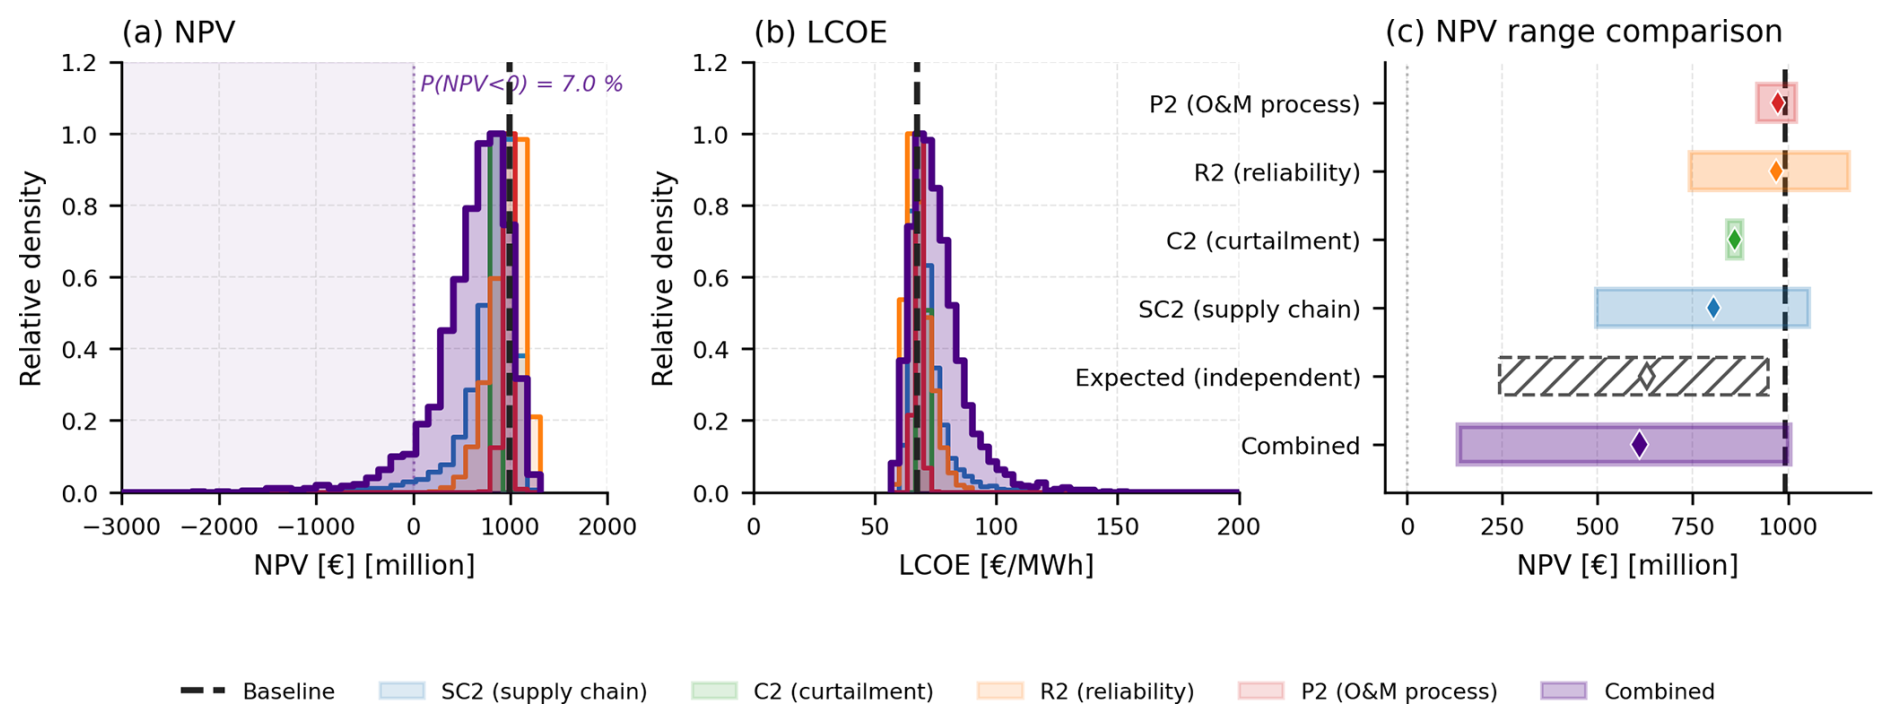
Figure 15Combined adverse-alignment experiment. (a) NPV distributions for individual moderate-risk scenarios and the combined scenario, with the deterministic baseline marked. (b) Corresponding LCOE distributions. (c) P10–P90 range bars comparing individual scenarios, the combined scenario, and the range expected under independence (additive means, quadrature-summed bands, hatched).
5.2 Cross-category synthesis
Table 15 brings together the individual and combined results. Under the scenario parameterizations adopted in this study, the six risk categories produce qualitatively distinct economic signatures. Supply chain and curtailment risk primarily shift mean outcomes downwards, while reliability and O&M process uncertainty predominantly widen outcome distributions and generate pronounced downside tails. The end-of-life decision acts as a value lever with large upside potential. These signatures are not intrinsic properties of the risk categories; they depend on the input assumptions and scenario design chosen for each assessment. Nevertheless, the distinction matters for management strategy. Mean-shifting risks are driven by systematic market factors that can be hedged or contracted against (e.g. locking commodity prices, securing grid access). Tail-widening risks, by contrast, are largely epistemic: the wide spread reflects insufficient knowledge of failure rates or repair times, and would narrow as better fleet data and monitoring reduce that uncertainty. These findings motivate the integration gaps and research priorities examined in Sect. 6.
Table 15Synthesis of risk categories examined in this study. The four quantified categories are shown with moderate-scenario results (3000 replicates each; deterministic baseline NPV = EUR 992 M). The combined row activates all four moderate scenarios simultaneously. The last row shows the sum of individual Δ NPV values for comparison. Italics indicate an explanatory note rather than a numerical result; bold font highlights the combined-risk experiment.
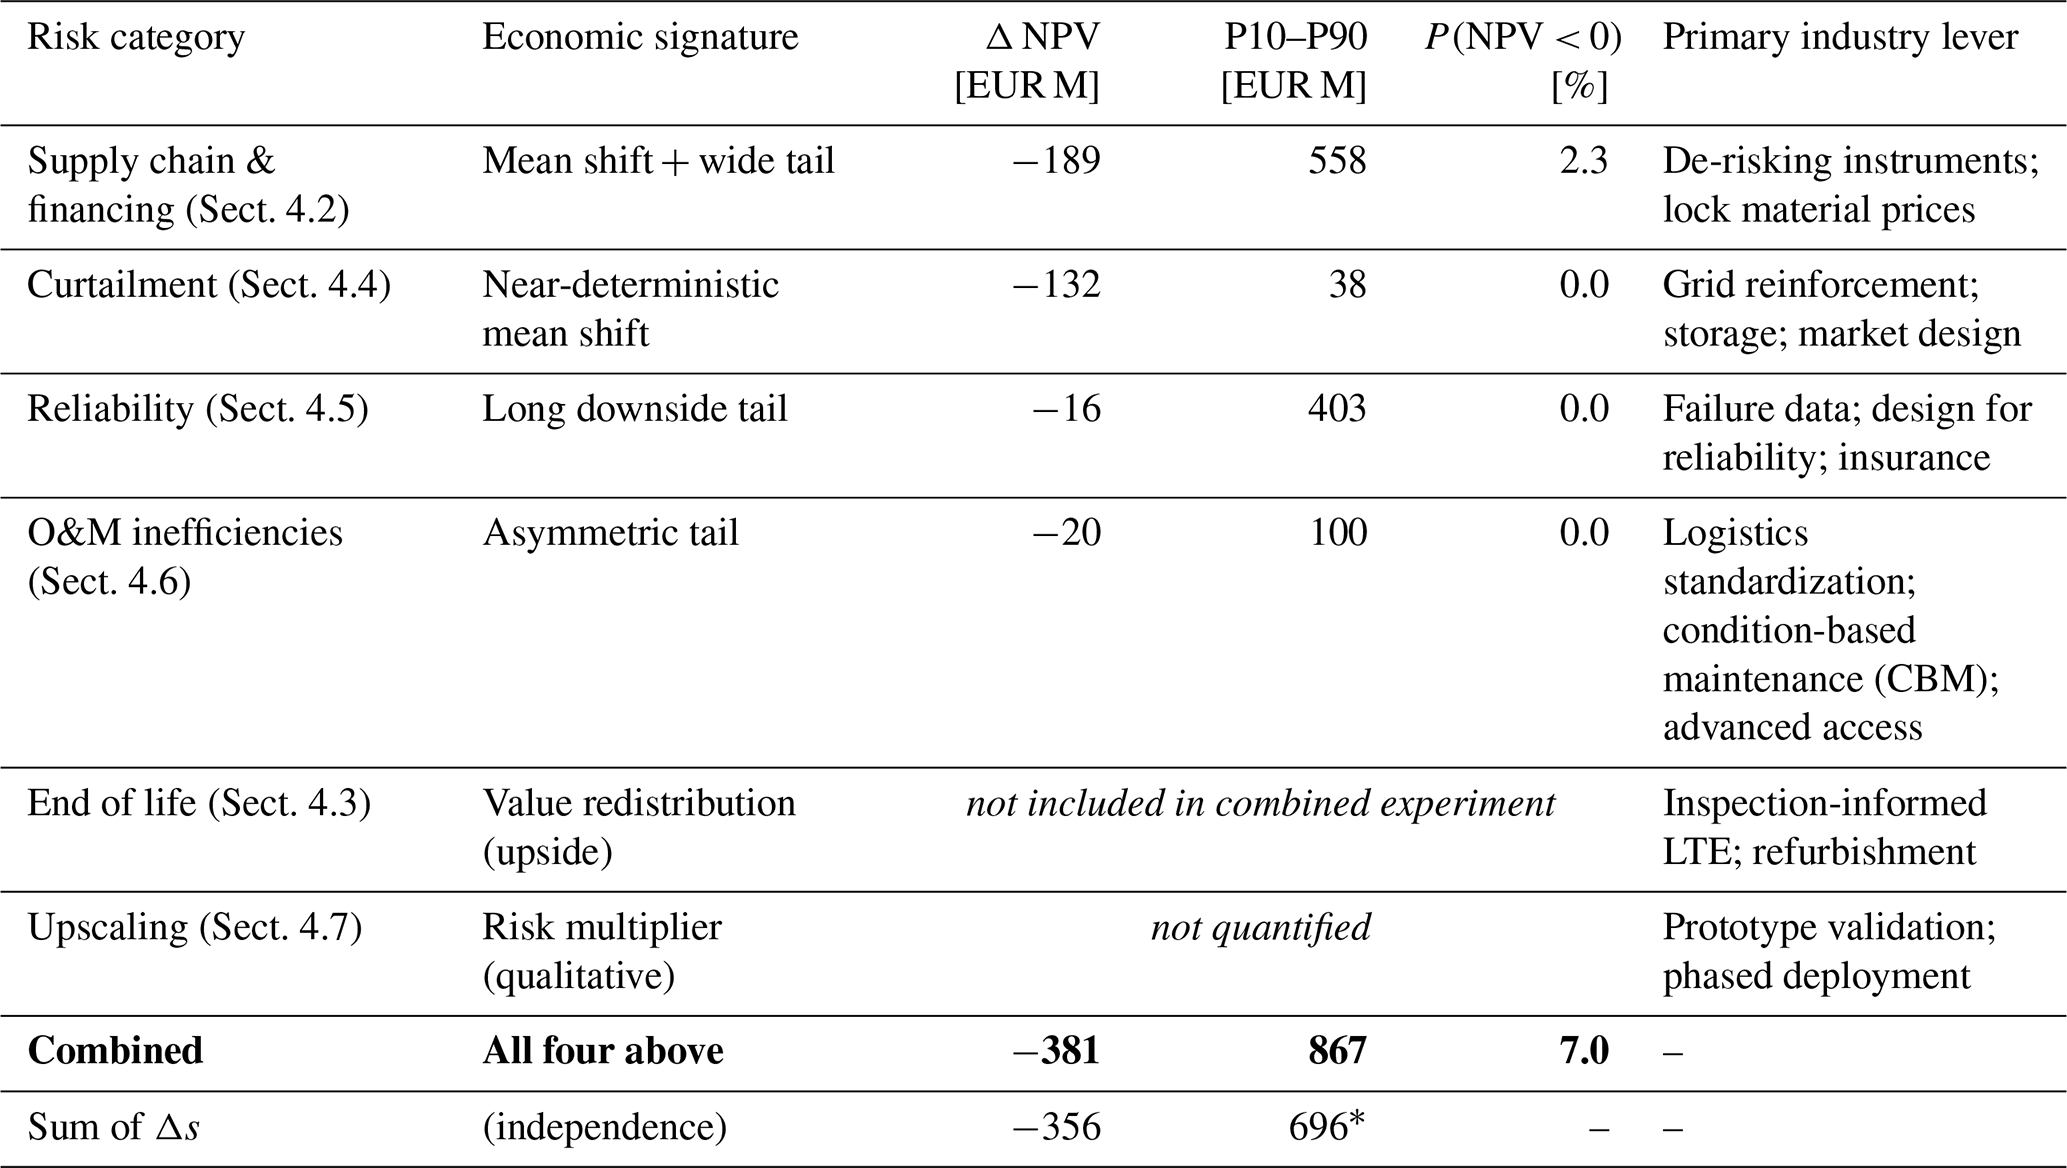
* Quadrature sum of individual P10–P90 bands.
The integration deficits discussed in this section are not a priori modelling choices but emerged from the preceding assessments. Although identified here in the context of WINPACT, they are formulated as general requirements for integrated risk assessment rather than as deficiencies of a specific tool. The combined-risk experiment in Sect. 5.1 demonstrates empirically that individually moderate risks produce tail-coupled outcomes exceeding what isolated assessment predicts: mean losses are roughly additive, but the P10–P90 band widens by 24 % beyond the independence assumption, and the probability of negative NPV triples. This compounding behaviour is a direct consequence of integration deficits in the assessment framework. A useful distinction can be drawn between two classes of such deficit: interface gaps between model components, and injection gaps between external drivers and the model chain.
Interface gaps arise at boundaries between coupled sub-models within the assessment framework, where both sides are internal to the model chain. Three principal interface gaps are identified:
-
Loads → reliability. Structural loading models and reliability models are developed and calibrated independently. The translation from site-specific, operation-dependent loading to component-level failure rates is not formalized, so that the effect of design choices, operating strategies, or environmental conditions on failure behaviour cannot be assessed within the model chain.
-
Reliability → O&M. O&M simulation relies on stationary failure-rate assumptions and predefined maintenance rules. Load-dependent and condition-dependent failure behaviour from structural or monitoring models is not fed back into maintenance scheduling, preventing realistic assessment of how site conditions and operational strategies influence maintenance outcomes.
-
O&M → revenue. Operational decisions (maintenance campaigns, access strategies) affect production timing and volume, but revenue models treat production loss as a simple annual deduction rather than resolving the interaction with time-varying electricity prices and market conditions.
Injection gaps arise where external drivers originating outside the project boundary need to enter the model chain but lack formalized interfaces. Five principal injection gaps are identified:
-
Wind resource and wake evolution. Long-term changes in wind climate and evolving wake interactions due to increasing wind farm density are not systematically propagated into energy yield and revenue projections.
-
Commodity and supply chain conditions. Geopolitical developments, commodity price dynamics, and industrial policy changes affect both CAPEX (material costs) and financing terms (cost of capital) but typically enter models as static assumptions rather than as scenario-dependent parameter distributions linked to the cost and financing modules.
-
Grid and curtailment regime. Transmission infrastructure trajectories, renewable deployment, and system flexibility investments jointly determine curtailment exposure but are not endogenously modelled within the assessment chain.
-
Market design and policy regime. Electricity market structures, support-scheme evolution, and compensation mechanisms affect project revenue risk but enter models as exogenous assumptions rather than uncertain parameters.
-
Technology maturity and model transferability. Reliability, O&M, and cost parameters are calibrated from mature-fleet operational data. For next-generation turbine platforms with limited field history, validated transfer functions from design parameters to operational failure behaviour do not exist, so that all downstream model outputs inherit unquantified epistemic uncertainty.
Figure 16 illustrates these gaps schematically, mapping both interface gaps and injection gaps onto a generalized impact assessment model chain.
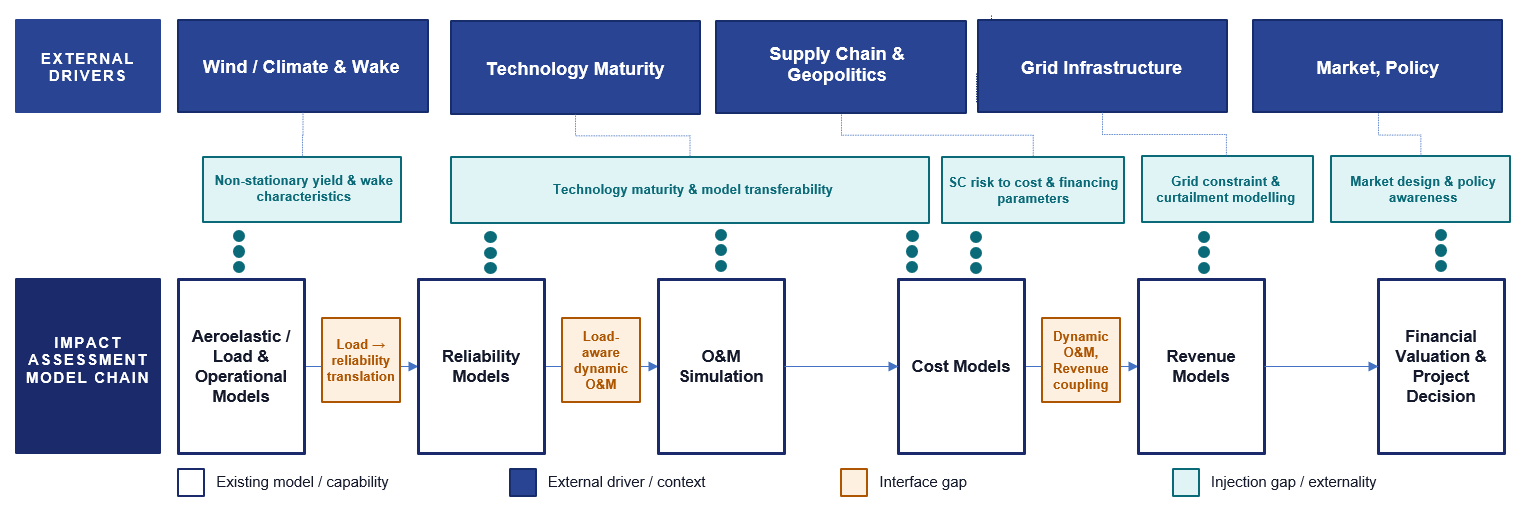
Figure 16Integration gaps in the impact assessment model chain. Interface gaps arise at boundaries between coupled sub-models. Injection gaps arise where external drivers lack formalized interfaces to the model chain. Existing model capabilities are shown in dark blue.
Closing these gaps requires progress on several fronts. Reliability and O&M data with consistent component taxonomies, documented uncertainty bounds, and reproducible benchmarks remain a binding prerequisite; without them, even well-coupled models propagate poorly constrained inputs. Some of the integration deficits identified above demand new methods that do not yet exist: translating site-specific loading histories into failure-rate distributions requires physics-informed reliability models beyond fleet-average statistics, and coupling reliability with O&M requires condition-dependent maintenance formulations in which failure behaviour evolves with operational state. Other deficits are primarily coupling tasks, connecting models that exist independently but are not yet linked: project-level techno-economic assessments need to be coupled with electricity system models to endogenize curtailment exposure and price formation, and with supply chain and macroeconomic models to propagate commodity dynamics and financing conditions as scenario-dependent inputs.
This paper reviewed and quantified six major risk categories affecting wind energy projects across development and operational phases, combining expert elicitation, literature review, and scenario-based impact assessments using the WINPACT toolchain. The illustrative case studies show that different risk categories, under the scenario assumptions adopted here, produce qualitatively distinct economic signatures, from near-deterministic mean shifts (curtailment) to pronounced downside tails (reliability, O&M process uncertainty), and that these signatures call for different management responses: mean-shifting risks are addressable through hedging and contracting, while tail-widening risks require reducing the underlying epistemic uncertainty through better data and monitoring.
The combined-risk experiment demonstrates that individually moderate risks can compound into jointly severe outcomes: while mean NPV losses are roughly additive across categories, tail risk is super-additive, and the probability of negative NPV emerges as a property of combination rather than of any single risk in isolation. This finding underscores the fact that siloed risk assessment, however detailed, systematically underestimates downside exposure.
The study does not claim to resolve these integration challenges. Rather, it maps the gap between current fragmented practice and the integrated treatment that project-level risk management requires. Eight specific integration deficits (three interface gaps between coupled sub-models and five injection gaps between external drivers and the model chain) are identified as priorities for future research. Progress will depend on shared data infrastructure with consistent taxonomies and documented uncertainty bounds, physics-informed methods to couple loads with reliability and O&M, and the integration of project-level assessments with electricity system and supply chain models.
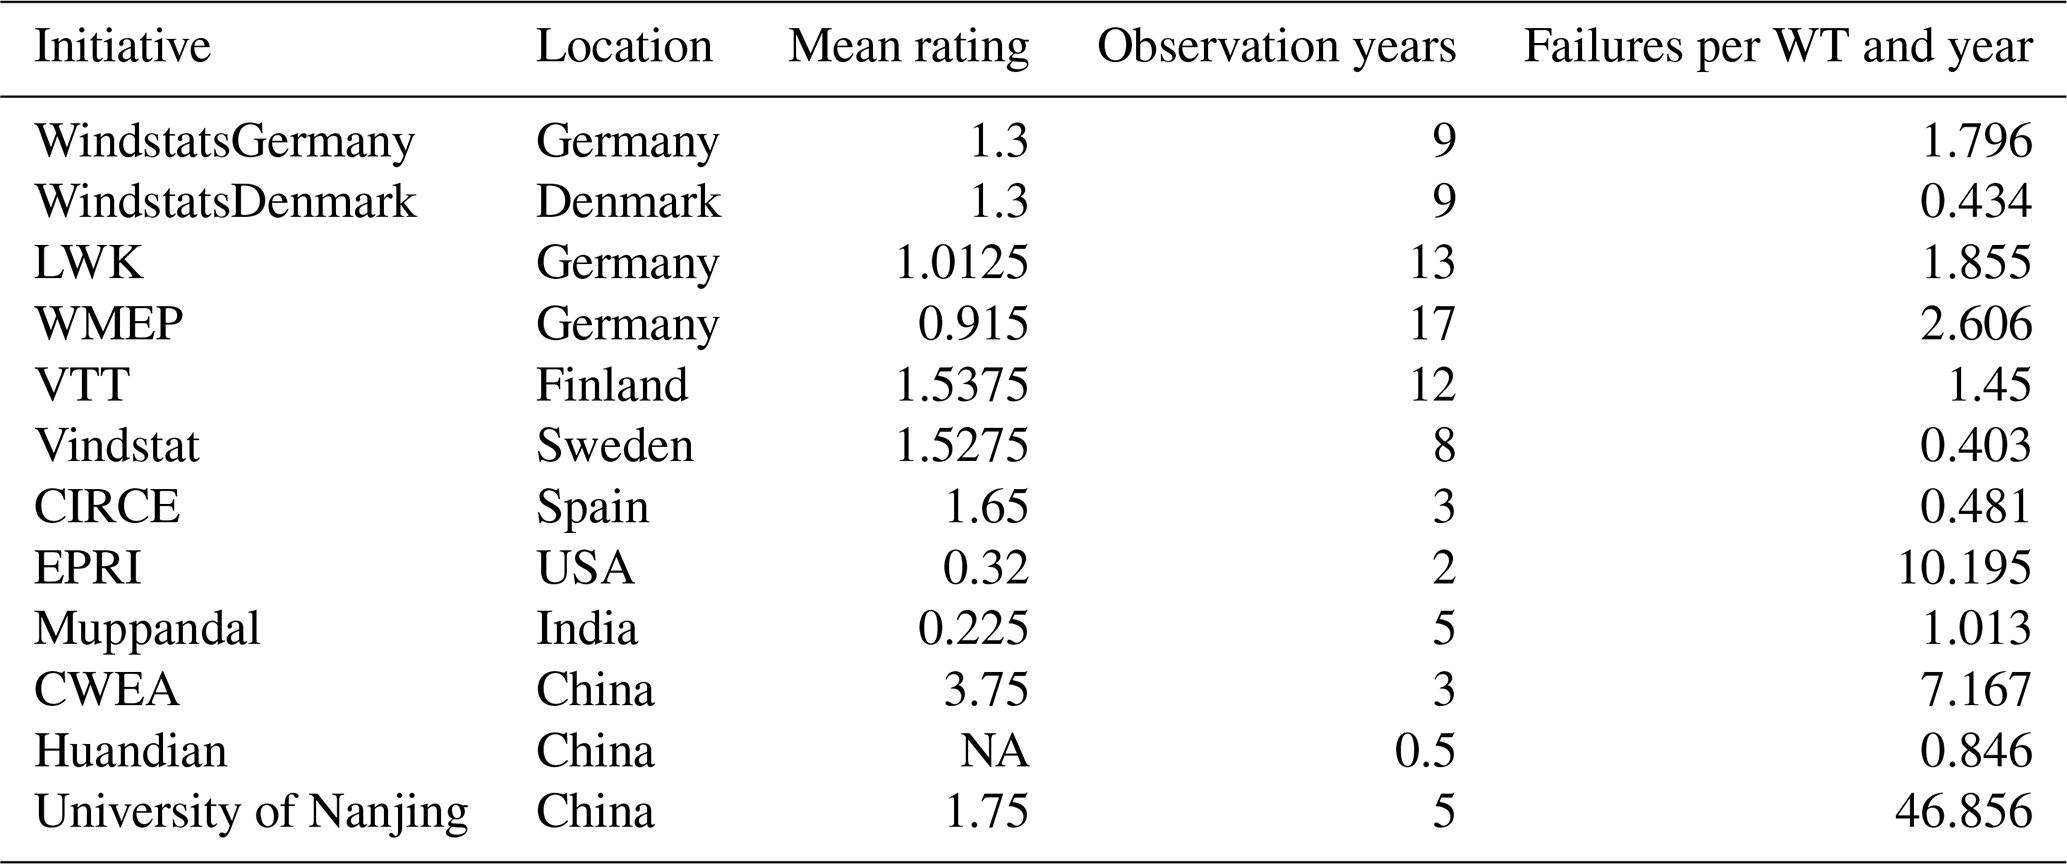
The WINPACT toolchain, including the experiment implementation and the complete input configurations (baseline wind farm definition and all scenario parameter sets) used in this study, is available at https://doi.org/10.5281/zenodo.17641606 (Gräfe et al., 2025a).
The expert survey responses underlying Sect. 3 are not publicly accessible as the survey was conducted under the condition of confidentiality and participants did not consent to the publication of their individual responses. The aggregated results are reported in full in Figs. 2 and 3. The data can be made available upon reasonable request. All other data used in this study are publicly available from the cited third-party sources.
MG: conceptualization, code implementation, scenario development, and writing (drafting and review). AL: review on curtailment and reliability. MS: review on supply chain. AK: review on technology upscaling. RP: survey execution. ND: ideation, survey design, formulation of sector challenges, and writing (conceptualization and review of the paper).
At least one of the (co-)authors is a member of the editorial board of Wind Energy Science. The peer-review process was guided by an independent editor, and the authors also have no other competing interests to declare.
Publisher's note: Copernicus Publications remains neutral with regard to jurisdictional claims made in the text, published maps, institutional affiliations, or any other geographical representation in this paper. The authors bear the ultimate responsibility for providing appropriate place names. Views expressed in the text are those of the authors and do not necessarily reflect the views of the publisher.
The authors acknowledge the use of large language model tools to support language editing and to improve clarity and coherence of the article.
This publication has received support through the Danish Energy Agency's Energy Technology Development and Demonstration Programme (grant no. 134234-512096).
This paper was edited by Yolanda Vidal and reviewed by four anonymous referees.
Abba, Z., Balta-Ozkan, N., and Hart, P.: A holistic risk management framework for renewable energy investments, Renew. Sust. Energ. Rev., 160, 112305, https://doi.org/10.1016/j.rser.2022.112305, 2022. a
Agbonaye, O., Keatley, P., Huang, Y., Odiase, F. O., and Hewitt, N.: Value of demand flexibility for managing wind energy constraint and curtailment, Renew. Energ., 190, 487–500, https://doi.org/10.1016/j.renene.2022.03.131, 2022. a
Artigao, E., Martín-Martínez, S., Honrubia-Escribano, A., and Gómez-Lázaro, E.: Wind turbine reliability: A comprehensive review towards effective condition monitoring development, Appl. Energ., 228, 1569–1583, https://doi.org/10.1016/j.apenergy.2018.07.037, 2018. a
Baranowski, R., Cooperman, A., Gilman, P., and Lantz, E.: Wind Energy Supply Chain Deep Dive Assessment, Tech. Rep. DOE/OP-0013, US Department of Energy, Office of Energy Efficiency and Renewable Energy, https://doi.org/10.2172/1866032, 2022. a
Behr, O., Brinkmann, R., Hochradel, K., Mages, J., Korner-Nievergelt, F., Niermann, I., Reich, M., Simon, R., Weber, N., and Nagy, M.: Mitigating bat mortality with turbine-specific curtailment algorithms: a model based approach, in: Wind Energy and Wildlife Interactions: Presentations from the CWW2015 Conference, edited by Köppel, J., 135–160, Springer International Publishing, Cham, https://doi.org/10.1007/978-3-319-51272-3_8, 2017. a
Biber, A., Felder, M., Wieland, C., and Spliethoff, H.: Negative price spiral caused by renewables? Electricity price prediction on the German market for 2030, The Electricity Journal, 35, 107188, https://doi.org/10.1016/j.tej.2022.107188, 2022. a
Bird, L., Lew, D., Milligan, M., Carlini, E. M., Estanqueiro, A., Flynn, D., Gómez-Lázaro, E., Holttinen, H., Menemenlis, N., Orths, A., Eriksen, P. B., Smith, J. C., Söder, L., Sørensen, P., Altiparmakis, A., Yasuda, Y., and Miller, J.: Wind and solar energy curtailment: A review of international experience, Renew. Sust. Energ. Rev., 65, 577–586, https://doi.org/10.1016/j.rser.2016.06.082, 2016. a
Board of Governors of the Federal Reserve System (US): Market Yield on US Treasury Securities at 10-Year Constant Maturity, Quoted on an Investment Basis [DGS10], FRED, Federal Reserve Economic Data, https://fred.stlouisfed.org/series/DGS10 (last access: 27 August 2026), 2026. a
Borgers, R., Meyers, J., and van Lipzig, N. P. M.: Energy production and inter-farm wake losses in future North Sea wind farms, Environ. Res. Lett., 20, 074036, https://doi.org/10.1088/1748-9326/add8a2, 2025. a
Borsotti, M., Negenborn, R., and Jiang, X.: A review of multi-horizon decision-making for operation and maintenance of fixed-bottom offshore wind farms, Renew. Sust. Energ. Rev., 226, 116450, https://doi.org/10.1016/j.rser.2025.116450, 2026. a, b
Carrara, S., Bobba, S., Blagoeva, D., Alves Dias, P., Cavalli, A., Georgitzikis, K., Grohol, M., Itul, A., Kuzov, T., Latunussa, C., Lyons, L., Malano, G., Maury, T., Prior Arce, Á., Somers, J., Telsnig, T., Veeh, C., Wittmer, D., Black, C., Pennington, D., and Christou, M.: Supply Chain Analysis and Material Demand Forecast in Strategic Technologies and Sectors in the EU – A Foresight Study, Tech. Rep. JRC132889, Joint Research Centre, Publications Office of the European Union, Luxembourg, https://doi.org/10.2760/386650, 2023. a
Carroll, J., McDonald, A., and McMillan, D.: Failure rate, repair time and unscheduled O&M cost analysis of offshore wind turbines, Wind Energy, 19, 1107–1119, https://doi.org/10.1002/we.1887, 2016. a, b, c
Cevasco, D., Koukoura, S., and Kolios, A.: Reliability, availability, maintainability data review for the identification of trends in offshore wind energy applications, Renew. Sust. Energ. Rev., 136, 110414, https://doi.org/10.1016/j.rser.2020.110414, 2021. a
Chesterman, X., Verstraeten, T., Daems, P.-J., Nowé, A., and Helsen, J.: Overview of normal behavior modeling approaches for SCADA-based wind turbine condition monitoring demonstrated on data from operational wind farms, Wind Energ. Sci., 8, 893–924, https://doi.org/10.5194/wes-8-893-2023, 2023. a
Costanzo, G., Brindley, G., and Tardieu, P.: Wind energy in Europe: 2024 Statistics and the outlook for 2025–2030, Tech. rep., Wind Europe, https://windeurope.org/data/products/wind-energy-in-europe-2024-statistics-and-the-outlook-for-2025-2030/ (last access: 14 September 2026), 2025. a
Cryan, P. M. and Barclay, R. M. R.: Causes of Bat Fatalities at Wind Turbines: Hypotheses and Predictions, J. Mammal., 90, 1330–1340, https://doi.org/10.1644/09-MAMM-S-076R1.1, 2009. a
Dao, C., Kazemtabrizi, B., and Crabtree, C.: Wind turbine reliability data review and impacts on levelised cost of energy, Wind Energy, 22, 1848–1871, https://doi.org/10.1002/we.2404, 2019. a, b, c
Dao, C. D., Kazemtabrizi, B., and Crabtree, C. J.: Offshore wind turbine reliability and operational simulation under uncertainties, Wind Energy, 23, 1919–1938, https://doi.org/10.1002/we.2526, 2020. a
Deutsche Finanzagentur: FactSheet: 2.60 % Federal bond 2025 (2035), ISIN DE000BU2Z056, https://www.deutsche-finanzagentur.de/en/federal-securities/factsheet/isin/DE000BU2Z056 (last access: 24 August 2026), 2026. a
Dinwoodie, I., McMillan, D., Revie, M., Lazakis, I., and Dalgic, Y.: Development of a Combined Operational and Strategic Decision Support Model for Offshore Wind, Energy Procedia, deepWind'2013 – Selected papers from 10th Deep Sea Offshore Wind R&D Conference, Trondheim, Norway, 24–25 January 2013, 35, 157–166, https://doi.org/10.1016/j.egypro.2013.07.169, 2013. a
Donnelly, O., Carroll, J., and Howland, M.: Analysing the cost impact of failure rates for the next generation of offshore wind turbines, Wind Energy, 27, 695–710, https://doi.org/10.1002/we.2907, 2024. a, b, c, d
Eberle, A., Cooperman, A., Walzberg, J., Hettinger, D., Tusing, R. F., Berry, D., Inman, D., Sirnivas, S., Marquis, M., Ennis, B., Sproul, E., Clarke, R., Paquette, J., Hendrickson, T., Morrow, W., Das, S., Korey, M., Paranthaman, P., Norris, R., Ghobrial, L., Seetharaman, S., and Korobeinikov, Y.: Materials Used in US Wind Energy Technologies: Quantities and Availability for Two Future Scenarios, Tech. Rep. NREL/TP-6A20-81483, National Renewable Energy Laboratory, Golden, CO, https://docs.nlr.gov/docs/fy23osti/81483.pdf (last access: 24 August 2026), 2023. a
EirGrid TSO and SONI TSO: Article 13 Clean Energy Package Redispatching Annual Report - 2023, Tech. Rep. SEM-24-059a, EirGrid and SONI, Dublin and Belfast, https://www.semcommittee.com/files/semcommittee/2024-08/SEM-24-059a_%20Proposed%20report%20under%20Article%2013%284%29.pdf (last access: 14 September 2026), 2024. a, b, c
Electric Power Research Institute (EPRI): Wind Network for Enhanced Reliability (WinNER) Database [data set], https://www.epri.com/research/products/000000003002027612 (last access: 14 September 2026), 2024. a
Ember: European Wholesale Electricity Price Data [data set], https://ember-energy.org/data/european-wholesale-electricity-price-data/ (last access: 16 December 2025), 2025. a, b
European Commission, Directorate-General for Environment: EU Guidance on Wind Energy Development in Accordance with the EU Nature Legislation, Tech. rep., European Commission, https://eolien-biodiversite.com/IMG/pdf/wind_farms_guide_final_draft_march_2010.pdf (last access: 24 August 2026), 2010. a
Faulstich, S., Hahn, B., and Tavner, P. J.: Wind turbine downtime and its importance for offshore deployment, Wind Energy, 14, 327–337, https://doi.org/10.1002/we.421, 2011. a, b, c
Fischer, K., Pelka, K., Bartschat, A., Tegtmeier, B., Coronado, D., Broer, C., and Wenske, J.: Reliability of Power Converters in Wind Turbines: Exploratory Analysis of Failure and Operating Data from a Worldwide Turbine Fleet, IEEE T. Power Electr., 34, 6332–6344, https://doi.org/10.1109/TPEL.2018.2875005, 2019. a
Friedenberg, N. A. and Frick, W. F.: Assessing fatality minimization for hoary bats amid continued wind energy development, Biol. Conserv., 262, 109309, https://doi.org/10.1016/j.biocon.2021.109309, 2021. a
Fuchs, R., Zuckerman, G., Duffy, P., Shields, M., Musial, W., Beiter, P., Cooperman, A., and Bredenkamp, S.: The Cost of Offshore Wind Energy in the United States From 2025 to 2050, Tech. Rep. NREL/TP-5000-88988, National Renewable Energy Laboratory, https://doi.org/10.2172/2433785, 2024. a
Global Wind Energy Council and Boston Consulting Group: Mission Critical: Building the global wind energy supply chain for a 1.5 °C world, Tech. rep., Global Wind Energy Council, https://www.gwec.net/reports/supplychain (last access: 24 August 2026), 2023. a, b, c
Global Wind Energy Council (GWEC): Global Wind Report 2025, Tech. rep., Global Wind Energy Council, Lisbon, Portugal, https://26973329.fs1.hubspotusercontent-eu1.net/hubfs/26973329/2.%20Reports/Global%20Wind%20Report/GWEC%20Global%20Wind%20Report%202025.pdf (last access: 14 September 2026), 2025. a, b
Gonzalez-Aparicio, I., Vitulli, A., Krishna-Swamy, S., Hernandez-Serna, R., Jansen, N., and Verstraten, P.: Offshore wind business feasibility in a flexible and electrified Dutch energy market by 2030, Whitepaper, TNO, https://publications.tno.nl/publication/34640203/tMlTI0/TNO-2022-offshorewind.pdf (last access: 24 August 2026), 2022. a
Gottlieb, I., Allison, T. D., Donovan, C., Whitby, M., and New, L.: Developing and Evaluating a Smart Curtailment Strategy Integrated with a Wind Turbine Manufacturer Platform, Tech. rep., Renewable Energy Wildlife Institute (REWI), Washington, DC (United States), https://doi.org/10.2172/2378000, 2024. a
Gräfe, M., Dimitrov, N., El Amri, M. R., and Guiton, M.: Validation of the Newly Developed FLS and ULS Distribution Predictions and Quantification of the Resulting Uncertainty Reduction, Public Deliverable Deliverable D4.5, Technical University of Denmark (DTU) and IFP Energies nouvelles (IFPEN), hIPERWIND project, Horizon 2020 Research and Innovation Programme, Grant Agreement No. 101006689, https://ifp.hal.science/hal-04836565v1 (last access: 14 September 2026), 2024. a
Gräfe, M., Pettas, V., and Dimitrov, N.: WINPACT (v1.0.0), Zenodo [code], https://doi.org/10.5281/zenodo.17641606, 2025a. a, b
GräfGräfe, M., Kainz, S., Ludot, A., Pettas, V., Anand, A., and Bottasso, C. L.: Impact of reliability parameters on O&M cost and greenhouse gas emissions of offshore wind farms, J. Phys. Conf. Ser., 3131, 012034, https://doi.org/10.1088/1742-6596/3131/1/012034, 2025b. a
Gräfe, M., Pettas, V., Ioannou, A., Kolios, A., and Dimitrov, N.: Wind farm project valuation under revenue-driven farm control considering life time extension, J. Phys. Conf. Ser., 3224, 062063, https://doi.org/10.1088/1742-6596/3224/6/062063, 2026. a
Guillet, J.: Financing Offshore Wind, Tech. rep., World Forum Offshore Wind (WFO), Hamburg, Germany, https://wfo-global.org/wp-content/uploads/2022/09/WFO_FinancingOffshoreWind_2022.pdf (last access: 24 August 2026), 2022. a
Hadjoudj, Y. and Pandit, R.: A review on data-centric decision tools for offshore wind operation and maintenance activities: Challenges and opportunities, Energy Sci. Eng., 11, 1501–1515, https://doi.org/10.1002/ese3.1376, 2023. a
Hahmann, A. N., García-Santiago, O., and Peña, A.: Current and future wind energy resources in the North Sea according to CMIP6, Wind Energ. Sci., 7, 2373–2391, https://doi.org/10.5194/wes-7-2373-2022, 2022. a
Hahn, B., Welte, T., Faulstich, S., Bangalore, P., Boussion, C., Harrison, K., Miguelanez-Martin, E., O'Connor, F., Pettersson, L., Soraghan, C., Stock-Williams, C., Sørensen, J. D., van Bussel, G., and Vatn, J.: Recommended practices for wind farm data collection and reliability assessment for O&M optimization, in: Energy Procedia, 14th Deep Sea Offshore Wind R&D Conference, EERA DeepWind'2017, Elsevier, vol. 137, 358–365,https://doi.org/10.1016/j.egypro.2017.10.360, 2017. a, b
Hammond, R. and Cooperman, A.: Windfarm Operations and Maintenance cost-Benefit Analysis Tool (WOMBAT), Tech. Rep. NREL/TP-5000-83712, National Renewable Energy Laboratory, https://doi.org/10.2172/1894867, 2022. a
Haseeb, S. A. and Krawczuk, M.: A State-of-the-Art Review of Structural Health Monitoring Techniques for Wind Turbine Blades, J. Nondestruct. Eval., 45, 4, https://doi.org/10.1007/s10921-025-01296-5, 2025. a, b
Hawker, G. S. and McMillan, D. A.: The impact of maintenance contract arrangements on the yield of offshore wind power plants, Proceedings of the Institution of Mechanical Engineers, Part O: Journal of Risk and Reliability, 229, 394–402, https://doi.org/10.1177/1748006X15594693, 2015. a
Hayes, M. A., Lindsay, S. R., Solick, D. I., and Newman, C. M.: Simulating the influences of bat curtailment on power production at wind energy facilities, Wildlife Soc. B., 47, e1399, https://doi.org/10.1002/wsb.1399, 2023. a, b
International Electrotechnical Commission: IEC 61400-1:2019 RVL, Wind energy generation systems – Part 1: Design requirements, International standard, International Electrotechnical Commission, https://webstore.iec.ch/publication/64648 (last access: 14 September 2026), 2019a. a
International Electrotechnical Commission: IEC 61400-3-1:2019, Wind energy generation systems – Part 3-1: Design requirements for fixed offshore wind turbines, International standard, International Electrotechnical Commission, https://webstore.iec.ch/publication/29360 (last access: 14 September 2026), 2019b. a
International Electrotechnical Commission: Wind energy generation systems – Part 28: Through-life management and life extension of wind power assets, Technical Specification IEC TS 61400-28:2025, IEC, Geneva, Switzerland, ISBN 9782832702956, https://webstore.iec.ch/en/publication/62236 (last access: 14 September 2026), 2025. a
International Energy Agency: The Netherlands 2024: Energy Policy Review, Energy policy review, International Energy Agency, Paris, France, https://iea.blob.core.windows.net/assets/2b729152-456e-43ed-bd9b-ecff5ed86c13/TheNetherlands2024.pdf (last access: 24 August 2026), 2025. a
Ioannou, A., Angus, A., and Brennan, F.: Informing parametric risk control policies for operational uncertainties of offshore wind energy assets, Ocean Eng., 177, 1–11, https://doi.org/10.1016/j.oceaneng.2019.02.058, 2019. a
IRENA: Renewable capacity statistics 2025, Tech. rep., https://www.irena.org/Publications/2025/Mar/Renewable-capacity-statistics-2025 (last access: 24 August 2026), 2025. a
Jardine, A. K. S., Lin, D., and Banjevic, D.: A review on machinery diagnostics and prognostics implementing condition-based maintenance, Mech. Syst. Signal Pr., 20, 1483–1510, https://doi.org/10.1016/j.ymssp.2005.09.012, 2006. a
Kapur, K. C. and Pecht, M.: Reliability Engineering, John Wiley & Sons, Hoboken, NJ, USA, ISBN 9781118841716, https://doi.org/10.1002/9781118841716, 2014. a
Kerr, S.: Scottish wind farms paid not to generate nearly 40 % of potential electricity, Financial Times, online, https://www.ft.com/content/e7481629-4e6b-460c-830c-d97324115aca (last access: 24 August 2026), 2025. a
Kestel, K., Chesterman, X., Zappalá, D., Watson, S., Li, M., Hart, E., Carroll, J., Vidal, Y., Nejad, A. R., Sheng, S., Guo, Y., Stammler, M., Wirsing, F., Saleh, A., Gregarek, N., Baszenski, T., Decker, T., Knops, M., Jacobs, G., Lehmann, B., König, F., Pereira, I., Daems, P.-J., Peeters, C., and Helsen, J.: Condition monitoring of wind turbine drivetrains: state-of-the-art technologies, recent trends, and future outlook, Wind Energ. Sci., 11, 2103–2155, https://doi.org/10.5194/wes-11-2103-2026, 2026. a, b
Kolios, A., Richmond, M., Koukoura, S., and Yeter, B.: Effect of weather forecast uncertainty on offshore wind farm availability assessment, Ocean Eng., 285, https://doi.org/10.1016/j.oceaneng.2023.115265, 2023. a
Kong, K., Dyer, K., Payne, C., Hamerton, I., and Weaver, P. M.: Progress and Trends in Damage Detection Methods, Maintenance, and Data-driven Monitoring of Wind Turbine Blades – A Review, Renewable Energy Focus, 44, 390–412, https://doi.org/10.1016/j.ref.2022.08.005, 2023. a
Larsén, X. G., Imberger, M., and Hannesdóttir, Á.: The impact of Climate Change on extreme winds over northern Europe according to CMIP6, Frontiers in Energy Research, 12, 1404791, https://doi.org/10.3389/fenrg.2024.1404791, 2024. a
Lopez, J. C. and Kolios, A.: Risk-based maintenance strategy selection for wind turbine composite blades, Energy Reports, 8, 5541–5561, https://doi.org/10.1016/j.egyr.2022.04.027, 2022. a
Ma, Z., An, G., Sun, X., and Chai, J.: A study of fault statistical analysis and maintenance policy of wind turbine system, in: International Conference on Renewable Power Generation (RPG 2015), 1–4, https://doi.org/10.1049/cp.2015.0443, 2015. a
Malik, T. H. and Bak, C.: Challenges in detecting wind turbine power loss: the effects of blade erosion, turbulence, and time averaging, Wind Energ. Sci., 10, 227–243, https://doi.org/10.5194/wes-10-227-2025, 2025. a
Mehta, M., Zaaijer, M., and von Terzi, D.: Drivers for optimum sizing of wind turbines for offshore wind farms, Wind Energ. Sci., 9, 141–163, https://doi.org/10.5194/wes-9-141-2024, 2024. a
Merton, R. C.: Option pricing when underlying stock returns are discontinuous, J. Financ. Econ., 3, 125–144, https://doi.org/10.1016/0304-405X(76)90022-2, 1976. a
Mikindani, D., O'Brien, J., Leahy, P., and Deeney, P.: The financial risks from wind turbine failures: a value at risk approach, Appl. Econ., 57, 6105–6120, https://doi.org/10.1080/00036846.2024.2380542, 2025. a
Mirletz, B., Vimmerstedt, L., Stehly, T., Stright, D., Cohen, S., Cole, W., Duffy, P., Feldman, D., Kurup, P., Ramasamy, V., Zuboy, J., Oladosu, G., Hoffmann, J., Eberle, A., Roberts, O., Mulas Hernando, D., Avery, G., Rosenlieb, E., Schleifer, A., Akindipe, D., and Sekar, A.: 2024 Annual Technology Baseline (ATB) Cost and Performance Data for Electricity Generation Technologies, National Renewable Energy Laboratory/US Department of Energy Office of Scientific and Technical Information [data set], https://doi.org/10.25984/2377191, 2024. a
Mishnaevsky, L.: Root Causes and Mechanisms of Failure of Wind Turbine Blades: Overview, Materials, 15, 2959, https://doi.org/10.3390/ma15092959, 2022. a
Moverley Smith, B., Clayton, R., van der Weijde, A. H., and Thies, P. R.: Evaluating technical and financial factors for commercialising floating offshore wind: A stakeholder analysis, Wind Energy, 25, 1959–1972, https://doi.org/10.1002/we.2777, 2022. a
National Renewable Energy Laboratory: WISDEM® (Wind-Plant Integrated System Design and Engineering Model), GitHub [code], https://github.com/WISDEM/WISDEM (last access: 14 September 2026), 2021. a
Nielsen, J. and Sørensen, J.: Risk‐based derivation of target reliability levels for life extension of wind turbine structural components, Wind Energy, 24, 939–956, https://doi.org/10.1002/we.2610, 2021. a
Nielsen, J., Dimitrov, N., and Sørensen, J.: Optimal Decision Making for Life Extension for Wind Turbines, in: Proceedings of the 13th International Conference on Applications of Statistics and Probability in Civil Engineering, ICASP 2019, Seoul National University, https://doi.org/10.22725/ICASP13.083, 2019. a, b
Nielsen, J. J. and Sørensen, J. D.: On risk-based operation and maintenance of offshore wind turbine components, Reliab. Eng. Syst. Safe., 96, 218–229, https://doi.org/10.1016/j.ress.2010.07.007, 2011. a
Nunemaker, J., Shields, M., Hammond, R., and Duffy, P.: ORBIT: Offshore Renewables Balance-of-System and Installation Tool, Tech. Rep. NREL/TP-5000-77081, National Renewable Energy Laboratory, https://doi.org/10.2172/1660132, 2020. a
Paquette, J., Williams, M., Clarke, R., Devin, M., Sheng, S., Constant, C., Clark, C., Fields, J., Gevorgian, V., Hall, M., Jonkman, J., Keller, J., Robertson, A., Sethuraman, L., and van Dam, J.: An Operations and Maintenance Roadmap for US Offshore Wind: Enabling a Cost-Effective and Sustainable US Offshore Wind Energy Industry through Innovative Operations and Maintenance, Tech. rep., US Department of Energy, Office of Energy Efficiency and Renewable Energy, https://www.energy.gov/sites/default/files/2024-05/operations-maintenance-roadmap-us-offshore-wind.pdf (last access: 20 January 2026), 2024. a, b
Pelka, K. and Fischer, K.: Field-data-based reliability analysis of power converters in wind turbines: Assessing the effect of explanatory variables, Wind Energy, 26, 310–324, https://doi.org/10.1002/we.2800, 2023. a
Pettas, V., Gräfe, M., Dirik, D. G., Ramaswamy, H. R., Riva, R., Quick, J., and Réthoré, P.-E.: A framework to evaluate structural fatigue accumulation and health metrics of wind farms under different operational strategies, J. Phys. Conf. Ser., 3224, 032079, https://doi.org/10.1088/1742-6596/3224/3/032079, 2026. a
Pfaffel, S., Faulstich, S., and Röhrig, K.: Performance and Reliability of Wind Turbines: A Review, Energies, 10, 1904, https://doi.org/10.3390/en10111904, 2017. a
Pulikollu, R., Haus, L., McLaughlin, J., and Sheng, S.: Wind Turbine Main Bearing Reliability Analysis, Operations, and Maintenance Considerations, Tech. Rep. NREL/TP–5000-90476, National Renewable Energy Laboratory (NREL), Golden, CO, USA, https://research-hub.nlr.gov/en/publications/wind-turbine-main-bearing-reliability-analysis-operations-and-mai/ (last access: 24 August 2026), 2024. a
Pulikollu, R. V., Sheng, S., McLaughlin, J., Fitchett, B., and Han, A.: Wind Turbine Gearbox Reliability Assessment - Value of Increased Reliability and Reduced Operations and Maintenance Costs, Tech. rep., Electric Power Research Institute (EPRI), National Renewable Energy Laboratory (NREL), Machine Building Specialists, https://www.epri.com/research/products/000000003002021422 (last access: 24 August 2026), 2021. a
Pulikollu, R. V., Erdman, W., McLaughlin, J., Alewine, K., Sheng, S., and Bezner, J.: Wind Turbine Generator Reliability Analysis to Reduce Operations and Maintenance (O&M) Costs, Tech. Rep. NREL/TP–5000-86721, National Renewable Energy Laboratory (NREL), Golden, CO, USA, https://doi.org/10.2172/1992825, 2023. a
Reder, M., Gonzalez, E., and Melero, J. J.: Wind Turbine Failures – Tackling current Problems in Failure Data Analysis, Journal of Physics: Conference Series, 753, 072027, https://doi.org/10.1088/1742-6596/753/7/072027, 2016. a, b, c
Reder, M. D.: Reliability Models and Failure Detection Algorithms for Wind Turbines, Ph.D. thesis, Universidad de Zaragoza, Zaragoza, Spain, https://zaguan.unizar.es/record/75399/files/TESIS-2018-066.pdf (last access: 24 August 2026), 2018. a
Requate, N., Meyer, T., and Hofmann, R.: From wind conditions to operational strategy: optimal planning of wind turbine damage progression over its lifetime, Wind Energ. Sci., 8, 1727–1753, https://doi.org/10.5194/wes-8-1727-2023, 2023. a
Scheu, M. N., Kolios, A., Fischer, T., and Brennan, F.: Influence of statistical uncertainty of component reliability estimations on offshore wind farm availability, Reliab. Eng. Syst. Safe, 168, 28–39, https://doi.org/10.1016/j.ress.2017.05.021, 2017. a
Scheu, M. N., Tremps, L., Smolka, U., Kolios, A., and Brennan, F.: A systematic Failure Mode Effects and Criticality Analysis for offshore wind turbine systems towards integrated condition based maintenance strategies, Ocean Eng., 176, 118–133, https://doi.org/10.1016/j.oceaneng.2019.02.048, 2019. a
Shafiee, M. and Sørensen, J. D.: Maintenance optimization and inspection planning of wind energy assets: Models, methods and strategies, Reliab. Eng Syst Safe., 192, 105993, https://doi.org/10.1016/j.ress.2017.10.025, 2019. a
Shields, M., Beiter, P., Nunemaker, J., Cooperman, A., and Duffy, P.: Impacts of turbine and plant upsizing on the levelized cost of energy for offshore wind, Appl. Energ., 298, 117189, https://doi.org/10.1016/j.apenergy.2021.117189, 2021. a
Shields, M., Stefek, J., Oteri, F., Kreider, M., Gill, E., Maniak, S., Gould, R., Malvik, C., Tirone, S., and Hines, E.: A Supply Chain Road Map for Offshore Wind Energy in the United States, Tech. Rep. NREL/TP-5000-84710, National Renewable Energy Laboratory, https://doi.org/10.2172/1922189, 2023. a, b, c, d, e
Siddiqui, M. O., Feja, P. R., Borowski, P., Kyling, H., Nejad, A. R., and Wenske, J.: Wind turbine nacelle testing: State-of-the-art and development trends, Renew. Sust. Energ. Rev., 188, 113767, https://doi.org/10.1016/j.rser.2023.113767, 2023. a
SMARD – German Electricity Market Data: Congestion Management in the Second Quarter of 2024, https://www.smard.de/page/en/topic-article/5892/215186/congestion-management-in-the-second-quarter-of-2024 (last access: 23 December 2025), 2024. a
Strang-Moran, C.: Subsea cable management: Failure trending for offshore wind, Wind Energ. Sci. Discuss. [preprint], https://doi.org/10.5194/wes-2020-56, 2020. a
Stålhane, M., Halvorsen-Weare, E. E., Nonås, L. M., and Pantuso, G.: Optimizing vessel fleet size and mix to support maintenance operations at offshore wind farms, Eur. J. Oper. Res., 276, 495–509, https://doi.org/10.1016/j.ejor.2019.01.023, 2019. a
Tautz-Weinert, J. and Watson, S. J.: Using SCADA data for wind turbine condition monitoring – a review, IET Renew. Power Gen., 11, 382–394, https://doi.org/10.1049/iet-rpg.2016.0248, 2017. a
Tavner, P., Greenwood, D., Whittle, M., Gindele, R., Faulstich, S., and Hahn, B.: Study of weather and location effects on wind turbine failure rates, Wind Energy, 16, 175–187, https://doi.org/10.1002/we.538, 2013. a, b
Thomaßen, G. K., Fuhrmanek, A., Cadenović, R., Pozo Cámara, D., and Vitiello, S.: Redispatch and Congestion Management: Future-Proofing the European Power Market, Tech. Rep. JRC137685, Joint Research Centre, Publications Office of the European Union, Luxembourg, https://doi.org/10.2760/853898, 2024. a
Tselika, K.: The impact of variable renewables on the distribution of hourly electricity prices and their variability: A panel approach, Energy Economics, 113, 106194, https://doi.org/10.1016/j.eneco.2022.106194, 2022. a
Ury, J., Anders, B., Beiter, P., Brown-Saracino, J., and Gilman, P.: Pathways to Commercial Liftoff: Offshore Wind, Tech. rep., US Department of Energy, https://luciatian.com/publications/April-2024-LIFTOFF_DOE_Offshore-Wind-Liftoff-2.pdf (last access: 24 August 2026), 2024. a
US Bureau of Labor Statistics: Producer Price Index by Industry: Other Pressed and Blown Glass and Glassware: Glass Fiber Mat, Textile-Type, Made by Glass Producers, Retrieved from FRED, Federal Reserve Bank of St. Louis, https://fred.stlouisfed.org/series/PCU327212327212B1 (last access: 20 January 2026), 2026a. a
US Bureau of Labor Statistics: Producer Price Index by Industry: Carbon and Graphite Product Manufacturing: Primary Products, Federal Reserve Bank of St. Louis, https://fred.stlouisfed.org/series/PCU335991335991P (last access: 20 January 2026), 2026b. a, b
US Bureau of Labor Statistics: Producer Price Index by Commodity: Metals and Metal Products: Hot Rolled Steel Bars, Plates, and Structural Shapes, Retrieved from FRED, Federal Reserve Bank of St. Louis, https://fred.stlouisfed.org/series/WPU101704 (last access: 20 January 2026), 2026c. a, b
van der Laan, M. P., García-Santiago, O., Sørensen, N. N., Troldborg, N., Criado Risco, J., and Badger, J.: Simulating wake losses of the Danish Energy Island wind farm cluster, J. Phys. Conf. Ser., 2505, 012015, https://doi.org/10.1088/1742-6596/2505/1/012015, 2023. a
van Kuik, G. A. M., Peinke, J., Nijssen, R., Lekou, D., Mann, J., Sørensen, J. N., Ferreira, C., van Wingerden, J. W., Schlipf, D., Gebraad, P., Polinder, H., Abrahamsen, A., van Bussel, G. J. W., Sørensen, J. D., Tavner, P., Bottasso, C. L., Muskulus, M., Matha, D., Lindeboom, H. J., Degraer, S., Kramer, O., Lehnhoff, S., Sonnenschein, M., Sørensen, P. E., Künneke, R. W., Morthorst, P. E., and Skytte, K.: Long-term research challenges in wind energy – a research agenda by the European Academy of Wind Energy, Wind Energ. Sci., 1, 1–39, https://doi.org/10.5194/wes-1-1-2016, 2016. a
Veers, P., Bottasso, C. L., Manuel, L., Naughton, J., Pao, L., Paquette, J., Robertson, A., Robinson, M., Ananthan, S., Barlas, T., Bianchini, A., Bredmose, H., Horcas, S. G., Keller, J., Madsen, H. A., Manwell, J., Moriarty, P., Nolet, S., and Rinker, J.: Grand challenges in the design, manufacture, and operation of future wind turbine systems, Wind Energ. Sci., 8, 1071–1131, https://doi.org/10.5194/wes-8-1071-2023, 2023. a
Vestas Wind Systems A/S: Interim Financial Report – Second Quarter 2024: Company Announcement No. 14/2024, Interim Financial Report Company Announcement No. 14/2024, Vestas Wind Systems A/S, Aarhus, Denmark, https://www.vestas.com/content/dam/vestas-com/global/en/investor/reports-and-presentations/financial/2024/q2-2024/240814_14_Company_Announcement.pdf (last access: 24 August 2026), 2024. a
Walgern, J., Stratmann, N., Horn, M., Then, N. W. Y., Menzel, M., Anderson, F., Kolios, A., and Fischer, K.: Reliability and O&M key performance indicators of onshore and offshore wind turbines based on field-data analysis, Wind Energ. Sci., 11, 1553–1568, https://doi.org/10.5194/wes-11-1553-2026, 2026. a, b, c, d
Wang, S., Vidal, Y., and Pozo, F.: Recent advances in wind turbine condition monitoring using SCADA data: A state-of-the-art review, Reliab. Eng. Syst. Safe., 267, 111838, https://doi.org/10.1016/j.ress.2025.111838, 2026. a, b
Whitby, M. D., Schirmacher, M. R., and Frick, W. F.: The State of the Science on Operational Minimization to Reduce Bat Fatality at Wind Energy Facilities, Tech. rep., Bat Conservation International, Austin, Texas, prepared for the National Renewable Energy Laboratory, https://tethys.pnnl.gov/publications/state-science-operational (last access: 14 September 2026), 2021 a
WindEurope: Where do wind turbine blades go when they are decommissioned?, https://windeurope.org/news/where-do-wind-turbine-blades-go (last access: 9 January 2026), 2025a. a
WindEurope: Offshore wind in Europe in peril, https://windeurope.org/news/offshore-wind-in-europe-in-peril/ (last access: 22 January 2026), 2025b. a
WindEurope: Recommendations for Harmonising Wind Energy Decommissioning Requirements, Position paper, WindEurope, https://windeurope.org/data/products/recommendations-for-harmonising-wind-energy-decommissioning-requirements/ (last access: 21 January 2026), 2025c. a
Wiser, R., Millstein, D., Hoen, B., Bolinger, M., Gorman, W., Rand, J., Barbose, G., Cheyette, A., Darghouth, N., Jeong, S., Kemp, J. M., O'Shaughnessy, E., Paulos, B., and Seel, J.: Land-Based Wind Market Report: 2024 Edition, Technical report, Lawrence Berkeley National Laboratory, https://doi.org/10.2172/2434282, 2024. a
Wiser, R. H., Bolinger, M., Hoen, B., Millstein, D., Rand, J., Barbose, G. L., Darghouth, N. R., Gorman, W., Jeong, S., Mills, A. D., and Paulos, B.: Land-Based Wind Market Report: 2021 Edition, Technical Report OSTI-1818277, Lawrence Berkeley National Laboratory (LBNL), https://doi.org/10.2172/1818277, 2021. a
Yeter, B., Garbatov, Y., and Guedes Soares, C.: Life-extension classification of offshore wind assets using unsupervised machine learning, Reliab. Eng. Syst. Safe., 219, 108229, https://doi.org/10.1016/j.ress.2021.108229, 2022. a
Ziegler, L., Gonzalez, E., Rubert, T., Smolka, U., and Melero, J. J.: Lifetime extension of onshore wind turbines: A review covering Germany, Spain, Denmark, and the UK, Renew. Sust. Energ. Rev., 82, 1261–1271, https://doi.org/10.1016/j.rser.2017.09.100, 2018. a, b
In reality, a wind project is unlikely to achieve a debt rate equal to a risk-free government bond rate. We use this value as a minimum threshold for supply chain risk-driven financing cost impacts on LCOE.
- Abstract
- Introduction
- Methodology
- Risk identification and categorization
- Review and quantification
- Discussion
- Towards integrated risk treatment
- Conclusion
- Appendix A: Supplementary reliability data
- Code availability
- Data availability
- Author contributions
- Competing interests
- Disclaimer
- Acknowledgements
- Financial support
- Review statement
- References
- Abstract
- Introduction
- Methodology
- Risk identification and categorization
- Review and quantification
- Discussion
- Towards integrated risk treatment
- Conclusion
- Appendix A: Supplementary reliability data
- Code availability
- Data availability
- Author contributions
- Competing interests
- Disclaimer
- Acknowledgements
- Financial support
- Review statement
- References