the Creative Commons Attribution 4.0 License.
the Creative Commons Attribution 4.0 License.
 | 05 Feb 2026
Optimizing the operation of energy islands with predictive nonlinear programming – a case study based on the Princess Elisabeth Energy Island
Mario Useche-Arteaga
Pieter Gebraad
Vinicius Lacerda
Marc Cheah-Mane
Oriol Gomis-Bellmunt
The concepts of energy islands or energy hubs have gained attention in Europe as a means to enhance offshore wind integration and regional energy systems. These islands can incorporate high-voltage alternating current (HVAC) and high-voltage direct current (HVDC) transmission systems, battery energy storage systems (BESS), and hydrogen production, requiring advanced operational strategies to manage the inherent nonlinearities and time dependence of their subsystems. To address these challenges, this work proposes a comprehensive framework for the optimal operation of hybrid AC/DC energy islands, addressing (i) active and reactive power dispatch, incorporating BESS and hydrogen production; (ii) a detailed wind resource characterization based on 1 year of hourly data obtained using a realistic wind model with local measurements, including wake losses and turbine-level forecasts, used to define representative seasonal and spatial production patterns that inform typical operating conditions; (iii) operational optimization of a realistic test system based on the Princess Elisabeth Energy Island, and (iv) uncertainty analysis via Monte Carlo simulations, quantifying the impact of wind power and electricity price forecast errors, set up using commercial wind power planning tools and advanced forecasting software, and verified with Pyomo/Python.
- Article
(5541 KB) - Full-text XML
- BibTeX
- EndNote


Offshore regions hold significant potential for wind energy generation, which has led to an accelerated development of offshore wind farms. In this context, the concept of energy islands has emerged as a powerful framework for planning and interconnecting these offshore wind projects. Energy islands offer a promising approach for the creation of a resilient and flexible power system, underpinned by regional interconnections. Their strategic positioning enables the integration of responsive technologies such as energy storage systems and green hydrogen production, which are vital for mitigating challenges often faced by renewable-energy-dominated power grids. These challenges include issues related to voltage and frequency stability, curtailment, and fluctuations caused by the inherent intermittency of renewable energy sources, as well as grid constraints and low system inertia. Furthermore, energy islands offer the flexibility needed to address these challenges, improving the overall reliability and efficiency of power systems that increasingly rely on renewable energy sources. In particular, the study by Teng et al. (2019) proposes a coordinated optimization to improve flexibility within multi-energy systems by integrating hydrogen and energy storage systems, thereby reducing the curtailment of renewable energy in the power grid. The report by Williams and Zhao (2023) emphasizes the role of Power-to-X technologies in the energy transition, positioning energy islands as strategic locations for green hydrogen production while enhancing power grid flexibility through wind-to-hydrogen systems and hydrogen storage, thereby reducing curtailments imposed by grid restrictions. Likewise, Yang et al. (2023) explore a multi-energy system with storage and hydrogen supply, optimizing combined power and hydrogen delivery to enhance energy utilization and reduce curtailment. Finally, the works by Østergaard et al. (2023), Useche-Arteaga et al. (2025), and Lüth et al. (2024) discuss the pivotal role of energy islands in the future of power systems, highlighting their potential as offshore energy hubs that integrate renewable generation, hydrogen production, and energy storage to enhance system flexibility, address grid integration challenges, and support long-term energy transition goals.
The optimal operation of energy islands is crucial for achieving the efficient integration of offshore wind power while ensuring the safe operation of power systems. Since energy islands serve as multi-energy hubs that combine hybrid AC/DC power systems, energy storage, and green hydrogen production, sophisticated coordination strategies are required to ensure their optimal operation. The complexity of the optimal operation of these systems arises from the nonlinear interactions between their subsystems, the fluctuating availability of wind power, and the requirement to comply with fundamental physical and steady-state security constraints, namely the voltage magnitude limits, the thermal loading limits of AC and DC transmission lines, and the power ratings of converters and other power system components. Addressing these complexities requires detailed AC/DC grid models, accurate wind power forecasts, and advanced mathematical programming techniques to optimize performance, security, and cost-effectiveness. Consequently, an optimal operational strategy must achieve three key objectives: coordinate power flows efficiently, ensure safe system operation, and maximize energy utilization. This involves optimizing wind power plant dispatch, defining the set points for HVDC power converters, and strategically managing energy storage and hydrogen production.
The optimization of energy island operations lacks a unified methodology, primarily due to the nonlinear and non-convex nature of the power flow equations in the grid power model. These equations, which contain trigonometric terms, can be represented in polar or complex notation, influencing the choice of optimization approach. The main strategies include linear, convex, and nonlinear methods. Linearization, commonly referred to as DC power flow approximation, simplifies the relationships between voltage magnitudes and angles by neglecting reactive power flows and assuming flat voltage profiles, as presented in Ju et al. (2018). Although computationally very efficient, this approach is inadequate for energy islands because it cannot dispatch reactive power from wind turbines or the battery energy storage system; it does not model voltage magnitude constraints, which are frequently binding in long offshore collector systems, and it systematically underestimates active power losses, since optimal reactive support can reduce resistive losses. In the complex domain, linearization employs Wirtinger's calculus, as power flow equations lack conventional derivatives in complex numbers, as proposed by Garces (2022). Another methodology that has gained significant relevance in power system analysis is convex programming, as it ensures a global optimum and unique solution under well-defined conditions, while also guaranteeing algorithmic convergence, as analyzed by Arteaga et al. (2023). These advantages make convex programming a powerful tool for optimizing energy island operations. On the other hand, despite its high computational burden, nonlinear programming (NLP) allows for precise modeling of voltage–current relationships and active–reactive power interactions, as presented in Useche-Arteaga et al. (2024). Recent advancements in numerical optimization algorithms and high-performance computing have improved NLP's tractability, as explained by Liu et al. (2022), allowing it to explore realistic operational scenarios.
AC-based energy islands, as studied by Useche-Arteaga et al. (2024), have been identified as potentially cost-effective solutions for short- and medium-distance applications through the integration of storage and hydrogen production systems. However, their efficiency significantly declines in long-distance and high-power transmission scenarios due to increased power losses and voltage deviations, as analyzed in Useche-Arteaga et al. (2025). Consequently, recent developments increasingly favor HVDC-based configurations, which offer inherent technical advantages such as reduced losses, enhanced voltage control, and flexible power flow management. Building upon these trends, hybrid AC/DC configurations have been proposed to leverage the benefits of both technologies; however, their operational coordination remains relatively underexplored. To address this gap in existing optimal power flow (OPF) methodologies, specifically the limited ability of current models to represent the operational interactions and requirements characteristic of hybrid AC/DC energy islands, AC/DC OPF frameworks offer a promising foundation for developing more comprehensive and realistic operational strategies. Prior research has demonstrated that OPF formulations can enhance system efficiency, ensure secure operation, and facilitate large-scale renewable energy integration. Addressing this gap, AC/DC OPF methodologies offer a promising framework for improving the performance of hybrid AC/DC grids. Existing studies apply OPF models to improve system efficiency, ensure operational safety, and facilitate renewable energy integration. For instance, Ergun et al. (2019) introduced a convexified and linearized OPF formulation tailored for hybrid AC/DC grids, prioritizing computational tractability without compromising solution accuracy. Similarly, security-constrained OPF (SCOPF) approaches have been developed to enhance grid reliability under contingency scenarios in large-scale hybrid systems, as explained by Mohy-ud-din et al. (2024). The work by Cao and Yan (2016) further incorporates wind farm variability into AC/DC OPF models through iterative methods. Despite these advances, a critical gap persists: current methodologies lack explicit consideration of technologies central to AC/DC energy islands, such as HVDC systems, energy storage, and green hydrogen production. This gap underscores the need for novel operational strategies that holistically address the specific challenges of AC/DC energy islands.
Therefore, this paper proposes a comprehensive framework for the optimal operation of AC/DC energy islands using nonlinear programming, with four key contributions:
-
Development of a detailed optimization model integrating active and reactive power dispatch, incorporating battery energy storage system (BESS) management and hydrogen production, while leveraging the reactive power capabilities of wind power plants, BESS, and HVDC systems to minimize power losses and enhance voltage regulation;
-
Detailed wind resource characterization based on 1 year of hourly data generated using a realistic method with local measurements from the Federal Public Service Economy of Belgium (2024), including wake losses and turbine-level forecasts, to identify representative seasonal and spatial patterns that define typical daily operating conditions;
-
Application of the proposed framework to a realistic test system modeled after the Princess Elisabeth Energy Island, incorporating detailed turbine layout designs for offshore wind power plants;
-
Uncertainty analysis via Monte Carlo simulations to quantify the economic impact of wind power and electricity price forecast errors, enabling robust operational planning under uncertainty.
The remainder of this paper is organized as follows: Sect. 2 introduces strategies for the optimal operation of AC/DC energy islands. Section 3 presents the corresponding mathematical programming models. Section 4 comprises three main components: (i) a description of the test system based on the Princess Elisabeth Energy Island, defined using the Youwind platform; (ii) the hydrogen test system model; and (iii) a methodology for estimating hydrogen production model parameters using a measurement-based optimization framework. Section 5 presents the results of the simulation scenarios to evaluate operational challenges in offshore energy systems, leveraging Youwind's wind power forecasts, performing numerical verifications to assess system performance and the effectiveness of the proposed strategy, and conducting a Monte-Carlo-based uncertainty analysis to quantify the economic impact of wind power and electricity price forecast errors. Finally, Sect. 6 draws conclusions, followed by the references.
Energy islands are designed to integrate multi-energy systems by combining hybrid AC/DC grids, energy storage systems, and Power-to-X technologies, as illustrated in Fig. 1. Their general design typically employs AC technology for the export cables of wind power plants, particularly for short- to medium-distance applications. However, the vast wind energy potential in far offshore areas has driven the development of energy islands toward long-distance transmission systems. Consequently, HVDC technology has become the preferred choice for most energy island projects due to its ability to efficiently transport large-scale power over extended distances, meeting the operational requirements of these systems, as explained by Ansari et al. (2020), Korompili et al. (2016), and Rodrigues et al. (2015).
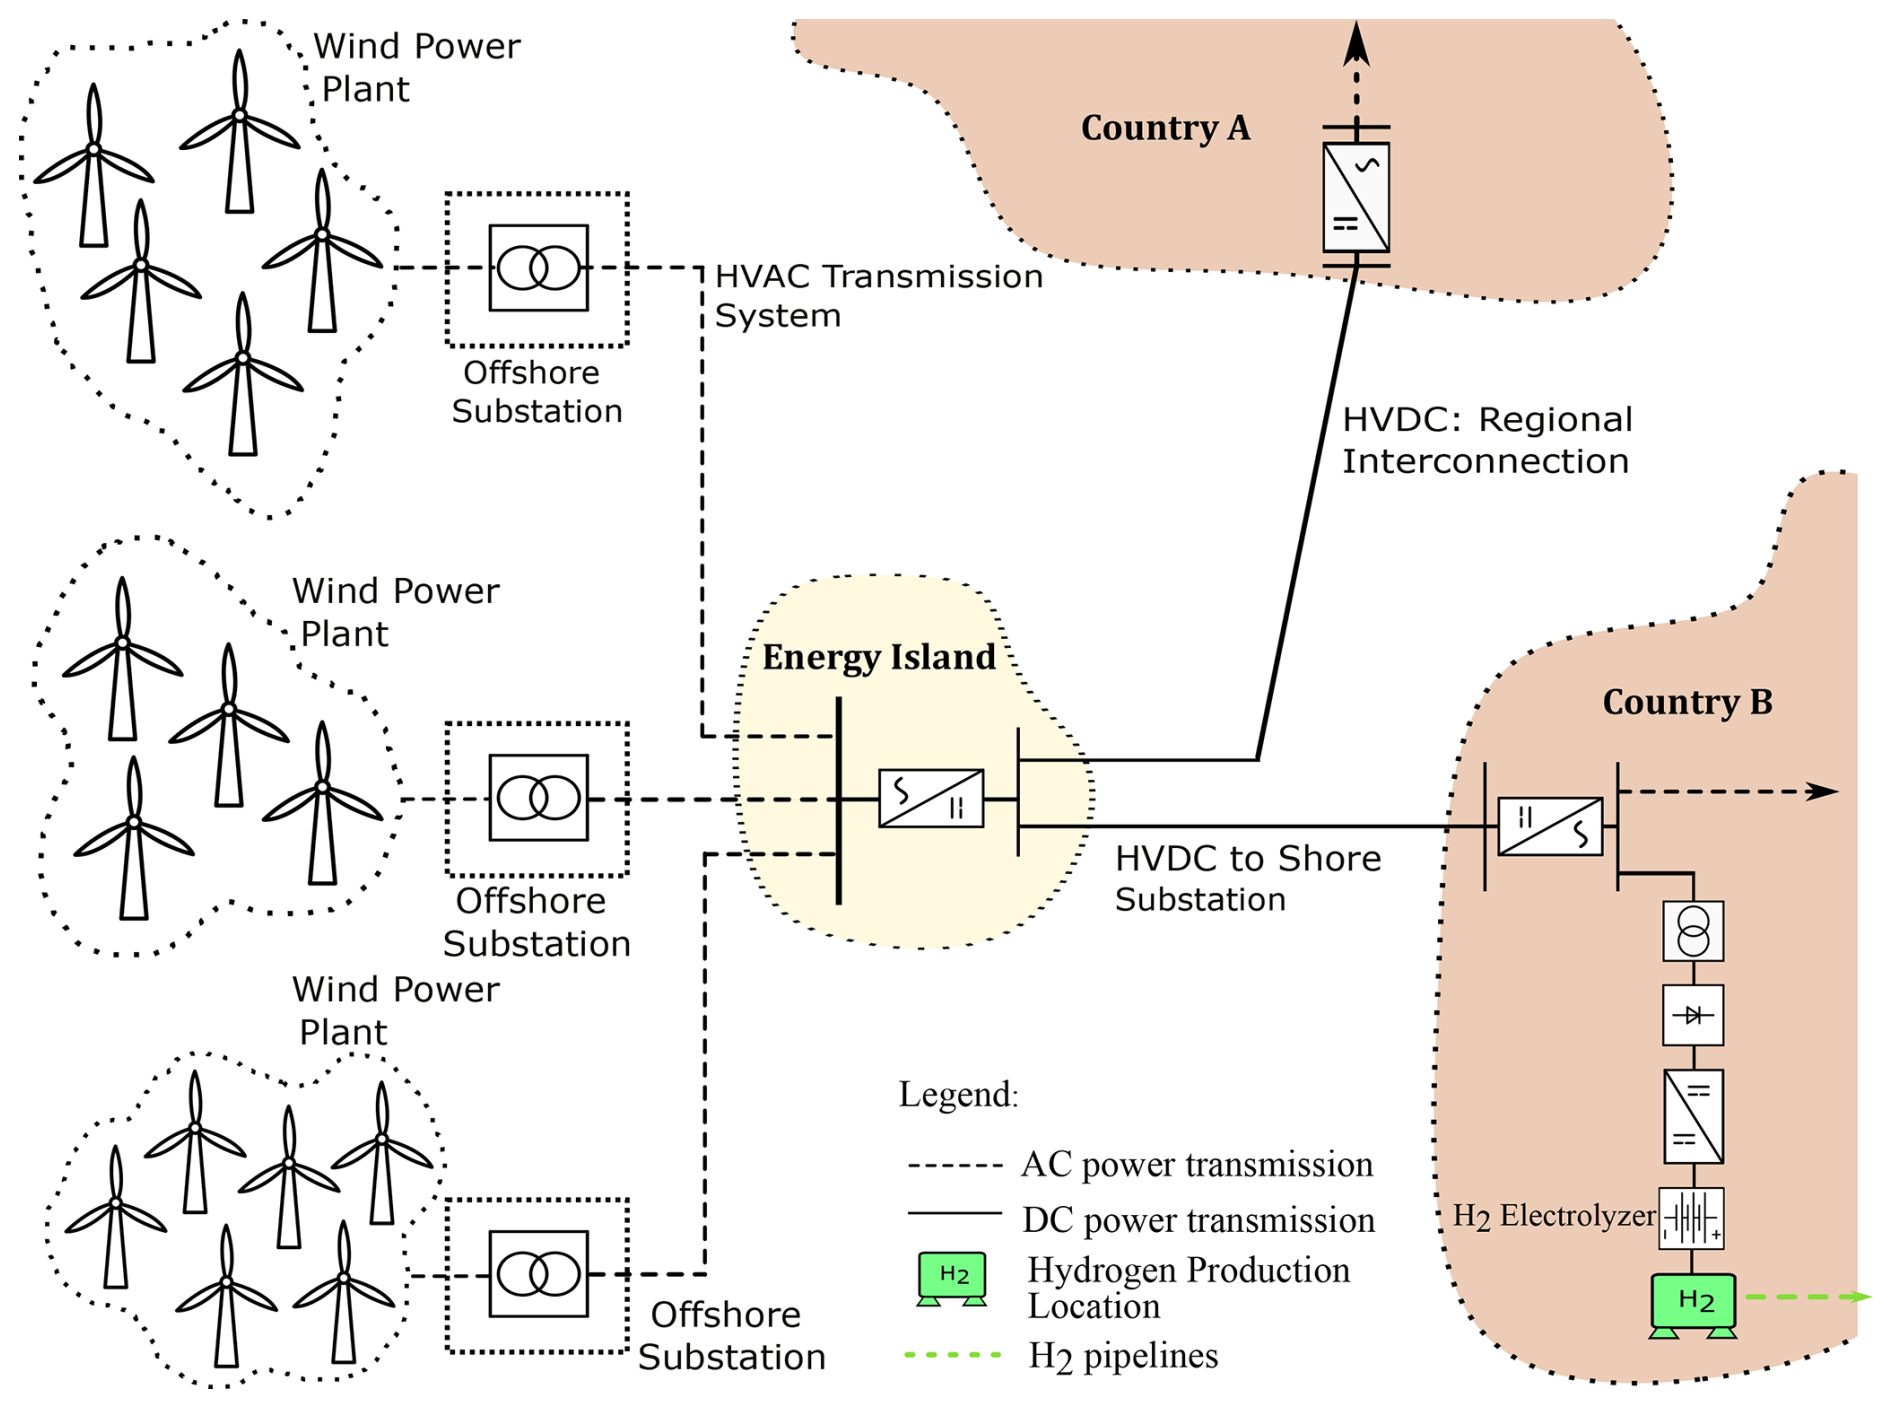
Beyond transmission considerations, energy islands can incorporate flexible infrastructure to enhance system adaptability. For instance, energy storage systems help to mitigate wind power intermittency and grid constraints. Conventional battery energy storage systems (BESSs) with integrated power converters enable both active and reactive power control, reducing curtailments and supporting the reactive power needs of AC energy islands.
In addition to storage solutions, green hydrogen production plays a crucial role in energy islands. Hydrogen's high energy density makes it particularly valuable for energy-intensive industries such as steel, non-ferrous metals, and cement, as outlined by Neuwirth et al. (2022). Furthermore, as technological advancements and economies of scale drive cost reductions, hydrogen is expected to become a key player in the energy transition, as explained in the work by Ueckerdt et al. (2024). Therefore, integrating green hydrogen systems within energy islands will be essential for future power systems.
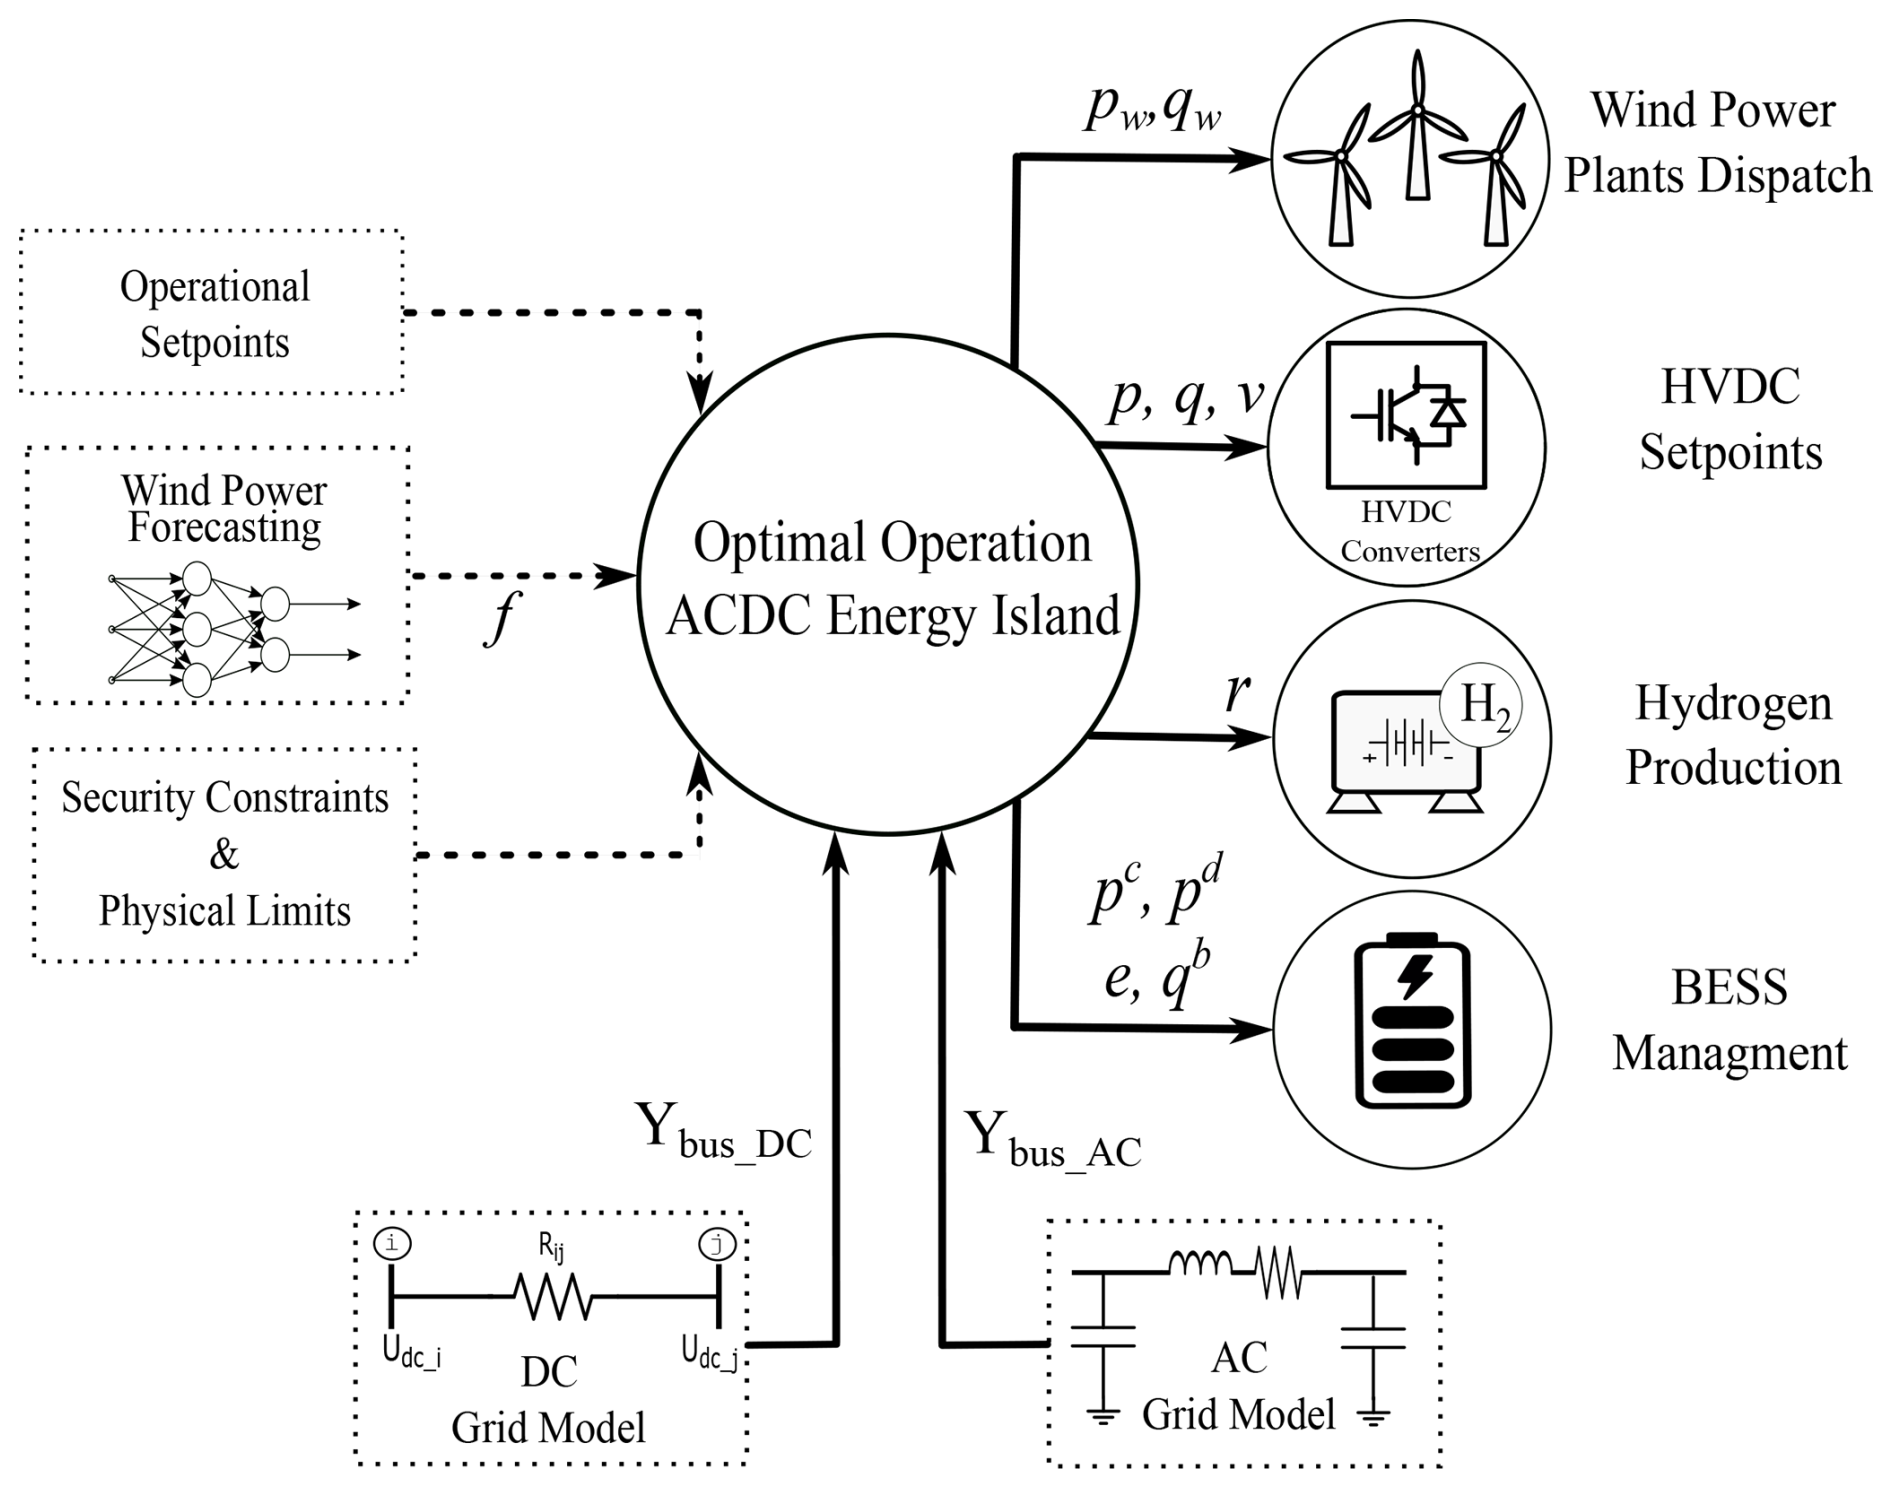
The operational strategy proposed for AC/DC energy islands adopts a centralized approach, where a central controller processes all relevant information to determine the optimal operating configuration, as illustrated in Fig. 2. The inputs to this strategy include: (i) the AC grid model, which represents the topology and electrical parameters of the array and export cables; (ii) the DC grid model, which characterizes the HVDC system connecting the energy island with the main grid; (iii) wind power forecasts for each individual turbine within the offshore wind power plants; and (iv) the physical and security constraints required to ensure safe system operation. These constraints encompass the nodal voltage limits, the thermal ratings of transmission lines, and the operating limits of generators and converters within the electrical infrastructure. Additionally, operational setpoints specified by the transmission system operator (TSO) can be integrated into the energy management scheme to align the island's operation with system-wide requirements.
Based on these inputs, as shown in Fig. 2, the centralized controller determines the optimal operating configuration of the energy island by simultaneously coordinating (i) the active and reactive power dispatch of the wind power plants, (ii) the setpoints of the HVDC converters, (iii) the operation of the hydrogen production system, and (iv) the management of the BESS. This integrated coordination framework ensures secure and efficient operation under varying system conditions. To implement this strategy, this paper proposes a mathematical programming approach, detailed in Sect. 3, which optimally schedules these four subsystems within a unified decision-making model.
This study addresses the operation of AC/DC energy islands using a predictive nonlinear mathematical programming approach. Managing these complex systems requires a structured methodology to optimize decision-making while ensuring technical feasibility. The mathematical formulation of an optimization problem consists of an objective function to be maximized or minimized, subject to a set of constraints. In this context, the objective function represents the operational goals of the energy island, while the constraints ensure adherence to the physical and technical limitations of its subsystems.
The predictive component of the proposed approach is inspired by the principles of model predictive optimization, using forecasts of time-dependent operational variables, such as wind power and generation costs, over a finite horizon to guide steady-state operational decisions. By anticipating grid conditions based on these forecasts, the approach enables proactive adjustments to operation actions, ensuring optimal performance under evolving scenarios. Furthermore, the nonlinear formulation is crucial for maintaining the physical accuracy of AC/DC power flow equations, which inherently exhibit nonlinear characteristics due to the coupling of voltage magnitudes, active power, and reactive power.
This section describes the mathematical programming models for the subsystems of the AC/DC energy island, details the objective function, and presents the complete optimization problem governing its operation. Note that the primary sources of nonlinearity in our model arise from the power flow equations for both AC and DC systems, where the state variables are the voltages. In the AC system, voltages are represented in polar form as V=ν∠θ, where ν denotes the voltage magnitude and θ represents the voltage angle. In the DC system, node voltages are denoted by u. Specifically, the mainly nonlinearities stem from the trigonometric expressions in the AC power flow equations and the model of the HVDC converter station. Furthermore, quadratic terms in the AC and DC power flow equations introduce additional nonlinearities.
3.1 Power grid model
The power grid model ensures the power balance of the energy island and the conditions for the secure operation of the system, as outlined below.
3.1.1 Export and array cables of the wind power plants
The export cables refer to the export and array cables, and the offshore transmission lines that connect the wind power plants to the energy island, typically using AC technology. This subsystem is modeled in the mathematical programming model using the π representation for the AC power lines, while the AC power grid is represented by the AC admittance matrix. As a result, export and array cables of the wind power plants are included in the mathematical programming model through the power balance of the AC system, as follows:
Here, νi,t denotes the magnitude of the bus voltage at node i during period t, while θi,t represents the corresponding voltage phase angle. The parameters gim and bim correspond to the real and the imaginary parts of the imth element of the system's admittance matrix, respectively. Finally, 𝒩ac represents the set of AC nodes in the network, and 𝒯 is the set of periods considered within the analyzed time window.
3.1.2 HVDC grid
The HVDC branch model for steady-state studies, such as the operation problem of energy islands, is represented by a series resistance. This HVDC branch model does not exhibit capacitive or inductive effects, which distinguishes it from HVAC systems. This results in lower power losses, which can be considerable in comparable offshore AC transmission systems. The mathematical programming model of the HVDC grid is presented as follows:
where ui,t represents the DC nodal voltage at node i during period t, denotes the DC admittance of the HVDC branch connecting nodes i and j, and ρ is a constant indicating the polarity of the HVDC branch.
3.1.3 HVDC converter station
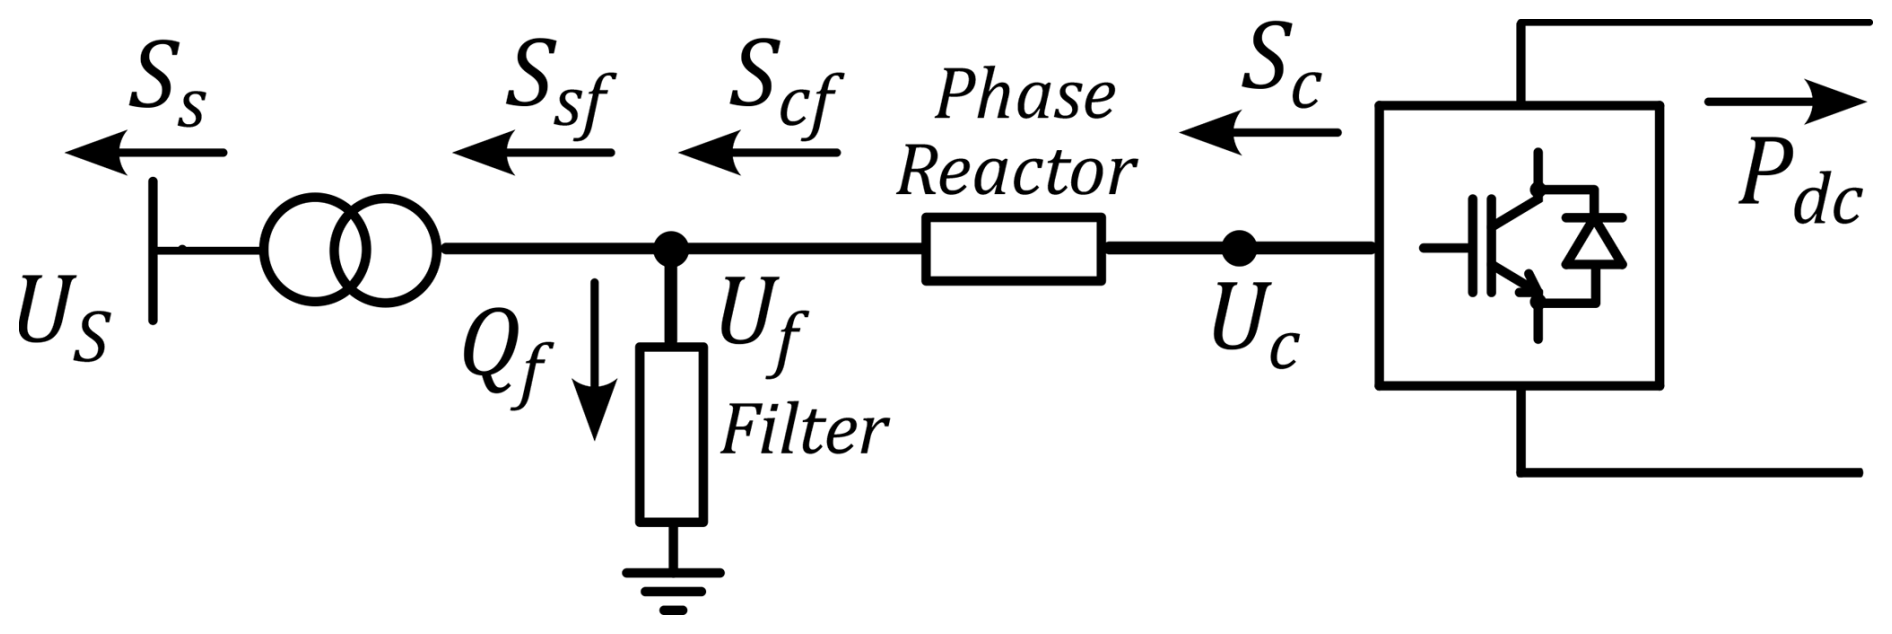
Figure 3 illustrates the general model of a conventional HVDC converter station, which plays a crucial role in facilitating the conversion between AC and DC power. This conversion process is essential for integrating HVDC transmission systems with AC grids. The model includes key components such as the AC filter (which mitigates harmonics and enhances power quality), the phase reactor, and the power transformer.
The AC-to-DC conversion process involves switching operations that contribute to power losses in converters. These losses depend on switching time, as power electronic devices dissipate energy during transitions between on and off states. To account for this, power losses are incorporated into the optimization model through the following constraint, where a, b, and c are loss constants of the HVDC converter station, and Ic represents the converter current, as explained in the work by Valerio et al. (2025). The connection between AC and DC networks is modeled through the following power balance constraints:
where Ploss represents the active power losses in the HVDC converters, modeled as a quadratic function of the converter current Ic, with a, b, and c being loss coefficients. The second equation defines the power withdrawn from the DC grid at node i, where denotes the DC power demand, corresponds to the converter's output power, and accounts for the losses at node i. The set 𝒩dc includes all DC nodes in the system.
The power flow equations for the elements of the HVDC converter station, as depicted in Fig. 3, are given by
Here, Ps and Qs represent the active and reactive power at the grid side, while Pc and Qc correspond to the active and reactive power at the converter side, respectively. The reactive power at the filter, denoted as Qf, depends on the filter susceptance Bf. The power transfer through the transformer is characterized by Psf and Qsf, whereas Pcf and Qcf describe the power flow through the phase reactor. The parameters Gtf and Btf define the transformer conductance and susceptance, respectively, while Gc and Bc account for the phase reactor parameters. The voltage magnitudes and angles at different points of the converter station are given by Us, Uf, and Uc, and δs, δf, and δc, as shown in Fig. 3.
3.2 Security constraints and physical limits
The mathematical programming model for operating energy islands must account for constraints related to both the physical limits of power grid components and operational limits to ensure safe system operation. Specifically, the proposed model includes thermal limits for AC lines (Eqs. 15–16) and HVDC lines (Eqs. 17–18), power limits for converters (Eq. 19), AC nodal voltage bounds (Eq. 20), and DC nodal voltage bounds (Eq. 21).
Here, Eqs. (15) and (16) ensure that the apparent power flow through AC transmission lines does not exceed the thermal limits imposed by their capacity, denoted as . Similarly, Eqs. (17) and (18) enforce the maximum permissible power transfer on DC transmission lines, defined by . The converter operational limits are enforced by Eq. (19), which constrains the apparent power sc,t within the converter's rated capacity . Voltage magnitude constraints for AC and DC nodes are imposed by Eqs. (20) and (21), ensuring that nodal voltages remain within the prescribed operational limits of , and , respectively.
The proposed strategy for AC/DC energy islands includes the active power dispatch of wind farms, constrained by wind power availability. Forecast wind power values are integrated into the model through Eq. (22). Additionally, wind turbines can contribute to reactive power support, which is particularly relevant in offshore AC applications. The proposed approach accounts for this by incorporating reactive power dispatch. This capability is modeled by including the turbine's capability curve, which is approximated by limiting the wind turbine's apparent power to its maximum value, as defined in Eq. (22).
where represents the complex power generated by the wind turbine i at period t, with and denoting its active and reactive power components, respectively. The parameter corresponds to the forecasted available wind power for turbine i at time t, while represents its nominal active power capacity. The variable defines the maximum apparent power output of the wind turbine. The notation ℜ(⋅) extracts the real part of a complex number, and denotes the Euclidean norm.
3.3 Battery energy storage system model
Energy islands could improve flexibility by integrating energy storage systems to manage wind power intermittency, grid constraints, and curtailments. Conventional BESS, equipped with power converters, regulate both active and reactive power, minimizing curtailments while enhancing reactive power support for AC energy islands. The energy storage system is represented by Eqs. (24)–(29), following the linear model in Pozo (2022). This approach determines the BESS energy state using the previous state within the prediction horizon. Charging and discharging losses are incorporated through efficiency rates ηc and ηd. To ensure continuity between time windows, the initial (E0) and final (Ef) energy states are enforced in Eq. (26), ensuring that the energy state of the system is consistent and maintains a seamless transition from one time window to the next. Additionally, BESS power and storage capacity limits are imposed by Eqs. (27)–(29). Here, et represents the state of energy (SoE) of the BESS at period t, while et−1 corresponds to the SoE from the previous period. The variables and denote the charging and discharging power of the BESS at period t, respectively. The parameters emin and emax define the minimum and maximum allowable SoE, while and impose the upper bounds on charging and discharging power.
Similar to wind turbines, BESS can provide reactive power support through the Q-control of their converters, enabling additional grid services. This capability is modeled as a control variable in the optimization framework to meet the reactive power demands of the AC grid. To this end, the converter's capability curve is incorporated by limiting its apparent power to the maximum allowable value, as shown in the following equations:
where the complex power injected or absorbed by the BESS at period t is denoted as , which consists of an active power component and a reactive power component . Additionally, Eq. (31) ensures that the apparent power of the BESS does not exceed its nominal capacity, denoted as .
3.4 Green hydrogen production model
Hydrogen production systems exhibit inherently nonlinear behavior, particularly in electrolyzers, where efficiency depends on factors such as voltage, current density, temperature, and degradation effects. This nonlinearity primarily stems from the electrochemical relationship between electrolyzer voltage and current density, which influences power input and hydrogen output, as explained in the work by Raheli et al. (2023). Common modeling approaches include constant-efficiency, polynomial, piecewise linear, and convex approximations, as discussed by Werner (2023) and Matute et al. (2021). Although constant-efficient models are widely used, such as the works by Useche-Arteaga et al. (2024) and Matute et al. (2021), they have limitations in capturing these nonlinear dynamics. To enhance accuracy, the proposed approach incorporates a linear model, formulated through the following constraints:
where hi,t represents the hydrogen produced at node i during period t. In addition, the model considers the initial cumulative hydrogen state and its final state , which correspond to the hydrogen demand for the analysis period. Finally, represents the demanded power of the electrolyzer, and and denote the parameters of the linear model for the green hydrogen production system.
3.5 Objective function
The objective function of the proposed framework is designed to maximize revenue from offshore wind power generation, reflecting the primary economic driver of hybrid AC/DC energy islands. This focus ensures optimal utilization of renewable energy resources while indirectly minimizing system power losses through efficient active and reactive power dispatch. By optimizing resource allocation within the nonlinear AC/DC power flow model, the framework achieves a reduction in power losses, as demonstrated in Sect. 5.2. Additionally, the model accounts for curtailments through network constraints, with BESS and hydrogen production mitigating potential curtailments by storing or converting excess energy, as detailed in Sect. 5.3. This approach enhances operational efficiency and economic performance while maintaining computational tractability for multi-period and seasonal analyses. The mathematical expression for the revenue maximization objective is as follows:
where Ci,t represents the power price at country i during period t and is the optimization (decision) variable representing the active power delivered to country i in period t within the time window 𝒯.
3.6 Uncertainty modeling in energy island operation
Accurate forecasting of wind power generation and electricity market prices is critical for the optimal operation of AC/DC energy islands. However, forecast errors are inevitable due to the inherent variability of wind and the stochastic nature of electricity markets. Ignoring these uncertainties can lead to suboptimal decisions and potential economic losses. Therefore, it is essential to evaluate the robustness of the proposed optimization framework under realistic conditions that account for forecast inaccuracies.
To this end, a probabilistic power flow (PPF) analysis was performed to assess the impact of uncertainty on the system. A Monte Carlo simulation approach was applied, where multiple realizations of the uncertain input variables – namely, wind power generation and energy prices – were generated according to their probabilistic distributions and used as inputs to the nonlinear optimization model. This methodology enables a systematic evaluation of how variability in forecasts affects the operational performance and economic outcomes of the energy island. The detailed methodology and results of this analysis are presented in Sect. 5.4.
This section evaluates the proposed optimization model through a case study. It introduces the test system based on the Princess Elisabeth Energy Island, defines simulation scenarios to assess offshore operational challenges, and conducts numerical verifications to analyze system performance and strategy effectiveness.
4.1 Test system definition: setup based on the Princess Elisabeth Energy Island
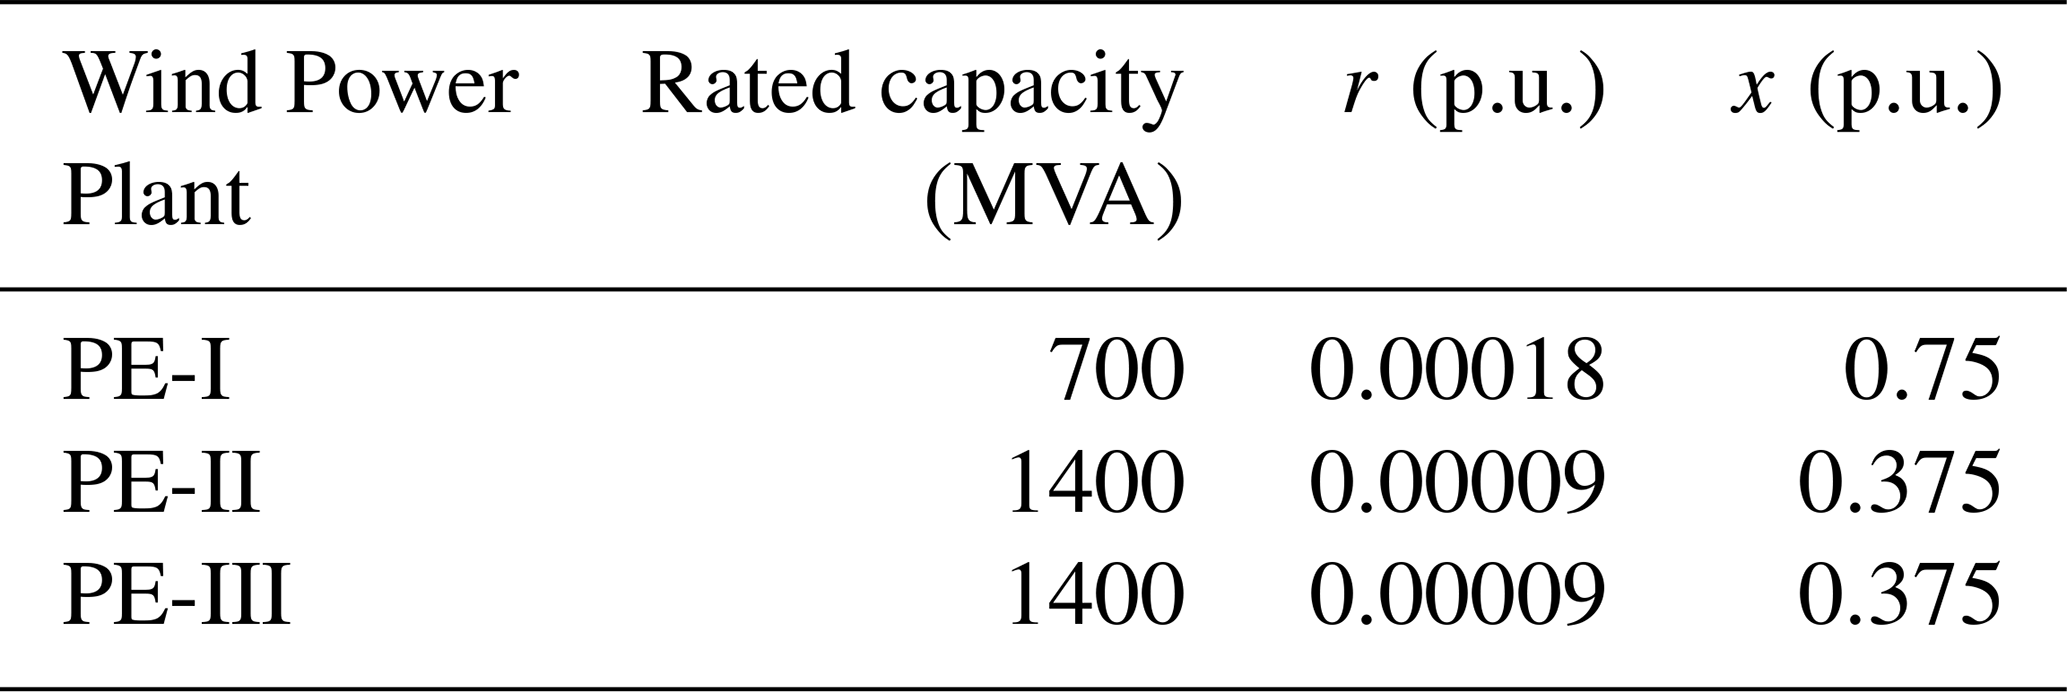
The Princess Elisabeth Energy Island is planned for construction by the Belgian Transmission System Operator (TSO) Elia in the Belgian sector of the North Sea, approximately 45 km offshore, as described in Williams and Zhao (2023), Viaene et al. (2022), and Van der Straeten (2022), and illustrated in Fig. 4. The energy island is designed to integrate three future offshore wind power plants: a 700 MW installation (PE-I), expected to be operational by 2028, and two additional wind power plants (PE-II and PE-III), each with a capacity of up to 1400 MW, planned for 2029, as shown in Fig. 5a.
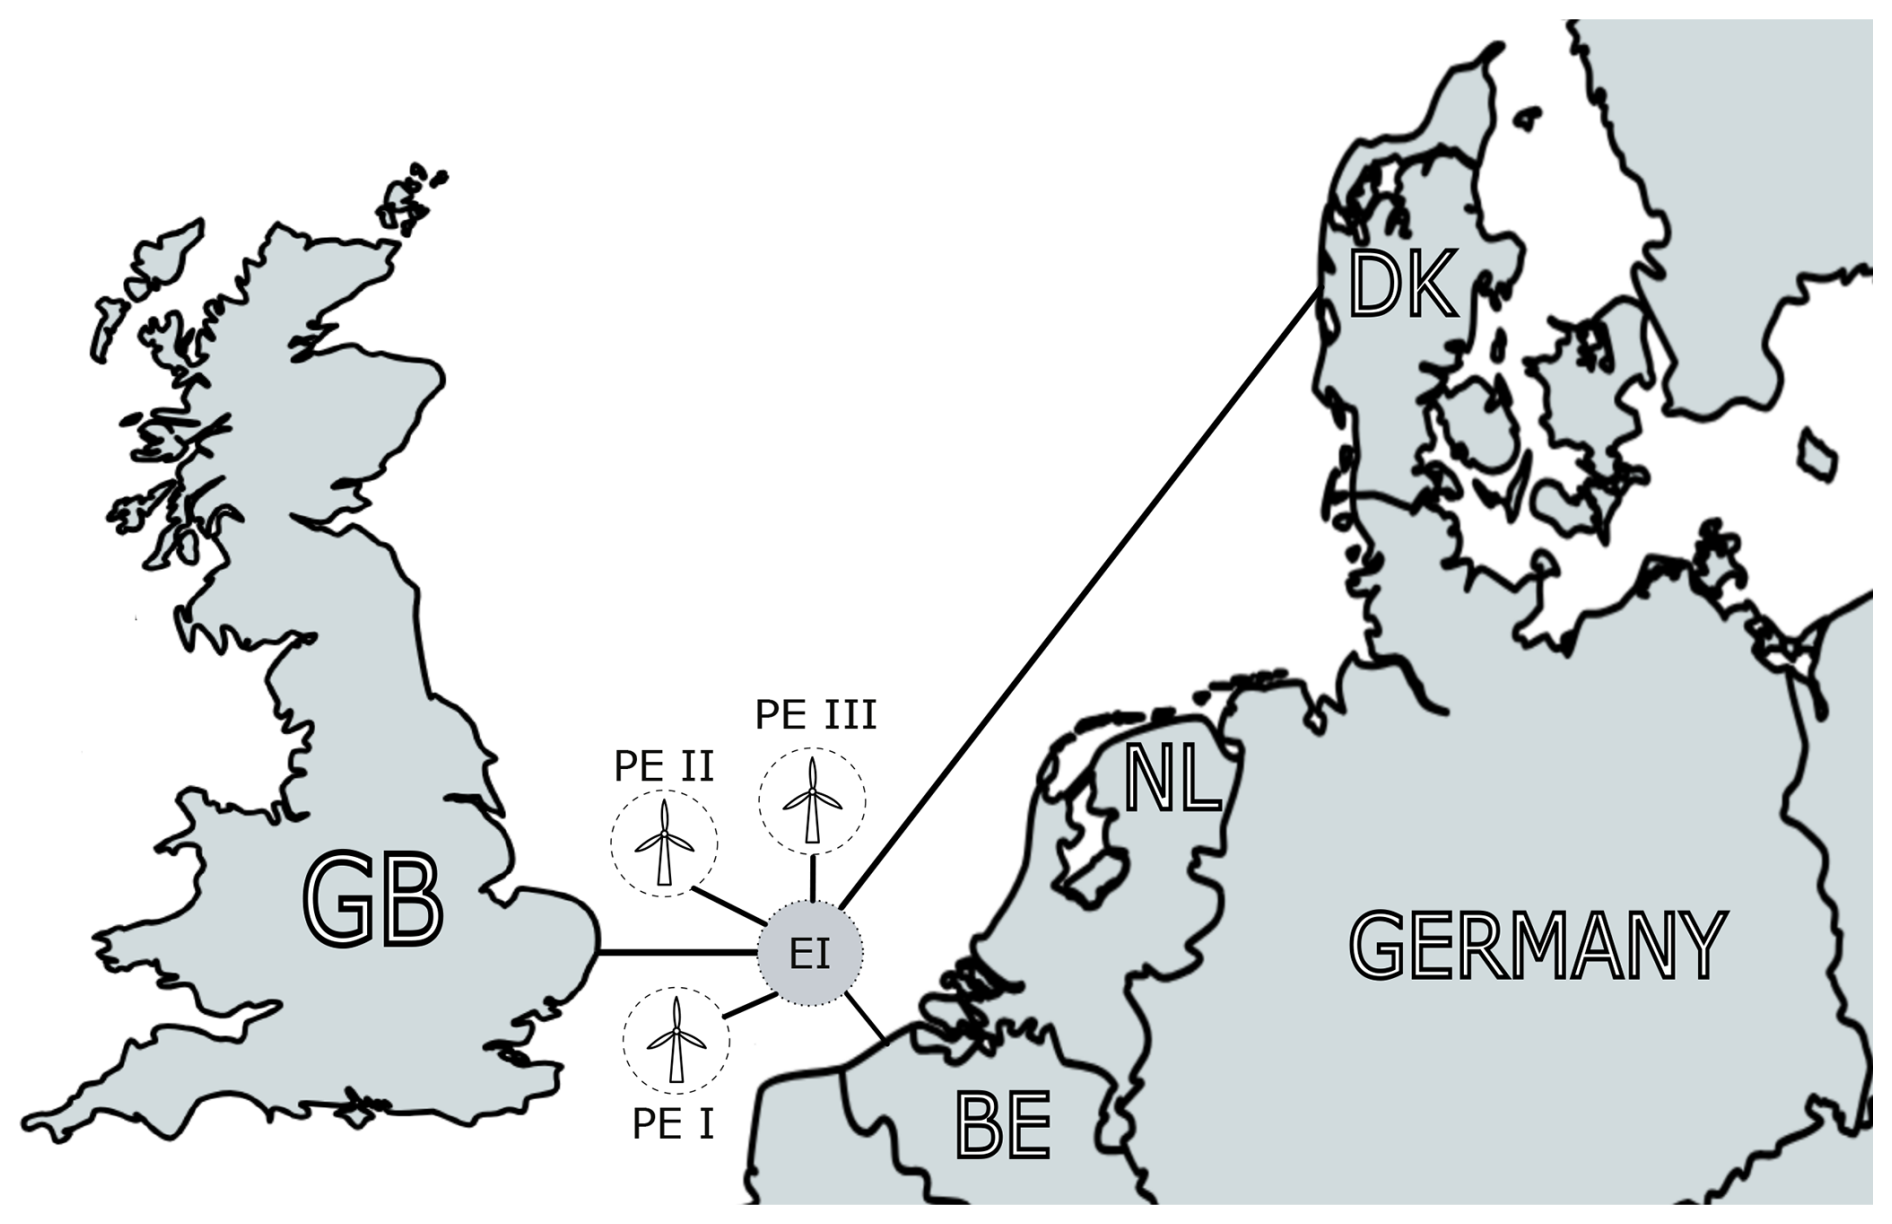
Figure 4Test system based on the Princess Elisabeth Energy Island.
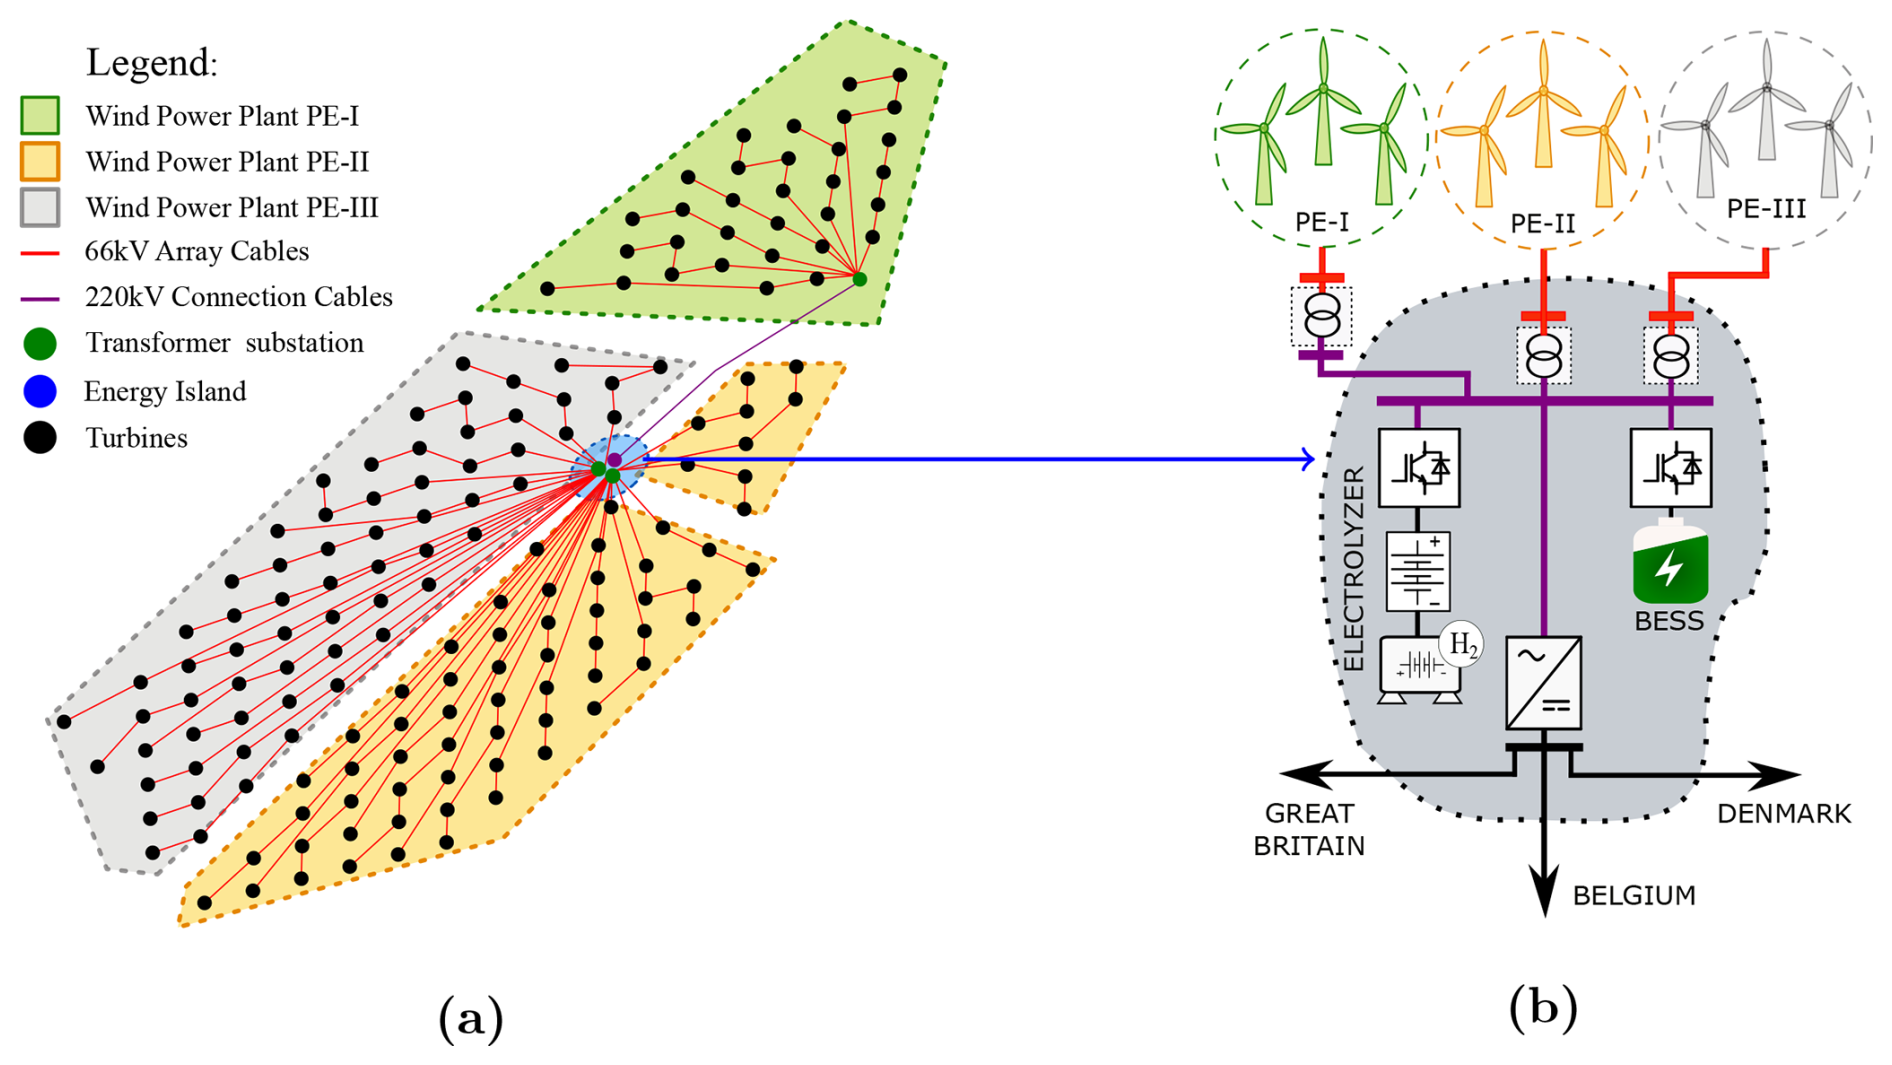
Figure 5AC/DC energy island and grid layout configurations. (a) Array cable layout of wind power plants PE-I, PE-II, and PE-III. (b) Topology of the AC/DC energy island with BESS and hydrogen production.
The infrastructure will incorporate both AC and DC technologies, where AC cables will be used for wind farm collection, while high-voltage direct current (HVDC) connections will facilitate interconnections. The HVDC links with Denmark and Great Britain are scheduled for commissioning in the future. While some elements, including the full 3.5 GW capacity and the hybrid interconnector with the UK, may be postponed or scaled back (Elia Group, 2025), the core construction of the island and HVAC infrastructure for the initial 2.1 GW offshore wind connection continues uninterrupted. Given that these wind farms are yet to be developed, this study defines and simulates their turbine position layout within the designated areas, employing commercially available tools from Youwind (2025). Assuming full capacity utilization, the layout is designed using the IEA-22 MW reference wind turbine defined in Zahle et al. (2024), applying a staggered grid arrangement with optimized row orientation and spacing for the local wind rose to minimize wake losses, as shown in Fig. 5a. Wind power plant PE-I contains 32 turbines, while wind power plants PE-II and PE-III contain 64 turbines.
The system includes a green hydrogen production unit and a battery energy storage system to utilize surplus wind energy for industrial decarbonization. Hydrogen is expected to play a critical role in decarbonizing hard-to-abate sectors, such as steelmaking, ammonia production, and heavy transport, due to its high energy density and versatility, as highlighted by the International Energy Agency (2021) and the European Commission (2020). Given the current absence of a mature hydrogen market, a fixed daily hydrogen production quota is assumed to represent anticipated demand, reflecting policy-driven or contractual obligations to supply industrial end-users. For downstream logistics, hydrogen is transported offshore via marine carriers rather than pipelines, motivated by: (i) geographical flexibility, enabling delivery to multiple European ports, aligning with the cross-border hydrogen economy vision European Commission (2020); (ii) operational flexibility, allowing production during high wind generation periods to reduce curtailment; and (iii) infrastructure scalability, avoiding large upfront investments in dedicated pipelines while offering a modular solution for future hydrogen value chains.
Table 1Technical parameters of BESS, green hydrogen production, and HVDC connections.
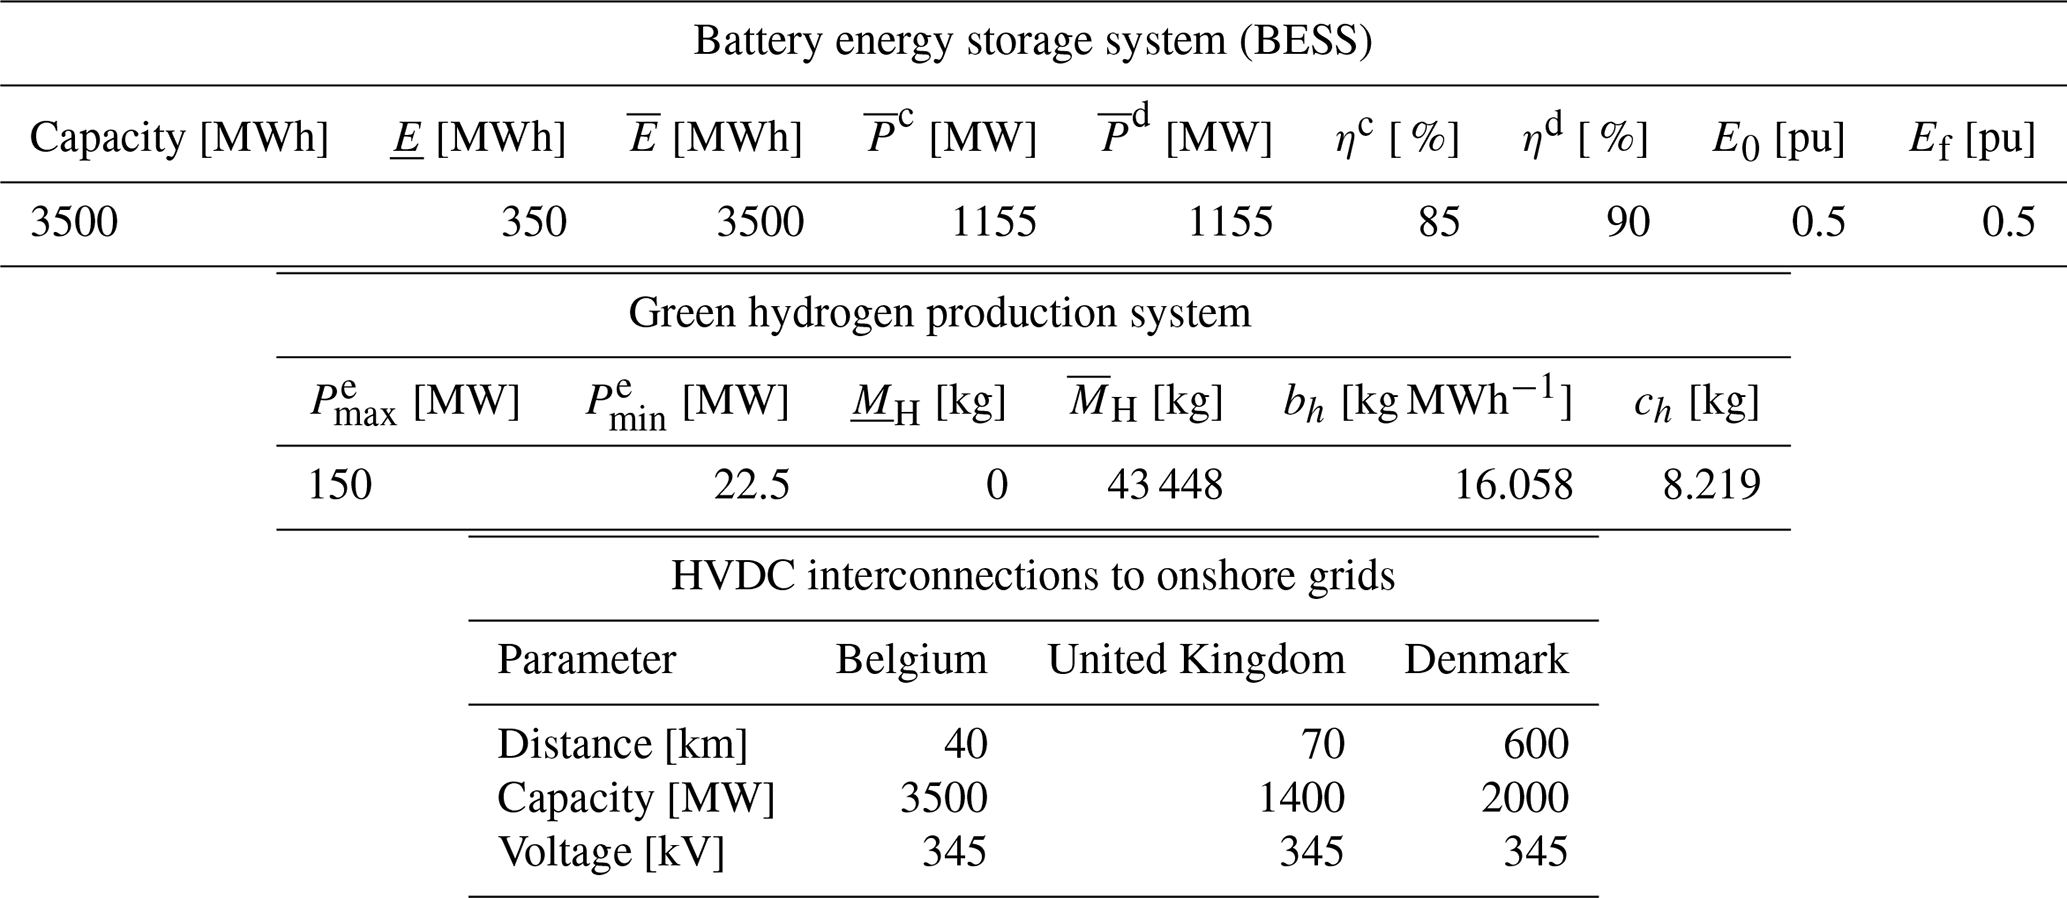
To support the analysis, Fig. 5b presents the single-line diagram of the test system, conceptually based on the Princess Elisabeth Energy Island. The diagram illustrates the topological structure, including offshore wind farms, internal AC collection systems, HVDC converters, storage options, and export transmission links to multiple regions. This configuration serves as the foundation for simulation scenarios used to verify the proposed optimization framework. The main technical parameters are summarized in Table 1, including the parameters of the BESS, which are based on the study by Pozo (2022), and the parameters of the green hydrogen system, calculated as explained in Sect. 4.2 and 4.3.
4.2 Hydrogen production system: electrolyzer model description
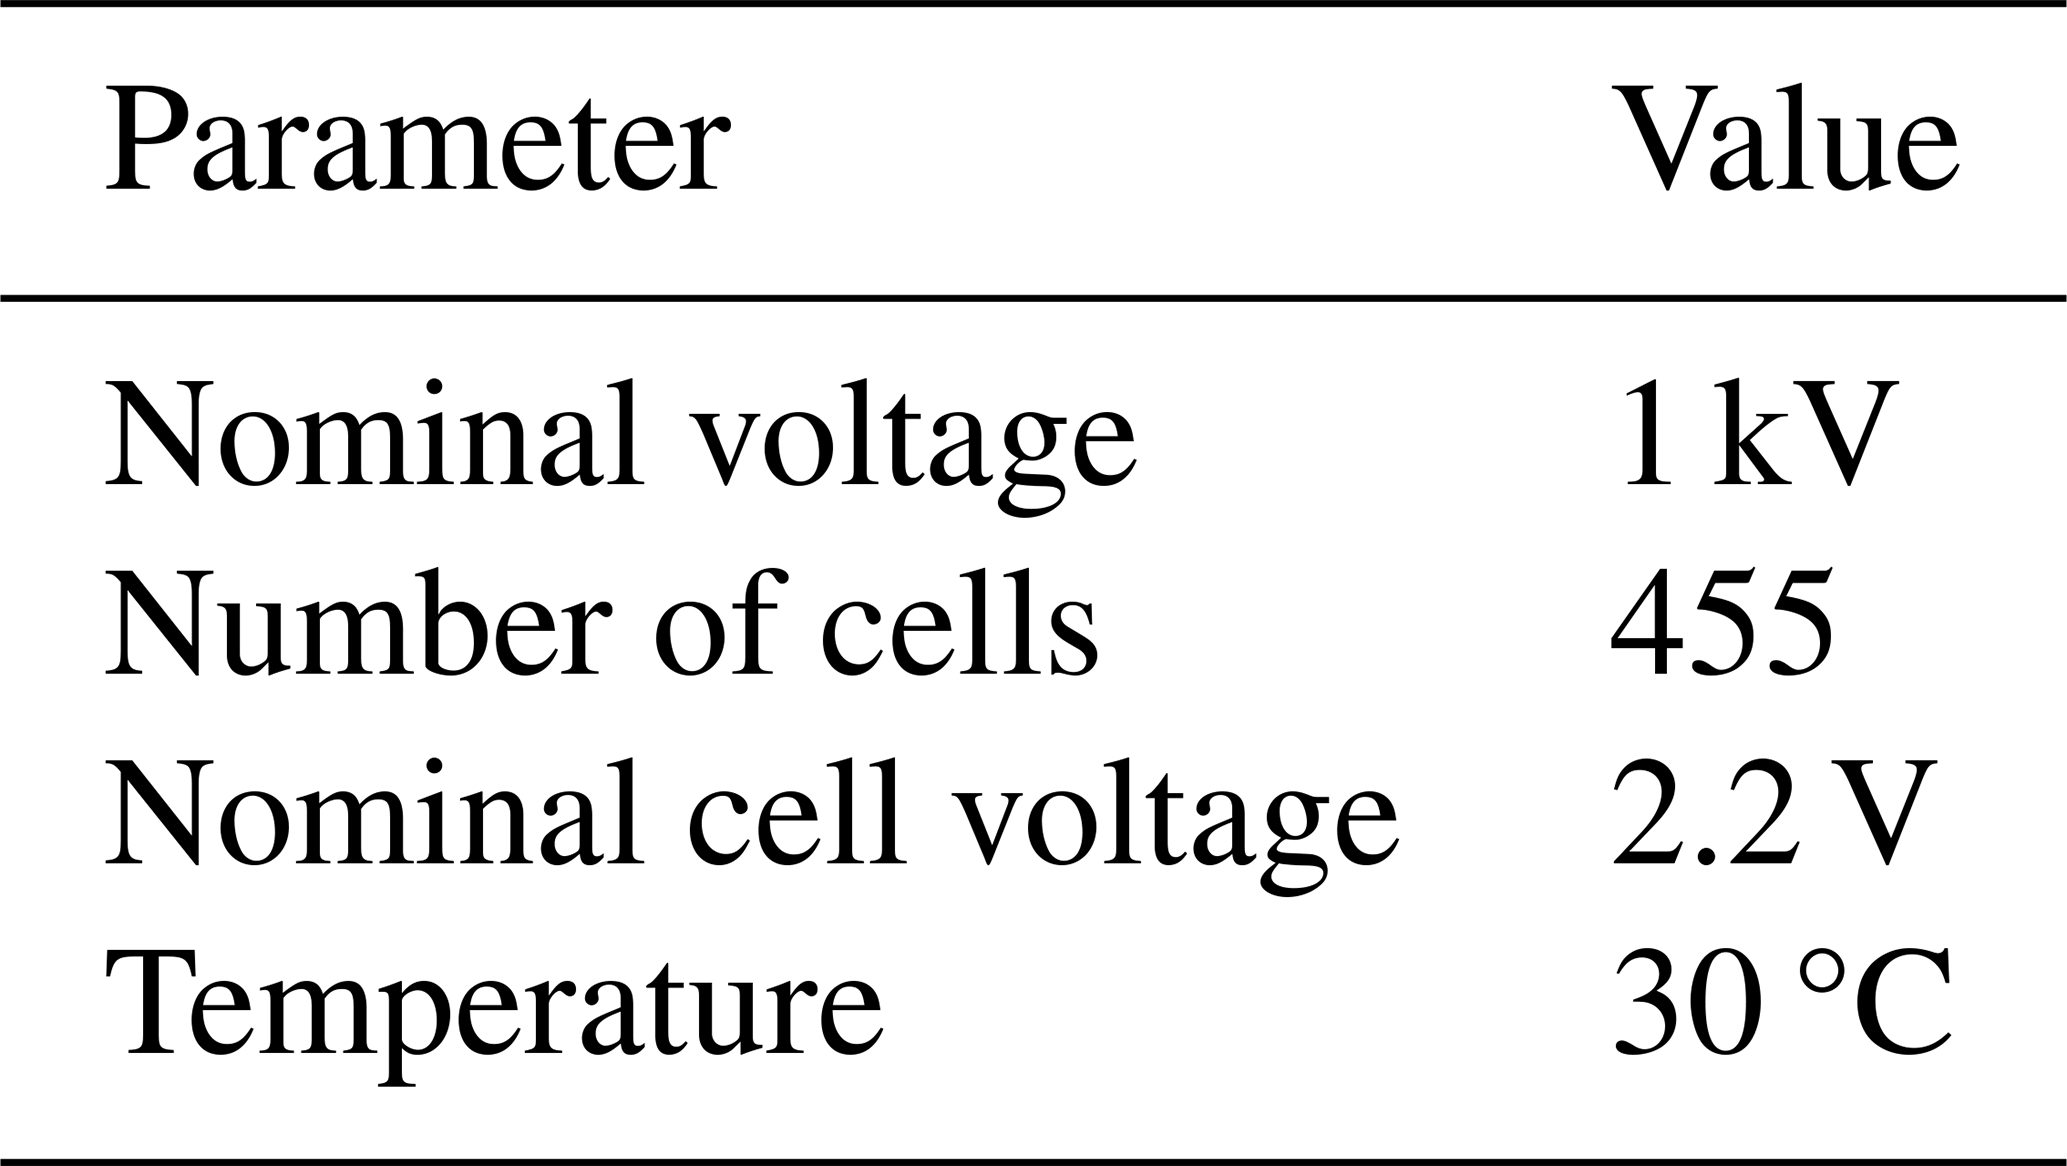
The hydrogen production system in this study was modeled in more detail and implemented in MATLAB Simulink, from which measurements were obtained to identify the parameters of a linear hydrogen production model, considering both the electrical and downstream components of an electrolyzer. The electrical model is based on a voltage–current characteristic, using an empirical formula with approximated parameters for alkaline electrolyzers from Ulleberg (2003). The downstream model links the electrolyzer current to the hydrogen production rate via chemical coefficients and Faraday efficiency, following the equations and parameters from Dozein et al. (2023). The electrolyzer stack is modeled as a series connection of cells, introducing nonlinearity between consumed power and hydrogen production due to the voltage–current characteristic and Faraday efficiency effects at low current levels. Additionally, the measurements are taken on the DC side, excluding power supply losses. Finally, the parameters used for the measurements are detailed in Table 2.
4.3 Measurement-based optimization for estimating green hydrogen production models
A significant challenge in modeling hydrogen production systems is accurately estimating the parameters of the model presented in the Sect. 3.4. This section presents a methodology for estimating the parameters of the green hydrogen production model through an optimization approach. Accordingly, the following optimization problem is proposed:
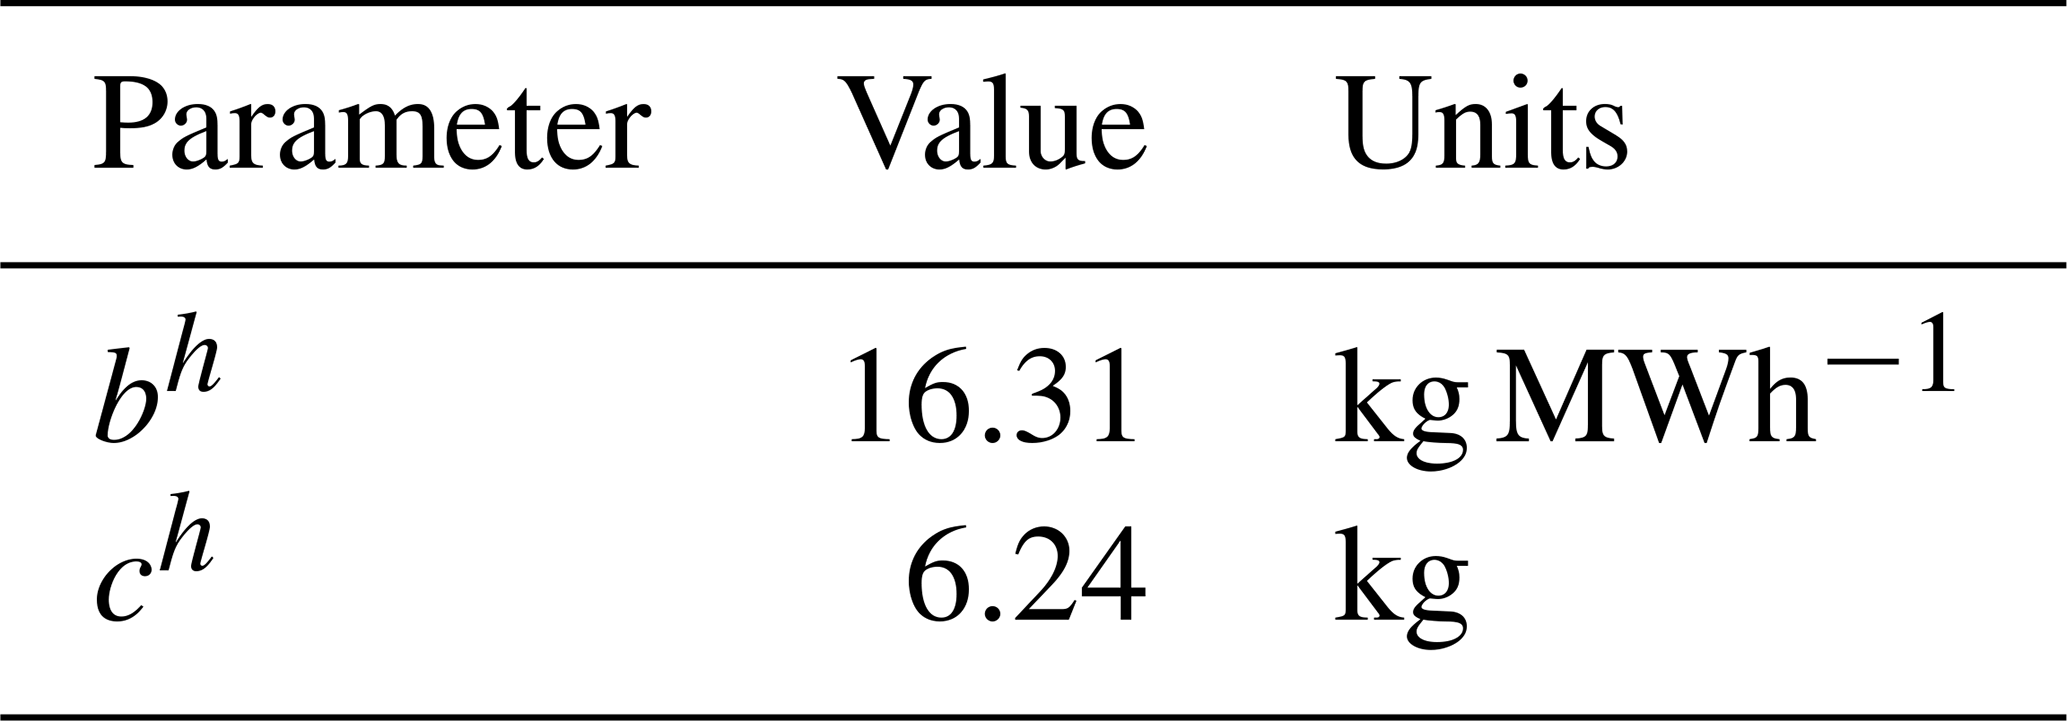
where is the measurement of the hydrogen produced with the power , hk is the hydrogen production estimation based on the linear model presented in Eqs. (32)–(35), and bh and ch are the parameters estimated by the optimization problem presented in Eq. (38). Similarly, the parameter of the constant-efficiency model is estimated using the problem model presented in Eq. (38), with ch=0.
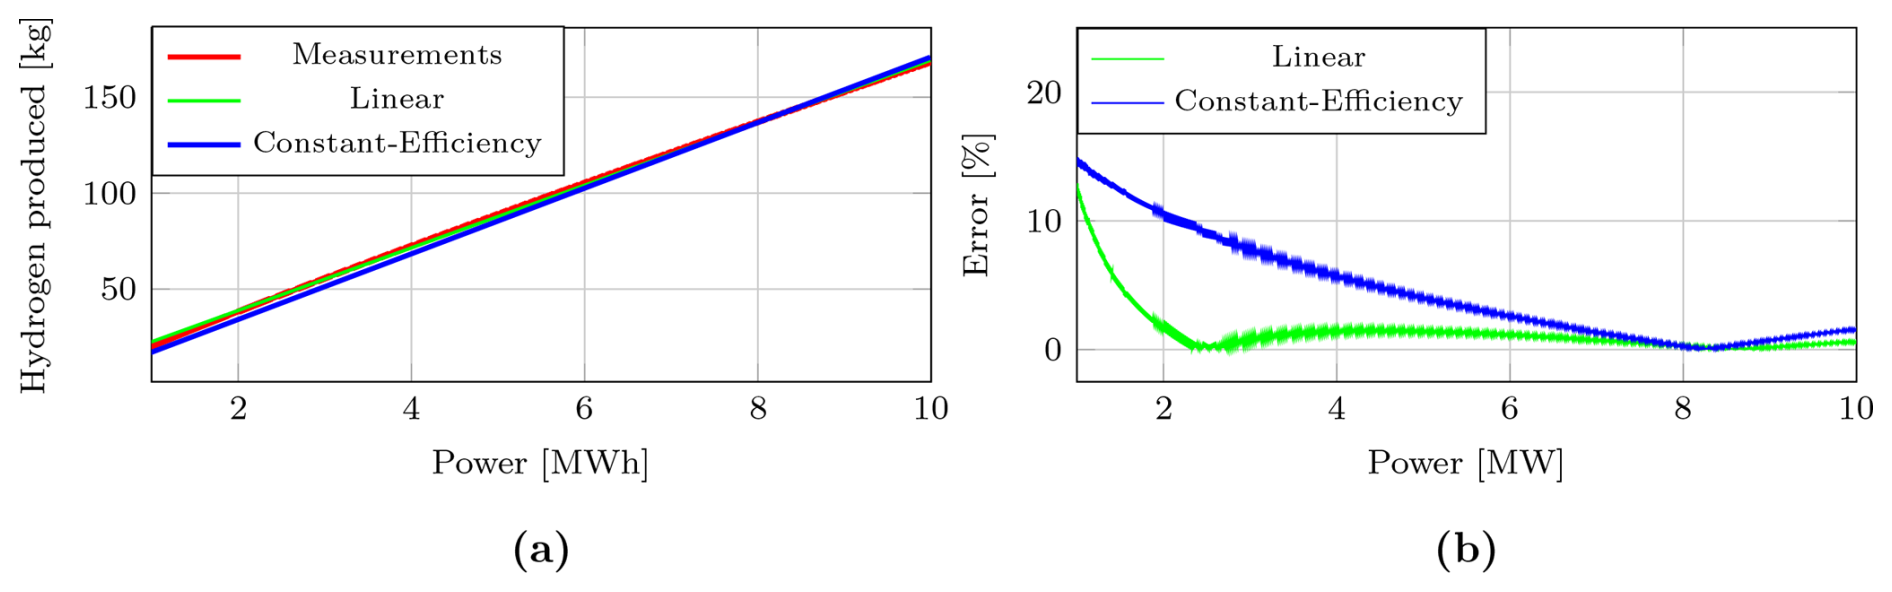
Figure 6Results of the hydrogen production system modeling. (a) Estimation of the hydrogen production system. (b) Error of the linear and constant-efficiency models.
The estimated parameters of the linear model for the hydrogen system are presented in Table 3. Figure 6a illustrates the estimation performance of the hydrogen production system using both constant-efficiency and linear models, identified against the measured data. The associated modeling errors are presented in Fig. 6b. The linear model achieves a maximum error of approximately 12.91 %, with an average and median error of 1.20 % and 0.69 %, respectively. In comparison, the constant-efficiency model exhibits a higher maximum error of 14.95 %, along with an average and median error of 3.98 % and 2.08 %. These results clearly indicate the improved accuracy of the linear approach. In particular, the significantly lower mean and median errors of the linear model reflect its enhanced robustness and sensitivity in capturing variations in the input power to the hydrogen electrolyzer, making it more suitable for dynamic operational conditions.
Table 3Estimated parameters of the linear model for the hydrogen system.
As observed in Fig. 6b, the largest discrepancies in hydrogen production estimation occur when the electrolyzer operates at low power levels. However, as shown in Fig. 15 in Sect. 5.2, the hydrogen production system operates most of the time close to its nominal capacity across different seasons. Consequently, the practical impact of estimation errors at low power levels is limited, as the system predominantly operates at levels where the linear model demonstrates high accuracy.
5.1 Wind power profile analysis of the Princess Elisabeth Energy Island
This section analyzes the wind power profiles of the three offshore wind power plants integrated into the Princess Elisabeth Energy Island. The objective is to characterize both seasonal and spatial patterns in the available power, based on hourly production data over a full year. The production data were generated by a simulation of the wind parks with wake losses in the Youwind platform with the Niels Otto Jensen wake model (Katic et al., 1987; Youwind, 2025), using wind speed and direction time series provided by the Federal Public Service Economy of Belgium (2024), which are based on LiDAR measurements at the PE sites. These patterns are used to identify representative daily profiles for each season, which are later used to define typical operating conditions in the optimization framework. The analysis includes the statistical distribution of daily average power, representative daily curves, and turbine-level power output for a representative day.
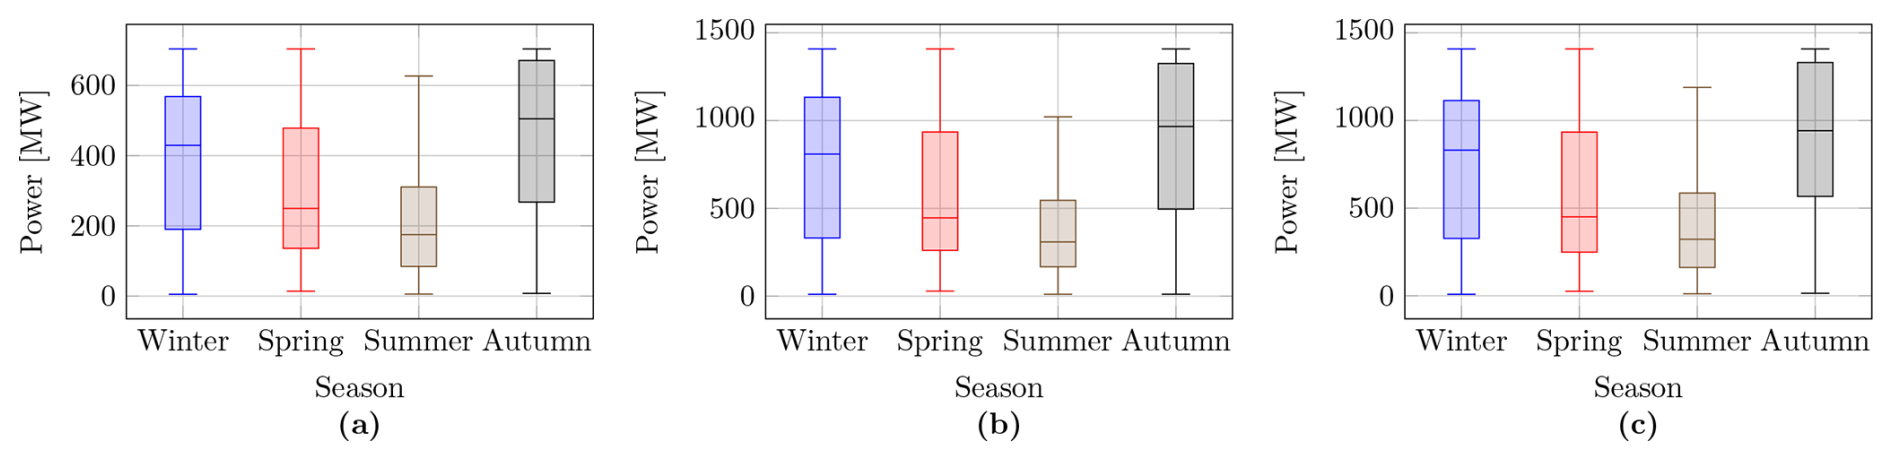
Figure 7Seasonal distribution of average daily power for the three wind power plants over a year: (a) PE-I, (b) PE-II, and (c) PE-III.
Figure 7 shows the seasonal distribution of average daily power for each of the three wind power plants. The boxplots summarize the statistical variability of the available power across the four seasons, based on daily average values. The central line indicates the median, the box spans the interquartile range (25th to 75th percentiles), and whiskers extend to 1.5 times the interquartile range. Autumn shows the highest median daily power across all wind power plants, while summer consistently presents the lowest. Spring and winter exhibit intermediate values, with winter showing greater variability. Rather than using a full year of data, we demonstrate the optimization on representative days for each season, to keep the calculation time for the study limited, while still capturing the key seasonal characteristics of offshore wind variability. Based on these analyses, we obtained turbine-level power forecasts, which constitute one of the key inputs for implementing the proposed optimization approach.
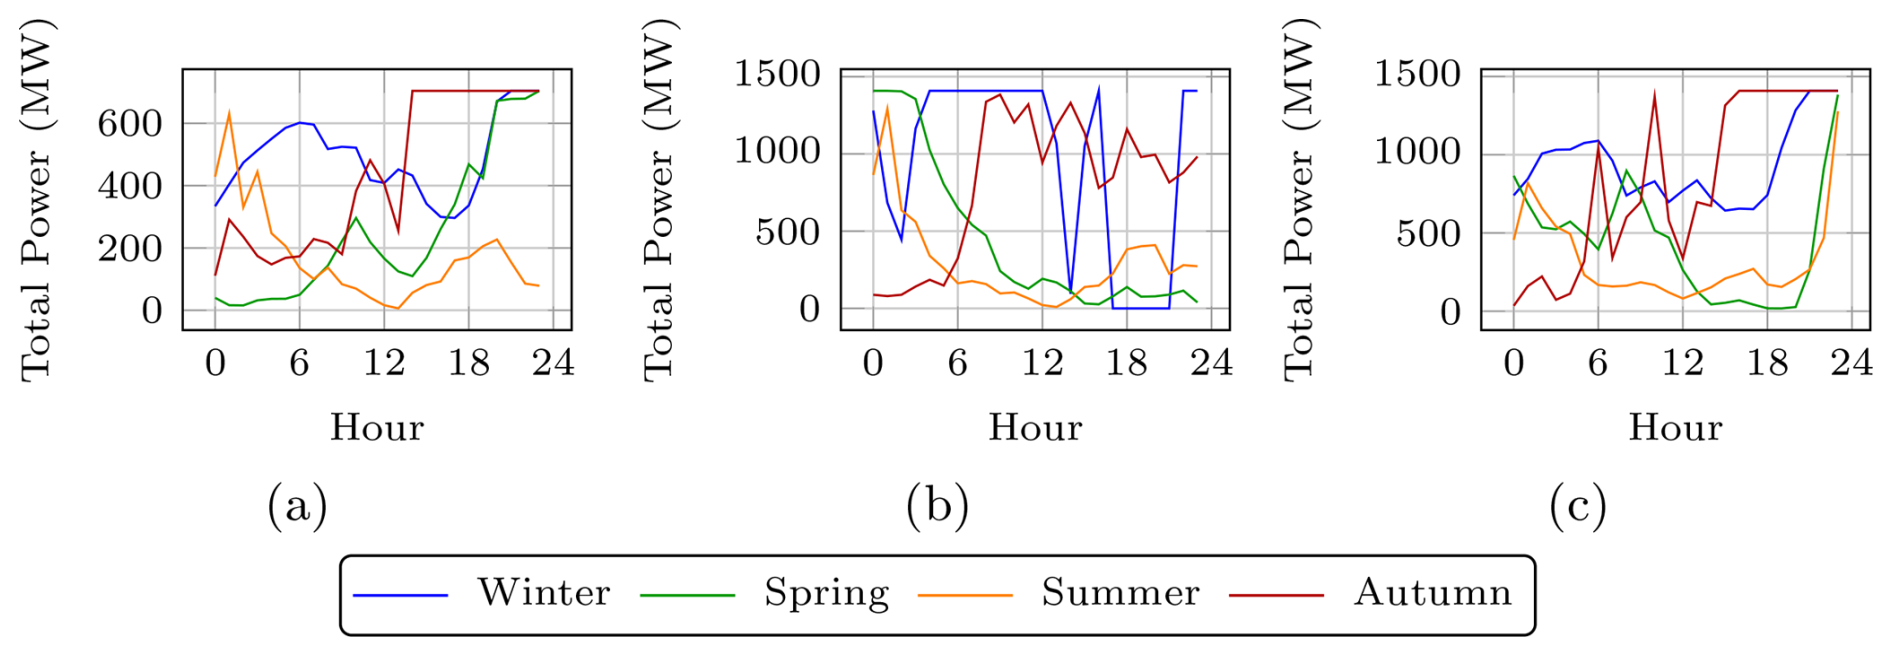
Figure 8Seasonal representative daily profiles of hourly power generation for the three wind power plants: (a) PE-I, (b) PE-II, and (c) PE-III.
Figure 8 shows the representative daily time series of hourly wind power generation for each wind power plant: (a) PE-I, (b) PE-II, and (c) PE-III. For each season, a representative day was selected by identifying the daily profile whose average total power was closest to the seasonal median. The curves reflect typical intraday generation behavior under seasonal wind conditions. These profiles provide seasonally realistic input scenarios for the operation of the hybrid energy island.
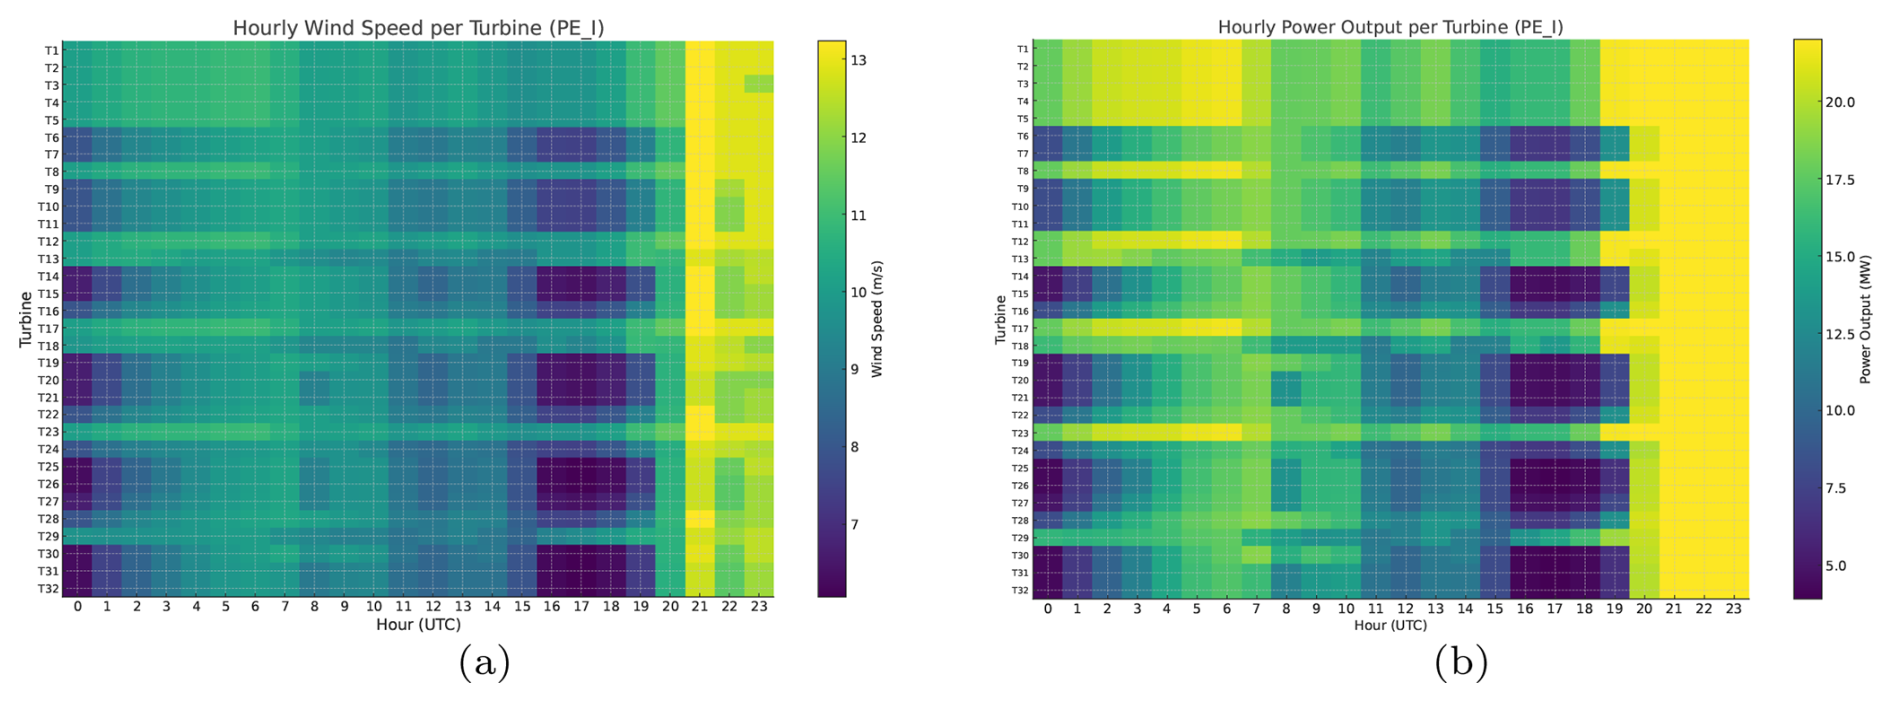
Figure 9Hourly turbine-level wind speed and power output in PE-I on a representative winter day, illustrating spatial variability and wake effects across the wind power plant. (a) Wind speed per turbine. (b) Power output per turbine.
Finally, Fig. 9 shows the hourly wind speed and power output per turbine in PE-I for the representative winter day. The plot illustrates the spatial variability in turbine performance over the course of a day, influenced by wake effects and wind direction, and highlights the importance of considering spatial resolution in wind power modeling.
5.2 Energy management and optimization for representative days on the Princess Elisabeth Energy Island
In this subsection, we evaluate the performance of the optimal operation strategies proposed for the Princess Elisabeth Energy Island, focusing on representative days that capture typical seasonal variations in wind power availability and electricity prices. The nonlinear mathematical programming model, developed in Sect. 3, is implemented using the Python-based optimization modeling library Pyomo, as described by Bynum et al. (2021) and solved with the IPOPT solver, developed by Wächter and Biegler (2006). It employs a primal-dual interior-point algorithm with a filter line-search method to efficiently handle the nonlinearities inherent in the system.
However, before proceeding with the multi-period and seasonal analyses, a preliminary verification of the proposed optimization approach was conducted to ensure its reliability under nominal operating conditions. Specifically, a cross-check was performed using the Python-based power flow tool pyflow_acdc, developed by Valerio et al. (2025). pyflow_acdc is an open-source library designed for power flow and optimal power flow (OPF) studies in hybrid AC/DC networks. However, it does not support the modeling of energy storage systems or green hydrogen production units, which are essential for the comprehensive operation of energy islands. Therefore, the verification was limited to a simplified case excluding BESS and hydrogen production. The comparison shows that both approaches yield very similar results, with the proposed method achieving a 1.5 % improvement in the objective function value compared to pyflow_acdc, thereby confirming the accuracy and robustness of the proposed optimization framework.
After verifying the proposed approach, the analysis focuses on the representative days selected to characterize the seasonal operation of the energy island. Figure 8 illustrates the seasonal representative daily profiles of hourly power generation for the three wind power plants (PE-I, PE-II, and PE-III) integrated into the energy island, with each plant's profile displayed in dedicated panels. These profiles provide a detailed representation of wind power availability across different seasons, serving as a fundamental input for the optimization model. Complementing this, Fig. 11 shows the day-ahead electricity price profiles for the representative seasonal day in the Great Britain, Belgium, and Denmark, which are pivotal for the economic optimization of the energy island's operation. The electricity price data for Belgium and Denmark were obtained from ENTSO-E (2025), while the Great Britain prices were sourced from Elexon (2025). Leveraging these wind power and electricity price profiles, the nonlinear model optimizes the power dispatch from the wind turbines, the charging and discharging schedules of the battery energy storage systems, and the production rates of green hydrogen, while accounting for the detailed characteristics of the energy island's AC/DC infrastructure. The results demonstrate the effectiveness of the proposed optimization framework in coordinating the energy island's resources, ensuring both operational efficiency and system reliability across diverse conditions.
To facilitate a structured analysis, the evaluation has been divided into two stages. First, we present a detailed operational analysis of a representative day for the autumn season. This focused assessment allows for an in-depth examination of the system's performance throughout a typical day under a specific seasonal scenario. Subsequently, we extend the analysis by presenting the representative daily profiles for all four seasons. This broader assessment demonstrates the capability of the proposed approach to adapt the optimal operational strategy to the varying conditions across the year.
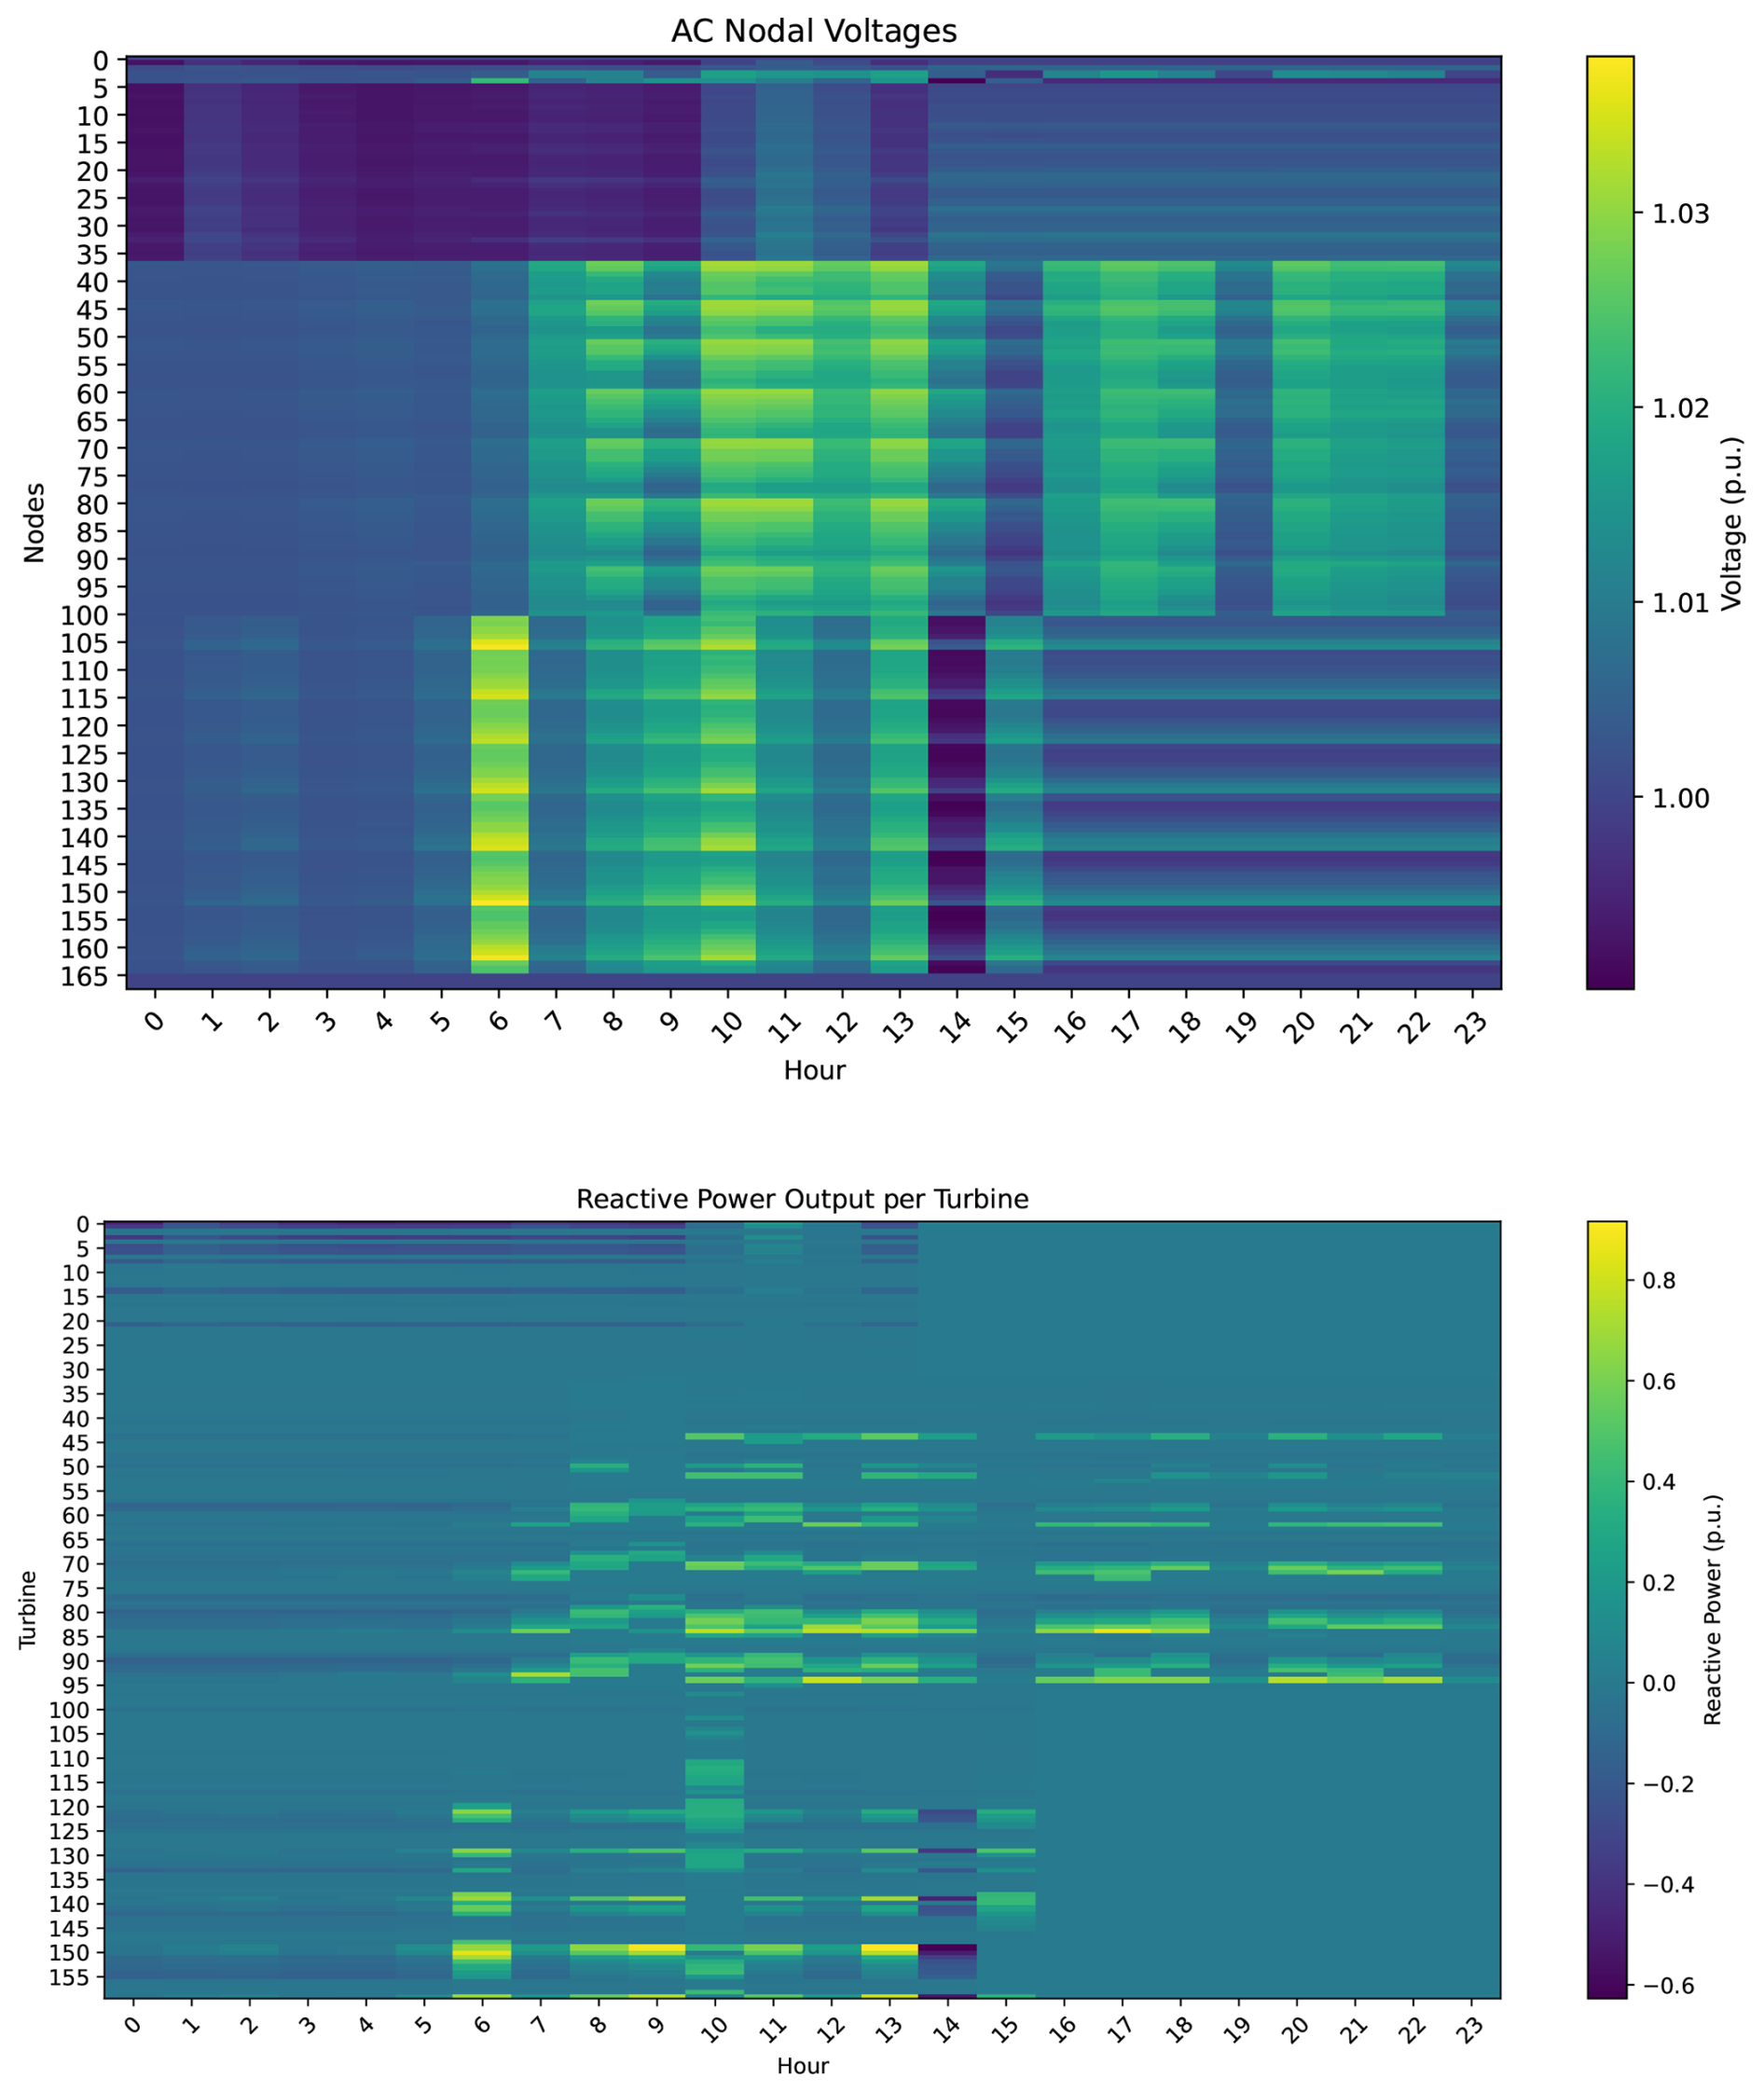
Figure 10Heatmaps of nodal voltage magnitudes and reactive power injection of wind turbines for the autumn scenario. Top: AC nodal voltage magnitudes. Bottom: Reactive power injection per turbine.
Figure 10 presents the nodal voltages and turbine-level reactive power injections for the representative autumn scenario, clearly evidencing the correlation between reactive power dispatch and voltage magnitudes. This relationship is fundamental in offshore AC networks, where voltage regulation plays a critical role in ensuring system stability – particularly during periods of high wind generation or significant power export. Capturing this interaction requires a modeling framework capable of representing both voltage magnitudes and reactive power flows, which is not possible in simplified DC power flow approximations where reactive power is neglected and voltages are assumed constant. To address this, the proposed nonlinear AC power flow formulation explicitly models and optimally dispatches reactive power from both the wind turbines and the battery energy storage system (BESS), enabling coordinated voltage support and a reduction in active power losses. In our case study, dispatching reactive power from the wind turbines and the BESS reduced total system losses by approximately 1 % compared to an equivalent scenario without such reactive power support. Furthermore, the high sparsity of the network admittance matrix ensures competitive computational performance despite the increased modeling detail: for example, the autumn representative day simulation was completed in approximately 27 s on a standard laptop (Intel Core i5-1235U, 16 GB RAM, Python 3.11). This demonstrates that the AC-based nonlinear formulation not only delivers a more accurate and operationally meaningful representation of the energy island but also remains computationally tractable for extended multi-period and seasonal analyses.
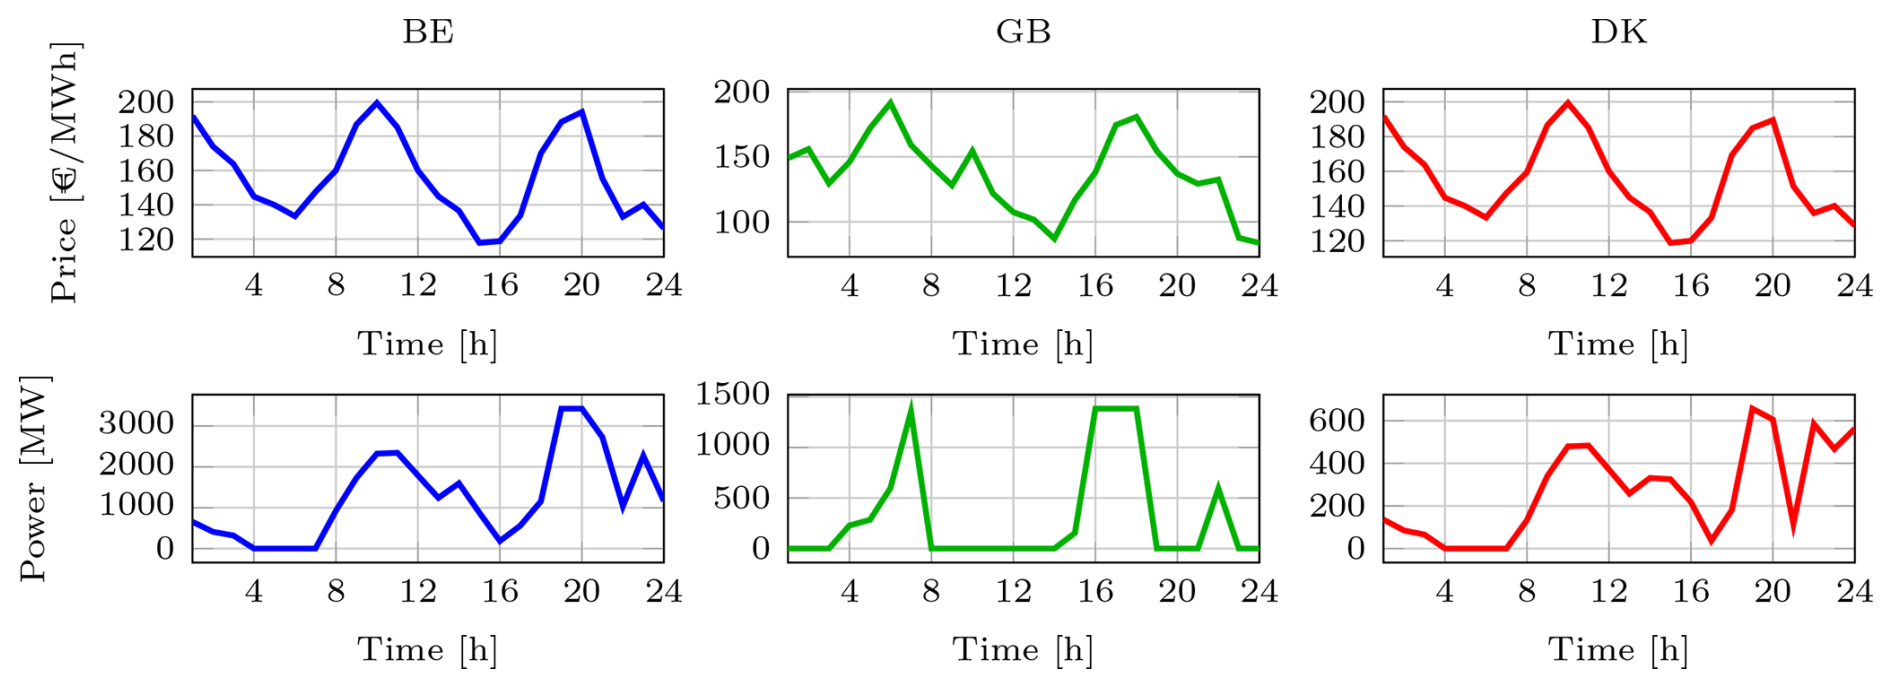
Figure 11Representative autumn daily profiles. Top row: hourly electricity prices for Belgium (BE), Great Britain (GB), and Denmark (DK). Bottom row: dispatched power to the corresponding onshore grids.
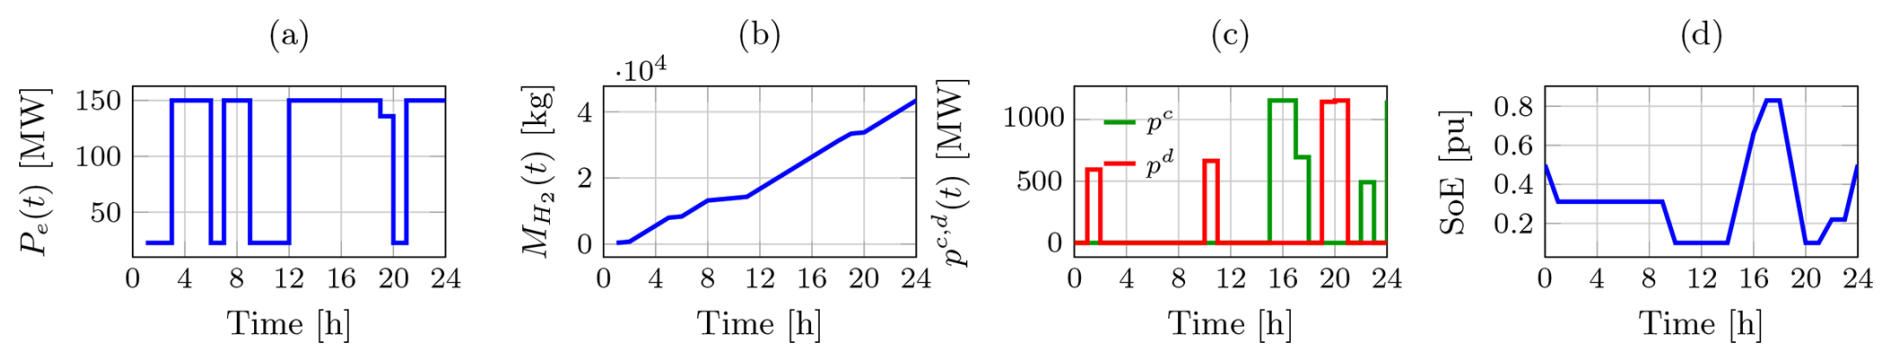
Figure 12Operational profiles of the hydrogen production and battery storage systems during a representative autumn day: (a) electrolyzer power Pe(t), (b) cumulative hydrogen production , (c) BESS power charging/discharging rates pc(t) and pd(t), and (d) battery state of energy (SoE).
Figure 11 presents the representative autumn daily profiles of electricity prices and dispatched power for Belgium (BE), Great Britain (GB), and Denmark (DK). The top panels show that electricity prices peak around EUR 199 MWh−1 at hour 10 in BE, EUR 191 MWh−1 at hour 6 in GB, and EUR 199 MWh−1 at hour 10 in DK. In response, the bottom panels illustrate the dispatched power profiles optimized according to these electricity price profiles. In BE, substantial exports occur between hours 8 and 22, with a maximum dispatch of approximately 3.43 GW at hours 19–20, coinciding with the higher electricity prices observed during these periods. In GB, exports are concentrated around hours 4–7 and 15–18, following the increases in electricity prices during the early morning and late afternoon. Despite similar price levels between BE and DK, dispatched power to DK remains lower, with peaks around 656 MW at hour 19, primarily due to the greater distance and associated transmission losses between the energy island and the Danish grid. The operation of the BESS, as illustrated in Fig. 12, further enhances the dispatch strategy: the BESS charges predominantly during lower-price periods around hours 15–18 and 22–24, with charging powers up to 1155 MW, and discharges during high-price intervals, notably at hours 10 and 19–20 with discharging peaks above 1140 MW. The hydrogen production system dynamically adjusts its operation, reducing electrolyzer power to 22.5 MW at hours 10 and 19–20 to prioritize electricity exports during price peaks, while otherwise absorbing surplus renewable generation, thus guaranteeing the fulfillment of the daily hydrogen production demand, which constitutes a critical operational constraint for the energy island.
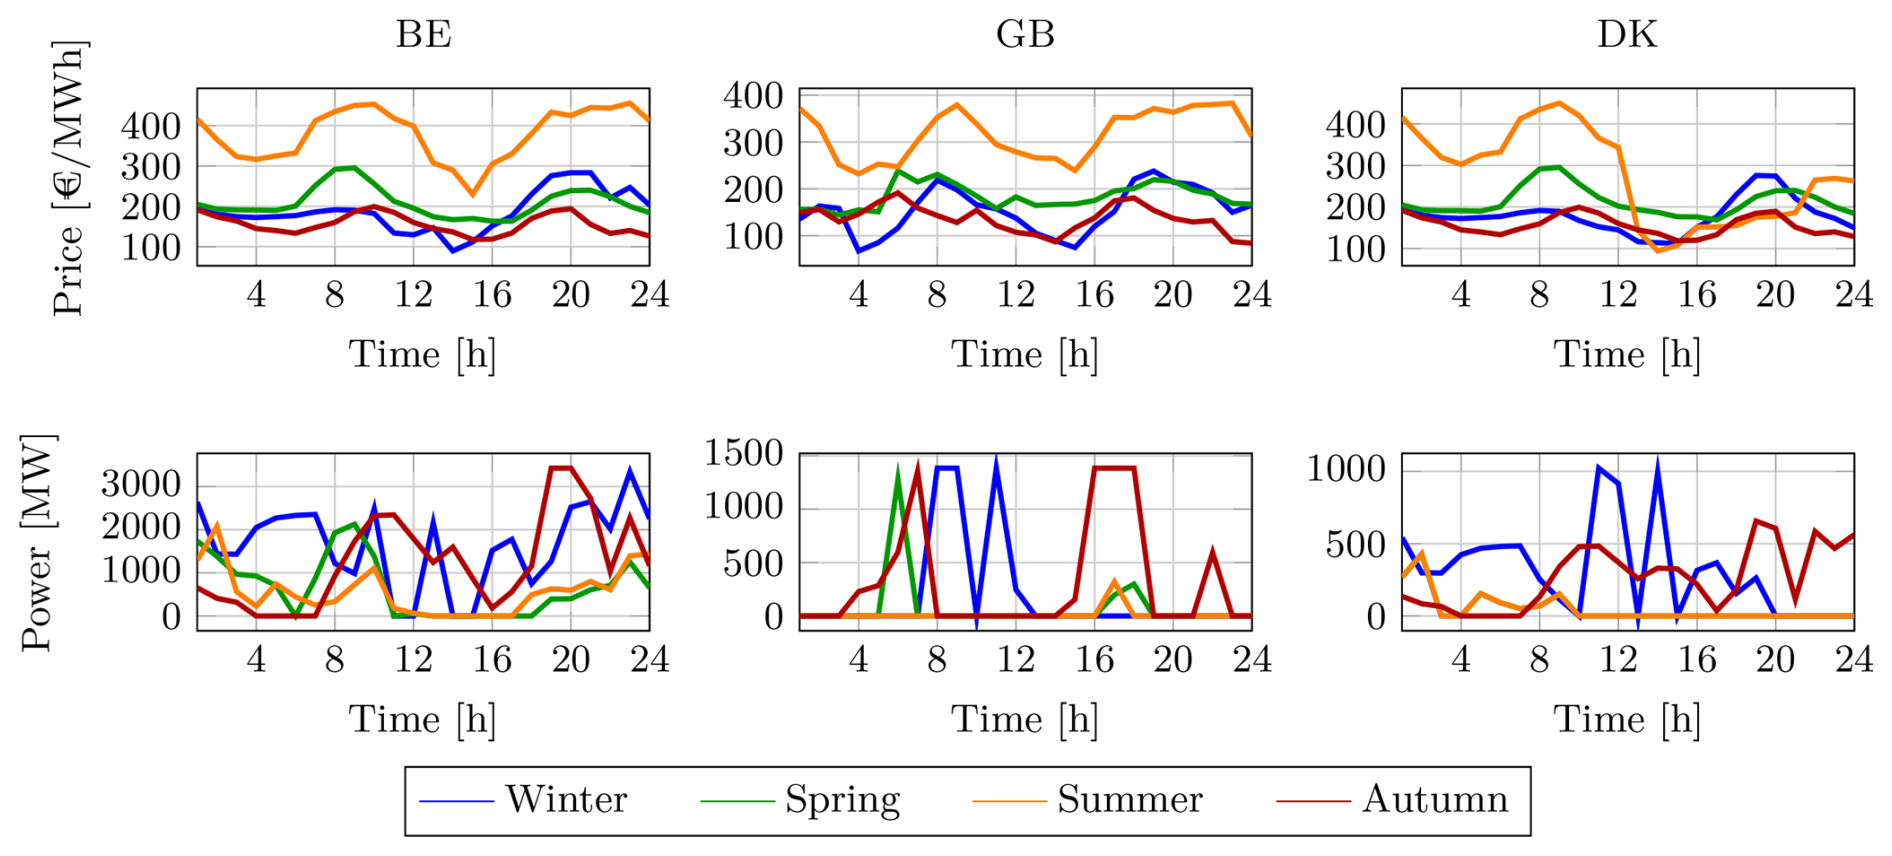
Figure 13Hourly energy prices (top row) and dispatched power (bottom row) for Belgium (BE), Great Britain (GB), and Denmark (DK) for representative days in the four seasons.
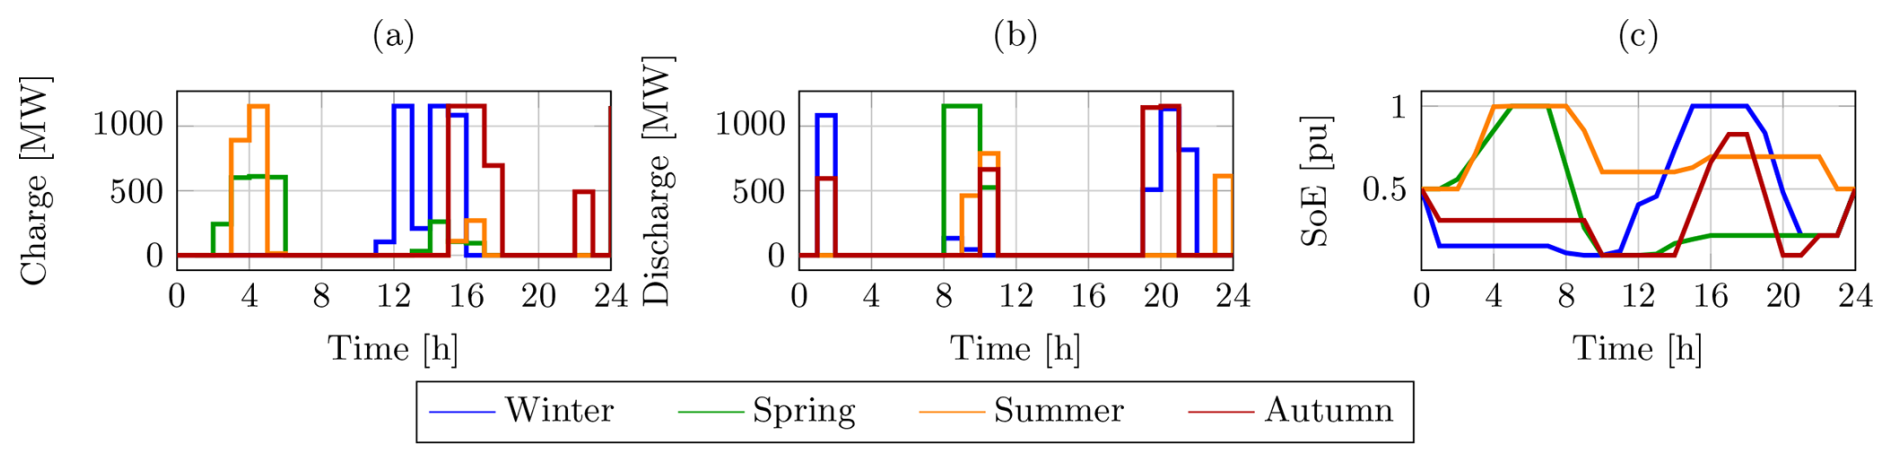
Figure 14Seasonal variation of battery operation: (a) charging power pc(t), (b) discharging power pd(t), and (c) state of energy SoE(t).
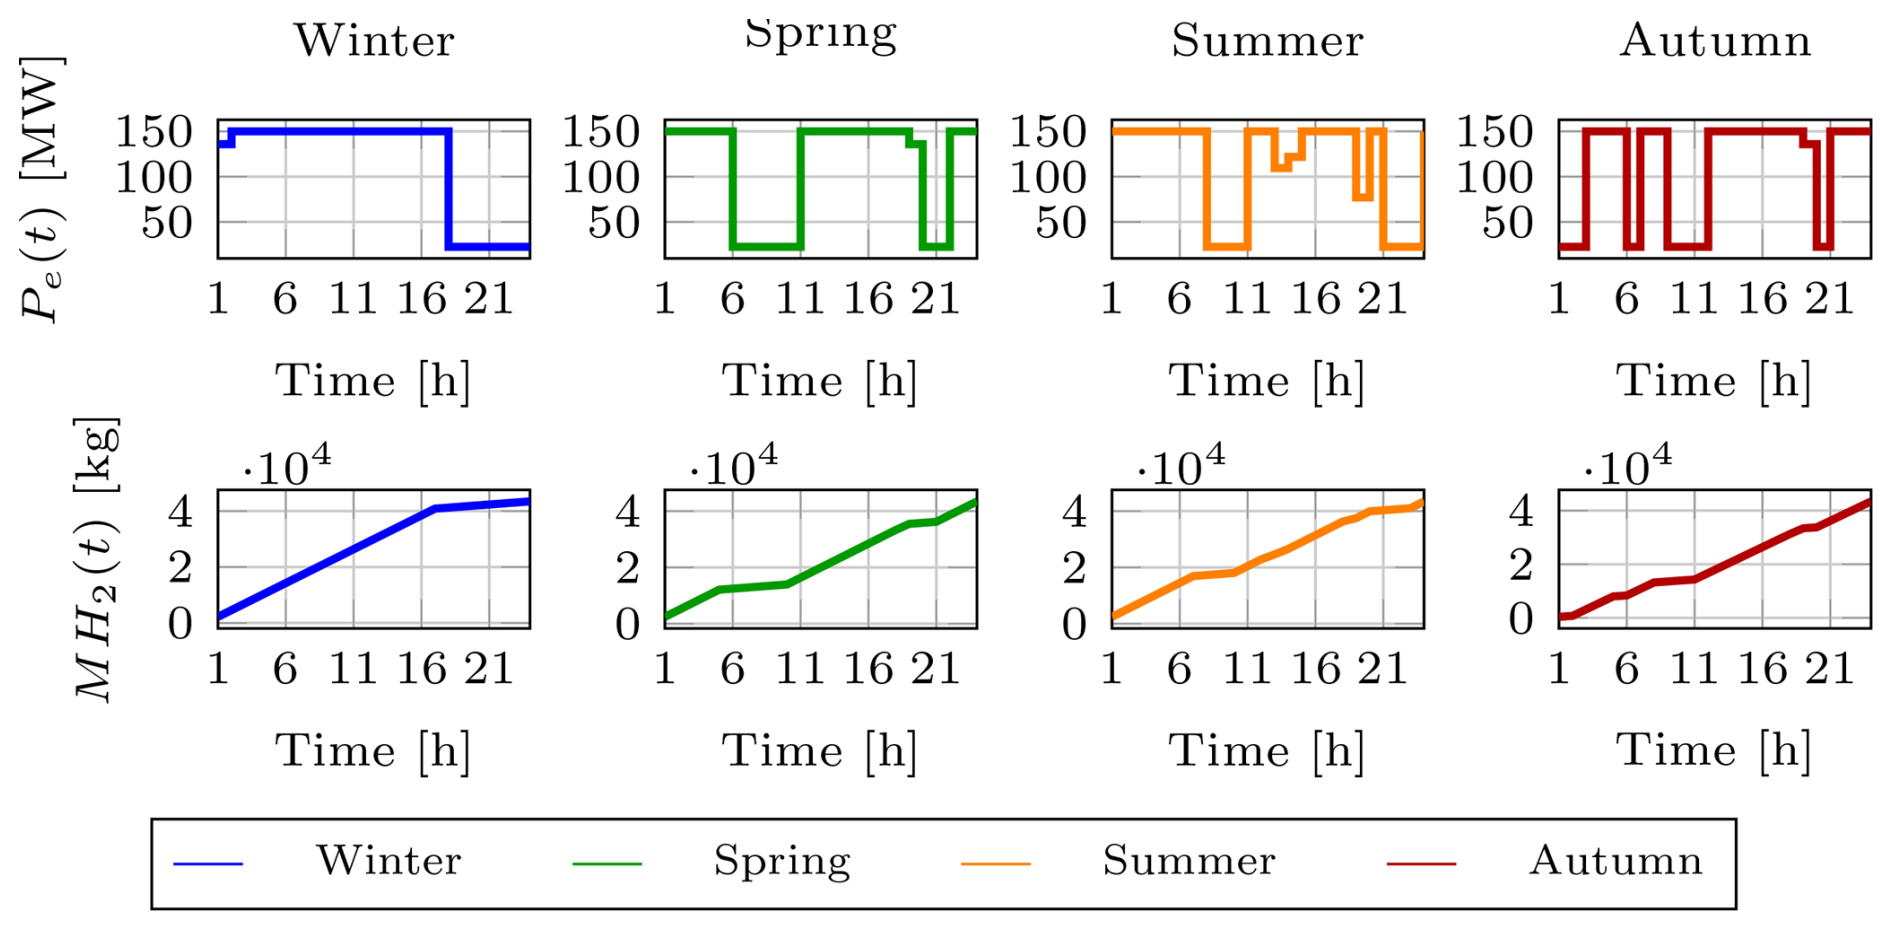
Figure 15Hydrogen system operation across seasons. (Top) electrolyzer power Pe(t) in [MW] and (bottom) cumulative hydrogen production in [kg].
Figures 13, 14, and 15 illustrate the seasonal operation of the energy island, covering the hourly electricity prices, the dispatched power to the onshore grids, and the performance of the battery and hydrogen production systems. The results clearly reflect the seasonal variability in both offshore wind generation and market prices. Despite these fluctuations, the proposed optimization framework dynamically adjusts energy dispatch, BESS management, and hydrogen production to maximize economic revenues while ensuring the secure operation of the energy island and the power system. In the representative days analyzed, the dispatched energy varies from 15 506 MWh in summer to 51 246 MWh in winter, with intermediate values of 23 018 MWh in spring and 43 971 MWh in autumn. Similarly, the revenues range from approximately EUR 5.31 million in spring to EUR 10.14 million in winter, with EUR 6.27 million in summer and EUR 7.26 million in autumn.
5.3 Optimizing curtailment mitigation with BESS and hydrogen systems under constrained transmission conditions
This section presents a case study to evaluate the effectiveness of the proposed approach in mitigating curtailments under constrained transmission conditions. To simulate a contingency scenario, the capacity of all HVDC transmission interconnections is reduced to 33 % of their nominal value, representing a severe limitation in power export capability, such as might occur during maintenance or unexpected outages. This case scenario analysis tests the robustness of the proposed nonlinear optimization framework, described in Sect. 3, by assessing its performance under atypical operating conditions. The optimization objective, focused on maximizing revenue from offshore wind generation, indirectly minimizes curtailments by prioritizing efficient resource allocation, including BESS charging/discharging and hydrogen production scheduling. The results demonstrate how the BESS stores excess energy during periods of high wind generation and constrained transmission, while the hydrogen production system absorbs surplus power to meet daily production targets, thereby reducing curtailments and enhancing economic performance.
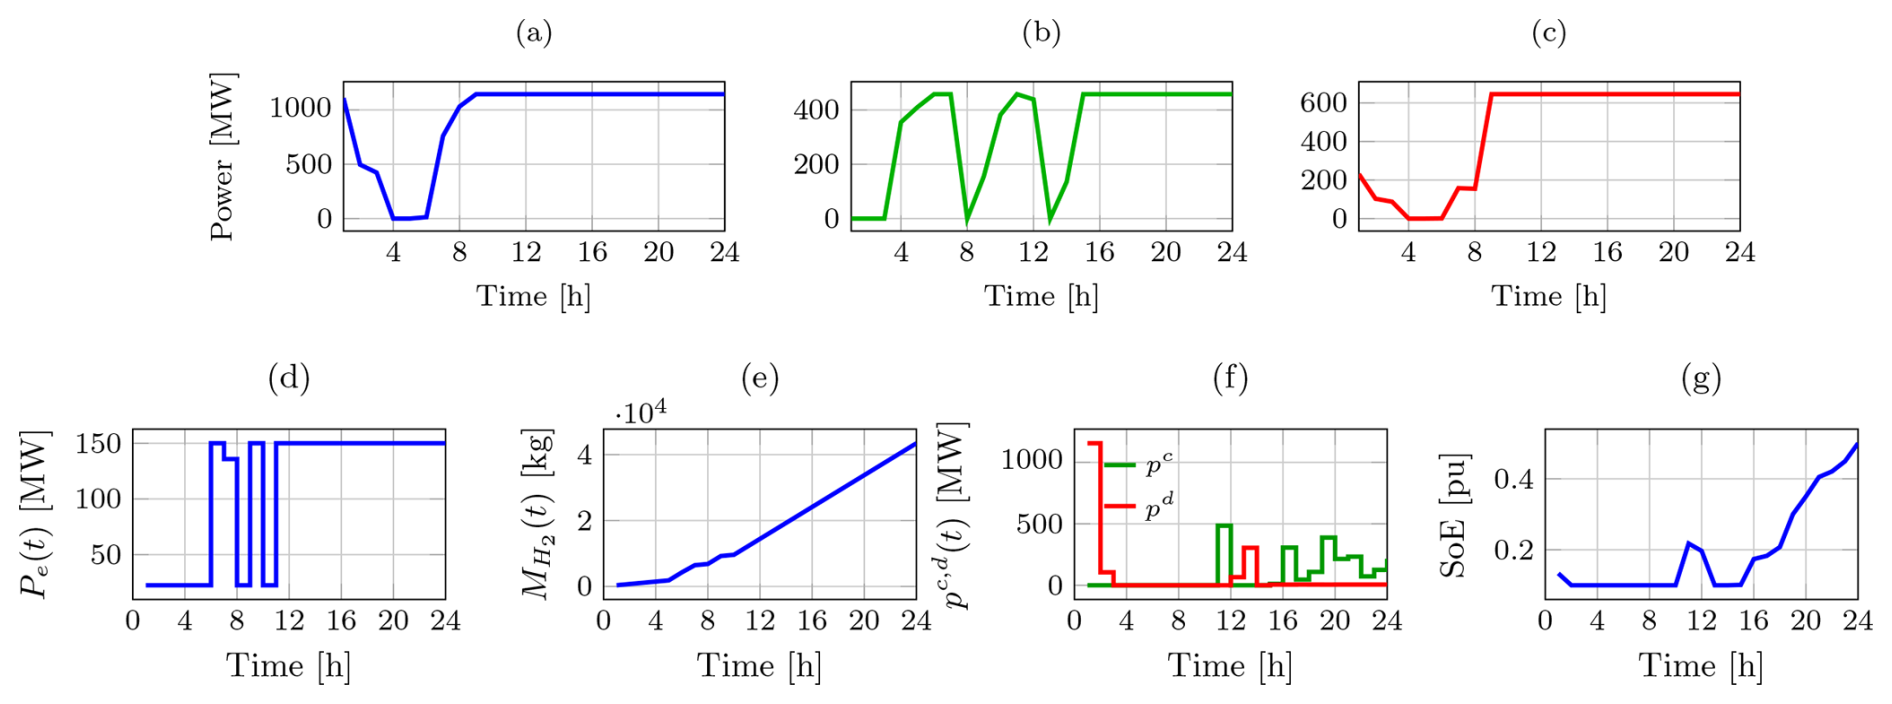
Figure 16Dispatched power and operational profiles for the curtailment analysis case study with constrained HVDC capacity. Top row: dispatched power to Belgium, Great Britain, and Denmark. Bottom row: electrolyzer power Pe(t), cumulative hydrogen production , BESS charging/discharging power pc(t) and pd(t), and battery state of energy (SoE).
Figure 16 illustrates the dispatched power profiles to the onshore grids of Belgium (BE), Great Britain (GB), and Denmark (DK), alongside the operational profiles of the BESS and hydrogen production systems for the representative day under constrained HVDC capacity. During hours 4–8, the optimization framework prioritizes power dispatch to GB, as shown in Fig. 16, driven by peak electricity prices in GB during this period, as observed in Fig. 13. This strategic allocation maximizes revenue by capitalizing on high market prices, aligning with the optimization objective.
From hour 8 onward, the dispatched power to Belgium reaches the maximum allowable capacity under the constrained HVDC limits, as depicted in Fig. 16. This preference for Belgium is primarily due to its proximity to the Princess Elisabeth Energy Island, which minimizes transmission losses compared to GB and DK. Additionally, electricity prices in Belgium during these periods are generally comparable to or higher than those in GB and DK, as shown in Fig. 13, further incentivizing exports to Belgium. In contrast, the dispatched power to GB exhibits lower peaks around hours 8 and 12, as seen in Fig. 16, reflecting the influence of lower electricity prices in GB during these hours, consistent with Fig. 13.
Beyond hour 8, the dispatched power to all three countries frequently reaches the maximum constrained HVDC capacity, as observed in Fig. 16. This behavior is driven by a significant increase in available wind power from the wind power plants (WPPs), particularly WPP PE-I around hour 12 and WPP PE-III from hour 16 onward, as indicated by the wind profiles in Fig. 13. To mitigate curtailments under these conditions, the optimization framework prioritizes hydrogen production from hour 8, as shown in Fig. 16, where the electrolyzer power Pe(t) increases to absorb surplus wind generation, ensuring that daily hydrogen production targets are met while minimizing unutilized renewable energy.
The BESS complements the hydrogen production system by dynamically adjusting its operation to balance the constrained transmission capacity and variable wind generation. As illustrated in Fig. 16, the BESS discharges during the early hours when wind power availability is low, supporting power exports to the onshore grids. During periods of high wind generation, particularly around hour 12 for wind power plant PE-I and from hour 16 for wind power plant PE-III, the BESS charges to store excess energy, as shown in Fig. 16, thereby preventing curtailments.
5.4 Impact of wind and price uncertainty using Monte Carlo analysis
This section presents a probabilistic assessment of the energy island's operation under uncertainties in wind power and electricity prices, using Monte Carlo simulations to evaluate variability in key performance indicators, as detailed in Sect. 3.6. In this study, wind power generation and electricity market prices were modeled with Gaussian-distributed uncertainty, using the forecasted value as the mean and a standard deviation of 10 %, consistent with the approaches in Yang et al. (2019) and Xiang et al. (2020).
Table 4Statistical indicators of economic profit under different forecast uncertainty scenarios. All values are in millions of euros.
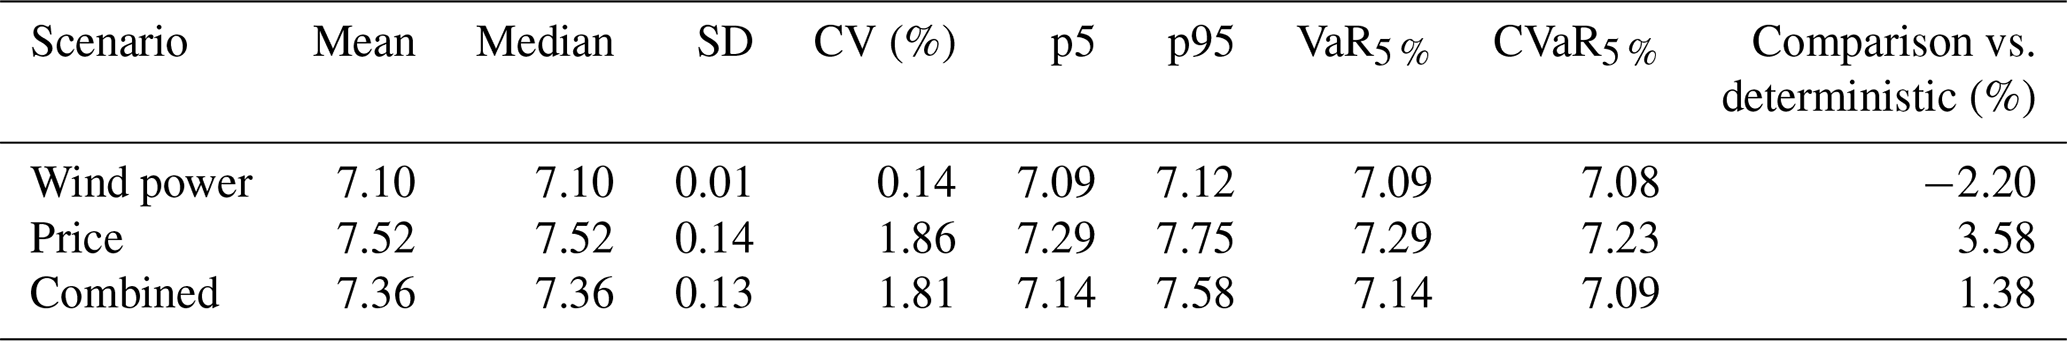
A Monte Carlo simulation approach was applied to evaluate the impact of these uncertainties on the operational performance of the energy island. Multiple realizations of the uncertain input variables were generated and used as inputs to the nonlinear optimization model. A total of 1000 simulation runs were performed per scenario, and the statistical distribution of the resulting economic benefits was analyzed to quantify the impact of forecast uncertainty. Finally, a statistical analysis of the output values is performed, studying key indexes to evaluate and visualize the probability distribution of the resulting effect of the uncertainty of energy price and wind power forecasting on the operation of the energy island. Three scenarios were considered: (i) uncertainty in wind power forecasts, (ii) uncertainty in electricity price forecasts, and (iii) combined uncertainty in both wind power and prices. Table 4 summarizes the key statistical indicators of the economic profit obtained for the simulations of each scenario.
The following points highlight the primary findings from the Monte Carlo analysis of wind power and price uncertainty impacts on the energy island's economic performance:
-
Wind power uncertainty alone has a minor effect on economic profits, as indicated by the very low coefficient of variation (0.14 %) and narrow percentile range. The mean and median are almost identical, highlighting the symmetry of the distribution. Relative to the deterministic case, this scenario reduces the mean profit by about 2.20 %, with risk metrics like the conditional value at risk (CVaR) showing a slightly larger drop of 2.48 %.
-
Price uncertainty introduces substantially higher variability (CV ≈ 1.86 %), with wider percentiles and a more pronounced impact on the value at risk. This indicates that economic performance is more sensitive to market price fluctuations than to wind forecast errors. Compared to deterministic, the mean increases by 3.58 %, but the CVaR decreases slightly by 0.41 %, suggesting potential downside risks in extreme cases.
-
Combined uncertainty produces results dominated by price variability, with slightly higher dispersion than the wind-only scenario but slightly lower than price only, reflecting interactions between both sources of uncertainty. Relative to deterministic, the mean rises by 1.38 %, but risk metrics vary: p95 increases by 4.41 % (upside potential), while CVaR drops by 2.34 % (downside risk).
-
In all scenarios, the deterministic profit (EUR 7.26 million) lies within the interquartile ranges, but the VaR and CVaR metrics reveal that extreme realizations can significantly reduce profits. The percentage comparisons emphasize that wind uncertainty tends to bias profits downward, while price uncertainty can boost averages but introduces two-tailed risks. This highlights the importance of probabilistic assessment for robust operational planning.
This study presents a predictive nonlinear optimization framework for the operation of AC/DC energy islands, verified through a case study of the Princess Elisabeth Energy Island. The nonlinear power flow formulation facilitated reactive power dispatch from wind turbines and the battery energy storage system, reducing system losses by approximately 1 % and enhancing voltage regulation. The linear model for green hydrogen production, derived through measurement-based optimization, achieved a mean modeling error below 1.5 %, surpassing conventional constant-efficiency models. Seasonal analyses underscored the framework's adaptability, optimizing energy dispatch, battery management, and hydrogen production to maximize economic revenues while ensuring secure operation. Monte Carlo simulations evaluating wind power and electricity price uncertainties revealed that price uncertainty significantly impacts economic profits, increasing mean profits by 3.58 % compared to the deterministic case. Meanwhile, wind uncertainty reduces profits by 2.20 %, and combined uncertainty yields a modest 1.38 % increase, highlighting the need for probabilistic assessments in operational planning. Realistic offshore wind conditions, modeled using the Youwind platform with wake effects, provided seasonally representative inputs. The proposed framework effectively adapts to seasonal variability, ensuring operational efficiency and economic performance while maintaining computational tractability for future hybrid AC/DC energy island applications.
Potential directions for future research may include the following:
- i.
Integrate detailed techno-economic assessments of subsystems into the planning framework for hybrid energy islands to evaluate their impact on overall system performance and cost-effectiveness.
- ii.
Apply stochastic optimization techniques to extend the proposed strategies, enabling robust planning of hybrid energy islands across both representative days and long-term horizons under uncertainty.
- iii.
Extending the analysis to other energy island projects, such as Denmark's energy islands and the Bornholm Energy Island, to verify the proposed methodology across different geographical and operational contexts, leveraging project-specific data and configurations to enhance the generalizability of the model.
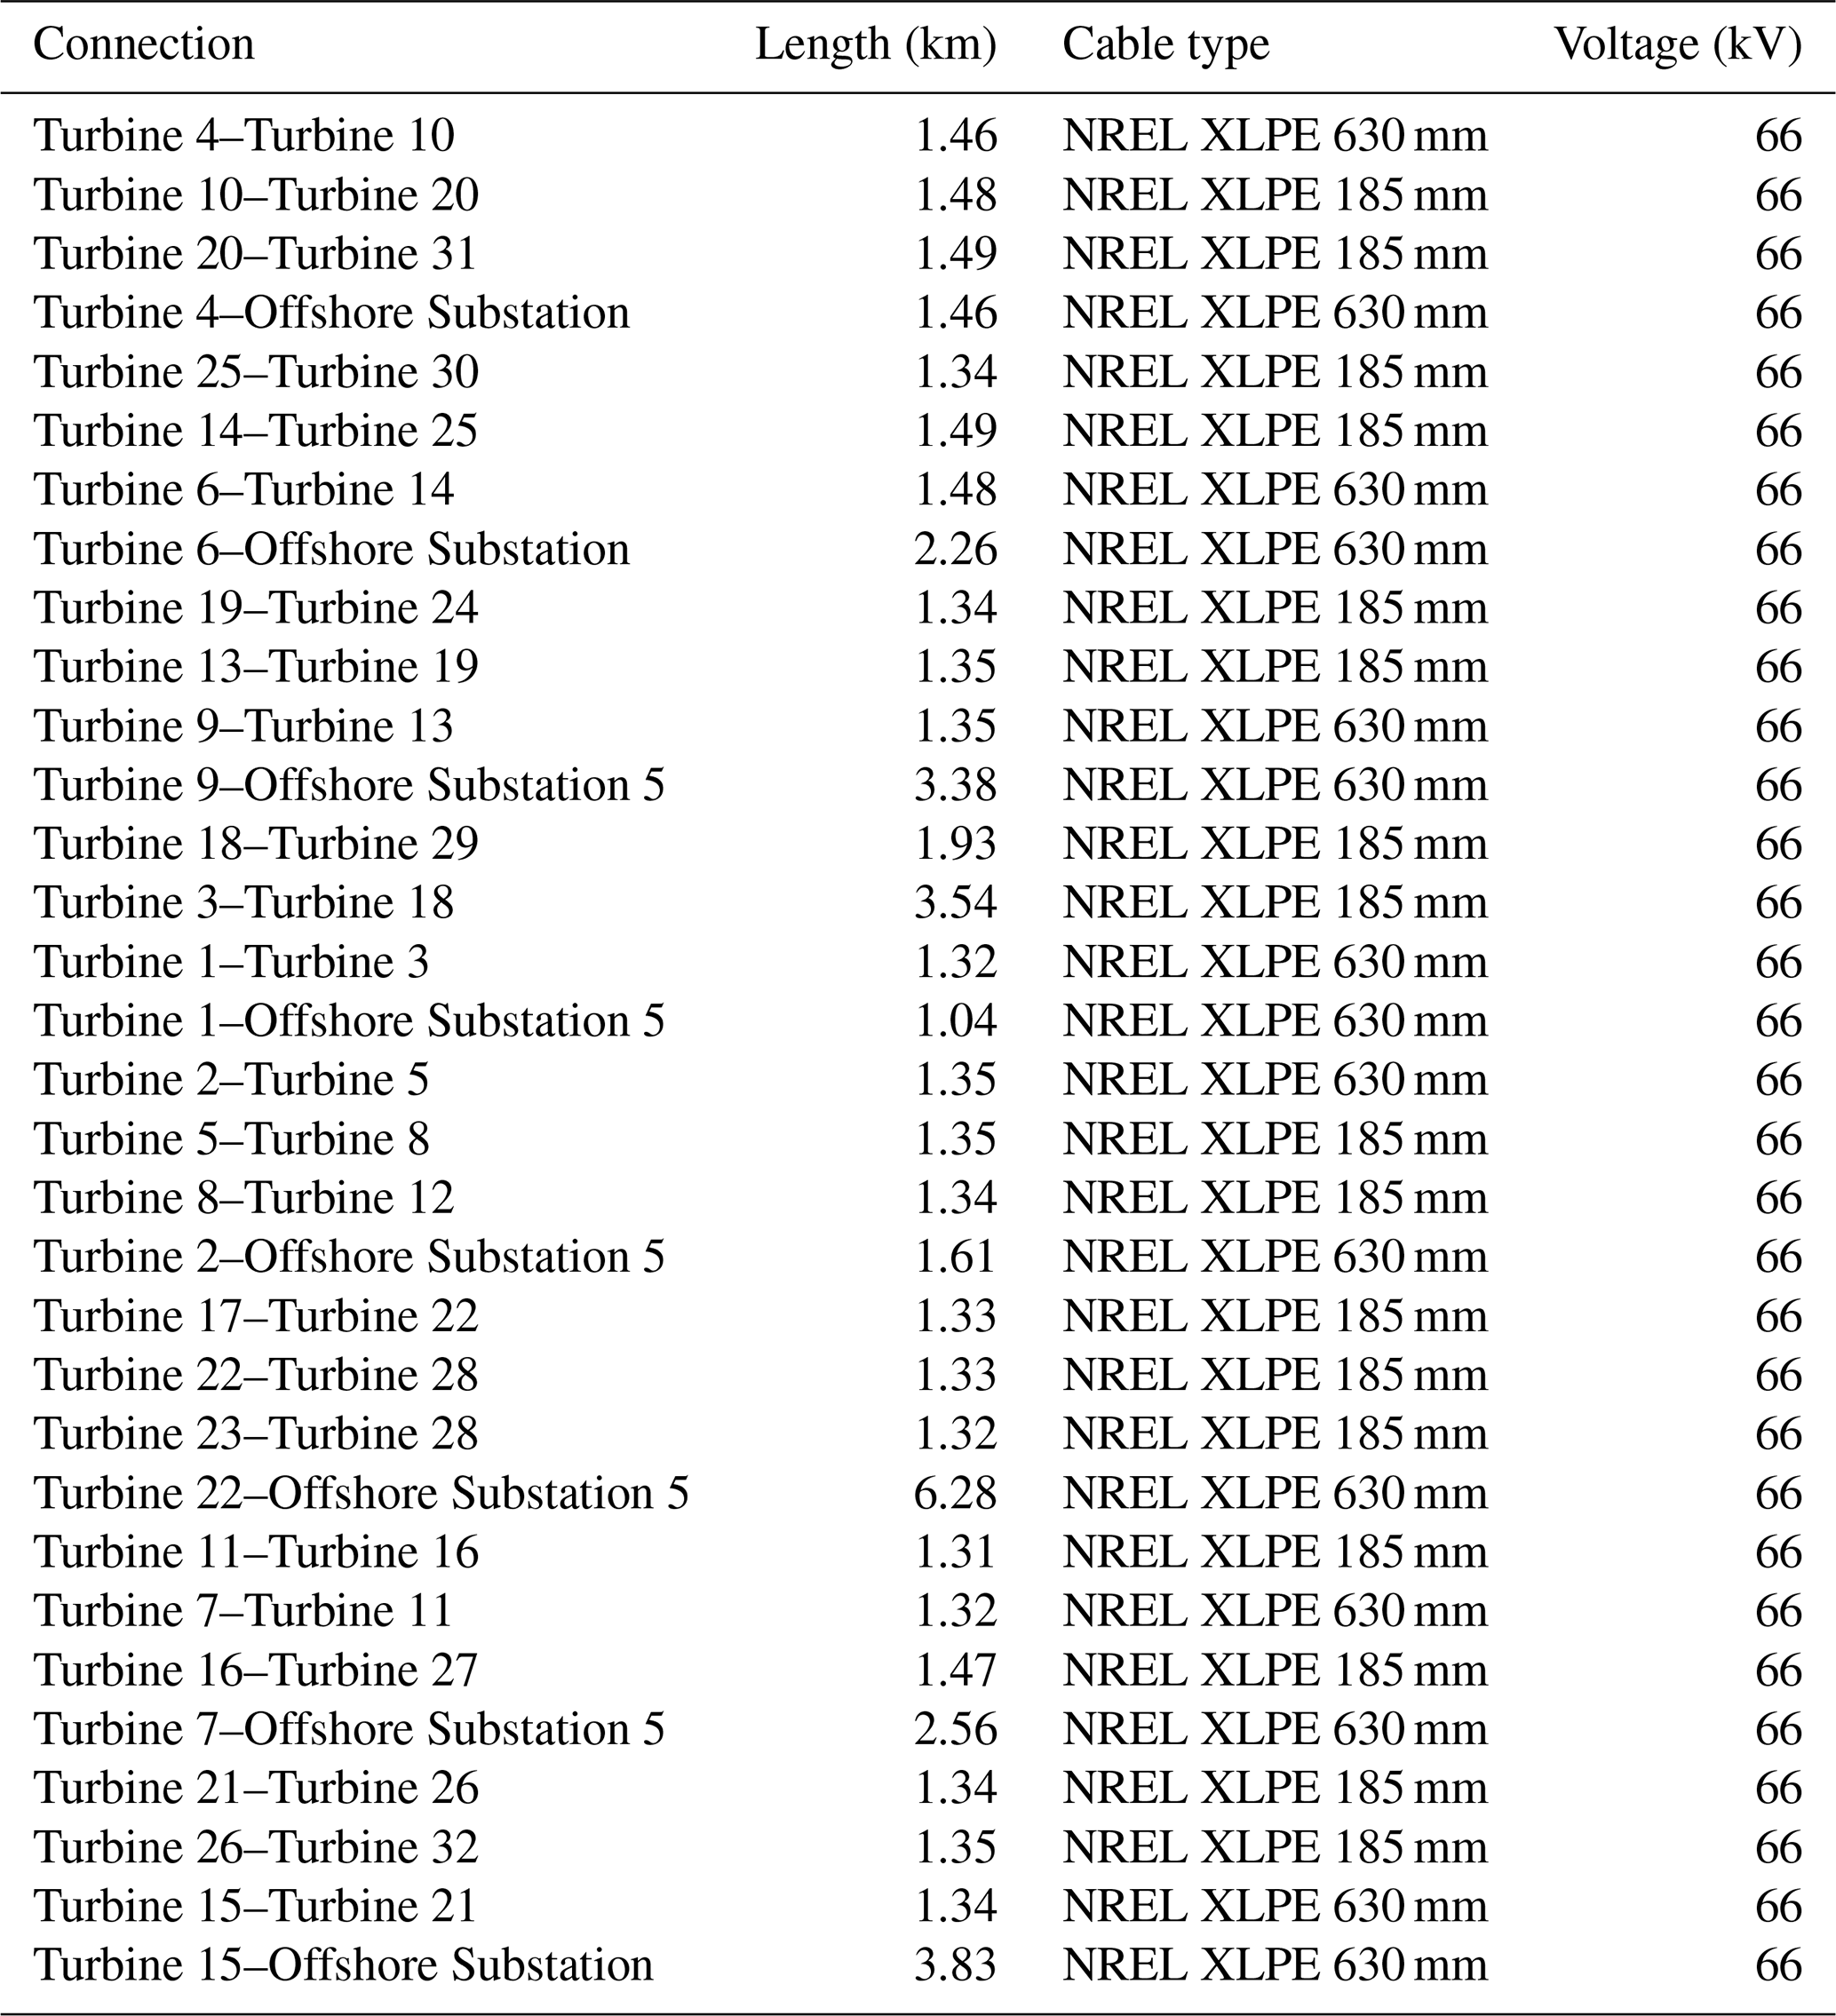
Table A2Technical parameters of the export cable system for wind power plant PE-I. The system consists of four identical cables connected in parallel.
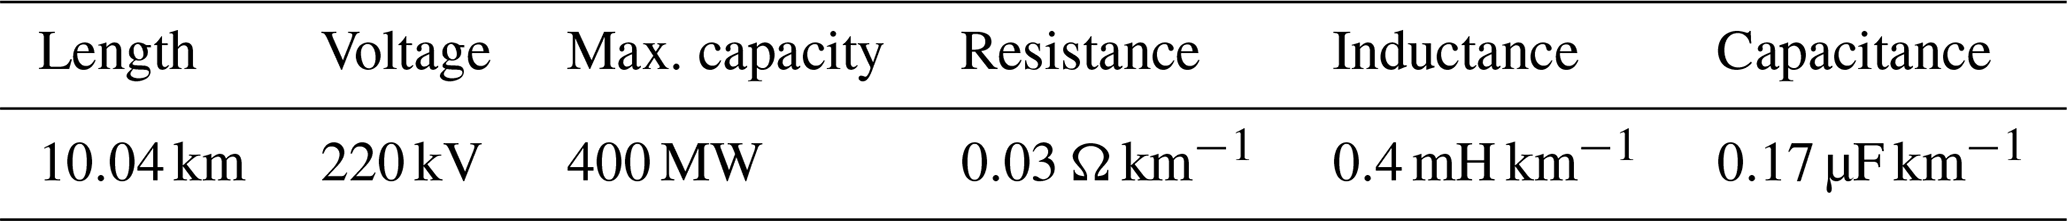
Table A3Technical parameters of array cables for wind power plant PE-II (Part I).
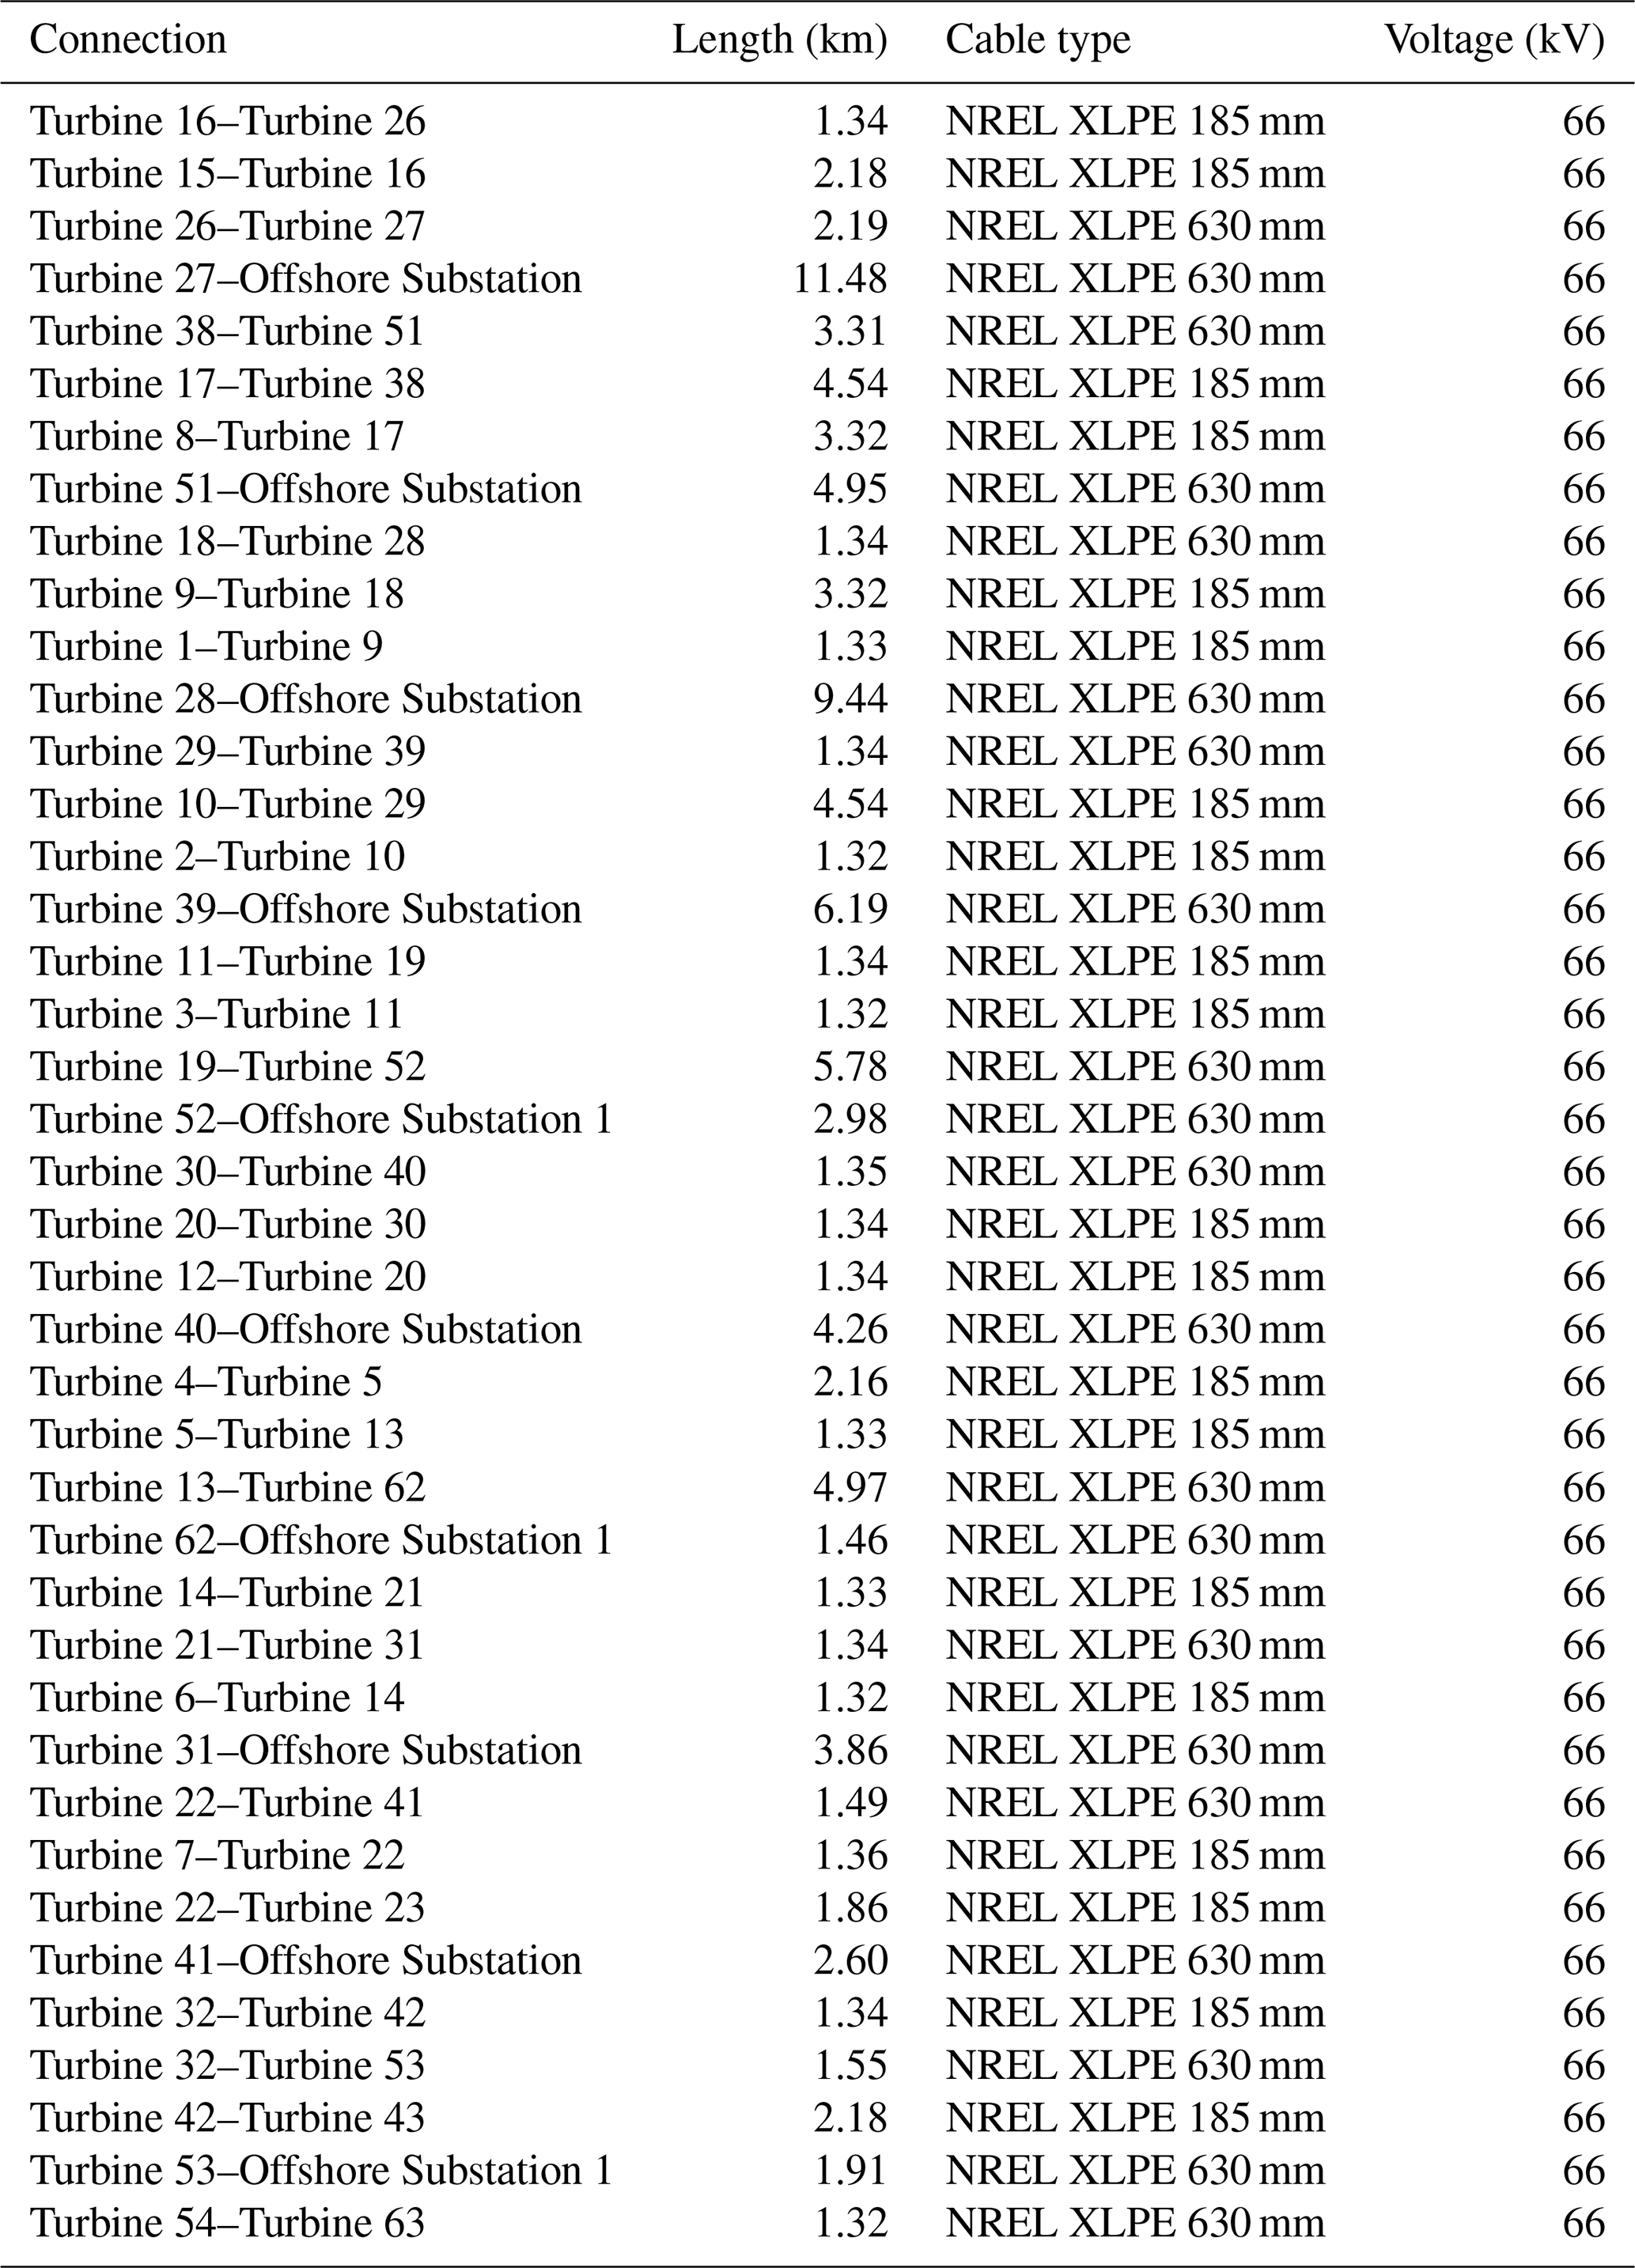
Table A4Technical parameters of array cables for wind power plant PE-II (Part II).
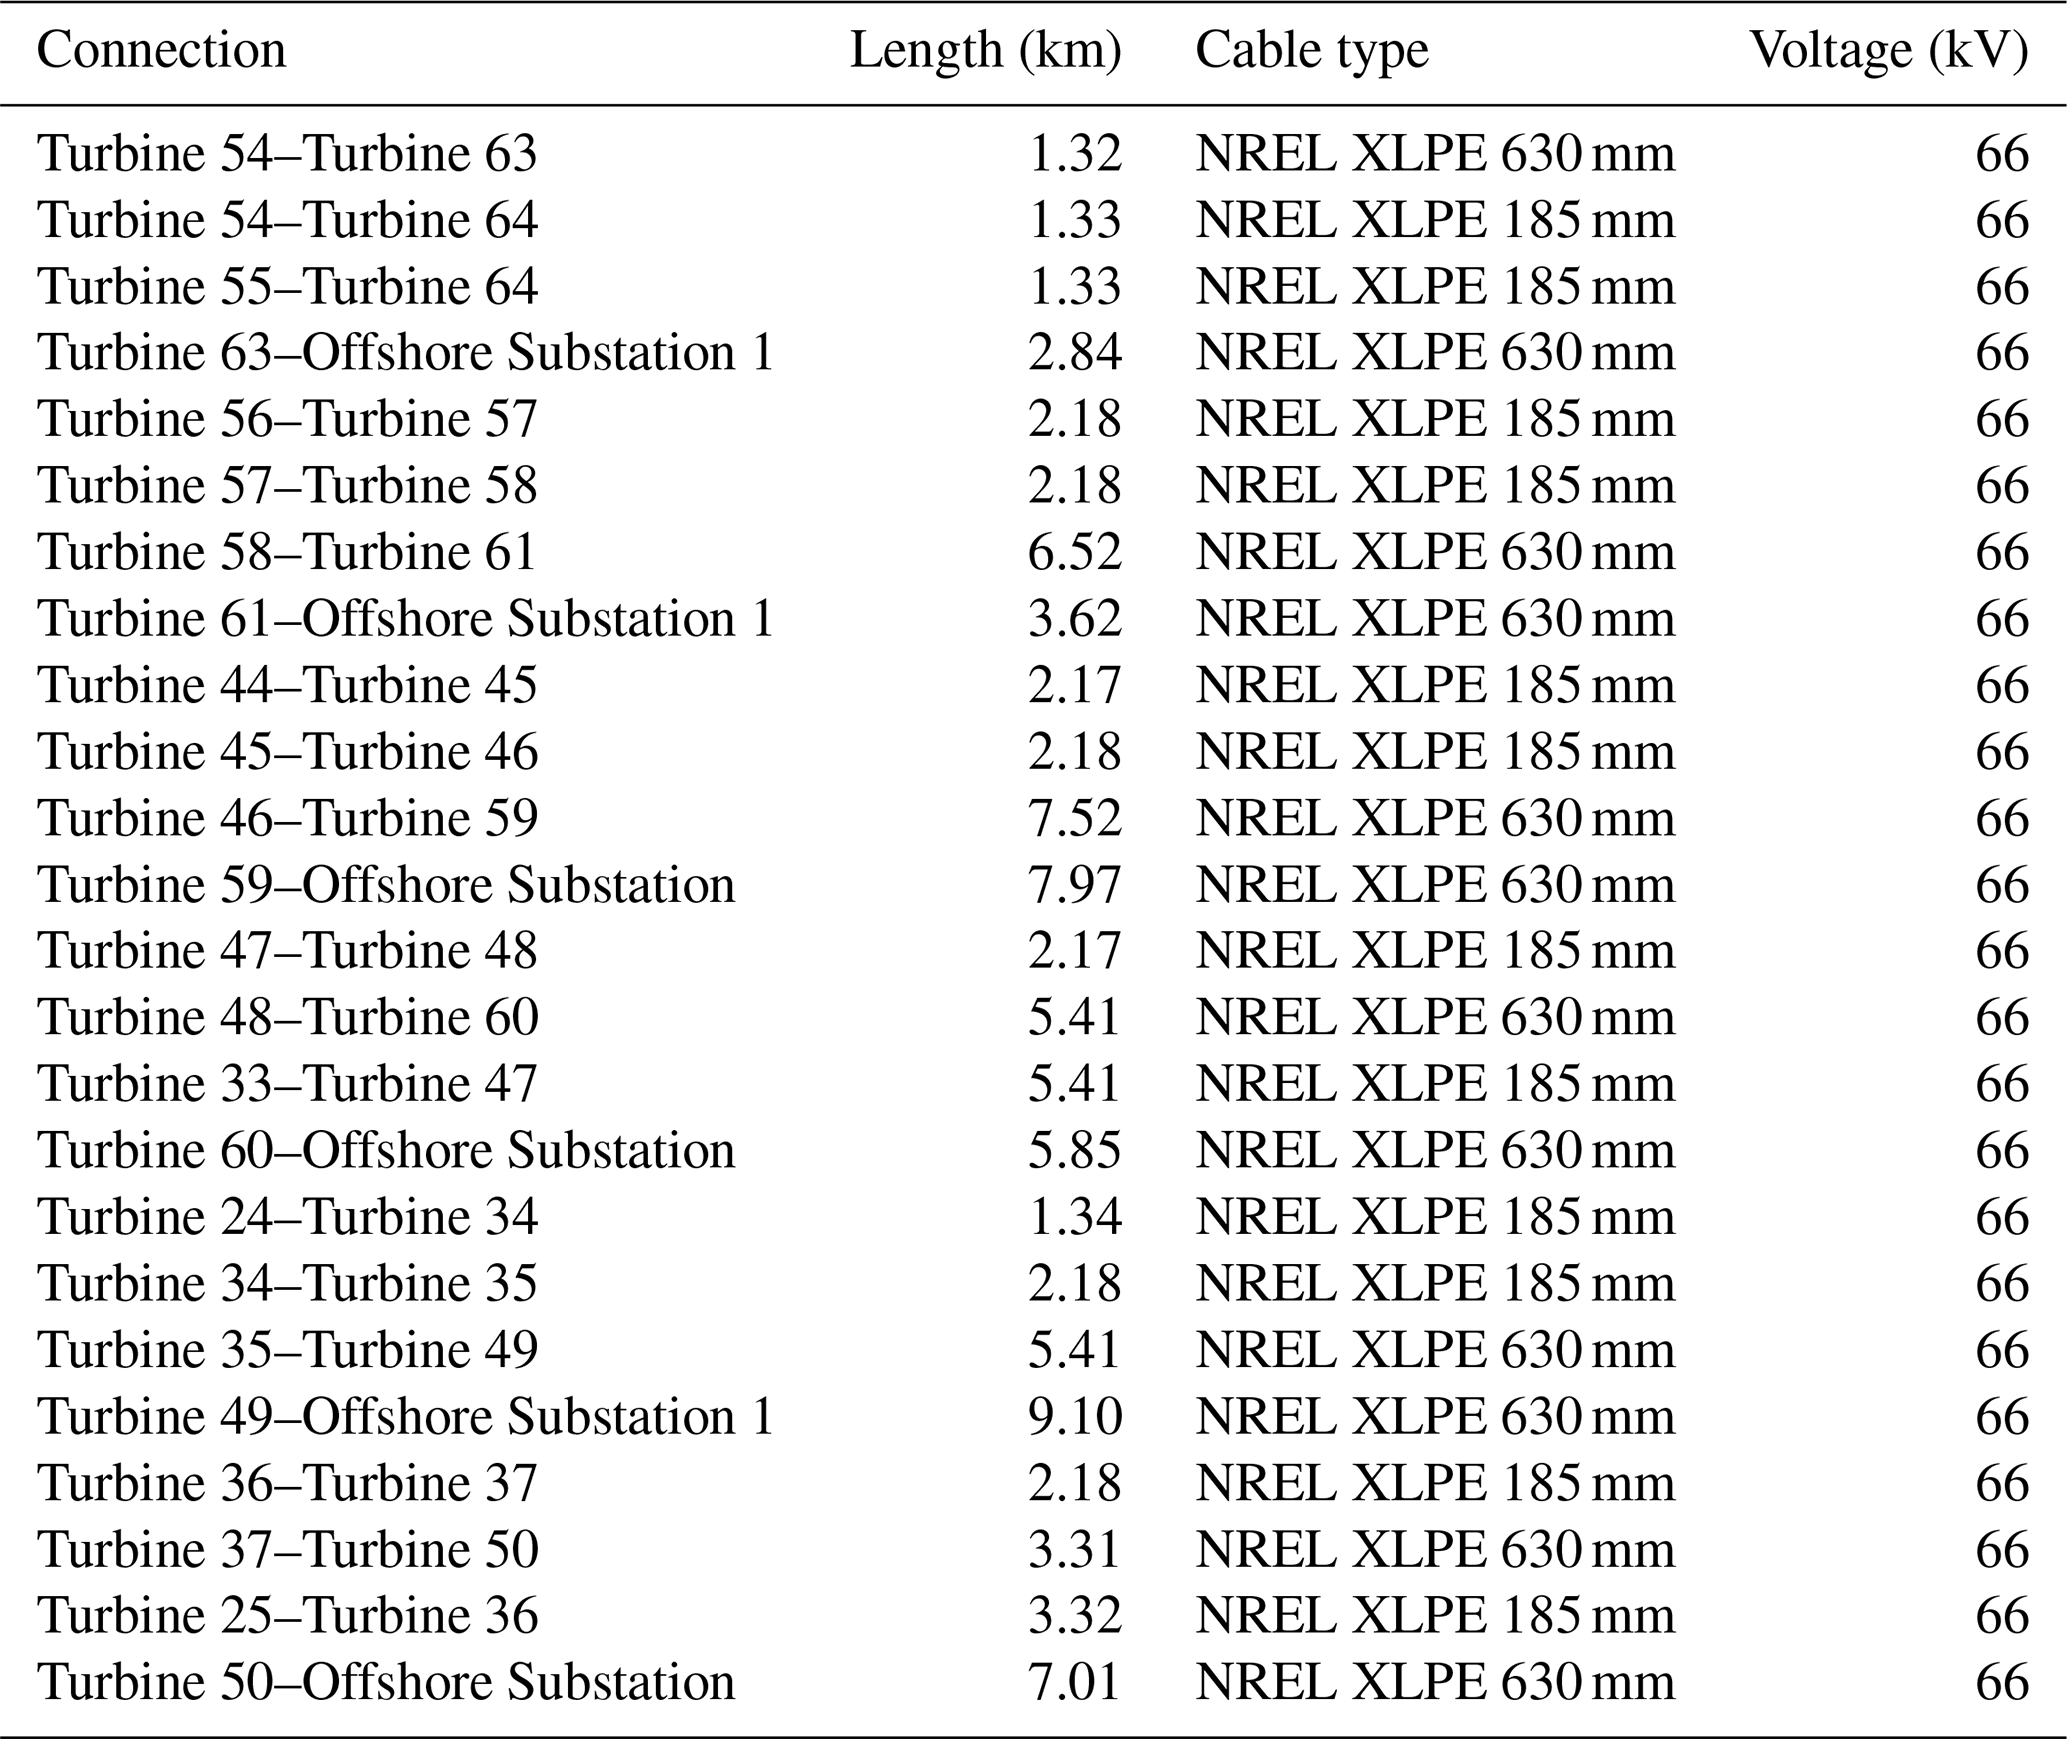
Table A5Technical parameters of array cables for wind power plant PE-III (Part I).
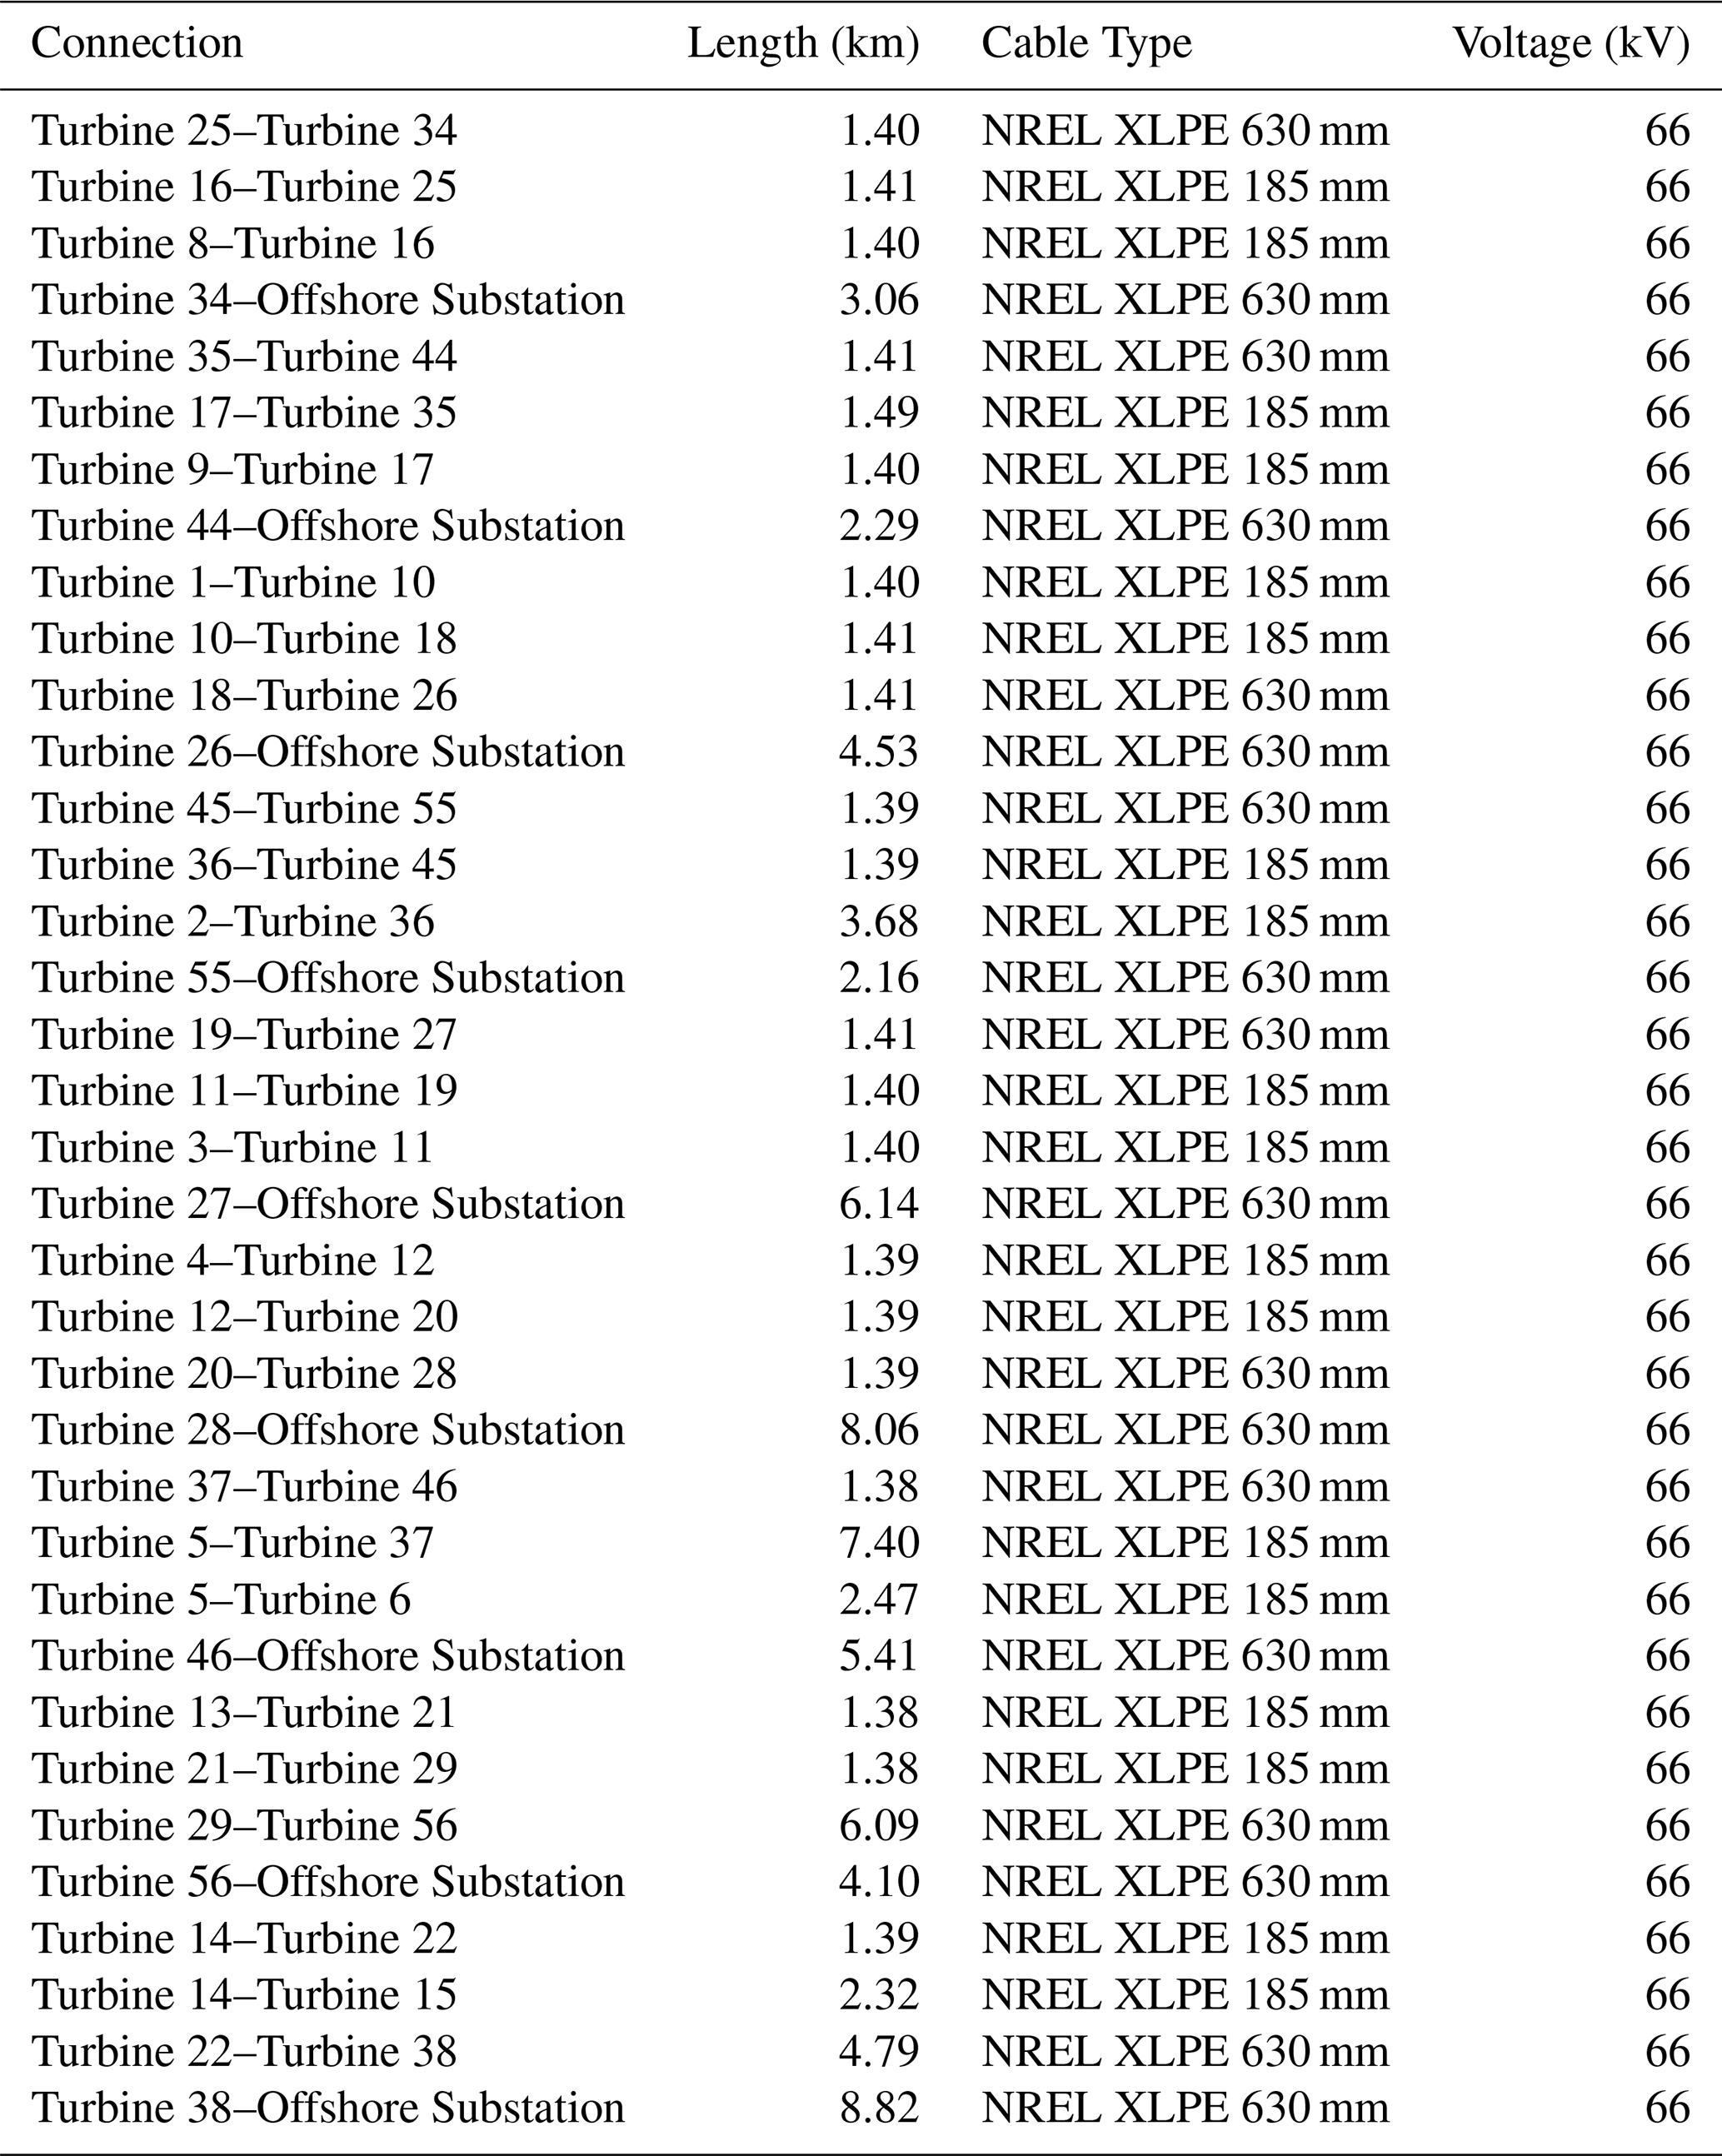
Table A6Technical parameters of array cables for wind power plant PE-III (Part II).
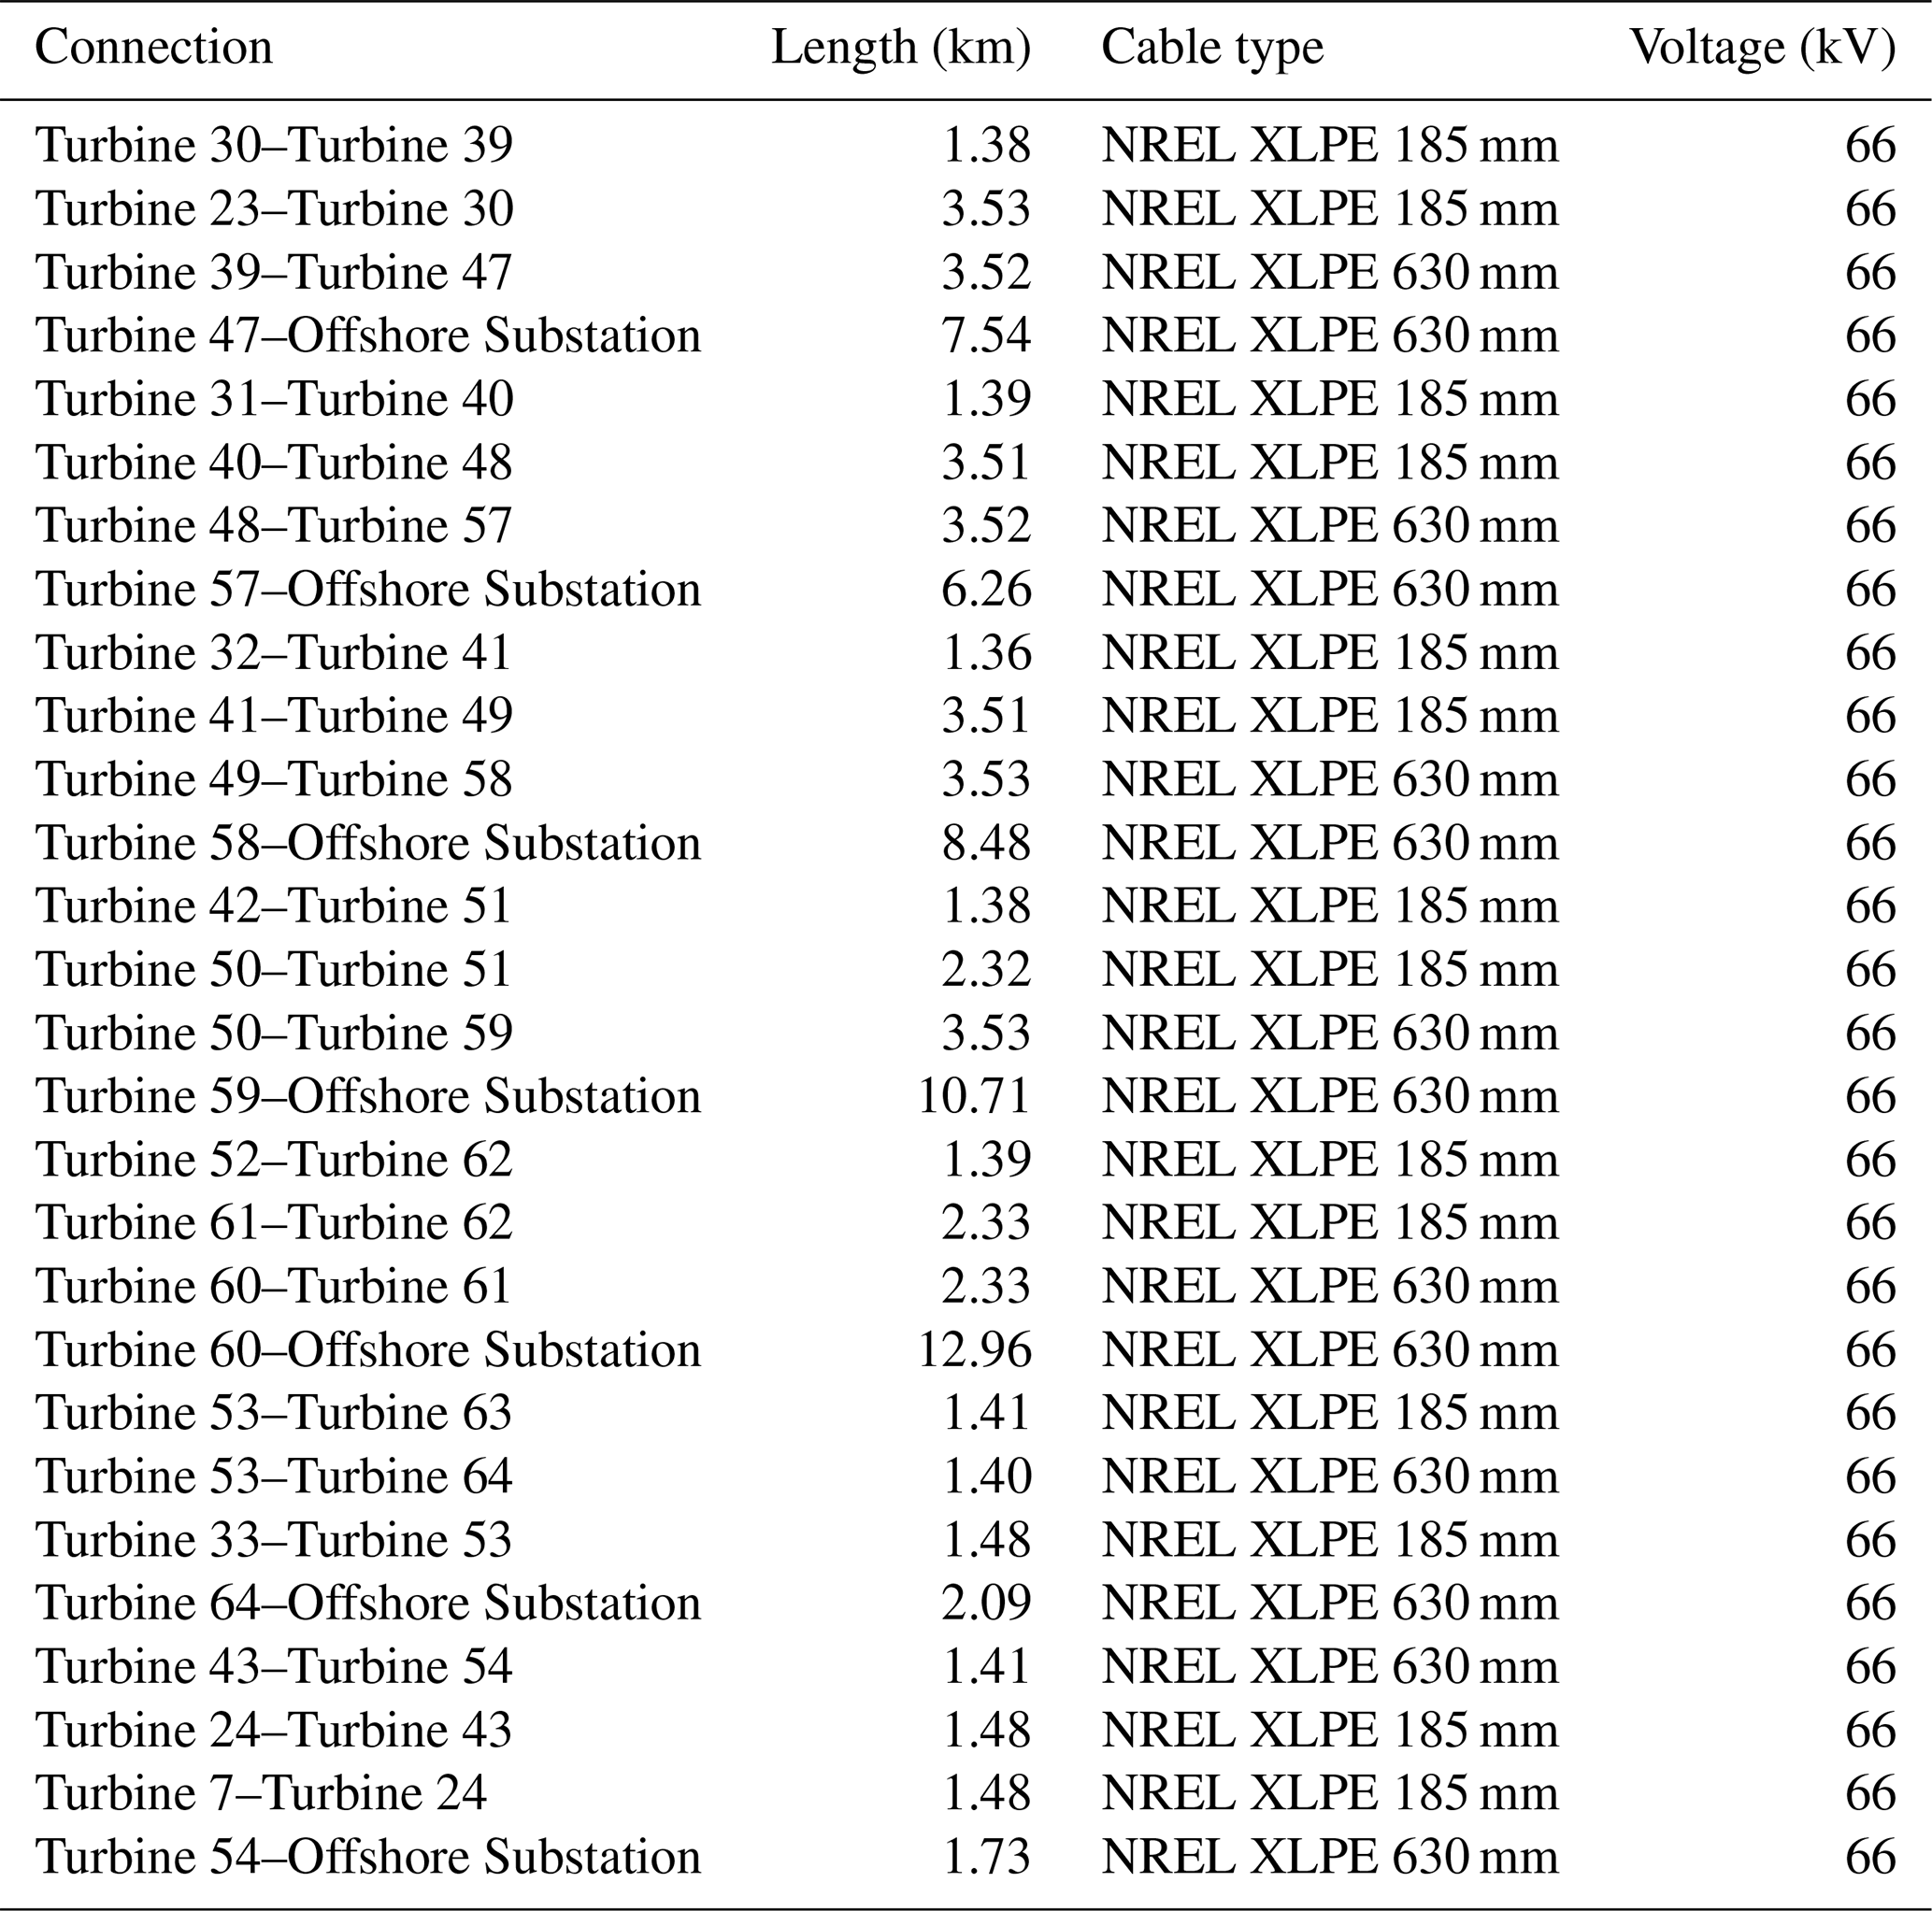
Table A7Technical parameters of the transformers for wind power plants PE-I, PE-II, and PE-III, referred to a 3500 MVA base.
The data and software codes to run the simulations are available in the Zenodo repository at https://doi.org/10.5281/zenodo.18414805 (Useche-Arteaga et al., 2026).
MUA: writing (original draft), writing (review and editing), visualization, validation, software, methodology, investigation, formal analysis, and conceptualization. PG: data collection, methodology, writing (review and editing), validation, supervision, and formal analysis. OGB: writing (review and editing), validation, supervision, project administration, and methodology. MCM: writing (review and editing) and validation. VL: writing (review and editing) and validation.
The contact author has declared that none of the authors has any competing interests.
Publisher's note: Copernicus Publications remains neutral with regard to jurisdictional claims made in the text, published maps, institutional affiliations, or any other geographical representation in this paper. The authors bear the ultimate responsibility for providing appropriate place names. Views expressed in the text are those of the authors and do not necessarily reflect the views of the publisher.
This work has received funding from the ADOreD project of the European Union's Horizon Europe Research and Innovation program under the Marie Skłodowska-Curie grant agreement no. 101073554.
This research has been supported by the Horizon Europe Marie Skłodowska-Curie Actions (grant no. 101073554). The work of Oriol Gomis-Bellmunt was supported by AGAUR – ICREA Academia program. The work of Marc Cheah-Mane was supported by the Serra Hunter Program.
This paper was edited by Anca Hansen and reviewed by three anonymous referees.
Ansari, J. A., Liu, C., and Khan, S. A.: MMC Based MTDC Grids: A Detailed Review on Issues and Challenges for Operation, Control and Protection Schemes, IEEE Access, 8, 168154–168165, https://doi.org/10.1109/ACCESS.2020.3023544, 2020. a
Arteaga, M. U., Lacerda, V. A., Bellmunt, O. G., and Mañe, M. C.: Taking advantage of PV systems for multi-period optimal reactive power dispatch: A Convex Optimization Approach, in: 2023 IEEE PES Innovative Smart Grid Technologies Europe (ISGT EUROPE), 1–5, https://doi.org/10.1109/ISGTEUROPE56780.2023.10408242, 2023. a
Bynum, M. L., Hackebeil, G. A., Hart, W. E., Laird, C. D., Nicholson, B. L., Siirola, J. D., Watson, J.-P., and Woodruff, D. L.: Pyomo – Optimization Modeling in Python, 3rd edn., Springer, https://doi.org/10.1007/978-3-030-68928-5, 2021. a
Cao, J. and Yan, Z.: AC/DC optimal power flow problem considering wind farm integration, in: 2016 IEEE Power and Energy Society General Meeting (PESGM), 1–5, https://doi.org/10.1109/PESGM.2016.7741125, 2016. a
Dozein, M. G., De Corato, A. M., and Mancarella, P.: Virtual Inertia Response and Frequency Control Ancillary Services From Hydrogen Electrolyzers, IEEE Transactions on Power Systems, 38, 2447–2459, https://doi.org/10.1109/TPWRS.2022.3181853, 2023. a
Elexon: BMRS Market Index Prices, https://bmrs.elexon.co.uk/market-index-prices (last access: 30 January 2026), 2025. a
Elia Group: Update on Princess Elisabeth Island, https://www.eliagroup.eu/en/press/2025/02/20250206_update-princess-elisabeth-island (last access: 3 February 2026), 2025. a
ENTSO-E: Transparency Platform, https://newtransparency.entsoe.eu/ (last access: 30 January 2026), 2025. a
Ergun, H., Dave, J., Van Hertem, D., and Geth, F.: Optimal Power Flow for AC–DC Grids: Formulation, Convex Relaxation, Linear Approximation, and Implementation, IEEE Transactions on Power Systems, 34, 2980–2990, https://doi.org/10.1109/TPWRS.2019.2897835, 2019. a
European Commission: A Hydrogen Strategy for a Climate-Neutral Europe, https://eur-lex.europa.eu/legal-content/EN/TXT/?uri=CELEX:52020DC0301 (last access: 30 January 2026), 2020. a, b
Federal Public Service Economy of Belgium: Digital Database Princess Elisabeth zone, Wind Resource Assessment, https://offshore.digital-database.economie.fgov.be/#/category/59 (last access: 20 December 2023), 2024. a, b
Garces, A.: Optimal power flow, 171–193, https://doi.org/10.1002/9781119747291.ch10, 2022. a
International Energy Agency: Net Zero by 2050: A Roadmap for the Global Energy Sector, Report, International Energy Agency, https://www.iea.org/reports/net-zero-by-2050 (last access: 30 January 2026), 2021. a
Ju, Y., Chen, C., Wu, L., and Liu, H.: General Three-Phase Linear Power Flow for Active Distribution Networks With Good Adaptability Under a Polar Coordinate System, IEEE Access, 6, 34043–34050, https://doi.org/10.1109/ACCESS.2018.2839641, 2018. a
Katic, I., Højstrup, J., and Jensen, N. O.: A Simple Model for Cluster Efficiency, in: EWEC'86. Proceedings, A. Raguzzi, Rome, European Wind Energy Association Conference and Exhibition, 7–9 October 1986, Rome, Italy, vol. 1, 407–410, https://orbit.dtu.dk/files/106427419/A_Simple_Model_for_Cluster_Efficiency_EWEC_86_.pdf (last access: 30 January 2026), 1987. a
Korompili, A., Wu, Q., and Zhao, H.: Review of VSC HVDC connection for offshore wind power integration, Renewable and Sustainable Energy Reviews, 59, 1405–1414, https://doi.org/10.1016/j.rser.2016.01.064, 2016. a
Liu, F., Fredriksson, A., and Markidis, S.: A survey of HPC algorithms and frameworks for large-scale gradient-based nonlinear optimization, J. Supercomput., 78, 17513–17542, https://doi.org/10.1007/s11227-022-04555-8, 2022. a
Lüth, A., Werner, Y., Egging-Bratseth, R., and Kazempour, J.: Electrolysis as a flexibility resource on energy islands: The case of the North Sea, Energy Policy, 185, 113921, https://doi.org/10.1016/j.enpol.2023.113921, 2024. a
Matute, G., Yusta, J., Beyza, J., and Correas, L.: Multi-state techno-economic model for optimal dispatch of grid connected hydrogen electrolysis systems operating under dynamic conditions, International Journal of Hydrogen Energy, 46, 1449–1460, https://doi.org/10.1016/j.ijhydene.2020.10.019, 2021. a, b
Mohy-ud-din, G., Heidari, R., Ergun, H., and Geth, F.: AC–DC security-constrained optimal power flow for the Australian National Electricity Market, Electric Power Systems Research, 234, 110784, https://doi.org/10.1016/j.epsr.2024.110784, 2024. a
Neuwirth, M., Fleiter, T., Manz, P., and Hofmann, R.: The future potential hydrogen demand in energy-intensive industries – a site-specific approach applied to Germany, Energy Conversion and Management, 252, 115052, https://doi.org/10.1016/j.enconman.2021.115052, 2022. a
Østergaard, J., Christensen, E., Halsnæs, K., Riisager-Simonsen, C., Lisbjerg, D., Jensen, A., Duus, J., Madsen, H., Frandsen, H., Savaghebi, M., Zhang, W., Keles, D., Ladenburg, J., Vest, M., Seger, B., Mortensen, N., Sin, G., Kitzing, L., Kolios, A., Thomsen, K., Dominkovic, D., Katsanos, E., Zania, V., Riisager, A., Astrup, T., Sulayman, A., Hoffmann, U., Andersen, D., Brückner, L., Andersen, M., and Uhd, L.: Denmark as the Energy Island Pioneer, Technical University of Denmark, https://orbit.dtu.dk/en/publications/denmark-as-the-energy-island-pioneer/ (last access: 30 January 2026), 2023. a
Pozo, D.: Linear battery models for power systems analysis, Electric Power Systems Research, 212, 108565, https://doi.org/10.1016/j.epsr.2022.108565, 2022. a, b
Raheli, E., Werner, Y., and Kazempour, J.: A conic model for electrolyzer scheduling, Computers & Chemical Engineering, 179, 108450, https://doi.org/10.1016/j.compchemeng.2023.108450, 2023. a
Rodrigues, S., Restrepo, C., Kontos, E., Teixeira Pinto, R., and Bauer, P.: Trends of offshore wind projects, Renewable and Sustainable Energy Reviews, 49, 1114–1135, https://doi.org/10.1016/j.rser.2015.04.092, 2015. a
Teng, Y., Wang, Z., Li, Y., Ma, Q., Hui, Q., and Li, S.: Multi-energy storage system model based on electricity heat and hydrogen coordinated optimization for power grid flexibility, CSEE Journal of Power and Energy Systems, 5, 266–274, https://doi.org/10.17775/CSEEJPES.2019.00190, 2019. a
Ueckerdt, F., Verpoort, P. C., Anantharaman, R., Bauer, C., Beck, F., Longden, T., and Roussanaly, S.: On the cost competitiveness of blue and green hydrogen, Joule, 8, 104–128, https://doi.org/10.1016/j.joule.2023.12.004, 2024. a
Ulleberg, Ø.: Modeling of advanced alkaline electrolyzers: a system simulation approach, International Journal of Hydrogen Energy, 28, 21–33, https://doi.org/10.1016/S0360-3199(02)00033-2, 2003. a
Useche-Arteaga, M., Gomis-Bellmunt, O., Cheah-Mane, M., Lacerda, V., and Gebraad, P.: AC energy islands for the optimal integration of offshore wind energy resources: Operation strategies using multi-objective nonlinear programming, Sustainable Energy, Grids and Networks, 40, 101576, https://doi.org/10.1016/j.segan.2024.101576, 2024. a, b, c
Useche-Arteaga, M., Gebraad, P. M. O., Lacerda, V. A., Cheah-Mane, M., Castro Valerio, B., and Gomis-Bellmunt, O.: Energy Islands: Opportunities, Challenges, and Topologies, IEEE Access, 13, 194366–194381, https://doi.org/10.1109/ACCESS.2025.3632648, 2025. a, b
Useche-Arteaga, M., Pieter, G., Albernaz Lacerda, V., Cheah-Mane, M., and Gomis-Bellmunt, O.: Optimizing the Operation of Energy Islands with Predictive Nonlinear Programming – A case study based on the Princess Elisabeth Energy Island, Zenodo [code], https://doi.org/10.5281/zenodo.18414805, 2026. a
Valerio, B. C., Lacerda, V. A., Cheah-Mane, M., Gebraad, P., and Gomis-Bellmunt, O.: An optimal power flow tool for AC/DC systems, applied to the analysis of the North Sea Grid for offshore wind integration, IEEE Transactions on Power Systems, 1–14, https://doi.org/10.1109/TPWRS.2025.3533889, 2025. a, b
Van der Straeten, T.: Public consultation on the offshore wind tender for the Princess Elisabeth Zone, Official public consultation document, Belgian Federal Public Service Economy, https://economie.fgov.be/sites/default/files/Files/Energy/Public-consultation-on-the-offshore-wind-tender-for-the-Princess-Elisabeth-Zone.pdf (last access: 30 January 2026), 2022. a
Viaene, P., Baert, P., Ghysels, V., Remy, X., Czupper, L., and Aerts, W.: Belgian offshore wind – upcoming tendering of the Princess Elisabeth zone, Clifford Chance, https://www.cliffordchance.com/content/dam/cliffordchance/briefings/2023/07/belgian-offshore-wind-tenders-final.pdf (last access: 30 January 2026), 2022. a
Wächter, A. and Biegler, L. T.: On the implementation of an interior-point filter line-search algorithm for large-scale nonlinear programming, Mathematical Programming, 106, 25–57, https://doi.org/10.1007/s10107-004-0559-y, 2006. a
Werner, Y.: Modeling Electrolyzers and Gas Networks for Integration with Power Systems, PhD thesis, Technical University of Denmark, https://doi.org/10.11581/DTU.00000301, 2023. a
Williams, R. and Zhao, F.: Global Offshore Wind Report 2023, Global Wind Energy Council, https://yenader.org/wp-content/uploads/2023/09/GWEC-Global-Offshore-Wind-Report-2023.pdf (last access: 30 January 2026), 2023. a, b
Xiang, M., Yu, J., Yang, Z., Yang, Y., Yu, H., and He, H.: Probabilistic power flow with topology changes based on deep neural network, International Journal of Electrical Power & Energy Systems, 117, 105650, https://doi.org/10.1016/j.ijepes.2019.105650, 2020. a
Yang, J., Chi, H., Cheng, M., Dong, M., Li, S., and Yao, H.: Performance analysis of hydrogen supply using curtailed power from a solar-wind-storage power system, Renewable Energy, 212, 1005–1019, https://doi.org/10.1016/j.renene.2023.05.094, 2023. a
Yang, Y., Hong, W., and Li, S.: Deep ensemble learning based probabilistic load forecasting in smart grids, Energy, 189, 116324, https://doi.org/10.1016/j.energy.2019.116324, 2019. a
Youwind: Youwind Application, a web-based wind park development tool, https://app.youwindrenewables.com (last access: 30 January 2026), 2025. a, b
Zahle, F., Barlas, A., Lønbæk, K., Bortolotti, P., Zalkind, D., Wang, L., Labuschagne, C., Sethuraman, L., and Barter, G.: Definition of the IEA Wind 22-Megawatt Offshore Reference Wind Turbine, Technical University of Denmark, dTU Wind Energy Report E-0243 IEA Wind TCP Task 55, https://doi.org/10.11581/DTU.00000317, 2024. a
- Abstract
- Introduction
- General concept and operational strategies of AC/DC energy islands
- Mathematical formulation for the optimal operation of AC/DC energy islands
- Energy island Princess Elisabeth: test system description and simulation scenarios
- Results and analysis of the Princess Elisabeth Energy Island operation
- Conclusions
- Appendix A: Array cable parameters
- Code and data availability
- Author contributions
- Competing interests
- Disclaimer
- Acknowledgements
- Financial support
- Review statement
- References