
the Creative Commons Attribution 4.0 License.
the Creative Commons Attribution 4.0 License.
 | 13 Nov 2026
Multi-scale simulations of wind farm impacts on nighttime near-surface temperature in complex terrain
Paul Boumendil
Pierre-Antoine Joulin

Quentin Rodier
Valéry Masson
Various studies have shown that wind turbine wakes can induce temperature variations. Investigating these effects near the ground is particularly important for assessing their potential impact on vegetation and human activities. In this study, the multi-scale Meso-NH/SURFEX/EOL modeling framework, which includes coupled atmosphere, land-surface and actuator models, is used to evaluate the impact of the Ensemble Éolien Catalan wind farm on ground and near-surface temperatures, as well as terrain-specific flow dynamics during a stable nocturnal radiative cooling event associated with frost risk in nearby vineyards. The simulations are performed using nested domains to dynamically downscale the atmospheric conditions from the operational weather forecast AROME-1.3km to a horizontal resolution of 5 m, allowing explicit representation of turbine wakes through rotative actuator disk representation. Turbine-induced meteorological variations are quantified by comparing simulations performed with and without the actuator model. The results reveal that near-surface meteorological responses arise from the combined influence of individual turbine wakes and the large-scale impact of the wind farm, which modifies the flow dynamics and temperature field. In the wind farm, a mean near-surface warming of approximately 0.4 °C is found, with localized temperature increases reaching up to 1.6 °C in the near wake of individual turbines. The strongest perturbations occur for turbines located within valleys, where strong temperature inversions enhance turbine-induced temperature changes. In addition, the wind farm shifts the position of a convergence zone associated with a katabatic flow by about 100–400 m, producing warming anomalies of up to 2 °C along the displaced meteorological front.
- Article
(22773 KB) - Full-text XML
- BibTeX
- EndNote


The expansion in both the size and number of wind turbines within wind farms raises increasing concerns about their potential meteorological impacts. Field measurement campaigns (Archer et al., 2019; Rajewski et al., 2013; Smith et al., 2013), numerical simulations (Baidya Roy et al., 2004; Xie and Archer, 2017; Wu et al., 2023; Adkins and Sescu, 2018; Joulin et al., 2020) and satellite measurements (Zhou et al., 2012) have revealed measurable modifications in temperature and humidity parameters downstream of wind farms. The sign and magnitude of these meteorological variations appear to be primarily governed by the thermal structure of the atmosphere (Archer et al., 2019; Wu and Archer, 2021), and thus by its stability. Under stable conditions, near-ground air temperature increases above +2 °C have been reported between the upstream and downstream regions of wind farms (Henschen et al., 2011). In contrast, under unstable stratification, studies report either no significant change or a weak cooling effect up to −0.7 °C (Rajewski et al., 2013). Those enhanced nighttime temperatures and associated microclimatic changes may reduce dew duration and modify moisture availability, potentially impacting crop respiration, photosynthesis and soil decomposition rates (Armstrong et al., 2014; Adkins and Sescu, 2017). Consistently, the economic study by Kaffine (2019) reported a positive correlation between wind farm development and crop productivity, suggesting that wind-farm-induced microclimatic changes may contribute to improved growing conditions. Wind farms have also been linked to mixed impacts on vegetation cover, plant growth and diversity, depending on regional climate and land-use conditions. While some studies report reduced vegetation growth (Tang et al., 2017) or species diversity primarily due to land disturbance during construction and incomplete ecological recovery (Urziceanu et al., 2021), others observe neutral or even positive effects, such as enhanced vegetation growth under arid conditions linked to reduced evapotranspiration (Qin et al., 2022). Although assessing such ecological and agricultural outcomes lies beyond the scope of this study, understanding them critically depends on accurately characterizing near-surface temperature modifications. Not only are atmospheric modifications relevant for understanding the environmental footprint of wind farms, but they also have implications for their operational performance. Changes in temperature and therefore stability can affect downstream turbine loads, wake recovery and power production (Rajewski et al., 2013; Porté-Agel et al., 2020). Consequently, a comprehensive understanding of wind turbine–atmosphere–surface interactions across all scales is essential to assess both the energy and environmental aspects of wind turbines.
To investigate wind-turbine-induced meteorological variations and their underlying mechanisms, numerical studies have been conducted using roughness-length (Keith et al., 2004) and farm parameterizations (Baidya Roy et al., 2004; Baidya Roy and Traiteur, 2010; Baidya Roy, 2011; Quint et al., 2025) to model the effects of wind turbines. Given the coarse spatial resolutions and low-fidelity wind farm parameterizations used in the first studies on this subject, such effects were primarily attributed to the turbulent kinetic energy (TKE) added by wind turbine wakes, which enhances vertical mixing. To gain further insight into the micro-scale mechanisms, high-resolution large-eddy simulations (LES) coupled with actuator models have been used to allow a high-fidelity representation of individual wake structures. Those studies showed that the vertical movement induced by the counter-rotation of the wake in response to the blade rotation (Wu and Porté-Agel, 2011; Mirocha et al., 2014) disrupts the background atmospheric stratification. These local anomalies are then advected by the wind, resulting in temperature and humidity variations that can extend well below the rotor area (Adkins and Sescu, 2017; Xie and Archer, 2017; Joulin et al., 2020; Boumendil et al., 2024, 2025). These studies highlight the need for turbine parameterizations that explicitly account for rotational effects, as the blade and wake rotation plays a key role in the vertical movements and in the resulting meteorological modifications (Boumendil et al., 2024). At the same time, the VERTEX field campaign (Archer et al., 2019) and recent LES studies (Wu et al., 2023) have shown that near the surface, temperature variations can occur even in the absence of increased TKE and may even coincide with a reduction in TKE. This challenges the hypothesis that enhanced vertical mixing is the only mechanism driving near-ground temperature changes in turbine wakes. Instead, Archer et al. (2019) and Wu et al. (2023) suggest that, in the presence of turbine wakes, the vertical convergence of turbulent heat flux below hub height plays a dominant role in driving near-surface temperature changes. Overall, these results highlight the importance of the spatial scale at which the phenomenon is investigated in determining the underlying physical mechanisms. Coherent vertical movements within individual turbine wakes, which are resolved in LES, may appear only as added TKE in low-fidelity simulations using farm parameterizations.
While the coupling between LES and actuator methods provides valuable information on wake dynamics and turbulence, the LES are most often performed under idealized and stationary conditions, with prescribed initial uniform atmospheric states. Such simplifications neglect the dynamic nature of the real atmosphere, which continuously evolves across spatial and temporal scales in terms of stability, turbulence, fluxes, wind speed and wind direction. They also neglect the heterogeneity of the surface in terms of orography, changes in surface roughness and land cover. Yet, these factors critically determine the wake behavior and its potential impact on the near-surface air (Porté-Agel et al., 2020). In complex terrain, the interplay between topographic flow acceleration over ridges, downhill flow separation and heterogeneous land cover creates highly localized flow features (Kale et al., 2023; Al Oqaily et al., 2025). To account for these processes, we employ a multi-scale online coupling approach, referred to as Meso-NH/SURFEX/EOL. This framework combines the LES atmospheric model Meso-NH (Lac et al., 2018) with the SURFEX land surface scheme (Masson et al., 2013) and the actuator disk model with rotation (ADR) (Wu and Porté-Agel, 2011) implemented in the EOL module (Joulin, 2019; Boumendil et al., 2024). This setup dynamically downscales atmospheric conditions from the mesoscale down to the microscale over complex terrain, resolving both turbine wake rotational dynamics and fine-scale surface–atmosphere exchanges. In our previous work (Boumendil et al., 2025), this coupling framework was developed and validated against the VERTEX measurement campaign (Archer et al., 2019) in a single-turbine configuration, demonstrating its capability to reproduce realistic atmospheric conditions and capture wake interactions within transitioning boundary layers.
In the present paper, we extend this approach to a real wind farm located near Perpignan (France), called Ensemble Éolien Catalan, located within the complex terrain of the Languedoc vineyards. Hilly and complex terrains represent strategic sites for wind energy deployment due to local flow acceleration, yet accurately modeling turbine wakes in such environments remains challenging due to complex terrain-driven flows, canopy interactions and nocturnal thermal circulations (Fernando et al., 2019; Kale et al., 2023; Al Oqaily et al., 2025). The objective of this study is to investigate the effect of a wind farm in hilly terrain on the wind speed, near-surface temperature, ground temperature and terrain-specific meteorological phenomena. The study aims to determine how the wind farm and the evolving mesoscale environment (including nocturnal stability, heterogeneous temperature distribution and terrain-driven flows) jointly influence meteorological changes induced by the wind turbines.
Previous studies have shown that the most pronounced wind-turbine-induced near-ground meteorological variations occur under stable atmospheric conditions, when the near-ground temperature lapse rate is high. In such situations, vertical movements in turbine wakes can significantly alter the naturally stratified structure of the nocturnal boundary layer. To investigate a case characterized by a strong nocturnal temperature inversion, we select the night of 7–8 April 2021, during which nocturnal frost events were reported across Europe, affecting 80 % of the fruit orchards and vineyards in France (Lamichhane, 2021). A means of protection used by winemakers consists of small fan towers to mix the near-surface air. The objective is to blow the ground cold layer of air and enhance sensible heat transfer from the air to the plants (Snyder and de Melo-Abreu, 2005). In this context, we aim to evaluate how the Ensemble Éolien Catalan wind farm interacts with the stable atmosphere shaped by the surrounding complex terrain and how it may locally increase near-surface temperatures in the context of nocturnal frost over the surrounding vineyards.
This section presents the characteristics of the selected wind farm and its surrounding environment. The meteorological conditions of the study period are then described.
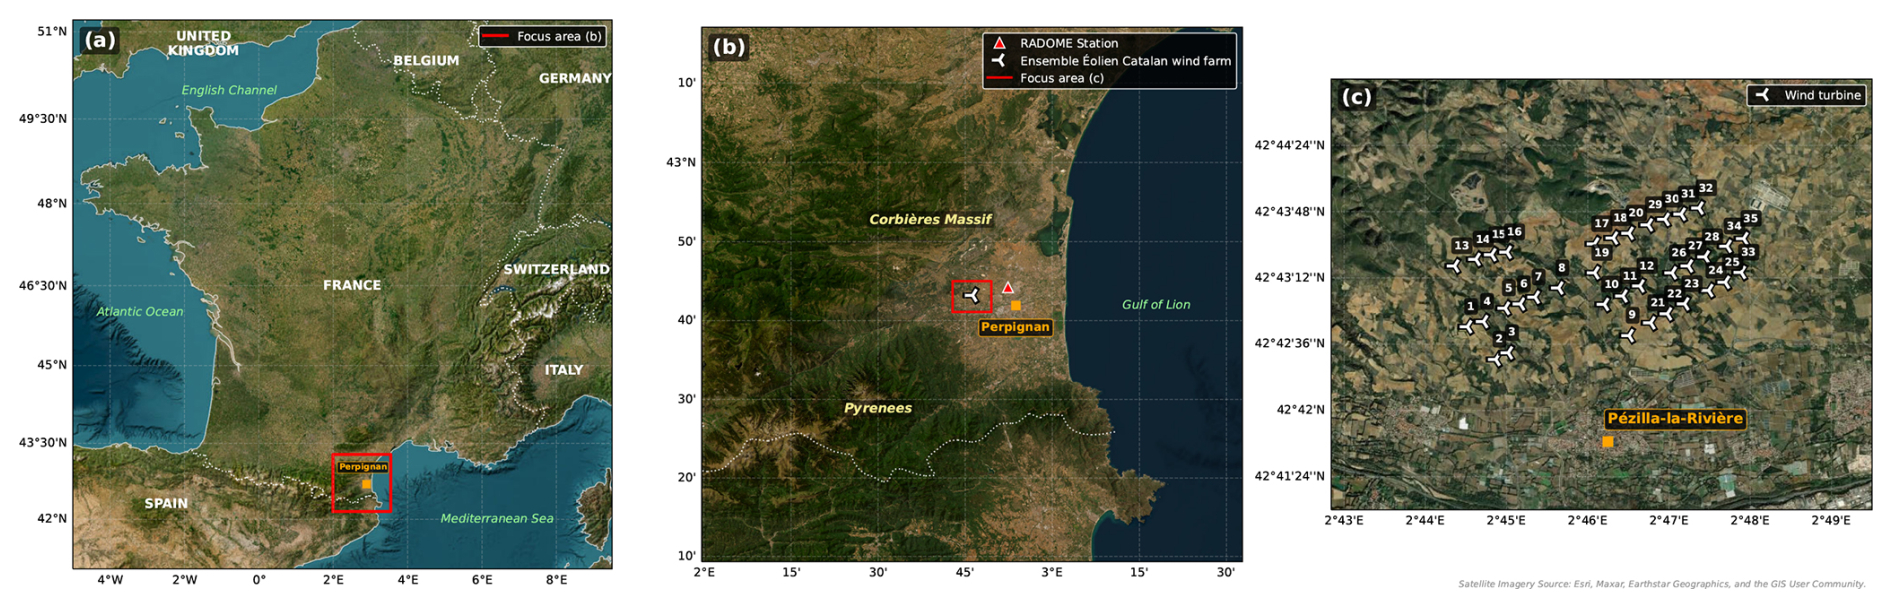
Figure 1Location map and surrounding geographical context of the study site: (a) national location, (b) regional geography and topographic context, (c) layout of the Ensemble Éolien Catalan wind farm (satellite data from Esri | Powered by Esri, © Vexcel Imaging, © Earthstar Geographics, © GIS User Community https://services.arcgisonline.com/ArcGIS/rest/services/World_Imagery/MapServer, last access: 15 October 2026).
2.1 Wind farm: Ensemble Éolien Catalan
We selected the Ensemble Éolien Catalan wind farm, located west of Perpignan in south of France (Fig. 1). The wind farm for the study was selected based on three main criteria: its location in France, which allows the use of the AROME model as atmospheric forcing (Seity et al., 2011); the presence of a sufficiently large number of closely spaced turbines to investigate inter-turbine interactions; and its location within vineyards. This wind farm offers several other features that make it particularly suitable for our study: the proximity of a RADOME meteorological station (Tardieu and Leroy, 2003) to validate the simulated atmosphere and the combined influence of the Mediterranean Sea and the Pyrenees on meteorological dynamics.
The Catalan wind farm consists of 35 turbines, including 9 Vestas V80 (2 MW) and 26 Vestas V90 (3 MW), resulting in a total installed capacity of 96 MW. The turbines are irregularly arranged in approximately four east-northeast-oriented rows, forming a rectangular layout of about 5 km in length and 2 km in width (farm layout in Fig. 1c). The orientation of the rows is perpendicular to the prevailing regional winds, which predominantly blow from the north-northwest direction.
The area surrounding the Catalan wind farm is characterized by a complex landscape that combines coastal, mountainous and agricultural features. To the east and southeast we find the proximity of the Mediterranean Sea. To the north and west, the terrain rises gradually toward the Corbières and Pyrénées mountains, which are mainly covered by forested and shrubland areas, creating complex orography. The immediate vicinity of the Catalan wind farm is mostly occupied by vineyards (purple in Fig. 3) with smaller patches of cereal crops and orchards. Further away, particularly toward the mountains, the landscape includes forest, Mediterranean shrubland and scattered rural villages. This combination of orography, vegetation types and proximity to the sea makes the region particularly suitable for studying wind farm–atmosphere interactions under realistic, heterogeneous conditions and local wind effects.
2.2 Case study: night of 7–8 April 2021
As reported in the literature, wind-turbine-induced meteorological variations are more pronounced under strongly stratified and stable atmospheric conditions. These situations also correspond to cases where wind turbine wake extends longer, enhancing interactions between turbines within the wind farm. To investigate such situations, we focus on the night of 7–8 April 2021, during which a strong near-surface cooling event occurred across all of France, leading to nocturnal frost (Fig. 2). According to the FNSEA (French National Federation of Farmers' Unions), this episode destroyed up to one-third of the national vineyard production, corresponding to an estimated economic loss of nearly EUR 2 billion. In the Languedoc-Roussillon region, where the Catalan wind farm is located, losses reached approximately 70 % of vineyard areas, with local minima down to −5.5 °C reported by the president of the southern branch of the AOC (Appellation d'Origine Contrôlée; French protected designation of origin) federation. According to the AROME model, on 8 April at 05:00 UTC, the hub-height wind speed at the center of the wind farm was approximately 4.8 m s−1 from the north-northeast (24°), with sunrise occurring at 05:20 UTC.
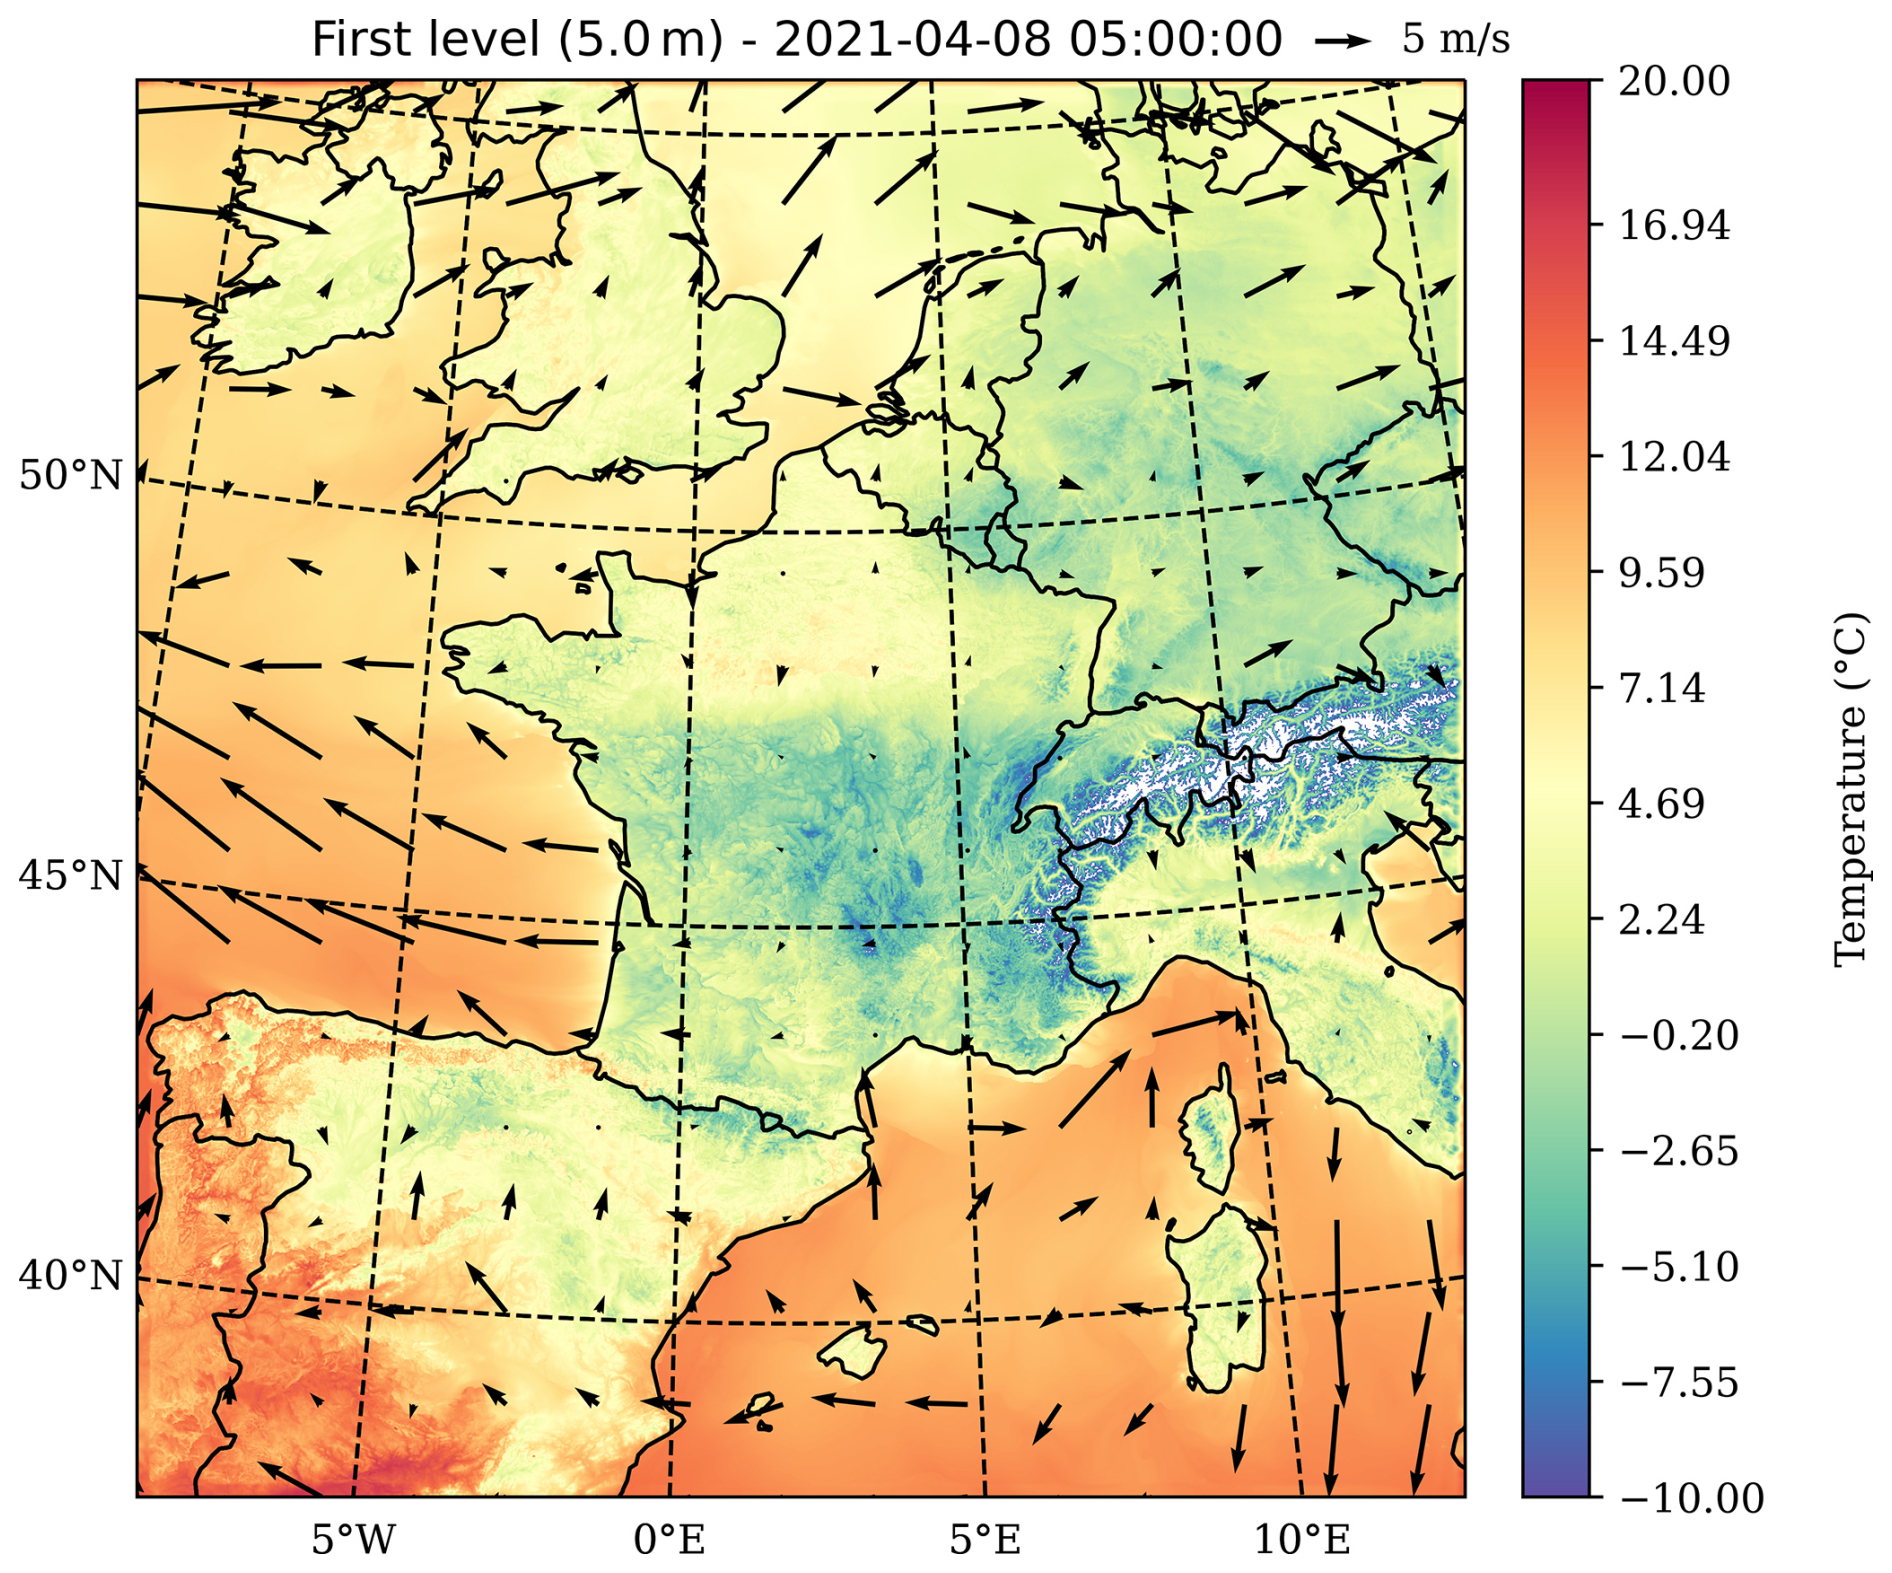
Figure 2Temperature and wind speed on 8 April 2021 at 05:00 at the first level of AROME (5 m): negative near-ground temperatures affected nearly two-thirds of southern France during that night.
These extreme temperature conditions resulted from the synoptic situation prevailing at the beginning of April 2021 in Europe, characterized by a persistent anticyclone positioned south of Iceland combined with a low-pressure system over the Iberian Peninsula. This situation generated clear skies and dry air over most of France, creating favorable conditions for intense radiative cooling during nighttime. Additionally, two intrusions of cold and dry polar air affected France during the first half of April, as reported by Météo-France in its April 2021 climate bulletin (Lemoine and Pineaud, 2021). These combined conditions resulted in cold nights, with temperatures well below seasonal averages and several new cold records across the country.
This section describes the numerical framework used in this study. We employ a multi-scale online coupling approach, referred to as Meso-NH/SURFEX/EOL, combining the atmospheric model Meso-NH (Lac et al., 2018), the SURFEX land surface scheme (Masson et al., 2013) and the wind turbine module EOL (Joulin, 2019; Boumendil et al., 2024). Similar multi-scale coupled setups have been widely used to investigate wind turbine (Wise et al., 2022; Kale et al., 2023; Mi et al., 2025) and wind farm (Rasheed et al., 2017; Wang et al., 2020) interactions with complex terrain or specific atmospheric phenomena (Bakhoday-Paskyabi et al., 2022). In our previous work (Boumendil et al., 2025), this multi-scale framework was established and validated against field campaign measurements (Archer et al., 2019), demonstrating its capability to capture turbine wake interactions across transitioning boundary layers. Below, the multi-scale setup and atmospheric configurations are presented first, followed by the surface exchange parameterizations and associated high-resolution datasets. Finally, the wind turbine parameterization and dynamic control mechanisms are detailed.
3.1 Multi-scale setup
Meso-NH is a non-hydrostatic and anelastic research atmospheric model developed by the Centre National de Recherches Météorologiques (CNRM – CNRS/Météo France) and the Laboratoire d'Aérologie (LAERO – UPS/CNRS) (Lac et al., 2018). In this work, Meso-NH v5.7.1 is used to simulate the atmosphere from mesoscale to microscale, with the finest domains relying on an LES method. The objective of the numerical setup is to dynamically downscale atmospheric conditions from the French operational numerical weather prediction model AROME to resolutions compatible with the wind turbine actuator parameterization.
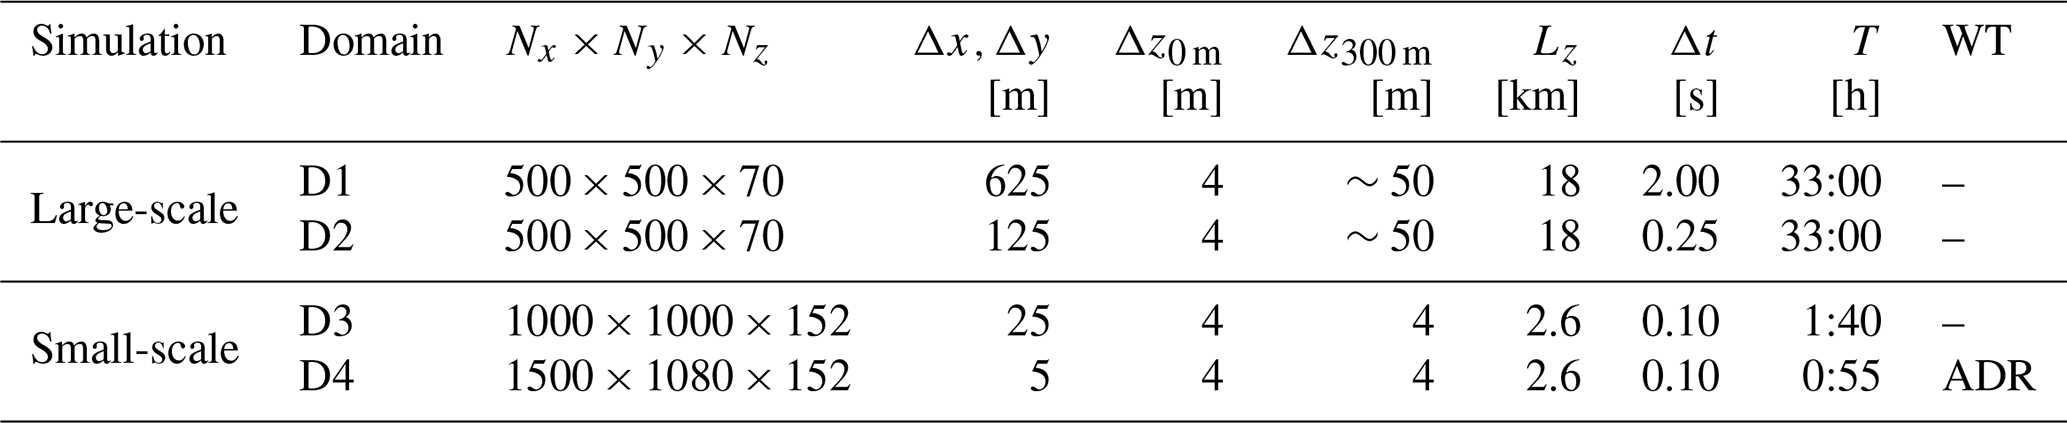
To achieve this, a numerical setup with four nested domains is used (illustrated in Fig. 3). Their characteristics are provided in Table 1. The configuration is divided into two successive offline coupled simulations. The first simulation, referred to as the large-scale, includes domains D1 and D2, which are two-way-nested and forced hourly at the lateral boundaries of domain D1 by AROME analyses. These analyses have a horizontal resolution of 1.3 km and 90 vertical levels. The large-scale simulation is run for 33 h and allows the flow to be downscaled to a horizontal resolution of 125 m. Then, 5 min outputs from this simulation are used to initialize and force the second simulation, referred to as the small-scale, which includes domains D3 and D4.
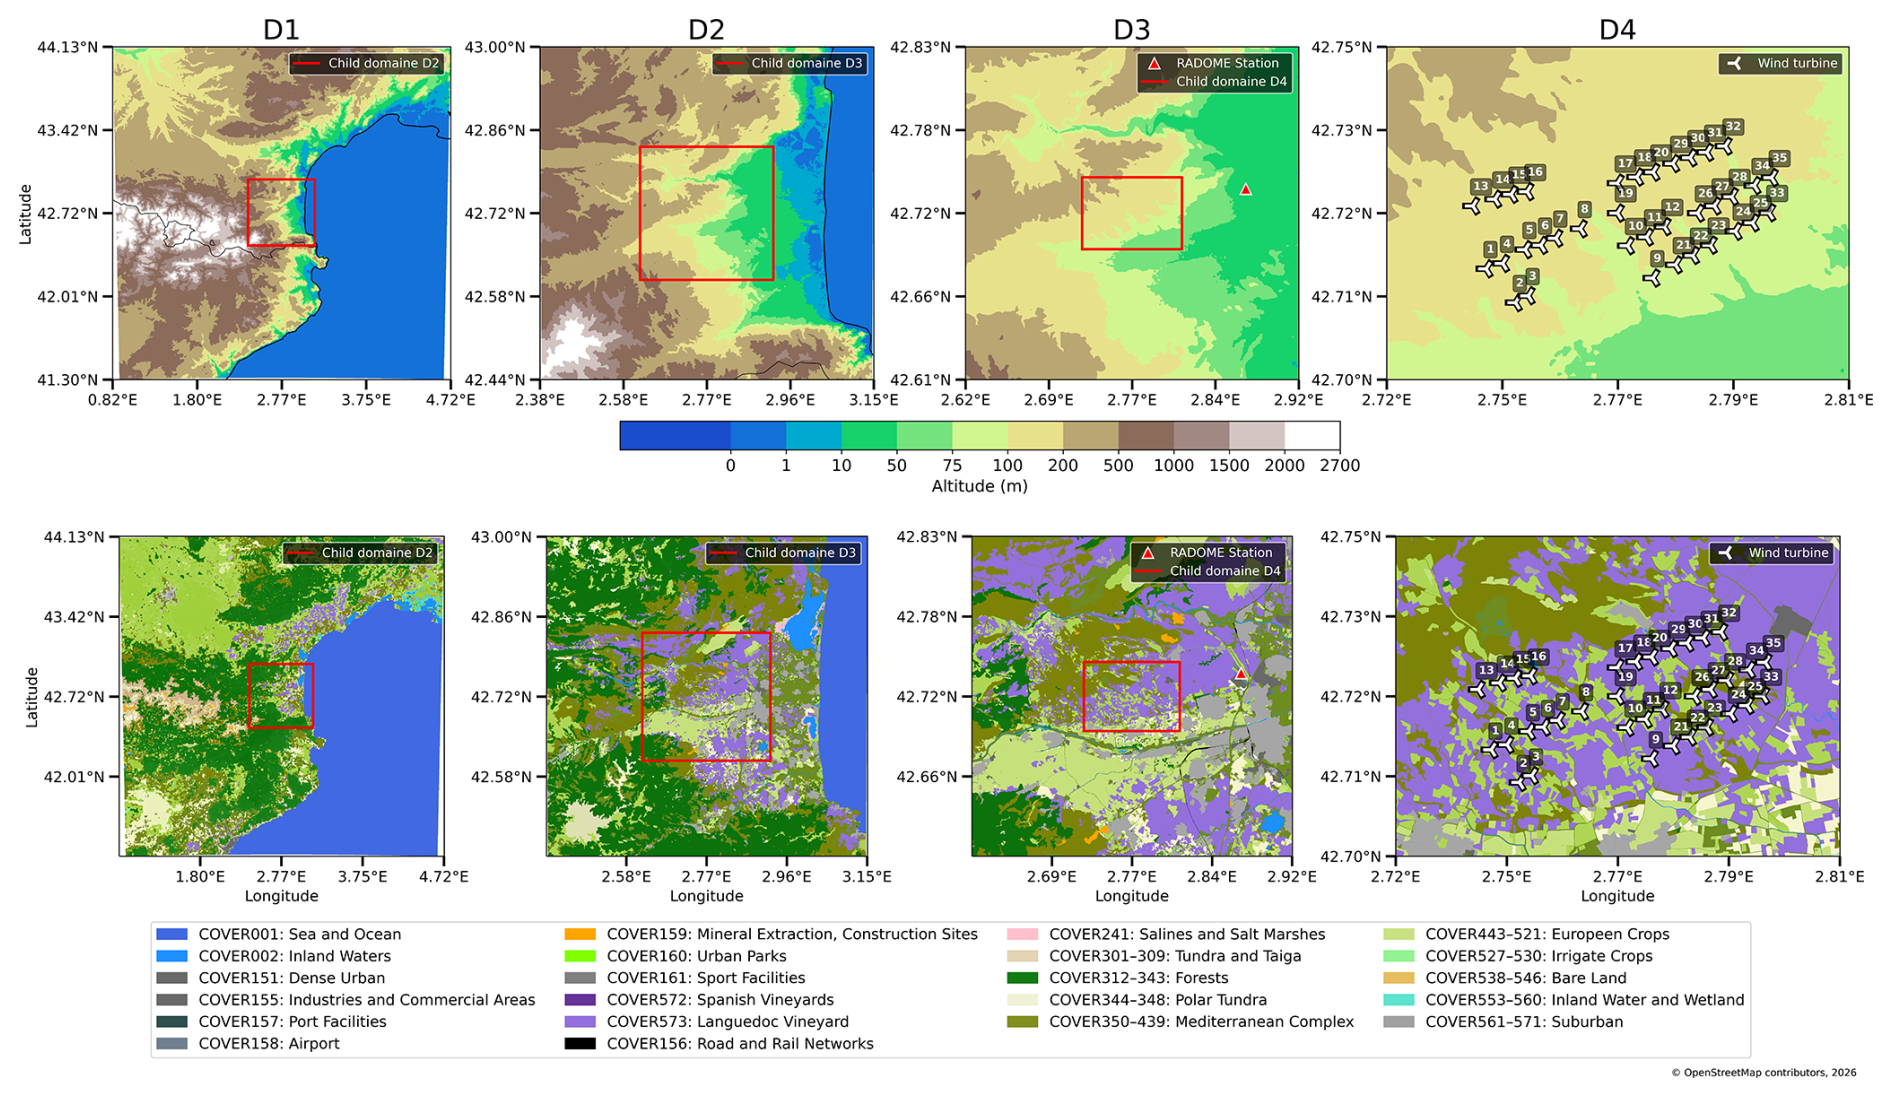
Figure 3Ground orography (top) and land cover (bottom) of the four nested domains. Positions of the wind turbines, RADOME station and child domains (with data from © OpenStreetMap contributors, 2026, OpenStreetMap and ECOCLIMAP-II data courtesy of Faroux et al., 2013).
This separation between the large-scale and small-scale simulation is motivated both by computational cost considerations and by the fact that Meso-NH does not allow vertical grid refinement between directly nested domains. This approach makes it possible to refine the vertical resolution only in the small-scale simulation, where the wind turbines are located. The domain D4 with a horizontal resolution of 5 m and a vertical resolution of 4 m encompasses the Catalan wind farm area. Its horizontal size was chosen to ensure that turbulence is fully developed before the flow reaches the wind turbines and the meteorological tower locations.
The complex topography and the large resolution jump prevent domain D4 from being directly initialized and run from the output of domain D2. Therefore, the small-scale simulation is first run using domain D3 alone for a 45 min spin-up period. The resulting atmosphere is then used to initialize domain D4. Finally, domains D3 and D4 are run in a one-way-nested configuration for a total duration of 55 min. To allow the small-scale atmospheric flow and turbine wakes to develop, the simulation includes a 25 min spin-up period, followed by a 30 min averaging period.
Table 1Characteristics of the numerical setup (: number of grid points in the x, y and z directions; Δx,Δy: horizontal grid resolution; Δz0 m: vertical grid resolution at the surface; Δz300 m: vertical grid resolution at 300 m altitude; Lz: domain height; Δt: time step; T: simulation duration; WT: wind-turbine representation).
3.2 Atmospheric parameterizations
The Meso-NH model solves the non-hydrostatic system of conservation equations for momentum, mass, humidity and other scalar variables, as well as a thermodynamic equation derived from entropy conservation (Lac et al., 2018). A detailed description of these governing equations and the model's formulation is available in Lafore et al. (1998). In this work, the choice is made to solve the pseudo-incompressible system of equations as defined by Durran (1989) to filter out acoustic modes and allow for an explicit time-stepping integration.
The prognostic variables include the three velocity components, the dry potential temperature and the mixing ratios of the water phases. The governing equations are formulated in flux form using the dry air density of a hydrostatic reference state at rest. Enforcing the corresponding continuity constraint requires solving an elliptic equation for the pressure perturbation.
These equations are formulated on a conformal projection plane to account for the Earth's sphericity and discretized horizontally and vertically on an Arakawa C grid using a height-based terrain-following coordinate system. Momentum transport is integrated in time with an explicit Runge–Kutta-centered fourth-order scheme paired with a centered fourth-order spatial discretization. Advection of meteorological scalars and water substances is handled via the piecewise parabolic method.
Subgrid-scale turbulence is parameterized using a three-dimensional, 1.5-order closure scheme based on a prognostic equation for the subgrid TKE (Cuxart et al., 2000), closed with a mixing length as defined by Deardorff (1980) and Honnert et al. (2021). Convective-scale motions are explicitly resolved across the finest nested grids; however, for domain D1, shallow convection is parameterized using the eddy-diffusivity–Kain–Fritsch parameterization (Pergaud et al., 2009). Radiation forcing terms are represented by the ecRad modular radiation scheme (Hogan and Bozzo, 2018) and the ICE3 mixed-phase single-moment microphysics scheme, which predicts mass mixing ratios for the six water categories (Caniaux et al., 1994; Pinty and Jabouille, 1998).
3.3 Surface parameterizations
An online coupling with the SURFEX v9.0 surface transfer model (Masson et al., 2013) is employed to finely model surface exchange with the atmosphere. Soil and vegetation effects are captured through the explicit multilayer model ISBA-DF (Boone et al., 2000; Decharme et al., 2011), which solves the heat and mass transfer equations in the soil with 14 vertical soil layers. Heat transfer is computed using Fourier's law, with soil thermal properties depending on soil texture, moisture and ice content. Water transfer is described using the mass-conservative mixed form of the Richards equation, accounting for both liquid water transport and water vapor diffusion. The surface heat flux into the soil–vegetation composite is determined by the surface energy balance, which partitions net radiation into sensible and latent heat fluxes (Masson et al., 2013). Urban effects are modeled using the Town Energy Balance (TEB) model (Masson, 2000). The detailed formulations of these physical processes are provided in the SURFEX scientific documentation (Le Moigne et al., 2018).
Usually, the SURFEX model is used with the global 1 km resolution ECOCLIMAP-II surface database (Faroux et al., 2013). However, in our case, its level of detail is insufficient for the resolution of domains D2, D3 and D4, as well as for accurate representation of the Catalan wind farm area. Therefore, a high-resolution surface database was created by extracting surface data from OpenStreetMap (OpenStreetMap contributors, 2026) using the GeoClimate tool (Bocher et al., 2021). The surface classes provided in OpenStreetMap were then manually converted into the cover classes defined in ECOCLIMAP-II and given as input to SURFEX (Fig. 3). While this method depends on somewhat arbitrary reclassification choices, it nevertheless provides a surface database that captures the fine-scale specification of the wind farm environment with a level of detail that does not exist in standard datasets, particularly at resolutions of 5 m.
However, transferring soil initial conditions from the 2-layer force-restore ISBA-FR model of AROME to a 14-layer soil representation is physically challenging, especially for deep soil temperatures. A strong sensitivity of the initial soil condition to the time of initialization was also identified. Technically, a multi-day surface spin-up would have been required to properly equilibrate the ISBA-DF soil profile, but this approach is computationally expensive. Instead, a simplified initialization was adopted, in which the 14 soil layers were initialized using the mean air temperature of the first AROME level over the previous 24 h. This method produced more realistic deep soil temperatures for April conditions and led to a nocturnal cooling closer to experimental observations (see Sect. 4.1).
3.4 Wind turbine parameterizations
3.4.1 Actuator disk
In Meso-NH, three wind turbine wake modeling approaches have been implemented and validated. The first one is the actuator disk with no rotation (ADNR), which consists of representing the wind turbine as a disk on which a thrust force is applied. Although computationally inexpensive, this approach does not account for blade rotation or detailed aerodynamic characteristics. The second one is the actuator line method (ALM) (Joulin et al., 2020), which provides a detailed representation of individual blade effects and wake dynamics. This approach is, however, computationally very expensive, as it requires high spatial and temporal resolutions to explicitly resolve blade rotation. To overcome these limitations and provide a compromise between accuracy and computational cost, the actuator disk model with rotation (ADR) has been implemented in Meso-NH since version 5.7.0 (Boumendil et al., 2024), offering a more affordable alternative while still capturing the rotational effects (Wu and Porté-Agel, 2011). A detailed description of its implementation is provided by Joulin (2019), while its validation is presented in Boumendil et al. (2024). As for the ALM, aerodynamic blade profiles along the span and their associated aerodynamic polars are used to compute the forces applied to the flow. These forces depend on the local incoming wind speed and on the rotational speed of each blade element. They are then applied to the atmospheric flow using a three-dimensional linear smearing method. A tip-loss correction function is also applied to avoid overestimation of loads near the blade-tip region.
As in our previous studies (Boumendil et al., 2024, 2025), a single equivalent 2 MW wind turbine is used to represent both the Vestas V80-2MW and V90-3MW turbines. The operating wind speed range of the wind turbine used is 3–24 m s−1, with a rated wind speed of 12.5 m s−1. This turbine is scaled while preserving its original airfoil data for the ADR model. To achieve this, the blade geometry is uniformly scaled to a rotor diameter of D=90 m, and the rotation speeds are adjusted to maintain an iso tip-speed ratio. Finally, the twist angle is modified to obtain, as output, thrust Ct and power Cp coefficients close to those of the Vestas.
The turbines of the Catalan wind farm are represented by 35 ADR, each discretized using an azimuthal mesh (Nθ=80) and a radial mesh (Nr=46). The spatial resolution of domain D4, in which the ADR is implemented, has been chosen to ensure at least 16 Meso-NH grid cells across the rotor diameter. The center of each actuator disk is positioned at a height of 80 m above the local terrain, accounting for the individual elevation of each turbine. The effects of the nacelle and the tower are not modeled.
3.4.2 Controlling
As in a real wind farm, each ADR experiences different wind speeds and directions, due to both atmospheric variability and wake interactions. Consequently, the operational parameters of each turbine are controlled individually. Several turbine controllers are available in Meso-NH/EOL. It allows the control of rotor speed, blade pitch angle and nacelle yaw orientation. For each of these parameters, one or several control strategies are available.
In this study, the rotor rotational speed and blade pitch angle are computed using a simple control strategy based on lookup tables. The reference incoming wind speed U∞ for each turbine is calculated as a spatial average over a disk located 1D upstream of the turbine, averaged over a 1 min time interval. The nacelle yaw angle is controlled dynamically. Similarly, the mean wind direction is evaluated every minute on a disk located 1D upstream of each turbine. At this interval, each ADR then progressively adjusts its nacelle angle at each model time step to align with the simulated wind direction.
This section presents the atmospheric conditions simulated before the activation of the ADR. First, the simulated atmospheric fields are evaluated against available observations. Then the large-scale atmospheric situation over the Languedoc-Roussillon region is described to provide the synoptic context of the event. Finally the analysis focuses on the atmospheric conditions over the wind farm area in the small-scale simulation, with particular attention to the horizontal and vertical structures of the flow that will interact with the turbines.
4.1 Comparison against the observations
The 5 min averaged time series of some meteorological variables from the large- and small-scale simulations are validated using measurements from the meteorological station located at the Perpignan airport (Fig. 4). This station is part of the operational surface observation network of Météo-France, known as RADOME (Tardieu and Leroy, 2003) (see position in domain D3 in Fig. 3). Consequently, only a limited set of meteorological variables is available, measured at 2 and 10 m above ground level. Evaluation is performed for the set of meteorological variables available from the RADOME observation network at this site. Vertical atmospheric profiles derived from domain D2 are also shown in Fig. A1.
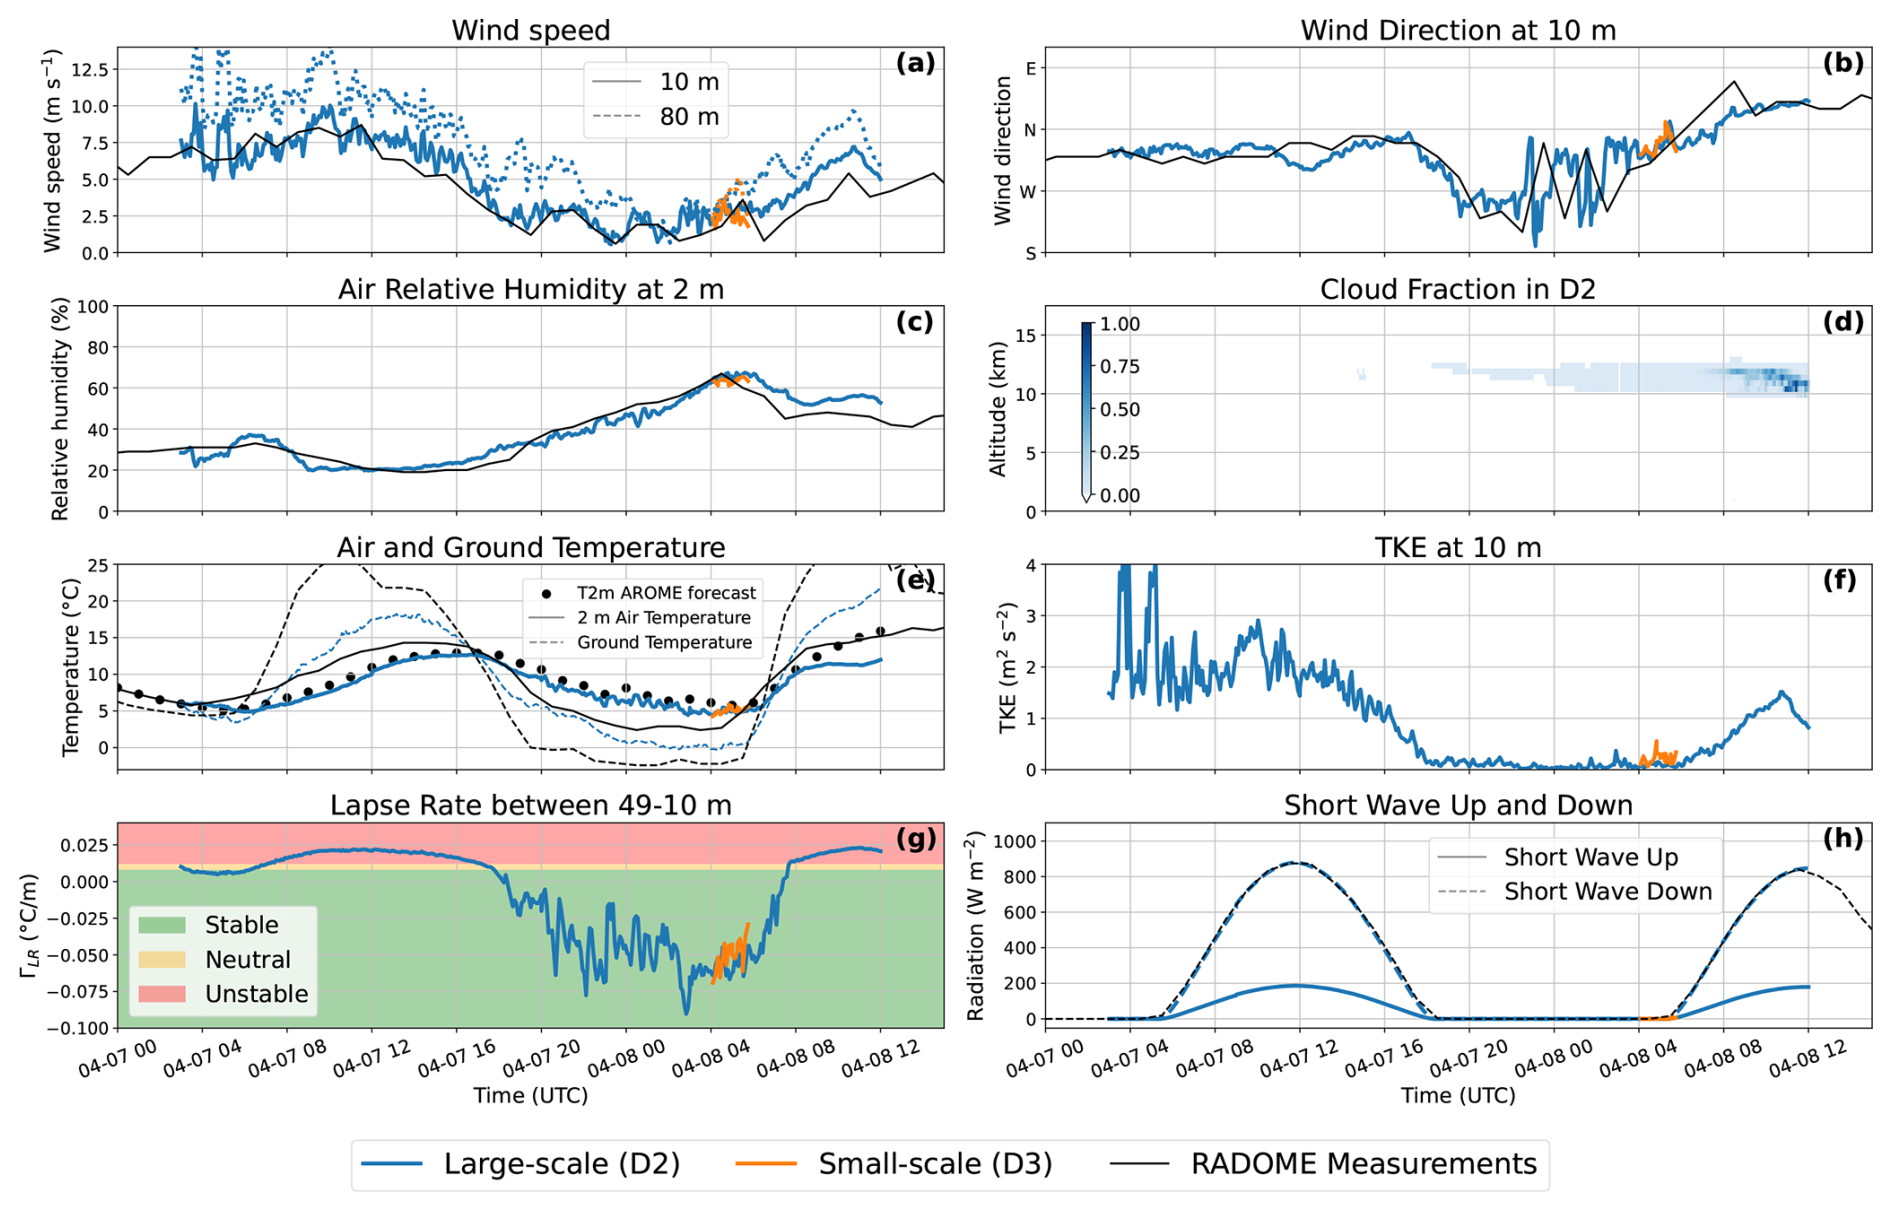
Figure 45 min averaged time series of (a) wind speed, (b) wind direction, (c) relative humidity, (d) cloud fraction, (e) air and ground temperature, (f) TKE, (g) static stability between 49 and 10 m, and (h) downward and upward shortwave heat flux at the Perpignan airport RADOME station in the domains D2 and D3 on 7–8 April 2021.
To quantitatively evaluate the performance of the simulation against observations, statistical validation metrics including mean bias error (BIAS), root mean square error (RMSE), systematic (RMSEs) and unsystematic (RMSEu) errors, and Willmott's index of agreement (d) were computed in accordance with the Willmott (1981, 1982) recommendations (Table 2). The simulation demonstrates overall good agreement with experimental observations across most evaluated parameters. High values of Willmott's index of agreement (d) are obtained for almost all variables, reflecting strong model skill in capturing atmospheric dynamics. As shown in Fig. 4a–b, the 10 m wind speed and direction closely match the observed time series, successfully reproducing both the daytime convective regime and the post-sunset wind weakening. This is supported by high Willmott's index values for domain D2 (d=0.944 for wind speed and d=0.971 for wind direction). Furthermore, for 10 m wind speed in D2, the unsystematic error exceeds the systematic error (), indicating that model discrepancies are predominantly driven by unresolvable random fluctuations rather than structural model deficiencies. The model also accurately captures the temporal variations in relative humidity (d=0.967) and shortwave downward radiation (d=1.000).
The main discrepancy between measurements and simulation occurs during nocturnal cooling. A warm bias of approximately 2–3 °C (RMSE of 2.60 °C) is observed in both the 2 m air temperature and surface temperature (solid and dotted lines in Fig. 4e). This bias is consistent with the driving AROME forecast (black dots in Fig. 4e). This nocturnal temperature discrepancy is directly reflected in the statistical metrics for temperature: Willmott's index drops to d=0.857, the lowest value among all evaluated variables, and the systematic error clearly dominates the unsystematic error (RMSEs=2.15 °C > RMSEu=1.47 °C). Several sensitivity experiments were conducted, including variations in the mixing-length formulation, soil model equations, soil temperature initialization and atmosphere–surface coupling coefficients. The results show a sensitivity of nocturnal cooling to these parameters; however, no combination was able to reproduce the observed cooling at the measurement site (not shown). Overall, the warm bias appears to be primarily linked to soil temperature overestimation, itself resulting from the initialization of subsurface temperatures in the ISBA-DF model. The revised methodology used to compute soil temperature, described in Sect. 3.3, improved nocturnal cooling but did not fully remove the bias. This highlights the complexity of modeling surface–atmosphere interactions and reproducing specific meteorological situations, even at high spatial resolutions (Kale et al., 2023; Bakhoday-Paskyabi et al., 2022).
This validation remains limited due to the availability of only a single near-surface measurement point and the lack of validation at rotor height in the absence of vertical-profile observations. Consequently, while near-surface measurements confirm the occurrence of nocturnal cooling, the exact vertical extent, inversion strength and thermal stratification of the real-world boundary layer cannot be quantitatively verified. The 2–3 °C surface warm bias introduces additional uncertainty regarding the exact magnitude of the simulated atmospheric stability compared to actual conditions. Nevertheless, the atmospheric conditions simulated here are consistent with the primary objective of this study: to simulate a physically consistent stable and stratified boundary layer to investigate its interaction with wind turbine and surface properties.
Table 2Statistical metrics comparing Meso-NH simulations (D2 and D3) with RADOME observations at Perpignan airport (7–8 April 2021). Metrics include observed mean (Obs), simulated mean (Sim), mean bias error (BIAS), root mean square error (RMSE), systematic RMSE (RMSEs), unsystematic RMSE (RMSEu) and Willmott's index of agreement (d). Statistical metrics d and RMSEu are omitted for domain D3 due to the 1 h 40 min simulation window relative to the hourly observation frequency of the RADOME station.
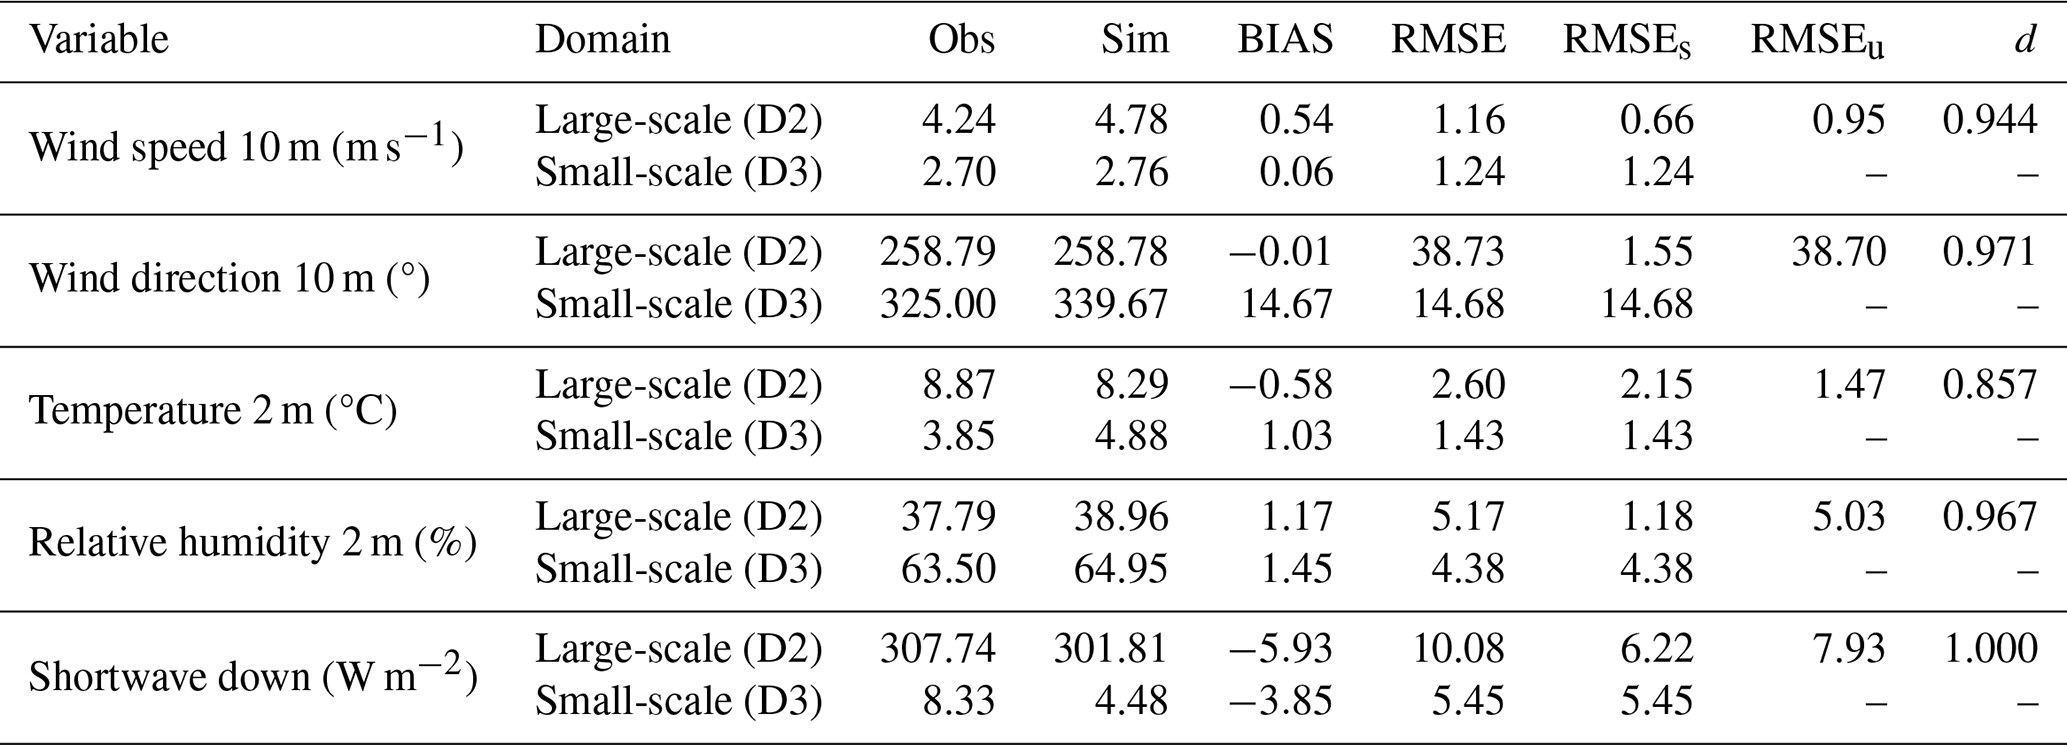
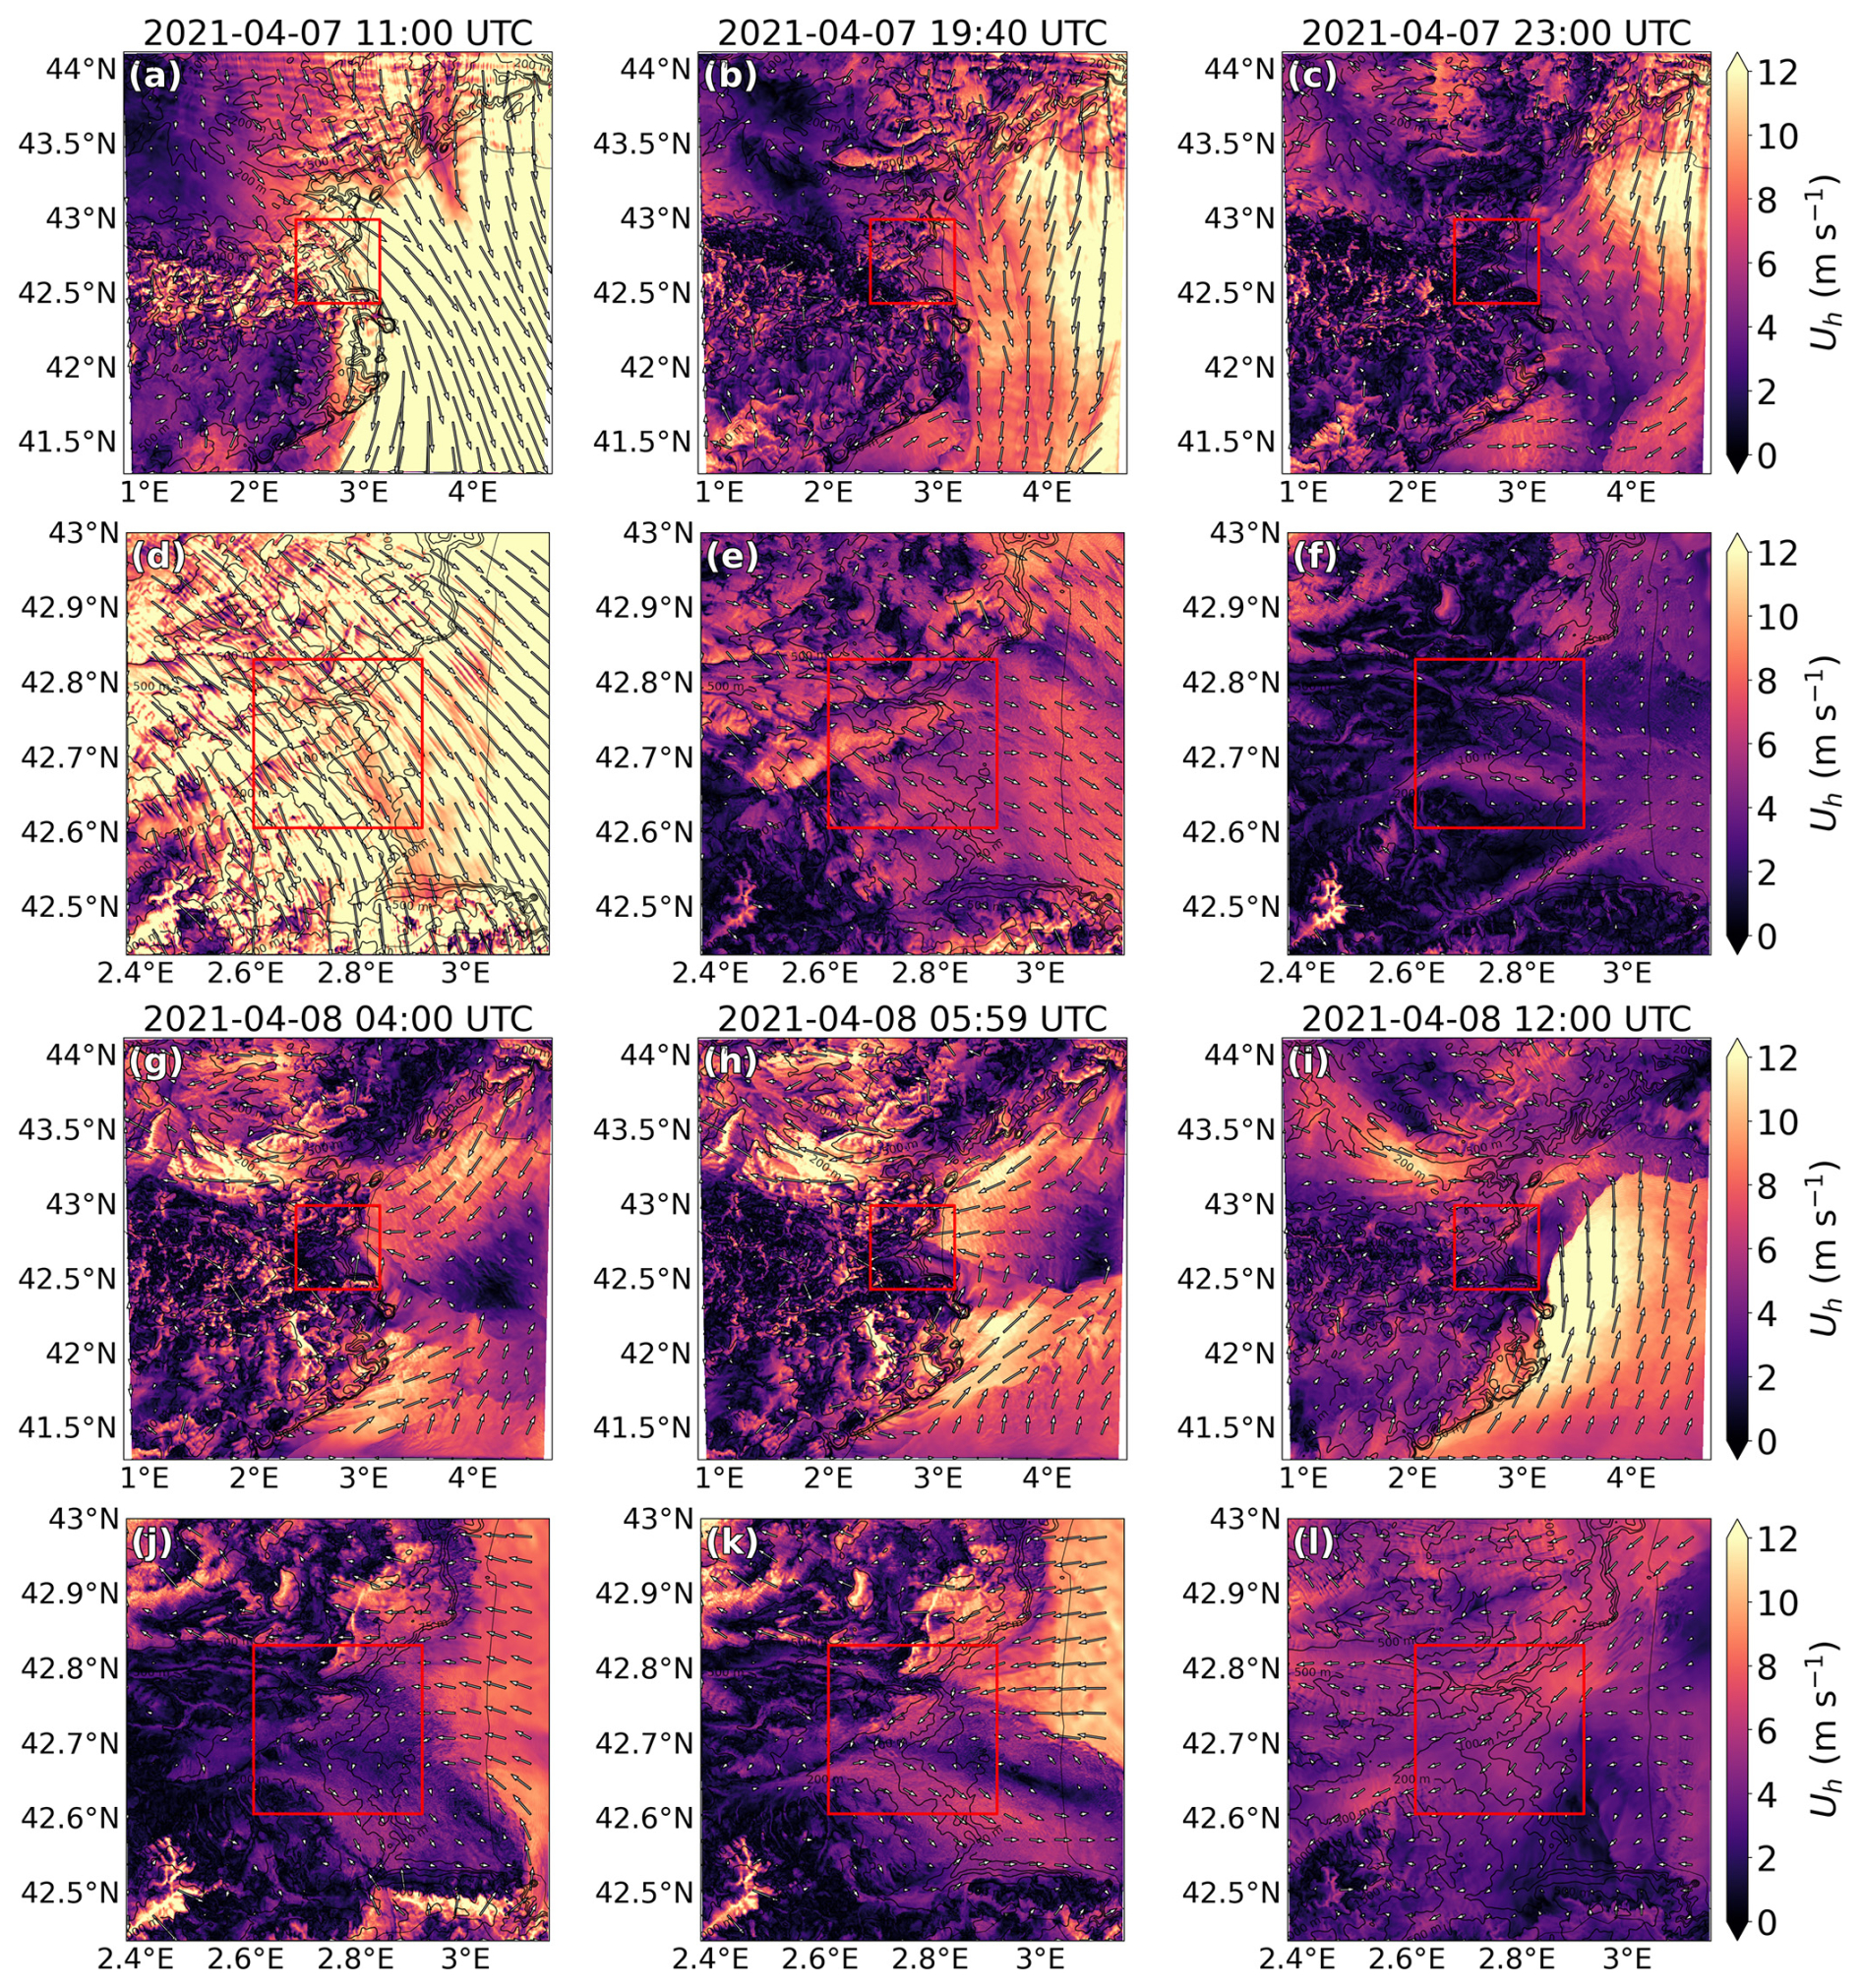
Figure 5Terrain-following horizontal plan of wind speed at 80 m above ground level from the large-scale simulation. The upper row of each panel shows domain D1 (a, b, c, g, h, i), and the lower row shows domain D2 (d, e, f, j, k, l). The red box indicates the extent of the child domain.
4.2 Analysis of the large-scale atmospheric conditions around the wind farm
A terrain-following plan of horizontal wind speed Uh at hub height (80 m above ground level) in domains D1 and D2 is shown in Fig. 5 (a video is also available at https://doi.org/10.5446/73018; Boumendil et al., 2026). During the morning and early afternoon of 7 April, strong winds blow from the Languedoc coast toward the Mediterranean Sea (Fig. 5a). After sunset, the associated nocturnal cooling leads to a marked decrease in wind speed in the Perpignan area (Fig. 5b). Over the Mediterranean Sea, a mesoscale frontal zone develops as a result of the convergence of three air masses, further reinforcing the weak-wind conditions over Perpignan (Fig. 5c). Under these conditions, the local flow becomes primarily controlled by orography, with slope and valley winds dominating the atmospheric circulation (Fig. 5f). Between 20:00 and 04:00, wind speeds remain around 3–4 m s−1, which is close to the cut-in wind speed of the turbines.
After 04:00, the frontal system progressively shifts over the Mediterranean. A strong marine flow then penetrates inland, guided by the Albères massif south of Perpignan. A recirculation pattern develops, leading to the formation of a mesoscale vortex over the Perpignan area (Fig. 5j–k). As a consequence, toward the end of the night, the wind farm is exposed to easterly to northeasterly winds, which enhance wake interactions along the turbine rows (see wind farm layout in Fig. 3). This late-night period, characterized by a strong nocturnal cooling, a highly stratified atmosphere and wind speeds sufficient for turbine operation, represents a particularly interesting case for the present study.
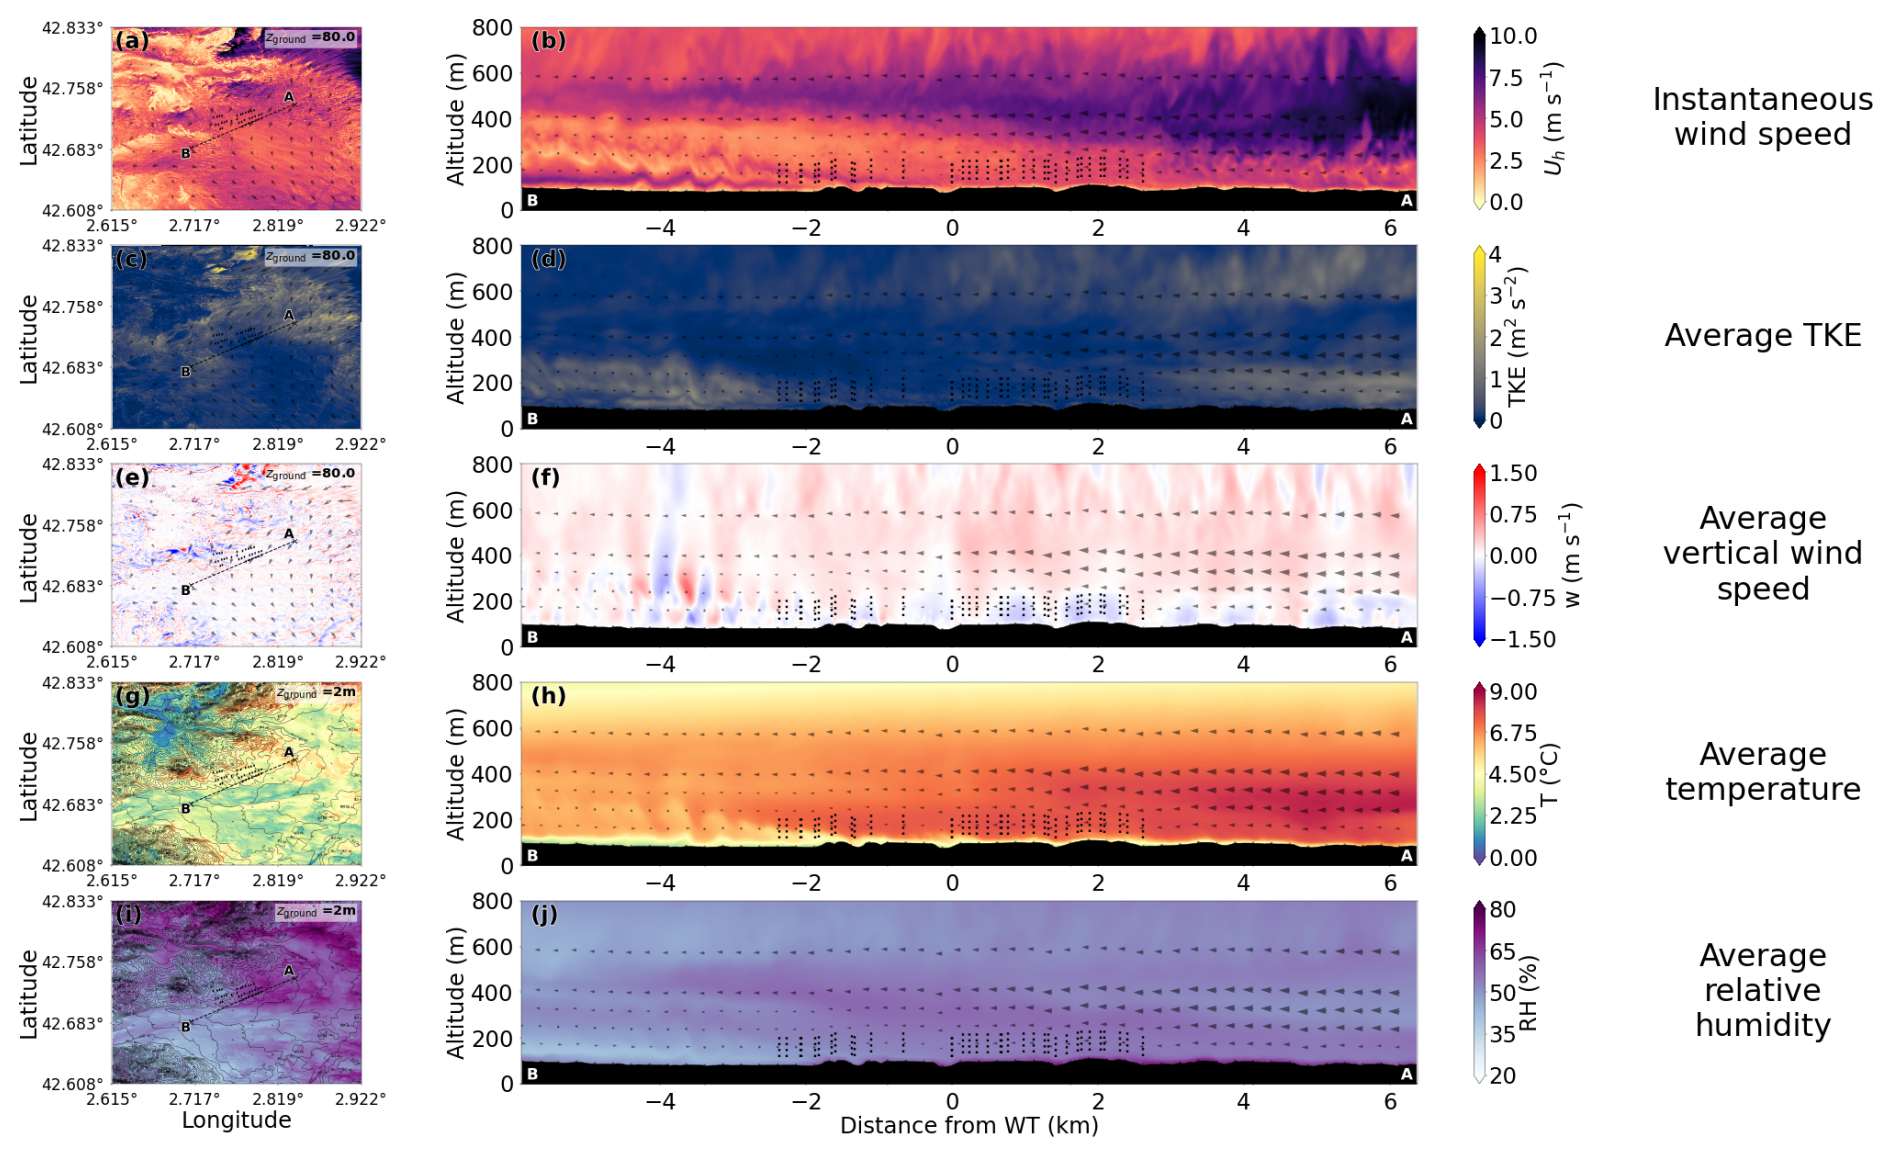
Figure 6Domain D3 at 04:50 on 8 April 2021. First column: horizontal cross-sections (at hub height 80 m or at 2 m above the ground). Second column: vertical cross-sections along the segment AB. The positions of the wind turbines, which are not activated in this domain, are represented by dotted black lines. The terrain on the vertical cross-sections is represented in black, and an altitude of zero is equal to sea level.
4.3 Analysis of the small-scale atmospheric conditions at the wind farm area
Vertical cross-sections of domain D3 at 04:50 are shown in Fig. 6. This cross-section is aligned with the wind direction at hub height and focuses on the eastern and southern parts of the wind farm (see segment AB in the horizontal cross-sections), which are subsequently analyzed in Sect. 5. The wind turbine actuator disk model is not activated at this step; however, turbine locations are indicated to provide a clearer view of the spatial scales and extent of the wind farm. A pronounced horizontal and vertical heterogeneity is visible in the different meteorological fields. In the vertical cross-sections, an air mass originating from the Mediterranean Sea enters the domain from the right (Fig. 6b). This air mass is characterized by higher wind speeds, warmer temperatures and greater moisture content compared to the continental air. Because the land surface is cooler, the warmer marine air mass tends to overrun the cold and dry air near the surface (see bottom left of Fig. 6h and j). This configuration leads to global positive vertical velocities (Fig. 6f) and the development of strong wind shear at the interface between the two air masses. Such shear conditions are favorable to Kelvin–Helmholtz instabilities, which are noticeable at low altitude on the left side of the vertical cross-section by the presence of vortical structures in the wind and temperature fields (Fig. 6b and h), as well as by enhanced turbulence and alternating ascending and descending air motions (Fig. 6d and f).
At the surface, temperature also exhibits strong spatial heterogeneity: hilltops are relatively warmer, while valleys remain cooler, a pattern typical of thermally driven slope and valley circulations under stable nighttime conditions (Fig. 6g). Near-surface winds follow the slope orientation and are partially decoupled from the flow at hub height, indicating the presence of a stratified boundary layer regime. Surface relative humidity (Fig. 6i) further highlights the contrast between the two air masses: a moist marine air mass advected from the sea and a drier air mass descending from the mountains.
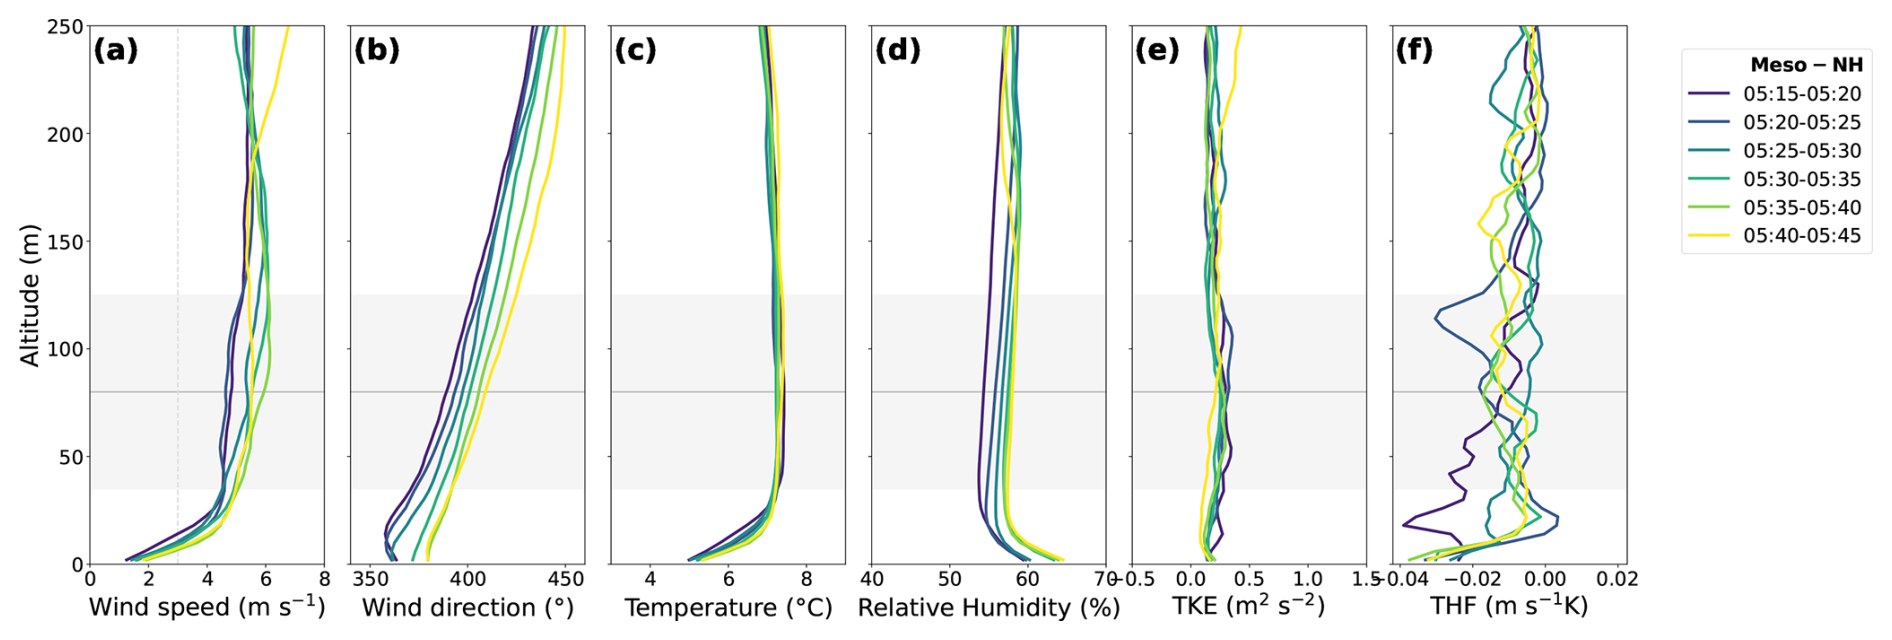
Figure 75 min averaged vertical profiles of (a) wind speed, (b) wind direction, (c) temperature, (d) relative humidity, (e) TKE, and (f) turbulent heat flux at the center of domain D4 for the Ref simulation. The wind turbine hub height and rotor dimension are represented by solid and dashed gray lines. The vertical dashed gray line corresponds to the cut-in wind speed.
To characterize the vertical structure of the atmosphere inside the wind farm before turbine activation, 5 min averaged vertical profiles between 05:15 and 05:45 at the center of domain D4 are presented in Fig. 7. Across the rotor layer, wind speeds exceed the turbine cut-in value, ranging from approximately 4.5 to 6.0 m s−1 (Fig. 7a), with a progressive speed increase observed over the 30 min study period. A strong directional shear (veering) is evident with altitude (Fig. 7b), alongside a gradual rotation toward easterly directions over time. The thermal structure (Fig. 7c) exhibits a sharp surface-based temperature inversion within the lowest 40 m (rising from 5.0 °C at the ground slightly above 7 °C). Relative humidity reaches its maximum near the surface (∼65 %) and stabilizes around 55 %–60 % across the rotor area (Fig. 7d). Finally, TKE values remain low (Fig. 7e), and the turbulent heat flux (THF) is strictly negative throughout the lower levels within the surface inversion layer (Fig. 7f), characteristic of downward sensible heat transport under strongly stratified nocturnal conditions.
The meteorological variations, denoted Δ, are computed as the difference between two identical small-scale simulations performed with an actuator, denoted as ADR, and without an actuator, denoted as Ref. This approach allows the atmospheric perturbations directly attributable to turbine wakes to be isolated from those that would have occurred independently of the presence of the wind farm. Such a methodology constitutes a major advantage of numerical simulations over experimental measurements, for which distinguishing turbine-induced effects from natural atmospheric variability are particularly challenging and require a statistical method (Wu and Archer, 2021; Rajewski et al., 2016).
The large-scale atmospheric conditions generated in domain D1 propagate down to domain D4, where they interact with the wind turbines. The simulations in domain D4 are run between 04:50 and 05:45. The analysis focuses on the last half-hour before sunrise, when the near-surface air layer reaches its lowest temperatures, and the risk of frost over the vineyards is the greatest. At this time of the night, hub-height wind speeds also increase sufficiently for the turbines to operate (see orange dotted line on Fig. 4a).
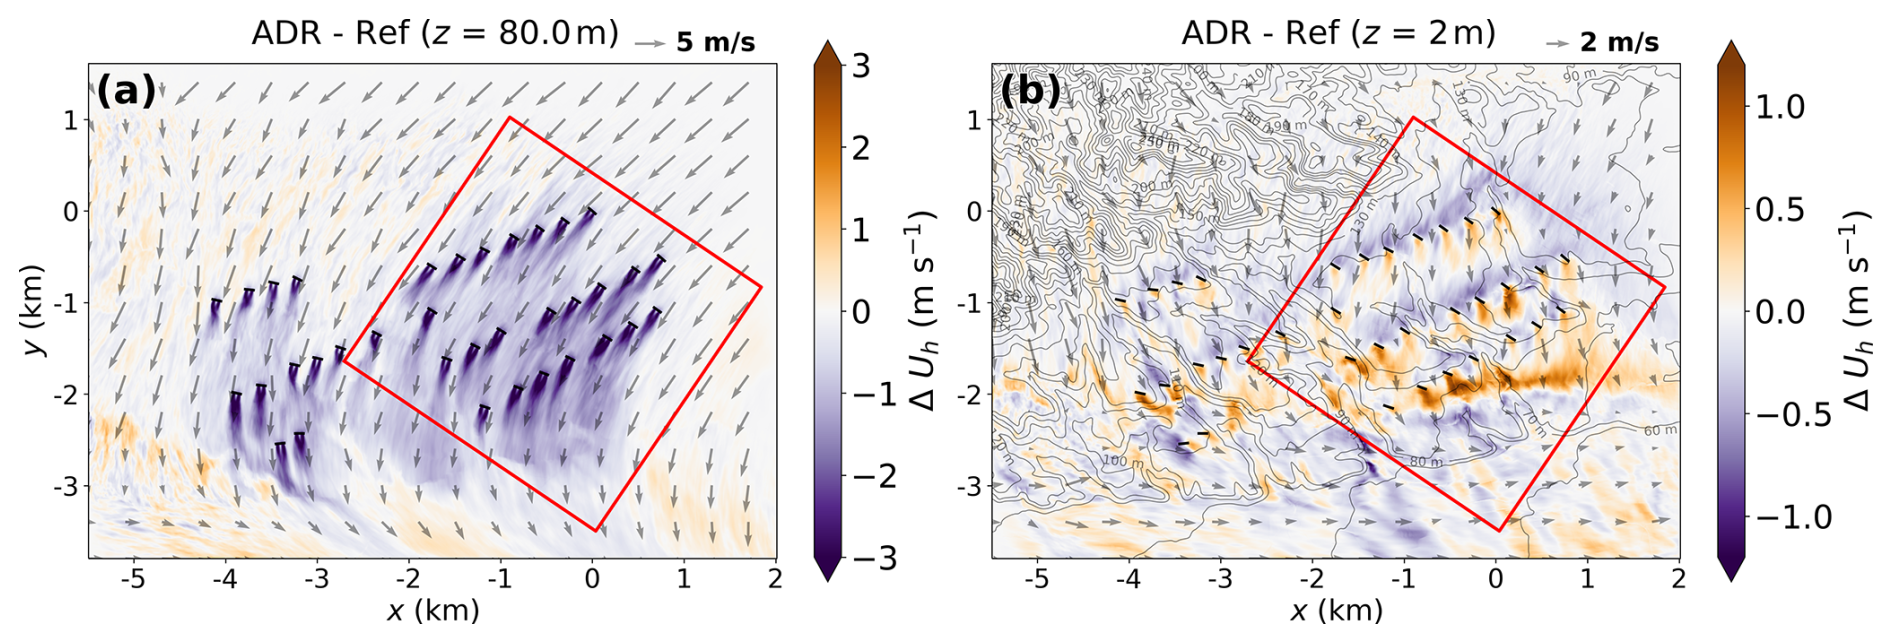
Figure 8Mean horizontal cross-sections between 05:15 and 05:45 of wind speed deficit (ADR − Ref) at (a) 80 m and (b) 2 m. Wind turbine positions are indicated by black segments. Wind speed and direction are represented by gray arrows. Terrain contours are shown in gray.
5.1 Wake deficit and power production
The wind regime during the end of the night over the Perpignan wind farm is dominated by a mesoscale vortex, due to sea and mountain flows interactions. At the hub height, the wind blows from the north-northwest and exhibits a counterclockwise deflection between the upstream and downstream parts of the farm. As a result, the velocity deficit reveals wake directions that can differ by up to 45° within the wind farm, despite its relatively compact layout (Fig. 8a). Horizontally, wake expansion is enhanced by the gradual turning of the wind direction across the farm. Velocity deficits generated by upstream turbines impact downstream rows. Figure 9 shows the ratio between the mean power produced by the ADR and the maximum theoretical power output of the wind turbine. Power ratio is maximal for turbines located along the outer edges of the farm, unaffected by upstream wakes, whereas turbines within the interior produce around half of the power. This contrast is further reinforced by the fact that the background wind speed at southern wind turbine locations is weaker even in the absence of upstream wake effects (Fig. B1a).
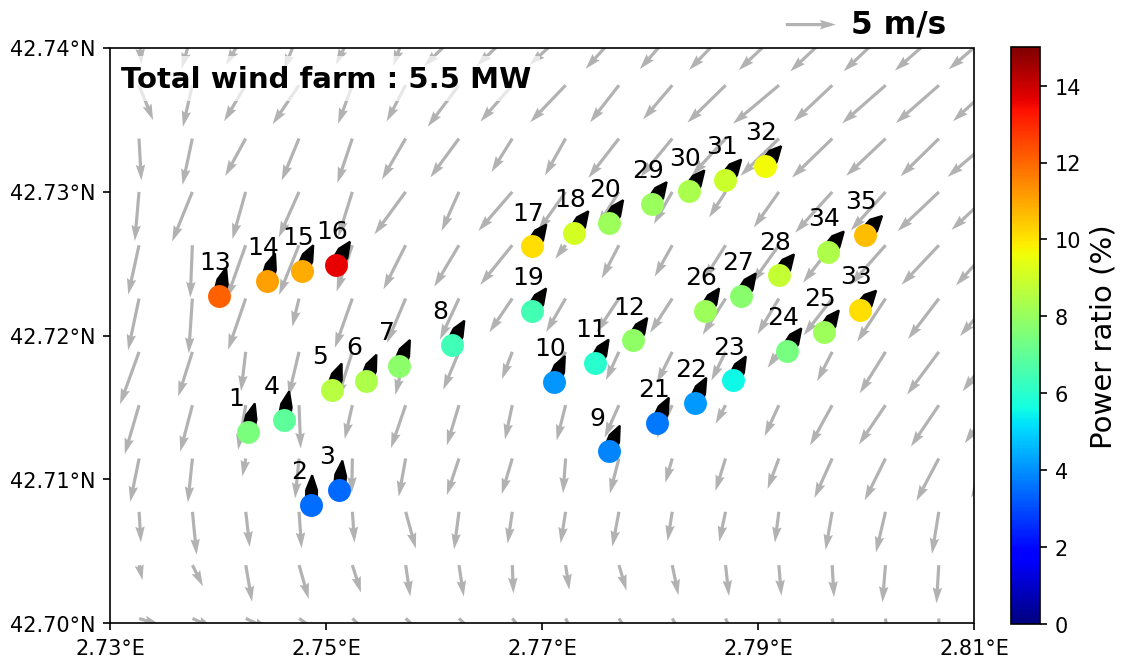
Figure 9Mean wind turbine power ratio between 05:15 and 05:45. The nacelle orientation is indicated by a small black arrow on each turbine.
A localized acceleration zone is visible near the ground beneath each rotor (Fig. 8b). Such sub-rotor accelerations have been previously reported in idealized LES studies (Xie and Archer, 2017; Wu et al., 2023), particularly under stable atmospheric conditions. This effect is attributed to turbine-induced pressure field adjustments that channel the flow beneath the rotor, producing a Venturi acceleration. The phenomenon is enhanced under stable stratification, where vertical motions that would otherwise allow the flow to pass the obstacle are strongly suppressed (Xie and Archer, 2017). At the wind farm scale, flow acceleration can also be observed above the farm (at around 600 m, not shown on the plot Fig. B1e) and, to a lesser extent, along its eastern lateral edges (Fig. 8a). These wind speed anomalies arise from the same mechanism as the sub-rotor acceleration but acting at the scale of the farm. This phenomenon, commonly referred to as wind farm blockage (Bleeg et al., 2018), occurs because the wind farm behaves as an obstacle that locally modifies the atmospheric circulation, forcing the flow to decelerate in front of the wind farm and accelerate around and above the farm to satisfy mass conservation. Similar large-scale acceleration patterns have been reported in offshore wind farm simulations using wind farm parameterization (Quint et al., 2025).
5.2 Near-ground meteorological variations induced by individual wind turbines and the farm
We now focus on the near-surface meteorological variations induced by the wind turbines. To simplify the analysis, we restrict the study to the eastern part of the wind farm, where the turbine density is highest and where the largest perturbations are observed. The study domain is therefore limited to the red rectangle in Fig. 8. The subdomain origin is centered and aligned with the wind direction at hub height of the most upstream turbine in the farm: wind turbine number 32.
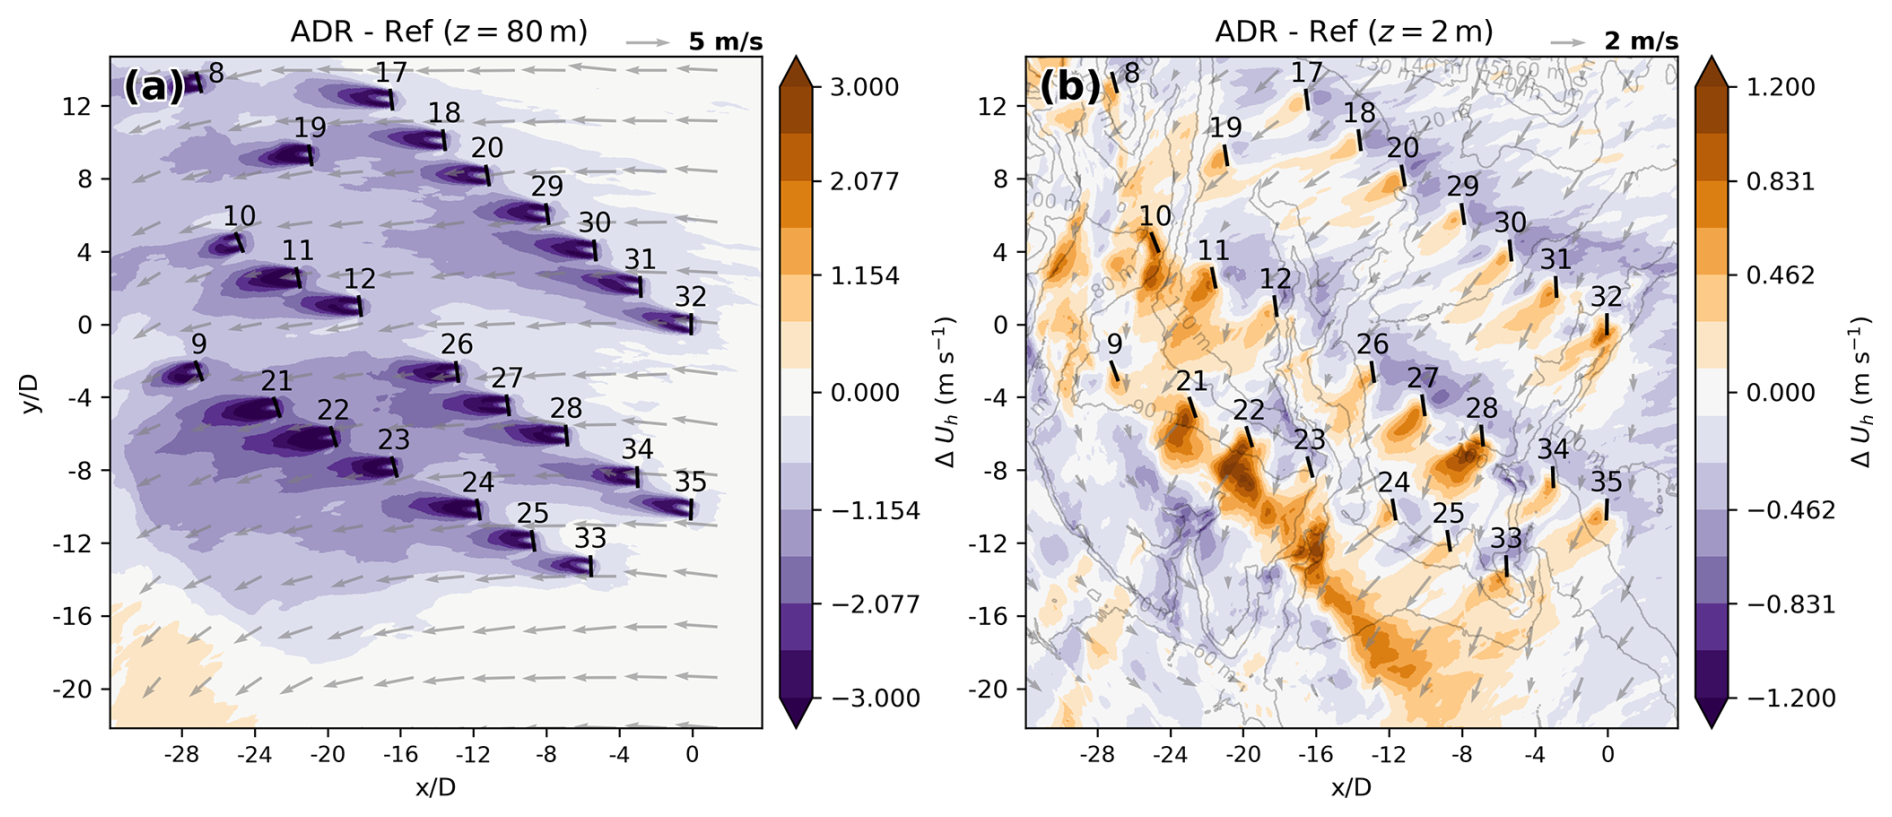
Figure 10Subdomain horizontal cross-sections of wind speed deficit (ADR − Ref) at 80 m (a) and 2 m (b) above ground level. Wind turbine positions are indicated by black segments. Wind speed and direction are represented by gray arrows.
Figure 10 shows the wind speed deficit induced by the turbines within the subdomain at 80 and 2 m above ground level (3D iso-surface of ΔUh is plotted in Fig. B3). A strong difference in wind direction is observed between hub height and the near-surface layer, with deviations approaching 30–50°. At 80 m, the wake structures exhibit the typical downstream spreading, while an upstream induction zone is visible in front of each turbine as well as a larger-scale induction zone associated with each turbine row. Near the ground, wind speed variations are also present. Although their magnitude is smaller than at hub height, they represent relatively large perturbations when compared to the weak background wind speeds close to the surface.
Near the ground a reduction in wind speed is observed upstream of turbine rows, while beneath the rotor localized acceleration occurs, consistent with the sub-rotor acceleration mechanism described in Sect. 5.1. In addition, downstream of the last turbine row, a region characterized by alternating positive and negative wind anomalies is visible. This region coincides with a convergence zone between two air masses with different flow directions (see converging arrows in Fig. 10b) and distinct temperatures (see the next paragraph and Fig. 11a). These wind anomalies therefore appear to result primarily from a wind-farm-induced modification of the position of the katabatic flow and the convergence zone, rather than from the individual influence of the turbines.
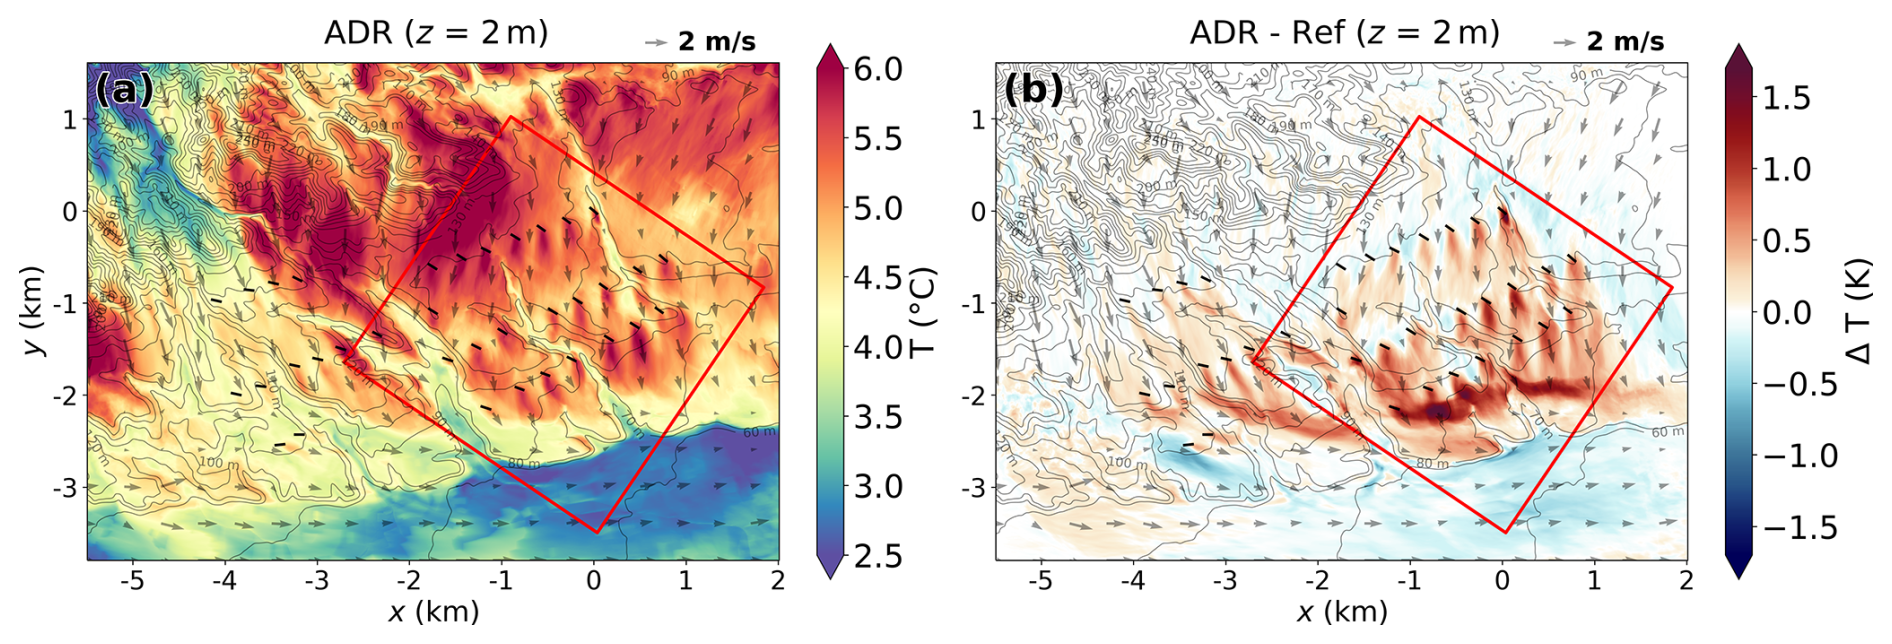
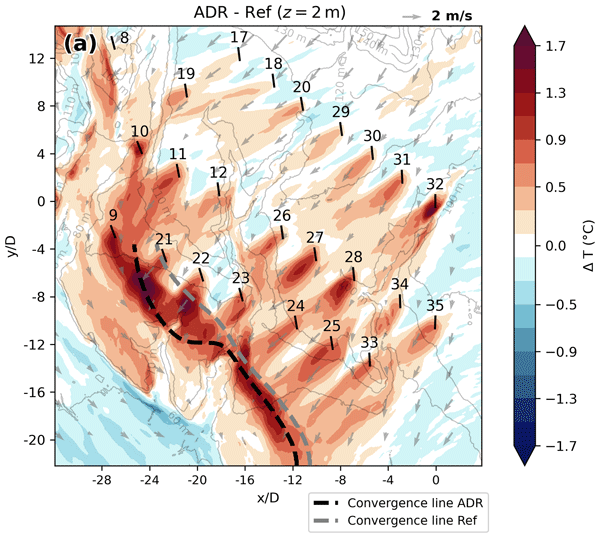
Figure 112 m mean horizontal cross-sections of (a) temperature (ADR) and (b) temperature variation (ADR − Ref) between 05:15 and 05:45. Wind turbine positions are indicated by black segments. Wind speed and direction are represented by gray arrows. Terrain contours are shown in gray.
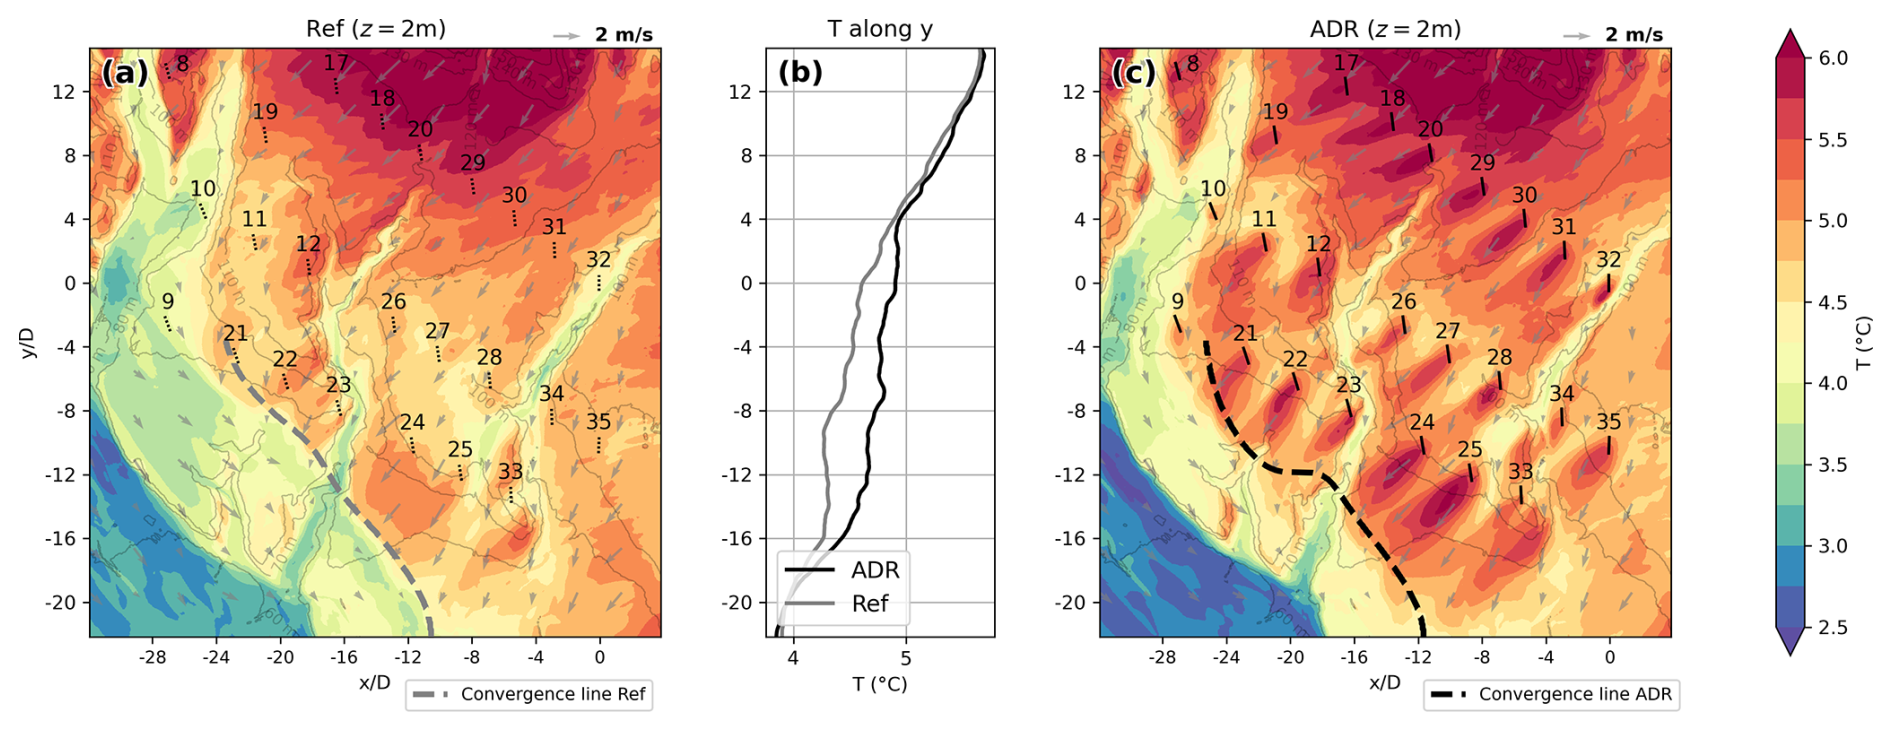
Figure 12Subdomain 2 m horizontal cross-sections of air temperature for the (a) Ref and (c) ADR simulations. Wind turbine positions are indicated by black segments. Wind speed and direction are represented by gray arrows. Terrain contours are shown in gray. The maximum convergence line of the 2 m wind field, corresponding to the boundary between the two air masses, is indicated by a dashed line. (b) 2 m mean temperature averaged along the y axis for the ADR and Ref simulations.
The 2 m air temperature T and temperature difference ΔT fields are illustrated in Fig. 11. As with the wind speed deficit analysis, the study is restricted to the subdomain (red rectangle in Fig. 11). Subdomain temperature distributions for the Ref and ADR simulations are evaluated in Fig. 12, with the corresponding ΔT field shown in Fig. 13a. Finally, the 3D iso-surface of ΔT is plotted in Figs. B2 and B5.
The temperature field exhibits strong spatial variability as cold air accumulates on valley floor, while terrain at higher elevations remains comparatively warmer. A katabatic flow is visible in the valley located downstream of the wind farm (blue/yellow air mass in Figs. 11a and 12), producing a front between the different local flows.
In the ADR simulation (Fig. 12c), localized warming zones appear downstream of the turbines and are advected by the near-surface flow. The temperature averaged along the x axis (Fig. 12b) shows a difference of nearly 2 °C between the upstream and downstream parts of the farm in both simulations. The net contribution of the wind farm has to be evaluated by comparing the two curves. The difference is limited to the immediate vicinity of the farm and shows a mean warming anomaly of up to 0.4 °C.
The maximum convergence of the 2 m wind field is indicated by the dotted line in Fig. 12. This line marks the position of the katabatic front separating the two interacting air masses. The comparison of its position in simulations Ref and ADR (Fig. 13a) shows that the presence of the wind farm shifts this convergence zone southward by approximately 100–400 m downstream of the farm. As a result, strong temperature variations are observed along this frontal zone, reflecting the different thermodynamic properties of the interacting air masses. Temperature variations ΔT (Fig. 13a) confirm the localized warming patterns downstream of wind turbines. However, they also highlight the presence of cooling anomalies of around 0.2 °C in some areas surrounding the wind farm.
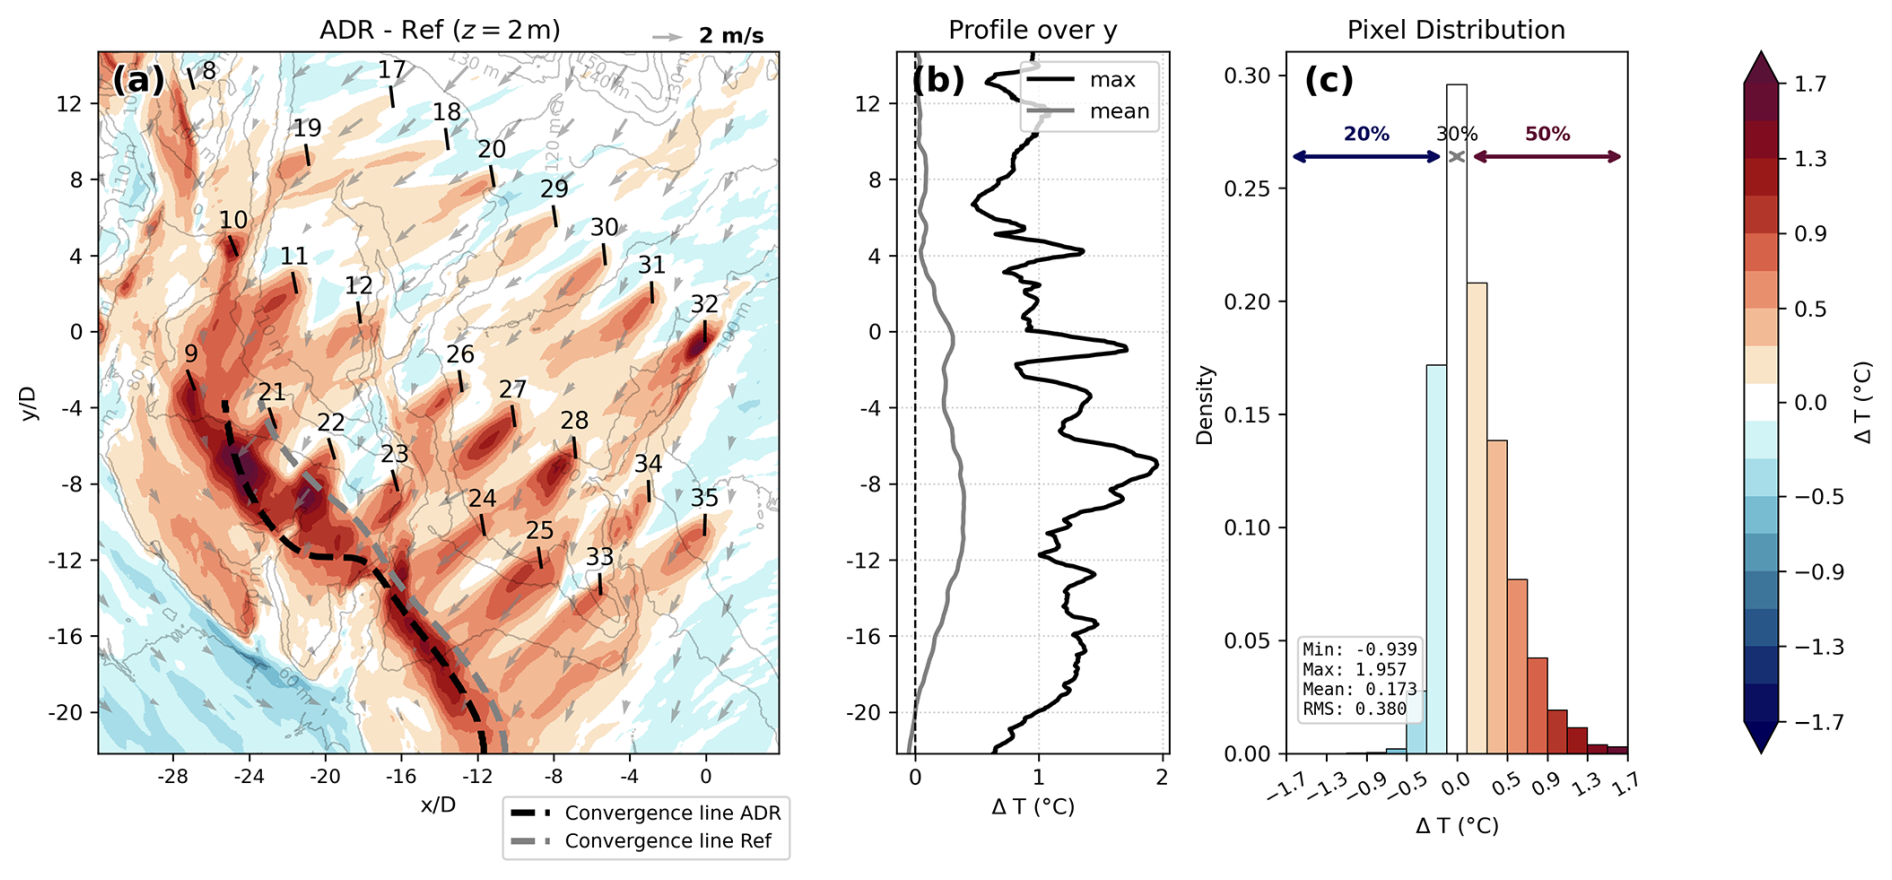
Figure 13(a) Subdomain mean horizontal cross-section of the 2 m temperature variation (ADR − Ref) between 05:15 and 05:45. (b) Maximum and mean 2 m temperature variation along the y axis. (c) Histogram of temperature variations within the subdomain.
By comparing the terrain contours with the temperature variations induced by the wind turbines, we can conclude that the strongest warming beneath the rotors occurs for turbines located within valleys, where cold air tends to accumulate (e.g., turbines 9, 10 and 32). Figure 14 helps illustrate this phenomenon by showing average vertical cross-sections of domain D4 passing through turbines 32, 26 and 21. Turbine 32 is located within a small valley a few tens of meters deep, whereas turbines 26 and 21 are located over relatively flat terrain. Within the valley, turbine-induced mixing interacts with stronger temperature inversions (Fig. 14e), bringing warmer air from aloft down towards the surface and thereby generating stronger temperature anomalies. For example, a temperature increase of up to 1.6 ∘C is observed downstream of turbine 32. Another region where strong meteorological variations are observed is along the katabatic flow. In this area, a pronounced warming trail reaching nearly 2 °C is visible (Fig. 13b). These temperature anomalies are therefore primarily associated with the displacement of the convergence zone induced by the wind farm rather than with the direct contribution of the third turbine row.
At night, surface radiative cooling makes the ground colder than the air above, establishing a stable air temperature inversion. Under these conditions, heat is transported downward by background turbulence from the warmer air aloft toward the colder surface, resulting in a negative turbulent heat flux (Fig. 7f). At and below rotor height, a negative flux anomaly develops downstream of each turbine, making the turbulent heat flux even more negative (Fig. 14j, k and l). This indicates an enhanced downward transport of warm air or an upward transport of cold air caused by wake-generated turbulence. This increased vertical mixing within the stable stratification drives the positive temperature anomalies below the rotor and the negative anomalies at and above rotor level (Fig. 14h and i).
The histogram of temperature variations (Fig. 13c) indicates that, although both warming and cooling occur within the subdomain, the distribution is positively skewed, with warming anomalies dominating in both frequency and amplitude. Specifically, 50 % of the subdomain pixels experience a temperature increase greater than +0.1 °C (reaching a maximum local warming of +1.96 °C), whereas 30 % remain unaffected, and only 20 % show minor cooling. The spatial distribution shows that under stable atmospheric conditions turbine-induced mixing tends to increase near-surface temperatures downstream of the wind farm, while modifications of the flow field around the farm tend to slightly cool the surrounding regions. Across the subdomain the mean temperature change is +0.17 °C with an RMS of 0.38 °C, reflecting significant spatial heterogeneity. These spatial statistics should, however, be considered indicative rather than absolute due to their dependence on the subdomain boundaries. Nevertheless, they provide a meaningful quantitative basis confirming the dominance of 2 m air temperature warming across the study area.
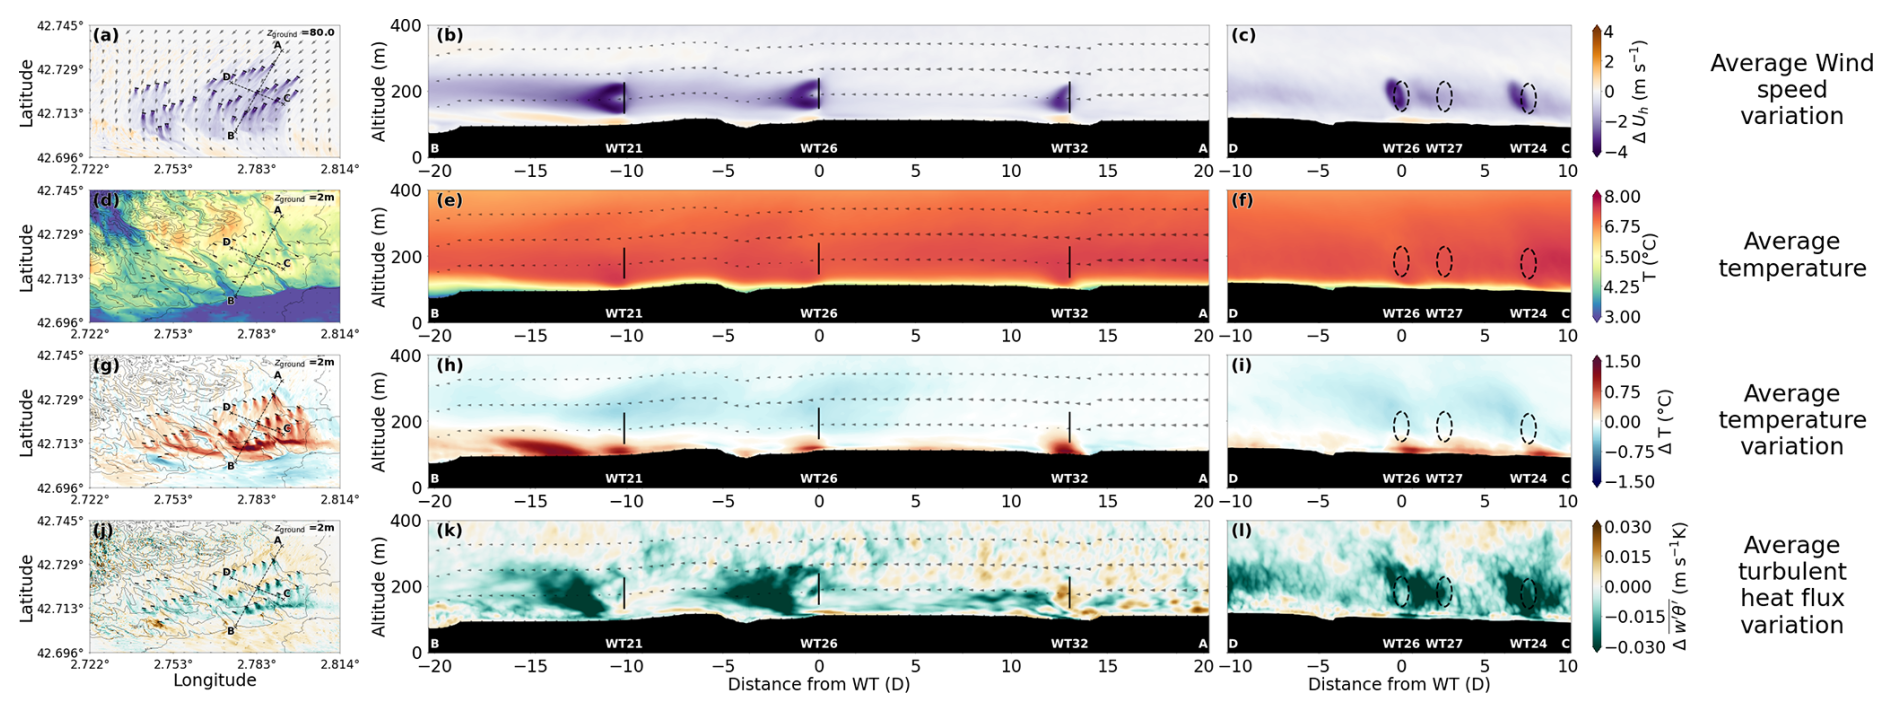
Figure 14First column: horizontal cross-sections (80 m or at 2 m above the ground); second column: vertical cross-sections along the wake; third column: cross-sections across the wake at 1D downstream of wind turbine (WT) 26. The position of the ADR is represented by a bold black line, and the rotor projection is indicated by a dashed black circle. The terrain is represented in black, and an altitude of zero corresponds to sea level. An extended version of this figure, including additional variables, is provided in Fig. B1.
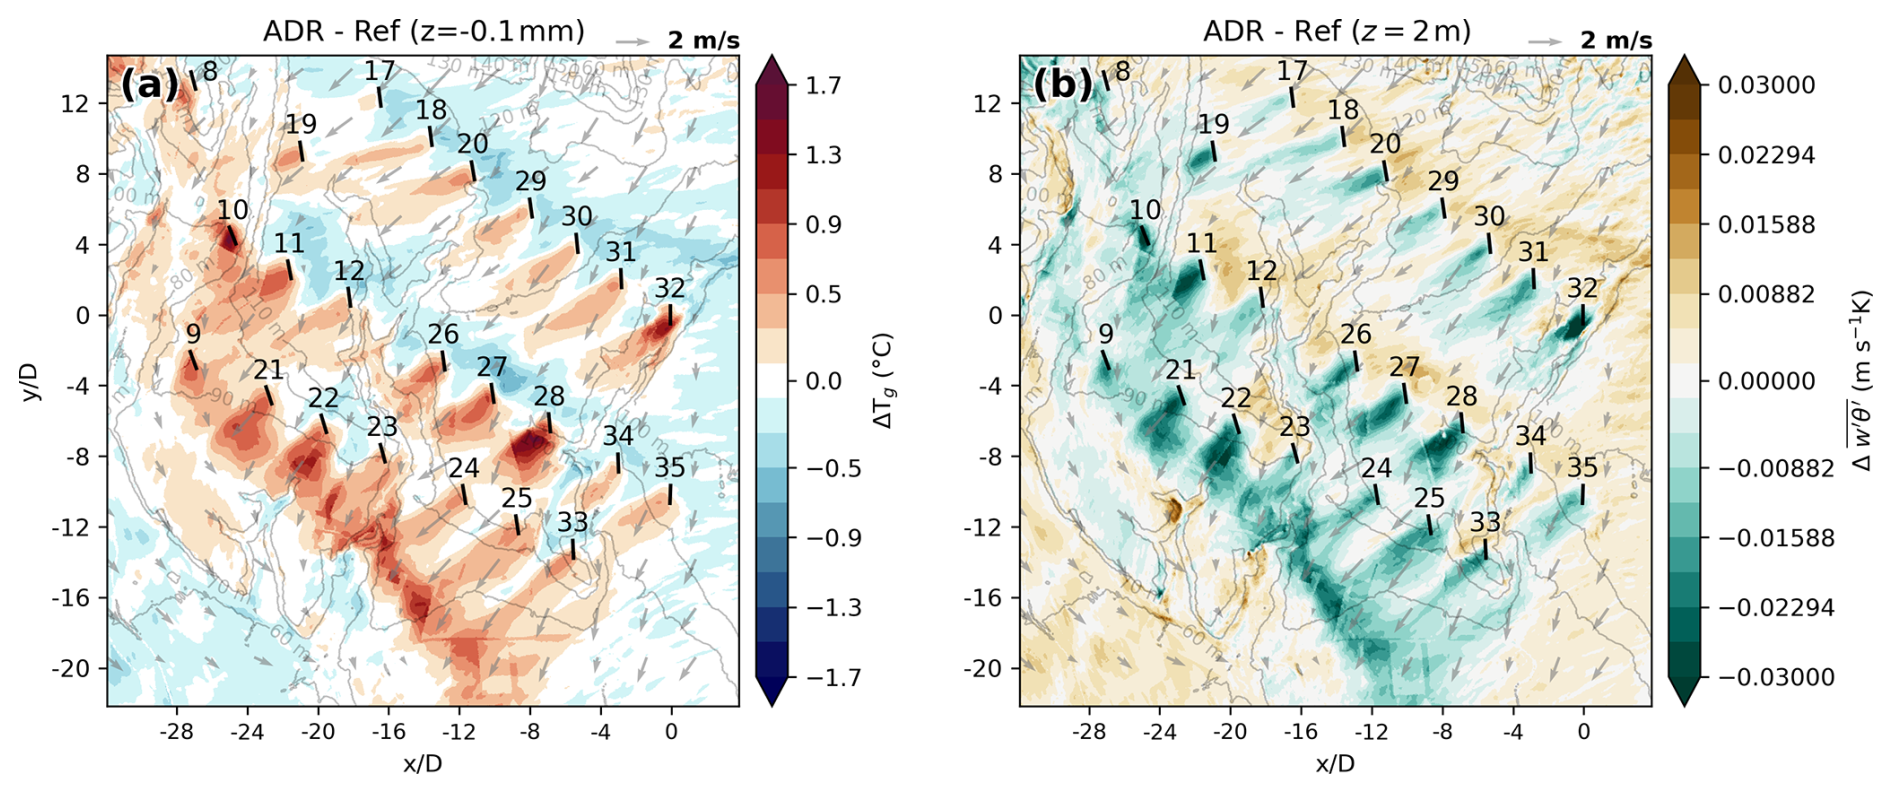
Figure 15Subdomain horizontal cross-sections of the mean difference in (a) ground temperature and (b) 2 m turbulent heat flux (resolved + subgrid) between the ADR and Ref simulations.
5.3 Effects on ground temperature across the wind farm
Figure 15a shows the ground temperature variation induced by the wind turbines at the first level (−0.1 mm) of the SURFEX/ISBA surface model (rivers and lakes are excluded). Warming patterns are visible starting from the rotor location of each turbine, corresponding to the near-surface air temperature increases previously identified.
Compared to the 2 m air temperature response, ground temperature exhibits a similar spatial pattern downstream of the turbines, where downward turbulent mixing of warmer air creates distinct surface warming plumes. However, a key difference lies in the higher prevalence of cooling anomalies (30 % of the subdomain for ground temperature versus 20 % for air temperature) and a lower overall mean warming impact (+0.043 vs. +0.173 °C). Comparing ground temperature variations with the near-surface turbulent heat flux (resolved + subgrid) reveals an identical spatial pattern (Fig. 15b) featuring positive turbulent heat flux anomalies where cooling occurs and negative anomalies where warming is observed. These cooling anomalies are primarily located immediately upstream of the turbine rows, in regions affected by the upstream blockage effect (Fig. 10b). In these deceleration zones, reduced near-surface wind speeds weaken turbulent exchange, thereby reducing the downward (negative) turbulent heat flux toward the ground. This drop in turbulent exchange leads to a local decoupling between the ground and the near-surface air. Consequently, nocturnal radiative cooling of the topsoil layer prevails, enhancing ground cooling upstream of the turbines. Conversely, because the upstream near-surface air is continuously replaced by the background flow, its temperature remains unaffected by this localized surface cooling. Overall, ground temperature variations reflect a coupled response to both air temperature changes and wind speed changes through modifications of turbulent transfer.
6.1 Physical processes controlling turbine–atmosphere interactions
The results highlight the importance of flow heterogeneities when investigating wind farm–atmosphere interactions in complex environments. In the present case, both the complex terrain and the stable, strongly stratified atmospheric conditions play a key role in shaping the flow. These findings align with recent literature emphasizing the necessity of multi-scale modeling chains (Wise et al., 2022) to capture the full spectrum of interactions across spatial scales.
The simulations reveal a strong heterogeneity of meteorological conditions across the domain, with significant spatial variability in both wind speed and wind direction horizontally as well as vertically. This heterogeneity becomes particularly pronounced near the surface, where local katabatic flows induce the convergence and interaction of air masses with distinct thermal and momentum properties. As recently highlighted by Lundquist et al. (2026) in complex terrain setups, terrain-induced atmospheric structures can strongly interact with or even dominate near-surface microclimatic signals, making realistic multi-scale forcing essential to isolate turbine-induced perturbations from natural background variability.
Within this already complex background flow, wind turbines introduce additional perturbations that further modify local atmospheric circulation. Under stable and strongly stratified conditions, turbines facilitate vertical transport through two main physical mechanisms: (i) organized vertical motion driven by blade rotation and wake divergence, which generates coherent vertical velocity pairs (Mirocha et al., 2014; Boumendil et al., 2024), and (ii) vertical convergence and divergence of turbulent heat fluxes downwind of the rotor (Archer et al., 2019; Wu and Archer, 2021; Wu et al., 2023). In stably stratified boundary layers, both mechanisms act to transport warmer, higher-momentum air from aloft down toward the surface.
At the single-turbine scale, the wind turbine acts as localized obstacles to the flow, manifesting as upstream induction zones and near-surface Venturi acceleration beneath the rotor. Local sub-rotor wind acceleration under stable stratification is consistent with fine-scale LES studies of isolated and aligned turbines (Mirocha et al., 2014; Xie and Archer, 2017; García-Santiago et al., 2024), where buoyancy forces in stable stratification reduce vertical displacement over the obstacle and enhance localized flow acceleration near the ground. At the wind farm scale, cumulative blockage causes broader flow redistribution, including lateral edge acceleration and slight displacement of surrounding air masses, echoing findings from mesoscale and microscale wind farm simulations (Fitch et al., 2012; Quint et al., 2025).
The amplitude of the meteorological variations induced by each turbine appears to be strongly influenced by local topography. In particular, turbines located within valleys generate the largest perturbations, as they interact with stronger near-surface temperature inversions. The strong relationship between near-surface thermal stratification and the magnitude of turbine-induced temperature variations is consistent with the experimental findings of Wu and Archer (2021) and the numerical results of Boumendil et al. (2024). In contrast, the amplitude of these variations does not seem to be primarily controlled by the turbine power production (Fig. 9) or by its spatial position within the wind farm.
The atmospheric perturbations generated by the turbines extend to near-surface air temperatures before propagating to the land surface through coupled energy exchanges. At 2 m height, the simulations indicate that wind turbines induce a mean near-surface warming of approximately 0.4 °C within the wind farm immediate area, with local maxima reaching up to 1.6 °C. This magnitude aligns well with field observations and numerical modeling under stably stratified nocturnal conditions, which typically report air temperature increases ranging between 0.1 and 2.2 °C depending on inversion strength, turbine hub height and farm layout (Baidya Roy and Traiteur, 2010; Rajewski et al., 2013; Smith et al., 2013; Henschen et al., 2011; Wu and Archer, 2021).
Driven by these near-surface air anomalies, local modifications of wind and turbulent heat flux, coupled land–atmosphere energy exchanges lead to topsoil ground temperature variations ranging from −0.7 to +1.6 °C. This range and its spatial heterogeneity are consistent with satellite-derived land surface temperature observations over operating wind farms (Zhou et al., 2012; Slawsky et al., 2015) as well as LES with surface energy balance modeling (Lu and Porté-Agel, 2015; Xia et al., 2019). Upstream blockage and velocity deficits weaken surface turbulent exchanges, leading to localized ground cooling, whereas downwind advection of turbine-mixed air enhances downward heat transfer, resulting in localized ground warming (Xia et al., 2019; Quint et al., 2025).
6.2 Implications for vineyards and frost events
From the perspective of vineyard protection, the simulations indicate that wind turbines induce a mean near-surface warming of approximately 0.4 °C within the wind farm immediate area, with local maxima reaching up to 1.6 °C. Although these temperature increases remain relatively small, they are of the same order of magnitude as those produced by frost protection fans commonly used in vineyards (Le Cap et al., 2024). As an example, the Food and Agriculture Organization of the United Nations (FAO) (Snyder and de Melo-Abreu, 2005) indicates that the 2 m temperature variation corresponds to roughly 30 % of the inversion strength between 2 and 10 m and recommends the use of fans when the inversion exceeds 1.5 °C, and wind speeds near the ground are below 2.5 m s−1. It should be noted, however, that frost protection fans rotate, providing a 360° coverage, and can be operated on demand. Unlike wind turbines, they do not require sufficient wind speed at hub height, as radiative cooling events are typically associated with weak wind conditions (Snyder and de Melo-Abreu, 2005).
However, the simulations also reveal ground cooling zones and wind speed reductions in some areas surrounding the farm. According to FAO recommendations, wind plays an important role in limiting frost damage by preventing cold air stagnation near the ground. Therefore, the spatial redistribution of wind and temperature induced by the wind farm may lead to both beneficial and adverse effects depending on the local position within the vineyard landscape.
Our simulations are consistent with reports from winegrowers indicating that frost damage can vary significantly from one location to another during the same frost event. This spatial variability is also present in the simulations, which show strong heterogeneity in near-surface temperature. Consequently, the warming induced by wind turbines is also highly heterogeneous and depends strongly on the local flow configuration.
6.3 Implications for experimental studies
Several in situ experimental studies (San Gorgonio campaign; see Baidya Roy and Traiteur, 2010; Rajewski et al., 2013, 2016; Henschen et al., 2011; Smith et al., 2013; Lundquist et al., 2026) estimate turbine-induced meteorological variations by computing the difference between measurements from an upstream and a downstream sensor. However, the present results suggest that such approaches may be insufficient in complex flow conditions. In particular, the wake direction at hub height and the advection direction of near-surface meteorological variations can differ significantly in complex terrain.
Furthermore, even in the absence of a wind farm, meteorological properties may evolve substantially between upstream and downstream locations due to natural atmospheric variability. For these reasons, experimental setups should ideally include multiple near-surface meteorological stations distributed around the wind farm (as for the VERTEX campaign of Archer et al., 2019). Such measurements would help characterize local flows and better distinguish the background atmospheric evolution from the perturbations directly induced by the turbines.
6.4 Limitations and uncertainties
While the present simulations provide high-resolution insights into turbine–atmosphere–surface interactions in complex terrain, several limitations and uncertainties must be emphasized.
First, model validation is inherently constrained by the availability of observational data. Quantitative evaluation was restricted to a single operational surface station at 2 or 10 m height. In the absence of vertical-profile observations at rotor height, the exact vertical extent, inversion strength and thermal stratification of the actual boundary layer could not be quantitatively verified against field measurements.
Second, the simulation exhibits a nocturnal warm bias in air temperature of approximately 2–3 °C, inherited from the driving AROME forecast and subsurface soil temperature initialization. Although sensitivity experiments were performed on mixing length formulations, soil parameters and atmosphere–surface coupling coefficients, this systematic bias could not be fully removed. Consequently, while the simulated boundary layer is physically consistent and stably stratified, this thermal bias introduces quantitative uncertainty regarding the exact magnitude of the simulated atmospheric stability relative to the study period.
Finally, the results presented here are specific to a single nocturnal event featuring a complex synoptic transition with weak rotor wind speed, local katabatic flows and a late-night mesoscale vortex. While the fundamental physical processes identified in this study are generalizable to stably stratified boundary layers over complex topography, the exact quantitative impacts on near-surface warming and soil temperature variations remain inherently linked to the specific thermal stratification, wind farm geometry and soil properties of this case study.
In an effort to better understand the interactions between wind turbines and a realistic atmosphere, a multi-scale modeling framework including atmosphere–soil–vegetation coupling was employed. A case study focusing on the interaction between a stable and strongly stratified atmosphere and the Ensemble Éolien Catalan wind farm was analyzed to evaluate near-surface meteorological variations induced by wind turbines.
The results highlight the major role of topography in shaping the local atmospheric circulation around the wind farm. Under the stable nocturnal conditions, the flow is strongly influenced by terrain-induced circulations, like local katabatic flows that lead to the interaction of air masses with distinct properties. As a result, the near-surface atmosphere already exhibits strong spatial heterogeneity before any interaction with the wind turbines occurs.
After 55 min of turbine operation, the averaged meteorological fields from simulations with and without ADR were compared to isolate turbine-induced atmospheric perturbations. Inside the wind farm, a mean near-surface warming of approximately 0.4 °C is observed, while localized air temperature variations of up to 1.6 °C occur in the immediate vicinity of some turbines. These near-ground warming anomalies are advected by the local wind, which, in the present case, differs by nearly 30–50° from the wind direction at hub height. Variations in near-ground wind speed are also noted, with zones of acceleration and deceleration associated with the blockage effects of wind turbines. These temperature and wind speed changes impact surface conditions, resulting in ground temperature variations ranging from −0.7 to +1.6 °C, consistent with changes in turbulent heat fluxes.
The meteorological and surface variations generated by the wind turbines result from the combination of three main contributions. First, turbines produce vertical movements that disrupt the natural atmospheric stratification and near-surface wind speed. Second, vertical convergence and divergence of turbulent heat fluxes occur downwind of the rotor, propagating these atmospheric variations and directly altering the surface energy budget, which in turn modifies ground temperature. Third, the wind farm acts as a collective obstacle to the atmospheric flow, inducing vertical and lateral flow deflections that can locally displace the regional katabatic flow. Together, these mechanisms produce air and ground temperature anomaly patterns downstream of the wind farm.
Overall, the results demonstrate that wind farm–atmosphere interactions in complex terrains and under strongly stable conditions are governed by a combination of multi-scale processes involving terrain-induced flows, atmospheric stratification, turbine wake and wind farm blockage dynamics. These processes lead to highly heterogeneous meteorological responses near the surface resulting from the superposition of individual turbine wakes and the global dynamical influence of the wind farm. This intrinsic complexity also poses a major challenge for both realistic numerical simulations and in situ measurement campaigns, as it complicates the interpretation and generalization of wind farm–atmosphere interactions.
From an applied perspective, the simulated near-ground air temperature increases within parts of the wind farm are of the same order of magnitude as those produced by frost protection fans used in vineyards. However, the simulations also reveal cooling areas and wind reductions in some regions surrounding the farm, highlighting that the effects of wind turbines on frost conditions may vary significantly depending on the local flow configuration. Moreover, the effectiveness of wind turbines in this context is inherently limited by their operational constraints. If wind speeds at hub height remain below the cut-in wind speed, the turbines do not operate and therefore cannot contribute to atmospheric mixing. In addition, under forecast icing conditions on turbine blades, wind turbines may be shut down to prevent damage caused by ice throw.
This study illustrates the importance of realistic multi-scale numerical simulations for investigating turbine–atmosphere interactions in complex environments. Such approaches provide a unique capability to isolate turbine-induced perturbations from the natural variability in the atmosphere, which remains challenging in observational studies.
Evaluating how turbine row orientation and overall wind farm layout influence near-surface meteorological variations represents a natural direction for future research. A dedicated sensitivity study could therefore investigate the effect of wind farm layout on near-surface meteorological variations under identical atmospheric conditions, for instance by rotating the wind farm layout.
Finally, to generalize the results presented here, further simulations should be conducted under a wider range of atmospheric conditions. Future work could include cases with different stability regimes, seasons, wind directions and wind speeds to better characterize the range of possible turbine–atmosphere interactions near the surface.
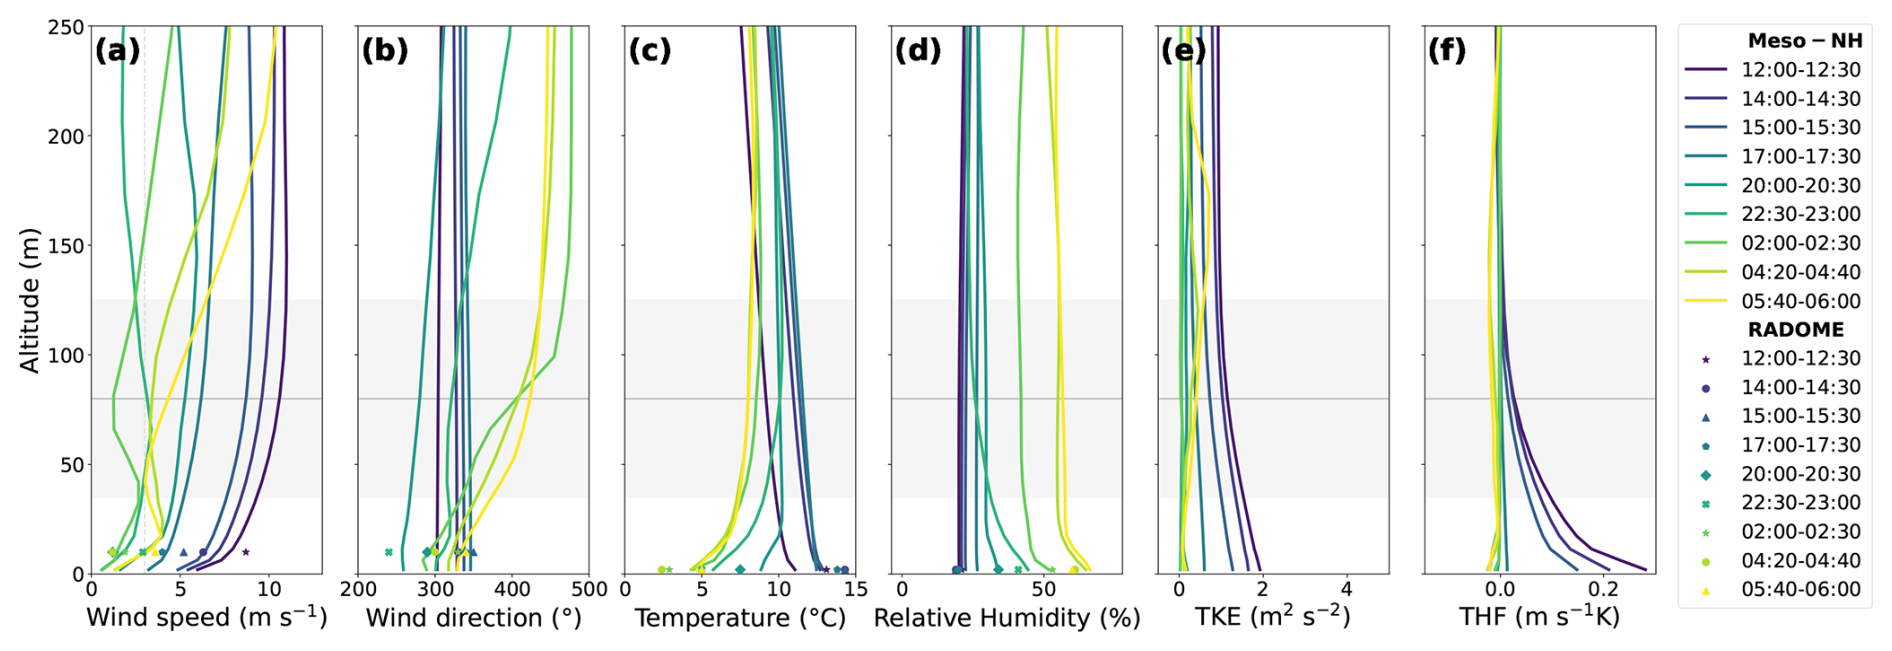
Figure A130 min averaged vertical profiles of (a) wind speed, (b) wind direction, (c) temperature, (d) relative humidity, (e) TKE, and (f) turbulent heat flux at the Perpignan RADOME station in domain d2. The wind turbine hub and rotor dimension are represented by solid and dashed gray lines.
Vertical cross-sections along two segments, averaged over 30 min, are shown in Fig. B1. Segment AB crosses the wind farm parallel to the mean wind direction and intersects wind turbines 32, 26 and 21. Segment CD is perpendicular to AB and located 1D downstream of wind turbine 26; it therefore intersects the wakes of turbines 26, 27 and 24.
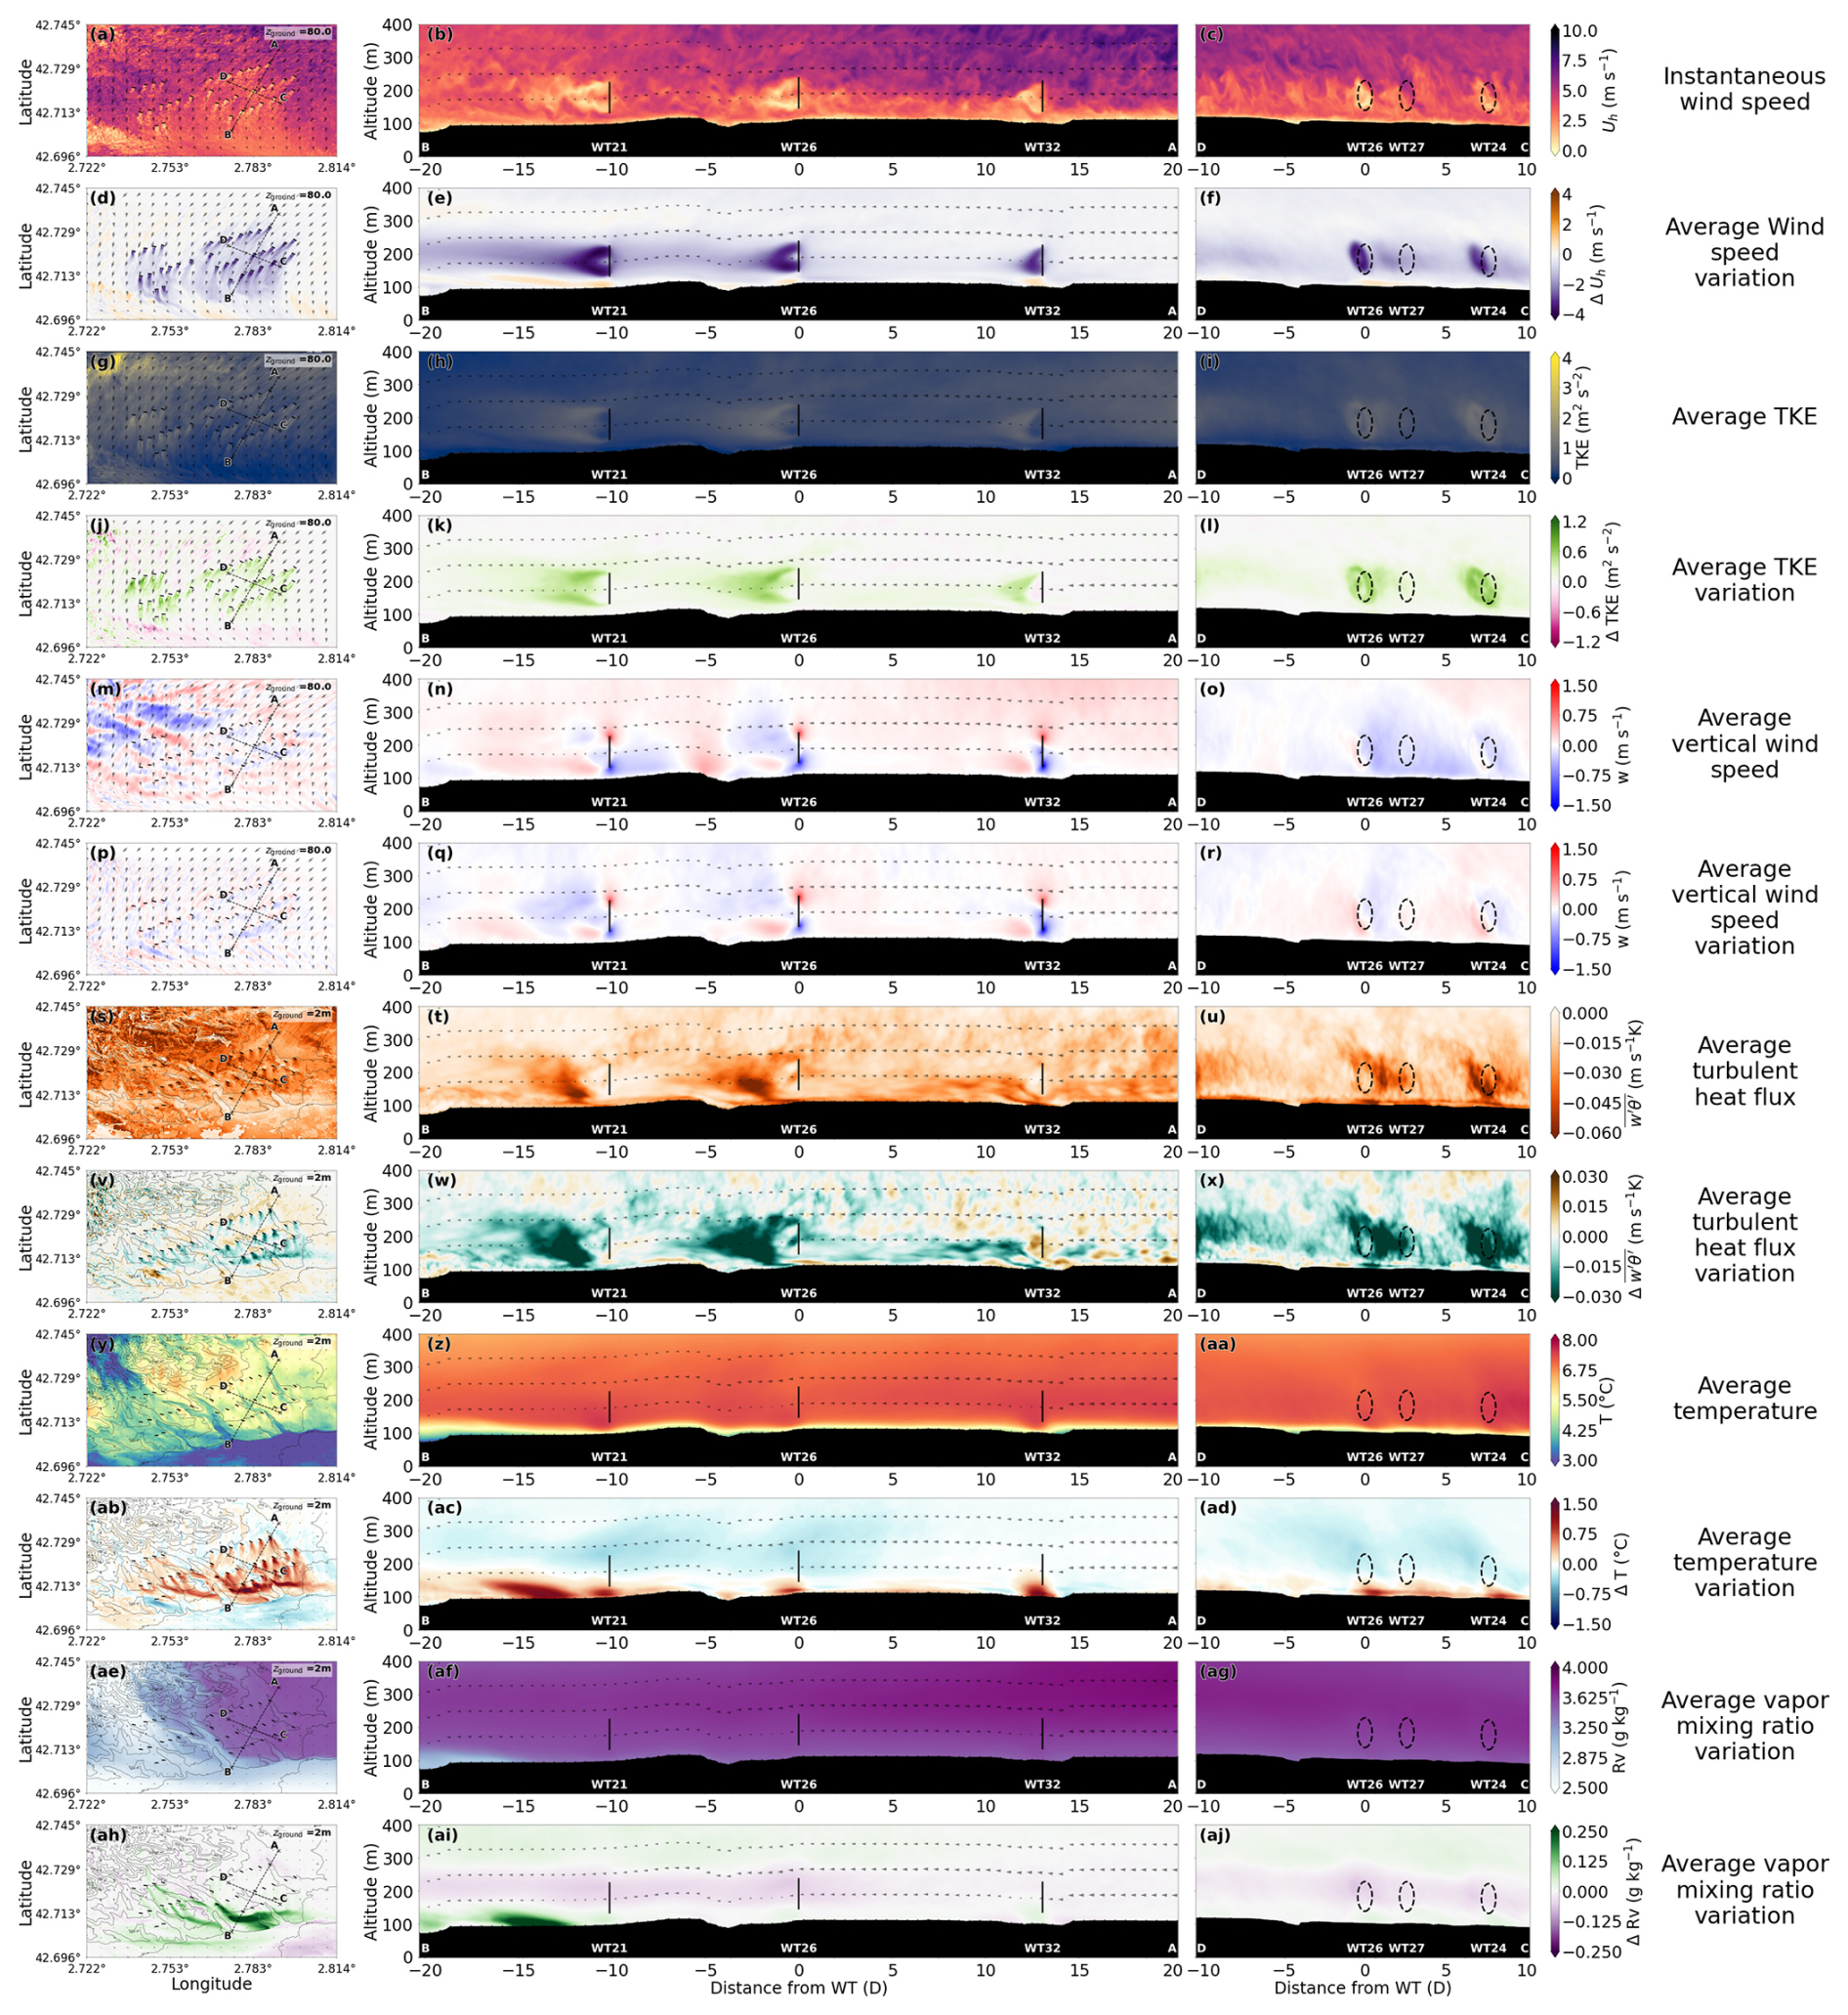
Figure B1First column: horizontal cross-sections (80 m or at 2 m above the ground); second column: vertical cross-sections along the wake; third column: cross-sections across the wake at 1D downstream of wind turbine 26. The position of the ADR is represented by a bold black line, and the rotor projection is indicated by a dashed black circle. The terrain is represented in black, and an altitude of zero is equal to sea level.
The structure, shape and length of the wakes deficits (Fig. B1d, e, f) differ from those typically observed in idealized large-eddy simulations. These differences arise because the simulations are conducted under realistic atmospheric conditions, in which the horizontal wind direction varies within the farm, preventing the cross-sections from passing exactly through the wake centers of all three turbines. In addition, the results are averaged over 30 min, during which both wind direction and turbine yaw angle vary slightly, contributing to a spreading of the wakes in the averaged fields. The wind direction also exhibits strong vertical shear (see Fig. 7b), resulting in pronounced wind veer. This vertical shear induces a pronounced stretching and distortion of the wakes with height. Finally, the complex topography within the wind farm generates additional turbulent, vertical movements and chaotic air motions that further disrupt wake coherence and enhance wake deformation and recovery (Mi et al., 2025).
Instantaneous wind fields reveal velocity fluctuations and vertical structures. This turbulence is explained by the synoptic and mesoscale circulation context, including the interaction between different air masses, strong vertical wind shear and complex terrain that induces vertical motions. Wind turbines interact with this ambient turbulence, while wake velocity deficits and wake rotation further enhance turbulent motions within the flow. As is commonly reported in LES studies (Xie and Archer, 2017; Boumendil et al., 2025), the additional TKE generated in the wake is larger in the upper than in the lower part of the wake (Fig. B1k).
The vertical wind component indicates strong vertical motions both near the surface and aloft (Fig. B1n). These vertical exchanges result from the convergence of air masses combined with the influence of complex terrain. The wind farm adds further vertical motions (Fig. B1q) to this already disturbed atmosphere. Individual turbine-induced motions can be distinguished on the 3D iso-surface plot (Fig. B4), forming a counter-rotating pattern characterized by upward motion on the upper right side of the rotor and downward motion on the lower left side of the rotor generated by wake rotation and induction effects (Lu and Porté-Agel, 2011; Mirocha et al., 2014; Boumendil et al., 2024). Upward and downward vertical motions in the rotor region transport relatively cooler air masses above the rotor and warmer air masses near the surface (Fig. B5). The amplitude of the resulting temperature anomalies is larger near the ground because the strong stable temperature inversion causes even small vertical displacements to mix air masses with markedly different temperatures. Furthermore, due to the strong vertical wind shear associated with the stratified atmosphere, the advection direction of the temperature anomalies differs significantly above and below the rotor.
Under stable atmospheric conditions, the turbulent heat flux is negative. At night, radiative cooling of the surface makes the ground colder than the air above, creating a temperature inversion. As a result, heat is transported downward by turbulence, from the relatively warmer air aloft toward the colder surface, leading to a negative turbulent heat flux. Within the wind turbine wake, an increase in the magnitude of the turbulent heat flux is observed, making it even more negative. This indicates an enhanced downward transport of heat caused by wake-generated turbulence, which intensifies mixing despite the stable stratification.
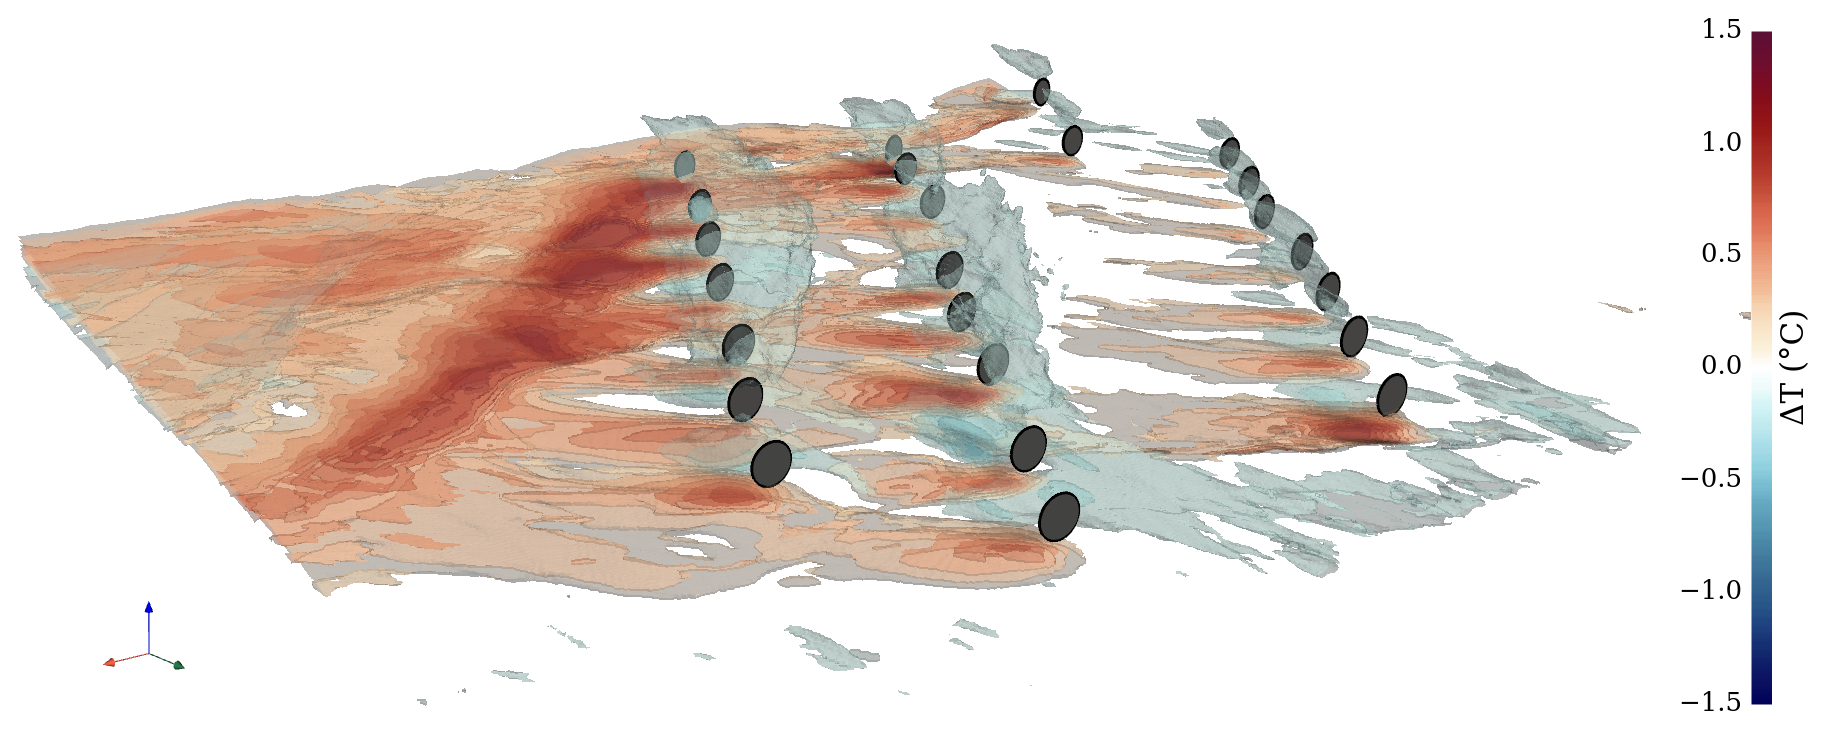
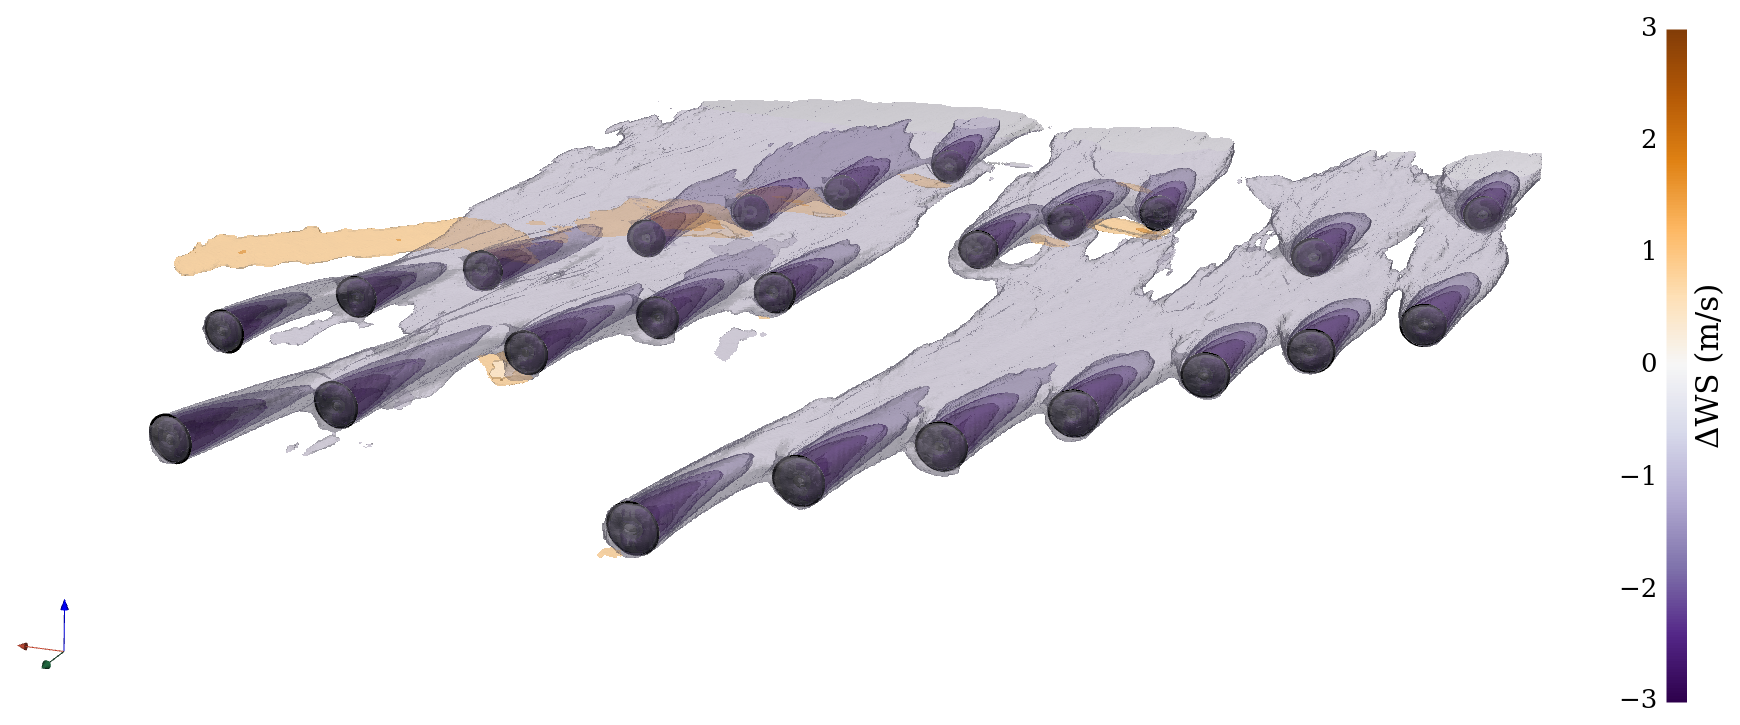
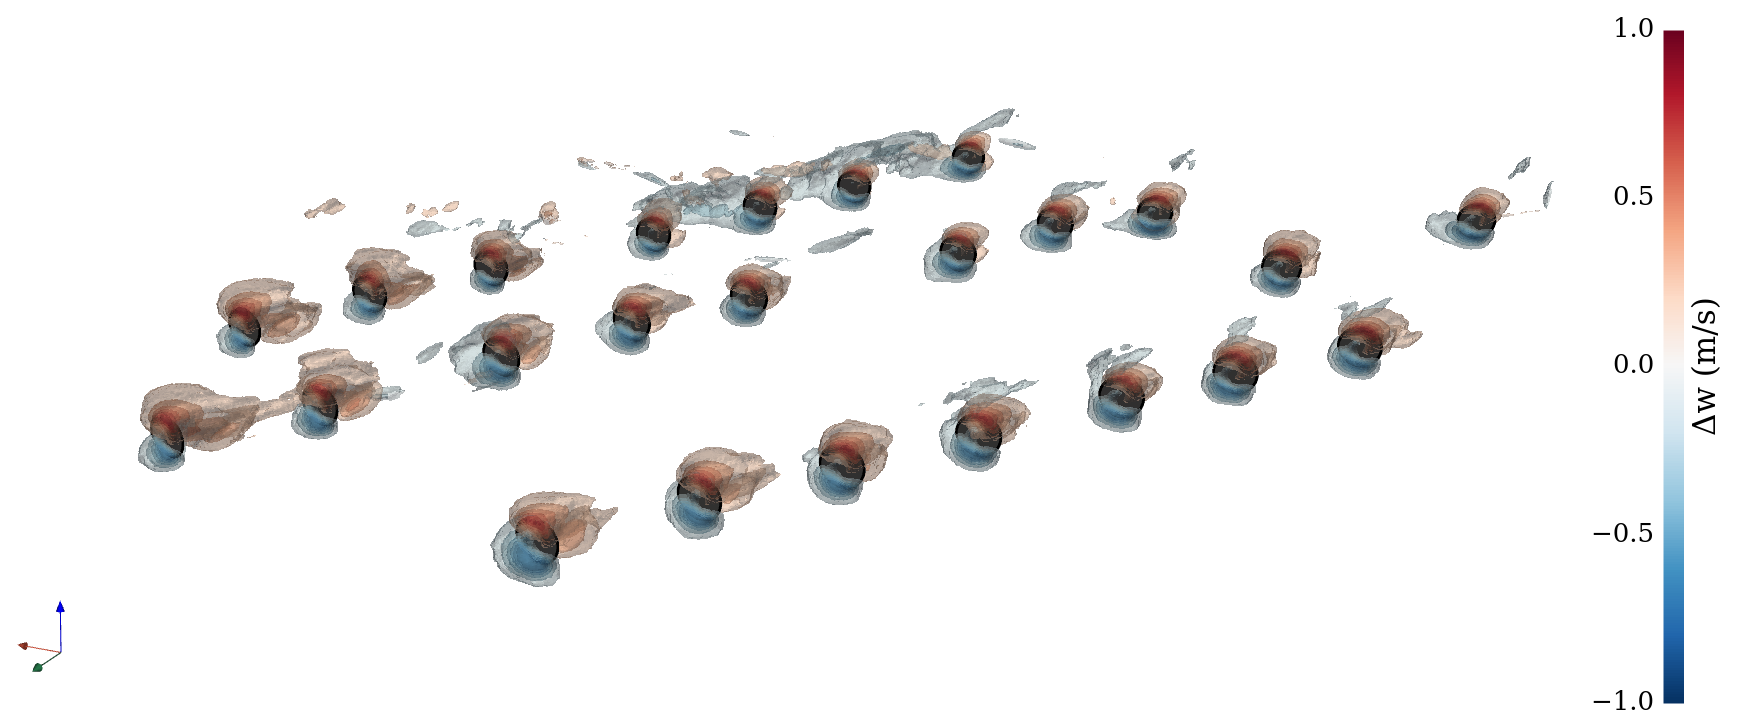
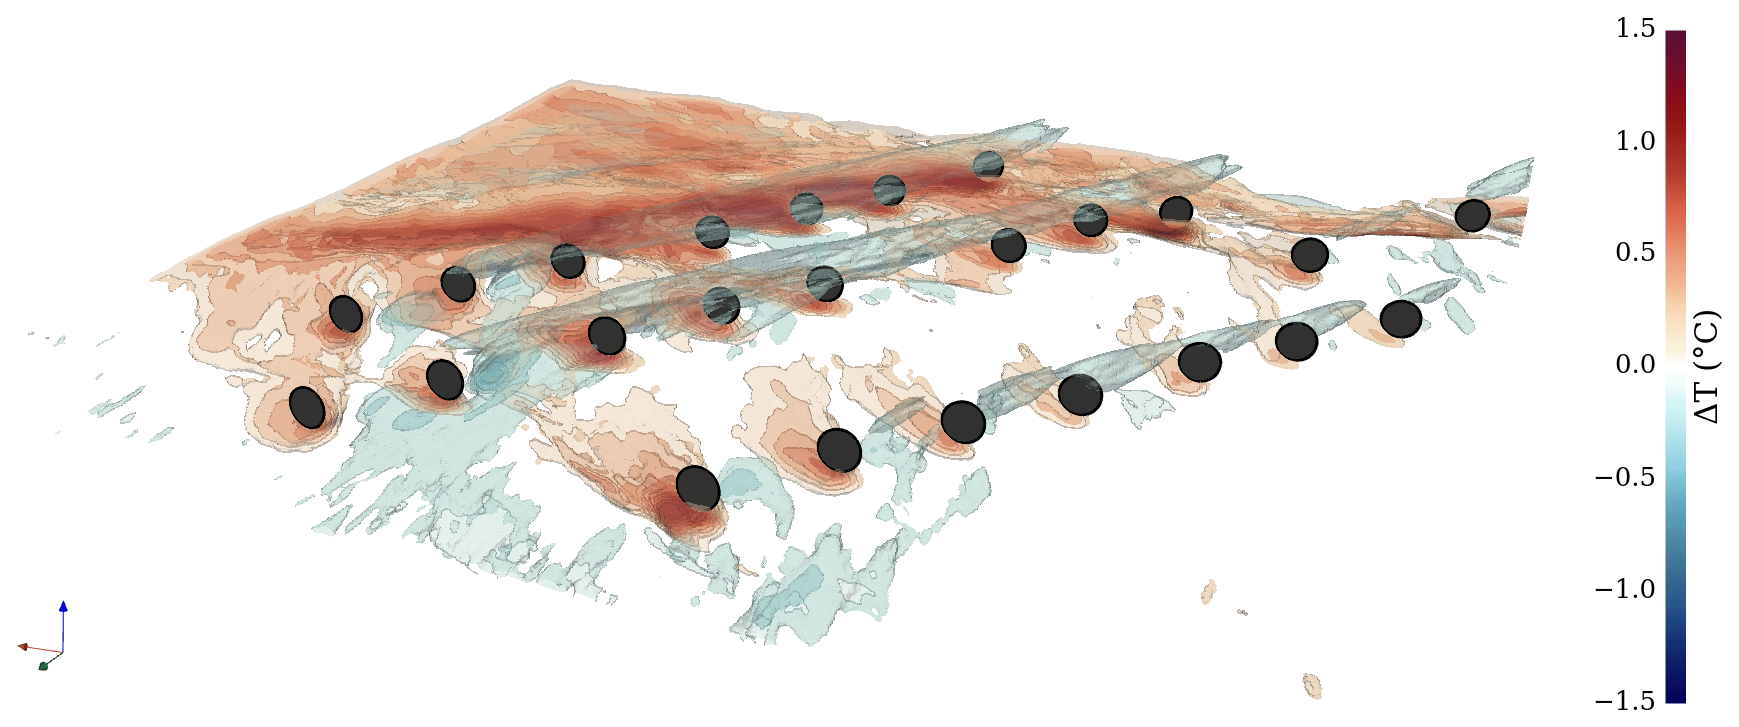
Figures B3, B4 and B5 respectively show the 3D iso-surfaces of wind speed deficit, vertical wind velocity and temperature variation within the subdomain, all viewed from the same perspective. These visualizations provide a spatial representation of the different perturbations induced by the wind turbines.
The vertical motions generated by the turbines are primarily confined to the immediate vicinity of the ADR. These effects are also visible upstream of the turbines, within the induction zone. In contrast, the wind speed deficit wakes extend much further downstream. Additionally, upstream turbine rows generate a wind deficit that impacts downstream turbines.
The temperature variation field highlights a clear vertical structure. Near the surface, localized warming zones are observed, whereas cooling regions develop above the rotor area. Due to the strong wind veer, the advection of these temperature anomalies differs significantly from the wake direction. Near-surface warming is advected toward the left, while cooling aloft is advected toward the right. Furthermore, the magnitude of the warming is significantly larger than that of the cooling.
Finally, by examining the 3D temperature iso-surfaces from Fig. B2, it can be observed that the warming region extends throughout the downstream area of the wind farm while progressively rising in altitude. As a result, this warming is not visible in the 2 m horizontal cross-sections shown in Fig. 13a.
The Meso-NH v5.7.1 code is available at https://doi.org/10.5281/zenodo.15095131 (Meso-NH team, 2024). Some developments from Meso-NH v6.0.0 (https://doi.org/10.5281/zenodo.19398091; Meso-NH team, 2026) were also used in the present simulations.
A video of the large-scale simulation is available at https://doi.org/10.5446/73018 (Boumendil et al., 2026). It shows the vertical cross-sections of wind speed at 80 m above ground level from a Meso-NH simulation between 7 and 8 April 2021, centered on the Ensemble Éolien Catalan wind farm, located west of Perpignan, France.
PB performed the simulations, developed the code, and carried out the post-processing and analysis under the supervision of PAJ, QR and VM. PB prepared the initial draft of the article. All authors reviewed and edited the article.
The contact author has declared that none of the authors has any competing interests.
Publisher's note: Copernicus Publications remains neutral with regard to jurisdictional claims made in the text, published maps, institutional affiliations, or any other geographical representation in this paper. The authors bear the ultimate responsibility for providing appropriate place names. Views expressed in the text are those of the authors and do not necessarily reflect the views of the publisher.
Map data are copyrighted by OpenStreetMap contributors and are available at OpenStreetMap. Computational resources were provided by the Belenos supercomputing facility operated by Météo-France. The authors acknowledge the use of meteorological data from the RADOME station network and the AROME model developed by Météo-France. The authors thank Jean Wurtz, Robert Schotter, Tim Nagel, Marie Minvielle, Fleur Couvreux and Tanguy Lunel for helpful discussions and technical support and for providing some code and scripts used in this work. The authors acknowledge the use of generative artificial intelligence tools to assist with language editing and support the writing process, as well as to contribute to the development and debugging of scripts used in the post-processing of some figures. All scientific content, analysis and conclusions remain the responsibility of the authors.
This paper was edited by Astrid Lampert and reviewed by two anonymous referees.
Adkins, K. A. and Sescu, A.: Observations of relative humidity in the near-wake of a wind turbine using an instrumented unmanned aerial system, Int. J. Green Energy, 14, 845–860, https://doi.org/10.1080/15435075.2017.1334661, 2017. a, b
Adkins, K. A. and Sescu, A.: Analysis of near–surface relative humidity in a wind turbine array boundary layer using an instrumented unmanned aerial system and large–eddy simulation, Wind Energy, 21, 1155–1168, https://doi.org/10.1002/we.2220, 2018. a
Al Oqaily, D., Giani, P., and Crippa, P.: Evaluating WRF Multiscale Wind Simulations in Complex Terrain: Insights From the Perdigão Field Campaign, J. Geophys. Res.-Atmos., 130, https://doi.org/10.1029/2025JD044055, 2025. a, b
Archer, C. L., Wu, S., Vasel-Be-Hagh, A., Brodie, J. F., Delgado, R., St. Pé, A., Oncley, S., and Semmer, S.: The VERTEX field campaign: observations of near-ground effects of wind turbine wakes, J. Turbul., 20, 64–92, https://doi.org/10.1080/14685248.2019.1572161, 2019. a, b, c, d, e, f, g, h
Armstrong, A., Waldron, S., Whitaker, J., and Ostle, N. J.: Wind farm and solar park effects on plant-soil carbon cycling: uncertain impacts of changes in ground-level microclimate, Global Change Biol., 20, 1699–1706, https://doi.org/10.1111/gcb.12437, 2014. a
Baidya Roy, S.: Simulating impacts of wind farms on local hydrometeorology, J. Wind Eng. Ind. Aerod., 99, 491–498, https://doi.org/10.1016/j.jweia.2010.12.013, 2011. a
Baidya Roy, S. and Traiteur, J. J.: Impacts of wind farms on surface air temperatures, P. Natl. Acad. Sci. USA, 107, 17899–17904, https://doi.org/10.1073/pnas.1000493107, 2010. a, b, c
Baidya Roy, S., Pacala, S. W., and Walko, R. L.: Can large wind farms affect local meteorology?, J. Geophys. Res.-Atmos., 109, https://doi.org/10.1029/2004JD004763, 2004. a, b
Bakhoday-Paskyabi, M., Krutova, M., Bui, H., and Ning, X.: Multiscale Simulation of Offshore Wind Variability During Frontal Passage: Brief Implication on Turbines' Wakes and Load, J. Phys. Conf. Ser., 2362, 012003, https://doi.org/10.1088/1742-6596/2362/1/012003, 2022. a, b
Bleeg, J., Purcell, M., Ruisi, R., and Traiger, E.: Wind Farm Blockage and the Consequences of Neglecting Its Impact on Energy Production, Energies, 11, https://doi.org/10.3390/en11061609, 2018. a
Bocher, E., Bernard, J., Wiederhold, E., Leconte, F., Petit, G., Palominos, S., and Noûs, C.: GeoClimate: a Geospatial processing toolbox for environmental and climate studies, J. Open Source Softw., 6, 3541, https://doi.org/10.21105/joss.03541, 2021. a
Boone, A., Masson, V., Meyers, T., and Noilhan, J.: The Influence of the Inclusion of Soil Freezing on Simulations by a Soil–Vegetation–Atmosphere Transfer Scheme, J. Appl. Meteorol., 39, 1544–1569, https://doi.org/10.1175/1520-0450(2000)039<1544:TIOTIO>2.0.CO;2, 2000. a
Boumendil, P., Joulin, P.-A., Toumi, H. Z., Rodier, Q., and Masson, V.: Role of rotational and divergence effects induced by wind turbines wakes on near-ground air warming, J. Phys. Conf. Ser., 2767, 092006, https://doi.org/10.1088/1742-6596/2767/9/092006, 2024. a, b, c, d, e, f, g, h, i, j
Boumendil, P., Rodier, Q., Joulin, P.-A., and Masson, V.: A multi-scale model with an atmosphere – soil – vegetation coupling to explore the effect of wind turbines on near-surface meteorological conditions, J. Phys. Conf. Ser., 3016, 012002, https://doi.org/10.1088/1742-6596/3016/1/012002, 2025. a, b, c, d, e
Caniaux, G., Redelsperger, J.-L., and Lafore, J.-P.: A Numerical Study of the Stratiform Region of a Fast-Moving Squall Line. Part I: General Description and Water and Heat Budgets, J. Atmos. Sci., 51, 2046–2074, https://doi.org/10.1175/1520-0469(1994)051<2046:ANSOTS>2.0.CO;2, 1994. a
Cuxart, J., Bougeault, P., and Redelsperger, J.-L.: A turbulence scheme allowing for mesoscale and large–eddy simulations, Q. J. Roy. Meteor. Soc., 126, 1–30, https://doi.org/10.1002/qj.49712656202, 2000. a
Deardorff, J. W.: Stratocumulus-capped mixed layers derived from a three-dimensional model, Bound.-Lay. Meteorol., 18, 495–527, https://doi.org/10.1007/BF00119502, 1980. a
Decharme, B., Boone, A., Delire, C., and Noilhan, J.: Local evaluation of the Interaction between Soil Biosphere Atmosphere soil multilayer diffusion scheme using four pedotransfer functions, J. Geophys. Res.-Atmos., 116, https://doi.org/10.1029/2011JD016002, 2011. a
Durran, D. R.: Improving the Anelastic Approximation, J. Atmos. Sci., 46, 1453–1461, 1989. a
Faroux, S., Kaptué Tchuenté, A. T., Roujean, J.-L., Masson, V., Martin, E., and Le Moigne, P.: ECOCLIMAP-II/Europe: a twofold database of ecosystems and surface parameters at 1 km resolution based on satellite information for use in land surface, meteorological and climate models, Geosci. Model Dev., 6, 563–582, https://doi.org/10.5194/gmd-6-563-2013, 2013. a, b
Fernando, H. J. S., Mann, J., Palma, J. M. L. M., Lundquist, J. K., Barthelmie, R. J., Belo-Pereira, M., Brown, W. O. J., Chow, F. K., Gerz, T., Hocut, C. M., Klein, P. M., Leo, L. S., Matos, J. C., Oncley, S. P., Pryor, S. C., Bariteau, L., Bell, T. M., Bodini, N., Carney, M. B., Courtney, M. S., Creegan, E. D., Dimitrova, R., Gomes, S., Hagen, M., Hyde, J. O., Kigle, S., Krishnamurthy, R., Lopes, J. C., Mazzaro, L., Neher, J. M. T., Menke, R., Murphy, P., Oswald, L., Otarola-Bustos, S., Pattantyus, A. K., Rodrigues, C. V., Schady, A., Sirin, N., Spuler, S., Svensson, E., Tomaszewski, J., Turner, D. D., van Veen, L., Vasiljević, N., Vassallo, D., Voss, S., Wildmann, N., and Wang, Y.: The Perdigão: Peering into Microscale Details of Mountain Winds, B. Am. Meteorol. Soc., 100, 799–819, https://doi.org/10.1175/BAMS-D-17-0227.1, 2019. a
Fitch, A. C., Olson, J. B., Lundquist, J. K., Dudhia, J., Gupta, A. K., Michalakes, J., and Barstad, I.: Local and Mesoscale Impacts of Wind Farms as Parameterized in a Mesoscale NWP Model, Mon. Weather Rev., 140, 3017–3038, https://doi.org/10.1175/MWR-D-11-00352.1, 2012. a
García-Santiago, O., Hahmann, A. N., Badger, J., and Peña, A.: Evaluation of wind farm parameterizations in the WRF model under different atmospheric stability conditions with high-resolution wake simulations, Wind Energ. Sci., 9, 963–979, https://doi.org/10.5194/wes-9-963-2024, 2024. a
Henschen, M., Herrholtz, B., Rhudy, L., Demchak, K., Doogs, B., Holland, J., Larson, E., Martin, J., and Rudkin, M.: Do Wind Turbines Affect Weather Conditions: A Case Study in Indiana, Journal of Purdue Undergraduate Research, 1, 22–29, https://doi.org/10.5703/jpur.01.1.4, 2011. a, b, c
Hogan, R. J. and Bozzo, A.: A Flexible and Efficient Radiation Scheme for the ECMWF Model, J. Adv. Model. Earth Sy., 10, 1990–2008, https://doi.org/10.1029/2018MS001364, 2018. a
Honnert, R., Masson, V., Lac, C., and Nagel, T.: A Theoretical Analysis of Mixing Length for Atmospheric Models From Micro to Large Scales, Front. Earth Sci., 8, https://doi.org/10.3389/feart.2020.582056, 2021. a
Joulin, P.-A.: Modélisation à fine échelle des interactions entre parcs éoliens et météorologie locale, thèse de doctorat dirigée par Masson, Valéry Océan, atmosphère, climat Toulouse, INPT 2019, https://doi.org/10.70675/7c8be7f3z9598z4c86za4e0z249da7039 2a4, 2019. a, b, c
Joulin, P.-A., Mayol, M. L., Masson, V., Blondel, F., Rodier, Q., Cathelain, M., and Lac, C.: The Actuator Line Method in the Meteorological LES Model Meso-NH to Analyze the Horns Rev 1 Wind Farm Photo Case, Front. Earth Sci., 7, https://doi.org/10.3389/feart.2019.00350, 2020. a, b, c
Boumendil, P., Joulin, P.-A., Rodier, Q., and Masson, V.: Vertical cross-sections of wind speed at 80 m above ground level from a Meso-NH simulation between 7 and 8 April 2021, centered on the Ensemble Éolien Catalan wind farm, located west of Perpignan, France, TIB AV-Portal [video], https://doi.org/10.5446/73018, 2026. a, b
Kaffine, D. T.: Microclimate effects of wind farms on local crop yields, J. Environ. Econ. Manag., 96, 159–173, https://doi.org/10.1016/j.jeem.2019.06.001, 2019. a
Kale, B., Buckingham, S., van Beeck, J., and Cuerva-Tejero, A.: Multi-scale modeling of a wind turbine wake in complex terrain, J. Phys. Conf. Ser., 2505, 012012, https://doi.org/10.1088/1742-6596/2505/1/012012, 2023. a, b, c, d
Keith, D. W., Decarolis, J. F., Denkenberger, D. C., Lenschow, D. H., Malyshev, S. L., Pacala, S., and Rasch, P. J.: The influence of large-scale wind power on global climate, P. Natl. Acad. Sci. USA, 101, 16115–16120, https://doi.org/10.1073/pnas.0406930101, 2004. a
Lac, C., Chaboureau, J.-P., Masson, V., Pinty, J.-P., Tulet, P., Escobar, J., Leriche, M., Barthe, C., Aouizerats, B., Augros, C., Aumond, P., Auguste, F., Bechtold, P., Berthet, S., Bielli, S., Bosseur, F., Caumont, O., Cohard, J.-M., Colin, J., Couvreux, F., Cuxart, J., Delautier, G., Dauhut, T., Ducrocq, V., Filippi, J.-B., Gazen, D., Geoffroy, O., Gheusi, F., Honnert, R., Lafore, J.-P., Lebeaupin Brossier, C., Libois, Q., Lunet, T., Mari, C., Maric, T., Mascart, P., Mogé, M., Molinié, G., Nuissier, O., Pantillon, F., Peyrillé, P., Pergaud, J., Perraud, E., Pianezze, J., Redelsperger, J.-L., Ricard, D., Richard, E., Riette, S., Rodier, Q., Schoetter, R., Seyfried, L., Stein, J., Suhre, K., Taufour, M., Thouron, O., Turner, S., Verrelle, A., Vié, B., Visentin, F., Vionnet, V., and Wautelet, P.: Overview of the Meso-NH model version 5.4 and its applications, Geosci. Model Dev., 11, 1929–1969, https://doi.org/10.5194/gmd-11-1929-2018, 2018. a, b, c, d
Lafore, J. P., Stein, J., Asencio, N., Bougeault, P., Ducrocq, V., Duron, J., Fischer, C., Héreil, P., Mascart, P., Masson, V., Pinty, J. P., Redelsperger, J. L., Richard, E., and Vilà-Guerau de Arellano, J.: The Meso-NH Atmospheric Simulation System. Part I: adiabatic formulation and control simulations, Ann. Geophys., 16, 90–109, https://doi.org/10.1007/s00585-997-0090-6, 1998. a
Lamichhane, J. R.: Rising risks of late-spring frosts in a changing climate, Nat. Clim. Change, 11, 554–555, https://doi.org/10.1038/s41558-021-01090-x, 2021. a
Le Cap, C., Carlier, J., Quénol, H., Heitz, D., and Buisson, E.: Analysis of the spatial variability of temperature with the aim of improving the location of wind machines, Theor. Appl. Climatol., 155, 421–438, https://doi.org/10.1007/s00704-023-04642-7, 2024. a
Le Moigne, P., Albergel, C., Boone, A., Belamari, S., Decharme, B., Dumont, M., Masson, V., Brun, E., Calvet, J.-C., Giordani, H., Lafont, S., Morin, S., Vionnet, V., Faroux, S., Gibelin, A.-L., Lebeaupin Brossier, C., Mahfouf, J.-F., Martin, E., Mironov, D., Noilhan, J., Tulet, P., and Van Den Hurk, B.: SURFEX scientific documentation, CNRM, Météo-France, Toulouse, France, https://www.umr-cnrm.fr/surfex/ (last access: 15 October 2026), 2018. a
Lemoine, A. and Pineaud, A.: Bulletin climatique avril 2021, https://donneespubliques.meteofrance.fr/donnees_libres/bulletins/BCM/202104.pdf (last access: 15 October 2026), 2021. a
Lu, H. and Porté-Agel, F.: Large-eddy simulation of a very large wind farm in a stable atmospheric boundary layer, Phys. Fluids, 23, https://doi.org/10.1063/1.3589857, 2011. a
Lu, H. and Porté-Agel, F.: On the Impact of Wind Farms on a Convective Atmospheric Boundary Layer, Bound.-Lay. Meteorol., 157, 81–96, https://doi.org/10.1007/s10546-015-0049-1, 2015. a
Lundquist, J. K., Letizia, S., and Radünz, W. C.: Can we distinguish between wind-farm-wake-induced and terrain-induced surface warming?, J. Phys. Conf. Ser., 3224, 032069, https://doi.org/10.1088/1742-6596/3224/3/032069, 2026. a, b
Masson, V.: A Physically-Based Scheme For The Urban Energy Budget In Atmospheric Models, Bound.-Lay. Meteorol., 94, 357–397, https://doi.org/10.1023/A:1002463829265, 2000. a
Masson, V., Le Moigne, P., Martin, E., Faroux, S., Alias, A., Alkama, R., Belamari, S., Barbu, A., Boone, A., Bouyssel, F., Brousseau, P., Brun, E., Calvet, J.-C., Carrer, D., Decharme, B., Delire, C., Donier, S., Essaouini, K., Gibelin, A.-L., Giordani, H., Habets, F., Jidane, M., Kerdraon, G., Kourzeneva, E., Lafaysse, M., Lafont, S., Lebeaupin Brossier, C., Lemonsu, A., Mahfouf, J.-F., Marguinaud, P., Mokhtari, M., Morin, S., Pigeon, G., Salgado, R., Seity, Y., Taillefer, F., Tanguy, G., Tulet, P., Vincendon, B., Vionnet, V., and Voldoire, A.: The SURFEXv7.2 land and ocean surface platform for coupled or offline simulation of earth surface variables and fluxes, Geosci. Model Dev., 6, 929–960, https://doi.org/10.5194/gmd-6-929-2013, 2013. a, b, c, d
Meso-NH team: Meso-NH (Version 5.7.1), Zenodo [code], https://doi.org/10.5281/zenodo.15095131, 2024. a
Meso-NH team: Meso-NH (Version 6.0.0), Zenodo [code], https://doi.org/10.5281/zenodo.19398091, 2026. a
Mi, L., Li, B., Chen, H., Zhang, C., Han, Y., and Cai, C. S.: Multiscale coupling wake simulations for a horizontal-axis wind turbine mounted in complex terrains, Energ. Source. Part A, 47, 1817–1835, https://doi.org/10.1080/15567036.2025.2449980, 2025. a, b
Mirocha, J. D., Kosovic, B., Aitken, M. L., and Lundquist, J. K.: Implementation of a generalized actuator disk wind turbine model into the weather research and forecasting model for large-eddy simulation applications, J. Renew. Sustain. Ener., 6, https://doi.org/10.1063/1.4861061, 2014. a, b, c, d
OpenStreetMap contributors: Planet dump retrieved from https://planet.osm.org, https://www.openstreetmap.org (last access: 15 October 2026), 2026. a, b
Pergaud, J., Masson, V., Malardel, S., and Couvreux, F.: A Parameterization of Dry Thermals and Shallow Cumuli for Mesoscale Numerical Weather Prediction, Bound.-Lay. Meteorol., 132, 83–106, https://doi.org/10.1007/s10546-009-9388-0, 2009. a
Pinty, J.-P. and Jabouille, P.: A mixed-phase cloud parameterization for use in a mesoscale non-hydrostatic model: Simulations of a squall line of orographic precipitation, Proc. Conf. of Cloud Physics, Everett, WA, USA, Amer. Meteor. Soc., 217–220, 1998. a
Porté-Agel, F., Bastankhah, M., and Shamsoddin, S.: Wind-Turbine and Wind-Farm Flows: A Review, Bound.-Lay. Meteorol., 174, 1–59, https://doi.org/10.1007/s10546-019-00473-0, 2020. a, b
Qin, Y., Li, Y., Xu, R., Hou, C., Armstrong, A., Bach, E., Wang, Y., and Fu, B.: Impacts of 319 wind farms on surface temperature and vegetation in the United States, Environ. Res. Lett., 17, 024026, https://doi.org/10.1088/1748-9326/ac49ba, 2022. a
Quint, D., Lundquist, J. K., Bodini, N., and Rosencrans, D.: Simulated meteorological impacts of offshore wind turbines and sensitivity to the amount of added turbulence kinetic energy, Wind Energ. Sci., 10, 1269–1301, https://doi.org/10.5194/wes-10-1269-2025, 2025. a, b, c, d
Rajewski, D. A., Takle, E. S., Lundquist, J. K., Oncley, S., Prueger, J. H., Horst, T. W., Rhodes, M. E., Pfeiffer, R., Hatfield, J. L., Spoth, K. K., and Doorenbos, R. K.: Crop Wind Energy Experiment (CWEX): Observations of Surface-Layer, Boundary Layer, and Mesoscale Interactions with a Wind Farm, B. Am. Meteorol. Soc., 94, 655–672, https://doi.org/10.1175/BAMS-D-11-00240.1, 2013. a, b, c, d, e
Rajewski, D. A., Takle, E. S., Prueger, J. H., and Doorenbos, R. K.: Toward understanding the physical link between turbines and microclimate impacts from in situ measurements in a large wind farm, J. Geophys. Res.-Atmos., 121, https://doi.org/10.1002/2016JD025297, 2016. a, b
Rasheed, A., Tabib, M., and Kristiansen, J.: Wind Farm Modeling in a Realistic Environment Using a Multiscale Approach, in: Volume 10: Ocean Renewable Energy, American Society of Mechanical Engineers, ISBN 978-0-7918-5778-6, https://doi.org/10.1115/omae2017-61686, 2017. a
Seity, Y., Brousseau, P., Malardel, S., Hello, G., Bénard, P., Bouttier, F., Lac, C., and Masson, V.: The AROME-France Convective-Scale Operational Model, Mon. Weather Rev., 139, 976–991, https://doi.org/10.1175/2010MWR3425.1, 2011. a
Slawsky, L. M., Zhou, L., Baidya Roy, S., Xia, G., Vuille, M., and Harris, R. A.: Observed Thermal Impacts of Wind Farms Over Northern Illinois, Sensors (Basel, Switzerland), 15, 14981–15005, https://doi.org/10.3390/s150714981, 2015. a
Smith, C. M., Barthelmie, R. J., and Pryor, S. C.: In situ observations of the influence of a large onshore wind farm on near-surface temperature, turbulence intensity and wind speed profiles, Environ. Res. Lett., 8, 034006, https://doi.org/10.1088/1748-9326/8/3/034006, 2013. a, b, c
Snyder, R. L. and de Melo-Abreu, J. P.: Frost protection: Fundamentals, practice and economics, vol. no. 10 of Environment and natural resources series, Food and Agriculture Organization of the United Nations, Rome, ISBN 92-5-105328-6, 2005. a, b, c
Tang, B., Wu, D., Zhao, X., Zhou, T., Zhao, W., and Wei, H.: The Observed Impacts of Wind Farms on Local Vegetation Growth in Northern China, Remote Sens., 9, 332, https://doi.org/10.3390/rs9040332, 2017. a
Tardieu, J. and Leroy, M.: Radome, le réseau temps réel d'observation au sol de Météo-France, La Météorologie, 8, 40, https://doi.org/10.4267/2042/36262, 2003. a, b
Urziceanu, M., Anastasiu, P., Rozylowicz, L., and Sesan, T. E.: Local-scale impact of wind energy farms on rare, endemic, and threatened plant species, PeerJ, 9, e11390, https://doi.org/10.7717/peerj.11390, 2021. a
Wang, Q., Luo, K., Yuan, R., Wang, S., Fan, J., and Cen, K.: A multiscale numerical framework coupled with control strategies for simulating a wind farm in complex terrain, Energy, 203, 117913, https://doi.org/10.1016/j.energy.2020.117913, 2020. a
Willmott, C. J.: On the Validation of Models, Phys. Geogr., 2, 184–194, https://doi.org/10.1080/02723646.1981.10642213, 1981. a
Willmott, C. J.: Some Comments on the Evaluation of Model Performance, B. Am. Meteorol. Soc., 63, 1309–1313, https://doi.org/10.1175/1520-0477(1982)063<1309:SCOTEO>2.0.CO;2, 1982. a
Wise, A. S., Neher, J. M. T., Arthur, R. S., Mirocha, J. D., Lundquist, J. K., and Chow, F. K.: Meso- to microscale modeling of atmospheric stability effects on wind turbine wake behavior in complex terrain, Wind Energ. Sci., 7, 367–386, https://doi.org/10.5194/wes-7-367-2022, 2022. a, b
Wu, S. and Archer, C. L.: Near-Ground Effects of Wind Turbines: Observations and Physical Mechanisms, Mon. Weather Rev., 149, 879–898, https://doi.org/10.1175/MWR-D-20-0186.1, 2021. a, b, c, d, e
Wu, S., Archer, C. L., and Mirocha, J. D.: New insights on wind turbine wakes from large–eddy simulation: Wake contraction, dual nature, and temperature effects, Wind Energy, https://doi.org/10.1002/we.2827, 2023. a, b, c, d, e
Wu, Y.-T. and Porté-Agel, F.: Large-Eddy Simulation of Wind-Turbine Wakes: Evaluation of Turbine Parametrisations, Bound.-Lay. Meteorol., 138, 345–366, https://doi.org/10.1007/s10546-010-9569-x, 2011. a, b, c
Xia, G., Zhou, L., Minder, J. R., Fovell, R. G., and Jimenez, P. A.: Simulating impacts of real-world wind farms on land surface temperature using the WRF model: physical mechanisms, Clim. Dynam., 53, 1723–1739, https://doi.org/10.1007/s00382-019-04725-0, 2019. a, b
Xie, S. and Archer, C. L.: A Numerical Study of Wind-Turbine Wakes for Three Atmospheric Stability Conditions, Bound.-Lay. Meteorol., 165, 87–112, https://doi.org/10.1007/s10546-017-0259-9, 2017. a, b, c, d, e, f
Zhou, L., Tian, Y., Baidya Roy, S., Thorncroft, C., Bosart, L. F., and Hu, Y.: Impacts of wind farms on land surface temperature, Nat. Clim. Change, 2, 539–543, https://doi.org/10.1038/nclimate1505, 2012. a, b
- Abstract
- Introduction
- Case study
- Methods
- Validation and meteorological conditions at the test site
- Results: interaction between the atmosphere and the wind farm
- Discussion
- Conclusions
- Appendix A: Vertical profiles
- Appendix B: Vertical cross-sections of ADR wakes and 3D iso-surfaces
- Code availability
- Video supplement
- Author contributions
- Competing interests
- Disclaimer
- Acknowledgements
- Review statement
- References
- Abstract
- Introduction
- Case study
- Methods
- Validation and meteorological conditions at the test site
- Results: interaction between the atmosphere and the wind farm
- Discussion
- Conclusions
- Appendix A: Vertical profiles
- Appendix B: Vertical cross-sections of ADR wakes and 3D iso-surfaces
- Code availability
- Video supplement
- Author contributions
- Competing interests
- Disclaimer
- Acknowledgements
- Review statement
- References