the Creative Commons Attribution 4.0 License.
the Creative Commons Attribution 4.0 License.
 | 10 Mar 2026
How accurately do engineering methods capture floating wind turbine performance and wake? A critical perspective using multi-fidelity simulations
Stefano Cioni
Francesco Papi
Pier Francesco Melani
Alessandro Fontanella
Agnese Firpo
Andrea Giuseppe Sanvito
Giacomo Persico
Vincenzo Dossena
Sara Muggiasca
Marco Belloli
Alessandro Bianchini
Despite an increasing number of experimental and numerical studies, the influence of platform motion on wake dynamics (wake recovery and turbulence production) in floating offshore wind turbines is still an open research question. In particular, efforts are being made to understand the accuracy of numerical models in use so far for fixed-bottom turbines when they are applied to floating configurations. Similarly to what has been done in the IEA OC6 task, in this work, a multi-fidelity approach is leveraged to investigate the capabilities of engineering models to capture the wake dynamics of a wind turbine model under imposed motion. In contrast to previous studies, however, many more different operating conditions have been investigated, including surge, pitch, yaw, and wind–wave misalignment cases; moreover, numerical methods are here consistently applied to the same test cases, which are part of the first experimental round of the NETTUNO project. More specifically, free vortex wake (FVW), actuator line model (ALM), and blade-resolved computational fluid dynamics (CFD) simulations have been benchmarked, and their capabilities in predicting the mean wake response and the onset of velocity oscillations in the wake of a floating wind turbine were evaluated. Results showed that FVW methods, if properly tuned, can correctly capture the wake response up to 3 D from the rotor, but to simulate the wake response up to 5 D, higher-fidelity methods are required. Significant improvements are achieved with ALM CFD simulations, even though a URANS approach might struggle to correctly predict the wake dissipation due to the interaction between the free-stream turbulence and wake.
- Article
(17426 KB) - Full-text XML
- BibTeX
- EndNote


Floating offshore wind turbines (FOWTs) have been one of the key study areas for wind energy research in the last few years because they represent the most promising way of exploiting the vast wind energy potential in deep waters. Despite recent research efforts, further work is required to improve the understanding of the complex interactions taking place between wind-driven loads, the aero-servo-elastic behavior of the rotor, and the hydrodynamics of the floater (Veers et al., 2023).
In fact, the additional degrees of freedom (DOF) alter the dynamic behavior of the system, both in terms of aerodynamic response of the rotor and the dynamics of the wake and control system. In particular, from an aerodynamic point of view, the effect of platform motion is twofold. First, the flow field around the rotor is modified (Chen et al., 2020; Sebastian and Lackner, 2013; Tran and Kim, 2015), causing, for example, local differences in the relative wind speed. Second, during the complex motion of the platform, especially in the case of severe sea states, the blades might enter their own wake, affecting the local induction and wake behavior (Dong and Viré, 2022; Papi et al., 2024; Ramos-García et al., 2022).
Understanding the wake dynamics of a floating wind turbine represents also a topic of interest, so as to reduce the installation, and operation and maintenance costs. Floating wind turbines will be installed in clusters, leading to significant wake interactions.
In fact, analogously to fixed-bottom machines, floating wind turbines placed downstream operate in the wake of the upstream machines, leading to reduced power production and increased loading. For this reason, installing wind turbines in clusters represents a non-trivial issue and requires careful design. Research has focused on improving the understanding of wake dynamics to provide industry with valuable information and models which may aid the optimization of future wind farms.
Despite recent progress in the investigation of fixed-bottom wind turbine wakes (Porté-Agel et al., 2020), understanding the wake dynamics of FOWTs and the differences from the fixed-bottom behavior over a range of operating conditions remains an open question. In fact, it is still unclear how the additional degrees of freedom of FOWTs impact the wake development.
Previous work has shown that platform motion induces periodic oscillations in aerodynamic rotor loading due to the changes in relative velocity (Bergua et al., 2023; Fontanella et al., 2021; Schulz et al., 2024; Taruffi et al., 2024), and this is expected to also impact the wake dynamics. At first, it was assumed that the oscillations in rotor aerodynamic response could lead to an improvement in mixing in the wake, improving the velocity recovery. This would lead to better performance of floating wind turbines in a waked configuration, due to the reduced velocity deficit and increased energy available in the wake.
However, previous studies concerning wake deficit have shown that the impact of platform motion on the wake depends on both operating (Fontanella et al., 2025) and inflow conditions (Li et al., 2022; Pagamonci et al., 2025). Wind tunnel experiments performed by Fontanella et al. (2021) during the UNAFLOW campaign and subsequently during the NETTUNO experimental campaign, have shown that the investigated sinusoidal platform motion conditions, including surge, pitch yaw, and wind–wave misalignment, have only a minor impact on wake deficit up to 5 D from the rotor. In contrast, Messmer et al. (2024a, b) investigated the wake response for a distance up to 8 D and observed further differences in the average wake recovery, especially when the inflow turbulent intensity is below 3 %. At higher turbulence levels, the first full-scale LIDAR measurements of a 6 MW floating wind turbine have also shown no significant difference in wake recovery (Angelou et al., 2023). Indeed, this result is consistent with the findings of Pagamonci et al. (2025), which have shown that inflow turbulence can have a significant impact on wake development of a floating wind turbine. Numerical studies have also investigated the wake deficit of floating wind turbines under imposed motion (Arabgolarcheh et al., 2022; Kleine et al., 2022; Ramos-García et al., 2022). Results have shown that the additional DOF can lead to the faster breakdown of the vortex structures in the near wake (Arabgolarcheh et al., 2022; Kleine et al., 2022), due to periodic variations in the position (Tran and Kim, 2015) and intensity of the tip vortices (Cioni et al., 2023). Nevertheless, the impact on the wake deficit was limited in the investigated conditions (Pagamonci et al., 2025; Ramos-García et al., 2022).
In addition to possible differences in wake deficit, the platform motion could also induce coherent velocity oscillations in the wake at the frequency of motion (Kleine et al., 2021), which could lead to increased loading on downstream turbines or even excite the response of the low-frequency platform modes (Veers et al., 2023). Wind tunnel measurements performed by Fontanella et al. (2022) showed that surge and pitching motions of a FOWT can induce velocity oscillations in the wake that are propagated downstream at a characteristic speed. Such oscillations are maximized for specific oscillation frequencies (Fontanella et al., 2025; Kleine et al., 2022; Schliffke et al., 2024), resulting in large streamwise velocity oscillations.
These large coherent structures are generated in the wake even for turbulent inflows, which could lead to increased loading on downstream turbines (Duan et al., 2025; Messmer et al., 2024b; Pagamonci et al., 2025; Schliffke et al., 2020). However, the current numerical methods may struggle to correctly capture their amplitude, as shown in the code-to-code comparison performed during the OC6 phase III project (Cioni et al., 2023).
In this complex scenario, a significant issue hampering progress in the understanding of floating wind turbine wakes is, in fact, validation. The vast availability of numerical methods has allowed industry and academia to study the aerodynamic and wake response of floating wind turbines without the need for expensive models or prototypes. These methods have been developed and extensively tested for fixed-bottom wind turbines; however, similar validation campaigns have still not been performed for floating wind turbines, mainly due to the lack of open-access experimental or field data. For this reason, simulation codes may not always provide reliable results, and results may depend on the specific numerical setup employed. For example, lower-fidelity methods are often significantly affected by tuning parameters, which may alter simulation results drastically. In particular, previous investigations performed during the OC6 phase III project have shown that numerical models mainly differ in terms of wake dynamics (Cioni et al., 2023), even though the rotor integral loads are usually captured with minor differences across different methodologies (Bergua et al., 2023).
In this framework, the NETTUNO project (Fontanella et al., 2025) aims to evaluate the accuracy of the available numerical codes, as well as shed further light on the actual physics governing the wake dynamics of a FOWT employing a multi-fidelity approach (i.e., multiple stand-alone numerical models with varying degrees of fidelity and different computational cost). In this way, the capabilities and limitations of each methodology can be highlighted. The analysis was carried out on a scaled model of the DTU 10 MW, which, with a diameter of 2.38 m, represents the largest model of a floating wind turbine investigated to date. In this way, this work builds on previous studies on floating wind turbines, which usually employ a smaller scale model (Messmer et al., 2024a) or a porous disk (Schliffke et al., 2024). The results obtained from free vortex wake (FVW) and actuator line model (ALM) URANS simulations were compared with the experiments to evaluate their capabilities and limitations in predicting the rotor aerodynamic response and wake dynamics. Following the comparison, the FVW method was properly tuned to improve its reliability. For the ALM URANS simulations, two different ALM URANS models and numerical setups employed by two different institutions, namely University of Florence and Politecnico di Milano, were employed to provide a range of accuracy for this methodology and sensitivity to simulation parameters. The validation of the numerical models was carried out over a significant range of operating conditions, including surge, pitch, and yaw motion, and wind–wave misalignment, up to 5 D from the rotor, representing, to the best of the authors' knowledge, the most in-depth evaluation to date of lower-fidelity models in comparison to experimental data (Cioni et al., 2023; Panthi and Iungo, 2025). In fact, previous works have focused mainly on surge motion (Cioni et al., 2023), while an in-depth comparison under more complex cases is still lacking. Additionally, previous analyses of the same test case with different numerical models, such as those carried out during the OC6 phase III project (Cioni et al., 2023), were limited to 2.4 D downstream, allowing for a limited investigation of the wake dynamics.
The numerical models were also compared with high-fidelity blade-resolved URANS simulations, which provide complementary data to the experiment in terms of spanwise rotor loads. This further comparison sheds light on the rotor aerodynamic response and provides a further benchmark for the lifting line models. Additionally, 2 D velocity fields from ALM large-eddy simulations (LESs) performed during the NETTUNO project (Pagamonci et al., 2025) are also leveraged to investigate whether lower-fidelity models can capture the coherent structures generated in the wake due to platform motion. Despite its significant computational cost, this method should better capture the interaction of the wake with free-stream turbulence, and the development and collapse of the vortex structures in the wake.
This work is structured as follows: Sects. 2 and 3 describe the experimental setup and numerical methods employed in this work, respectively. The main outcomes of the analysis are presented in Sects. 4 and 5, where the aerodynamic loads and wake response are evaluated. Finally, the main conclusions of this work are summarized in Sect. 6.
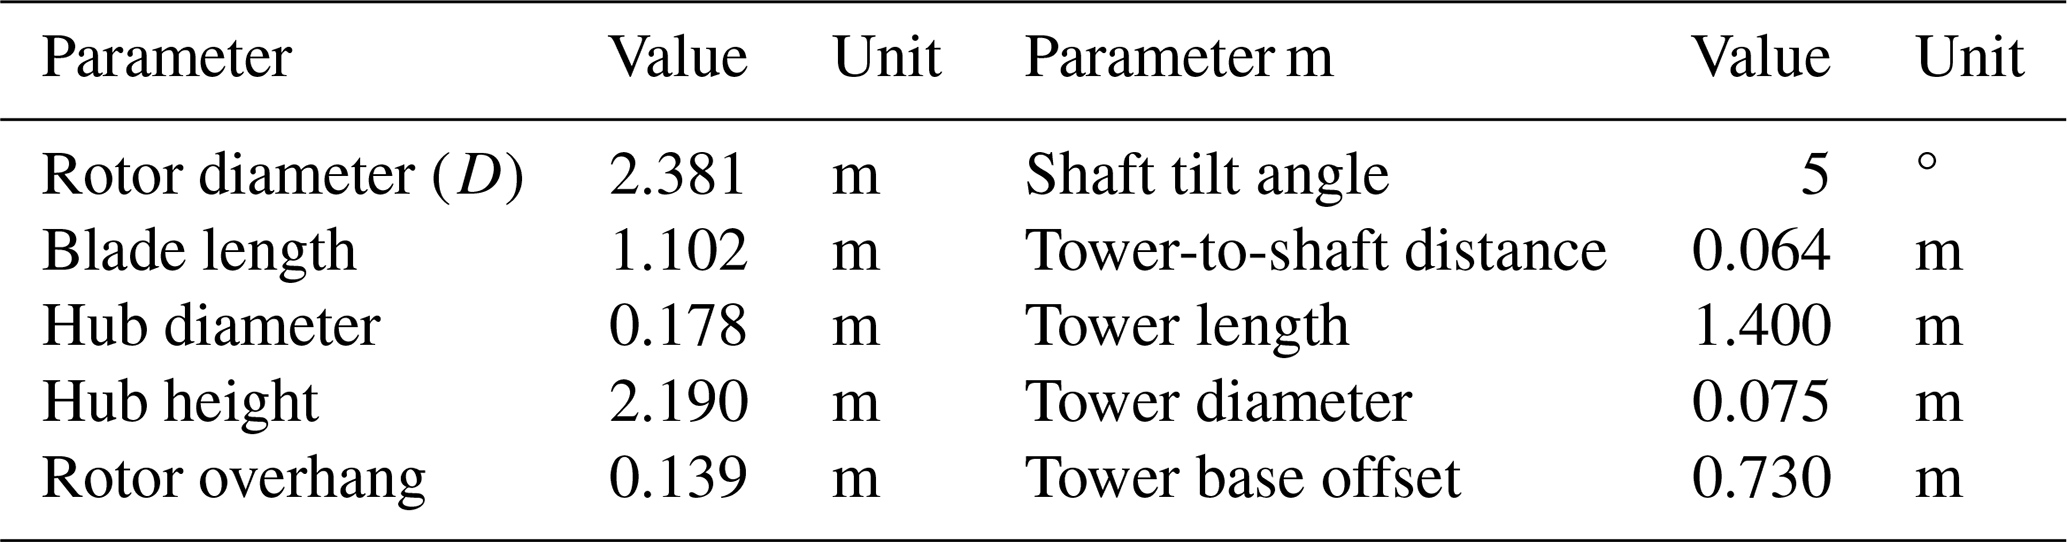
The experimental data employed as a benchmark in the NETTUNO project was obtained during an experimental campaign carried out at the wind tunnel of Politecnico di Milano (Fontanella et al., 2025). A 1:75 scaled model of the DTU 10 MW (Bak et al., 2013) turbine was placed on a 6 DOF robot and tested under multiple imposed platform motion conditions. The main geometric parameters of the wind turbine model are summarized in Table 1. Sinusoidal surge, and pitch and yaw motions were tested with varying amplitudes and frequencies to provide a benchmark over multiple operating conditions.
The wind tunnel campaign focused mainly on the surge and pitch motions of the platform. The wake development was assessed with varying amplitudes, frequencies of motion, and apparent wind speed induced by the motion at the hub, which ranged from 0.1 to 0.7 m s−1. Following existing literature (Bergua et al., 2023; Fontanella et al., 2021; Taruffi et al., 2024), the investigated frequencies are expressed in the form of rotor-reduced frequency, as in Eq. (1):
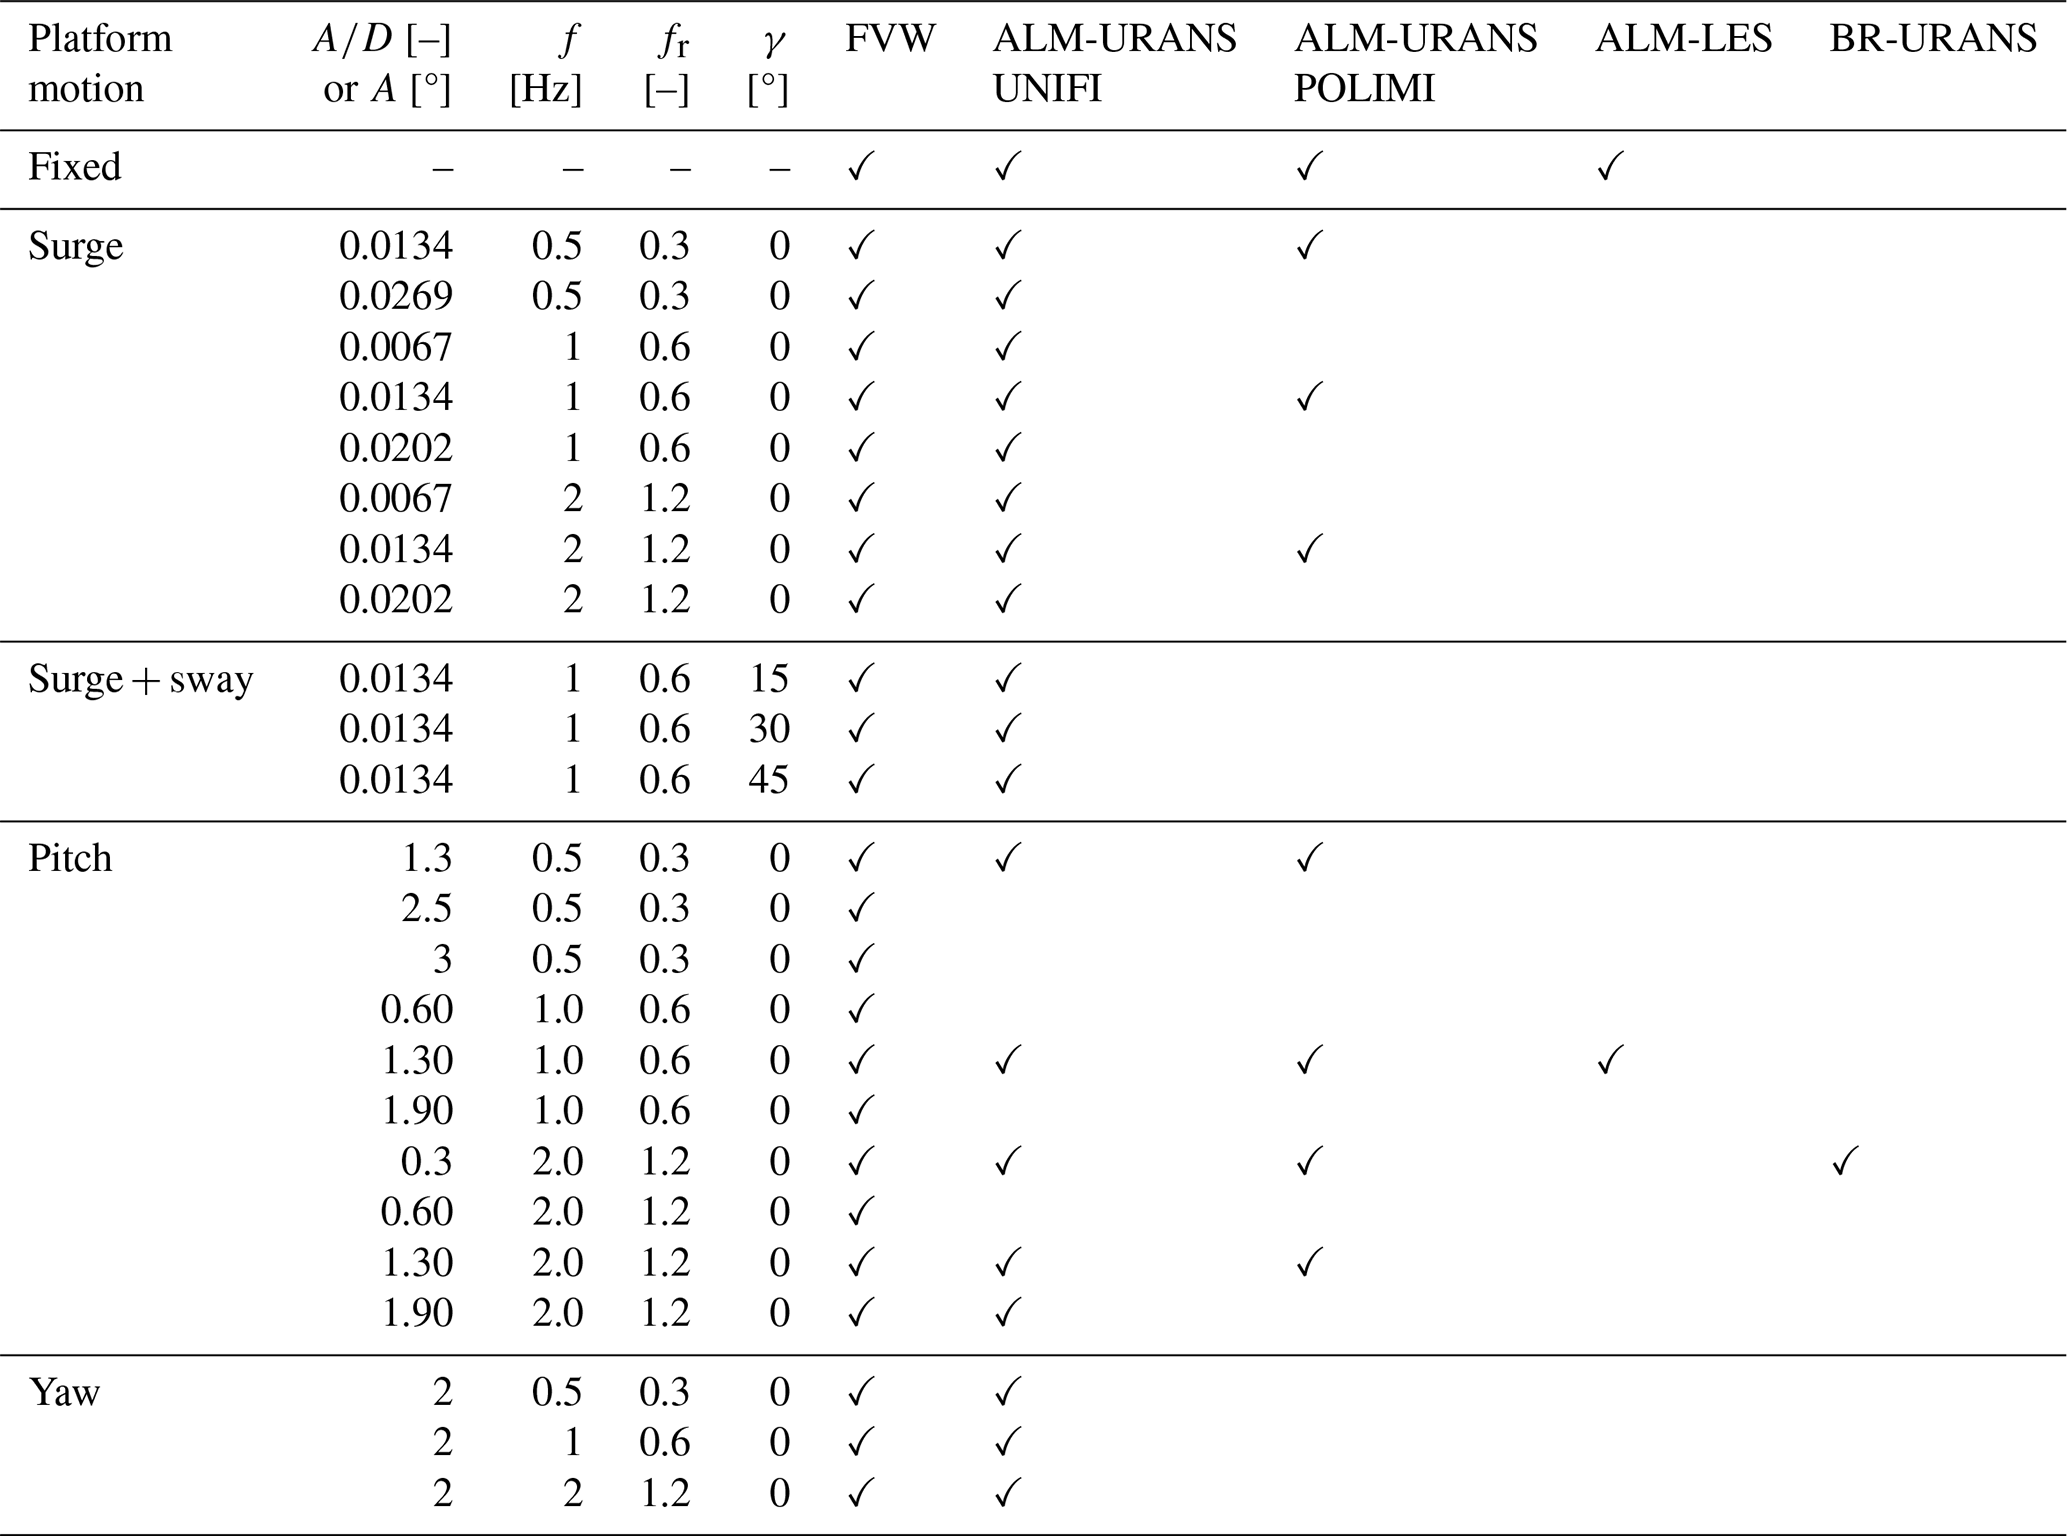
where f is the platform motion frequency, D is the rotor diameter, and U is the free-stream velocity. According to Eq. (1), as the inflow speed was kept constant during all the tests U∞=4.19 m s−1, the investigated range between 0.5 and 2 Hz corresponds to a range of reduced frequencies between 0.3 and 1.2. These frequencies are considered representative of full-scale turbines. In particular, the frequencies of 0.5 and 2 Hz correspond to full-scale values of 0.02 and 0.04 Hz, typical of rigid-body modes; and the reduced frequency of 1.2 corresponds to a full-scale frequency of 0.08, representative of wave-induced motion. A summary of the tested conditions is shown in Table 2.
Additional tests were performed for a sinusoidal yaw motion of the platform. In fact, previous studies on fixed-bottom machines have shown that dynamic yaw control may induce wake meandering (Munters and Meyers, 2018). For FOWTs, platform motion may induce yaw oscillations of the turbine in normal operating conditions at characteristic frequencies and amplitudes, which can be significantly different to those previously investigated in dynamic yaw control applications (Lin and Porté-Agel, 2024). In particular, significantly larger amplitudes and lower frequencies are usually considered for controller-driven yaw control. In this work, the wake response was analyzed for a fixed amplitude of yaw motion A=2°, and a range of reduced frequencies between 0.3 and 0.6, which are considered representative of operating conditions for floating wind turbines (Fontanella et al., 2025).
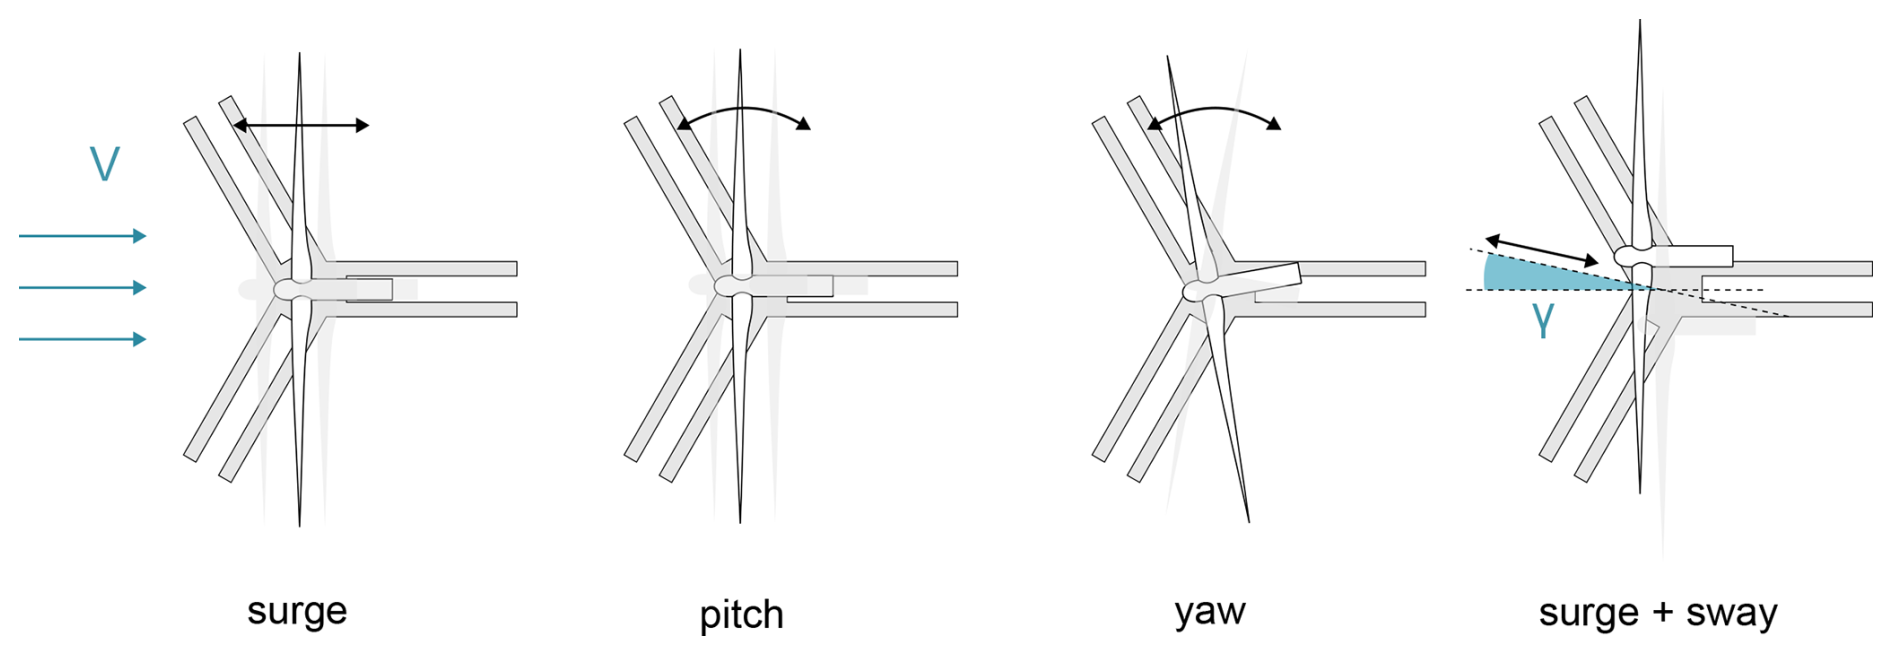
In the surge, pitch, and yaw cases, the wind direction was aligned with platform motion, mimicking the common situation in which waves and wind are aligned along the same direction. However, a misalignment γ between platform motion and wind direction may arise during operation due to misalignment between the inflow and the waves. To evaluate the impact of such conditions on wake development, combinations of surge and sway motions were tested. During these tests, the amplitude and frequency of motion were maintained constant, and the impact of the misalignment angle was evaluated between 15 and 45°.
Only sinusoidal motions of the platform were investigated, as the objective of this work is to evaluate the capabilities of the available numerically tools, not provide a representation of realistic wake dynamics in the field. A more realistic motion of the floating substructure could be imposed through a combination of all the 6 DOFs but may lead to different wake dynamics to those investigated during these model scale tests.
During the tests, the tower-top loads and wake response were measured. A hot wire anemometer (HWA) was used to measure horizontal and vertical velocity profiles at 3 and 5 D downstream from the rotor, using a traversing system. The vertical traverses were acquired for some of the operating conditions to evaluate if the motion induces an asymmetric response in the wake. The inflow conditions were maintained constant at 4 m s−1, with an inflow turbulence level of about 1.5 % over the rotor area. The rotational speed of the turbine was kept constant at 240 rpm. Additional details about the experimental set up are found in Fontanella et al. (2025), and the complete dataset is available open access (https://doi.org/10.5281/zenodo.13994979, Fontanella et al., 2024).
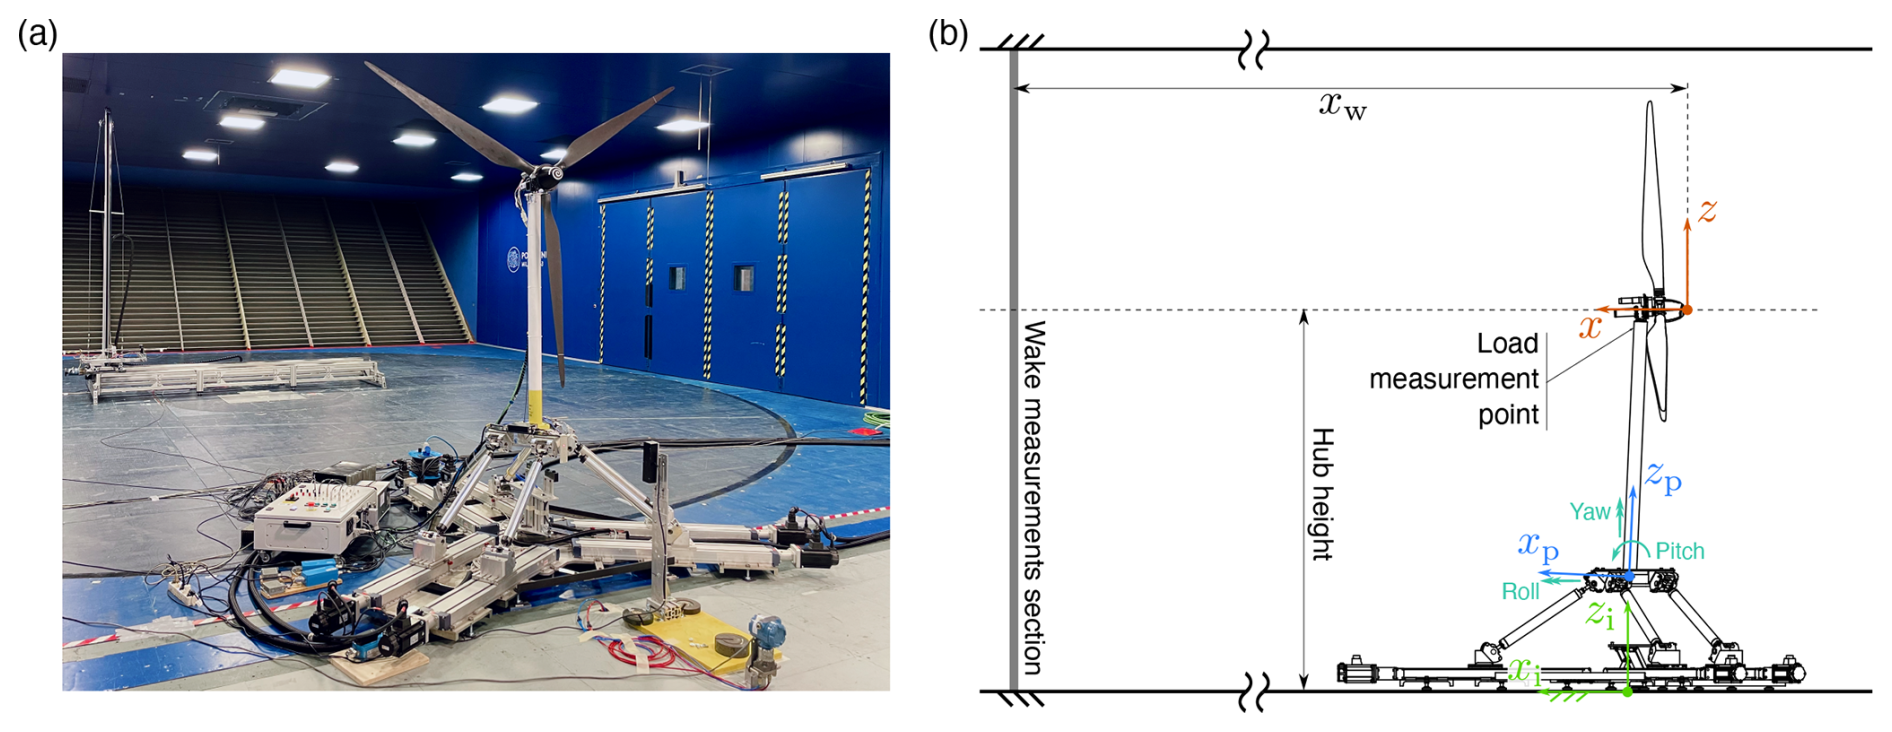
Figure 2Experimental setup during the NETTUNO wind tunnel campaign. (a) Wind turbine model and traversing system. (b) Sketch of wind turbine model and reference systems. Image from Fontanella et al., (2025).
The test matrix described in Sect. 2 was simulated employing two different numerical approaches: the FVW method implemented in QBlade (Marten, 2020) and a CFD ALM URANS model implemented in CONVERGE (2025) (Richards et al., 2026). The details of each simulation setup are described in Sect. 3.1 and 3.2. Additional ALM URANS simulations of some surge and pitch cases were performed in OpenFOAM employing the ALM code developed by Sanvito et al. (2024). These simulations are included in this work to showcase how different ALM codes, each set up independently to reproduce the experiments based on the experience of the scientific investigators, might impact the method's predictions. As a further benchmark for the lower-fidelity methods, blade-resolved URANS CFD simulations of the platform pitching case were performed in Ansys Fluent, at a frequency of 2 Hz and an amplitude of 0.3°. This case also corresponds to the highest frequency pitching motion investigated during the OC6 phase III project, where the most significant differences between simulations and experiments were observed (Cioni et al., 2023). This test case was selected to further investigate the causes of the observed discrepancies between simulations and experiments. In fact, the blade-resolved simulation was used to shed further light on the spanwise aerodynamic response of the rotor (which cannot be evaluated from experimental data) and to provide a further benchmark for the low-fidelity methods. The numerical setup is described in Sect. 3.3. Finally, the ALM LES results obtained by Pagamonci et al. (2025) for the pitch motion case, characterized by an amplitude of 1.3° and a reduced frequency of 0.6, are included as a benchmark for the analysis of the wake dynamics. A summary of the operating conditions and corresponding simulations investigated in this work are shown in Table 2.
Table 2Summary of operating conditions investigated in this work. A is the amplitude of platform motion; f and fr are the frequency and rotor-reduced frequency, respectively; and γ is the misalignment angle.
3.1 Free vortex wake simulations
The same test cases investigated during the wind tunnel campaign were simulated using the lifting line free vortex wake method implemented in QBlade (Marten, 2020), version 2.0.7. In this approach, the rotor aerodynamic behavior comes from tabulated polar data. The aerodynamic coefficients for lower angles of attack were obtained during wind tunnel tests (Fontanella et al., 2021), extended to 360° using the Viterna method (Viterna and Janetzke, 1982) and then corrected to account for rotational augmentation effects using the method by Du and Selig (1998). The workflow is described in detail in Robertson et al. (2023). The same polar dataset was employed during the OC6 phase III project by all participants (Bergua et al., 2023), providing good agreement in terms of aerodynamic loading between lifting line simulations and experiments.
In the simulations, the lifting line is discretized into 30 panels using a cosine distribution. The effect of dynamic stall is considered with the model proposed by Øye (1991). As the wind tunnel walls could not be included in the simulations, the impact of blockage was evaluated with Glauert's correction, and the inflow speed was increased to 4.19 m s−1 (Cioni et al., 2023).
Following the analysis carried out during the OC6 phase III project (Bergua et al., 2023; Cioni et al., 2023), it was observed that FVW simulations carried out by different participants led to significant differences in the results, despite employing the same aerofoil polars. For this reason, an analysis of the main simulation parameters was performed to investigate their impact on the accuracy of the results. In particular, the impact of inflow turbulence and vortex filament parameters was investigated.
During the OC6 project, the participants assumed laminar inflow in the numerical simulations, due to the low inflow turbulence in the wind tunnel of about 2 %. However, recent studies showed that even small turbulence levels of about 2 % can have a significant effect on wake development of a floating wind turbine (Pagamonci et al., 2025). For this reason, turbulence was introduced in the FVW simulations to evaluate the impact on the accuracy of the results.
In QBlade turbulence is introduced by defining a turbulent velocity time series over an imposed grid. The turbulent inflow spectrum of the Politecnico di Milano wind tunnel, measured during previous experimental campaigns (Fontanella et al., 2021), was used to generate the turbulent inflow imposed in the simulations. The time series was defined using the software TurbSim (Jonkman, 2009) in order to match the experimental one.
3.1.1 Tuning of inflow turbulence
The introduction of turbulence in the simulation can be performed using different approaches in FVW codes. In QBlade, two options are available to consider the effect of turbulence on the vortex filaments:
-
The vortex filaments are convected with the mean hub velocity (MEAN).
-
The vortex filaments are convected with the local turbulent velocity (LOC).
The two methodologies were investigated to evaluate the impact on the simulation accuracy. Results are shown in Fig. 3 in terms of streamwise velocity and turbulence intensity profile at 3 D from the rotor in the fixed-bottom case. In this paper, turbulent intensity refers to the streamwise value, defined as
where u′ is the standard deviation of the streamwise velocity and is the mean velocity value.
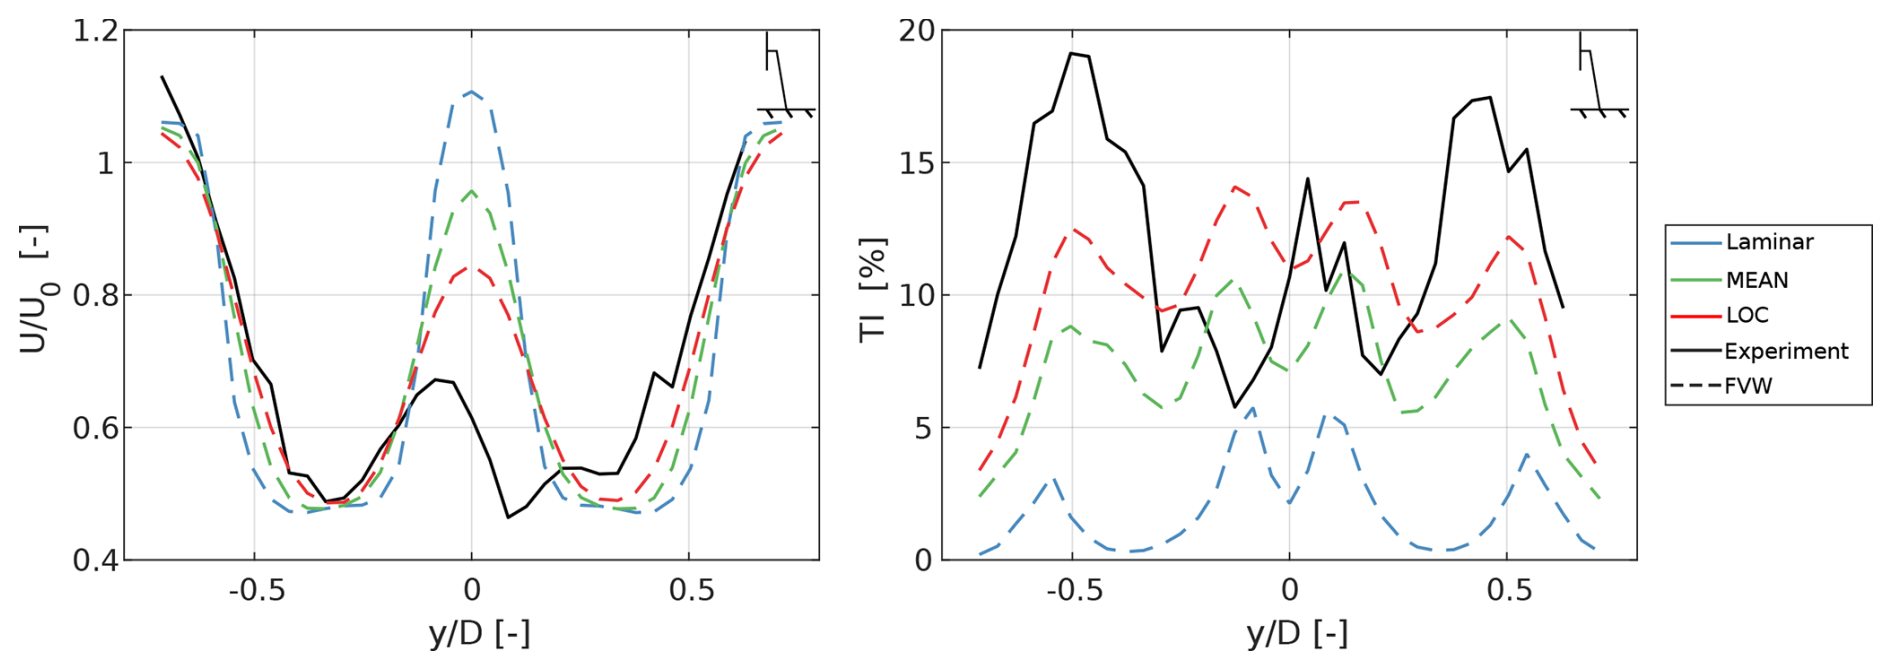
Figure 3Impact of different turbulence modeling in FVW simulations in a fixed-bottom configuration. Left: streamwise velocity profile, normalized by inflow speed, at 3 D from the rotor; right: turbulence intensity profile at 3 D from the rotor.
The inflow turbulence and its modeling affect the wake results drastically. In terms of average wake profile, the inflow turbulence leads to increased mixing especially at the center of the wake, showing better agreement with the experimental results in comparison to the laminar inflow conditions. Employing the LOC strategy shows better results, as this methodology can account for the impact of turbulence on the vortex filaments in the wake. Analogous results are observed in terms of wake turbulence intensity values, as introducing turbulence with the LOC methodology leads to improved agreement with the experimental data.
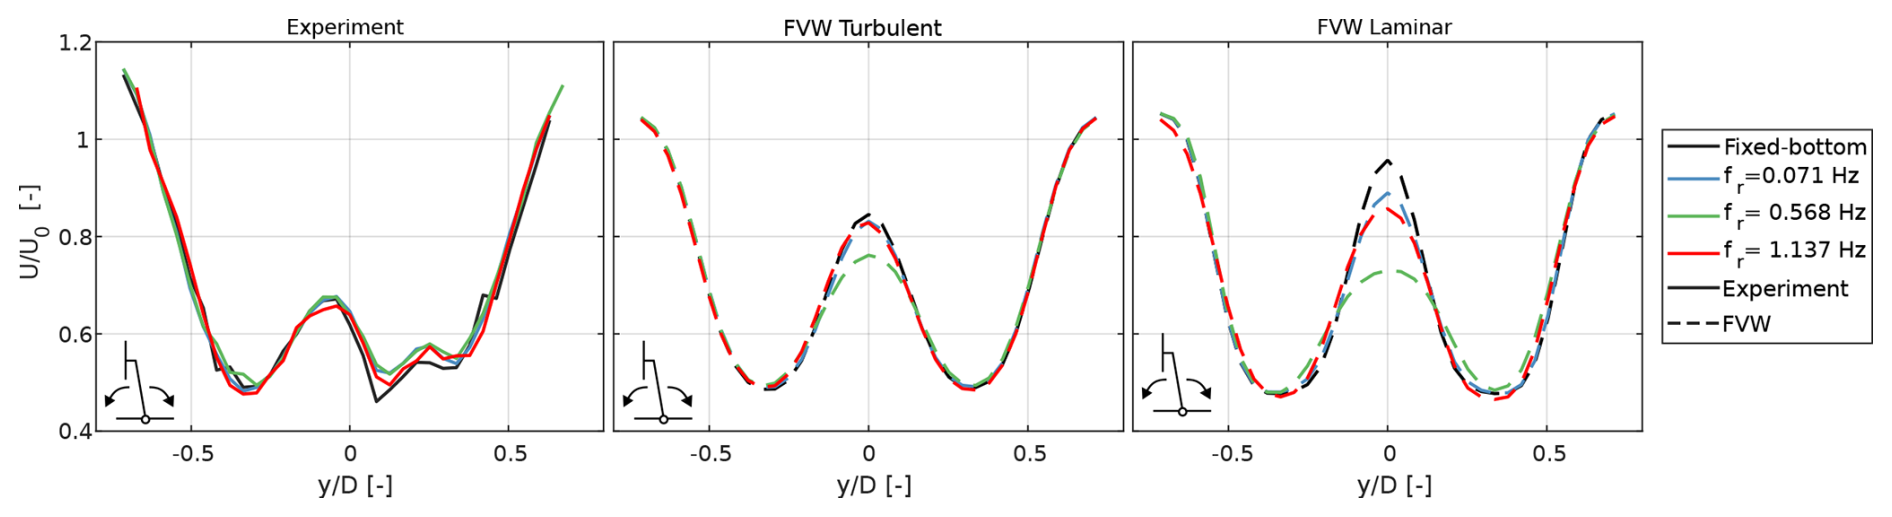
Figure 4Impact of turbulence on mean velocity profile at 3 D from the rotor for different reduced frequencies of pitching motion. Left: experimental data (middle) FVW results with laminar inflow; right: FVW results with turbulent inflow.
The impact of turbulence is even more significant when a pitching motion of the platform is considered (see Fig. 4). Indeed, in laminar inflow conditions, a pitching motion of the platform causes improved mixing and faster transition in the central parts of the wake, in comparison to the fixed-bottom value. However, when a 2 % inflow turbulence is introduced, the impact of platform motion becomes less significant, in agreement with the results observed during the wind tunnel campaign (see Fig. 4, left). This result shows that inflow turbulence cannot be neglected when the wake of a floating wind turbine is investigated and that the FVW method can correctly account for this, if properly implemented.
Due to the free-stream velocity oscillations in the inflow, it is not sufficient to run the simulation until numerical convergence, but the rotor loads and wake parameters need to be acquired over multiple cycles of platform motion to achieve statistical convergence. The data obtained from the simulations are then phase averaged over a cycle of platform motion to obtain the mean wake behavior. For each operating point, the results were acquired over 40 s of physical simulation time (corresponding to 20 cycles of platform motion for the slowest oscillations considered in this work). Each simulation was run on a GPU (NVIDIA A100) for a total computational time of about 6 h.
3.1.2 Tuning of simulation parameters
The impact of the main simulation parameters on the simulation results was also tested. In fact, FVW models are affected by the user-defined initial size of the vortex filaments generated at the lifting line r0 and by the diffusion properties of the vortex filaments, calculated as
where the core radius is calculated as
In Eq. (4), a=1.25643 is a constant, δv is the turbulent viscosity coefficient, ν is the kinematic viscosity, Δt the time step size and ϵ is the strain rate of the vortex filament. The effect of vortex core diffusion is accounted using the vortex turbulent viscosity, δv. As this parameter is increased, the dissipation of the vortex filaments is faster (Marten, 2020).
Both the initial core radius and the turbulent vortex core viscosity have a significant effect on wake development. For this reason, the experimental tests were used as benchmark, and a parametric sweep was performed to identify the best combination for improved reliability.
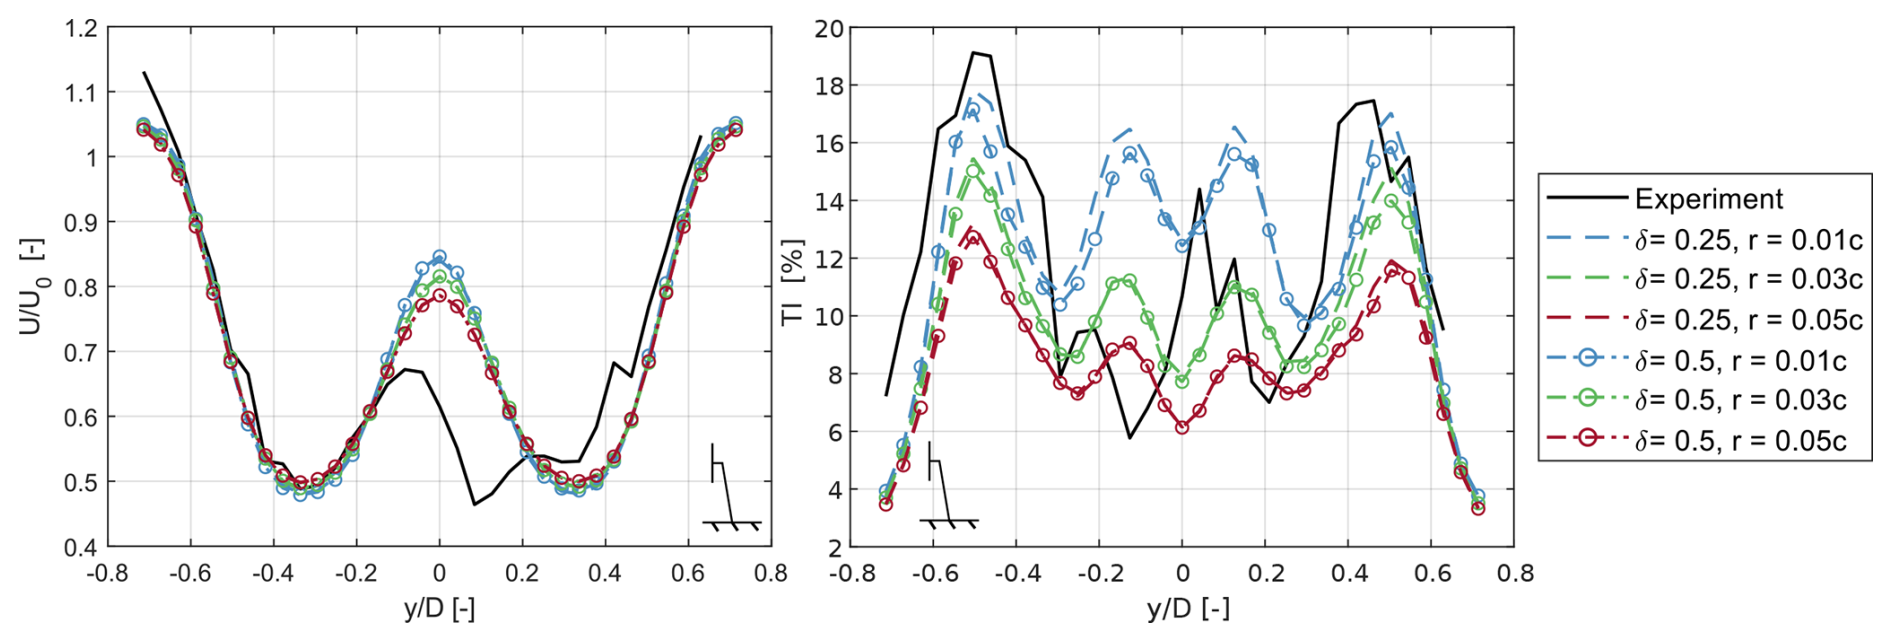
Figure 5Impact of vortex viscosity and initial core radius on wake behavior at a distance of 3 diameters from the rotor.
The combination of the two parameters affects both the mean velocity and turbulence intensity in the wake in fixed-bottom conditions, even though the impact on the latter is more significant (Fig. 5). Increasing the initial core radius, the strength of the tip and root vortices decreases, leading to reduced turbulent intensity in the central and outer parts of the wake. Similarly, increasing the vortex viscosity reduces the strength of the vortex structures and spreads out the turbulent intensity gradients. From the parameter sweep, the combination of δv=0.25 and r0=0.03c was selected, as it guaranteed the best agreement with the experimental data both in the central and the outer parts of the wake.
3.2 ALM URANS CFD simulations
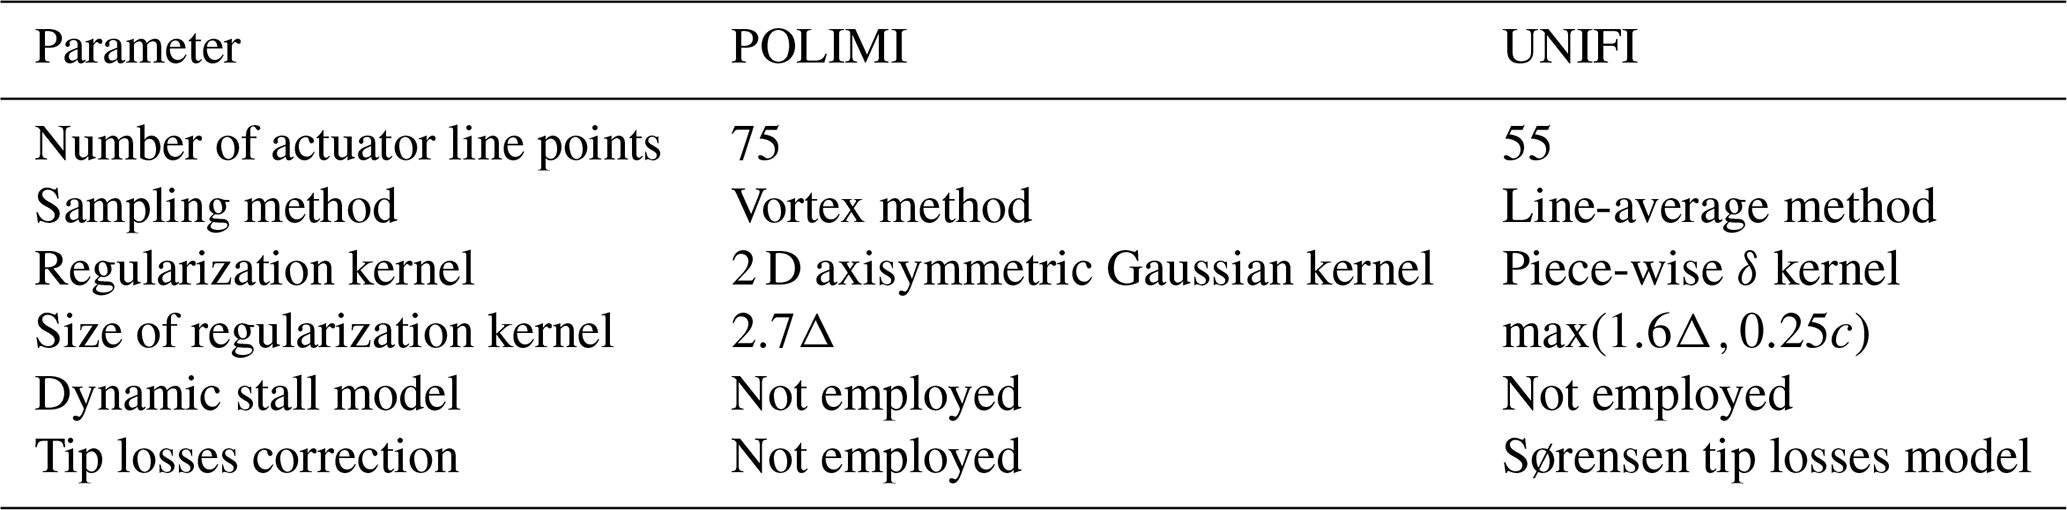
The ALM provides an invaluable tool for simulating the wake behavior of wind turbines. Indeed, this method combines the accuracy of CFD in the wake, with the simplified rotor modeling of a lifting line approach. In this work, a subset of operating conditions evaluated during the wind tunnel campaign were simulated using an ALM model and the commercial software CONVERGE v3.1 (Richards et al., 2026; see Table 2). Some of the surge and pitch operating conditions were also simulated in OpenFOAM using the ALM implemented by Sanvito et al. (2024) to evaluate the sensitivity of this approach to set up and tune parameters. The two different implementations of the ALM have been set, following the best practice of each software and fine-tuned to successfully reproduce rotor load variations (Bergua et al., 2023); their ability to predict FOWT wake characteristics is benchmarked in this experiment, without additional fine-tuning. As the first method was developed by the University of Florence (UNIFI) and the second by Politecnico di Milano (POLIMI), the two ALM models and corresponding results will be distinguished by the corresponding institution name in the remainder of this work. The main simulation parameters for the two numerical setups are summarized in Table 3.
Both ALM simulation setups included the wind tunnel walls in the simulation; UNIFI was included in the simulation the nacelle, tower, and robot, which are not present in the numerical setup used by POLIMI. To limit the computational effort, slip walls were employed on the wind tunnel ceiling and lateral walls in both numerical setups, and the domain was reduced by 10 cm to account for the reduction in cross-section due to boundary layer expansion, employing the same setup used during the OC6 phase III (Robertson et al., 2023). The boundary layer on the wind tunnel floor was solved by UNIFI, as the robot was included in the simulations. POLIMI further reduced the computational domain by 12.5 cm on the wind tunnel floor (Robertson et al., 2023) to limit the computational cost, as the robot is not included in the simulation. The numerical domain was discretized in both numerical approaches using a structured grid, with a mesh size of about 0.015 m (0.0062 D) in the rotor region. UNIFI employed local mesh refinement in the near wake and included additional adaptive mesh refinement in regions characterized by high velocity gradients. In contrast, POLIMI employed a Cartesian grid with three levels of refinement, ensuring the same grid cell size in the rotor and wake regions of 0.015 m.
For the lifting line model, both ALM simulations employed the same polars of the FVW method, as described Sect. 3.1. In terms of velocity sampling, UNIFI employed the line-average approach (Jost et al., 2018), where the velocity is computed as an average over a circle centered on the aerodynamic center. In this way, the contribution of circulatory effects on the induced velocity cancels out. A total of 20 sampling points was used along a circumference of 1 chord around the aerodynamic center. On the other hand, POLIMI employed the vortex-based method as described in Sanvito et al. (2024), which is based on the fact that the induced velocity field, originated by the bound vortex, is subtracted from the flow field in order to obtain a free-induction flow field to sample an undisturbed velocity.
For the spreading of the aerodynamic loads, UNIFI used a three-dimensional piece-wise δ kernel with a radius calculated depending on the mesh size Δ and local chord value c as (Xie, 2021). This setup guarantees adequate compromise between numerical stability and avoiding excessive spreading of the rotor force, which would lead to underestimation of the rotor induction. The numerical setup employed here is the same as the one used during the OC6 phase III project (Bergua et al., 2023), as the results showed good agreement with experimental data. POLIMI used a 2 D axisymmetric Gaussian kernel with a width of 2.7Δ, where Δ is the size of the grid in the rotor region, following the independence study performed in Sanvito et al. (2024). Both actuator line models did not include dynamic stall, but differences are found in the modeling of tip effects, as UNIFI employed the Sørensen tip losses model (Dağ and Sørensen, 2020). The POLIMI ALM, on the other hand, uses 75 actuator line points (Table 3) combined with a 2 D kernel that avoids spreading volume forces radially beyond the effective rotor radius at the blade tip. This approach has been shown to be effective in capturing tip losses without the need of additional corrections (Navarro Diaz et al., 2023).
For the solution of the Navier–Stokes equations in the computational domain, both UNIFI and POLIMI employed a URANS approach with the k−ϵ turbulence model for the closure of the turbulence equations. Additionally, the flow is compressible in the UNIFI simulations, while it assumed to be incompressible in the POLIMI setup. The PISO and PIMPLE algorithms were used to solve the flow equations by UNIFI and POLIMI, respectively. At the inflow, the turbulence intensity is set to guarantee a value of 2 % at the rotor plane, replicating wind tunnel conditions.
Finally, comparable time steps of the simulation were employed in the simulation setups, equal to and s, for UNIFI and POLIMI, respectively, ensuring the distance traveled by the blade tip at each time step is smaller than the cell size, while also guaranteeing numerical stability of the ALM model. The ALM simulations were run over multiple cycles of platform motion, until numerical convergence. Since the URANS methodology only accounts for turbulence through the transport of the turbulent kinetic energy and dissipation rate, the simulations show only minor differences between subsequent cycles of platform motion. For this reason, the simulations were run until numerical convergence of the wake, which required about 15 s of simulation time. For each operating condition, the computational cost for the ALM URANS simulations performed by UNIFI was about 1.2k CPU hours on three AMD EPYC 7 computing nodes (48 CPUs each).
In this work, the results from numerical models are benchmarked also with available data from LESs performed by Pagamonci et al. (2025). The same ALM model and geometry are used as the setup employed by UNIFI. Details about the simulation setup and methodology employed are found in the original publication. The high-fidelity LES data, which required about 400k CPU hours on 10 AMD EPYC 7 computing nodes (48 nodes each), is used here to provide detailed 2 D representations of the vortex structures in the wake, complementing the experiment. An in-depth comparison of the LES results with the experimental data is out of the scope of this work and is described in depth in Pagamonci et al. (2025).
3.3 Blade-resolved simulations
Blade-resolved CFD simulations of a pitching case at an amplitude of 0.3° and a frequency of 2 Hz were performed to obtain further information about the spanwise rotor aerodynamic response and provide a further benchmark for the lower-fidelity models. This case was selected as the most significant differences were observed for these operating conditions when comparing experiments and simulations during the OC6 phase III (Cioni et al., 2023).
The CFD blade-resolved simulations were performed using the software Ansys Fluent (v231). The whole geometry of the turbine was simulated, including the rotor, the nacelle, and the tower. The Navier–Stokes equations were solved using a URANS approach, employing the k-omega SST turbulence model for the closure of the fluid equations, with the gamma-algebraic boundary layer transition model (Menter et al., 2015).
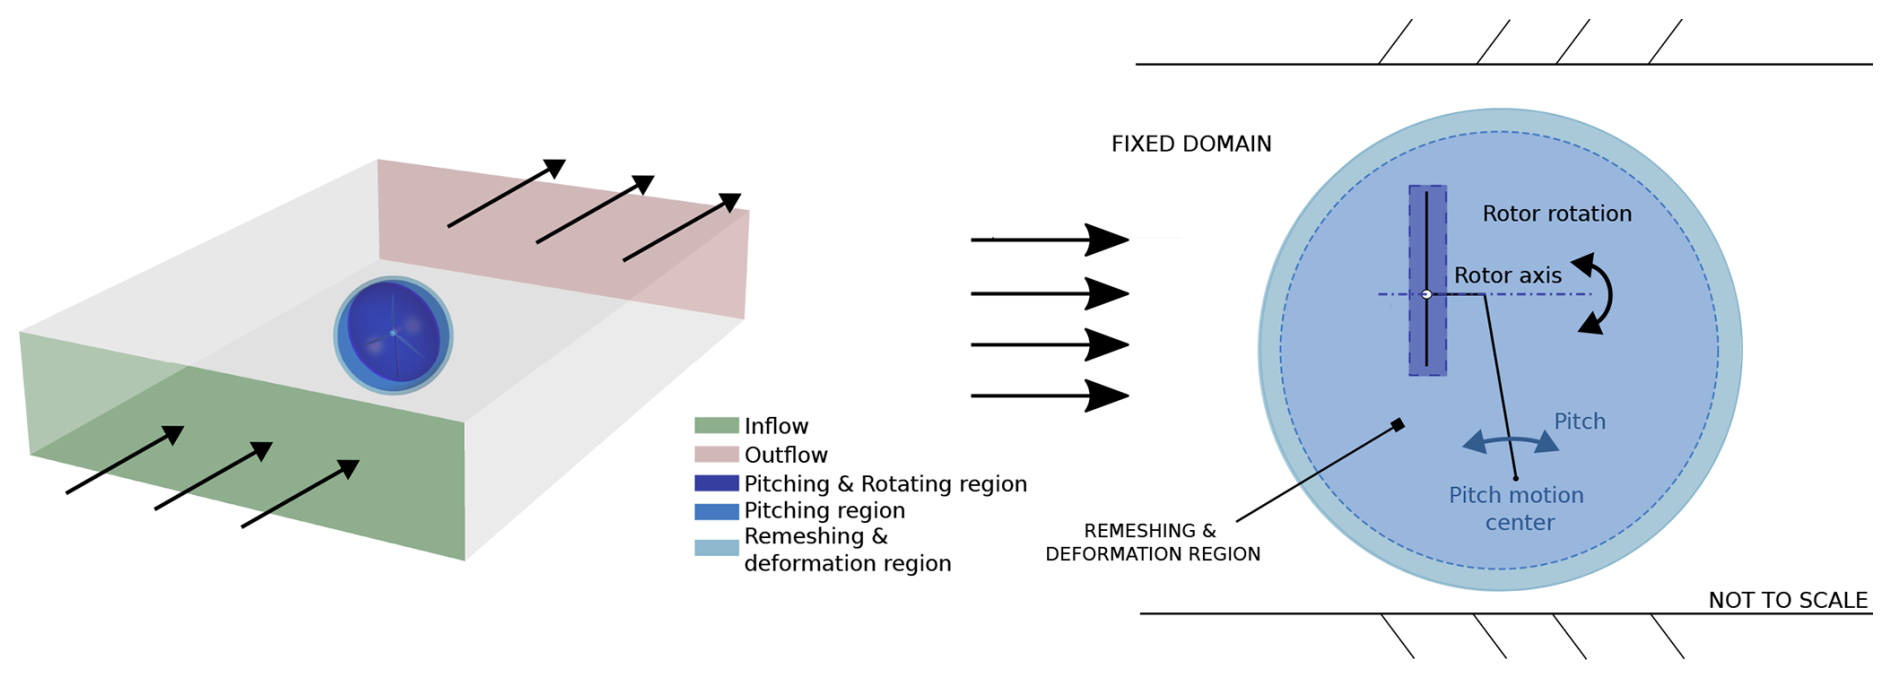
Figure 6Computational domain of the blade-resolved simulation. The inflow and outflow boundaries are highlighted. Additionally, the rotor region, moving region, and remeshing and deformation regions are shown.
The numerical domain, including the wind tunnel walls, was discretized using a total of about 60 million elements. To limit the number of elements, the size of the domain was reduced by the boundary layer thickness on all the wind tunnel walls and the robot was neglected. In this way, the impact of the boundary layer on the wind tunnel walls on blockage is considered without the need to resolve the wall boundary layer. The rotor region was discretized using polyhedral elements to limit the number of cells and consequently the computational cost of the simulation. In the wake, tetrahedral elements were used, including local refinements in the root and tip regions. In fact, capturing these structures is essential to correctly predict the rotor aerodynamic response and wake dynamics. A sliding mesh approach was used to include the rotation of the rotor. The pitching motion was imposed to a spherical region, including the wind turbine model, while the wind tunnel domain is kept fixed. The relative motion between the two regions is compensated through a spherical shell, where the mesh is deformed and regenerated automatically (Fig. 6). This innovative strategy was used to limit the computational cost of the remeshing process. Further details about the rotor and wake discretization, and simulation setup are provided in Cioni et al. (2023).
The inflow conditions were set to replicate the experiment, imposing the same mean velocity and turbulent intensity. At the outflow, the ambient pressure was imposed. The SIMPLE scheme was used as a pressure–velocity coupling algorithm, and the time advancement was performed with a second-order implicit approach and a discretization of , corresponding to a rotor rotation of 0.5°. The simulation was run for a total of 9 s to achieve the numerical convergence of both the rotor loads and wake velocities up to 3 D. The simulation required a significant computational effort of about 250k CPU hours on six AMD EPYC 7413 nodes of 48 cores.
In this section, the capabilities of the numerical models to capture the aerodynamic response of the rotor was evaluated by comparing the results with available experimental data and spanwise loads obtained from blade-resolved simulations. In this way, the limitations of each method in predicting the rotor aerodynamic response can be evaluated.
4.1 Rotor integral loads
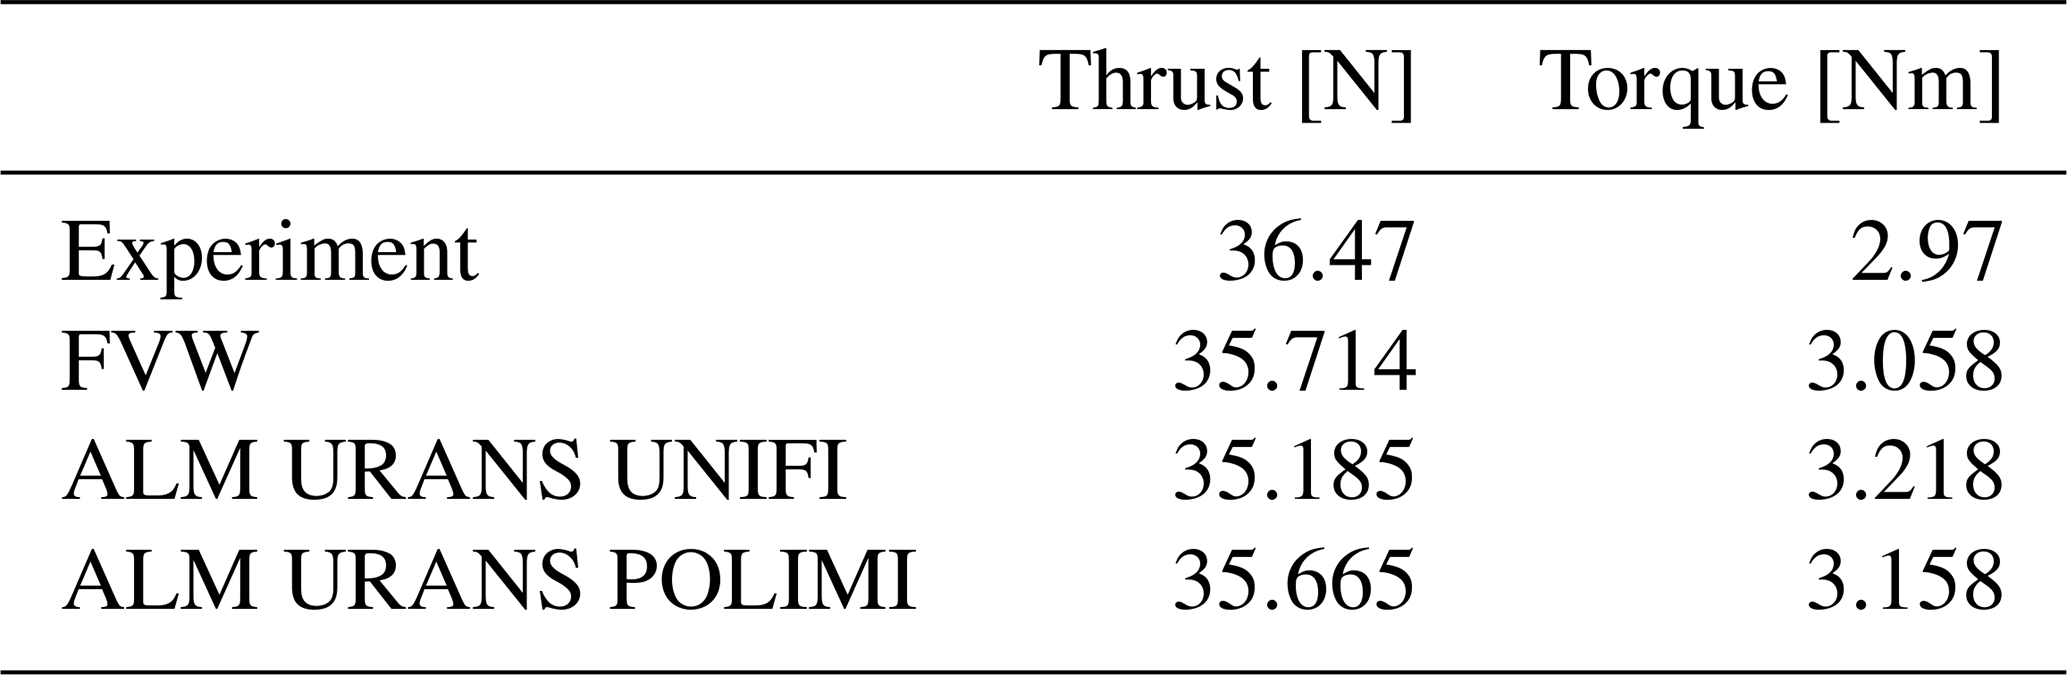
The rotor thrust and torque obtained from the wind tunnel campaign and the FVW and ALM URANS simulations were compared across the investigated test cases. Table 4 shows the mean thrust and torque values for the surge and pitch motion cases. The FVW and ALM URANS results show good agreement with experiments, and the small differences are within the experimental uncertainty of the data. Across all the investigated platform motion cases, the mean thrust and torque values from simulations and experiments show only minor differences, as platform motion only induces periodic oscillations in rotor loads without affecting the average aerodynamic response across the investigated operating conditions, independently of platform motion amplitude, frequency, or type of motion.
Table 4Summary of rotor thrust and torque values for surge and pitch motion cases. Results are averaged across the investigated platform motion conditions. Only minor differences were observed in terms of average rotor loads across the different operating conditions.
To further compare numerical and experimental results, the amplitude and phase shift of the rotor thrust oscillations were investigated in Fig. 7, to evaluate possible differences across the operating conditions. The rotor thrust time series was post-processed using the Fourier transform to extract the amplitude and the phase shift for platform motion. In quasi-steady conditions, i.e., in the absence of significant unsteady effects, platform motion should lead to periodic oscillations with an amplitude proportional to the reduced frequency and a phase shift of −90° for platform motion (i.e., corresponding to the rotor loads being in phase with the apparent wind profile induced by the motion) (Bergua et al., 2023). For both surge and pitch cases, the amplitudes of thrust and torque oscillations show a linear trend with the reduced frequency for A=0.3° and A=1.3°, respectively. Due to the limited number of points for the other oscillation amplitudes, the same linear trend cannot be verified; however, the rate of change in the thrust amplitude increases with the amplitude of motion. The numerical results show only minor differences with the experiment in terms of amplitude of the load oscillations until a reduced frequency of 0.6. Some differences arise at the reduced frequency of 1.2, where the numerical methods underpredict the oscillation amplitude. The source of this difference may be deformations of the rotor blades and tower in these conditions, which are not captured by numerical models, as they assume a rigid geometry. Such differences are more pronounced for higher oscillation amplitudes and consequently larger accelerations during the cycle of motion, which could indeed amplify deformations of the turbine model. Regarding phase shift, no clear trend is observed in the experimental results as the phase shift oscillates around the −90° quasi-steady value. Possible differences fall within the uncertainty of the phase calculation, which was evaluated as about 5°. The numerical results agree with the experimental data, as the differences in phase shift across the operating conditions are within the 5° range.
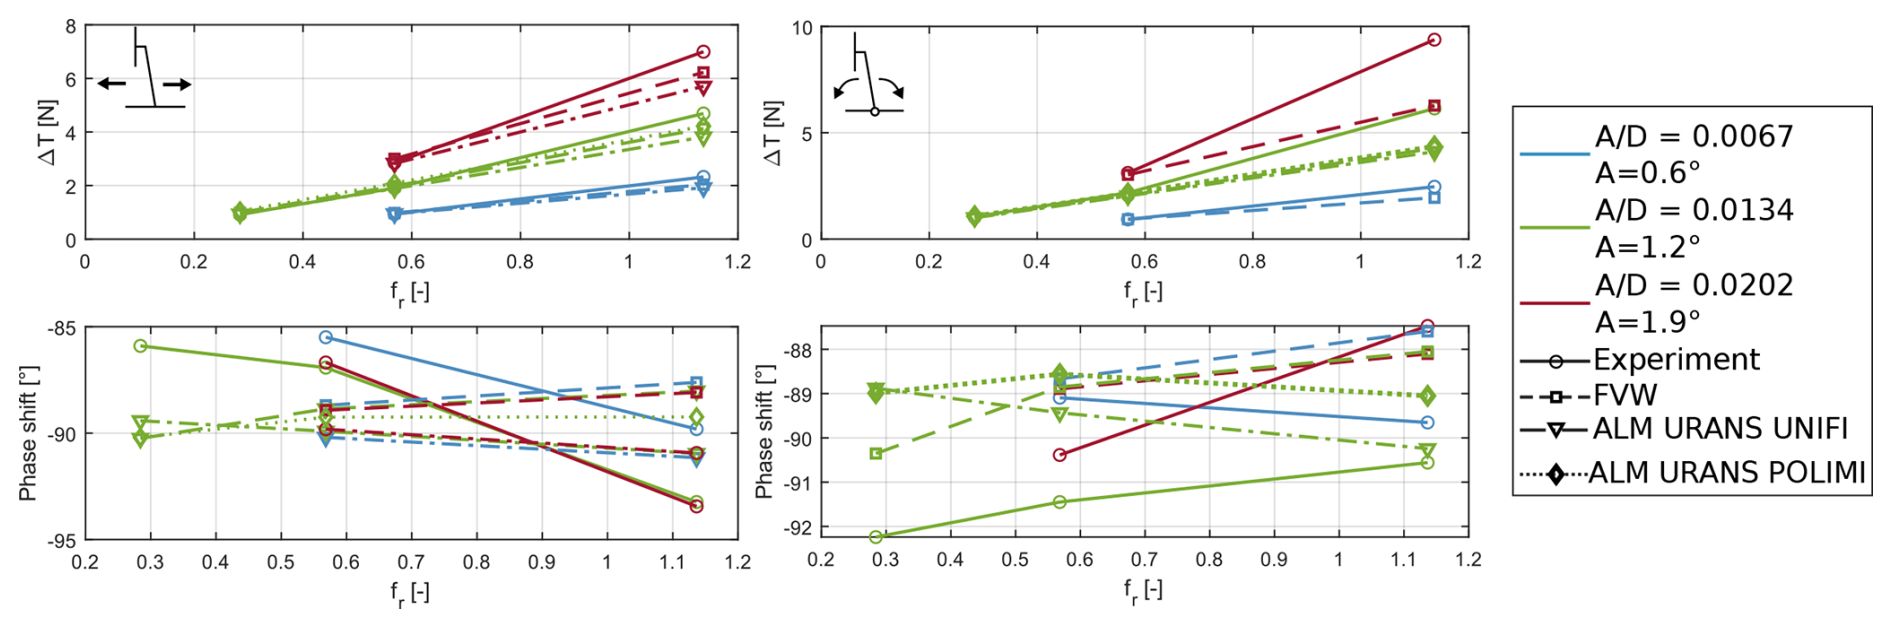
Figure 7Amplitude and phase shift of thrust oscillations for surge (left column) and pitch (right column) motion cases.
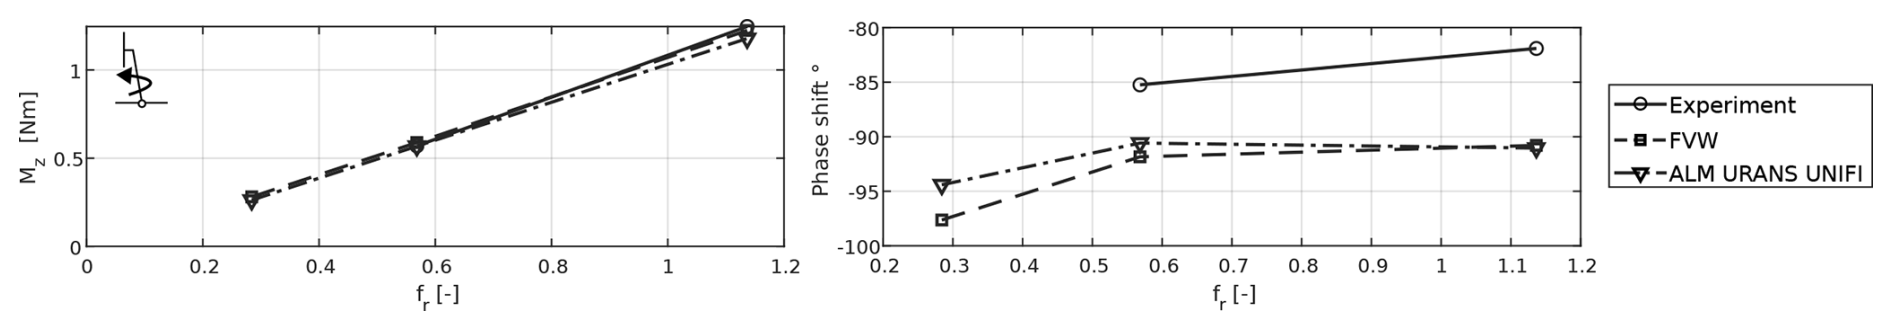
Figure 8Amplitude and phase shift of Mz for yaw motion cases, with A=2° and varying frequency of motion.
Different frequencies of platform motion were also investigated for the yaw motion cases, with a constant amplitude of 2°. The yaw motion causes periodic oscillations of the momentum around the z axis at the frequency of platform motion. The FVW and ALM URANS methods by UNIFI correctly capture these oscillations in all the investigated frequencies of motion (Fig. 8). For the yaw motion cases, the amplitude of the rotor momentum around the z axis at the frequency of motion increases linearly with the reduced frequency. As the amplitude of yaw motion is maintained constant, such an increase shows that the amplitude of these oscillations is proportional to the apparent velocity induced by the motion. While an in-depth investigation of the root causes of such linear trend is out of the scope of this work, this result may be employed for the validation of fast quasi-steady linear models for the simulation of floating wind turbines.
Finally, the wake response was evaluated for different misalignment angles between platform motion and wind direction. In these cases, the rotor thrust oscillates at the frequency of platform motion proportionally to the apparent velocity along the wind direction. For this reason, the amplitude of thrust oscillations reduces with the misalignment angle. The numerical methods, not shown for brevity, show only minor differences with the experimental data with increasing misalignment angle.
4.2 Spanwise results with blade-resolved CFD
The capability of the low-fidelity models to correctly predict rotor aerodynamic performance was further investigated by comparing the FVW and ALM URANS results with the available blade-resolved data. In fact, the blade-resolved simulation provides additional spanwise information, complementing the available data from the experiment. The additional assessment was performed for a pitch motion of 0.3° and a frequency of 2 Hz.
The mean out-of-plane and in-plane spanwise load distributions across the numerical methods were compared. In terms of out-of-plane loads, the FVW and ALM URANS simulations show good agreement with the blade-resolved simulation over most of the blade span, as these methods correctly capture the mean out-of-plane load even close to the root and tip regions (Fig. 9). Some differences are observed in the central part of the blade, where the FVW and ALM URANS simulations similarly overestimate the out-of-plane loads. Additionally, some differences are observed between the two ALM URANS methods. Such differences might be due to the different sampling of the angle of attack, especially in the root and tip regions, where 3 D effects become predominant; these methods do not account for the contribution of chordwise bound circulation (Rahimi et al., 2018). At the tip, differences in the insertion of the forces in the CFD domain may further increase the differences across the two models. In terms of in-plane loads, further differences are observed across the methods. The ALM URANS by UNIFI overestimates the in-plane force over most of the blade span, while the FVW and ALM URANS implementation by POLIMI show better agreement with the blade-resolved simulations. Nevertheless, the most significant differences across the numerical results are observed in the first 30 % of the span. Both FVW and ALM URANS underestimate the in-plane loads in this region significantly. This difference is probably caused by a combination of three-dimensional effects, which are not captured explicitly in the lifting line models, and inaccuracy in the aerodynamic polars. In fact, in the root region, the blade profile as well as the corresponding polars are obtained by an interpolation of the SD7032 profile and a cylindrical section, possibly leading to significant inaccuracies. In fact, despite the differences in the in-plane loads, the mean angle of attack calculated from the ALM URANS in this region is in better agreement with the blade-resolved data, in comparison to the FVW simulations (Fig. 10). The angle of attack distribution (Fig. 10) also shows how the FVW and ALM URANS simulations can correctly predict the angle of attack in the inner part of the blade, where three-dimensional effects are negligible. Despite the differences in the aerodynamic loads, the two algorithms for the definition of the angle of attack, namely the line-average and vortex methods, provide almost identical results in terms of mean angle of attack distribution, which would suggest that the differences observed between the ALM URANS simulations are mostly driven by the different insertion of the aerodynamic loads in the CFD domain.
The periodic oscillations in aerodynamic loads, which were investigated in Sect. 4.1, are not homogenous along the span. For this reason, the amplitude and phase shift of the out-of-plane force oscillations along the span was evaluated using the Fourier transform. Results showed that the maximum of the oscillation amplitude is located at about 70 % of the span for the blade-resolved simulations (Fig. 11). Instead, the low-fidelity models show the maximum between 50 % and 60 % of the span. This difference could be connected to the inaccuracies in the airfoil polars, altering the aerodynamic response to variations in the angle of attack. In fact, all lifting line models overpredict the out-of-plane force between 60 % and 80 % of the span (Fig. 9), even if good agreement is observed in the angle of attack distribution for the same spanwise region (Fig. 10). Nevertheless, as the differences between the numerical models are confined to a limited portion of the blade, the impact on the integral rotor loads remains minor. Additionally, the observed difference could be due to 3 D and unsteady aerodynamic effects, which are inherently captured only in blade-resolved CFD and only modeled in lifting line methods.
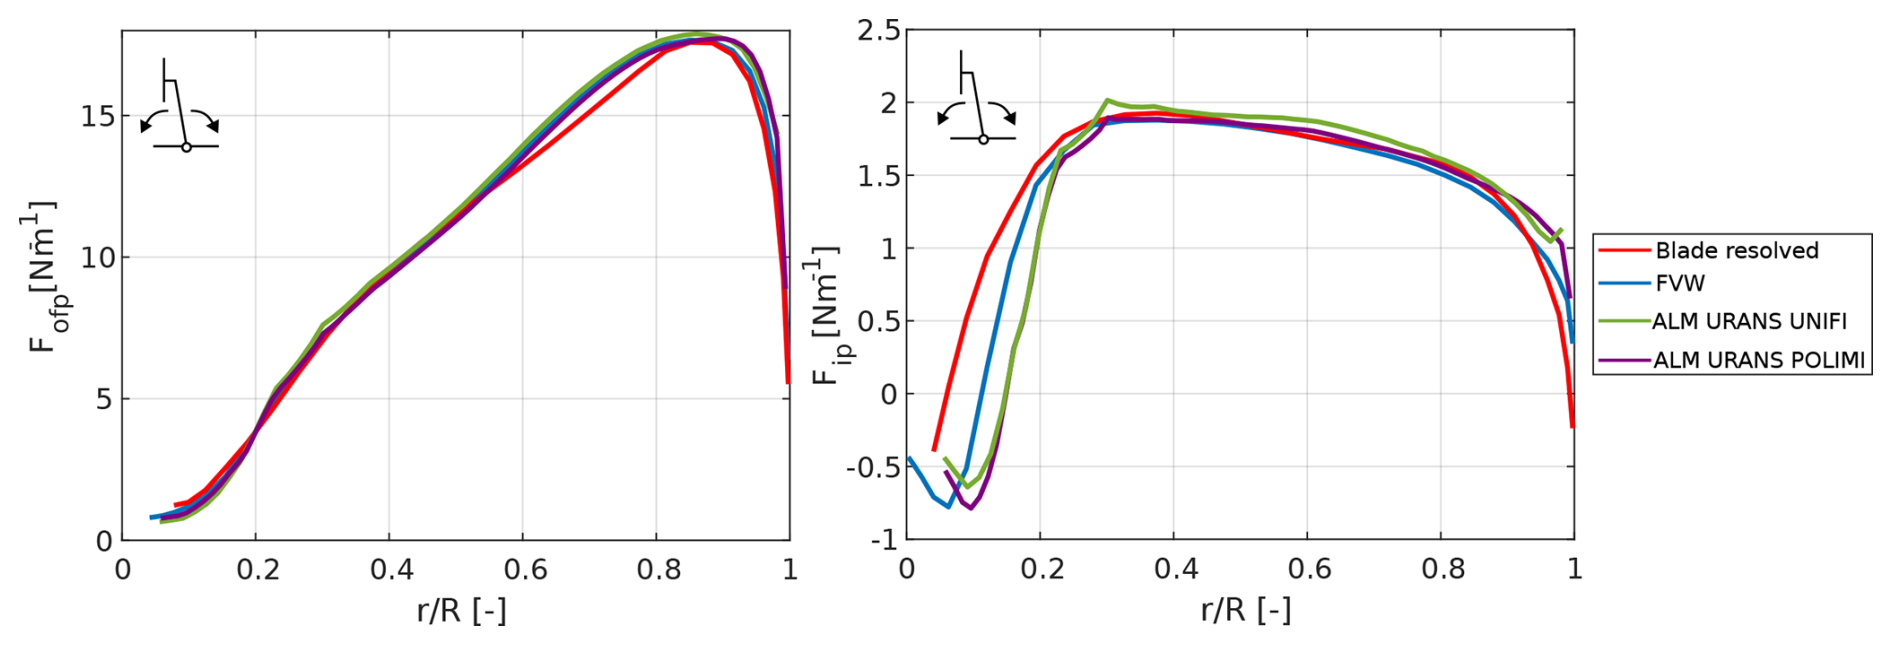
Figure 9Spanwise distribution of out-of-plane and in-plane loads, averaged over a cycle of platform motion.
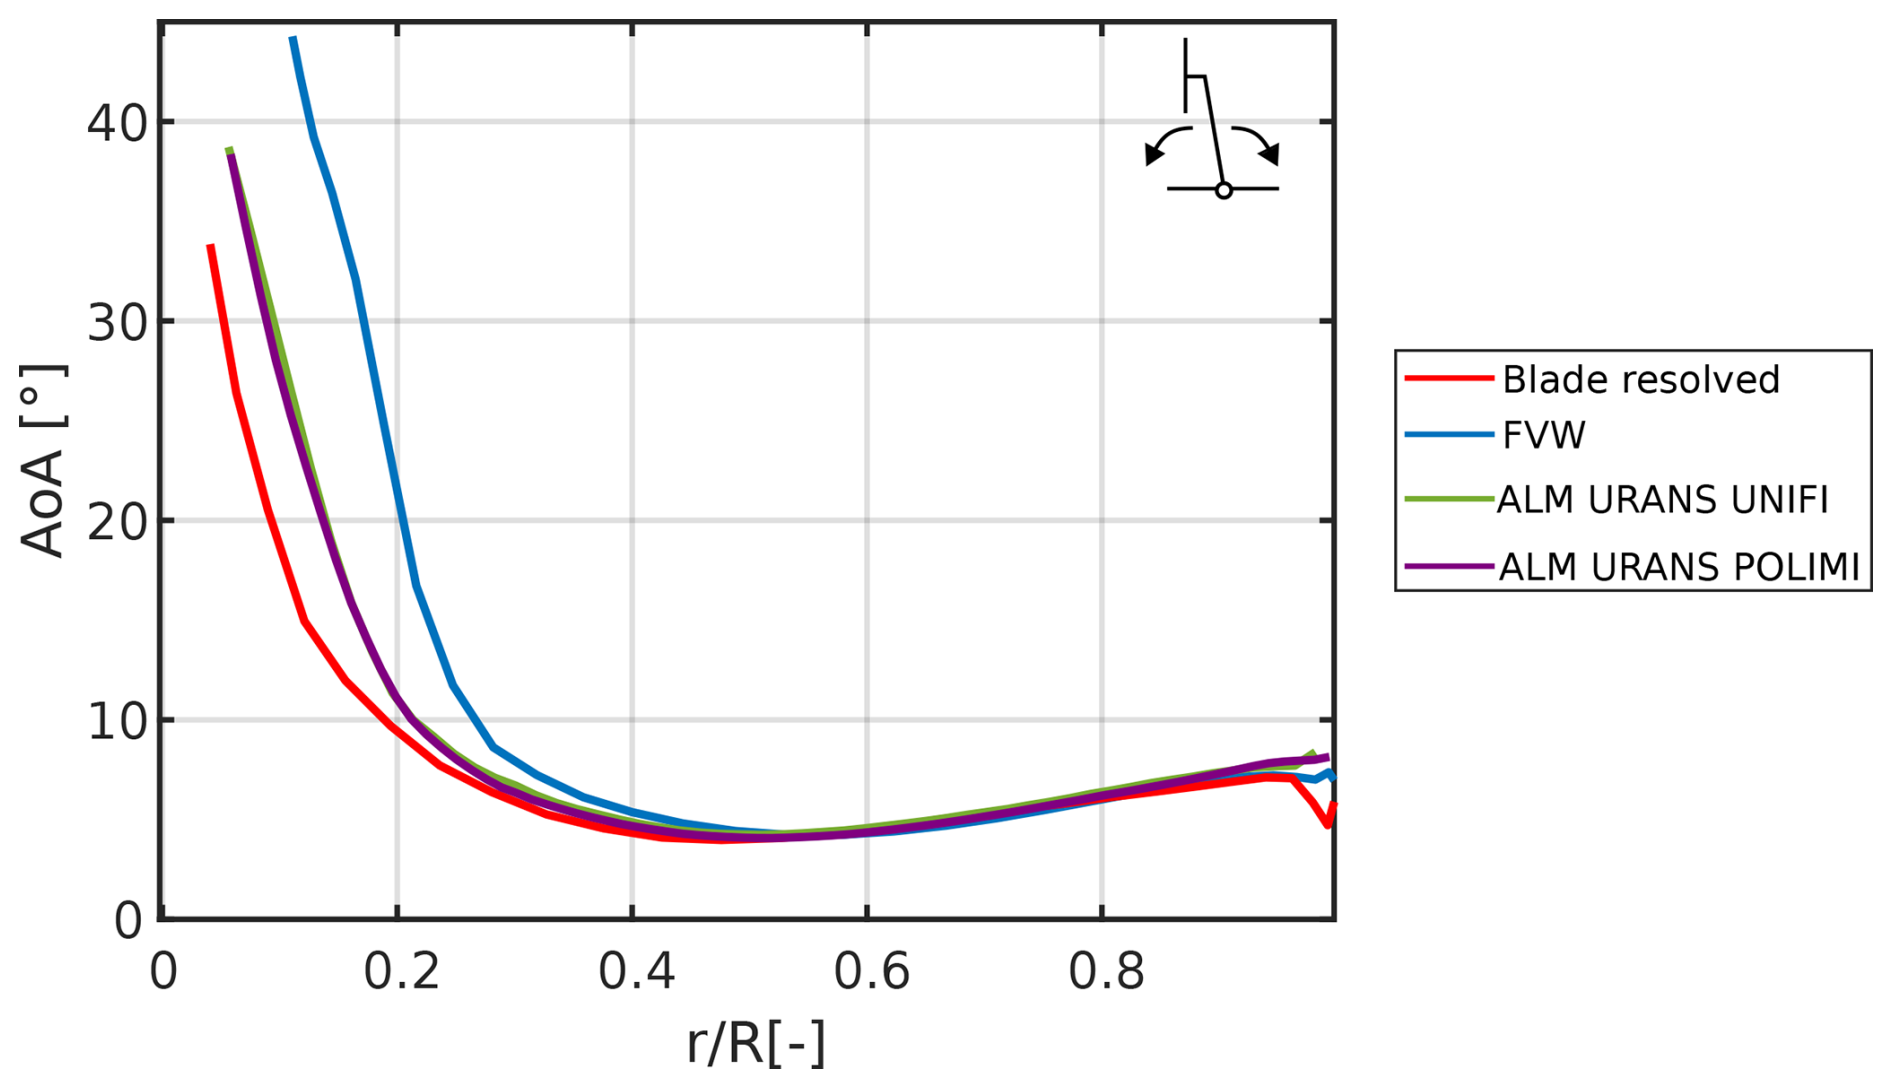
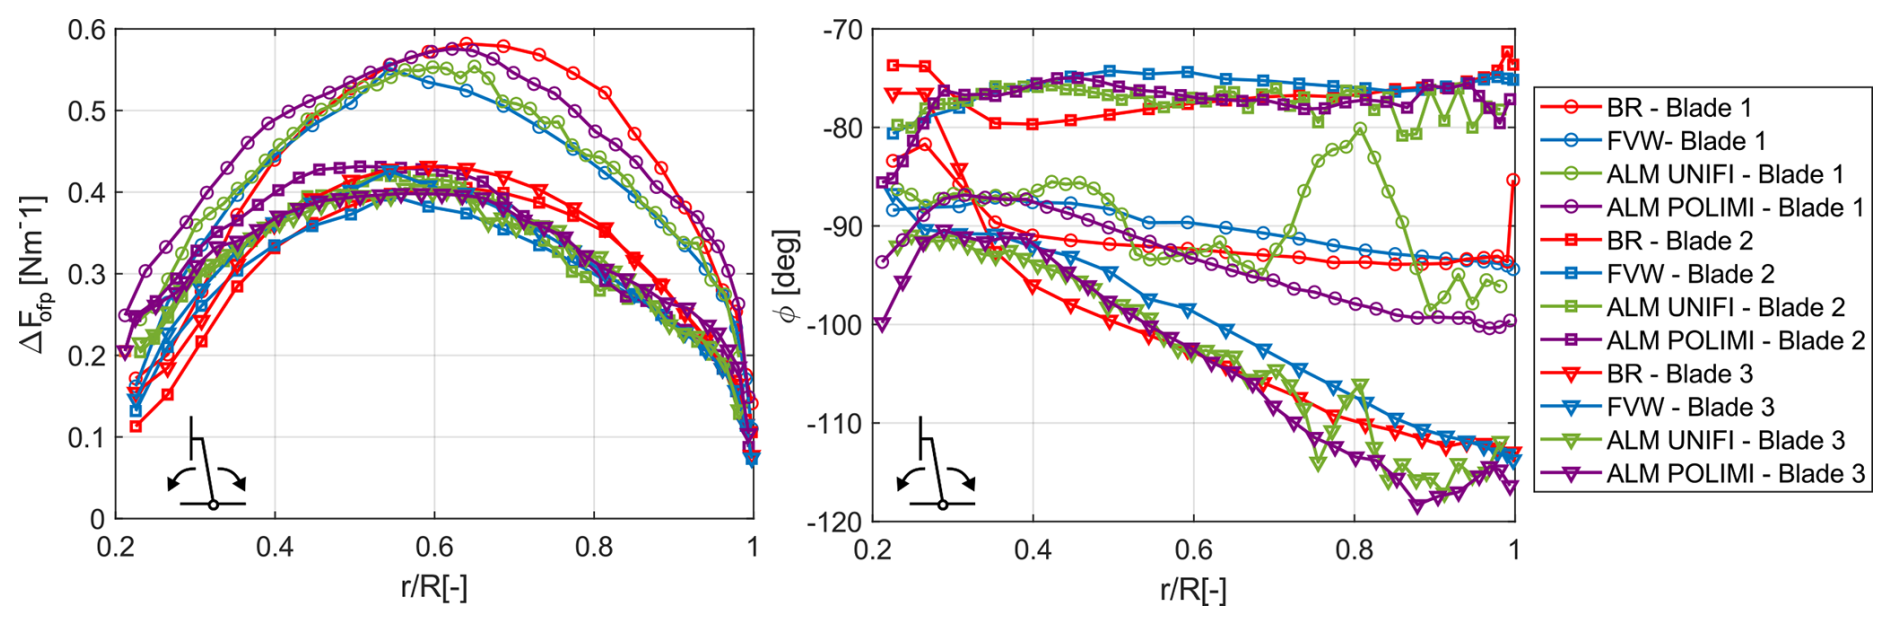
Figure 11Distribution of amplitudes and phase shifts of the out-of-plane loads along the span for a pitch motion of the turbine, with A=0.3° and fr=1.2.
In all the numerical results, discrepancies are observed between the three rotor blades, which are caused by the effect of the periodic rotor tilt induced by pitch motion on the angle of attack (Cioni et al., 2025). In fact, pitch motion alters the local angle of attack both by introducing an additional structural velocity in the flow direction (caused by the motion of the turbine in the streamwise direction) and a misalignment between the blades and the inflow (due to the misalignment induced by the pitching of the turbine). Depending on the azimuthal position of each blade, these two contributions may add up or compensate each other, leading to the observed differences in out-of-plane loads' oscillations. In these specific operating conditions, where the rotor rotational frequency is two times the platform motion frequency, each blade is found in the same azimuth position for each motion cycle, highlighting this effect. Further details about the impact of pitch motion on the spanwise aerodynamic response are provided in Cioni et al. (2025). The FVW and ALM URANS show an analogous difference across the blades, showing that these methodologies can correctly predict the impact of the rotor pitch on the different blades. In particular, results show that the FVW approach, if properly tuned, can lead to similar results to the ALM URANS approach in terms of rotor loads, at a fraction of the computational cost. The ALM URANS are also affected by the tuning parameters and model employed, despite using the same airfoil polars. Indeed, the ALM URANS implementation by UNIFI shows better agreement with the blade-resolved simulation in the first 40 % of the span, while POLIMI shows improved results between 60 % and 80 % of the blade, even though such difference is observed for only one of the rotor blades.
The impact of platform motion on the wake response was evaluated for all the test cases described in Sect. 2. First, the mean wake response was evaluated by averaging the results over multiple cycles of platform motion (Sect. 5.1). The mean wake deficit and turbulent intensity profiles from the experiment and numerical methods were compared. Then, the onset of velocity oscillations was evaluated (Sect. 5.2). Finally, the vortex structures in the wake were investigated to improve the current understanding of wake dynamics under sinusoidal platform motion conditions (Sect. 5.3).
5.1 Mean wake response
The mean wake response of the floating wind turbine model under the different platform motion conditions was evaluated from experimental results and numerical simulations at a distance of 3 D from the rotor for a horizontal traverse located at hub height (see Fig. 2). For a pitch motion of the turbine, the experimental results show that platform motion has only a minor impact on the average streamwise profile (Fig. 12). Analogous results were observed for the remaining operating conditions investigated in this work, which are not shown here for brevity. This result confirms the previous analysis of the OC6 phase III project (Cioni et al., 2023), suggesting that the sinusoidal surge and pitch motions do not lead to a significant improvement in wake recovery in the near wake. Both FVW and ALM URANS CFD simulations show an analogous wake response to platform motion, as only minor differences are observed across the investigated conditions and the fixed-bottom results. The main discrepancies are observed for the FVW results, which show higher mixing at the center of the wake for a reduced frequency of 0.6. In these operating conditions, the FVW method might overestimate the impact of platform motion on the wake.
The differences between the simulations and the experiment are connected to the limitations of the numerical methods in capturing the fixed-bottom wake recovery and not differences induced by platform motion. Both FVW and CFD ALM URANS results underpredict the wake transition at a distance of 3 D, showing a bi-Gaussian velocity profile (Fig. 12). In contrast, the wind tunnel tests show improved mixing at the center of the wake and an asymmetric velocity profile, which might be due to the interaction between the rotor wake and the wake of the nacelle and tower (Fontanella et al., 2025).
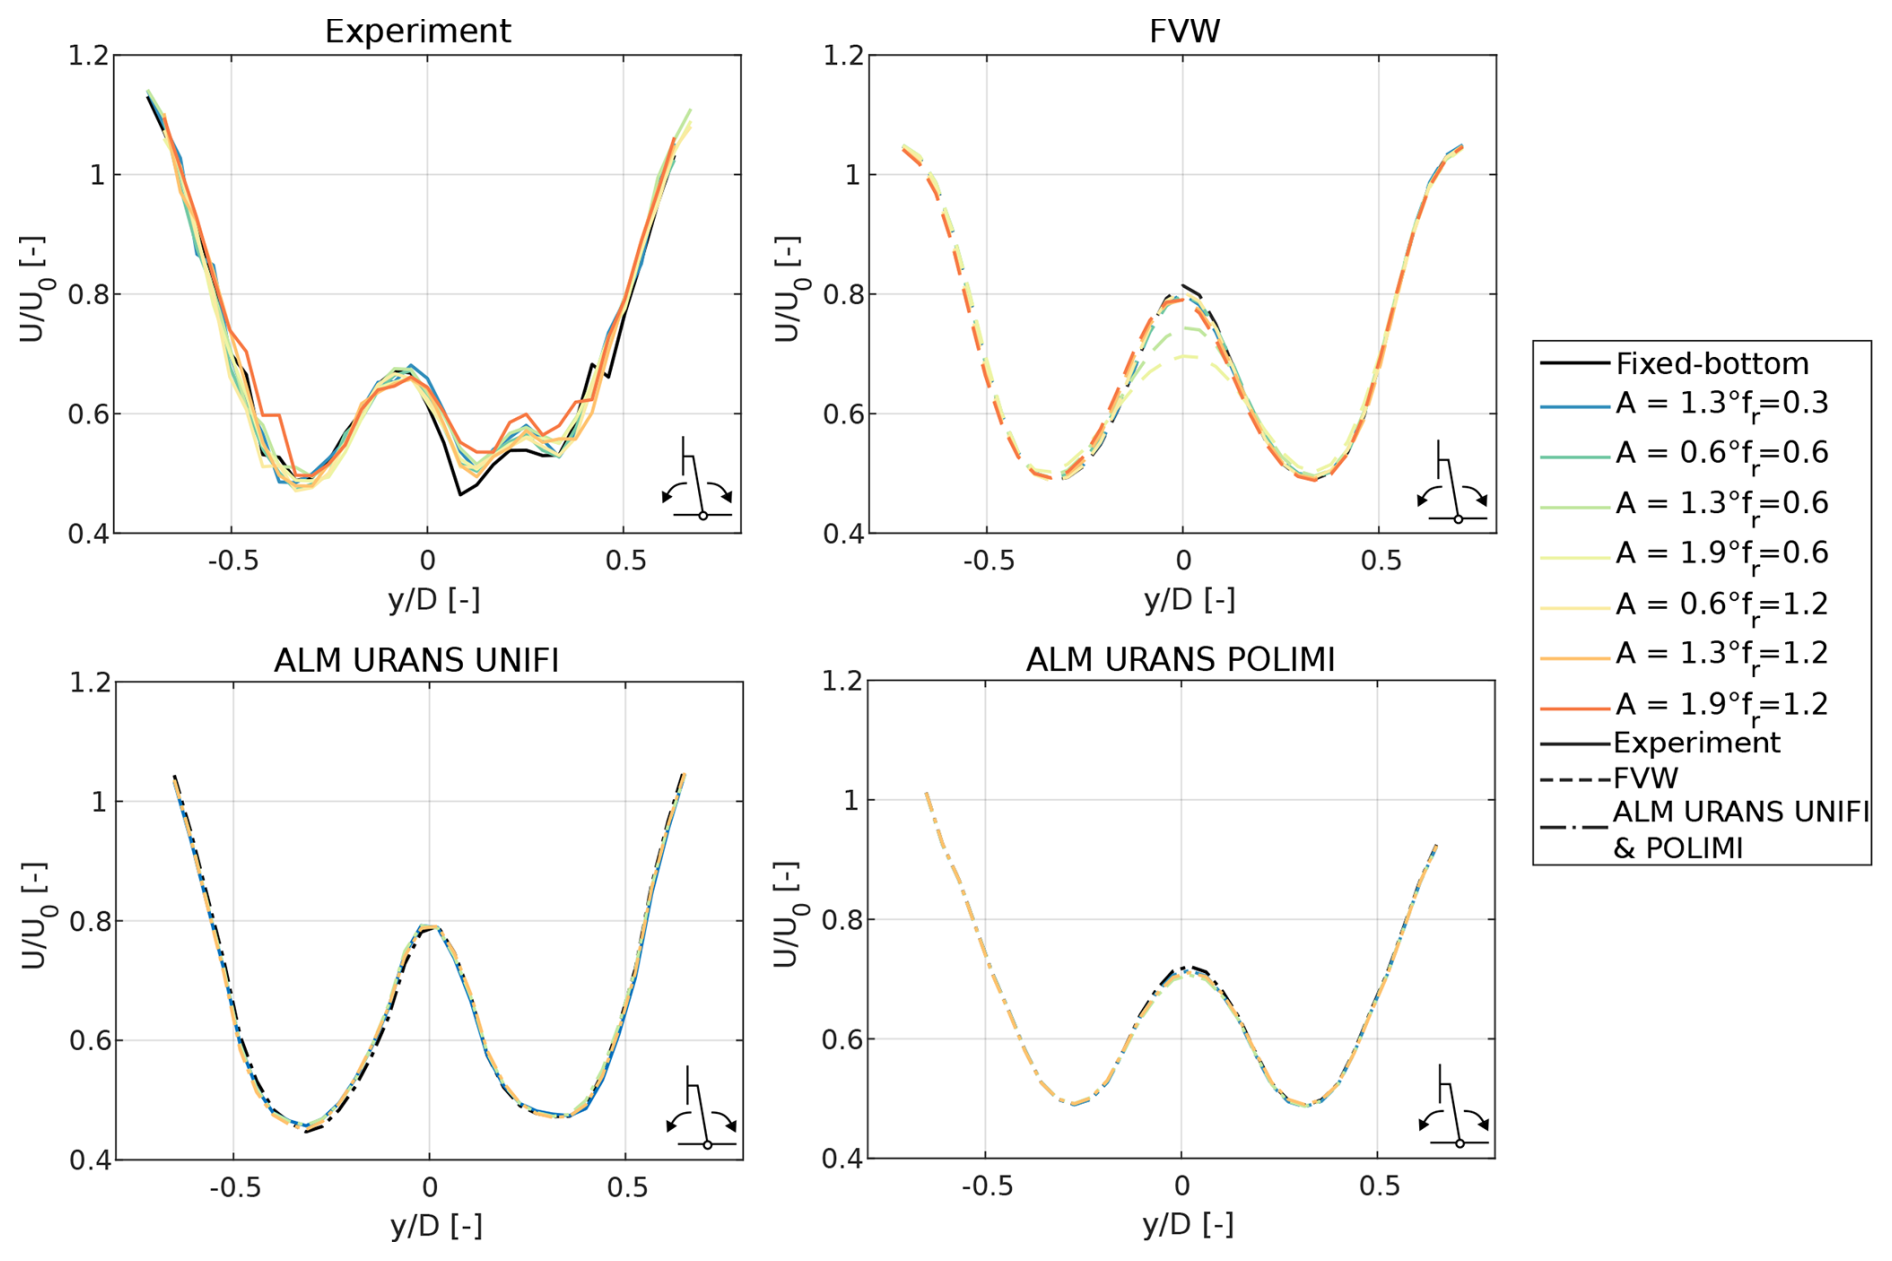
Figure 12Horizontal profiles of streamwise velocity at a distance of 3 D from the rotor for a pitch motion of the rotor.
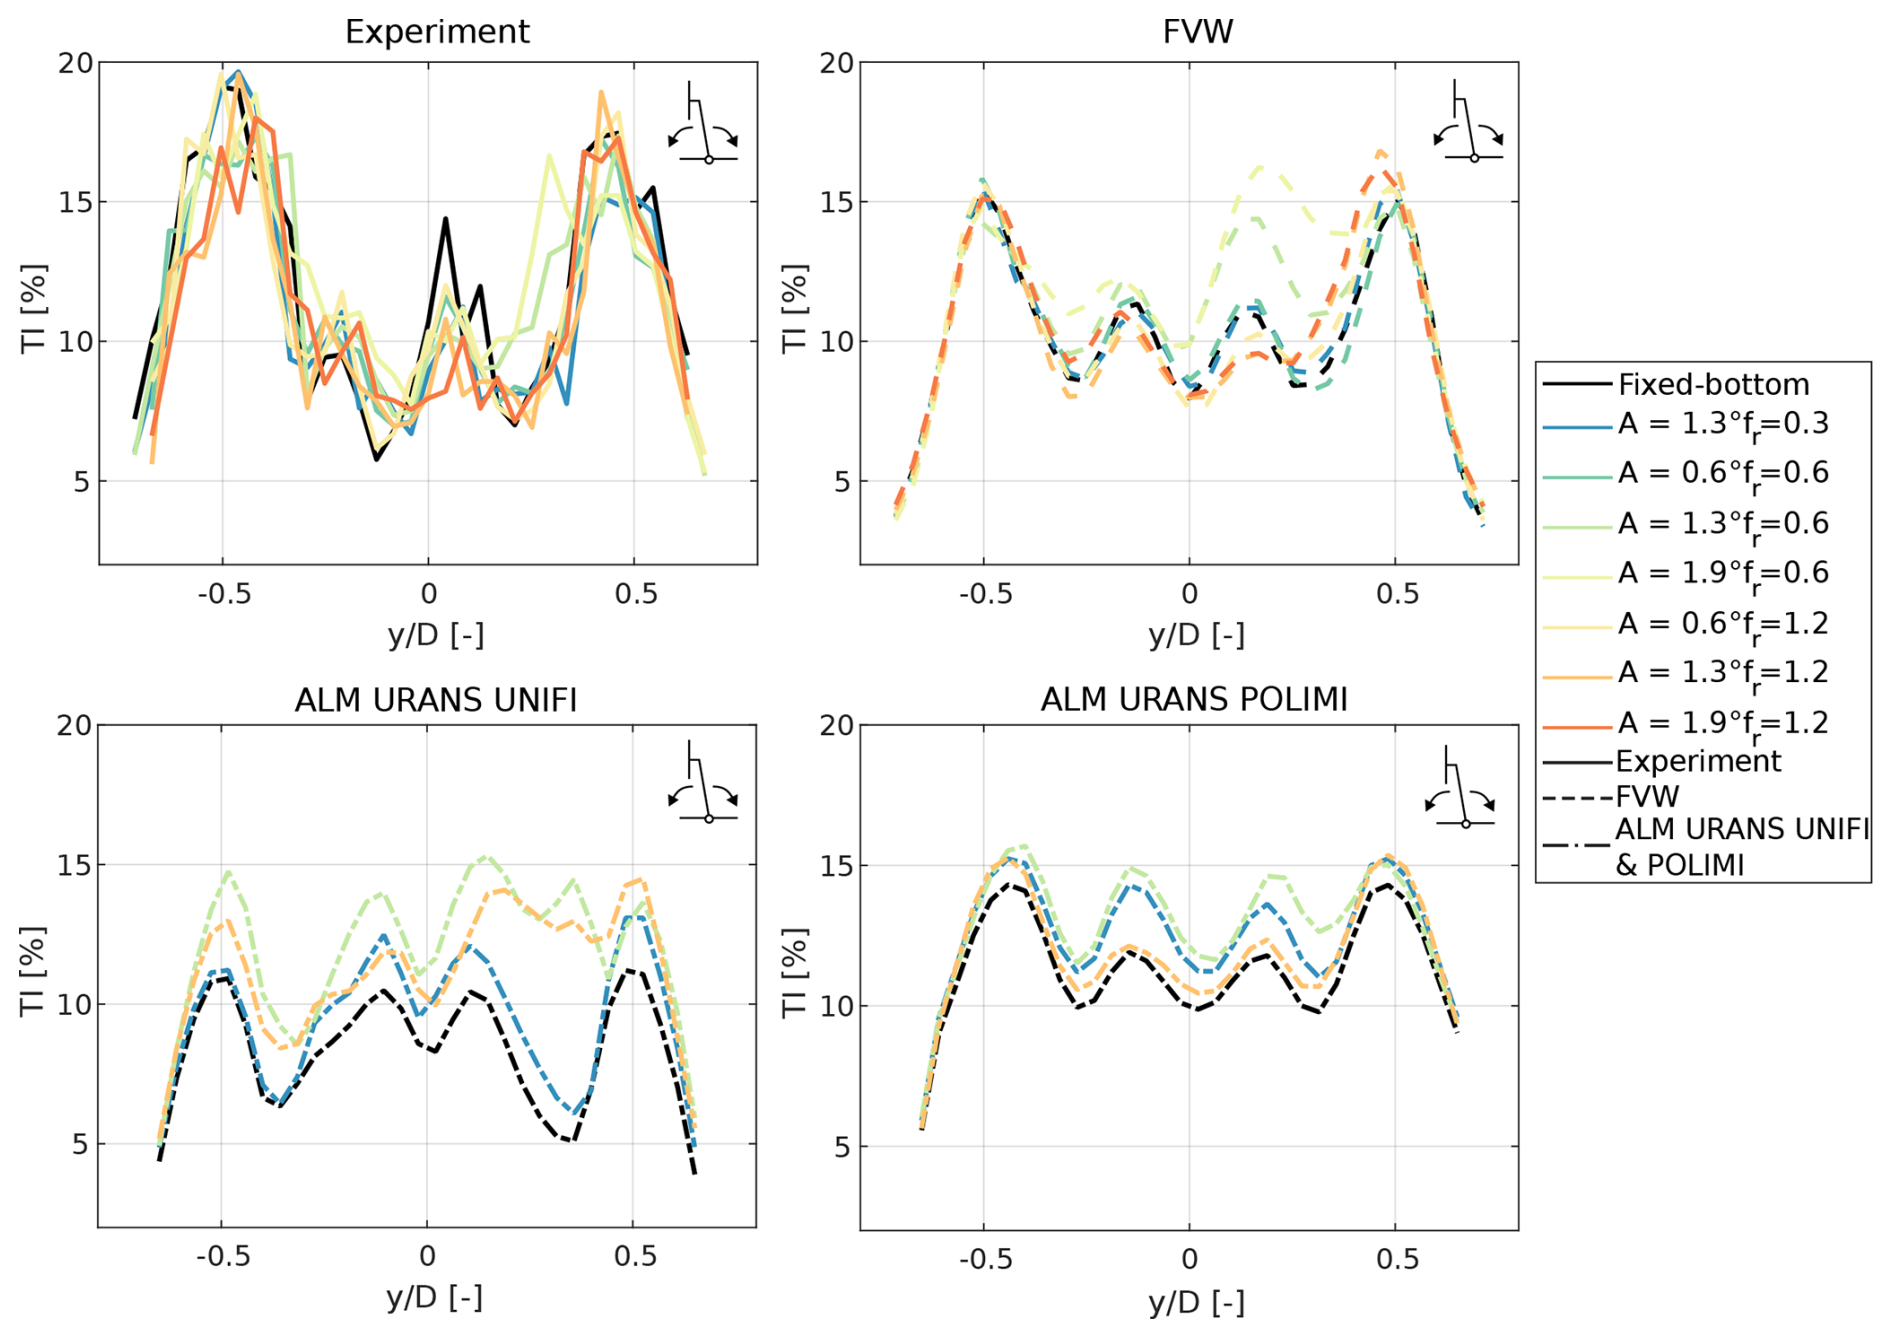
Figure 13Turbulent intensity horizontal profile at 3 D from the rotor for the pitch motion cases.
The motion of the turbine could also lead to increased turbulence intensity in the wake, due to the improved mixing and the additional impact of periodic apparent velocity oscillations. In this work, the turbulence intensity from FVW and ALM URANS simulations refers to the streamwise velocity value, computed according to Eq. (2). For the ALM URANS simulations, the turbulence intensity is instead computed as
where TKE is the turbulent kinetic energy obtained as an output from the URANS simulations.
In pitch motion conditions, an increase in turbulent intensity is observed mainly in the inner part of the wake (Fig. 13). Most differences from the fixed-bottom case are observed at high reduced frequency and high amplitudes of motion (i.e., for large apparent velocity oscillations). The numerical methods are able to capture the turbulence intensity increase observed in experiments, with minor differences. Both the FVW and ALM URANS methods show a significant increase also at a reduced frequency of 0.6 and an amplitude of 1.3°, overestimating the impact of these conditions in comparison to the experiment. The ALM URANS results significantly underestimate the turbulence intensity in fixed-bottom conditions, due to the URANS methodology employed, in agreement with the existing literature (Cabezon et al., 2011). For this reason, this method overpredicts the increase in turbulence intensity caused by platform motion with respect to fixed-bottom conditions.
For a sinusoidal pitch motion of the platform, the increase in turbulence intensity in the wake is more significant for two specific operating conditions: a reduced frequency of 0.6 and an amplitude of motion of 1.9°, and at a reduced frequency of 1.2 and an amplitude of 0.6°. Hence, the increase in turbulence intensity is not strictly correlated with an increase in reduced frequency or in the amplitude of the apparent velocity oscillation. Instead, the wake shows an amplified response for a reduced frequency of 0.6. The FVW and ALM URANS simulations are able to capture this trend, even if the relative increase in turbulence intensity is overestimated in comparison to the experiment. Some differences are observed across the two ALM URANS methodologies compared in Fig. 13. First of all, in fixed-bottom conditions, POLIMI shows increased turbulence intensity corresponding to the tip vortices in comparison to UNIFI. Such a difference might be connected to differences in the spreading of the aerodynamic forces, and may alter the size and strength of these vortex structures, in turn affecting the distribution of the turbulent intensity. Additionally, the ALM URANS results show different wake responses to a pitch motion of the platform. Indeed, UNIFI shows an asymmetrical increase in turbulence intensity, matching the experiment, while a uniform increase is observed for the POLIMI simulations.
The wake response of the model wind turbine was investigated also at a distance of 5 D to evaluate the impact of platform motion further downstream. In fact, platform motion may enhance turbulent mixing in the wake, leading to further differences between the fixed-bottom and platform motion cases in terms of mean velocity deficit. Figure 14 shows the mean streamwise velocity profile under different frequencies of pitching motion and a constant amplitude of 1.3°. Both experiments and FVW simulations show only a minor impact of pitching motion on the average velocity profile and wake deficit. The wake profile from the FVW and ALM URANS simulations is not fully transitioned and shows a bi-Gaussian profile. The experiment, however, shows further transition of the wake. Nevertheless, both experimental, and FVW and ALM URANS simulations by UNIFI show a non-symmetric wake response when the reduced frequency is 0.6, suggesting that in such operating conditions the wake dynamics are more influenced by platform motion, despite minor impacts on the overall wake deficit. This is confirmed by the turbulence intensity profile, as the most significant increases are observed for this motion frequency (Fig. 15). The ALM URANS simulation by POLIMI shows improved transition of the wake and better agreement with the experiment in terms of fixed-bottom wake deficit; however, the impact of platform motion is underestimated in the experiment.
In terms of turbulence intensity, significant differences are observed across the ALM URANS simulations. While both models underestimate the turbulent intensity values in the wake due to the URANS methodology employed, the ALM by UNIFI shows significant increases in turbulence intensity when a pitching motion of the platform is introduced. Such a difference with the fixed-bottom response is significantly reduced in the POLIMI simulations. To investigate the differences between the two ALM URANS models, UNIFI runs some tests without including the nacelle, tower, and robot; however, no significant difference was observed in the result. Additionally, the different kernel size between POLIMI and UNIFI is probably not the root cause of the observed differences, as additional tests run by UNIFI matching the setup by POLIMI did not show significant differences.
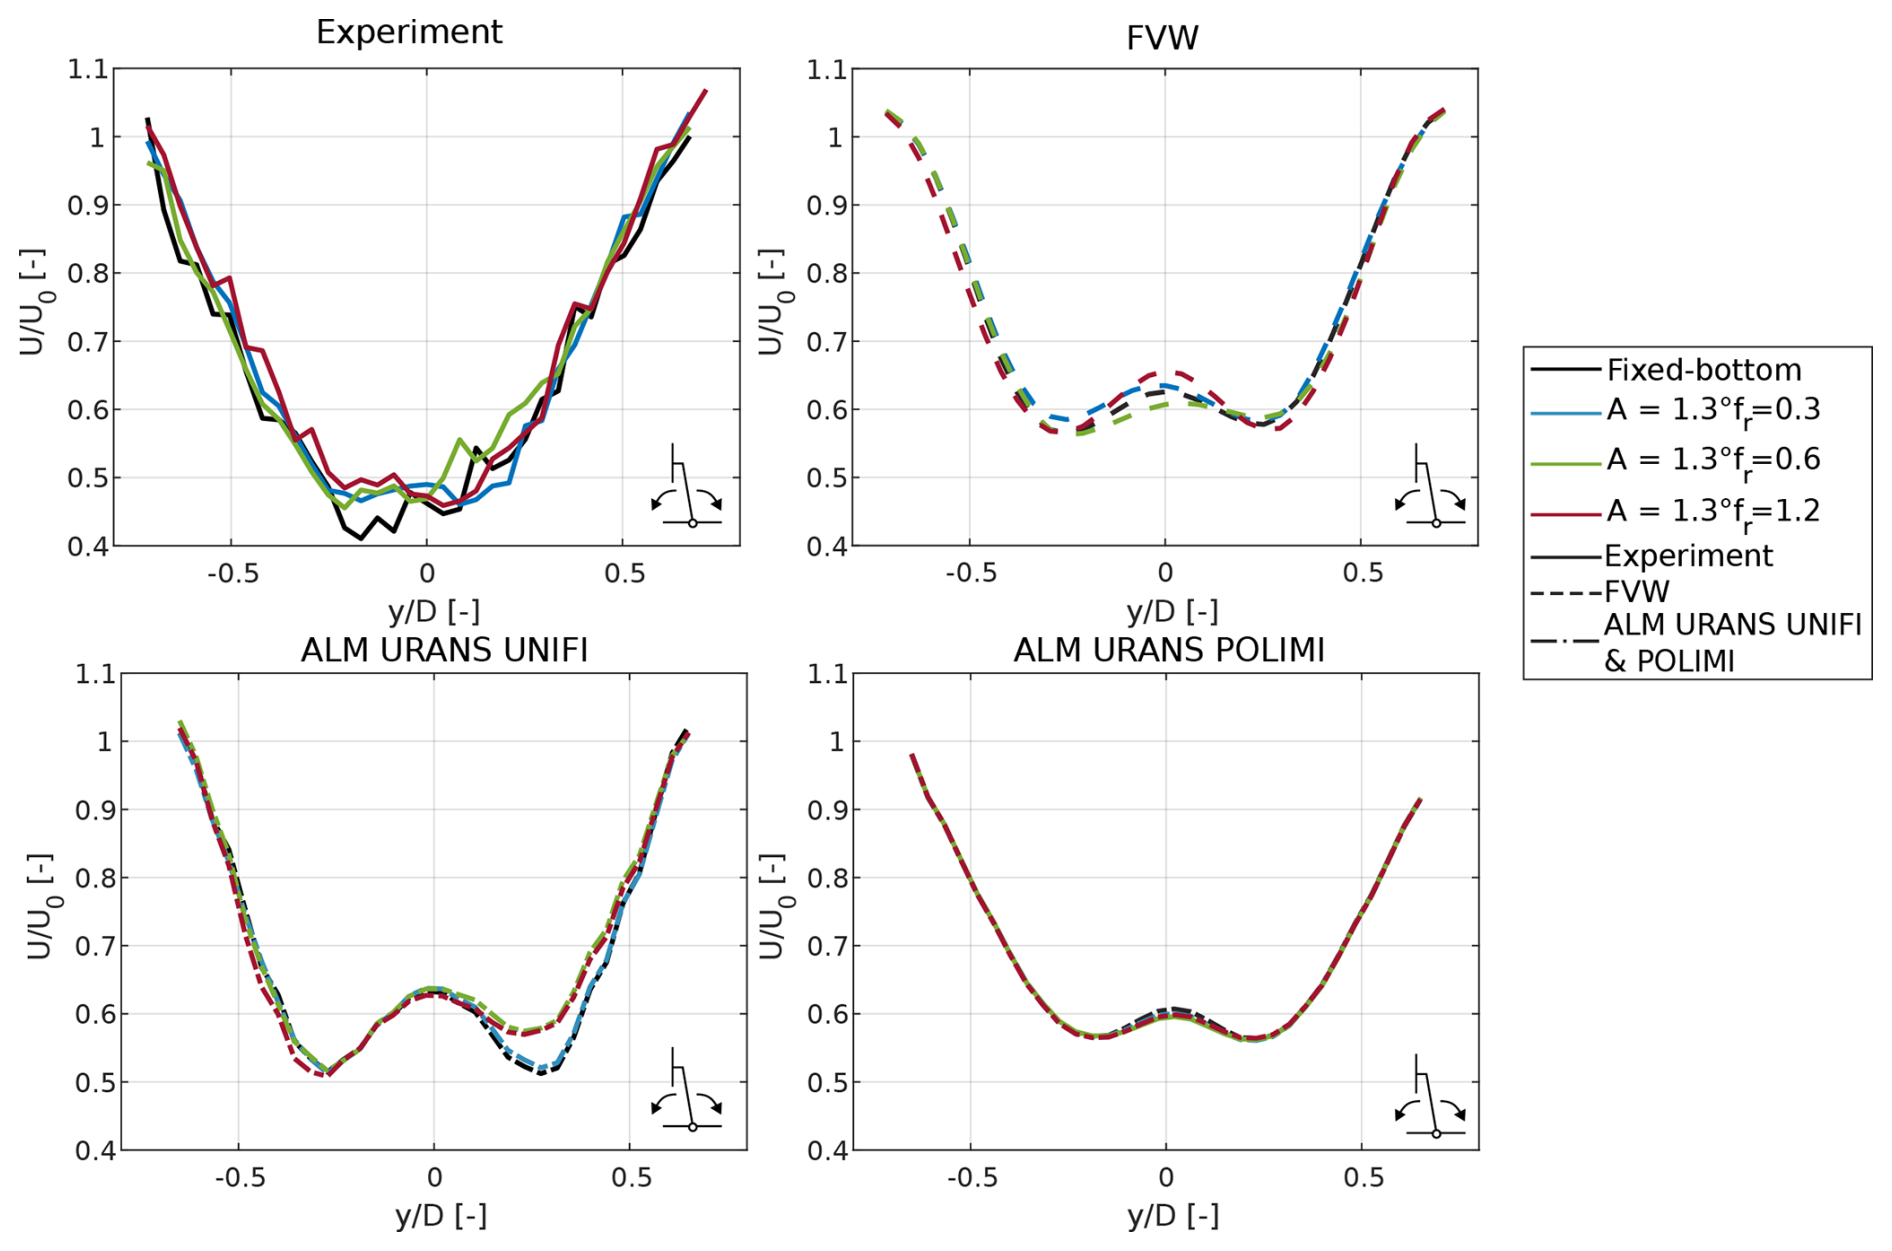
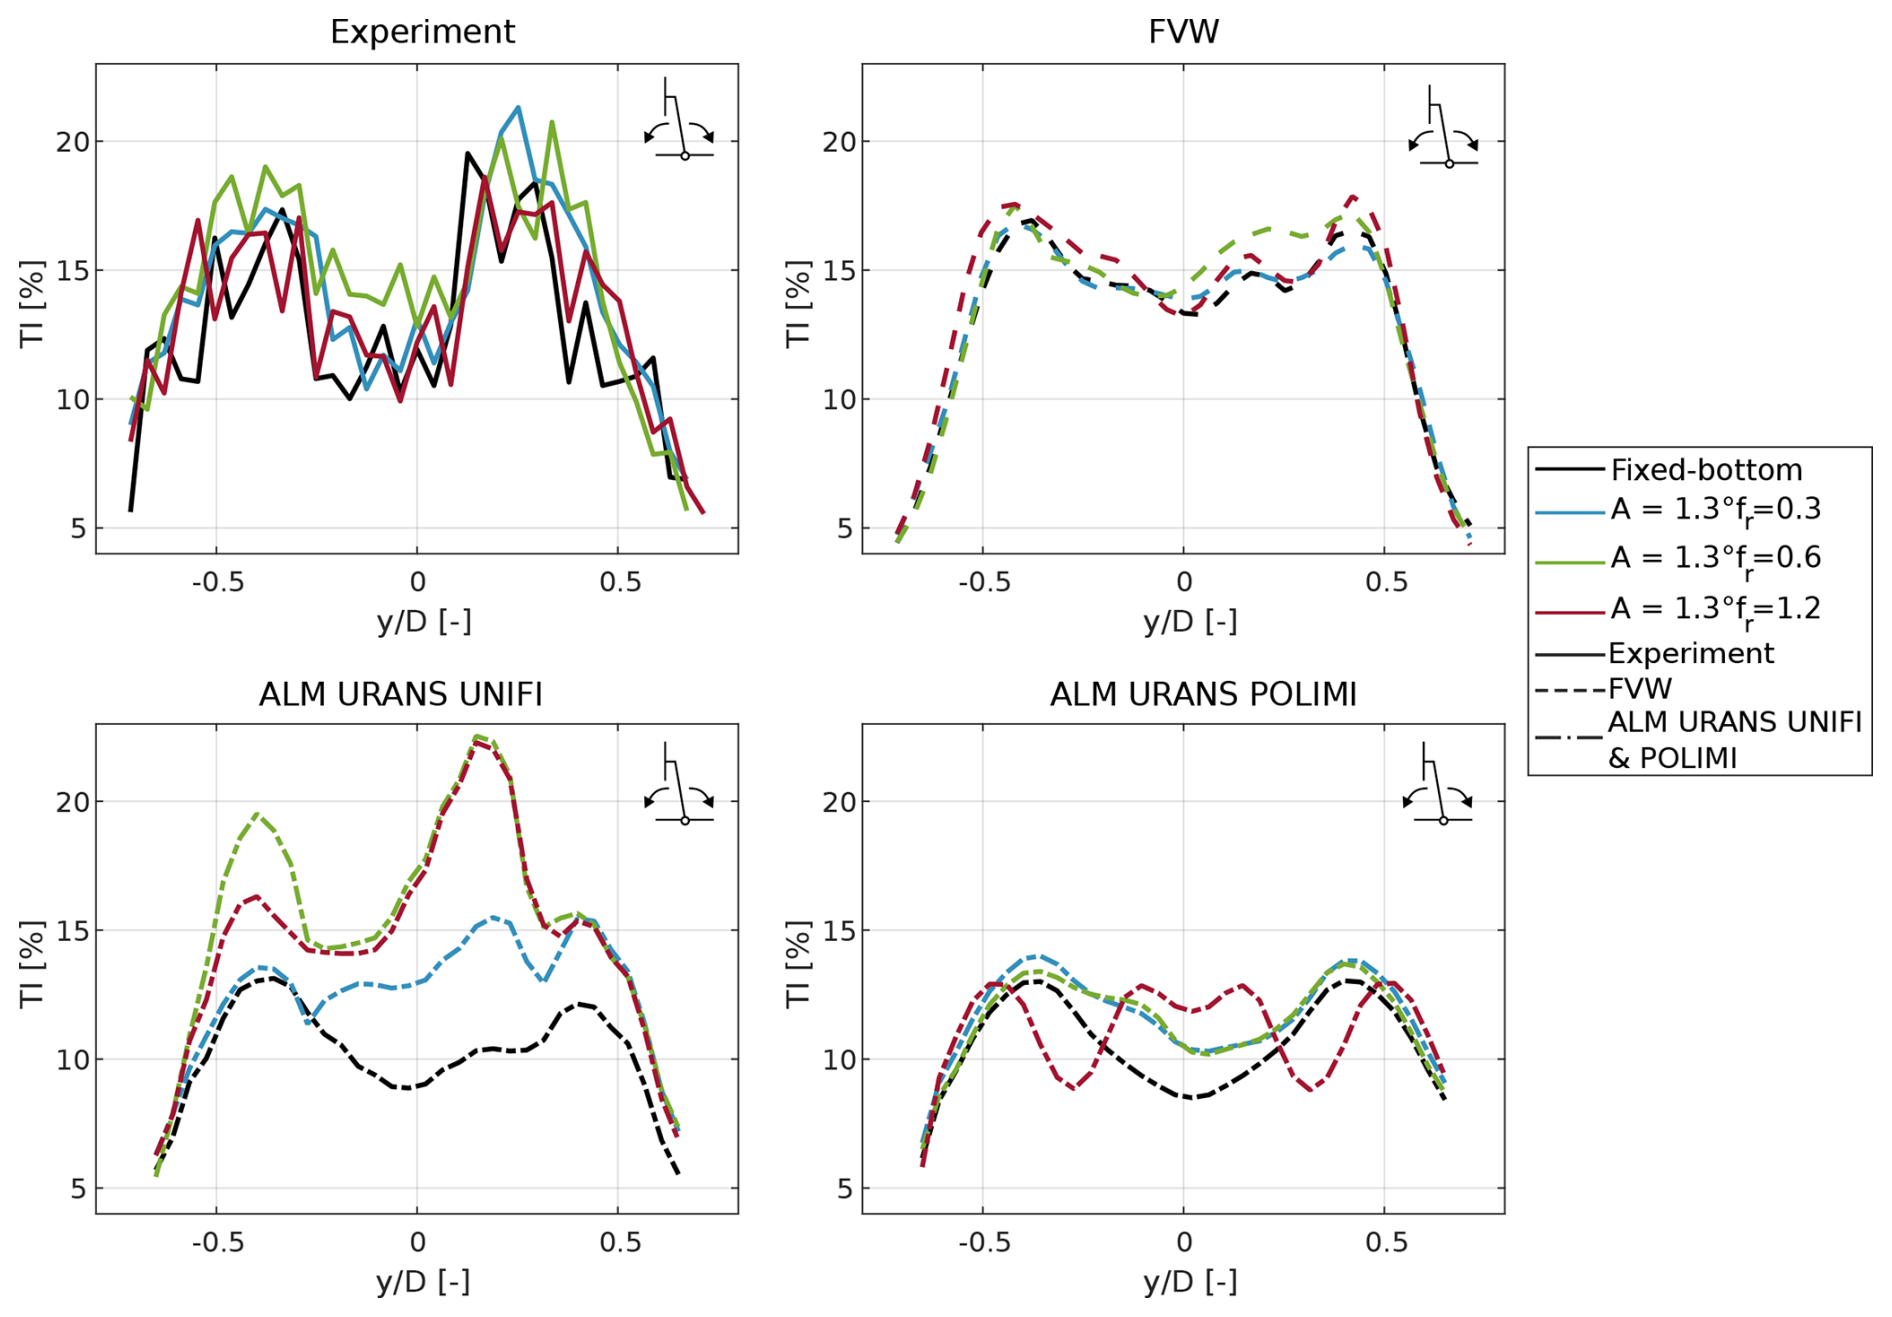
Figure 15Horizontal turbulence intensity profile at a distance of 5 D from the rotor under pitching motion of the turbine.
During the NETTUNO wind tunnel campaign, the initial analysis of surge and pitch cases was expanded by including different types of platform motion. The wake response was evaluated also under sinusoidal yaw oscillations at a constant amplitude and with varying frequency. Nevertheless, similar to surge and pitch motions, experiments and numerical simulations show that yaw motion does not lead to significant improvements in wake deficit (not shown here for brevity).
In terms of turbulence intensity (Fig. 16), yaw motion enhances turbulent mixing in the inner part of the wake, similarly to what was observed for surge and pitch motions. The most significant increase in the experimental results is observed for a reduced frequency of 0.6, while almost no difference is observed at a higher frequency of motion, and minor increases are observed at fr=0.2. The FVW and ALM URANS simulations generally overpredict the impact of platform motion across the wake, even though the reduced frequency of 0.6 shows the most significant turbulence increase in the wake, as the turbulence intensity maxima corresponding to the wake shear layer become wider, suggesting an increase in the boundary layer thickness. Significant increases are observed in all the numerical methods also for a reduced frequency of 0.2, which are not shown in the experimental data, suggesting that the wake dynamics are not captured in these conditions.
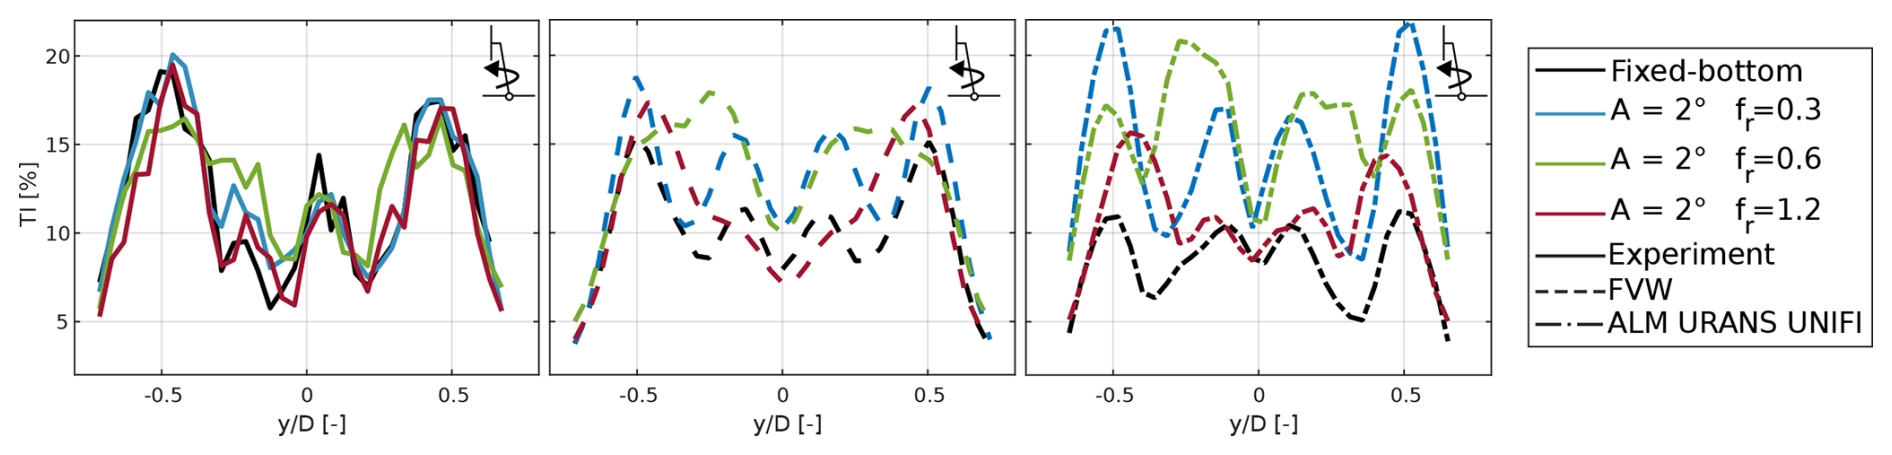
Figure 16Turbulent intensity profiles at a distance of 3 D during yaw motion of the wind turbine.
Finally, the wake response of the model wind turbine was investigated in more complex platform motion conditions, where the wind and wave are misaligned, resulting in a combination of surge and sway. In these test cases, the mean wake response was evaluated as a function of the misalignment angle under fixed amplitude and frequency of motion (Fig. 17). A reduced frequency of 0.6 was chosen as this resulted in the most significant differences in wake response in comparison to the fixed-bottom case.
Even under a combination of the surge and sway, the impact of platform motion on the average wake deficit is limited, despite the introduction of the crosswise motion. This result is confirmed across experiments and simulations, with good agreement. However, an increase in turbulence intensity is observed in comparison to the fixed-bottom case in both experiments and simulations. For a combination of surge and sway, the turbulence intensity is increased, mostly in the inner part of the wake. In the experimental data, the turbulence intensity increases with the misalignment angle, up to 90° (i.e., pure sway), even though the differences are limited when increasing the misalignment angle from 30 to 45° and 90°. The FVW and ALM URANS simulations show a similar increase in the turbulence intensity in the inner part of the wake; however, the increase in turbulence intensity is overestimated, especially when a pure sway motion is considered. The ALM URANS results show further differences in the shear layer in comparison to the experiment as the turbulent intensity in the shear layer increases significantly due to platform motion.
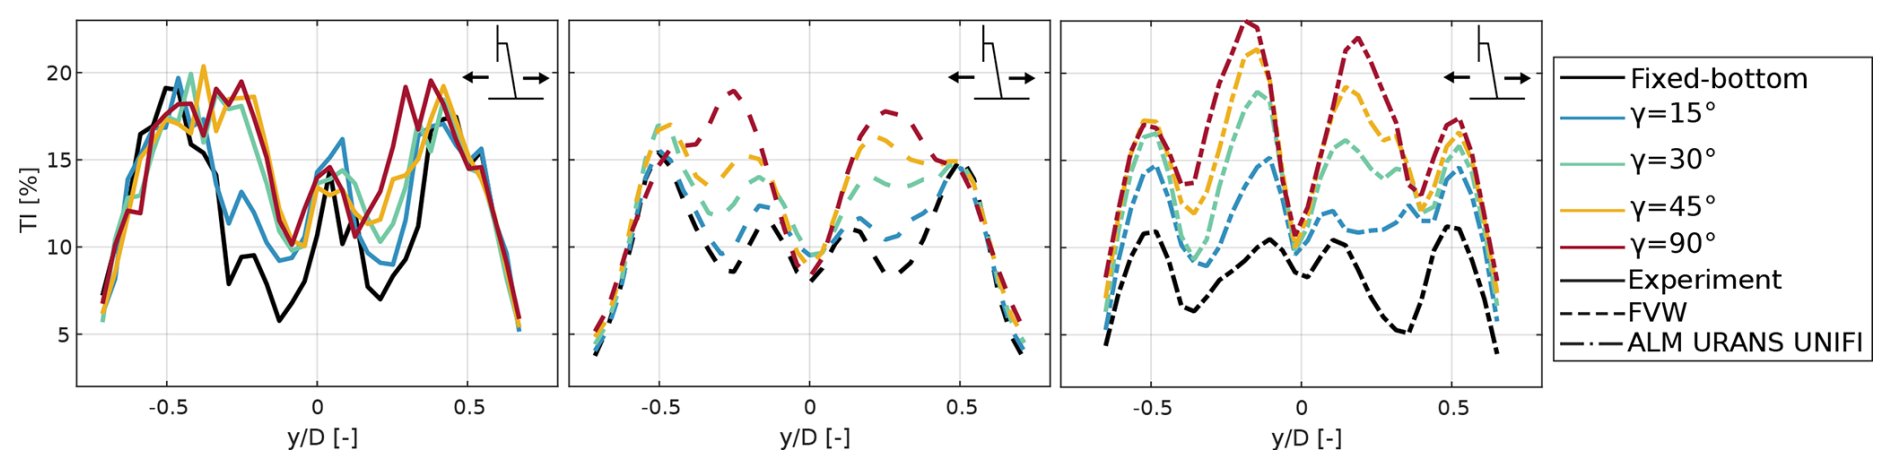
Figure 17Turbulent intensity horizontal profiles for wind–wave misalignment cases at 3 D from the rotor. Results are shown for varying angles of misalignment at a constant amplitude of and a frequency of
The analysis of the mean wake response of the wind turbine model under different types of platform motion conditions performed in this section suggests that platform motion only has a limited impact on wake recovery, up to a distance of 5 D from the rotor (Figs. 12 and 14). The additional mixing in the wake induced by the motion leads to increased turbulent intensity in the wake, which could be detrimental to downstream machines but not to improved wind speed recovery. Numerical methods correctly predict the relative impact of motion on the average wake deficit but may overpredict the increase in turbulence intensity, both for FVW and ALM URANS simulations. In this case, the higher-fidelity ALM does not show significant improvements in the agreement with the experiment, possibly due to the limitations of the URANS approach and ALM setup employed in this work.
5.2 Unsteady wake response
Platform motion may affect the wake response of the wind turbine by inducing periodic velocity oscillations or deflections in the wake. Such oscillations may not have an impact on the average wake response but may be detrimental for downstream turbines. In this section, the unsteady wake response of the turbine is investigated.
The periodic oscillation of the turbine induces oscillations in the relative velocity seen by the rotor and consequently periodic oscillations in rotor thrust and velocity deficit in the wake. For example, Fig. 18 shows the phase-averaged wake deficit calculated along a horizontal traverse at 3 D from the rotor during a cycle of surge motion at a reduced frequency of 0.6 and an amplitude of . The wake deficit is calculated as
where r is the radial coordinate, and u and u∞ are the streamwise velocity values in the wake and free stream, respectively. The wake deficit is weighted by the radial coordinate representing a rotor-averaged value. A clear sinusoidal trend at the frequency of platform motion is observed in both the experiment and the numerical results. Hence, to quantify the entity of such oscillations, for each of the operating conditions investigated in this work, the amplitude of the wake deficit oscillations was calculated using the Fourier transform to extract the contribution at the frequency of motion.
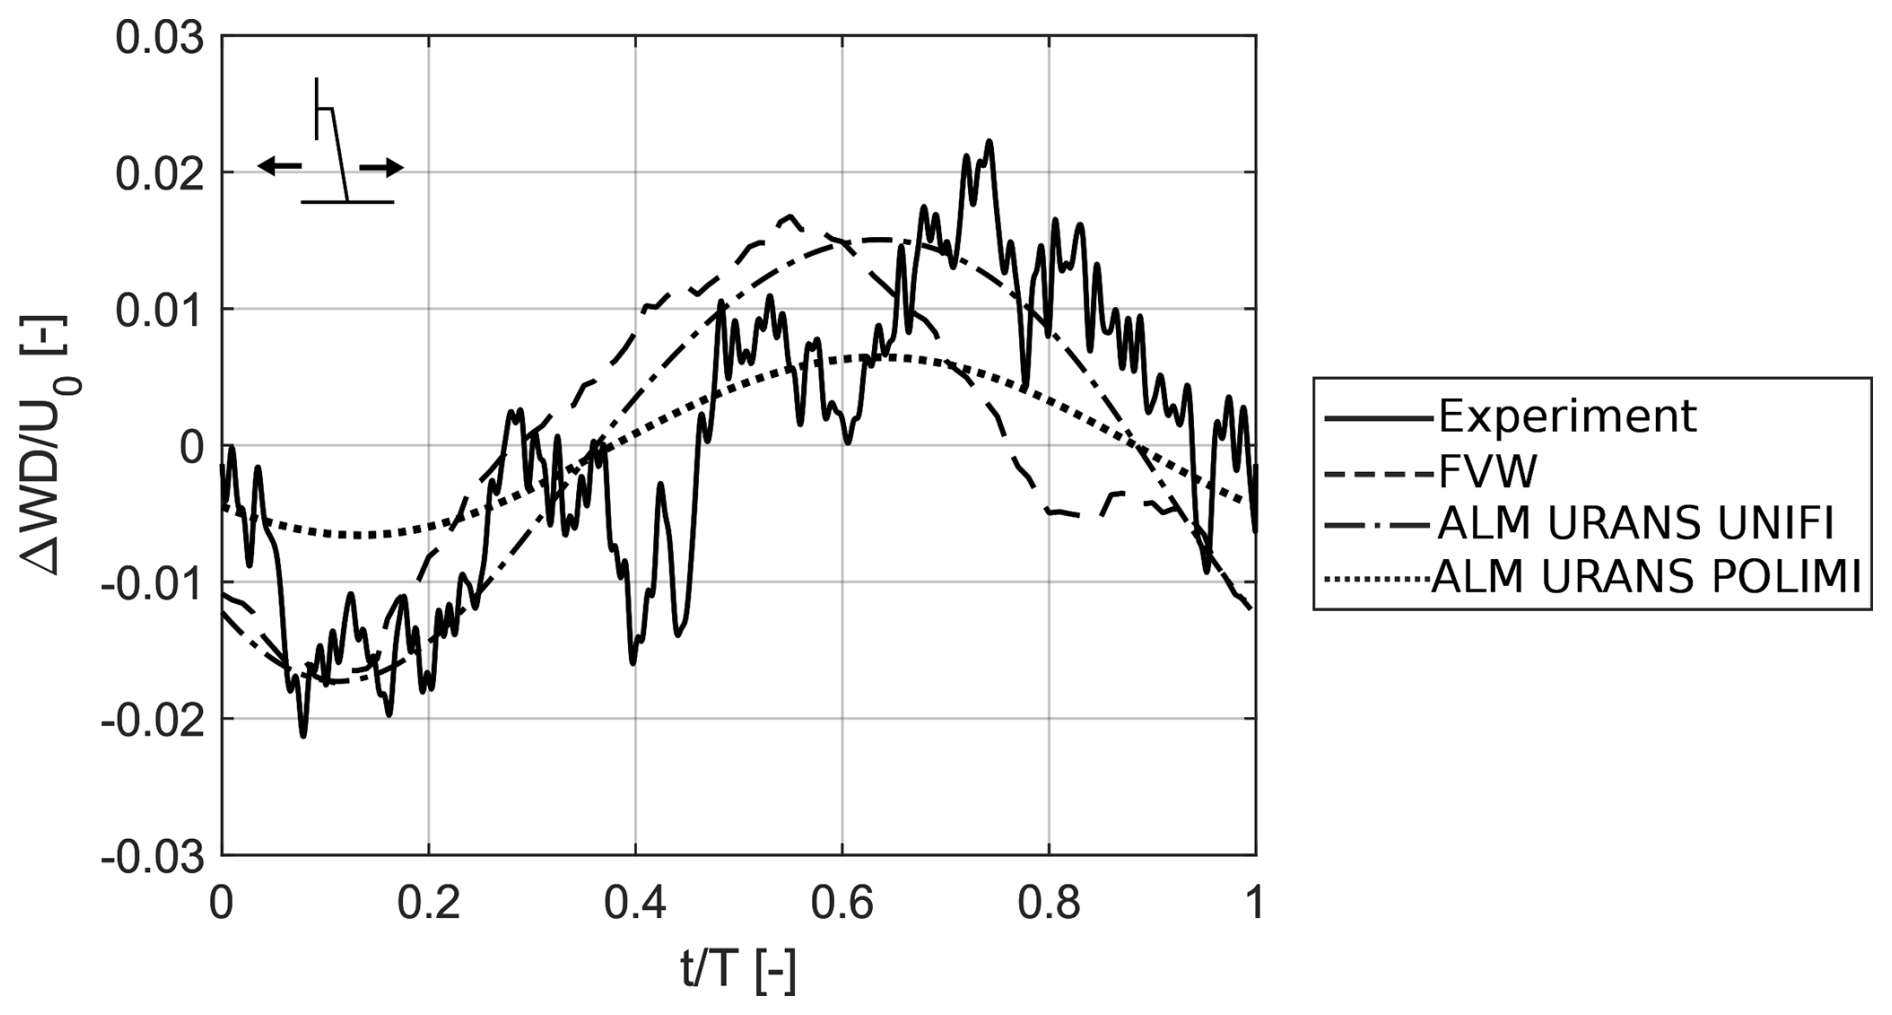
Figure 18Oscillation of phase-averaged wake deficit time series during a cycle of surge motion at m and fr= 0.6.
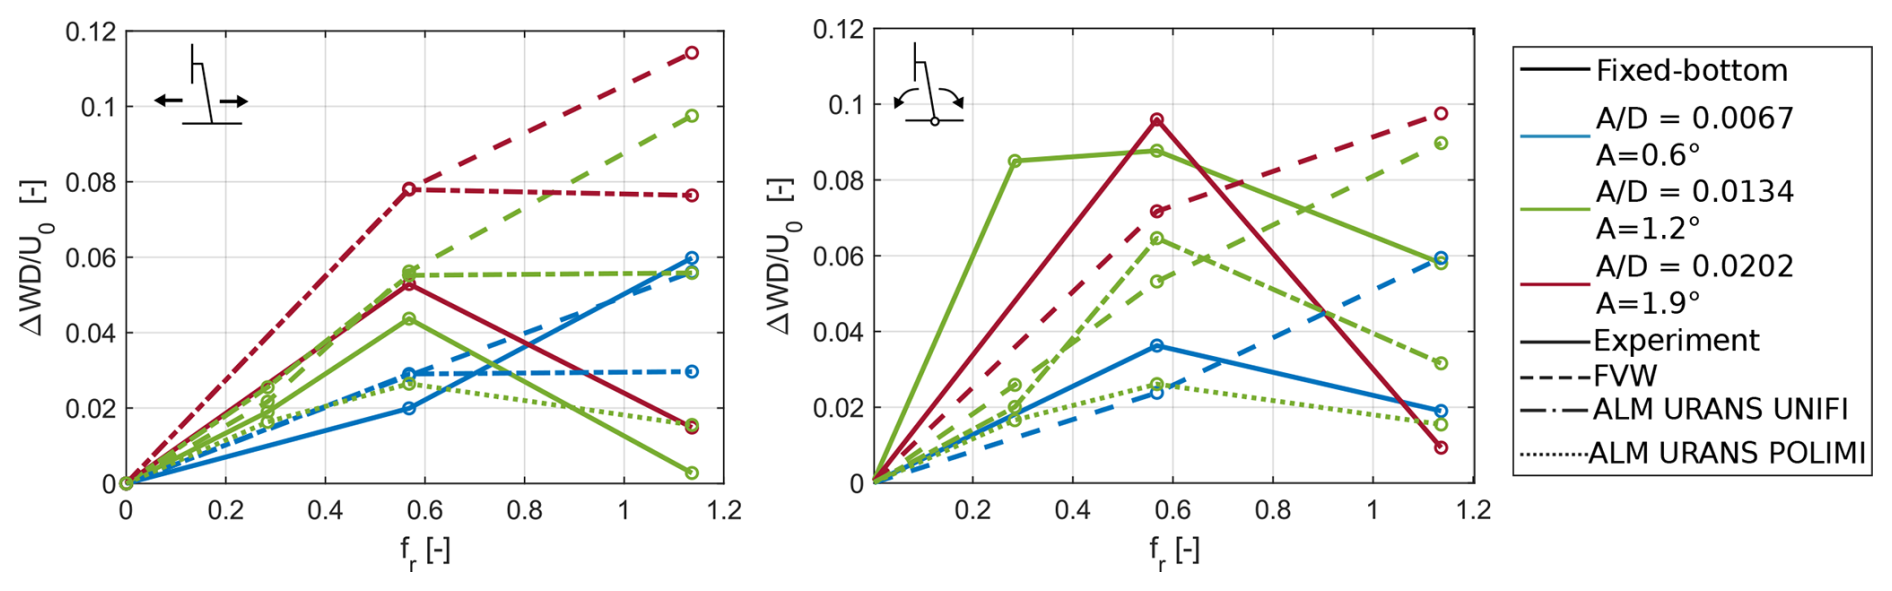
Figure 19 shows the amplitude of the wake deficit oscillations along the horizontal traverse at 3 D from the rotor for the surge and pitch cases. In the case of surge motion, the experimental results show a maximum of the wake deficit oscillations at the reduced frequency of 0.6 at the largest amplitudes of platform motion. This result indicates that the velocity oscillations in the wake are not proportional to the rotor thrust oscillations induced by the motion, which increase almost linearly with the frequency of oscillation (see Sect. 4.1). Such a similar linear trend is observed for wake deficit oscillations only for an amplitude of , which corresponds to the smallest apparent velocity induced by the motion investigated in this work. This result suggests that in these surge motion conditions, the wind turbine model and wake operate in quasi-steady conditions, and the wake deficit oscillations are proportional to the rotor thrust oscillations. In contrast, for larger amplitudes of motion (and consequently increased apparent velocity), the wake deficit oscillations do not increase for fr=1.2, even though the amplitude of thrust oscillations increases (Fig. 7). As minor differences are also observed in the mean wake deficit (Fig. 13), this result suggests that the wake dynamics are once again dominated by the turbulent mixing with the free stream rather than platform motion. Hence, due to this difference in wake dynamics, quasi-steady assumptions might not correctly predict high-frequency velocity oscillations in the wake in such conditions.
The numerical results show only minor differences with the experimental data, up to a reduced frequency of 0.6 for large amplitudes of platform motion (i.e., and ). At a high reduced frequency, the FVW simulations show an almost linear increase in the wake deficit oscillations, in contrast to the reduction observed in the experimental tests. In the ALM URANS data, the wake deficit oscillations do not show a similar increase but still overestimate the velocity oscillations recorded in the experiment. As observed in Sect. 5.1, platform motion at the reduced frequency of 0.6 excites the wake more significantly than in other conditions, and the velocity oscillations in the wake increase with reduced frequency only when the apparent velocity oscillations are low, at about 0.2 m s−1.
For the pitch cases, a reduction in the wake deficit oscillations at high reduced frequencies is observed for all the amplitudes of motion, independently of the apparent velocity value. The FVW simulations show an almost linear increase in the velocity oscillations with reduced frequency; however, for a pitch motion, the amplitude of the wake deficit is underestimated rather than overestimated in comparison to the surge cases. At high reduced frequency, a further increase in the velocity oscillations is observed, suggesting that the FVW method might be unreliable in predicting the wake dynamics in these conditions. Similarly to the surge cases, the ALM URANS simulations show a closer response to the experiment to variations in the reduced frequency, as the velocity deficit oscillations are maximized for a reduced frequency of 0.6. However, significant differences are observed across the two ALM URANS methodologies employed in this work, as the POLIMI simulations usually underestimate the onset of the velocity oscillations in the wake in comparison to the experiment and to the ALM URANS simulations by UNIFI.
Since the wake deficit only shows an integral evaluation of the velocity oscillations in the wake, an in-depth analysis of the spatial distribution of the velocity oscillations was performed. Figure 20 shows the velocity oscillations along the horizontal traverse during a cycle of surge or pitch motion. For the surge cases (Fig. 20, left column), in both experiments and numerical simulations, the velocity oscillations are not uniform across the wake. At low reduced frequency, almost no oscillation is observed, as confirmed by both experiments and simulations. When the reduced frequency is increased to 0.6, the whole wake pulsates at the frequency of platform motion, and the amplitude of oscillations is also increased. However, when the reduced frequency is 1.2, significant velocity oscillations are observed in the experimental results only in the outer part of the wake. The CFD ALM URANS simulations show a similar distribution of velocity oscillations, while the FVW method still shows significant oscillations in the inner part of the wake. These results show how the wake dynamics are altered with increasing reduced frequency, resulting in a different distribution and intensity of the velocity oscillations in the wake.
When a pitch motion of the platform is considered, the entity of the velocity oscillations in the wake is increased (Fig. 20, right column). Such an increase might be connected to the periodic deflections of the wake due to the pitch motion. In the experimental results, the motion induces a periodic pulsation which is more significant at the reduced frequency of 0.6, analogously to the surge motion case. However, in this case, the velocity oscillations are not symmetric around the center of the wake but are more significant on the right-hand side. This result is confirmed in both FVW and ALM URANS simulations and might be connected to the combination of rotor rotation and pitch motion, leading to an asymmetrical response. At a reduced frequency of 1.2, the velocity oscillations are significant only at the edges of the wake in the experimental results; however, the FVW simulations show significant oscillations also in the inner part of the wake, similarly to the surge motion cases. Across the ALM URANS simulations, UNIFI and POLIMI show a similar spatial distribution of the velocity oscillations of the wake, which match the experiment. In general, however, both ALM models underestimate the oscillation amplitudes, and this phenomenon is more pronounced in the ALM-POLIMI model.
No significant differences were observed in the velocity oscillations along the vertical transverse at 3 D both for surge and pitch cases, showing that the velocity oscillations do not have a preferential direction.
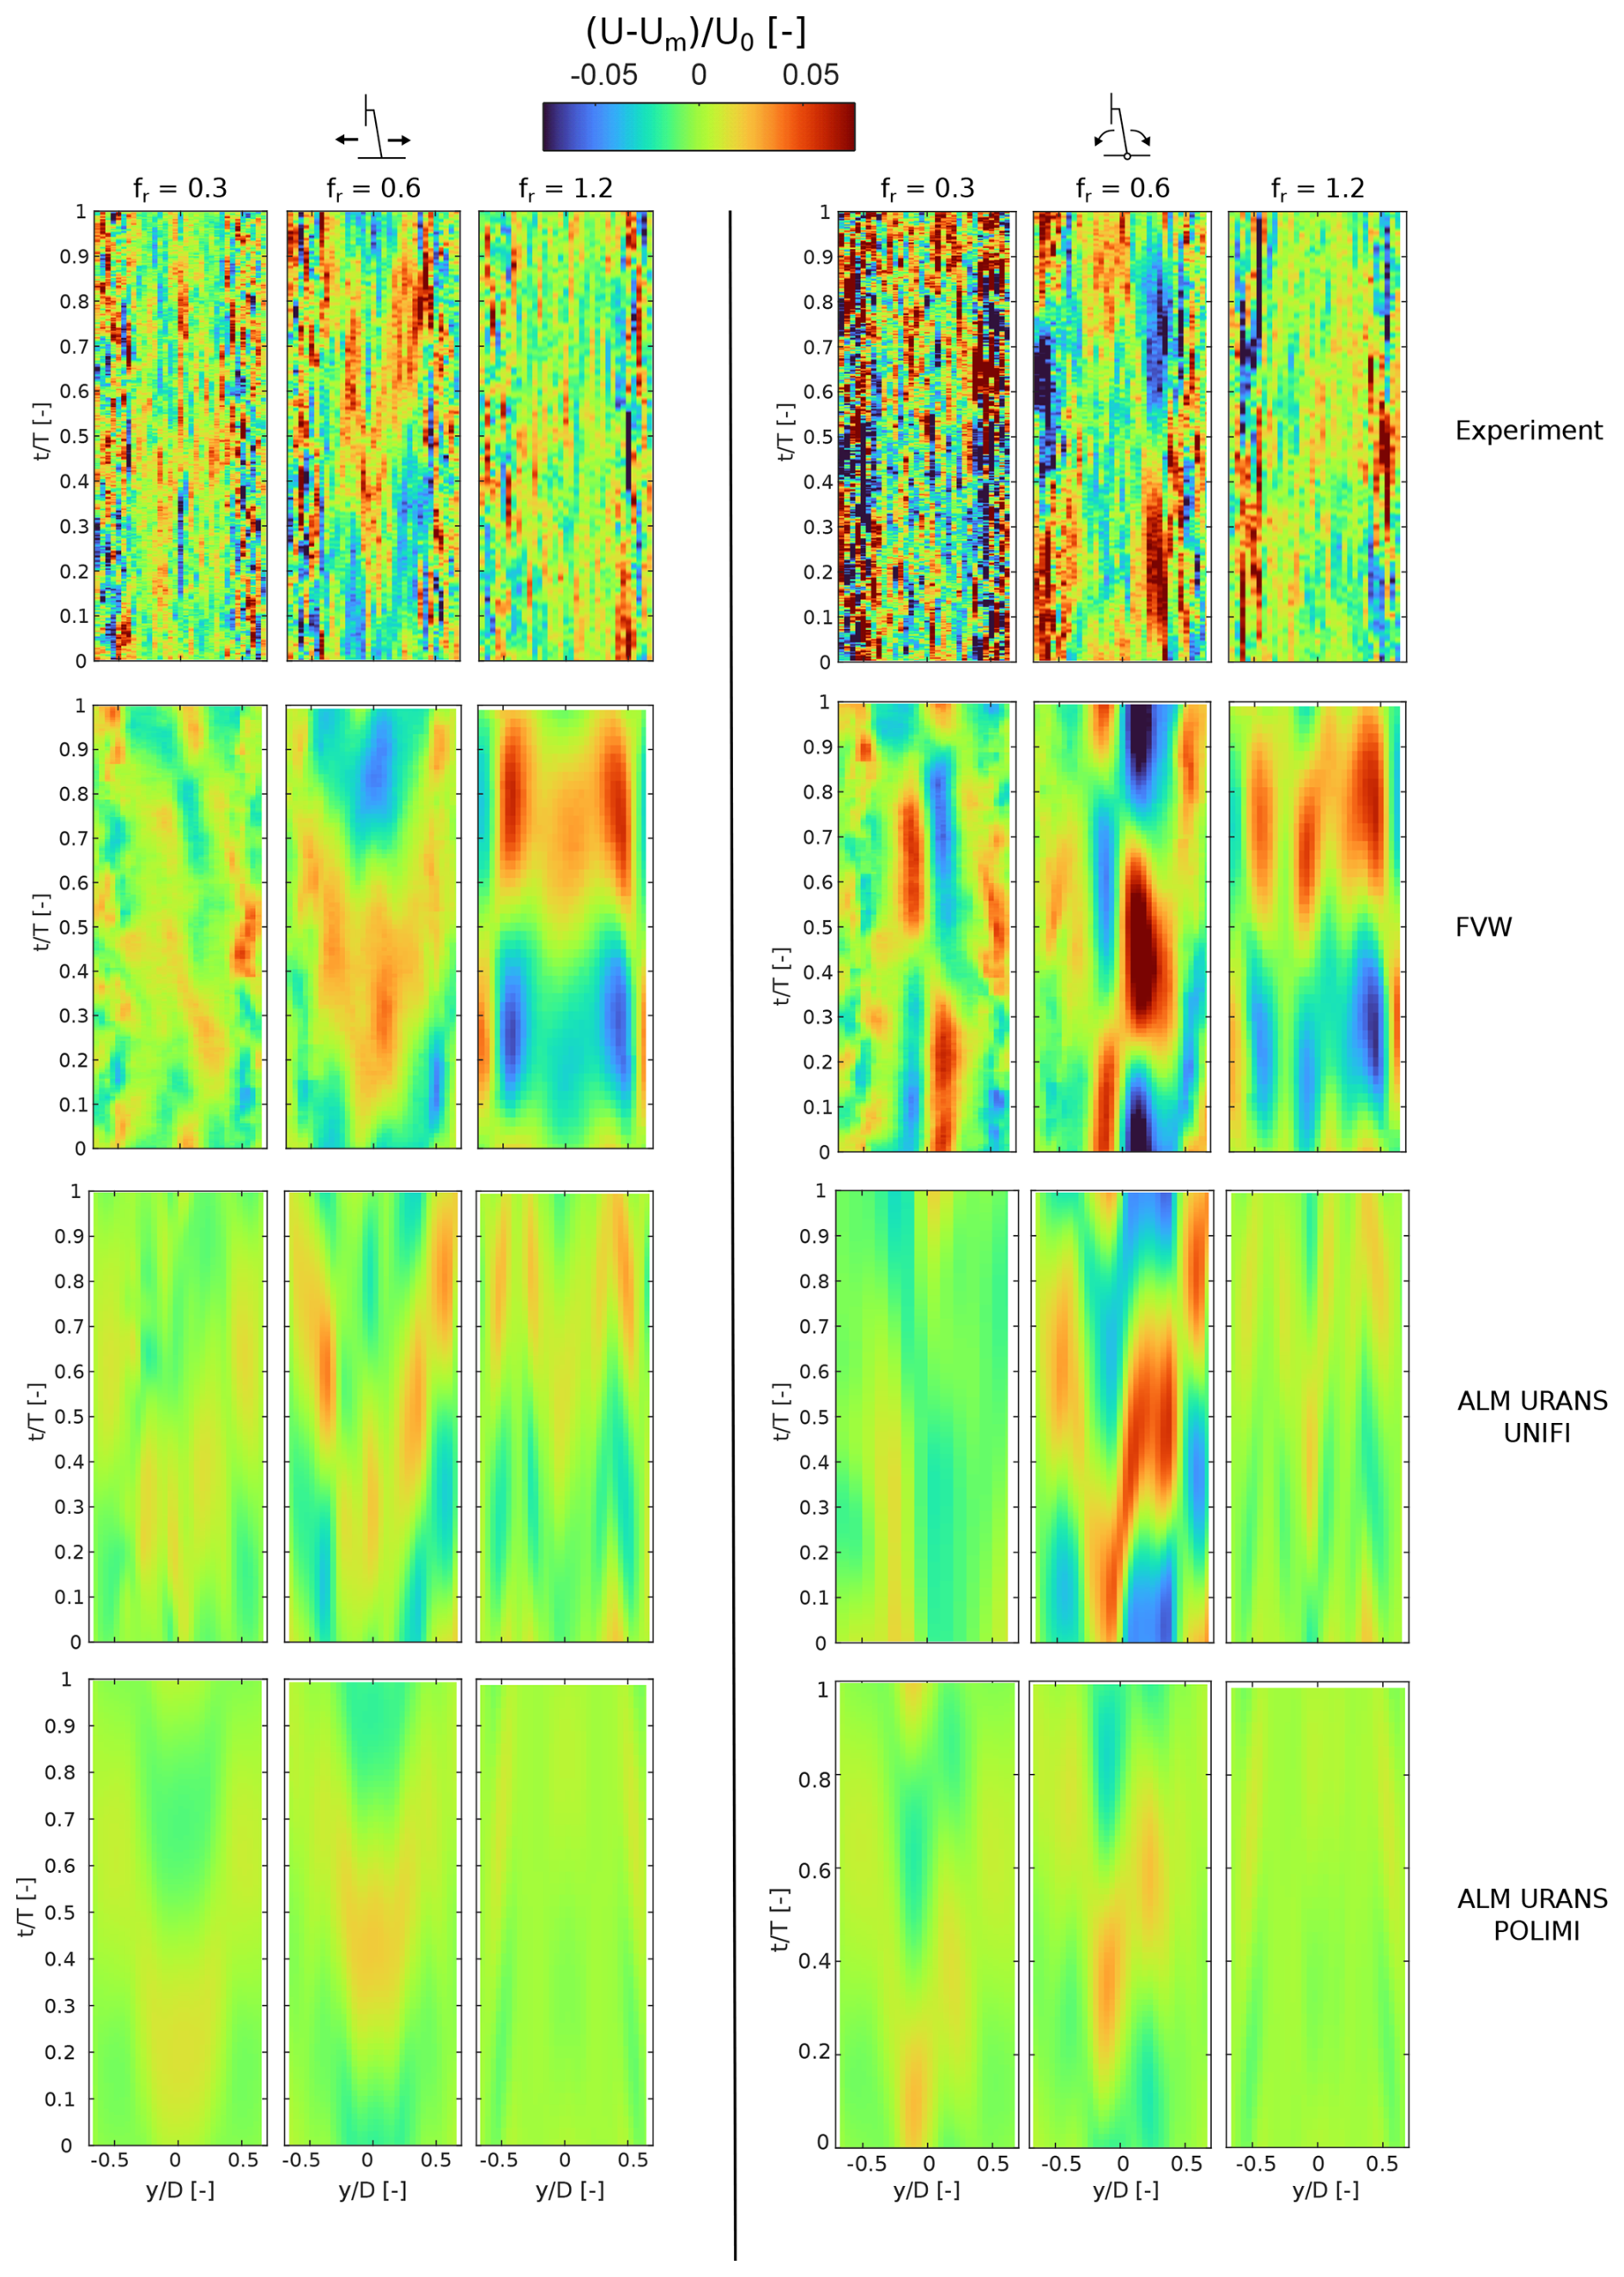
Figure 20Wake velocity oscillations along a horizontal traverse at 3 D from the rotor during a cycle of surge and pitch motion. Left column: surge motion (); right column: pitch motion (A=1.3°).
As the wake is convected downstream, also the velocity oscillations are propagated. The velocity oscillations in the wake could be amplified as they are convected downstream. For this reason, the wake response under pitch motion was investigated also at a distance of 5 D from the rotor.
The distribution of the velocity oscillations during a cycle of pitch motion provides further insight into the wake dynamics at 5 D from the rotor (Fig. 21). At low reduced frequencies (fr=0.3), both experiment and simulations show an amplification of the velocity oscillations with the distance from the rotor, as the right side of the wake shows a coherent pulsation of the wake at the frequency of platform motion. At high reduced frequency (fr=1.2), a substantial dissipation of the velocity oscillations is observed, as these are mainly present in the shear layer of the wake. At a reduced frequency of 0.6, the wake shows a synchronization to the motion frequency, as both experiments and simulations show an almost homogenous pulsation of the wake. However, the FVW and ALM URANS UNIFI results overestimate such oscillations, while the ALM URANS by POLIMI underestimates them, suggesting that the employed methodologies may struggle to capture the propagation of the velocity oscillations as they are convected downstream.
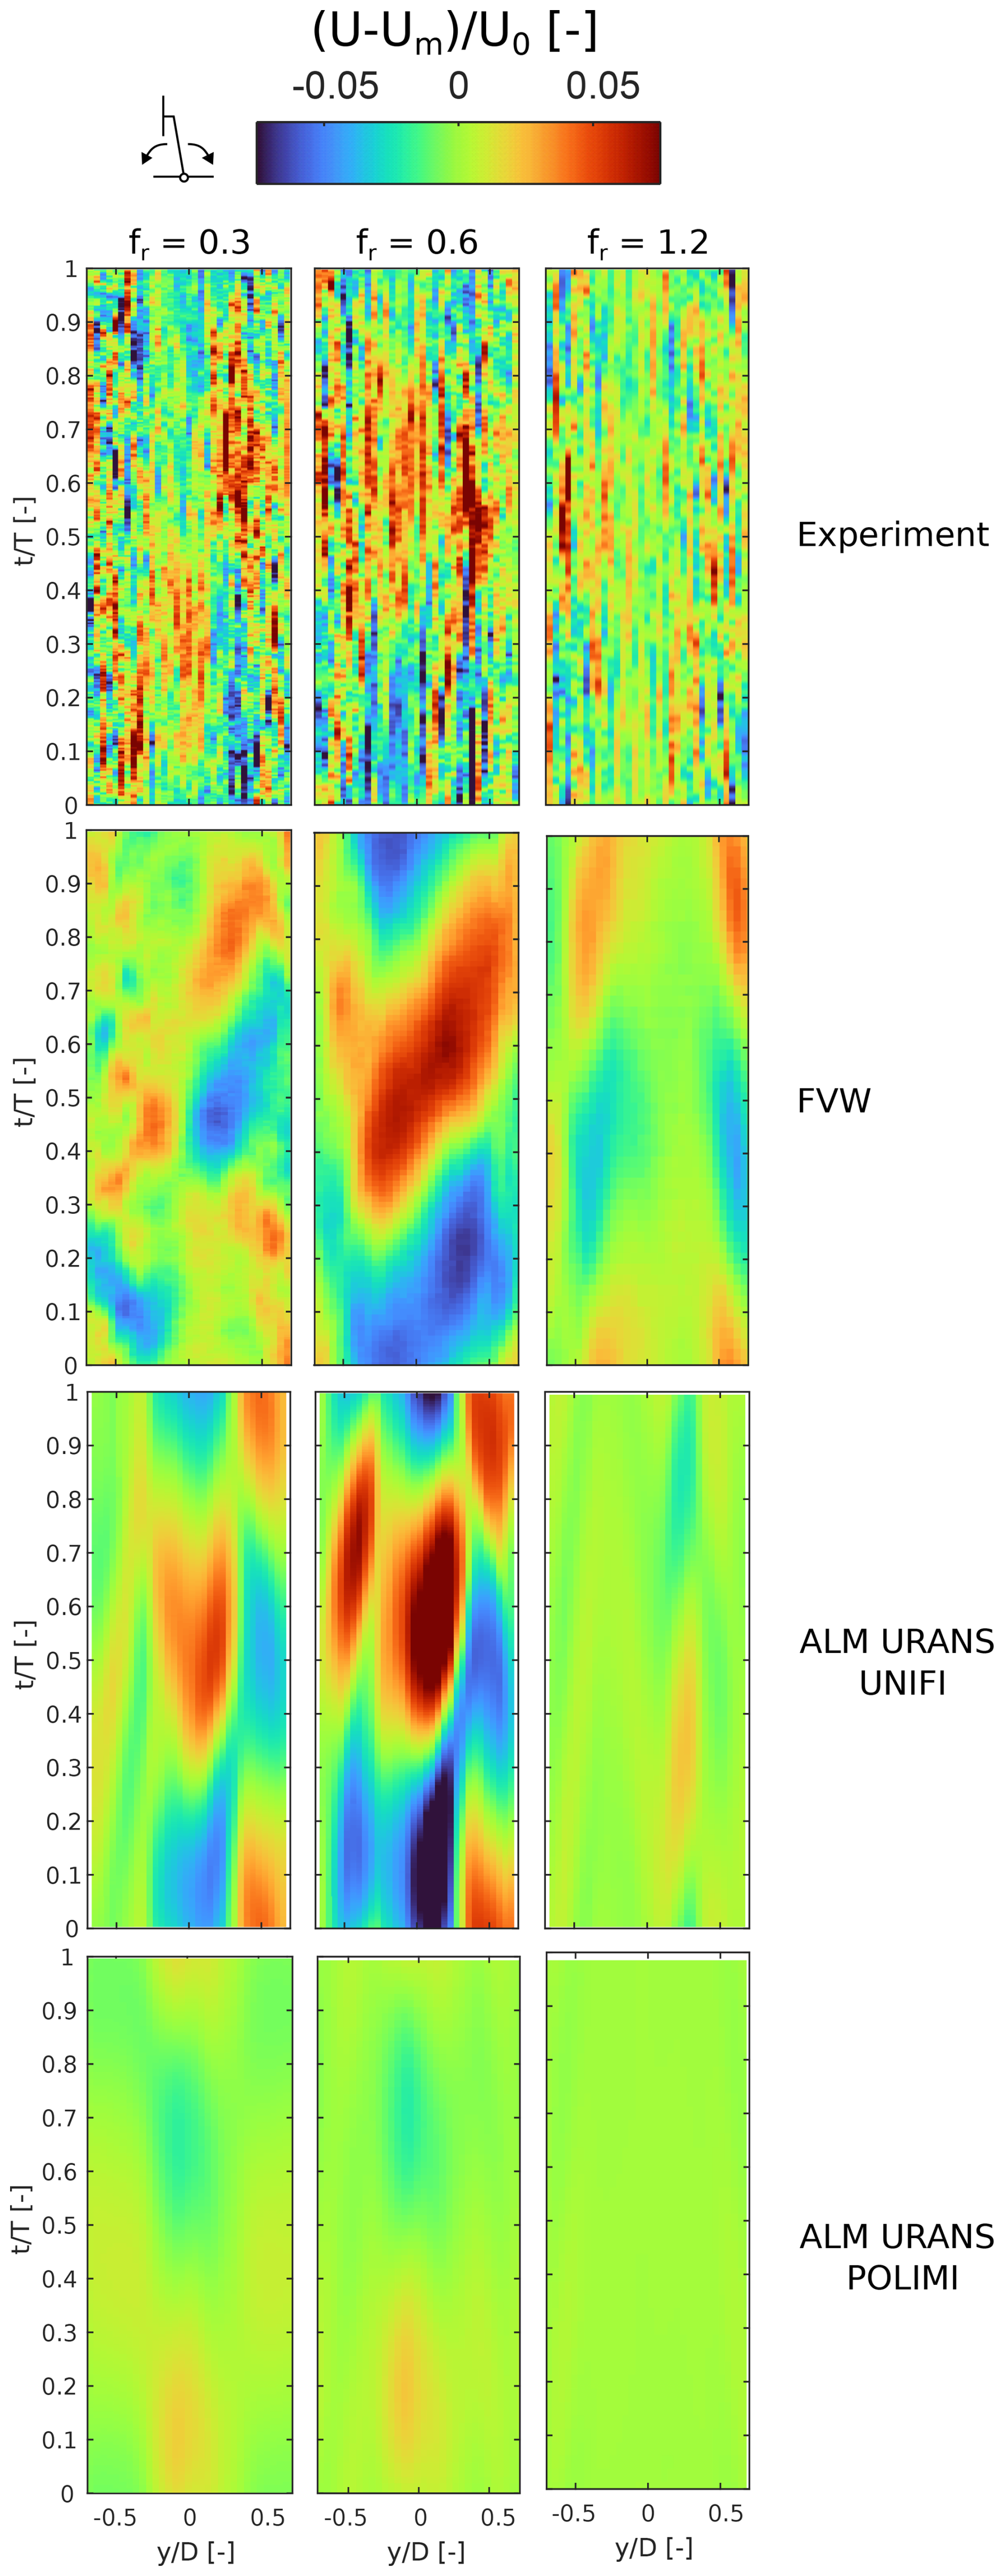
Figure 21Wake velocity oscillations along a horizontal traverse at 5 D from the rotor during a cycle of pitch motion.
The onset of velocity oscillations was also investigated for a yaw motion of the platform. The wake response as a function of platform motion frequency is similar to the one observed under surge and pitch motions, as the velocity oscillations are predominant at a reduced frequency of 0.6 and involve the whole wake, while at a reduced frequency of 1.2, only the shear layer shows significant velocity oscillations (Fig. 22). In addition, yaw motion affects the wake also at a reduced frequency of 0.3, showing significant velocity oscillations, mainly in the shear layer. The FVW model correctly captures the spatial distribution of the velocity oscillations; however, the intensity of the wake response is overestimated in comparison to the experiment. The ALM URANS shows better agreement with the experiment, especially at low and high reduced frequencies.
The velocity oscillations observed for a sinusoidal yaw motion of the turbine are caused by meandering of the wake, introduced by the periodic yaw oscillations of the wind turbine model. In fact, the main difference between surge or pitch motions and yaw oscillations concerns the different dynamics of the wake. For the former, the pitch and surge motion introduce periodic oscillations in rotor thrust, which consequently induce a pulsation of the wake; for the latter, the motion introduces periodic deflections of the wake in the side-to-side directions due to the yaw misalignment of the rotor. For this reason, the velocity oscillations under yaw motion are anti-symmetrical for the wake center, as the wake is deflected from left to right. Such differences can have a significantly different impact on downstream turbines. In fact, for a surge and pitch motion, the whole wake pulsates at the same frequency and phase, which could lead to significant oscillations in the rotor thrust and power. In contrast, for a yaw motion, the anti-symmetrical velocity oscillations induced by wake meandering might compensate over the whole rotor, resulting in smaller power oscillations. Nevertheless, significant load oscillations might be induced on both sides of the rotor, possibly increasing fatigue loading.
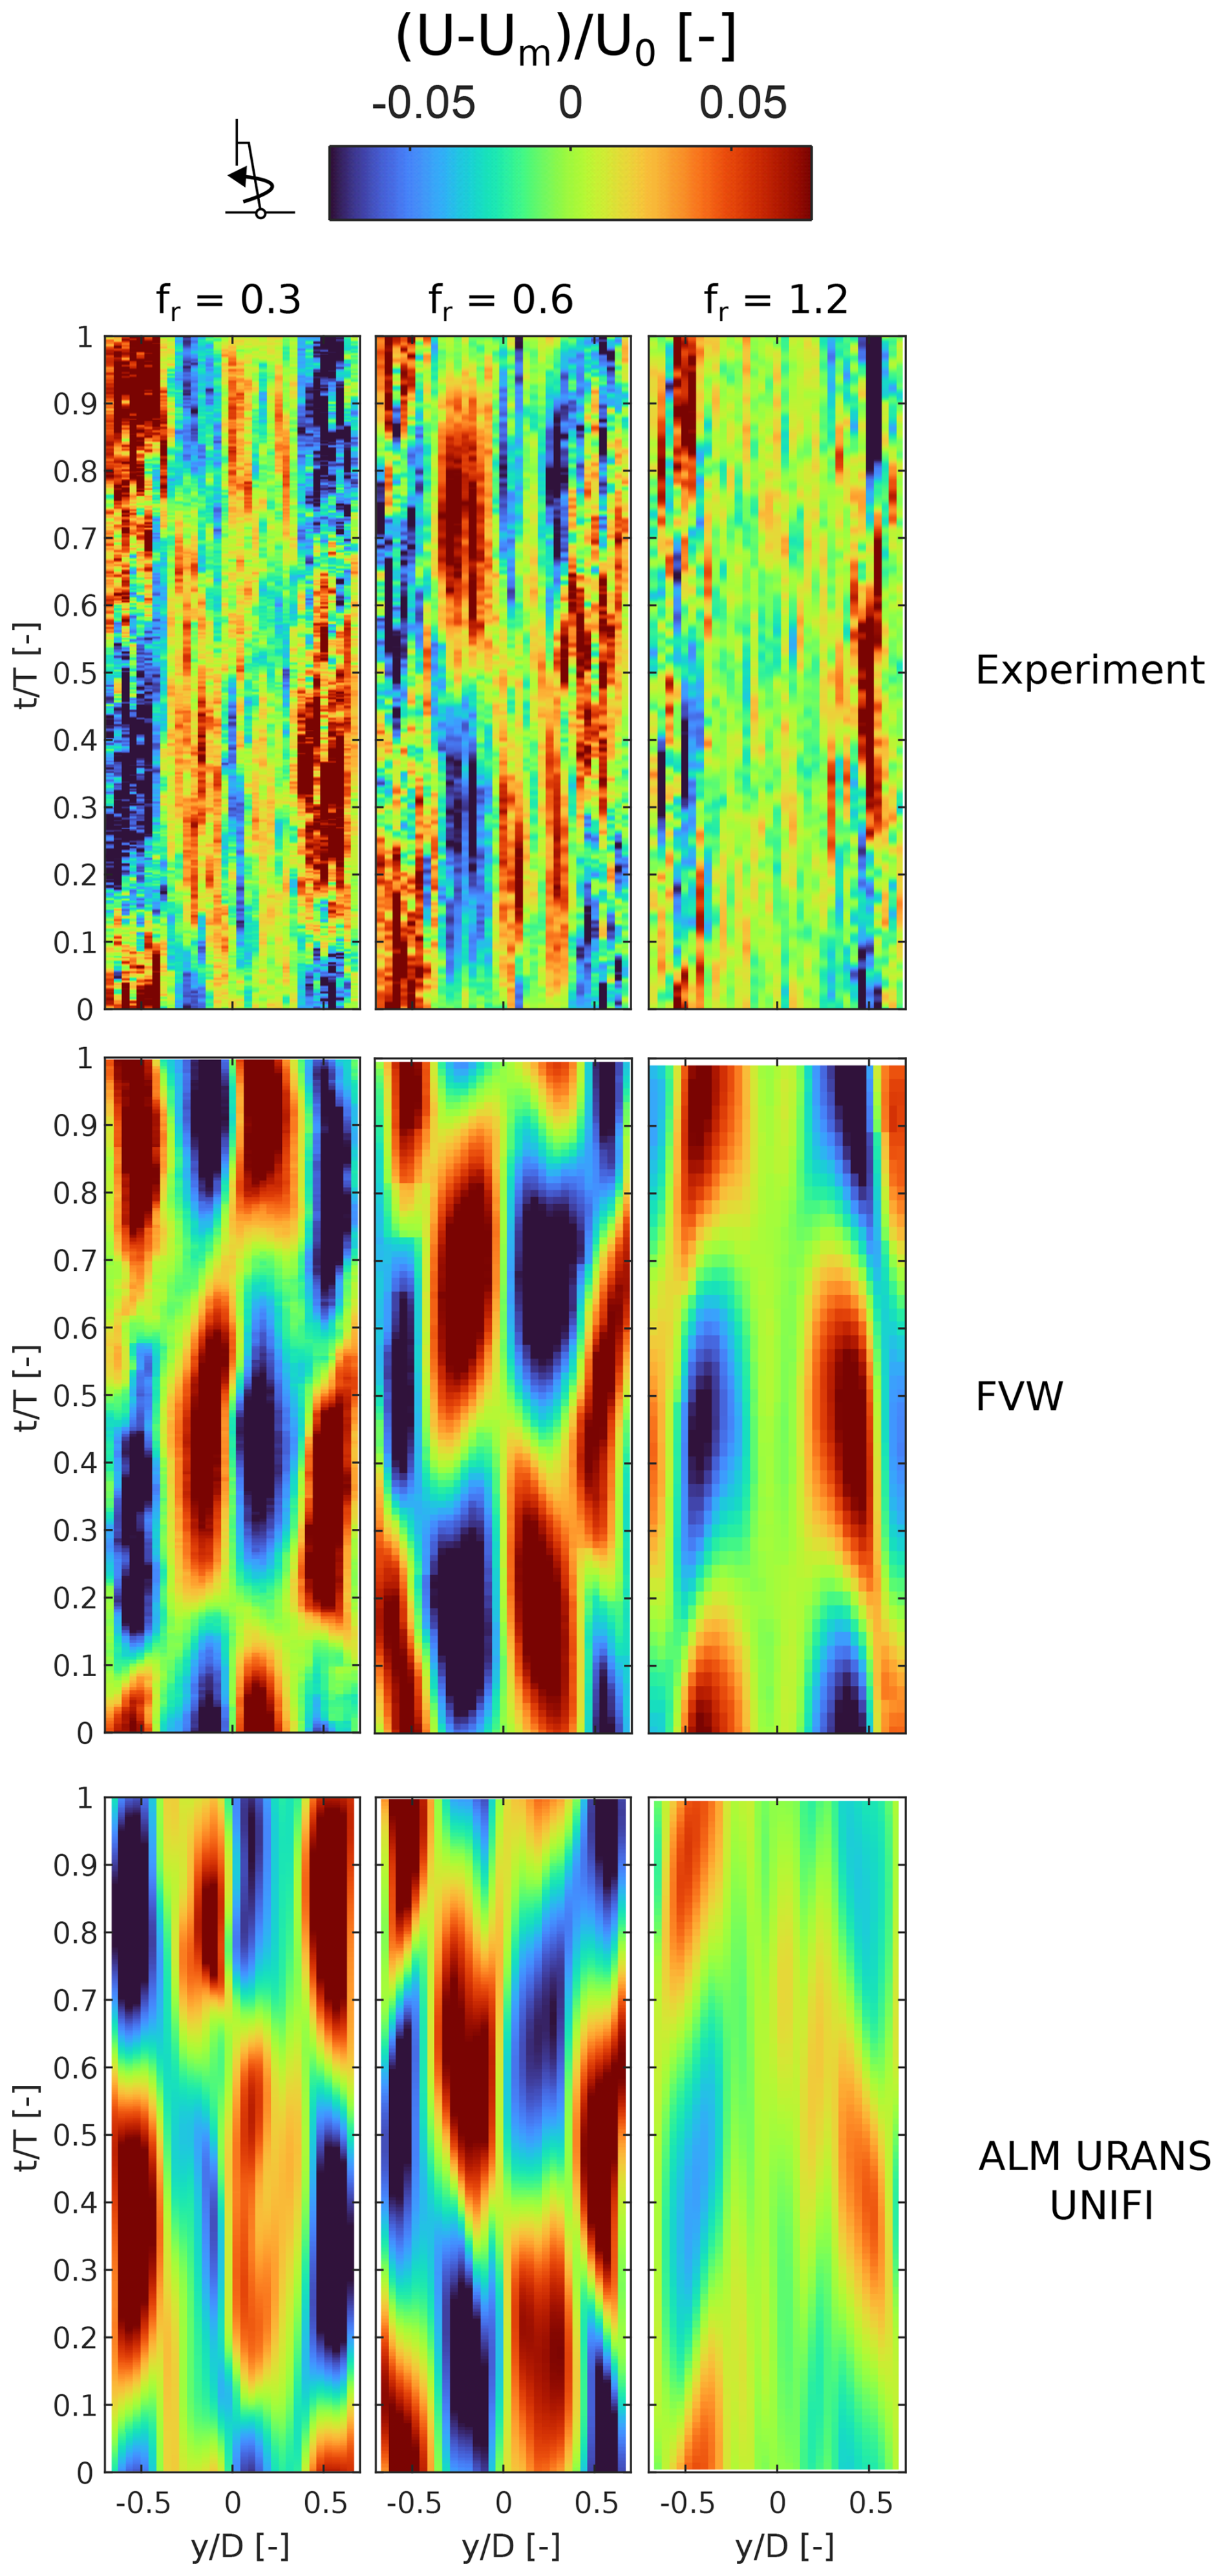
Figure 22Wake velocity oscillations along a horizontal traverse at 3 D from the rotor during a cycle of yaw motion. Results are shown for a constant motion amplitude A=2° and varying reduced frequency.
The wake response under yaw motion was also investigated at a distance of 5 D from the rotor to understand how the deflection of the wake is propagated downstream (Fig. 23). The analysis was performed for a single yaw motion case at fr=0.6 and A=2°. In the experiment, the velocity oscillations are not dissipated with increasing distance from the rotor. However, the oscillations are no longer anti-symmetrical with respect to the center of the wake, contrary to what was observed at 3 D. This shows how the wake dynamics are modified as the wake is convected downstream. At 3 D, the wake oscillates in the crosswind direction, while at 5 D, the wake pulsates at the frequency of motion, and the entirety of the wake shows homogenous velocity oscillations. The FVW simulations do not show a similar behavior, and the velocity oscillations are anti-symmetrical, similarly to what was observed at a distance of 3 D. The limitation of this approach might lead to the inaccurate prediction of rotor loading on downstream machines. The ALM URANS approach does not show a fully anti-symmetrical velocity oscillation pattern as is the case of the FVW method; however, the pulsation of the wake is also not as uniform as in the experiments. In this regard, the transition to a uniform pulsation may be predicted further downstream in the ALM URANS simulations. Near to the far wake, transition and recovery are, in fact, generally delayed in the ALM URANS simulations if compared to experiments (Fig. 14).
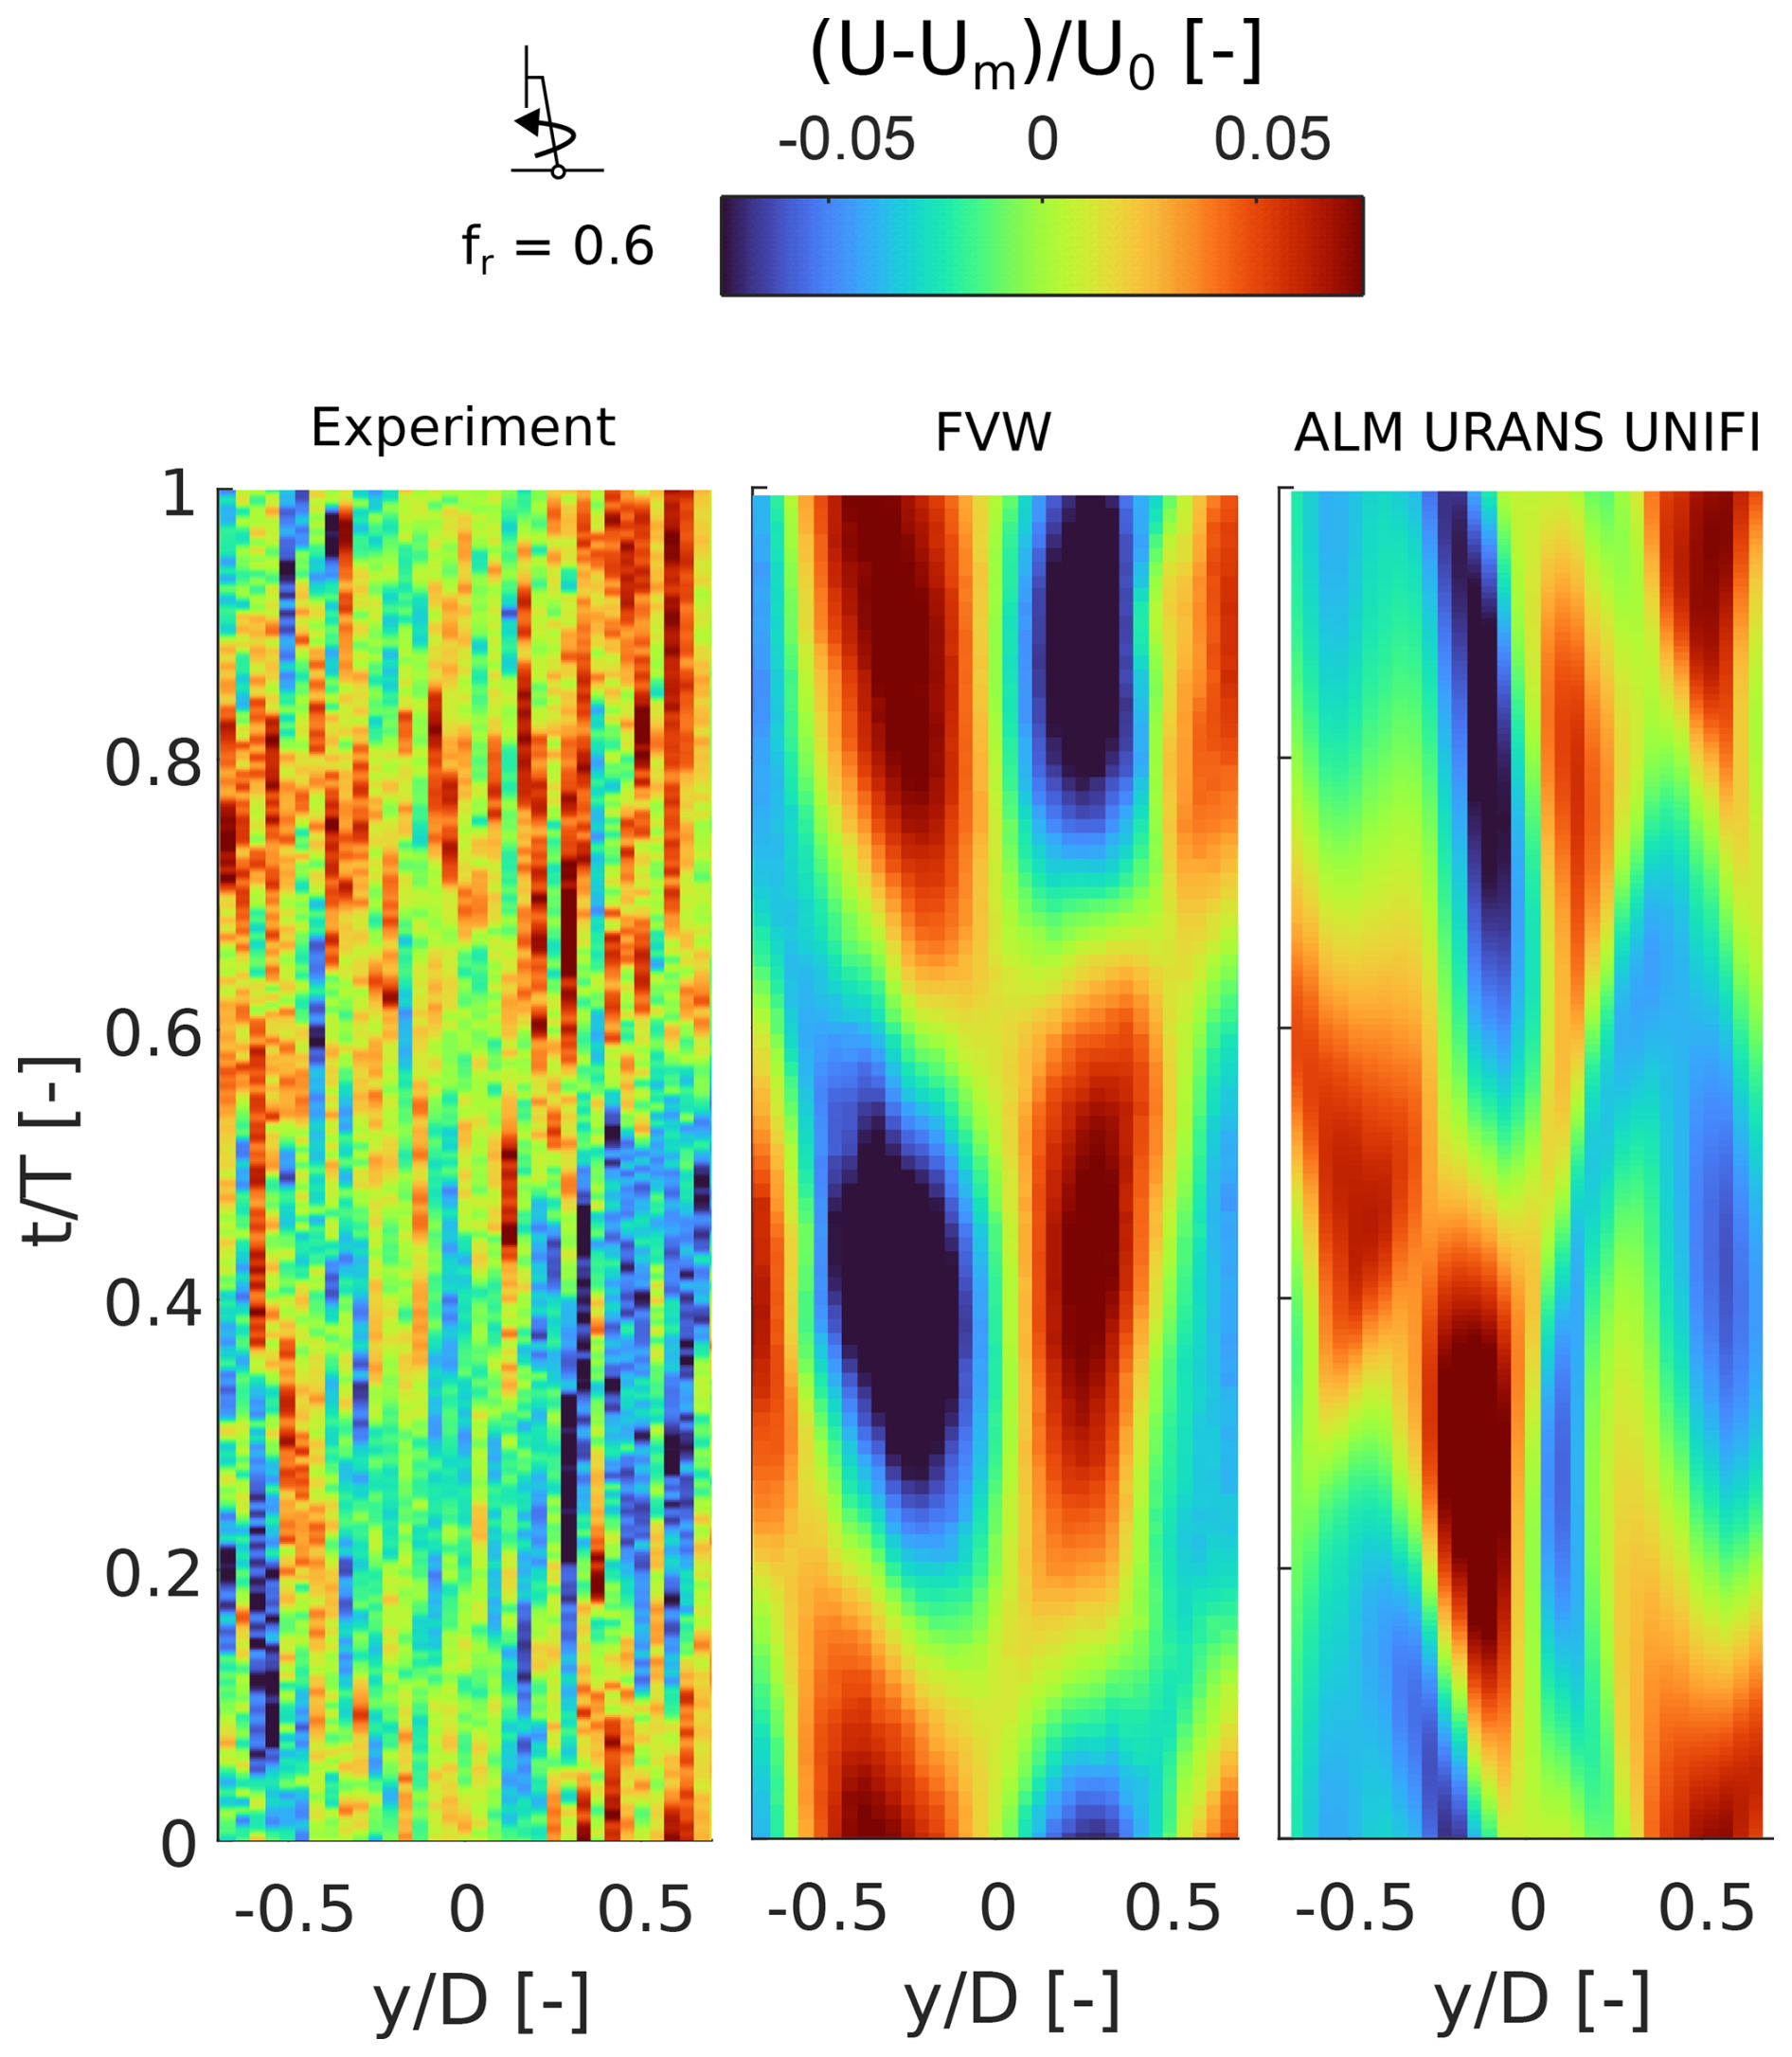
Figure 23Wake velocity oscillations along a horizontal traverse at 5 D from the rotor during a cycle of yaw motion, with an amplitude of 2° and fr=0.6.
The different wake dynamics between the FVW and ALM URANS simulations can be observed from the distribution of the turbulent intensity in the wake (Fig. 24). Until a distance of about 1 D, the numerical methods show a similar wake response. However, as the vortex structures in the wake break down, the FVW method shows a significantly different turbulent intensity distribution than the ALM URANS simulation. In the latter, the wake shear layer pulsates at the frequency of platform motion. Such oscillations are amplified until they lead to a uniform oscillation of the whole wake at about 5 D.
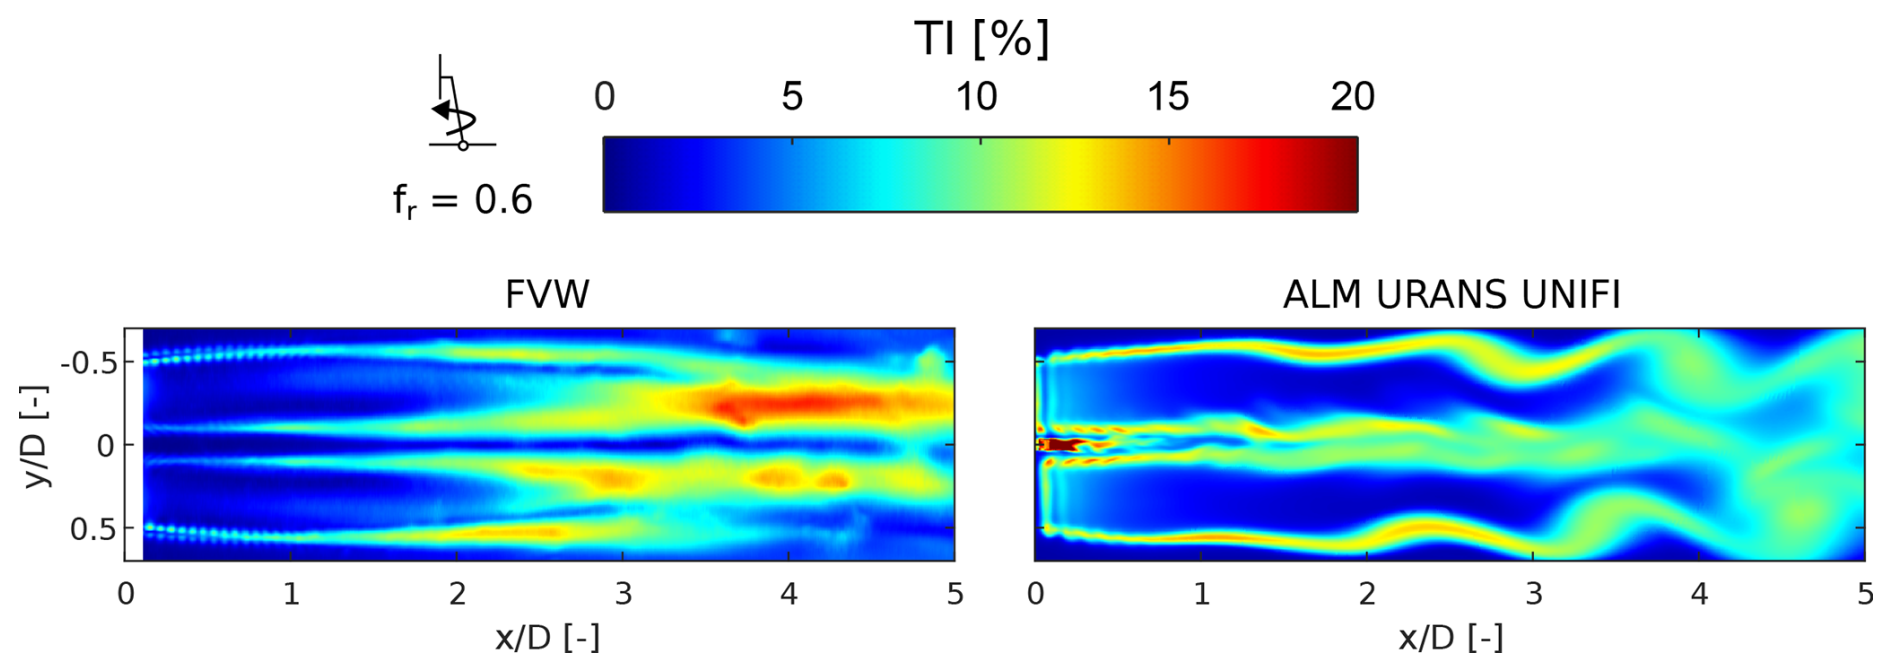
Figure 24Turbulent intensity distribution under sinusoidal yaw motion of the rotor at a reduced frequency of 0.6.
In the cases of wind–wave misalignment, platform motion causes an additional side-to-side displacement of the turbine, which could lead to significant oscillations in the wake. For example, the velocity oscillations at 3 D downstream are shown for , a reduced frequency of 0.6, and a misalignment of 45° in Fig. 25.
The introduction of the wind–wave misalignment leads to an increase in the velocity oscillations in the wake in comparison to the aligned surge cases (Fig. 25). In addition, velocity oscillations are anti-symmetric with respect to the wake center, suggesting that the main driver of velocity oscillations is wake meandering (i.e., side-to-side motion of the wake) rather than pulsation of the wake due to periodic oscillations in rotor thrust. In these operating conditions (, fr=0.6 and γ=45°), further differences are observed between the experiment and simulations, in comparison to the surge cases. In particular, the velocity oscillations in the wake obtained from FVW and ALM URANS simulations do not show a similar pattern to the experiment. This result might indicate that numerical methods may struggle to capture a side-by-side motion of the wake caused by a significant misalignment angle between the wind and platform motion direction.
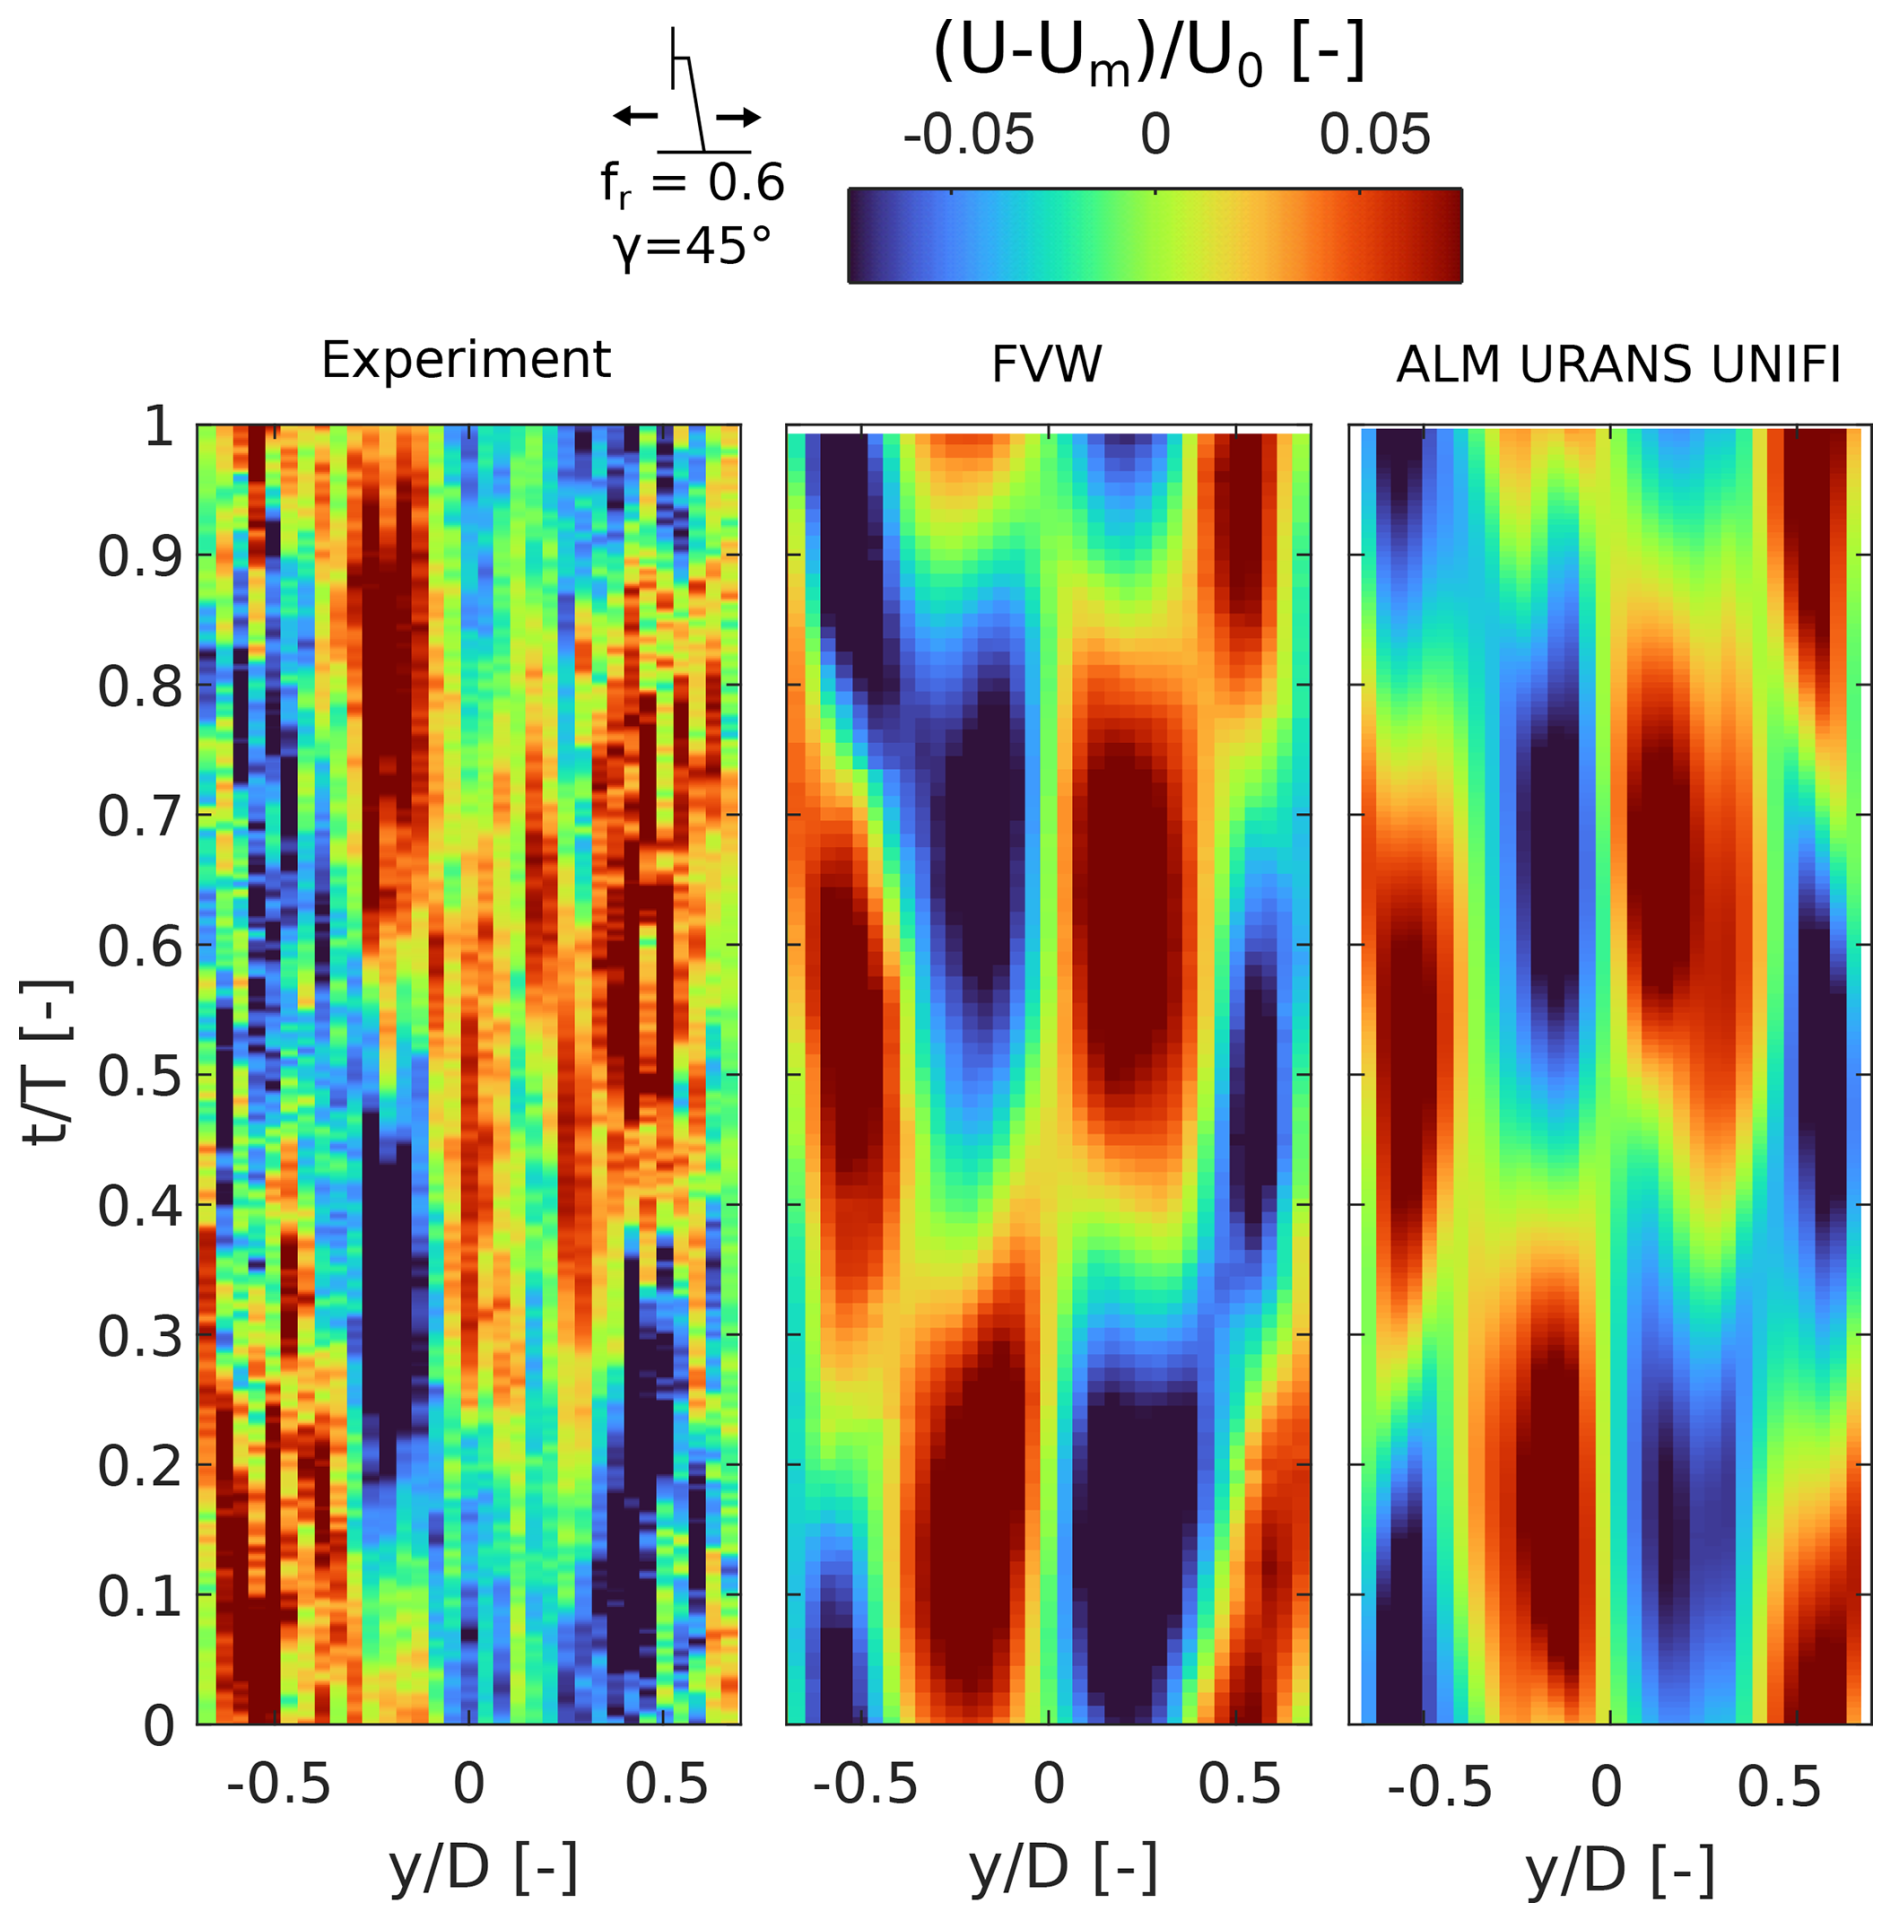
Figure 25Wake velocity oscillations along a horizontal traverse at 3 D from the rotor during a cycle of surge motion at a normalized amplitude of 0.0134, a constant reduced frequency of 0.6, and a misalignment of 45°.
More differences between the numerical methods are observed at a distance of 5 D from the rotor (Fig. 26). In this case, the experiment shows distinct velocity oscillations induced by the motion, but their intensity is reduced in comparison to those recorded at 3 D. The FVW simulation shows instead a significant intensity of the wake velocity oscillations, and only the ALM URANS shows a similar reduction to the experiment. This result suggests that the FVW method can capture the onset of the velocity oscillations in these conditions only close to the rotor, but the dissipation of these oscillations is better predicted by high-fidelity models, such as ALM URANS CFD.
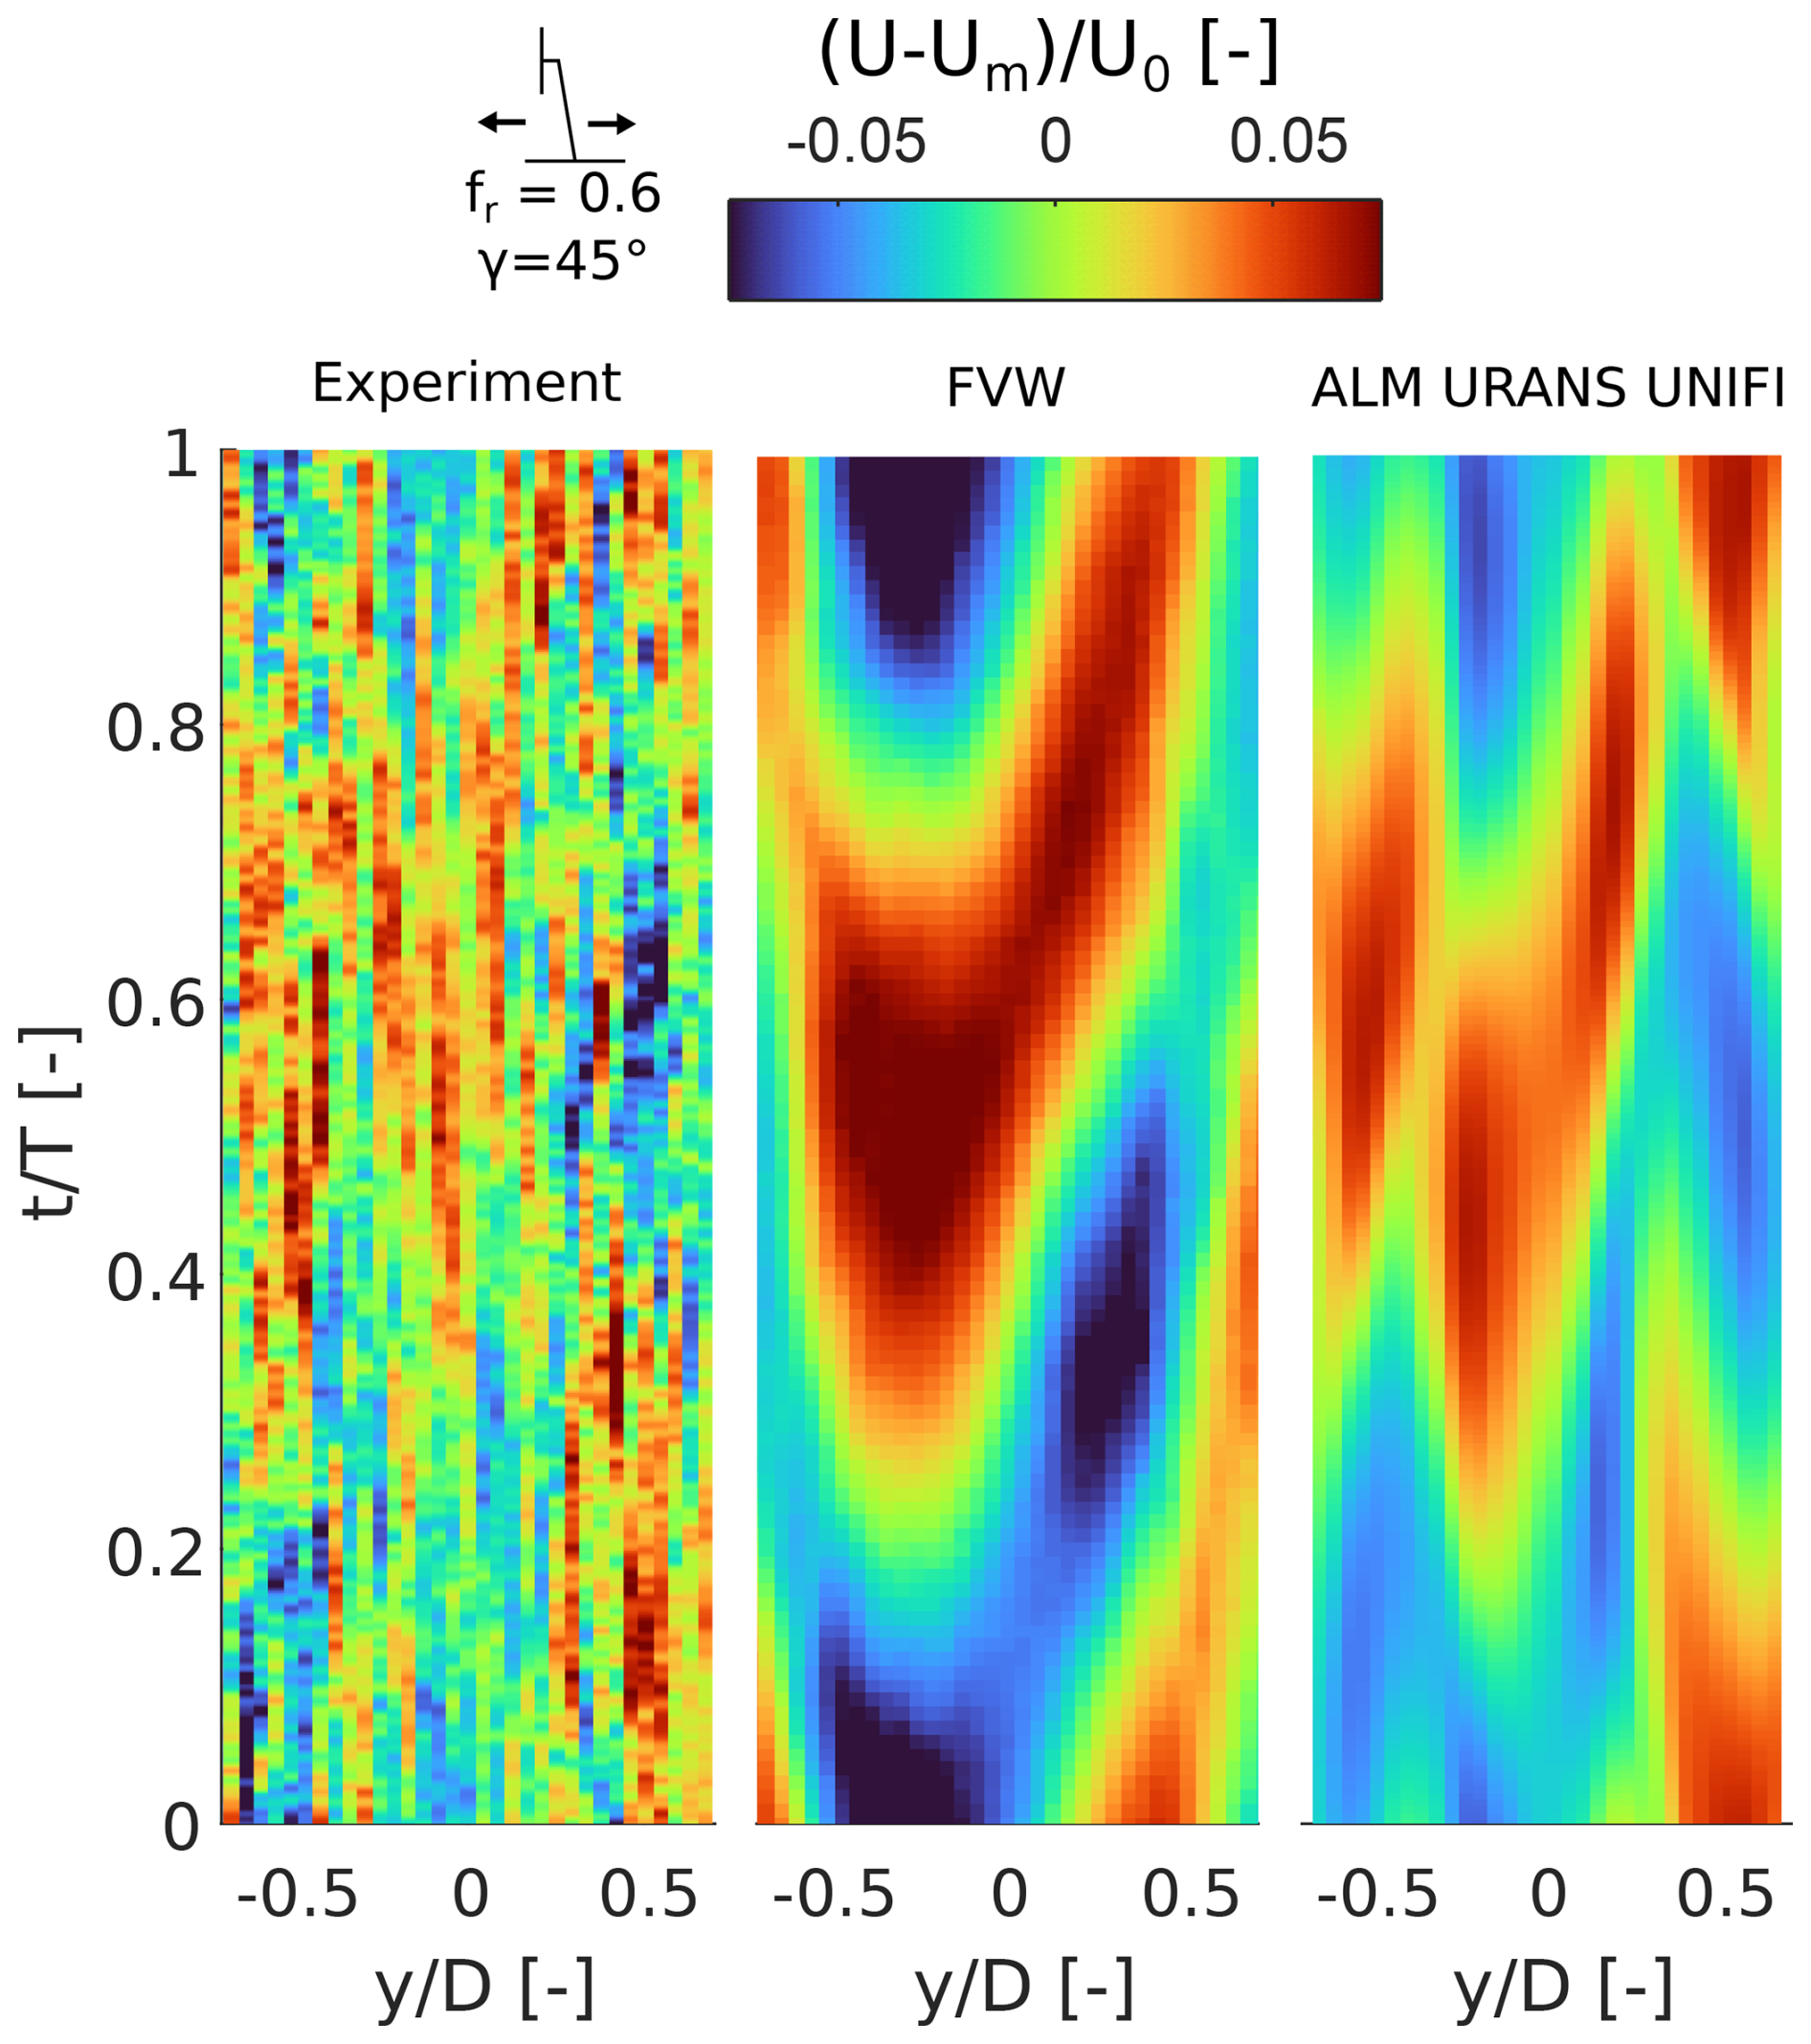
Figure 26Wake velocity oscillations along a horizontal traverse at 5 D from the rotor during a cycle of surge motion at a normalized amplitude of 0.0134, a constant reduced frequency of 0.6, and a constant misalignment angle of 45°.
5.3 Wake vortex structures
In Sect. 5.2, it was observed that the wake shows a different dynamic response with varying reduced frequency and type of motion. To improve the current understanding of wake dynamics of a floating wind turbine, the vortex structures in the wake were investigated, leveraging the additional data provided by the FVW and ALM URANS simulations. In fact, the numerical methods allow the analysis of a full 2 D slice of the wake, which would require complex measurement techniques in the experiment, such as particle image velocimetry (PIV).
The analysis of 2 D velocity fields can be used to investigate the formation of coherent vortical structures, which are responsible for the breakdown and recovery in the wake. Multiple methods have been proposed in the literature to investigate vortex structures; however, the Q-criterion is used in this work as it allows the distinction between vortex structures and wake shear layers.
Figure 27 show the vortex structures in the wake of the wind turbine model under imposed surge motion () and for varying reduced frequencies, obtained from the FVW and ALM URANS simulations, respectively. In the fixed-bottom configuration, the tip and root vortices are the main structures in the wake. The tip vortices form a stable helical structure which is convected downstream in the wake. Both in the FVW and ALM URANS simulation, the tip vortices interact and merge after about 1 D from the rotor, collapsing into complex vortex structures. As the distance from the rotor increases, the FVW simulation still shows strong vortex structures in the shear layer of the wake, which are dissipated in the ALM URANS method. In fact, the FVW method models the convection of the vortex filaments and their breakdown, while the ALM URANS solves their interaction and dissipation. This represents one of the limits of the FVW method, when investigating the far-wake behavior of a wind turbine.
The FVW and ALM URANS simulations also show significant differences at the center of the wake. In fact, in the FVW simulations, the root vortices form a stable helix in the inner part of the wake, and they interact and collapse only after about 1 D. In contrast, in the ALM URANS simulation, the root vortices are stretched and deformed very close to the rotor, possibly due to the interaction with the nacelle and tower shear layer. Such deformation leads to a significantly faster breakdown of the root vortices, which merge together after about 0.5 D from the rotor. This difference might be responsible of the improved transition in the ALM URANS results in comparison to the FVW method in Sect. 5.1.
The impact of surge motion on the wake was evaluated by investigating the impact on the wake vortex structures. At low reduced frequency (fr=0.3), the imposed surge motion has a minor impact on both root and tip vortices. In fact, in Sect. 5.1 and 5.2, only minor differences were observed in the wake dynamics. At a higher reduced frequency (fr=0.6), both FVW and URANS ALM results show a pulsation of the vortex structures at the frequency of platform motion, as the tip vortices merge together forming larger and less intense periodic vortex structures. Nevertheless, the tip vortices collapse at a similar distance from the rotor as the fixed-bottom case. This might explain why no significant difference is observed in average free-stream velocities in the wake. In fact, wake recovery is connected to the breakdown of the helixes formed by the tip vortices, which leads to improved mixing with the free-stream flow. In contrast, minor differences are observed in the root vortices. In the FVW simulations, no clear difference is observed in comparison to the fixed-bottom case. Instead, in the URANS ALM results, the root vortices show a small pulsation at the frequency of motion after about 3 D, even though such vortex structures are weaker than those formed by the tip vortices.
At the highest reduced frequency, the tip vortices merge into large coherent structures shed at the frequency of platform motion, similarly to what was observed at fr=0.6. However, such vortex structures are smaller and more intense than those observed at lower reduced frequency. This might explain the differences observed in velocity oscillations in Sect. 5.2. In fact, at fr=0.6, the larger vortex structures may cause pulsation of the wake both in the shear layer and inner part of the wake, while at fr=1.2, the smaller size of these coherent structures only leads to significant pulsation in the outer section of the wake.
Another difference in the wake dynamics when the reduced frequency is increased from 0.6 to 1.2 concerns the dissipation of these larger vortex structures. In fact, in the ALM URANS results, at fr=1.2, these vortical structures are formed closer to the rotor, but they are also dissipated faster, which is not observed in the FVW results. Such a difference, which might be linked to the limitations of the FVW method to capture vortex breakdown and its interaction with free-stream turbulence, might explain the differences observed in terms of velocity oscillations. In fact, the FVW approach overpredicts the entity of velocity oscillations in comparison to the experiment and the ALM URANS results at a distance of 3 D from the rotor.
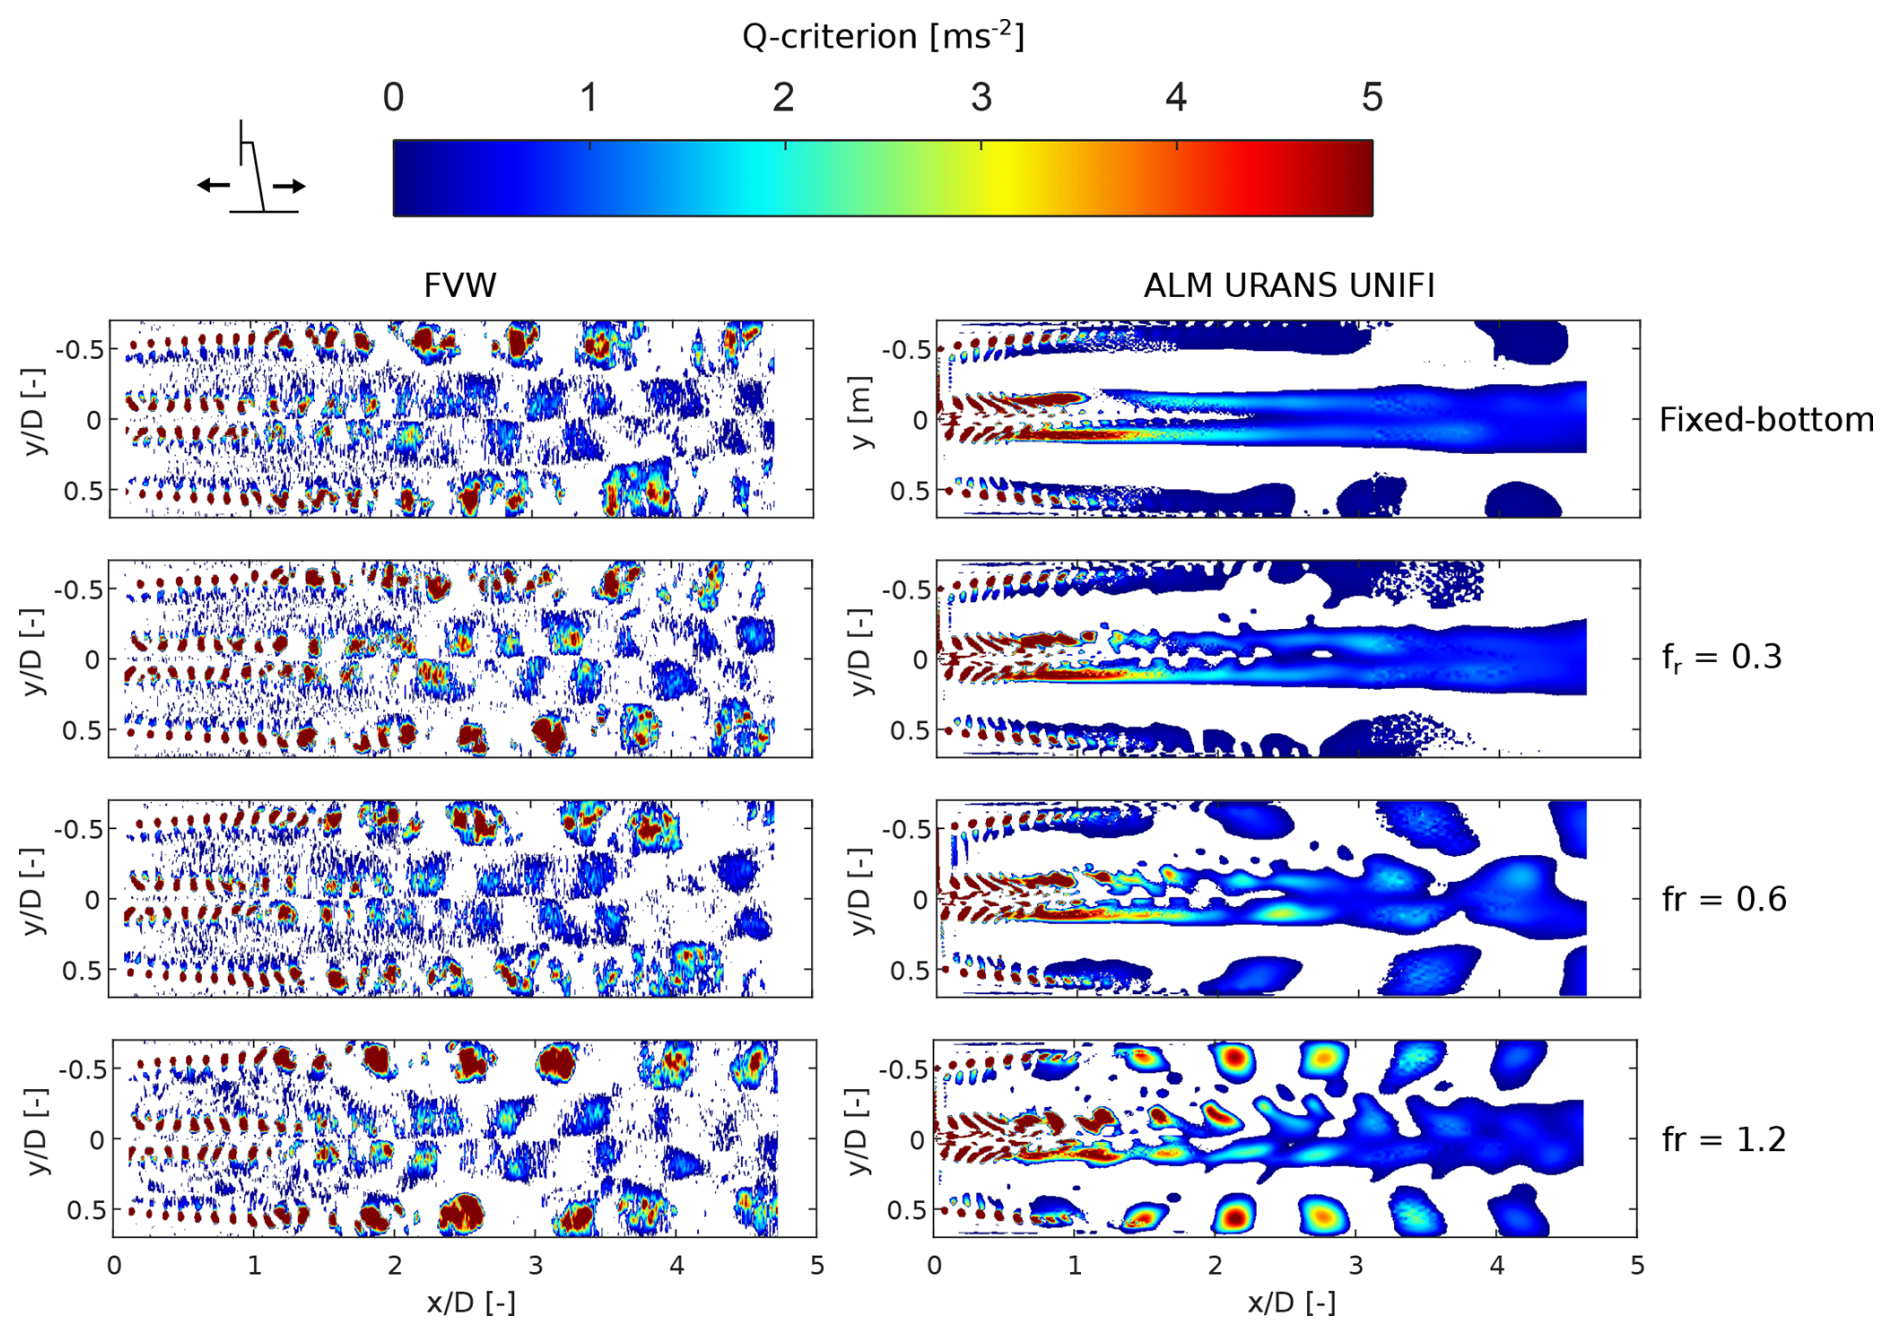
Figure 27Vortex structures in the wake of the wind turbine model under varying frequencies of surge motion and a constant normalized amplitude of 0.0134. Results obtained from FVW and CFD ALM URANS simulations performed by UNIFI.
The capabilities of FVW and ALM URANS simulations to capture the vortex structures in the wake of a floating wind turbine was evaluated by comparing the results with the vortex structures observed from ALM LESs (Pagamonci et al., 2025). The results are shown in Fig. 28 for a pitch motion of the platform (A=1.3° and fr=0.6). The main differences between the different numerical methodologies concern the breakdown of the wake. The LES shows the breakdown of the largest structures into smaller scales, which is not shown in the URANS or FVW simulations. The large coherent structures observed in the URANS simulations are also not easily identifiable in the LES results, as multiple smaller structures can be observed as the wake breaks down. Nevertheless, the wake starts to pulsate as the vortex structures formed from the tip vortices start to interact with the tip vortices and breaking down, similarly to the URANS results. This result suggests that ALM URANS simulations may predict some of the main dynamics of the wake of a floating wind turbine but might overestimate the strength of the coherence structures which are formed due to platform motion.
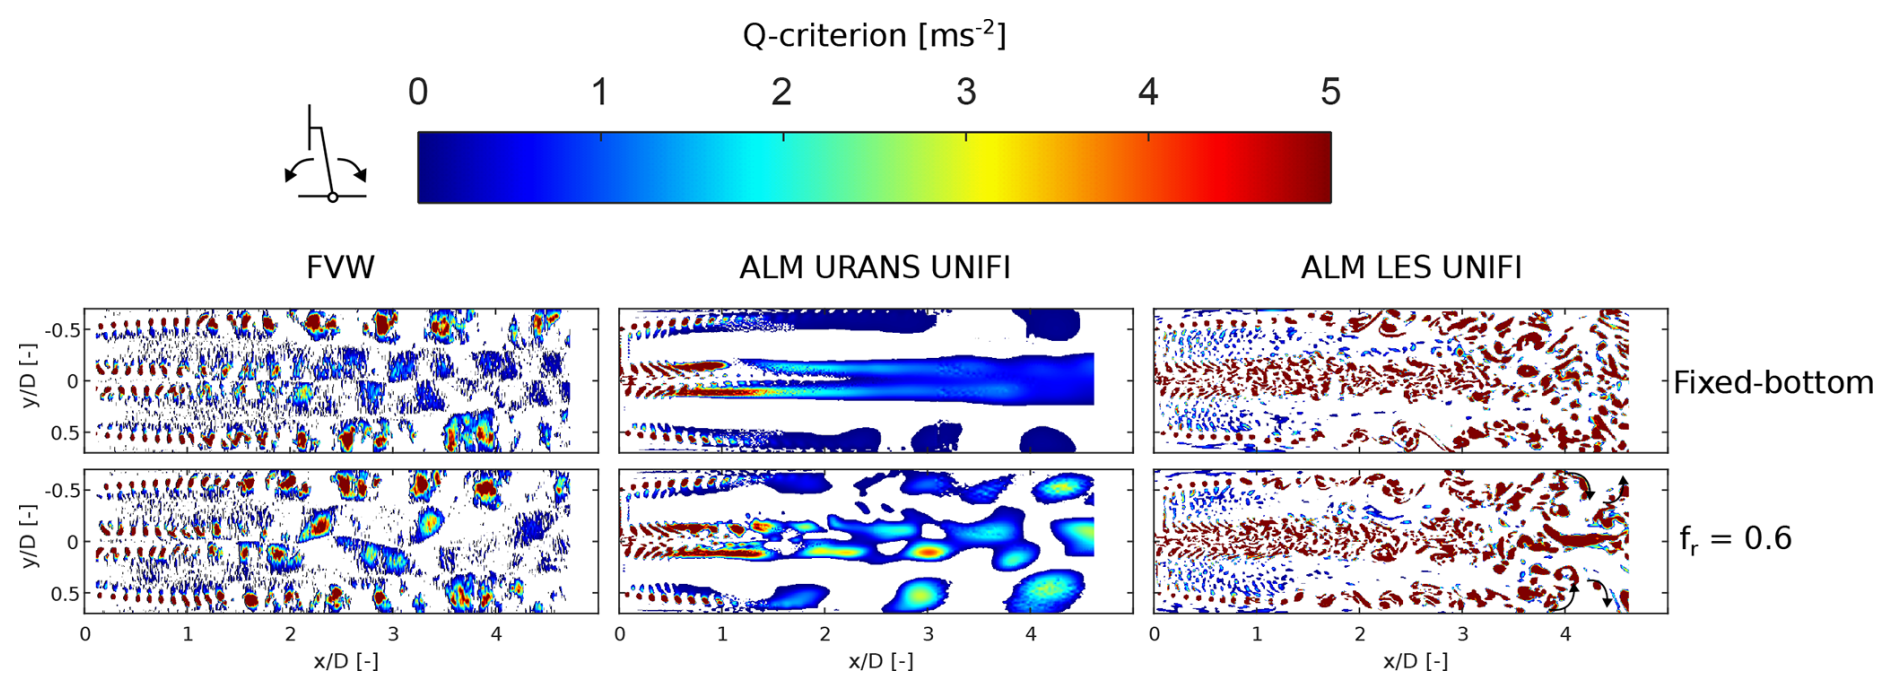
Figure 28Vortex structures in the wake of the model wind turbine in fixed-bottom conditions and under sinusoidal pitch motion (A=1.3° and fr=0.6). Arrows highlight the pulsation of the wake in the LES results.
The impact of yaw motion on the vortex structures was also investigated, as under such platform motion conditions, significant velocity oscillations were observed in Sect. 5.2. Figure 29 shows the vortex structures in the wake for the FVW and ALM URANS simulation. Results are shown for a single platform motion frequency of 0.6 and a constant amplitude of A=2°, as the wake shows similar responses to changes in platform motion frequency to those observed for surge motion.
For a yaw motion of the platform, the FVW methods show the onset of significant vortex structures at the edges of the wake, due to the merging of the tip vortices. These vortex structures are alternating on the two sides of the wake, leading to an anti-symmetrical configuration. The root vortices are also merged into larger structures, even though their strength is significantly smaller. The ALM URANS show similar results until about 2–3 D from the rotor. Large coherent structures are formed both in the inner and outer part of the wake, with a similar anti-symmetrical distribution. However, differences arise with increasing distance from the rotor. The ALM URANS results show that the coherent structures at the edge of the wake become larger as they are convected downstream, until they affect the root vortices, leading to a pulsation of the whole wake. A similar behavior was observed from the analysis of the velocity oscillations in the experimental results (see Sect. 5.2), showing how the ALM URANS can better predict the wake dynamics in comparison to the FVW method. Additionally, there are significant differences between the FVW and ALM URANS simulations in the dissipation of the above-mentioned vortex structures, which could explain the overestimation of the velocity oscillations by the former methodology observed in Sect. 5.2.
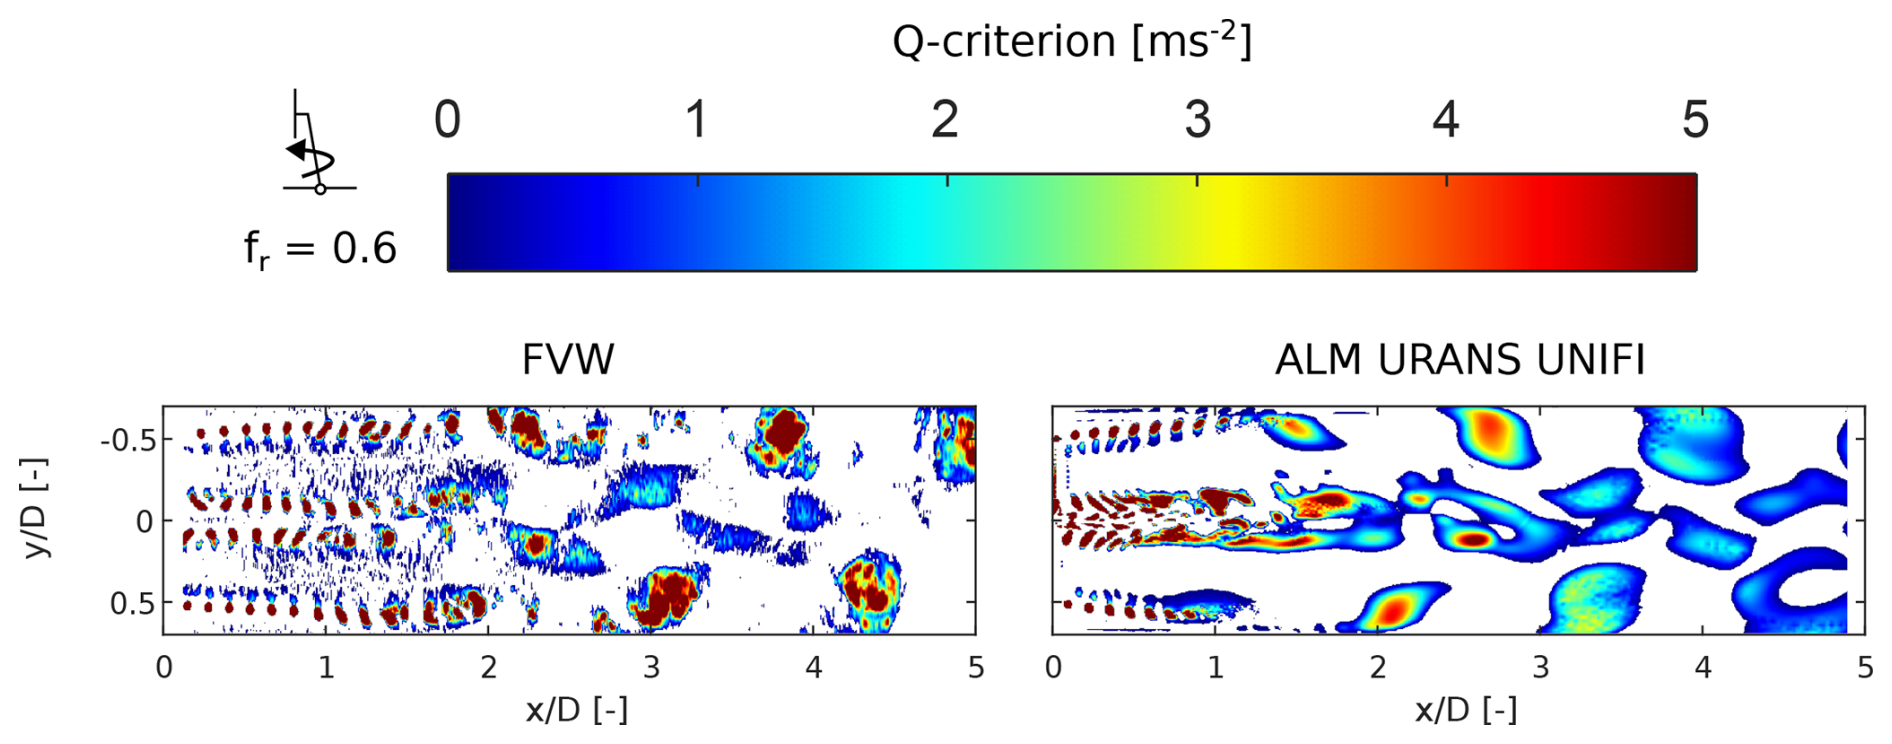
Figure 29Vortex structures in the wake of the wind turbine model under yaw motion (A=2° and fr=0.6). Results obtained from FVW and ALM URANS simulations.
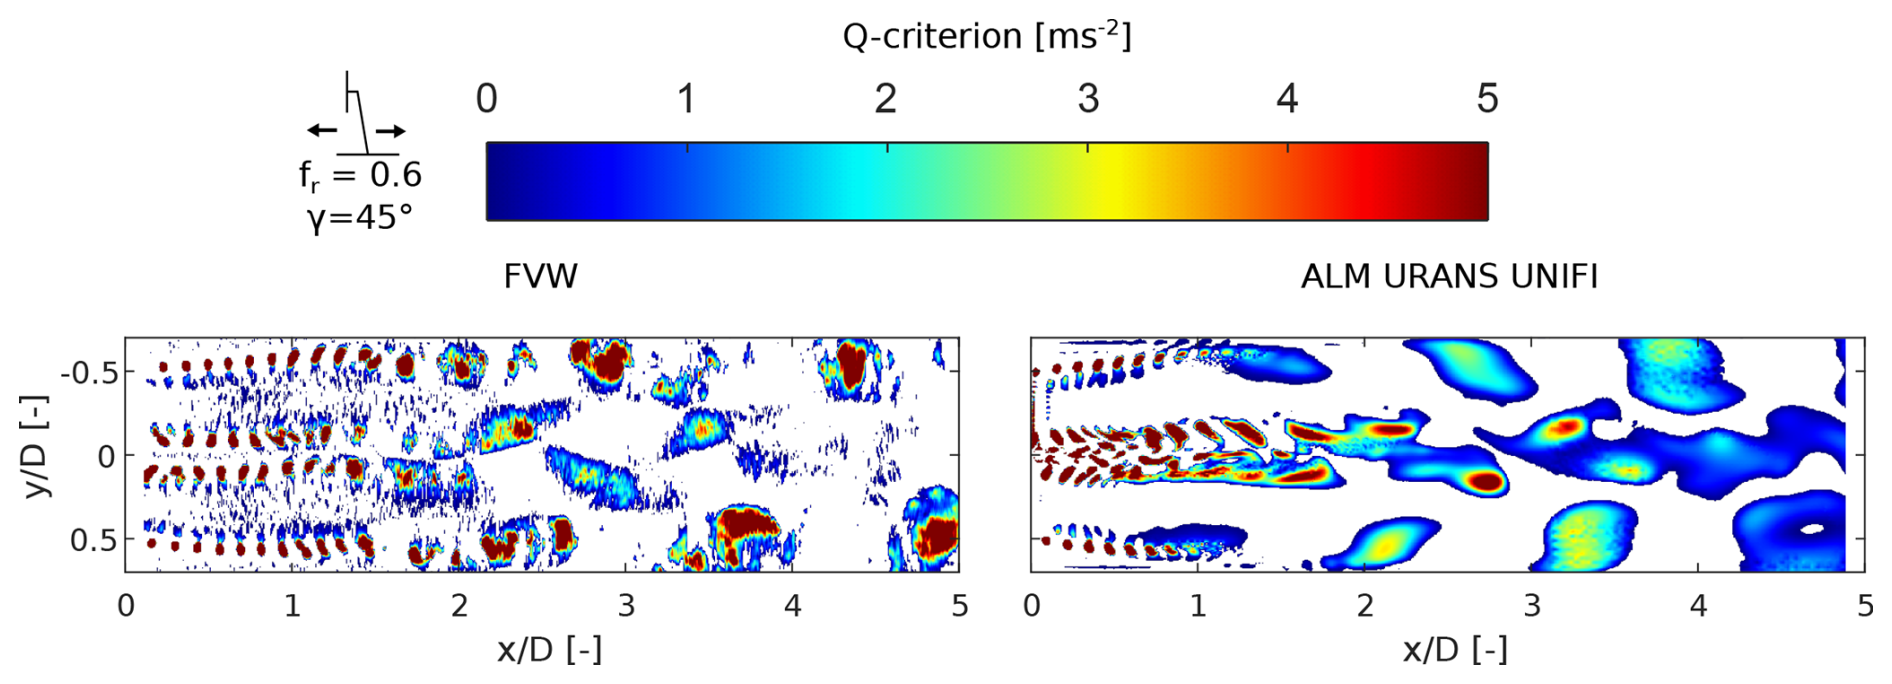
Figure 30Vortex structures in the wake of the wind turbine model under surge motion, with , fr=0.6, and a misalignment angle of 45°. Results obtained from FVW and CFD ALM URANS simulations.
Finally, the impact of misalignment angle between platform motion and the wind direction on the vortex structures in the wake was evaluated. Figure 30 shows the results for a surge motion of the platform with a misalignment of 45° with the wind direction, a normalized amplitude of , and a reduced frequency of 0.6. In comparison to the surge case, the wind–wave misalignment increases the strength of the vortex structures formed at the edges of the wake. Additionally, the vortex structures are shed in an alternating fashion on the two sides of the wake, due to the misalignment angle, similarly to the yaw motion cases. This difference is probably caused by wake meandering, as the wake is deflected in the crosswise direction due to the misaligned motion of the turbine.
Additionally, significant differences are observed at the center of the wake, as the root vortices merge into stronger and larger structures. The formation of the wake of these structures is probably connected to the velocity oscillations observed at the center of the wake for wind–wave misalignment cases (see Sect. 5.2).
In conclusion, the analysis of the vortex structures in the wake provided further insight into the dynamics of the wake in the investigated conditions. Results show that platform motion may lead to the formation of larger coherent structures in the far wake, which are connected to significant velocity oscillations. The formation of these structures is predominant when the reduced frequency is 0.6 and when meandering of the wake is introduced, either due to yaw motion of the platform or wind–wave misalignment. Among the numerical methods, the FVW shows similar results to the ALM URANS simulations until about 2 or 3 D from the rotor, but differences arise as the distance is increased. In fact, after about 3 D, the main vortex structures interact with one another and collapse into larger and weaker structures. The FVW model can struggle to capture such interactions as the impact of viscosity is introduced through semi-empirical correlations rather than being implicitly included in the model, as is the case for CFD approaches.
The rotor and wake dynamics of a model wind turbine under imposed motion were further investigated as part of the NETTUNO project, leveraging additional operating conditions and wind tunnel measurements. The model response was investigated under sinusoidal surge, pitch, and yaw motions. Additionally, some cases characterized by a misalignment angle between the motion and the wind direction were studied, providing further insight into more complex operating conditions. The objective of the investigation was to evaluate the capabilities of engineering models, namely FVW and ALM URANS, to capture the rotor and wake response of a floating wind turbine. An extensive calibration campaign of the FVW model was performed to guarantee the best possible agreement with experiments and to provide guidelines for the tuning of the model. The ALM URANS models were calibrated during previous numerical campaigns to best reproduce rotor load oscillations and were adopted here without additional tuning. The present comparison focuses on wake quantities, for which the models were not specifically calibrated, highlighting potential discrepancies arising from differences in ALM URANS implementations and simulation setups across research teams. The numerical results were compared with experimental wind tunnel data complemented by additional data from blade-resolved and high fidelity LESs. While this work aimed to provide an extensive investigation into available numerical codes for the simulation of the wake of FOWTs, the results of this study strictly refer to the specific code implementations and operating conditions at hand. Further efforts are required to compare additional codes and operating conditions to provide a more general outlook.
The main outcomes of this study are summarized as follows:
-
The FVW and ALM URANS methods can correctly predict rotor load oscillations in terms of thrust and torque over the considered range of conditions. Additional comparison to blade-resolved data has shown that these models are capable of capturing not only the integral rotor response but also the spanwise load distribution, even though inaccuracies in the airfoil polars and tip effects may introduce some uncertainty.
-
Among the simulation methods, the FVW approach can correctly capture the mean wake response in most operating conditions; however, results are impacted by the correct tuning of the main simulation parameters, namely the inflow turbulence, vortex viscosity, and initial core radius. Such parameters are typically defined by the user based on previous experience, but the existence of experimental data can significantly improve the results obtained.
-
ALM URANS models show similar results to the FVW method for wake deficit and better agreement with respect to the experiments at 5 D from the rotor. Nevertheless, some differences from the experiment remain, which are connected to the limitations of the URANS approach in capturing the interaction between wake development and free-stream turbulence.
-
Regarding velocity oscillations induced by the motion, the FVW model correctly captures the wake dynamics up to about 3 D from the rotor, even though motion-dependent velocity oscillations are usually overestimated. At 5 D from the rotor, the FVW does not solve the breakdown of the vortex structures leading to significant differences with the experiment.
-
The ALM URANS methodology captures wake velocity oscillations even at 5 D from the rotor, which are not captured by the FVW method. Nevertheless, the two different setups employed by UNIFI and POLIMI show significant differences when predicting the amplitude velocity oscillations in the wake. The impact of nacelle, tower, and robot, which are simulated by UNIFI but not included in the POLIMI setup, was investigated, but results showed only a minor impact on the wake response. Additionally, the kernel size was also excluded as the possible root cause for these differences, as additional tests performed by UNIFI matching the setup by POLIMI showed only minor differences to previous results.
-
Under pitch motion, an ALM URANS approach overestimates the formation of coherent structures in the wake in comparison to high-fidelity ALM LES data, even though the URANS methodology captures the pulsation of the wake induced by the motion.
-
For yaw and wind–wave misalignment cases, platform motion induces wake meandering, leading to asymmetrical velocity oscillations in the wake. Under such operating conditions, the ALM URANS approach is found to outperform FVW, especially at 5 D downstream of the rotor, even though the entity of the velocity oscillations is not always correctly captured by either of the models.
In general, this study shows that the FVW approach can provide valuable insight with limited computational effort, even though it requires significant tuning (which is not always straightforward when benchmark data are missing). The ALM URANS methodology is a powerful tool and shows better agreement with the experiment at larger distances from the rotor and for yaw and wind–wave misalignment cases; however, results are strongly dependent on the employed simulation setup, and careful validation and tuning campaigns are required. Future work should focus on expanding the wake analysis to more realistic platform motion conditions, such as realistic motions involving all 6 DOFs. Additionally, the capability and limitations of the numerical methods presented here to predict the loading on downstream turbines should be evaluated, as these tools could provide significant insight for the design and development of floating offshore wind turbines.
Post-processing scripts can be provided upon request to Alessandro Bianchini. ALM codes are proprietary of the research groups.
Measurement data of the wind tunnel experiment are accessible at https://doi.org/10.5281/zenodo.13994980 (Fontanella et al., 2024). Simulation data can be provided upon request to the authors.
SC performed the numerical simulations, gathered and curated all the data, performed formal investigation, and prepared the original draft. FP and PFM contributed to the conceptualization, methodology, and investigation. AFo curated the experimental data, and contributed to conceptualization and investigation. AFi, AGS, and GP performed the numerical simulations and contributed to the investigation. VD, SM, MB, and AB provided supervision, acquired funding and resources, contributed to developing the methodology, and conceptualized the study. AB coordinated the research team. All authors reviewed the paper.
At least one of the (co-)authors is a member of the editorial board of Wind Energy Science. The peer-review process was guided by an independent editor, and the authors also have no other competing interests to declare.
Publisher's note: Copernicus Publications remains neutral with regard to jurisdictional claims made in the text, published maps, institutional affiliations, or any other geographical representation in this paper. The authors bear the ultimate responsibility for providing appropriate place names. Views expressed in the text are those of the authors and do not necessarily reflect the views of the publisher.
The CONVERGE licenses used in this work were obtained through the CONVERGE Academic Program.
This research has been supported by the European Commission, NextGenerationEU (grant no. M4C2 I1.1, Progetto PRIN 2022 “NETTUNO”, Prot. 2022PFLPHS, CUP D53D23003930006).
This paper was edited by Erin Bachynski-Polić and reviewed by three anonymous referees.
Angelou, N., Mann, J., and Dubreuil-Boisclair, C.: Revealing inflow and wake conditions of a 6 MW floating turbine, Wind Energ. Sci., 8, 1511–1531, https://doi.org/10.5194/wes-8-1511-2023, 2023.
Arabgolarcheh, A., Jannesarahmadi, S., and Benini, E.: Modeling of near wake characteristics in floating offshore wind turbines using an actuator line method, Renewable Energy, 185, 871–887, https://doi.org/10.1016/j.renene.2021.12.099, 2022.
Bak, C., Zahle, F., Bitsche, R., Kim, T., Yde, A., Henriksen, L. C., Hansen, M. H., Blasques, J. P. A. A., Gaunaa, M., and Natarajan, A.: The DTU 10- MW Reference Wind Turbine, DTU Wind Energy Report-I-0092, 2013.
Bergua, R., Robertson, A., Jonkman, J., Branlard, E., Fontanella, A., Belloli, M., Schito, P., Zasso, A., Persico, G., Sanvito, A., Amet, E., Brun, C., Campaña-Alonso, G., Martín-San-Román, R., Cai, R., Cai, J., Qian, Q., Maoshi, W., Beardsell, A., Pirrung, G., Ramos-García, N., Shi, W., Fu, J., Corniglion, R., Lovera, A., Galván, J., Nygaard, T. A., dos Santos, C. R., Gilbert, P., Joulin, P.-A., Blondel, F., Frickel, E., Chen, P., Hu, Z., Boisard, R., Yilmazlar, K., Croce, A., Harnois, V., Zhang, L., Li, Y., Aristondo, A., Mendikoa Alonso, I., Mancini, S., Boorsma, K., Savenije, F., Marten, D., Soto-Valle, R., Schulz, C. W., Netzband, S., Bianchini, A., Papi, F., Cioni, S., Trubat, P., Alarcon, D., Molins, C., Cormier, M., Brüker, K., Lutz, T., Xiao, Q., Deng, Z., Haudin, F., and Goveas, A.: OC6 project Phase III: validation of the aerodynamic loading on a wind turbine rotor undergoing large motion caused by a floating support structure, Wind Energ. Sci., 8, 465–485, https://doi.org/10.5194/wes-8-465-2023, 2023.
Cabezon, D., Migoya, E., and Crespo, A.: Comparison of turbulence models for the computational fluid dynamics simulation of wind turbine wakes in the atmospheric boundary layer, Wind Energy, 14, 909–921, 2011.
Chen, P., Chen, J., and Hu, Z.: Review of Experimental-Numerical Methodologies and Challenges for Floating Offshore Wind Turbines, J. Marine. Sci. Appl., 19, 339–361, https://doi.org/10.1007/s11804-020-00165-z, 2020.
Cioni, S., Papi, F., Pagamonci, L., Bianchini, A., Ramos-García, N., Pirrung, G., Corniglion, R., Lovera, A., Galván, J., Boisard, R., Fontanella, A., Schito, P., Zasso, A., Belloli, M., Sanvito, A., Persico, G., Zhang, L., Li, Y., Zhou, Y., Mancini, S., Boorsma, K., Amaral, R., Viré, A., Schulz, C. W., Netzband, S., Soto-Valle, R., Marten, D., Martín-San-Román, R., Trubat, P., Molins, C., Bergua, R., Branlard, E., Jonkman, J., and Robertson, A.: On the characteristics of the wake of a wind turbine undergoing large motions caused by a floating structure: an insight based on experiments and multi-fidelity simulations from the OC6 project Phase III, Wind Energ. Sci., 8, 1659–1691, https://doi.org/10.5194/wes-8-1659-2023, 2023.
Cioni, S., Papi, F., Balduzzi, F., Fontanella, A., and Bianchini, A.: Blade-resolved CFD analysis of a floating wind turbine: new insights on unsteady aerodynamics, loads, and wake, Ocean Engineering, 341, 122746, https://doi.org/10.1016/j.oceaneng.2025.122746, 2025.
Dağ, K. O. and Sørensen, J. N.: A new tip correction for actuator line computations, Wind Energy, 23, 148–160, 2020.
Dong, J. and Viré, A.: The aerodynamics of floating offshore wind turbines in different working states during surge motion, Renewable Energy, 195, 1125–1136, https://doi.org/10.1016/j.renene.2022.06.016, 2022.
Du, Z. and Selig, M.: A 3-D stall-delay model for horizontal axis wind turbine performance prediction, in: 1998 ASME Wind Energy Symposium, 21, https://doi.org/10.2514/6.1998-21, 1998.
Duan, G., Gattari, D., and Porté-Agel, F.: Theoretical and experimental study on power performance and wake characteristics of a floating wind turbine under pitch motion, Applied Energy, 378, 124767, https://doi.org/10.1016/j.apenergy.2024.124767, 2025.
Fontanella, A., Bayati, I., Mikkelsen, R., Belloli, M., and Zasso, A.: UNAFLOW: a holistic wind tunnel experiment about the aerodynamic response of floating wind turbines under imposed surge motion, Wind Energ. Sci., 6, 1169–1190, https://doi.org/10.5194/wes-6-1169-2021, 2021.
Fontanella, A., Zasso, A., and Belloli, M.: Wind tunnel investigation of the wake-flow response for a floating turbine subjected to surge motion, J. Phys.: Conf. Ser., 2265, 042023, https://doi.org/10.1088/1742-6596/2265/4/042023, 2022.
Fontanella, A., Fusetti, A., Menconi, F., Cioni, S., Papi, F., Muggiasca, S., Persico, G., Dossena, V., Bianchini, A., and Belloli, M.: NETTUNO Experiment 1 – Wake Development in Floating Wind Turbines, Zenodo [data set], https://doi.org/10.5281/zenodo.13994980, 2024.
Fontanella, A., Fusetti, A., Cioni, S., Papi, F., Muggiasca, S., Persico, G., Dossena, V., Bianchini, A., and Belloli, M.: Wake development in floating wind turbines: new insights and an open dataset from wind tunnel experiments, Wind Energy Science, 10, 1369–1387, 2025.
Jonkman, B. J.: TurbSim user's guide: Version 1.50, National Renewable Energy Lab.(NREL), Golden, CO (United States), https://doi.org/10.2172/965520, 2009.
Jost, E., Klein, L., Leipprand, H., Lutz, T., and Krämer, E.: Extracting the angle of attack on rotor blades from CFD simulations, Wind Energy, 21, 807–822, 2018.
Kleine, V. G., Franceschini, L., Carmo, B. S., Hanifi, A., and Henningson, D. S.: Stability of Floating Wind Turbine Wakes, J. Phys.: Conf. Ser., 1934, 012009, https://doi.org/10.1088/1742-6596/1934/1/012009, 2021.
Kleine, V. G., Franceschini, L., Carmo, B. S., Hanifi, A., and Henningson, D. S.: The stability of wakes of floating wind turbines, Physics of Fluids, 34, 074106, https://doi.org/10.1063/5.0092267, 2022.
Li, Z., Dong, G., and Yang, X.: Onset of wake meandering for a floating offshore wind turbine under side-to-side motion, Journal of Fluid Mechanics, 934, https://doi.org/10.1017/jfm.2021.1147, 2022.
Lin, M. and Porté-Agel, F.: Wake meandering of wind turbines under dynamic yaw control and impacts on power and fatigue, Renewable Energy, 223, 120003, 2024.
Marten, D.: QBlade: a Modern Tool for the Aeroelastic Simulation of Wind Turbines, Technische Universität Berlin, https://doi.org/10.14279/depositonce-10646, 2020.
Menter, F. R., Smirnov, P. E., Liu, T., and Avancha, R.: A One-Equation Local Correlation-Based Transition Model, Flow Turbulence Combust, 95, 583–619, https://doi.org/10.1007/s10494-015-9622-4, 2015.
Messmer, T., Hölling, M., and Peinke, J.: Enhanced recovery caused by nonlinear dynamics in the wake of a floating offshore wind turbine, Journal of Fluid Mechanics, 984, A66, https://doi.org/10.1017/jfm.2024.175, 2024a.
Messmer, T., Peinke, J., and Hölling, M.: Wind tunnel investigation on the recovery and dynamics of the wake of a floating offshore wind turbine subjected to low inflow turbulence, J. Phys.: Conf. Ser., 2767, 092083, https://doi.org/10.1088/1742-6596/2767/9/092083, 2024b.
Munters, W. and Meyers, J.: Towards practical dynamic induction control of wind farms: analysis of optimally controlled wind-farm boundary layers and sinusoidal induction control of first-row turbines, Wind Energ. Sci., 3, 409–425, https://doi.org/10.5194/wes-3-409-2018, 2018.
Navarro Diaz, G. P., Otero, A. D., Asmuth, H., Sørensen, J. N., and Ivanell, S.: Actuator line model using simplified force calculation methods, Wind Energ. Sci., 8, 363–382, https://doi.org/10.5194/wes-8-363-2023, 2023.
Øye, S.: Dynamic stall simulated as time lag of separation, in: Proceedings of the 4th IEA Symposium on the Aerodynamics of Wind Turbines, 28, https://docs.qblade.org/src/theory/index_th.html (last access: 23 February 2026), 1991.
Pagamonci, L., Papi, F., Cojocaru, G., Belloli, M., and Bianchini, A.: How does turbulence affect wake development in floating wind turbines? Some insights from comparative large-eddy simulations and wind tunnel experiments, Wind Energ. Sci., 10, 1707–1736, https://doi.org/10.5194/wes-10-1707-2025, 2025.
Panthi, K. and Iungo, G. V.: Wind tunnel experiments and model predictions of the performance of a floating offshore wind turbine undergoing pitch motion, Journal of Renewable and Sustainable Energy, 17, https://doi.org/10.1063/5.0301237, 2025.
Papi, F., Jonkman, J., Robertson, A., and Bianchini, A.: Going beyond BEM with BEM: an insight into dynamic inflow effects on floating wind turbines, Wind Energ. Sci., 9, 1069–1088, https://doi.org/10.5194/wes-9-1069-2024, 2024.
Porté-Agel, F., Bastankhah, M., and Shamsoddin, S.: Wind-Turbine and Wind-Farm Flows: A Review, Boundary-Layer Meteorol., 174, 1–59, https://doi.org/10.1007/s10546-019-00473-0, 2020.
Rahimi, H., Schepers, J. G., Shen, W. Z., García, N. R., Schneider, M., Micallef, D., Ferreira, C. S., Jost, E., Klein, L., and Herráez, I.: Evaluation of different methods for determining the angle of attack on wind turbine blades with CFD results under axial inflow conditions, Renewable Energy, 125, 866–876, 2018.
Ramos-García, N., Kontos, S., Pegalajar-Jurado, A., González Horcas, S., and Bredmose, H.: Investigation of the floating IEA Wind 15 MW RWT using vortex methods Part I: Flow regimes and wake recovery, Wind Energy, 25, 468–504, https://doi.org/10.1002/we.2682, 2022.
Richards, K. J., Senecal, P. K., and Pomraning, E.: CONVERGE v4.1, https://convergecfd.com/ (last access: 23 February 2026), 2026.
Robertson, A., Bergua, R., Fontanella, A., and Jonkman, J.: OC6 Phase III Definition Document: Validation of Nonlinear Hydrodynamic Loading on the DeepCwind Semisubmersible, https://doi.org/10.2172/1846746, 2023.
Sanvito, A. G., Firpo, A., Schito, P., Dossena, V., Zasso, A., and Persico, G.: A novel vortex-based velocity sampling method for the actuator-line modeling of floating offshore wind turbines in windmill state, Renewable Energy, 231, 120927, https://doi.org/10.1016/j.renene.2024.120927, 2024.
Schliffke, B., Aubrun, S., and Conan, B.: Wind Tunnel Study of a “Floating” Wind Turbine's Wake in an Atmospheric Boundary Layer with Imposed Characteristic Surge Motion, J. Phys.: Conf. Ser., 1618, 062015, https://doi.org/10.1088/1742-6596/1618/6/062015, 2020.
Schliffke, B., Conan, B., and Aubrun, S.: Floating wind turbine motion signature in the far-wake spectral content – a wind tunnel experiment, Wind Energ. Sci., 9, 519–532, https://doi.org/10.5194/wes-9-519-2024, 2024.
Schulz, C. W., Netzband, S., Özinan, U., Cheng, P. W., and Abdel-Maksoud, M.: Wind turbine rotors in surge motion: new insights into unsteady aerodynamics of floating offshore wind turbines (FOWTs) from experiments and simulations, Wind Energ. Sci., 9, 665–695, https://doi.org/10.5194/wes-9-665-2024, 2024.
Sebastian, T. and Lackner, M. A.: Characterization of the unsteady aerodynamics of offshore floating wind turbines, Wind Energy, 16, 339–352, https://doi.org/10.1002/we.545, 2013.
Taruffi, F., Novais, F., and Viré, A.: An experimental study on the aerodynamic loads of a floating offshore wind turbine under imposed motions, Wind Energ. Sci., 9, 343–358, https://doi.org/10.5194/wes-9-343-2024, 2024.
Tran, T.-T. and Kim, D.-H.: The platform pitching motion of floating offshore wind turbine: A preliminary unsteady aerodynamic analysis, Journal of Wind Engineering and Industrial Aerodynamics, 142, 65–81, https://doi.org/10.1016/j.jweia.2015.03.009, 2015.
Veers, P., Bottasso, C. L., Manuel, L., Naughton, J., Pao, L., Paquette, J., Robertson, A., Robinson, M., Ananthan, S., Barlas, T., Bianchini, A., Bredmose, H., Horcas, S. G., Keller, J., Madsen, H. A., Manwell, J., Moriarty, P., Nolet, S., and Rinker, J.: Grand challenges in the design, manufacture, and operation of future wind turbine systems, Wind Energ. Sci., 8, 1071–1131, https://doi.org/10.5194/wes-8-1071-2023, 2023.
Viterna, L. A. and Janetzke, D. C.: Theoretical and experimental power from large horizontal-axis wind turbines, NASA Lewis Research Center, Cleveland, OH (United States), https://doi.org/10.2172/6763041, 1982.
Xie, S.: An actuator-line model with Lagrangian-averaged velocity sampling and piecewise projection for wind turbine simulations, Wind Energy, 24, 1095–1106, https://doi.org/10.1002/we.2619, 2021.
- Abstract
- Introduction
- Experimental data for benchmarking
- Numerical methods
- Multi-fidelity analysis of rotor loads
- Multi-fidelity analysis of wake dynamics
- Conclusions
- Code availability
- Data availability
- Author contributions
- Competing interests
- Disclaimer
- Acknowledgements
- Financial support
- Review statement
- References