the Creative Commons Attribution 4.0 License.
the Creative Commons Attribution 4.0 License.
 | 03 Apr 2018
Benefits of subcomponent over full-scale blade testing elaborated on a trailing-edge bond line design validation
Malo Rosemeier
Gregor Basters
Alexandros Antoniou
Wind turbine rotor blades are designed and certified according to the current IEC (2012) (International Electrotechnical Commission) and DNV GL AS (2015) (Det Norske Veritas Germanischer Lloyd Aksjeselskap) standards, which include the final full-scale experiment. The experiment is used to validate the assumptions made in the design models. In this work the drawbacks of traditional static and fatigue full-scale testing are elaborated, i.e., the replication of realistic loading and structural response. Subcomponent testing is proposed as a potential method to mitigate some of the drawbacks. Compared to the actual loading that a rotor blade is subjected to under field conditions, the full-scale test loading is subjected to the following simplifications and constraints: first, the full-scale fatigue test is conducted as a cyclic test, wherein the load time series obtained from aeroservoelastic simulations are simplified to a damage-equivalent load range. Second, the load directions are typically applied solely in two directions, often pure lead–lag and flapwise directions which are not necessarily the most critical load directions for a particular blade segment. Third, parts of the blade are overloaded by up to 20 % to achieve the target load along the whole span. Fourth, parts of the blade are not tested due to load introduction via load frames. Finally, another downside of a state-of-the-art, uni-axial, resonant, full-scale testing method is that dynamic testing at the eigenfrequencies of today's blades with respect to the first flapwise mode between 0.4 and 1.0 Hz results in long test times. Testing usually takes several months. In contrast, the subcomponent fatigue testing time can be substantially shorter than the full-scale blade test since (a) the load can be introduced with higher frequencies which are not constrained by the blade's eigenfrequency, and (b) the stress ratio between the minimum and the maximum stress exposure to which the structure is subjected can be increased to more realistic values. Furthermore, subcomponent testing could increase the structural reliability by focusing on the critical areas and replicating the design loads more accurately in the most critical directions. In this work, the comparison of the two testing methods is elaborated by way of example on a trailing-edge bond line design.
- Article
(1635 KB) - Full-text XML
- BibTeX
- EndNote


Reliability, i.e., serviceability and structural integrity of rotor blades, is essential to fulfill the requirements placed on a wind turbine in the field. Serviceability is of economic interest while integrity is of interest from a safety point of view. Before a rotor blade design goes into operation, a full-scale blade test (FST) is required in the certification process to validate the assumptions made in the design models. Wind turbine rotor blades are designed and certified according to the current standards and guidelines (DNV GL AS, 2015; IEC, 2012) (International Electrotechnical Commission). As part of the certification process, static as well as fatigue loads are applied to the rotor blade. Static and fatigue loads are usually applied in the two main directions, i.e., lead–lag and flapwise. Damage-equivalent fatigue test loads are applied to the rotor blade, but they do not necessarily reflect the actual load direction, amplitude and mean during its service life.
Although DNV GL AS (2015) (Det Norske Veritas Germanischer Lloyd Aksjeselskap) accepts combined static full-scale tests (SFST) rather than pure lead–lag and flapwise, the importance of which is highlighted in Roczek-Sieradzan et al. (2011) and Haselbach et al. (2016), this approach is rarely used for certification tests.
Attempts have been made to improve fatigue full-scale blade testing (FFST) towards a more realistic scenario by minimizing the overloading, i.e., the deviation between applied test bending moments and target bending moments as per the design requirements. For example, Lee and Park (2016) applied an algorithm to optimize the bending moment distribution for uni-axial, resonant FFST by using additional masses and determining optimal actuator positions and excitation frequencies. Moreover, Eder et al. (2017) propose a uni-axial multifrequency approach to replicate the actual spatial damage distribution more realistically. Bi-axial FFST is an approach that emulates more comprehensive damage along the blade's circumference (Heijdra et al., 2013). The random-phase bi-axial resonant excitation has been a focus of research for a number of years (Greaves et al., 2012; Snowberg et al., 2014; White, 2004; White et al., 2005). Yet another approach is the phase-locked excitation with frequency ratios, e.g., of 1 : 1 between the flapwise and lead–lag mode (White et al., 2011). The flapwise mode is excited in its eigenfrequency while the lead–lag mode is forced in the same frequency (Heijdra et al., 2013). Alternatively, both modes can be excited in resonance by tuning both eigenfrequencies independently with the concept of virtual masses (Post, 2016).
IEC (2012) states that during fatigue testing, the mean loads applied shall normally be as close as possible to the mean load under the operating conditions that cause the most severe fatigue damage. The importance of considering mean loading for the fatigue life evaluation of fiber-reinforced polymers is described and quantified in Sutherland and Mandell (2005).
According to Krimmer et al. (2016) lead–lag fatigue loading is the design-driving loading for current and future rotor blades. Therefore, this work focuses on the most sensitive area for the lead–lag load case, i.e., on the trailing-edge bond line in particular.
Branner et al. (2016), Rosemeier et al. (2016) and Lahuerta et al. (2017) proposed subcomponent test (SCT) concepts to investigate the structural performance of trailing-edge bond lines in particular. Kühlmeier (2006) showed an alternative SCT method for investigating the flapwise buckling response of a blade segment.
Within this work, SCT is presented as a means to potentially overcome some of the drawbacks of FST. The intention of applying SCT is not to overcome the necessity of FST. The method of SCT, however, has the potential to be considered as a standard intermediate test before, during or after certification. By taking the target mean loading and thus the stress ratio between the minimum and the maximum stress exposure at the trailing edge into account, the structural evaluation of the blade can be approached more realistically compared to field simulations. The testing time can be reduced significantly by means of SCT when considering the case of a particular blade segment validation, recertification due to a repair or design retrofit solution.
First, the FST and SCT concepts are described. Second, on the basis of calculations the benefits of SCT over static and fatigue FST are highlighted.
For a SFST, the blade is clamped to a stiff block and several load frames are attached to the blade along the span1 (Fig. 1a). Point loads are introduced via load frames pulling ropes which are connected to actuators on a strong floor or strong wall.
For a uni-axial, resonant FFST, only one load frame is attached to the blade. Cyclic tension and compression loads are applied by one actuator (Fig. 1b). The testing frequency is chosen so as to be close to the blade's eigenfrequency, thus enabling displacement-controlled resonant excitation of the mode shape of the blade.
The concept of blade SCT discussed in this work is based on the work by Rosemeier et al. (2016), where a subcomponent is defined as a part or section representative of the blade design (IEC, 2017). The specimen can either be a full-scale blade cutout or a separately manufactured full-scale part. In the present study the area of interest is the trailing-edge cell, including one main shear web (Fig. 1c), to obtain a closed cross section, which can still realistically emulate “breathing” or “pumping” effects of the thin-walled blade structure. Both ends of the subcomponent are glued into load frames, which are connected to ball joints. An eccentric axial load is introduced at one joint, thus introducing a normal force on which a bending moment is superimposed. The position of the two joints within the cross sectional plane can be chosen arbitrarily, which makes it possible to introduce any load combination and distribution of lead–lag and flapwise loading.
In the following, the benefits and drawbacks of SCT over static and fatigue full-scale blade testing (FST) are elaborated.
An advantage of SCT over FST is that the number of relatively inexpensive specimens can be increased to investigate different design variants of a critical blade detail, for example. Owing to the smaller dimension and relatively small displacements of an SCT, it is possible to conduct experiments under environmental conditions, e.g., in climate chambers, and to better observe the experiment via optical measurement systems, such as the digital image correlation shown by Nielsen et al. (2010).
A disadvantage of SCT is that only a segment of the blade is considered for testing. Furthermore, the design of the boundary conditions of an SCT relies on detailed models, e.g., for the determination of blade properties of a cutout segment as explained in Rosemeier et al. (2016).
The focus of the following sections is on the problem of constrained areas and overloading of blade parts, the load direction in static and fatigue testing, as well as on the stress ratio at the trailing edge and the resulting testing time.
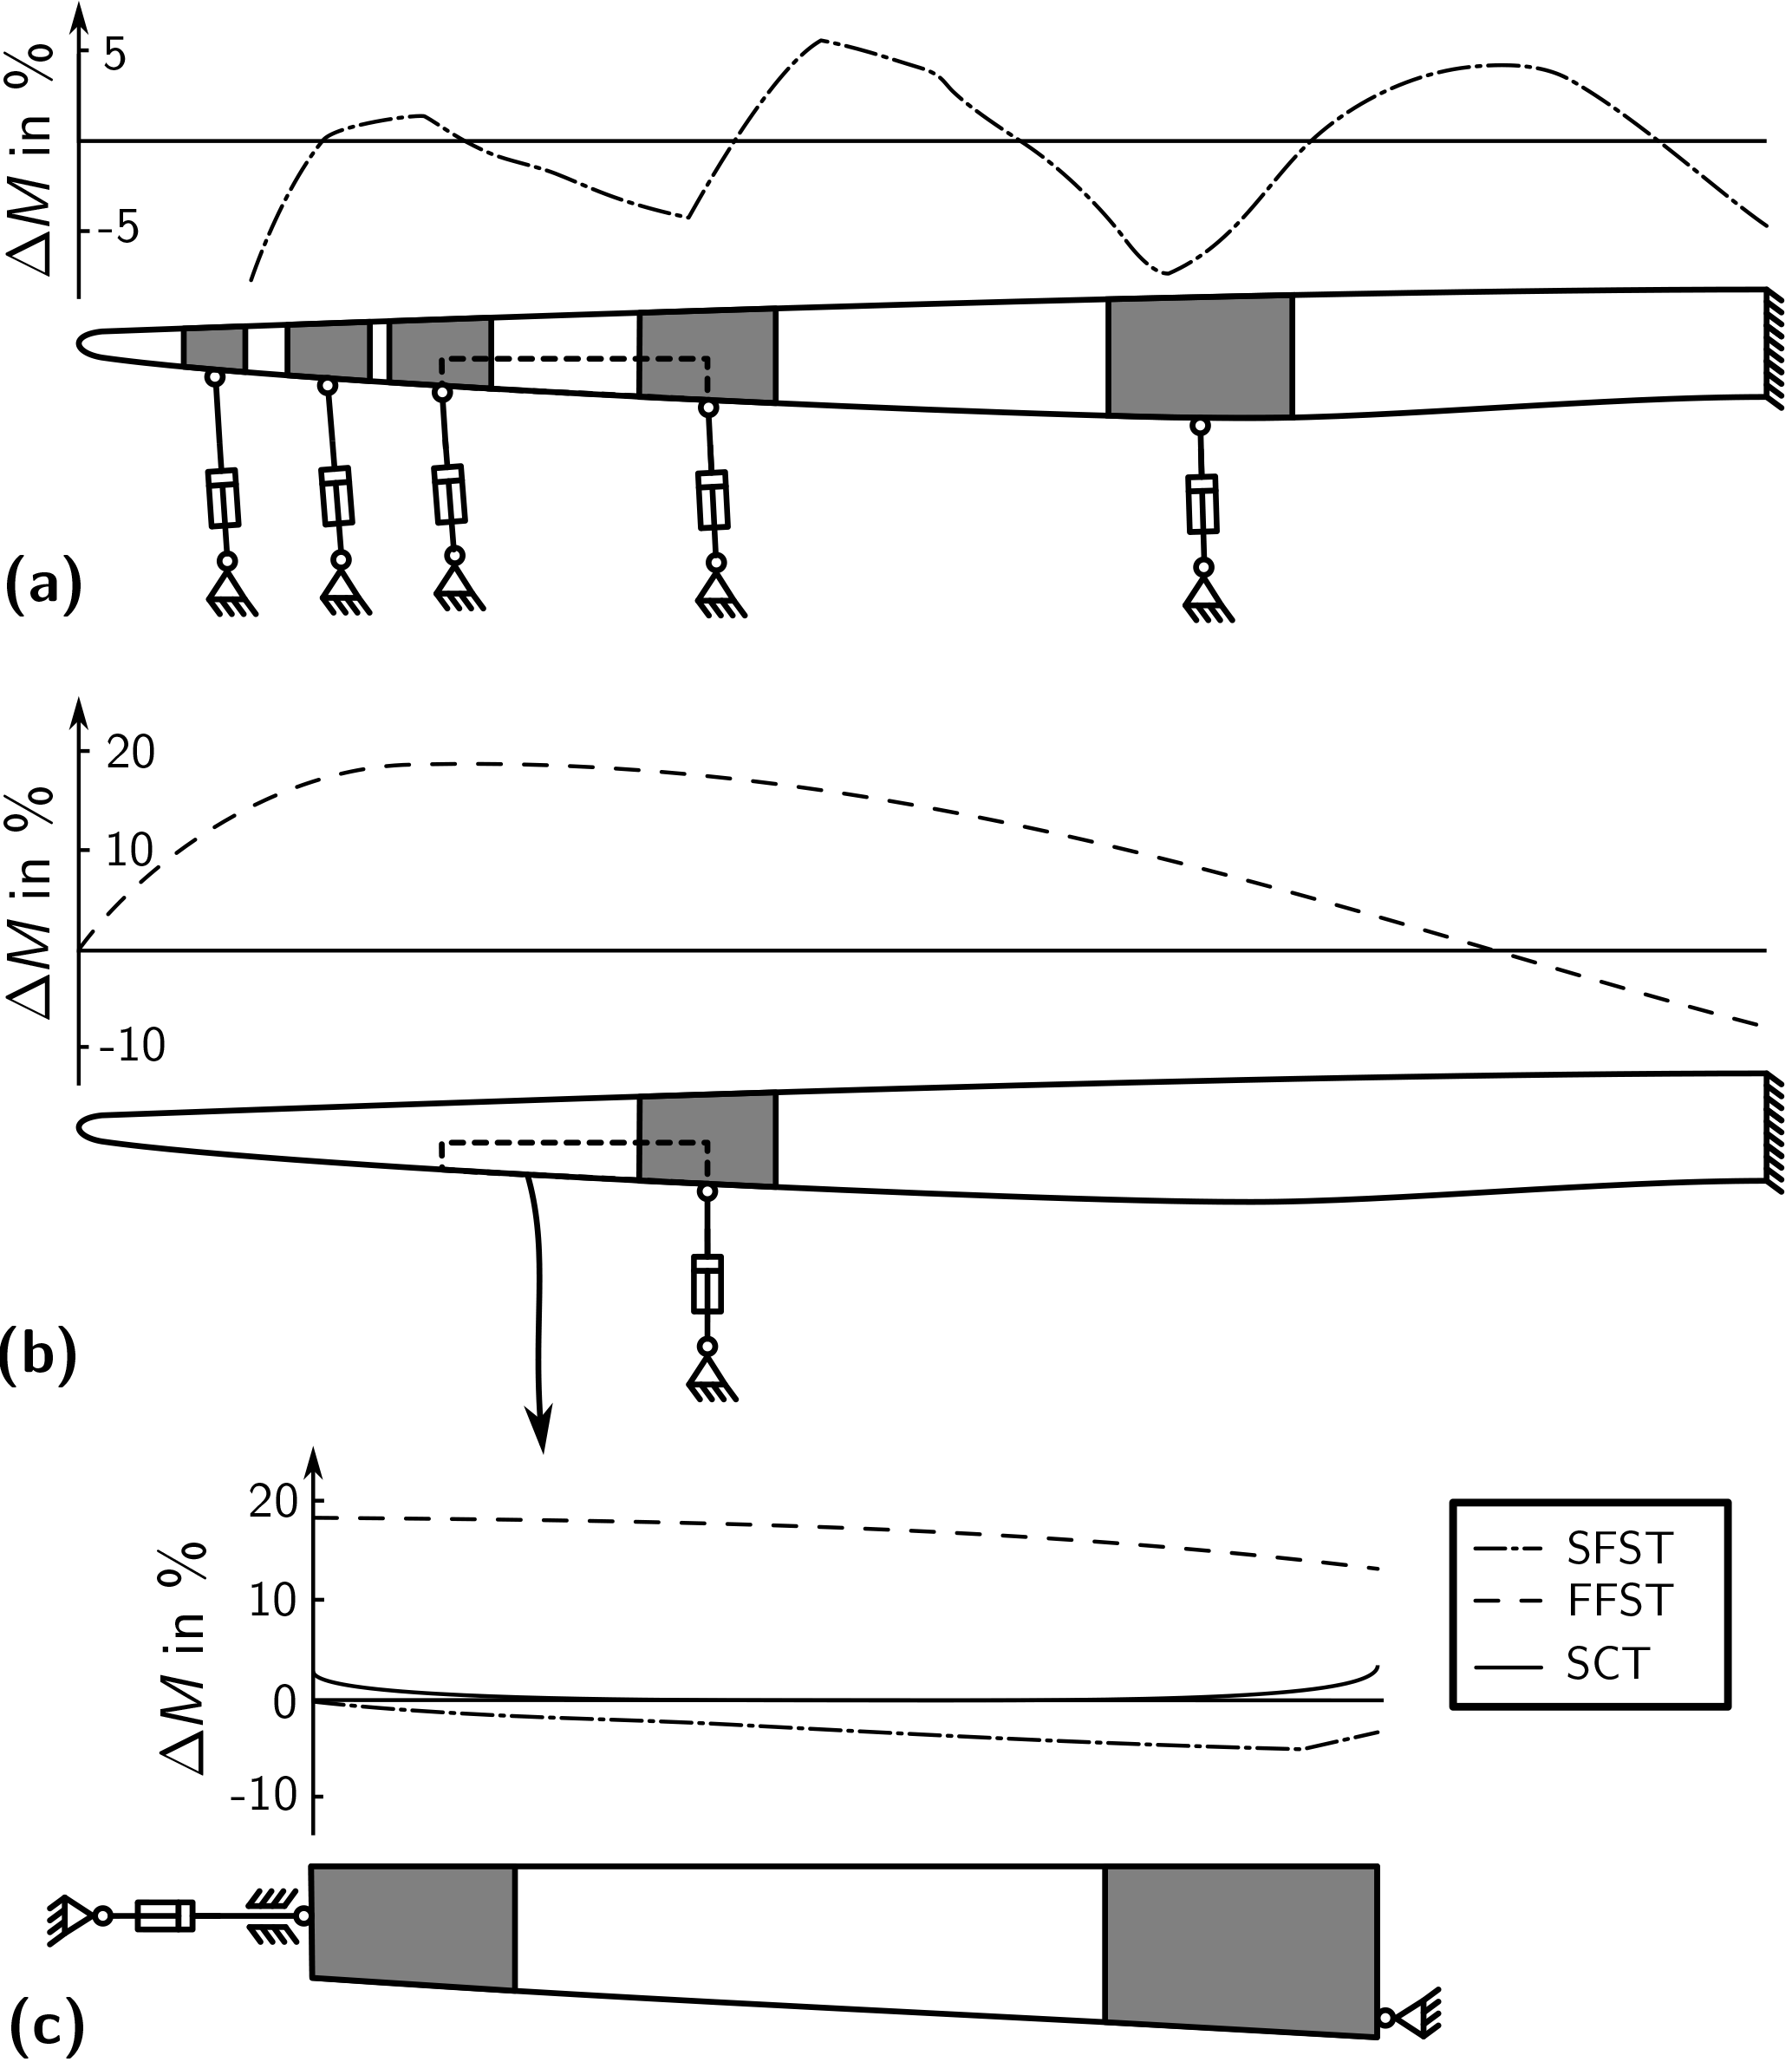
Figure 1Load deviation ΔM between test bending moment and target bending moment determined for the DTU10MW blade and test setup for static full-scale test (SFST) in side view (excerpt from Antoniou et al., 2015) (a), fatigue full-scale test (FFST) in top view (b) and blade cutout subcomponent test (SCT) (c). Untested areas are shown in gray.
3.1 Constrained areas and overloading
Load frames diminish tested areas because they constrain the structure (Fig. 1a). The longitudinal dimension of the constrained area at a load clamp is assumed to be ±75 % of the local blade chord length (IEC, 2012). Critical cross sections should not be within constrained areas. Owing to the multilinear moment distribution in the static test, the critical areas are necessarily in under- or overloaded areas (Fig. 1a). Thus, due to the setup of an FST, these areas are subjected to a load deviation, which means a lower or a higher test loading Mtest compared to the target load envelope Mtarget:
In the fatigue FST, the constrained area is reduced to solely one load clamp, which increases the area for this test (Fig. 1b). The load deviation ΔM, however, can be even higher for the blade (overloading by up to 20 %) although mass tuning is conducted. Overloading occurs along all tested areas because the shape of the target moment distribution cannot be fully replicated by the test moment distribution. That is, parts of the blade can be damaged far beyond their fatigue life before all relevant areas reach their target damage.
In an SCT, the constrained areas are determined by means of a method similar to that used in FST (Fig. 1c). This implies that a reasonable length of the specimen should be chosen to replicate, for example, a realistic buckling response. The overloading in the tested areas, however, is close to zero, since the bending moment can be adjusted by specially designed boundary conditions (Rosemeier et al., 2016).
Moreover, in an SCT the cross section of interest can be tested up to its final fatigue limit state compared to an FST, where other, highly overloaded blade areas may limit the damage that is required to reach the final fatigue limit state at the cross section of interest.
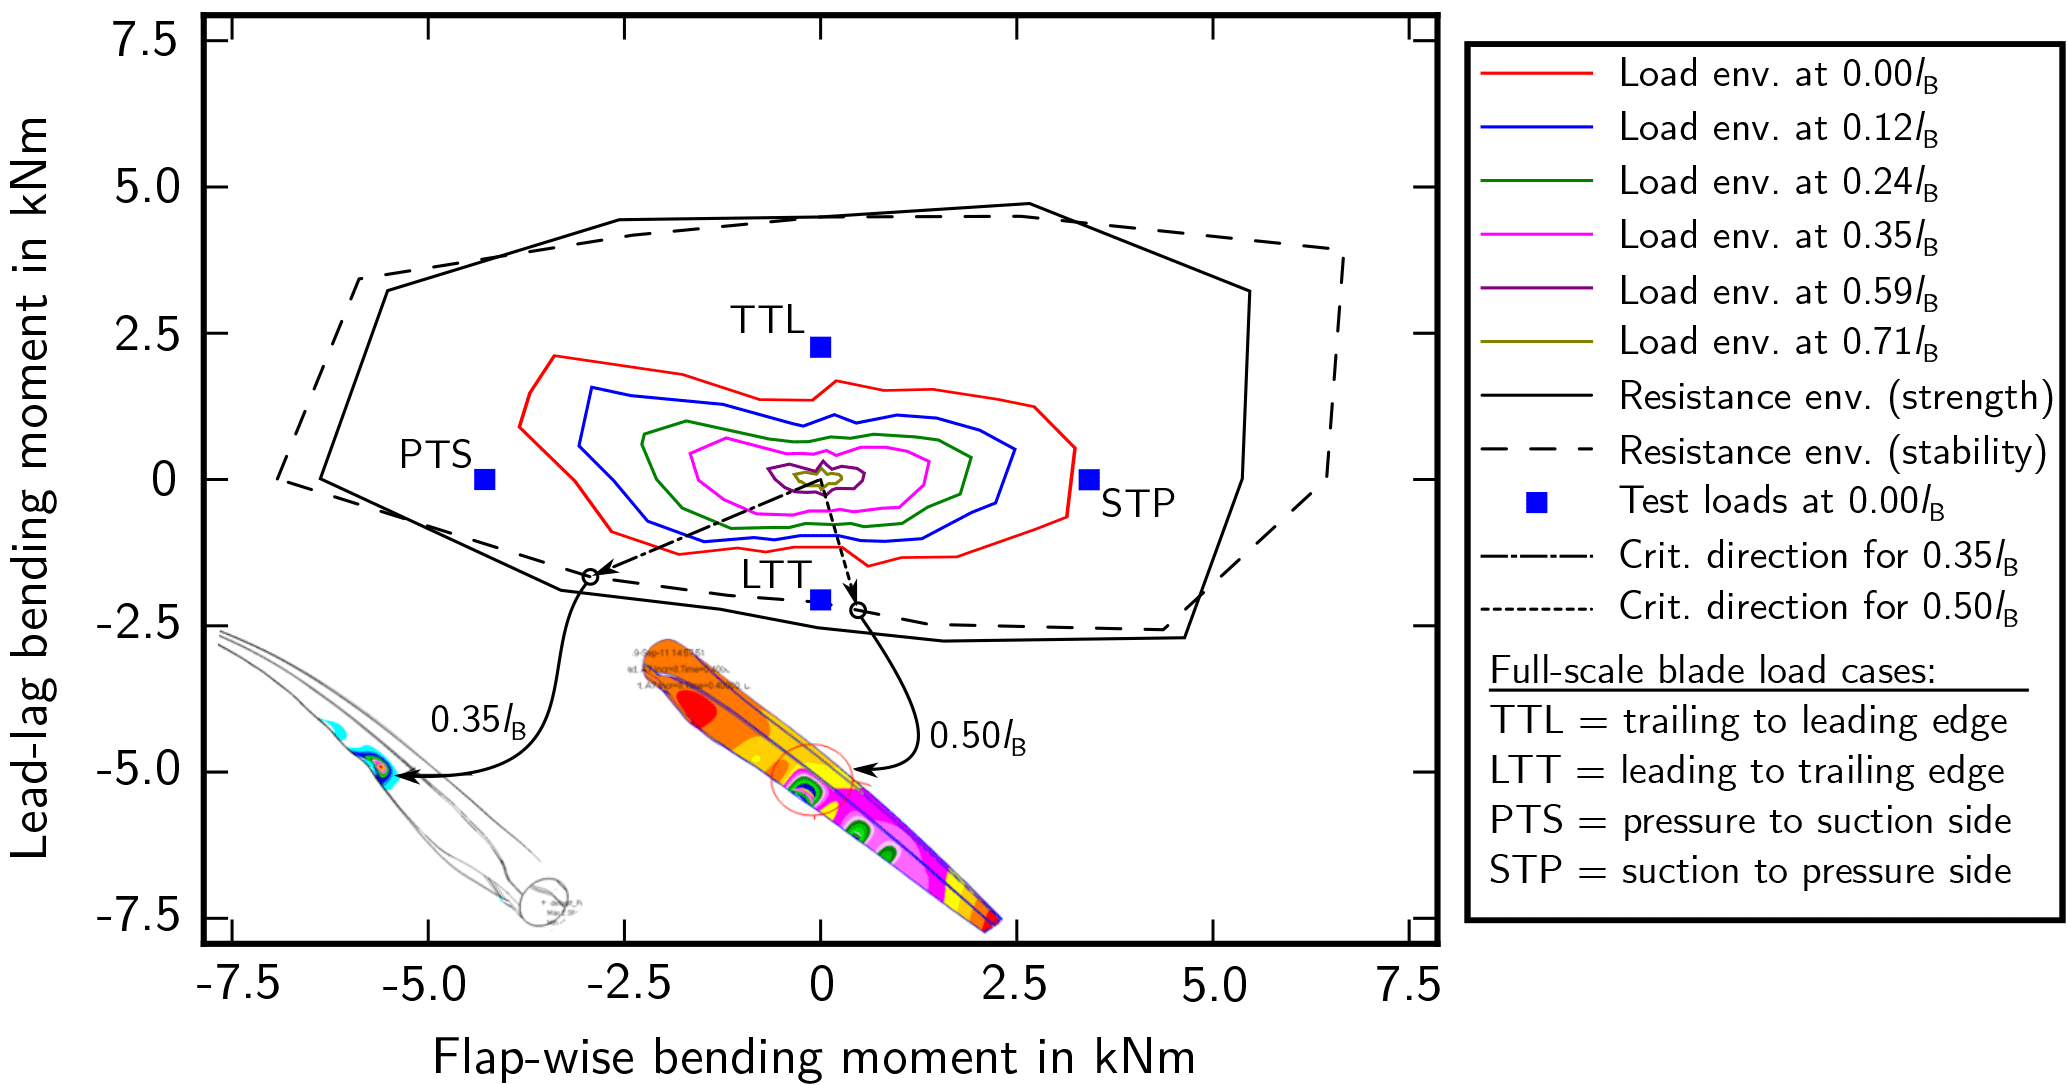
Figure 2Load envelopes in terms of moment vectors determined from aeroservoelastic simulations for several cross sections of a 34 m blade and certification test loads contrasted with strength and stability resistance of the whole blade's cross sections from 0 to 100 % blade length (lB) in terms of the root bending moment (excerpt from Branner et al. (2015)). The two moment vectors represent the critical load directions at 35 and 50 % lB.
3.2 Load direction in static testing
When designing a static FST, the usual procedure is to use a worst-case load envelope of each cross section along the blade span (Fig. 2) to create the target loads. From these envelopes at least two load directions are extracted for the static load case. Either the pure lead–lag or flapwise load cases (PTS, STP, LTT and TTL as explained in Fig. 2) or any combination of these load directions can be chosen for the tests. Considering the stress exposure (Eq. 3) of the critical area of interest of each cross section individually, however, the load direction leading to the critical stress exposure is not necessarily identical to the overall full-scale loading directions.
In Fig. 2 the load envelopes at different cross sections along the blade are plotted against the strength and stability resistance envelope of all cross sections, i.e., the whole blade. Furthermore, the load direction with the critical stress exposure is highlighted by way of example for two different cross sections at 35 % blade length (lB) and 50 % lB, where the critical load directions are a combination of PTS plus LTT and STP plus LTT, respectively.
Theoretically, the load envelopes should be compared to the resistance envelopes at each particular cross section to determine the most critical load directions. The determination of the resistances for each cross section is only possible via analysis of a blade segment or subcomponent cutout from the full blade subjected to the load envelope determined from aeroservoelastic simulations.
SCT allows for the flexible adjustment of these critical loading configurations for particular blade segments on an individual basis.
3.3 Load direction in fatigue testing
With regard to the load direction, the uni-axial, resonant FFST is constrained to the static blade dead load (suction-side points towards the strong floor) superimposed with the dynamic inertia loads of the mode shape of the blade. According to IEC (2012), the mean loads applied during FFST shall be as close as possible to the mean load at the operating conditions that cause the most severe fatigue damage.
Since no load directions other than the first and second modal shapes, i.e., lead–lag and flap, are possible, the only degree of freedom during uni-axial, resonant FST is the direction of the gravity load due to the pitching position of the blade.
The loads for FFST and field calculations are elaborated by way of example using the DTU10MW reference turbine (Bak et al., 2013) with respect to the loading of the trailing-edge bond line. A simplified load calculation was conducted comprising the superposition of the quasistatic mean flapwise aerodynamic load for 10 wind speed bins plus the lead–lag gravity load due to the rotor revolution as a function of the blade pitch angle.
A beam model implemented in ANSYS APDL (ANalysis SYStem Parametric Design Language) (Swanson, 2014) was assembled with a fully populated cross section stiffness matrix determined by the BEam Cross Section Analysis Software, BECAS (Blasques, 2014; Blasques and Bitsche, 2015; Blasques and Stolpe, 2012; Blasques et al., 2016). The blade parameterization and input generation were conducted using workflows from the FUSED-Wind framework (Zahle et al., 2015). The BEM-based aerodynamic rotor simulator CCBlade (Ning, 2014) was used and populated with airfoil polars determined by Rfoil, an extension of Xfoil (Drela, 1989) including rotational effects (Bosschers, 1996).
The lead–lag load cycles were determined on the basis of wind speed distribution and the rotor revolution as well as the design life of 20 years. Furthermore, damage-equivalent loads were determined following Freebury and Musial (2000) using an S–N exponent of m=10, which is a typical value for a glass-fiber-reinforced epoxy (GL, 2010) and ultimate loads as of Bak et al. (2013).
The greatest damage impact was found at wind speeds around conditions rated between 11.0 and 15.6 m s−1 (Figs. 3 and 4). Berring et al. (2014) found similar results for a 34 m blade. The relative damage impact peak at around the rated wind speed of an outboard cross section (Fig. 4) protrudes over the peak of an inboard cross section (Fig. 3) because in outboard regions the influence of aerodynamic loads predominates.
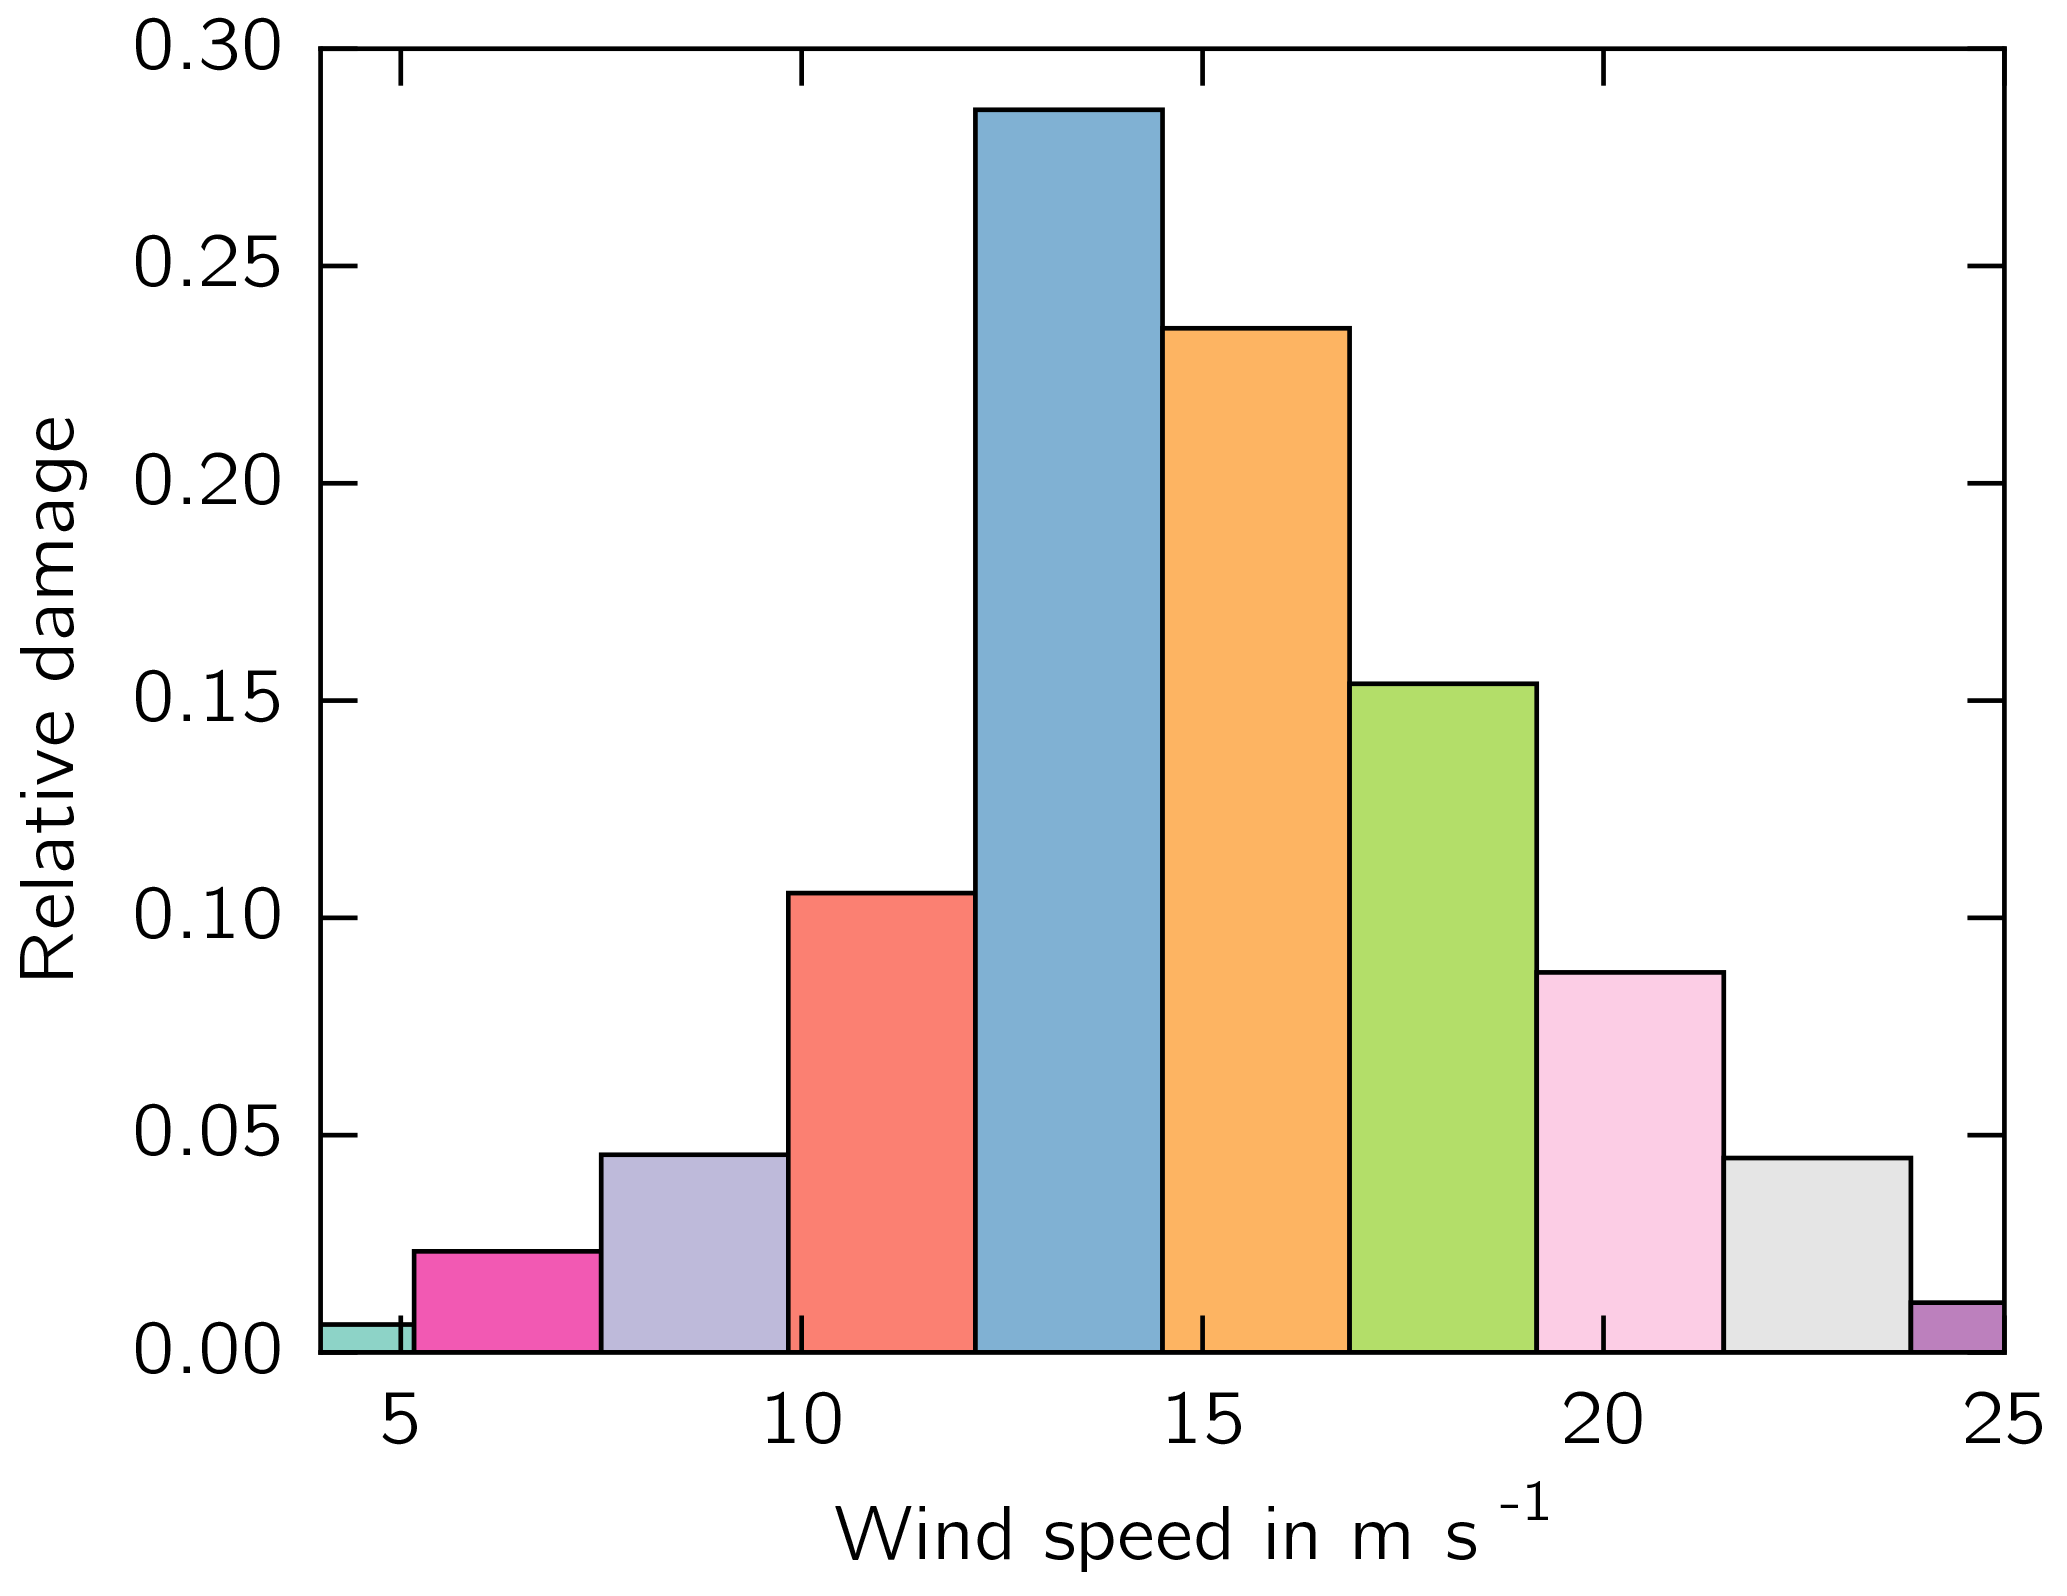
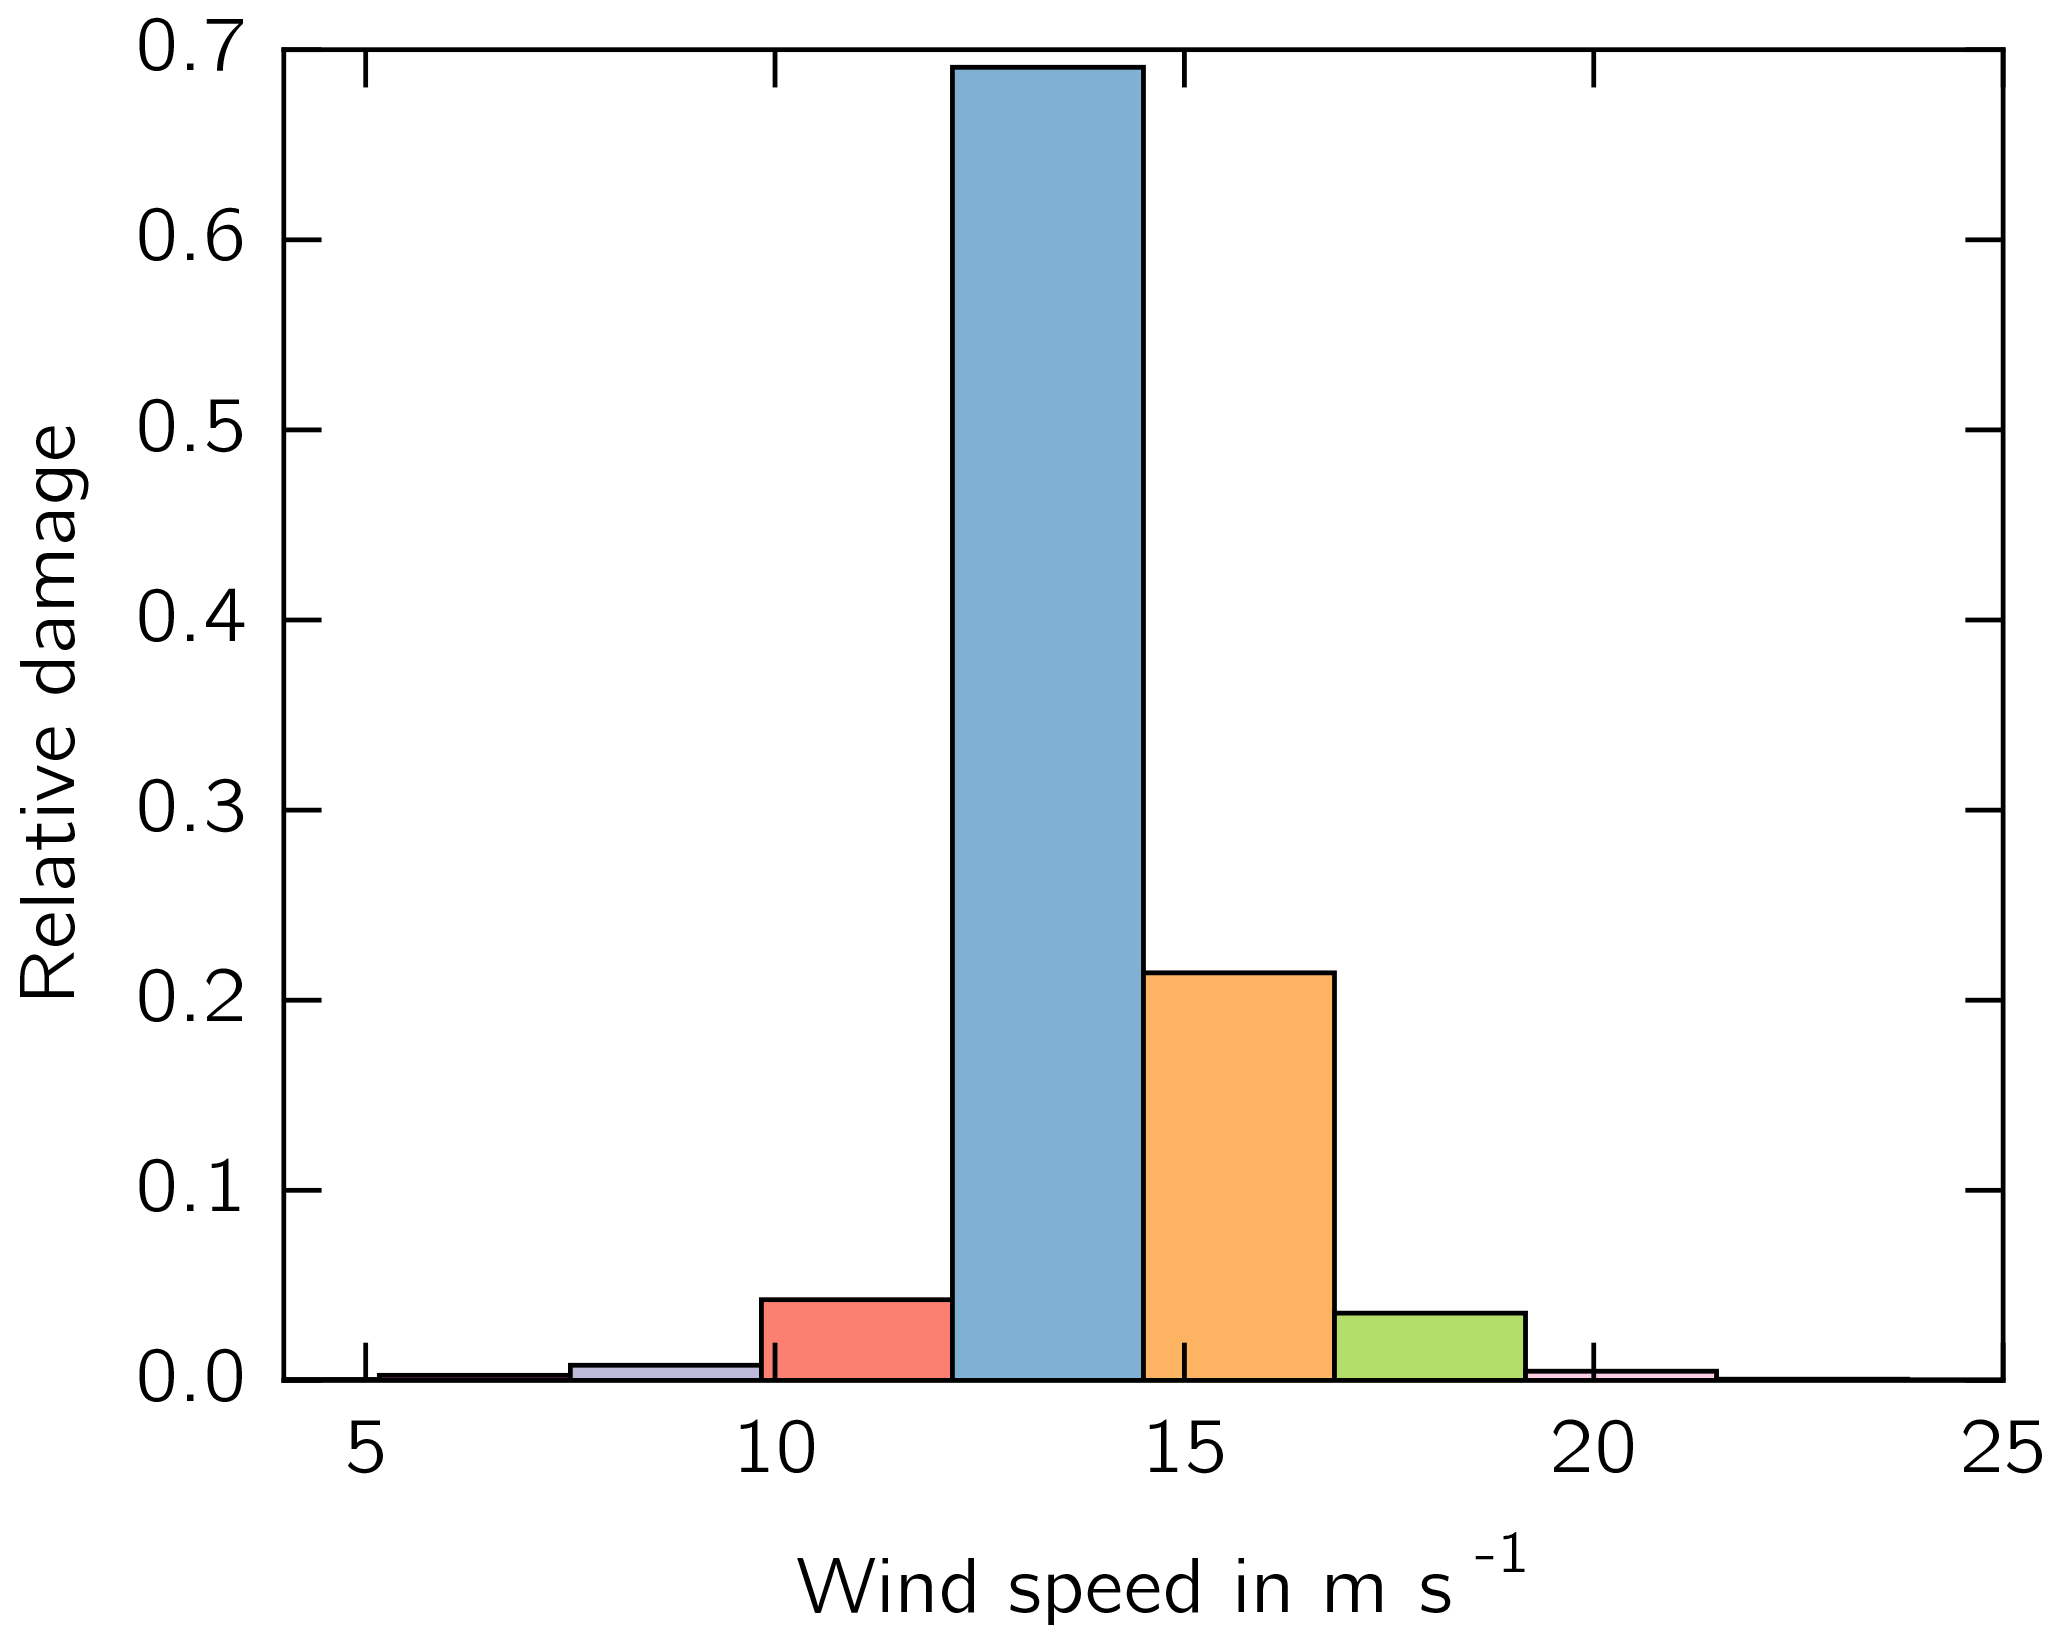
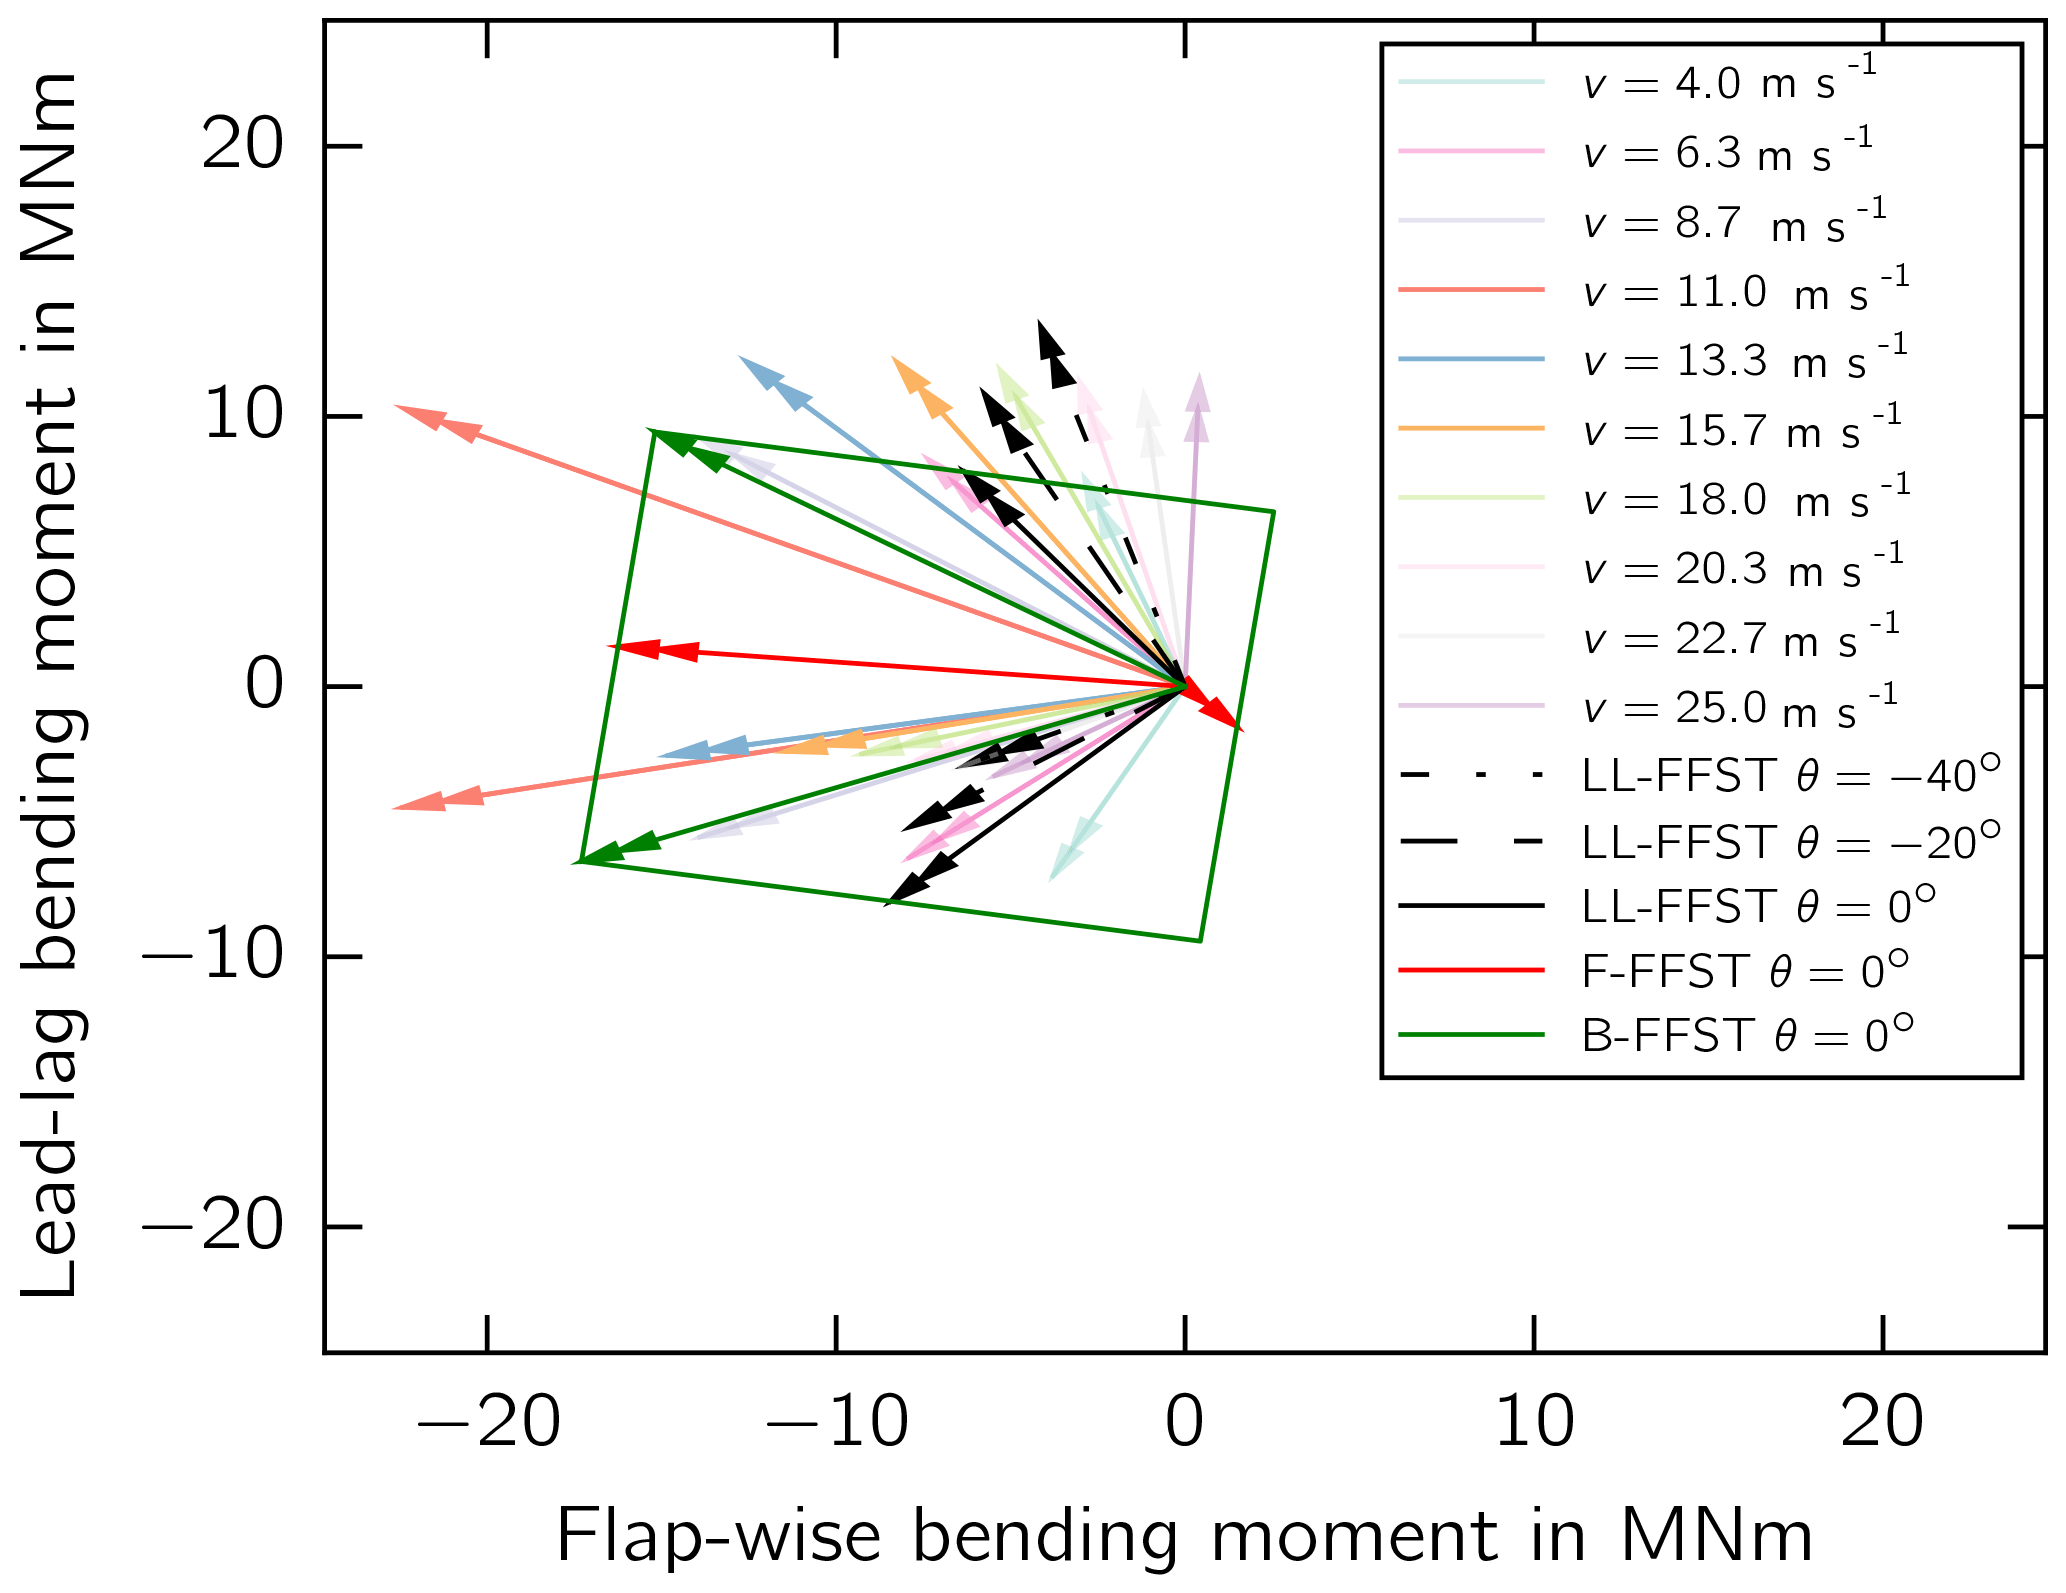
Figure 5Moment vectors of lead–lag loading at different wind speed bins and in a lead–lag fatigue full-scale blade test (LL-FFST) at different pitch angles at 10 % blade length. A flapwise FFST (F-FFST) and the bounding box of possible bi-axial FFST scenarios (B-FFST) are shown.
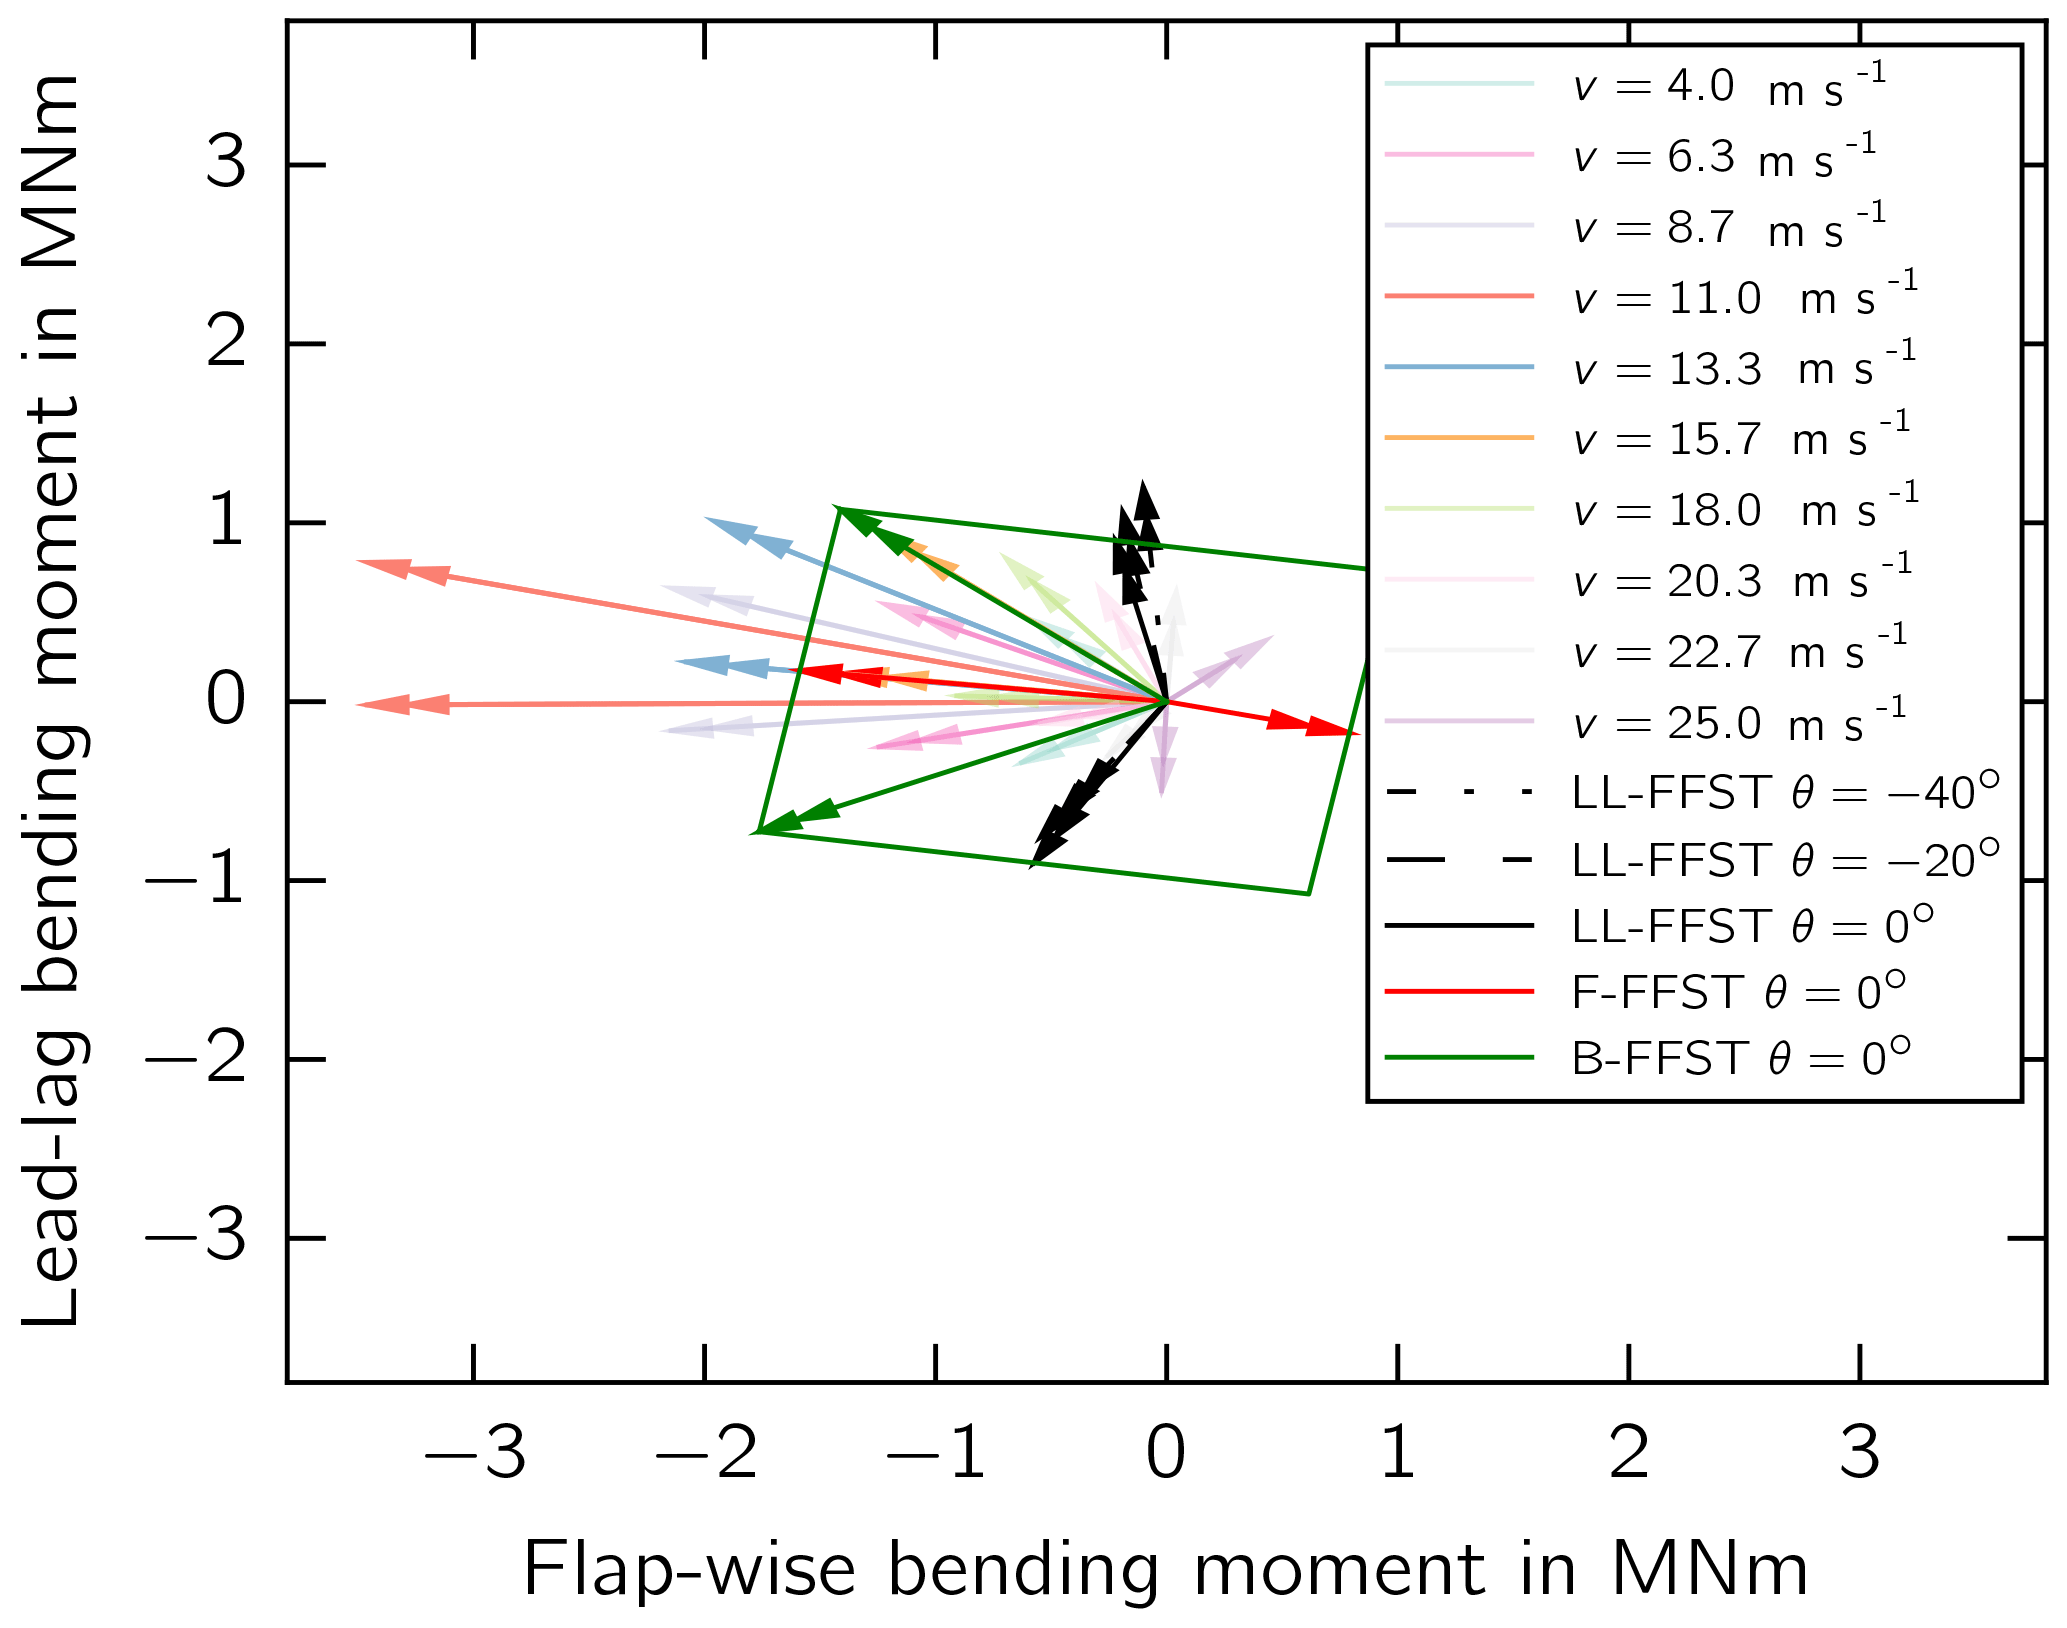
Figure 6Moment vectors of lead–lag loading at different wind speed bins and in a lead–lag fatigue full-scale blade test (LL-FFST) at different pitch angles at 70 % blade length. A flapwise FFST (F-FFST) and the bounding box of possible bi-axial FFST scenarios (B-FFST) are shown.
Furthermore, uni-axial, resonant, flapwise and lead–lag FFSTs were designed. To this end, the flapwise and lead–lag target loads were calculated on the basis of damage-equivalent loads and scaled according to Palmgren (1924) and Miner (1945) to cycle numbers of respectively 1.0×10⁶ and 3.0×10⁶ using an S–N exponent of m=10. The test loads were determined on the basis of the inertia loads caused by the dynamic excitation of the first flapwise and lead–lag dominated eigenmode extracted from a modal analysis. This load distribution was superimposed with the gravity loading according to the FFST setup for different pitch angles θ, where corresponds to the suction side pointing towards the strong floor and a negative pitch angle which rotates the leading edge towards the floor.
The minimum and maximum bending moment vectors acting at each wind speed bin according to field calculations and for three pitched lead–lag FFSTs are shown for two cross sections at 10 and 70 % blade length (Figs. 5 and 6). From the angle between the minimum and maximum moment vectors at the inboard cross section it can be seen that the lead–lag gravity loads dominate. Moreover, bending moment vectors for the flapwise FFST are superimposed with the lead–lag FFST. The resulting bounding box represents the extremes of the bending moment vector in different bi-axial testing scenarios, i.e., random-phase and phase-locked excitation with different flapwise and lead–lag testing frequency ratios (Post, 2016). The minimum and maximum bending moment vectors are highlighted for a bi-axial testing scenario that is closest to the field conditions.
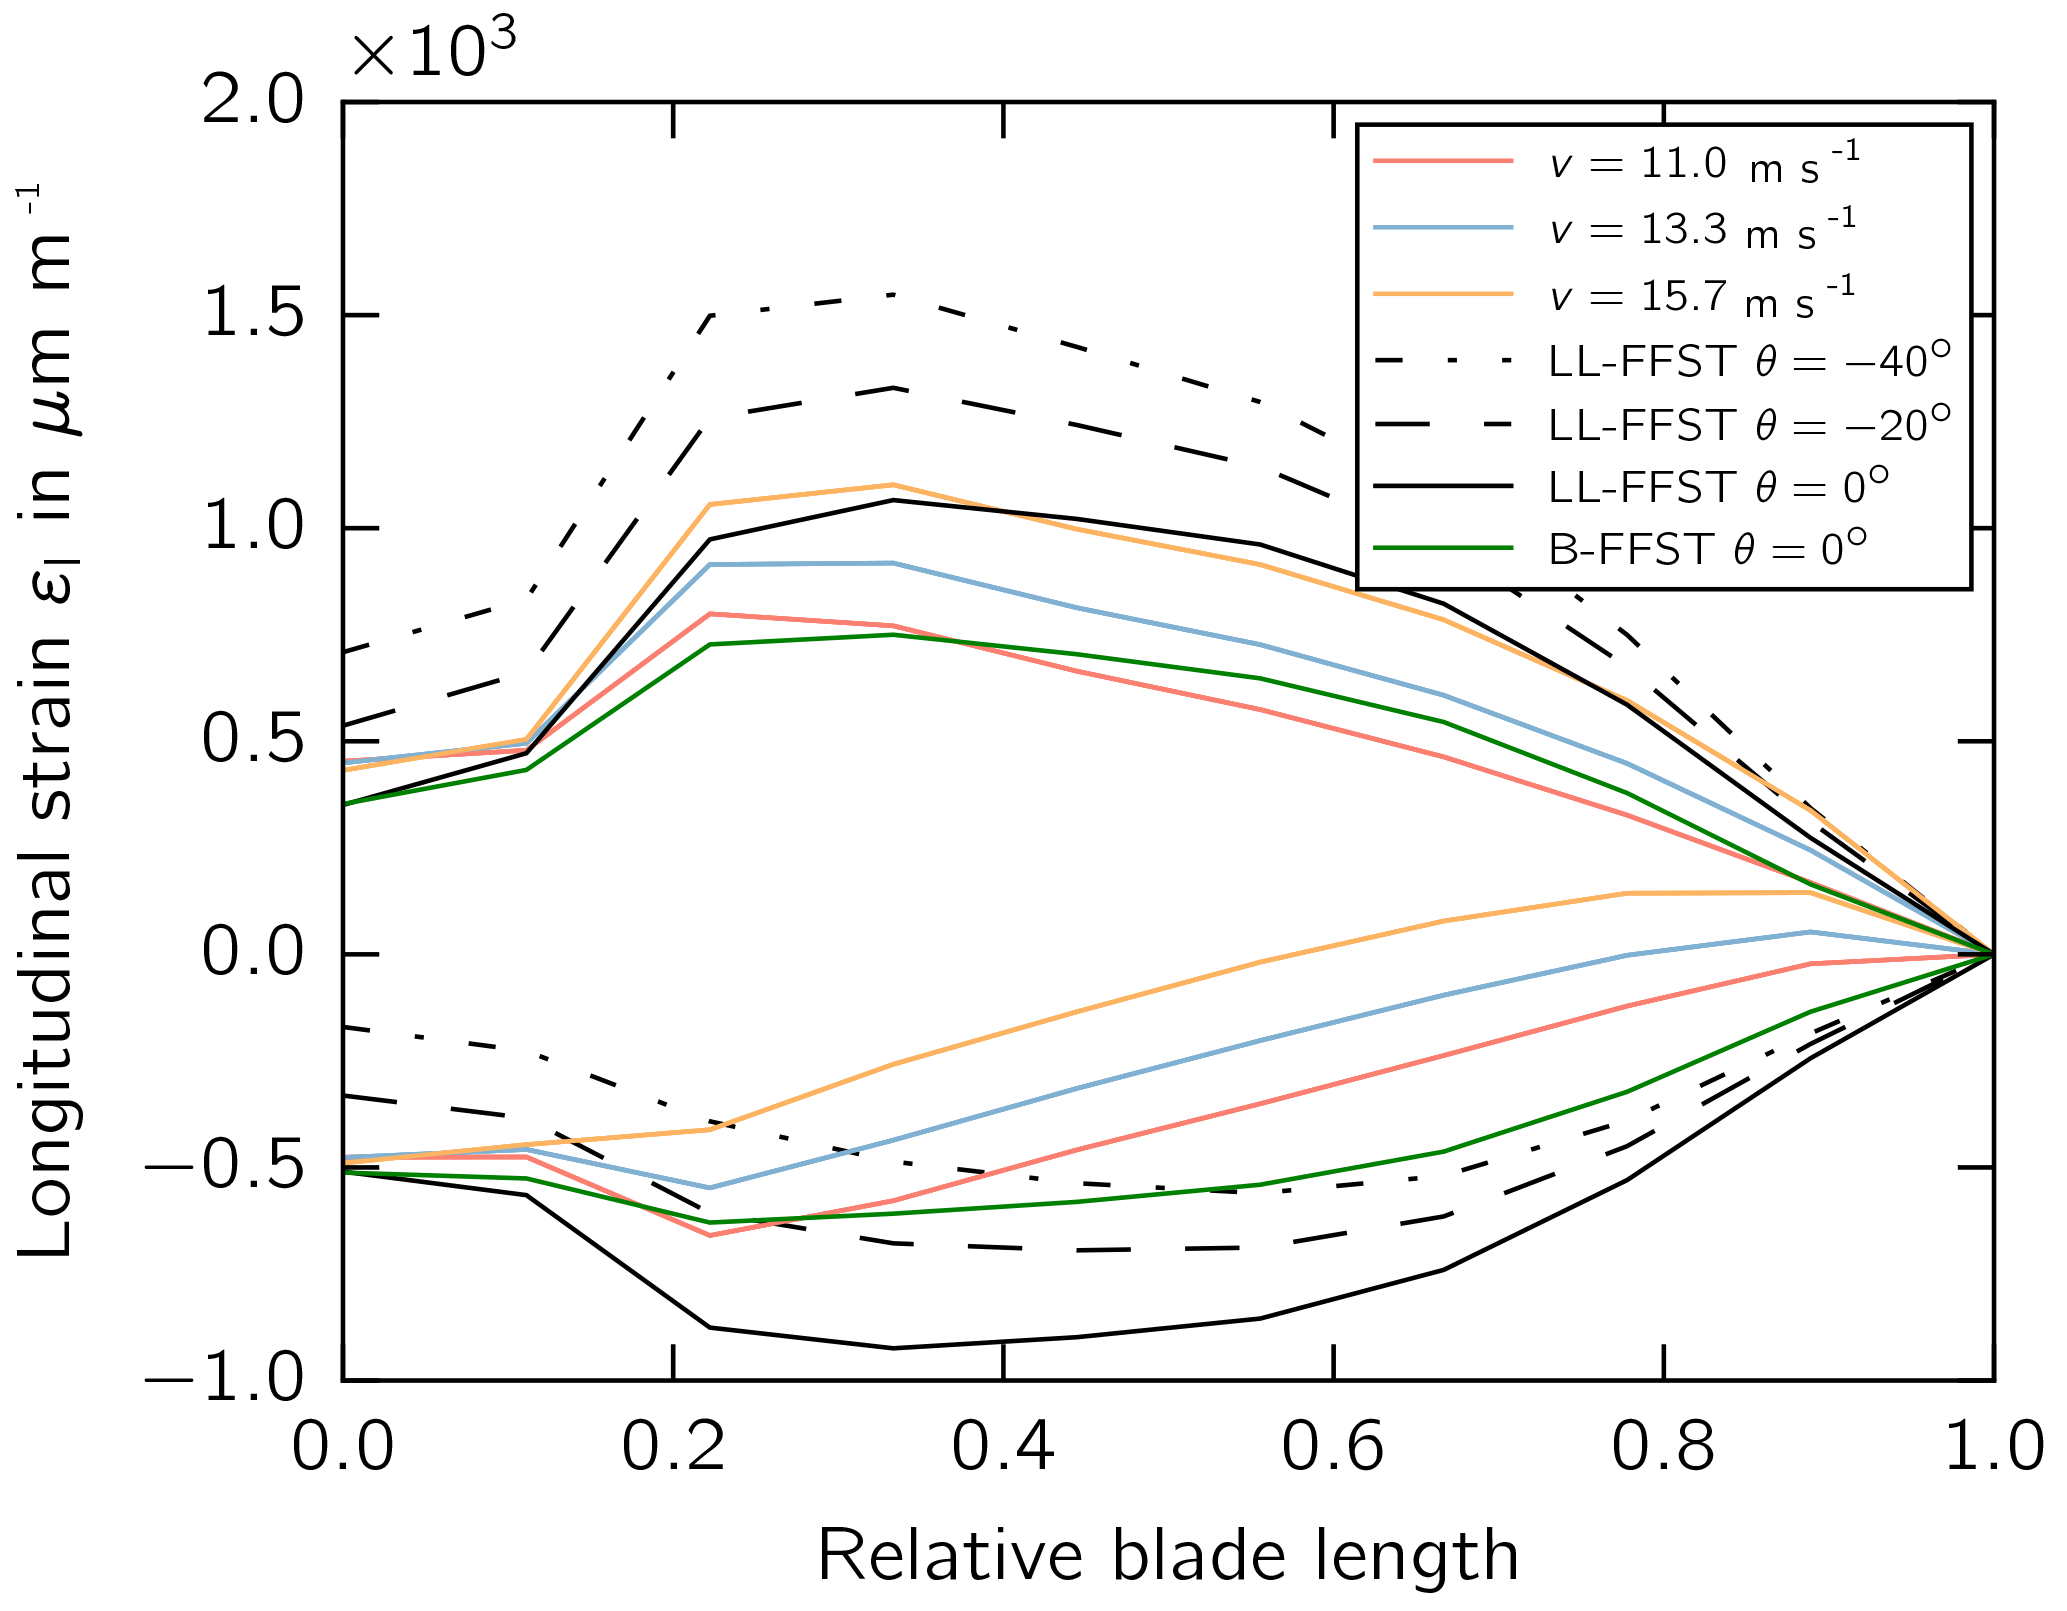
Figure 7Axial strain along the trailing-edge bond line at different wind speed bins, lead–lag (LL-FFST) and bi-axial (B-FFST) fatigue full-scale blade tests at different pitch angles.
Moreover, Eder and Bitsche (2015) showed that the quantity of geometrically nonlinear deformations, e.g., breathing or pumping of the trailing-edge panel, depends on the load direction. In particular, this deformation is expected to be most prominent for moment vectors within the second and fourth quadrants of the cross section coordinate system as shown in Figs. 5 and 6. Pitching the blade in an FFST helps to adjust the mean load direction towards field load directions for one cross section along the span. In an SCT setup any of the loading scenarios for the different wind speed bins which are shown can theoretically be replicated by shifting the load introducing ball joints while tuning the bending moments (Rosemeier et al., 2016), leading to a more realistic loading condition in the test.
Using the loading of the most severe wind speeds (11.0, 13.3, 15.7 m s−1), the longitudinal strains in the direction of the blade span at the trailing-edge bond line were determined for the minimum and maximum amplitudes (Fig. 7). It can be seen that the trailing-edge bond line is loaded more in compression during an FFST at compared to the strains determined from field load calculations.
Assuming linear elastic material behavior, the stress ratio R can be expressed as the strain ratio between the minimum and maximum longitudinal strains:
Considering the R of the field load calculation (Fig. 8), the deviation becomes even more prominent towards the tip, where the loading tends more towards a tension–tension than a tension–compression loading condition. Pitching the blade in an FFST increases the stress ratio, but the inclination of the stress ratio distribution is the opposite to that obtained in field simulations. Thus, in an FFST only the stress ratio of a defined cross section can be obtained via pitching. As already stated above, in an SCT the stress ratio can be adjusted according to the cross section of interest.
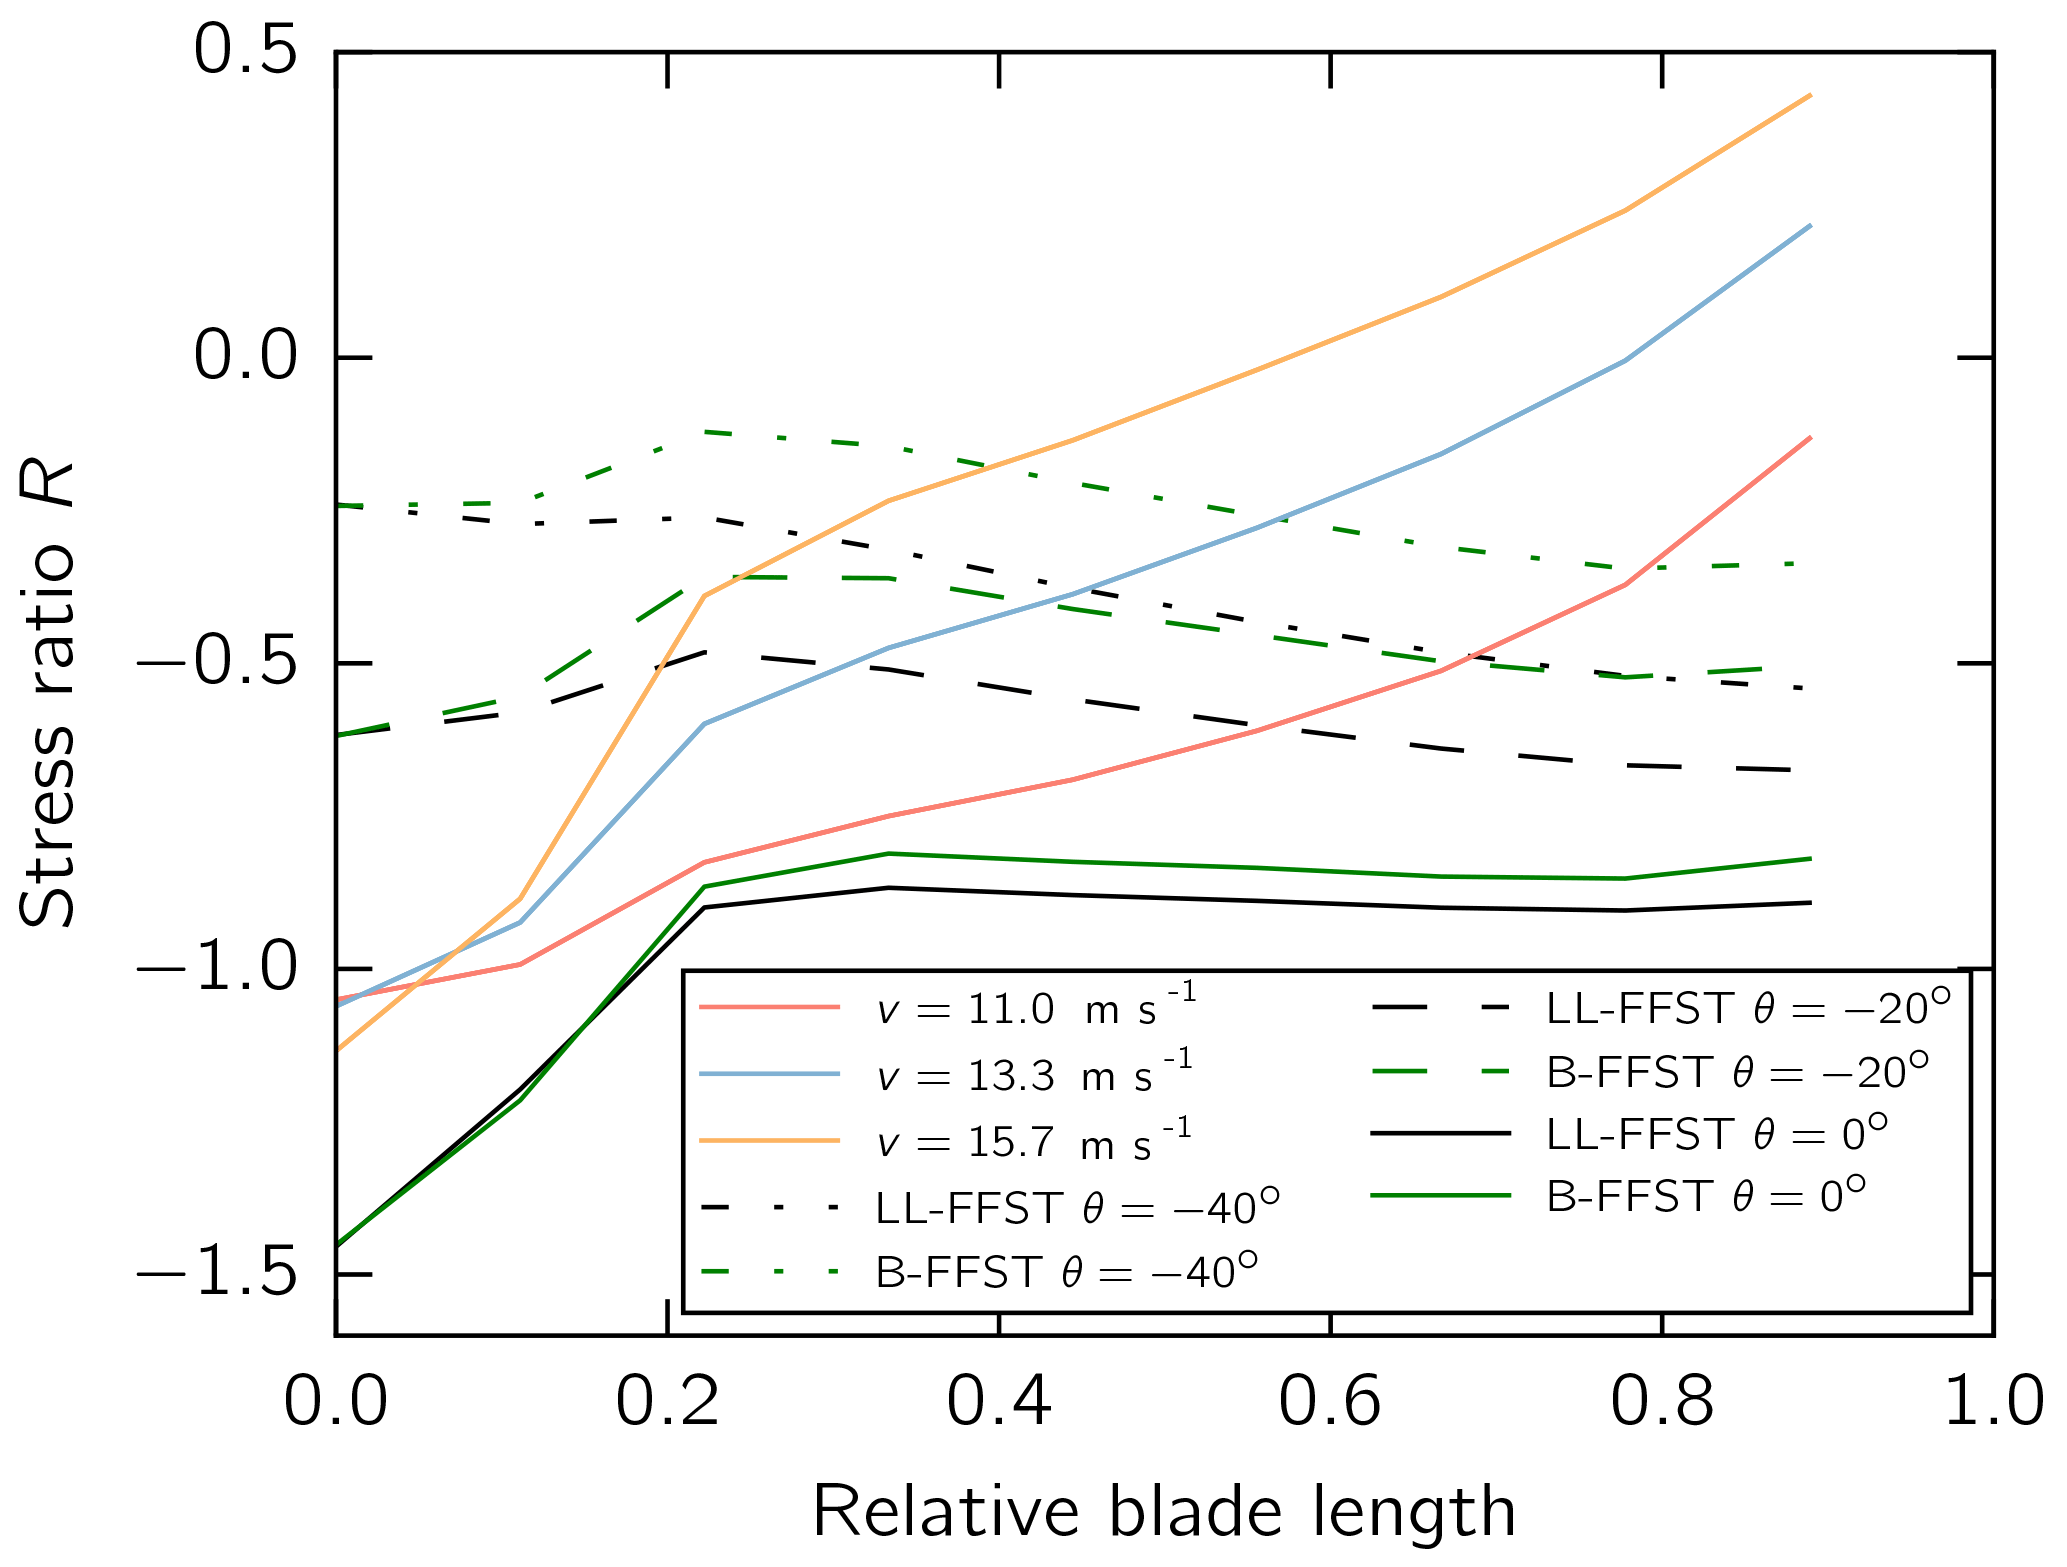
Figure 8Stress ratio R of the axial strain along the trailing-edge bond line at different wind speed bins, and lead–lag (LL-FFST) and bi-axial (B-FFST) fatigue full-scale blade tests at different pitch angles.
3.4 Stress ratio and testing time
The testing time is compared for the two testing concepts FFST and SCT. To this end, the loading at the trailing-edge bond line due to FFST is compared to the field calculations.
On the basis of the formulation by Puck (1996), the internal loading of a material is expressed in terms of stress exposure e (also referred to as effort), which means an ambient stress σ over the allowable stress (fracture resistance), which is here the tensile strength Rt. Thus the stress exposure is generally defined as
Furthermore, the materials of a rotor blade, i.e., adhesive, resin and glass fiber, can be considered to be isotropic. Assuming that a symmetric constant life diagram (Sutherland, 1999) is applicable for an isotropic material (Krimmer et al., 2016), the allowable cycle number to failure Ni for a given load collective i, with a mean stress exposure and a stress exposure amplitude , is derived from
This means that the cycle number is directly related to the mean stress exposure, the stress exposure amplitude and to the material-dependent S–N curve exponent m.
Assuming the same S–N curve exponent m for different stress ratios,
the allowable load cycle number of a load collective of any ratio NiR and the allowable load cycles can be expressed as the relation (Appendix A):
The relation is plotted for different stress exposure amplitudes in Fig. 9.
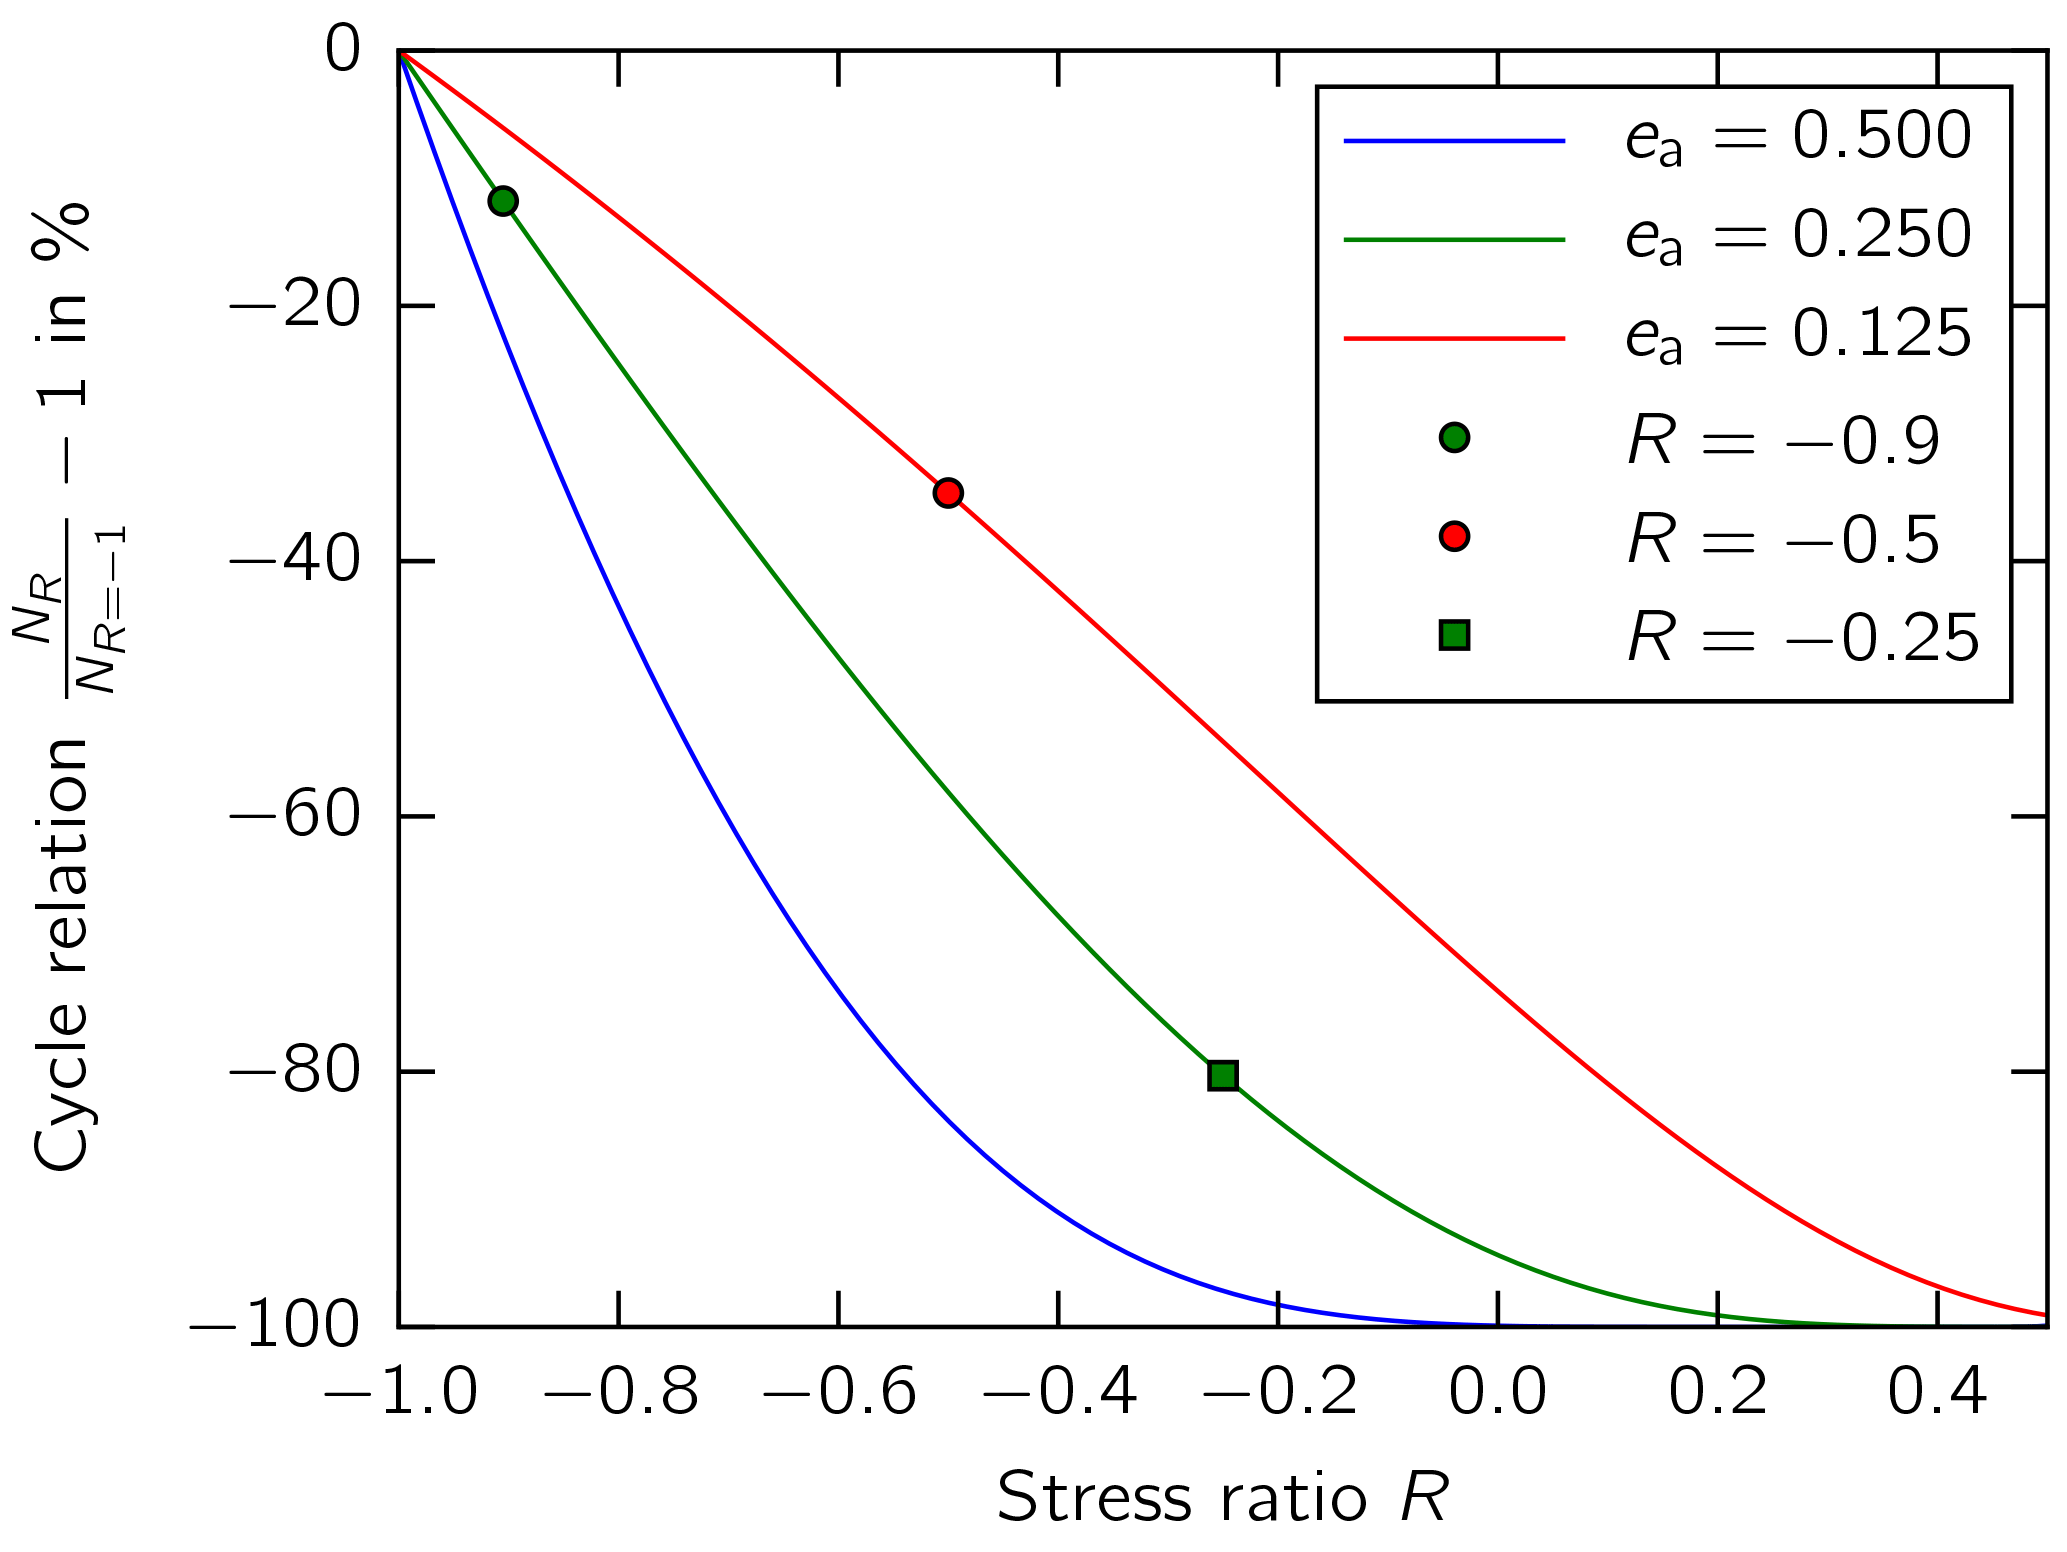
Figure 9Impact of stress ratio on the relation between allowable cycles using any testing stress ratio and a stress ratio of (Eq. 6) shown for different stress exposure amplitudes. An S–N curve exponent of m=10 was used.
The pure testing time in days can be determined using
where Ntest corresponds to the number of test cycles and ftest to the test frequency.
For a lead–lag FFST of the DTU10MW blade in a pitching position of and a test frequency equal to the blade's eigenfrequency of ftest=0.965 Hz, a stress ratio of with an stress exposure amplitude of ea=0.25 and results in a testing time of Ttest≈36 days. If the blade is pitched at , the stress ratio is increased from to and gets closer to stress ratios from field load calculations (Fig. 8). To overcome too high tension strains (Fig. 7), the stress exposure amplitude is decreased to ea=0.125. Owing to the effect of a higher stress ratio the testing time can be reduced by 23 % to Ttest≈28 days (green dot vs. red dot in Fig. 9).
When performing an SCT of a blade segment at 10 % blade length, the stress ratio of is close to the field calculations (Fig. 8). For this case, the testing time cannot be reduced by the testing cycles Ntest but only by an increase in testing frequency. Assuming a frequency of ftest=1.0…1.5 Hz, the testing time is slightly to moderately reduced to Ttest≈35…23 days compared to an FFST at . When a segment at 70 % blade length is considered for an SCT with a realistic stress ratio of from field calculations (Fig. 8) and an stress exposure amplitude of ea=0.25, the test cycles can be further reduced by 47…68 % compared to an FFST with a pitch angle between (green square vs. red dot in Fig. 9). Assuming a test frequency between ftest=1.0…1.5 Hz, the testing time results in Ttest≈11…7 days.
The loading conditions of a combined static full-scale blade test (SFST), lead–lag and bi-axial fatigue full-scale blade test (FFST) were compared to field simulations.
It was demonstrated that SFST does not necessarily cover all critical loading conditions along the blade length. Blade subcomponent testing (SCT) allows the flexible adjustment of the load direction for each segment of interest individually. Thus, the use of SCT could enhance the structural reliability by covering all relevant loading directions in contrast to testing the blade solely in its full-scale loading directions.
The simultaneous benefit and drawback of the SCT method is that only one blade segment is considered. Furthermore, the design of the boundary conditions of an SCT relies on detailed models.
It was calculated that the load directions and the stress ratios at the trailing-edge bond line along the blade differ significantly in part between the field and FFST. The load direction and stress ratio of a particular cross section in an FFST, however, can be arbitrarily adjusted towards the field load conditions by pitching the blade. The calculation has shown that the load direction in a bi-axial FFST seems to be closer to the field load conditions, but it does not affect the stress ratio at the trailing-edge bond line along the blade, whereas an SCT can be adjusted in any case to realistically replicate the field conditions. Furthermore, using SCT means the testing time of one blade segment can be significantly reduced when the field stress ratio is larger than the stress ratio the blade is subjected to in FFST.
There are different application scenarios for SCT, e.g., the detailed exploration of different design variants of a certain blade part under specific loading (not possible in FST). These experiments can be conducted within the design phase before or in hand with the certification FST or, in the case of a design revision, after the certification FST. Although these benefits of SCT can add value to the design process, SCT is not necessarily intended to replace FST.
On the basis of the assumptions presented for the damage calculation, it is shown that the mean stress level plays a substantial role in the fatigue damage calculation.
The used input data and obtained result data are available at https://doi.org/10.5281/zenodo.1208135 (Rosemeier et al., 2018). The script necessary to reproduce the results is not publicly available since it partly refers to not published source code.
The authors declare that they have no conflict of interest.
This article is part of the special issue “Wind Energy Science Conference 2017”. It is a result of the Wind Energy Science Conference 2017, Lyngby, Copenhagen, Denmark, 26–29 June 2017.
We acknowledge the support of the European Commission's Seventh Framework
Programme within the IRPWind project (609795) and the support within the
Future Concept Fatigue Strength of Rotor Blades project granted by the German
Federal Ministry for Economic Affairs and Energy (BMWi) (0325939) and the
Senator for Health, Environment and Consumer Protection of the Free Hanseatic
City of Bremen within the ERDF programme Bremen 2014-2020
(201/PF_IWES_Zukunftskonzept_Betriebsfestigkeit_Rotorblätter_
Phase I).
Edited by: Athanasios Kolios
Reviewed by: Peter Joosse and one anonymous referee
Antoniou, A., Branner, K., Lekou, D., Nuin, I., and Nijssen, R.: Methodology for testing subcomponents; background and motivation for subcomponent testing of wind turbine rotor blades, Tech. rep., Deliverable Number D7.1, Integrated Research Programme on Wind Energy (IRPWind), 2015. a
Bak, C., Zahle, F., Bitsche, R., Kim, T., Yde, A., Henriksen, L., Hansen, M., Blasques, J., Gaunaa, M., and Natarajan, A.: Description of the DTU 10 MW Reference Wind Turbine – DTU Wind Energy Report-I-0092, Tech. rep., DTU Wind Energy, Denmark, 2013. a, b
Berring, P., Fedorov, V., Belloni, F., and Branner, K.: Advanced topics on rotor blade full-scale structural fatigue testing and requirements, Tech. rep., DTU Wind Energy, 2014. a
Blasques, J. P.: Multi-material topology optimization of laminated composite beams with eigenfrequency constraints, Compos. Struct., 111, 45–55, 2014. a
Blasques, J. and Bitsche, R.: An efficient and accurate method for computation of energy release rates in beam structures with longitudinal cracks, Eng. Fract. Mech., 133, 56–69, 2015. a
Blasques, J. P. and Stolpe, M.: Multi-material topology optimization of laminated composite beam cross sections, Compos. Struct., 94, 3278–3289, 2012. a
Blasques, J., Bitsche, R., Fedorov, V., and Lazarov, B.: Accuracy of an efficient framework for structural analysis of wind turbine blades, Wind Energy, 19, 1603–1621, 2016. a
Bosschers, J.: Modelling of rotational effects with a 2-D viscous-inviscid interaction code, NLR Contract Report CR, 96521, 1996. a
Branner, K., Eder, M., Berring, P., Belloni, F., Toft, H., Sørensen, J., Corre, A., Lindby, T., Quispitupa, A., and Petersen, T.: Experimental Blade Research - phase 2, Tech. rep., DTU Wind Energy, Denmark, 2015. a
Branner, K., Berring, P., and Haselbach, P.: Subcomponent testing of trailing edge panels in wind turbine blades, in: Proceedings of 17th European Conference on Composite Materials, 26–30 June 2016, Munich, Germany, 2016. a
DNV GL AS: DNVGL-ST-0376 – Rotor blades for wind turbines, available at: https://rules.dnvgl.com/docs/pdf/DNVGL/ST/2015-12/DNVGL-ST-03% 76.pdf (last access: 15 June 2016), 2015. a, b, c
Drela, M.: Xfoil: An analysis and design system for low reynolds number airfoilsii, University of Notre Dame, 1989. a
Eder, M. A. and Bitsche, R.: A qualitative analytical investigation of geometrically nonlinear effects in wind turbine blade cross sections, Thin Wall. Struct., 93, 1–9, 2015. a
Eder, M. A., Belloni, F., Tesauro, A., and Hanis, T.: A multi-frequency fatigue testing method for wind turbine rotor blades, J. Sound Vib., 388, 123–140, 2017. a
Freebury, G. and Musial, W.: Determining equivalent damage loading for full-scale wind turbine blade fatigue tests, in: 2000 ASME Wind Energy Symposium, 10–13 January 2000, Reno, NV, USA, 287–296, https://doi.org/10.2514/6.2000-50, 2000. a
GL: Guideline for the Certification of Wind Turbines, Germanischer Lloyd Industrial Services, Hamburg, Germany, 2010. a
Greaves, P. R., Dominy, R. G., Ingram, G. L., Long, H., and Court, R.: Evaluation of dual-axis fatigue testing of large wind turbine blades, P. I. Mech. Eng. C-J. Mec., 226, 1693–1704, 2012. a
Haselbach, P. U., Eder, M. A., and Belloni, F.: A comprehensive investigation of trailing edge damage in a wind turbine rotor blade, Wind Energy, 19, 1871–1888, https://doi.org/10.1002/we.1956, 2016. a
Heijdra, J., Borst, M., and Van Delft, D.: Wind turbine blade structural performance testing, in: Advances in Wind Turbine Blade Design and materials, Woodhead Publishing, Sawston, Cambridge, UK, https://doi.org/10.1533/9780857097286.3.432, 432–445, 2013. a, b
IEC: IEC 61400-23 – Wind Turbines Part 23: Full-scale Structural Testing of Rotor Blades, International Electrotechnical Commission, Geneva, Switzerland, 2012. a, b, c, d, e
IEC: IEC 61400-5 – Wind Energy Generation Systems - Part 5: Wind Turbine Blades (draft in RevU), International Electrotechnical Commission, Geneva, Switzerland, 2017. a
Krimmer, A., Leifheit, R., and Bardenhagen, A.: Assessment of quasi-static and fatigue performance of uni-directionally fibre reinforced polymers on the basis of matrix effort, 6th EASN International Conference on Innovation in European Aeronautics Research, Porto, Portugal, 18–21 October 2016. a, b
Kühlmeier, L.: Buckling of wind turbine rotor blades – Analysis, design and experimental validation, PhD thesis, Aalborg University, Denmark, 2006. a
Lahuerta, F., de Ruiter, M. J., Espinosa, L., Koorn, N., and Smissaert, D.: Assessment of wind turbine blade trailing edge failure with sub-component tests, in: Proceedings of 21st International Conference on Composite Materials, 20–25 August 2017, Xi'an, Shaanxi, China, 2017. a
Lee, H. G. and Park, J.-S.: Optimization of resonance-type fatigue testing for a full-scale wind turbine blade, Wind Energy, 19, 371–380, 2016. a
Miner, M. A.: Cumulative damage in fatigue, J. Appl. Mech., 12, A159–A164, 1945. a
Nielsen, M., Jensen, F., Nielsen, P., Berring, P., Martyniuk, K., Roczek, A., Sieradzan, T., Roudnitski, V., Kucio, P., Bitsche, R., Andresen, P., Lukassen, T., Andrlová, Z., Branner, K., Bak, C., Kallesøe, B., McGugan, M., Wedel-Heinen, J., Lindby, T., Sørensen, F., Jensen, C., Knudsen, H., Uldahl, U., Rasmussen, A., and Rasmussen, J.: Full Scale Test of SSP 34 m blade, edgewise loading LTT: Data Report 1, Tech. rep., Danmarks Tekniske Universitet, Risø Nationallaboratoriet for Bæredygtig Energi, 2010. a
Ning, S. A.: A simple solution method for the blade element momentum equations with guaranteed convergence, Wind Energy, 17, 1327–1345, https://doi.org/10.1002/we.1636, 2014. a
Palmgren, A.: Die Lebensdauer von Kugellagern, Zeitschrift des Vereins Deutscher Ingenieure, 68, 339–341, 1924. a
Post, N.: Fatigue Test Design: Scenarios for Biaxial Fatigue Testing of a 60-Meter Wind Turbine Blade, Tech. rep., National Renewable Energy Laboratory, Golden, CO, USA, https://doi.org/10.2172/1271941, 2016. a, b
Puck, A.: Festigkeitsanalyse von Faser-Matrix-Laminaten: Modelle für die Praxis, Hanser, Munich, Germany, 1996. a
Roczek-Sieradzan, A., Nielsen, M., Branner, K., Jensen, F., and Bitsche, R.: Wind turbine blade testing under combined loading, in: Proc. of 32nd Risø International Symposium on Materials Science, 5–9 September 2011, Roskilde, Denmark, 32, 449–456, 2011. a
Rosemeier, M., Massart, P., and Antoniou, A.: Tailoring the design of a trailing edge sub-component test, 3rd annual IRPWind conference in Amsterdam, the Netherlands, 19–20 September 2016, https://doi.org/10.5281/zenodo.153837, 2016. a, b, c, d, e
Rosemeier, M., Basters, G., and Antoniou, A.: Repository of WESC2017 paper data – Benefits of subcomponent testing over full- scale blade testing elaborated on a trailing-edge bond line design [Data set], Zenodo, https://doi.org/10.5281/zenodo.1208135, 2018.
Snowberg, D., Dana, S., Hughes, S., and Berling, P.: Implementation of a Biaxial Resonant Fatigue Test Method on a Large Wind Turbine Blade, Tech. rep., National Renewable Energy Laboratory, National Renewable Energy Laboratory, Golden, CO, USA, https://doi.org/10.2172/1155105, 2014. a
Sutherland, H.: On the Fatigue Analysis of Wind Turbines, Tech. rep., Sandia National Laboratories, Albuquerque, NM, USA, https://doi.org/10.1.1.31.7908, 1999. a
Sutherland, H. and Mandell, J.: Optimised Goodman diagram for the analysis of fiberglass composites used in wind turbine blades, in: A Collection of the 2005 ASME Wind Energy Symposium: Technical Papers Presented at the 43rd AIAA Aerospace Sciences Meeting and Exhibit, Reno, Nevada 10, 18–27, 2005. a
Swanson, J. A.: ANSYS Mechanical APDL, version 15.0, 2014. a
White, D.: New method for dual-axis fatigue testing of large wind turbine blades using resonance excitation and spectral loading, Tech. rep., National Renewable Energy Lab., Golden, CO, USA, 2004. a
White, D., Musial, W., and Engberg, S.: Evaluation of the new B-REX fatigue testing system for multi-megawatt wind turbine blades, in: Proceeding, ASME/AIAA Wind Energy Symposium, Reno, NV, 2005. a
White, D., Desmond, M., Gowharji, W., Beckwith, J. A., and Meierjurgen, K.: Development of a dual-axis phase-locked resonant excitation test method for fatigue testing of wind turbine blades, in: ASME 2011 International Mechanical Engineering Congress & Exposition, 2011. a
Zahle, F., Réthoré, P.-E., Graf, P., Dykes, K., and Ning, A.: FUSED-Wind v0.1.0 (Version v0.1.0), Zenodo, https://doi.org/10.5281/zenodo.13899, 2015. a
The span is measured from the blade root.