the Creative Commons Attribution 4.0 License.
the Creative Commons Attribution 4.0 License.
 | 20 Oct 2020
Finite element simulations for investigating the strength characteristics of a 5 m composite wind turbine blade
Can Muyan
Full-scale structural tests enable us to monitor the mechanical response of the blades under various loading scenarios. Yet, these tests must be accompanied by numerical simulations so that the physical basis of the progressive damage development can be better interpreted and understood. In this work, finite element analysis is utilized to investigate the strength characteristics of an existing 5 m RÜZGEM composite wind turbine blade under extreme flapwise, edgewise and combined flapwise plus edgewise loading conditions. For this purpose, in addition to a linear buckling analysis, Puck's (2D) physically based phenomenological model is used for the progressive damage analysis of the blade. The 5 m RÜZGEM blade is found to exhibit sufficient resistance against buckling. However, Puck's damage model indicates that laminate failure plays a major role in the ultimate blade failure. Under extreme flapwise and combined load cases, the internal flange at the leading edge and the trailing edge are identified as the main damaged regions. Under edgewise loading, the leading edge close to the root is the failure region. When extreme load case is applied as a combination of edgewise and flapwise loading cases, less damage is observed compared to the pure flapwise loading case.
- Article
(4097 KB) - Full-text XML
-
Supplement
(3032 KB) - BibTeX
- EndNote


As fundamental eco-friendly renewable energy resources, wind turbines are designed to operate over a lifespan of 20 years. According to Holmes et al. (2007), the long-term structural reliability of wind turbine components is vital when the high cost of manufacturing, inspection and repair, especially for turbines located in remote regions, is considered. Composite blades are among the most critical components of a wind turbine, which are subjected to complex loading conditions. A rotor blade failure can have a significant impact on turbine downtime and safety. In order to assure sufficient mechanical resistance, structural testing and analysis must be conducted. However, structural testing methods, such as full-scale testing of the blade, are expensive and troublesome due to the construction of a test setup. For a better understanding and interpretation of the progressive damage development, tests need to be accompanied by numerical analysis methods (Chen et al., 2017). Moreover, structural analyses are utilized to calibrate structural blade test set-ups for different loading conditions.
In the literature, many studies on the structural behavior of composite turbine blades have been published in the past 2 decades with most of the studies conducted for large wind turbine blades. Jensen et al. (2006) carried out full-scale tests and nonlinear finite element (FE) simulations of a 34 m composite wind turbine blade under flapwise loading. In both the tests and the simulations, they noted that the spar cap (suction side) deflected nonlinearly and observed cross-sectional ovalization, i.e., the Brazier effect, arguing that the Brazier effect is the main reason for the blade collapse. Overgaard et al. (2010) reported on testing and numerical analysis of the collapse of a 25 m composite wind turbine blade subjected to static flapwise loading. In the study, in contrast to Jensen et al. (2006), the main failure mechanism which leads to blade collapse is argued to be delamination and its interaction with local buckling. It is stated that nonlinear strain behavior, i.e., local buckling, is triggered by geometrical imperfections. According to Overgaard et al. (2010) delamination and local buckling occur prior to the Brazier effect observed in spar caps. Once the blade is weakened by the aforementioned failure mechanisms, the blade collapses due to the compressive strains in fiber directions.
Yang et al. (2013) investigated the structural collapse of a 40 m blade and based on full-scale test results showed that aerodynamic shell debonding was the root cause of rotor blade collapse. Kim et al. (2014) studied the structural response of a multi-MW class wind turbine blade using Puck's 3D damage model and linear buckling analysis. According to the results, the blade shows sufficient structural strength and resistance against buckling. When laminate failure is of concern, the major weak point of the blade is located in the skin at the maximum chord. In another study, Chen et al. (2014) conducted a full-scale bending test of a 52.3 m wind turbine blade. Delamination in the spar cap and shear web failure in the root transition region were found to be the main failure mechanisms for the blade collapse. Local buckling contributed to the main failure mechanism by facilitating local out-of-plane deformation. They conclude that for large blades, through-the-thickness stresses which cause debonding and delamination at the blade root transition region need to be considered in the finite element analysis (FEA). In the follow-up study, Chen et al. (2017) stated that 3D stresses and strains are important in the failure of a 52.3 m blade and recommended the use of solid elements in the FE simulation when debonding failure is of concern. The Yeh–Stratton failure criterion and 3D strains were used to calculate delamination and debonding failures in the blade utilizing submodeling technique.
Haselbach and Branner (2016) discuss the initiation and development of trailing edge failure in the full-scale test of a 34 m wind turbine blade. They highlight the influence of buckling on the damage onset in the trailing edge and sandwich panel failure. As a further outcome of the study, they show that a modeling technique utilizing a fracture mechanics approach for the failure in the trailing edge delivers good agreement with experiments. Later, Haselbach (2017) investigated different trailing edge modeling methods in his work. He analyzed the trailing edge failure under edgewise and combined loading conditions. He concluded that modeling the adhesive bonding in the trailing edge with solid brick elements and connecting them to the shell elements of the skin with multipoint constraints (MPCs) shows the best agreement with experiments. Recently, Noever Castelos and Balzani (2016) studied the effect of geometric nonlinearities on the fatigue analysis of the trailing edge bonding in wind turbine blades. They point out that the superposition of stresses for the fatigue may be misleading for modern, flexible rotor blades where geometric nonlinearities must be considered. In addition to this, they propose a novel methodology for calculating stresses with a new load application method that reduces geometric nonlinear behavior of the blade.
Montesano et al. (2016) state that progressive failure models incorporating failure criteria do not consider the progressive nature of subcritical microscopic intralaminar damage, which is vital for predicting the onset of macroscopic failure modes. Therefore, in the study a physically based multiscale damage model, which can account for failures of a 33.25 m rotor blade under quasi-static and fatigue loading, is introduced. The simulation results show the capability of the model to predict the evolution of subcritical ply cracks between spar webs located near the blade root at maximum chord length. The capability of the model to show damage evolution in the early stages of the progressive damage analysis is important for increasing damage tolerance accuracy and structural health monitoring. In the follow-up work by Zuo et al. (2018), the multiscale model is further expanded to include cohesive zone elements to predict structural debonding failure at the spar–skin interface located near the blade root at maximum chord.
In contrast to large wind turbine blades, fewer investigations into the structural analysis of small wind turbine blades exist. Chen et al. (2015) focused on the local buckling resistance of 10.3 m wind turbine blades. FE analysis showed that configurations with sharp edges are susceptible to local buckling. During testing of the 10.3 m blade, although local buckling of shear webs and flatback airfoils was observed, composite laminate failure in these locations was not observed. These results show the possibility of different failure mechanisms for different blade sizes. In another study, to improve the structural strength of a small-size 9 m wind turbine blade, Paquette and Veers (2007) carried out a blade system design study (BSDS) where structural innovations such as flatback airfoils, large root diameter and carbon spar caps were introduced and their advantages were demonstrated. The static strength of the blades was determined by measuring strains to failure by tests and using finite element analysis. Moreover, linear buckling analysis of the blades was conducted.
Fagan et al. (2016) presented a new iterative design process and utilized failure criteria to check the structural strength of different blade designs under various load cases. Besides this, Fagan et al. (2017) utilized failure criteria for the structural design optimization of a 13 m glass-fiber epoxy composite wind turbine blade. In the study, experimental testing was used to calibrate finite element models. In these studies, Puck's damage model is used to determine the most suitable composite turbine blade design in terms of its structural behavior.
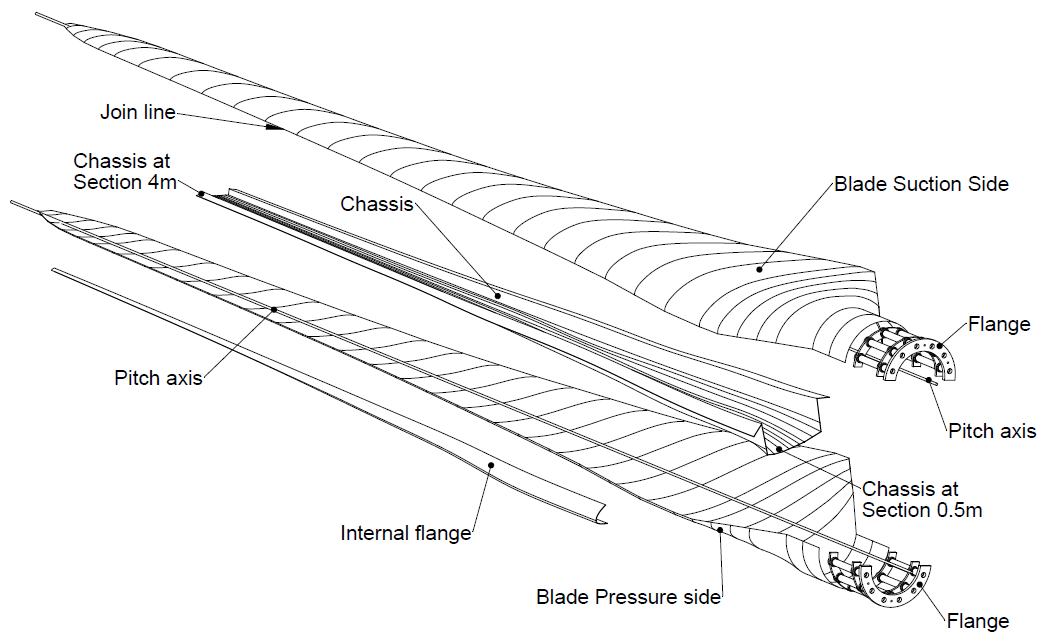
Figure 1Blade assembly for the 5 m RÜZGEM turbine blade (Philippidis and Roukis, 2013).
Within the framework of this study, the authors of this study refer back to their previous paper concerning the strength analysis of an existing 5 m RÜZGEM glass fiber reinforced polymer (GFRP) turbine blade using Puck failure criteria (Ozyildiz et al., 2018). As a part of the previous study, the linear Puck material model was compared with the progressive damage model (Puck). They concluded that progressive failure analysis is necessary to capture a more realistic simulation of failure mechanisms prior to testing.
The scope of this work is limited to the investigation of the structural response of an existing 5 m wind turbine blade using a global finite element modeling approach and progressive composite failure analysis. Hence, using the current modeling technique with shell elements, critical locations for failure and a worst-case load scenario are identified. Puck's 2D damage model demonstrates the direction to proceed for a complete and comprehensive modeling of the failure mechanisms. Furthermore, differences between edgewise, flapwise and combined flapwise–edgewise loading conditions are discussed. In combined edgewise and flapwise loading, less damage is observed compared to the pure flapwise loading case.
The existing blade investigated in this work was designed as part of a joint project between the Core Team of the University of Patras and METUWIND (RÜZGEM) – METU Center for Wind Energy. The blade was designed for a wind turbine that has a 30 kW nominal power capacity at 10 m s−1 wind speed. According to the wind turbine characteristics, optimized aerodynamic blade design was finalized by the blade manufacturer. The existing blade consists of five main parts: suction side, pressure side, internal flange, “hat-shaped” chassis (spar) and flange, as seen in Fig. 1.
For the progressive failure analysis of the blade, Puck criteria, explained briefly in the following paragraphs, are used. Puck failure criteria (Puck and Schürmann, 1998) are some of the most commonly used and well-established criteria for the assessment of composite laminate strength. In this study, Puck's failure criteria are implemented for the evaluation of stress results of unidirectional and triaxial composite laminates.
For fiber failure, Puck's criteria are as follows:
where and are stress exposures for fiber failure under tension and compression loading cases. σ1 is the stress value in the fiber direction; XT and XC are tensile and compressive strengths in the fiber direction, respectively. Puck's interfiber failure uses different equations depending on the failure mode detected. Under two-dimensional (2D) biaxial loading, the failure modes which can be detected are summarized in Fig. 2. In Fig. 2 the transition point from failure mode B to failure mode C is denoted by the point () and is calculated by the ratio . Their values are calculated by the expressions below:
and

Figure 2Failure envelope under biaxial loading (Knops, 2008).
Depending on the region of the failure envelope, the following interfiber failure expressions are written:
In the equations above and represent inclination parameters that control the shape of the failure envelope. According to Puck and Schuermann (1998), and are chosen for the GFRP material. σ2 is the stress value in the transverse fiber direction; YT and YC are tensile and compressive strengths in the transverse fiber direction. Shear stress and shear strength are represented by σ6 and S, respectively. If the value of stress exposure (fE) is equal to or greater than 1, failure initiation occurs. Mode A is caused by tensile and shear stresses. Modes B occurs under compressive and shear stresses. Mode C is a dangerous failure mode in compressive shearing, which may lead to delamination.
Degradation rules are applied to the elements which fail according to the specific Puck's failure criteria that are interfiber failure (IFF) mode A, B or C (Eqs. 6–8, respectively). As presented by Passipoularidis et al. (2011), based on degradation rules in Table 1, transverse elasticity and shear moduli of the damaged elements are reduced accordingly. Recommended parameters c, ηr and ξ for the degradation function of the GFRP material in Eq. (9) are taken from Knops and Bögle (2006). , and are the stress exposure values that are considered for determining the failure mode during the analysis.

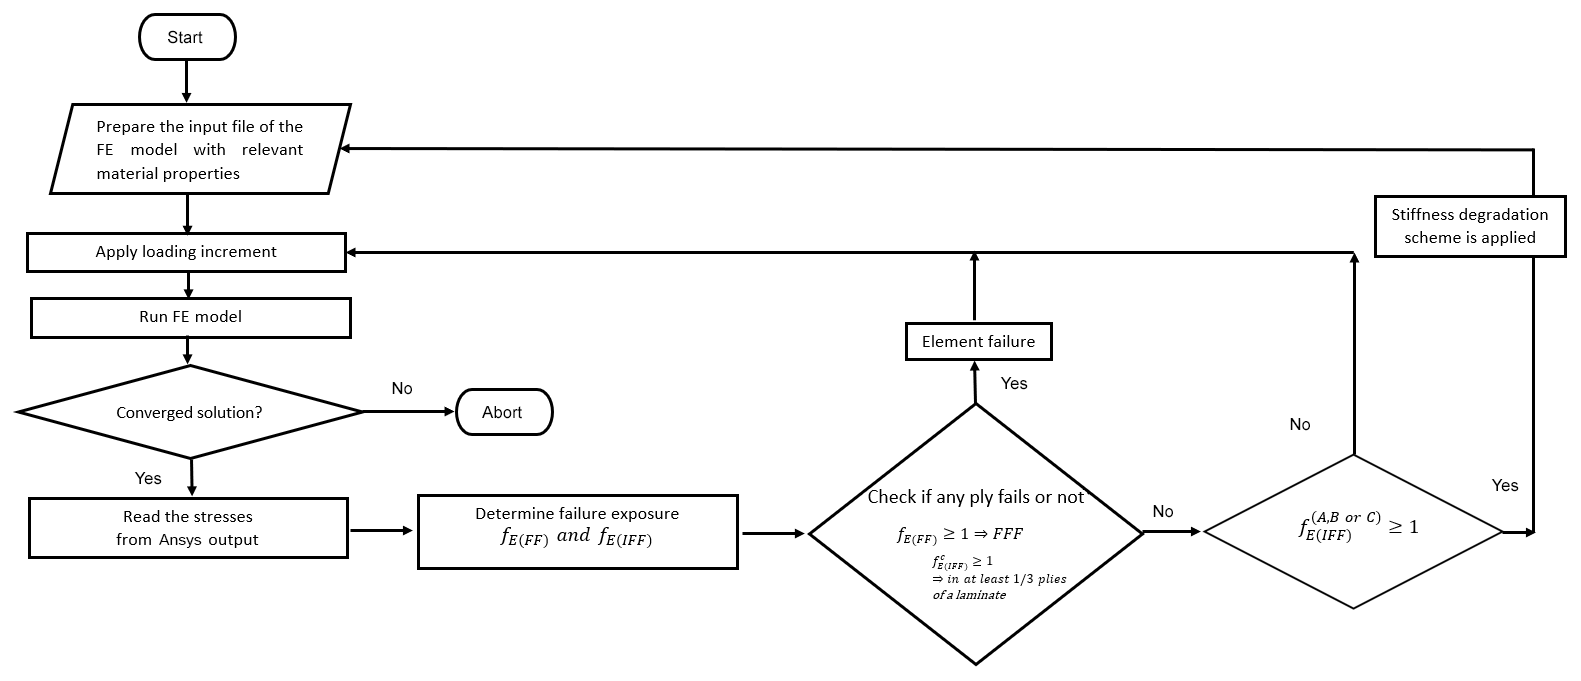
Figure 3Flowchart of the FE-analysis-based strength analysis of a composite laminate using Puck's damage model.
In Eq. (9) η is known as the degradation factor and can be expressed according to the equation below:
The summary of the algorithm of the FE-analysis-based progressive failure analysis of a composite laminate using Puck failure criteria is shown in Fig. 3. The complete algorithm is implemented using Ansys Parametric Design Language (APDL; Ansys Inc, 2017). First, using Ansys APDL script, different material numbers are given to each lamina, which constitutes a layer of a composite laminate. This step is necessary because, during the execution of the progressive damage propagation, each lamina is subjected to different degradation rules. Then, an extreme load case is applied incrementally to the model, and static analysis is run. Afterwards, in the postprocessing module, stresses are read. From Puck failure criteria for fiber failure (FF; Eqs. 1 and 2) and IFF (Eqs. 6–8), stress exposures are calculated. Depending on the rules presented in Table 1 whether ply failure happens is checked. If ply failure occurs due to first fiber failure (FFF) or if IFF (C) is observed in at least one-third of the plies of a laminate, laminate failure is assumed to take place. If IFF A or B or IFF C in any ply is seen, gradual degradation rules are applied, and after the assembly of the new constitutive material model, the load is increased and the analysis is rerun. This calculation procedure is run until the solution does not converge. If the solution does not converge, the analysis is aborted. As seen from the flow chart (Fig. 3), as long as no FF or IFF occurs, without updating the constitutive material model, load is incremented and the analysis is executed.
Validation of the APDL code against experimental data provided by Hinton et al. (2002) is carried out for the [0∕90]s GFRP laminate MY750 and carbon fiber reinforced polymer (CFRP) laminate AS4 3501-6 under uniaxial tension loading. As seen from Fig. 4, there is a good agreement between APDL code and experimental data for the progressive failure analysis of [0∕90]s GFRP MY750 and CFRP AS4 3501-6 laminates.
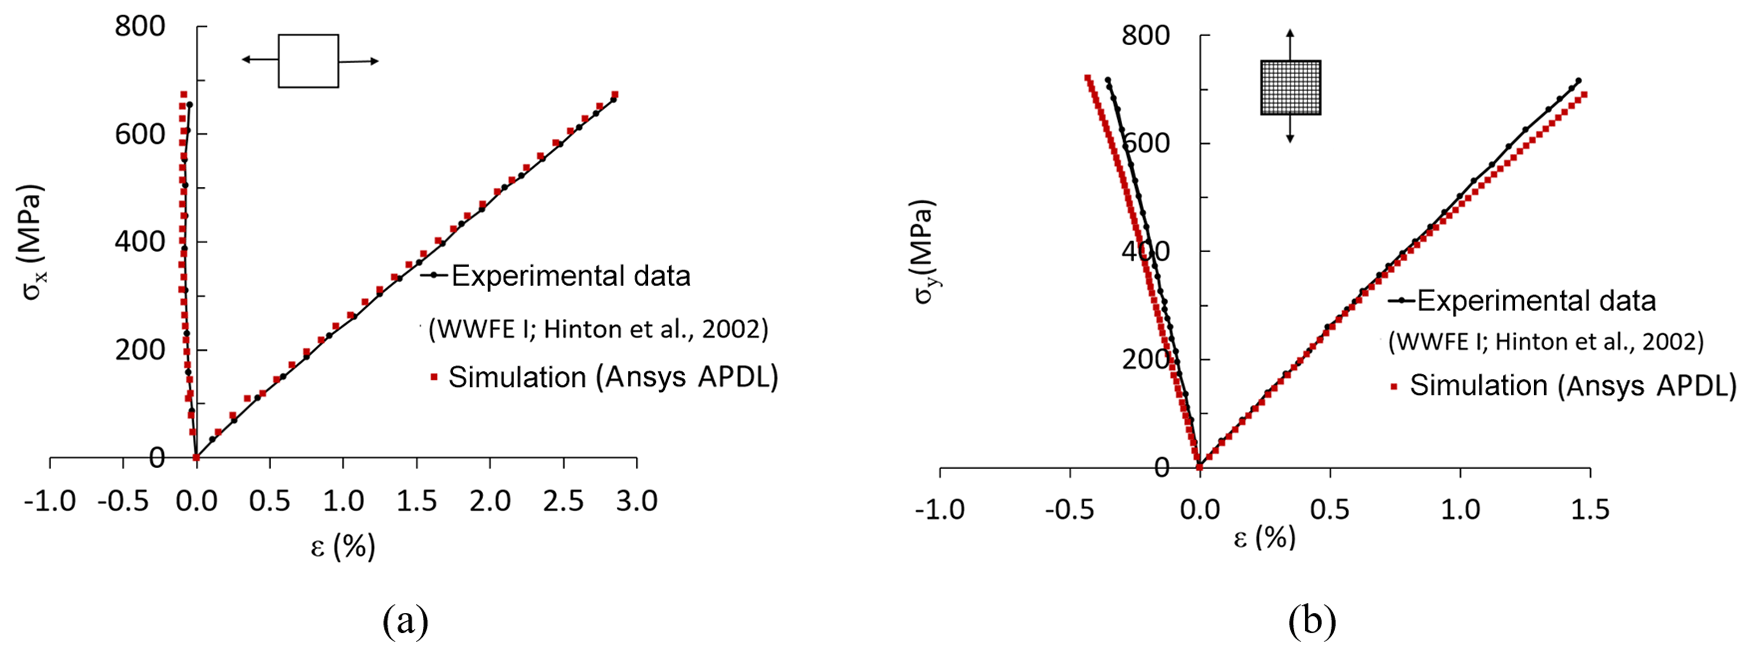
Figure 4Validation of the APDL code for the progressive failure analysis of (a) [0∕90]s GFRP MY750 laminate under σx uniaxial tension and (b) CFRP/AS4 3501-6 laminate under σy uniaxial tension (Hinton et al., 2002).
2.1 Finite element model of the RÜZGEM blade
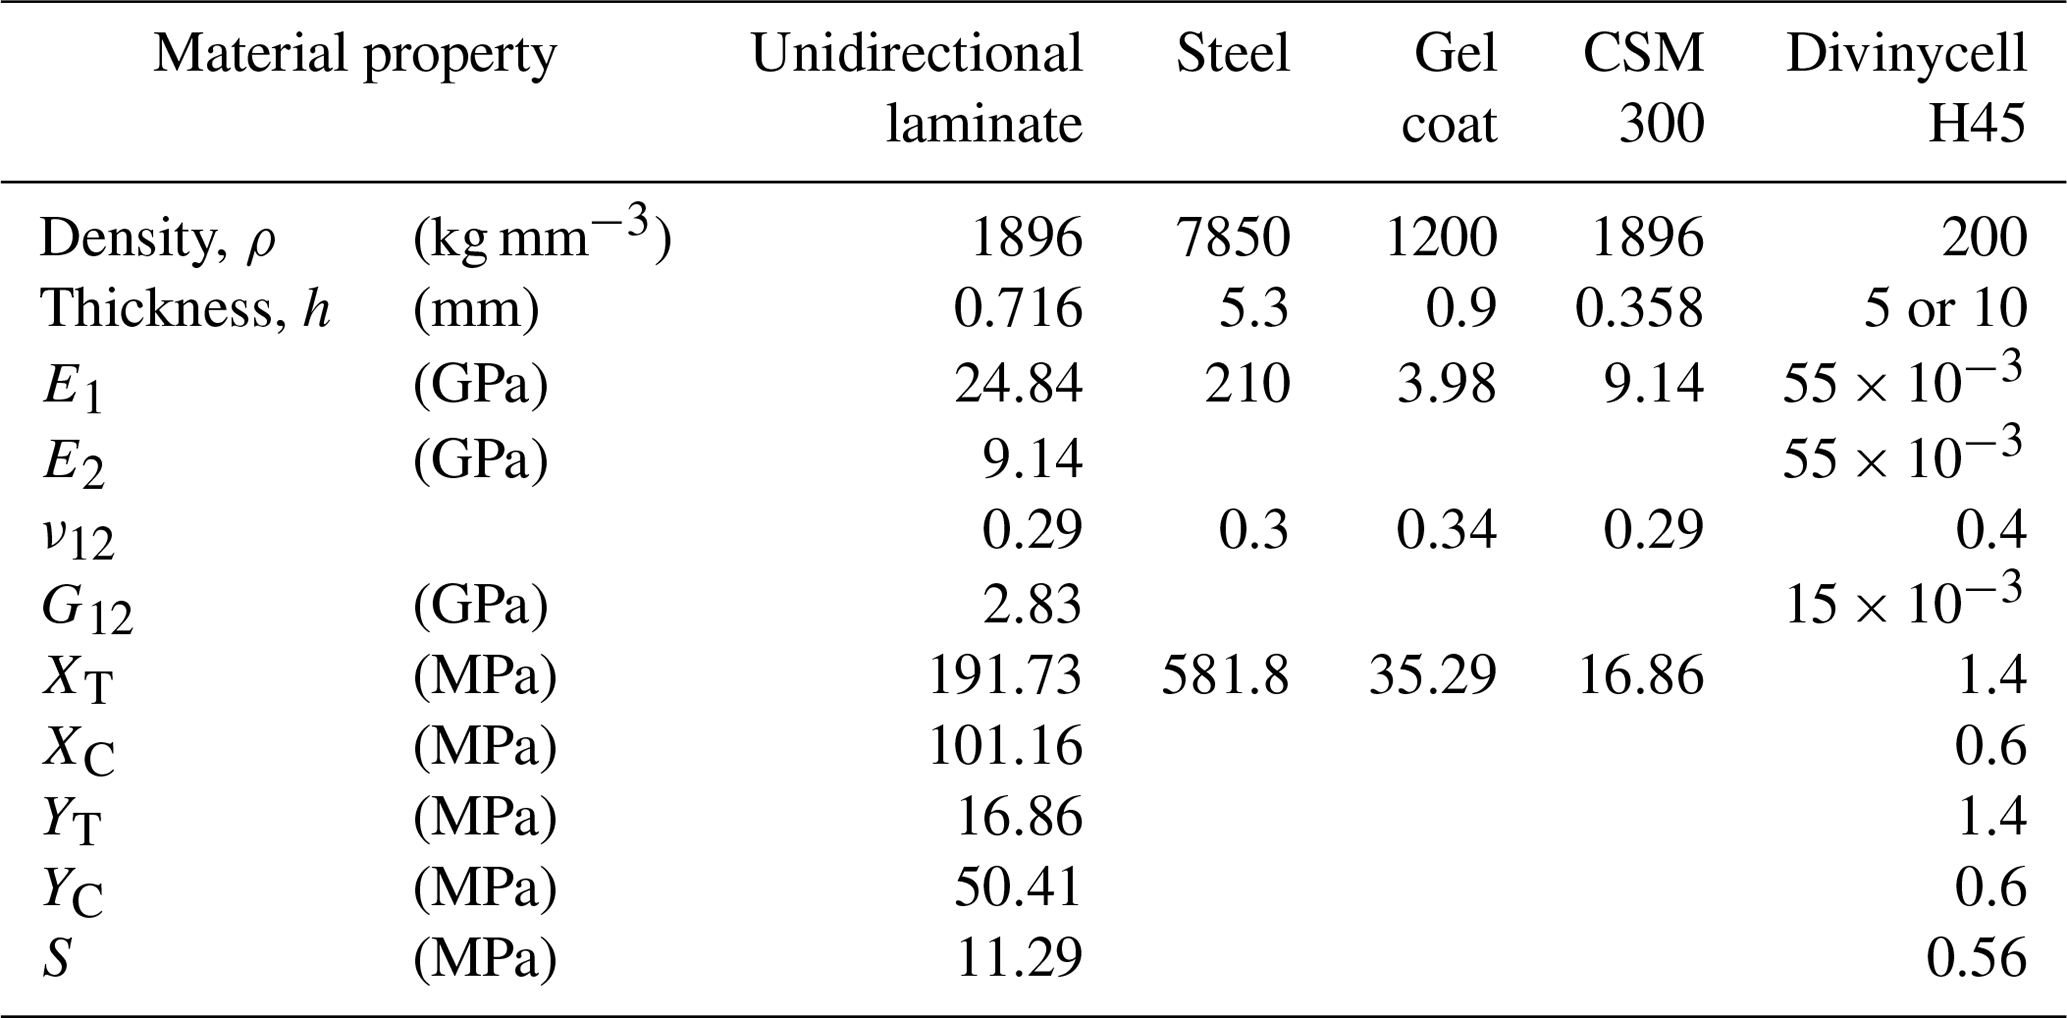
The 2D blade technical drawings, which include the blade aerodynamic design details such as chord length and twist angle along the blade, were provided by the blade manufacturer Compblades. By using these given 2D blade drawings, the 3D CAD model of the blade is prepared in an NX 12.0 environment (Siemens NX, 2017). In Table 2, the material properties and design allowables of the blade materials for static analysis are listed (Philippidis and Roukis, 2013). Referring to Germanischer Lloyd Guidelines (2010), design allowables are obtained from the knockdown of the experimental strength values by the material safety factor 2.406.
The skin of the blade is composed of unidirectional and triaxial laminates, whereas only triaxial laminates are used for the spar. The layup sequence for the pressure and suction side differs only in the area from 1.25 to 2.0 m, where an extra unidirectional glass fabric was placed in the suction side of the blade. The root part of the blade is composed of unidirectional laminate, triaxial laminates and steel. The outer surface of the blade is covered with transparent gel coat and a layer of chopped strand mat of 300 g m−2, CSM 300. In addition to this, the Divinycell H45 foam used in the trailing edge is of 10 mm thickness in the area from 0.7 to 2.0 m and 5 mm thickness from 2.0 to 3.0 m. Since the gel coat, CSM 300 and foam do not make a significant contribution to the strength of the blade, these materials are not included in the finite element model. The details of the material layup and geometry are given in the Supplement.
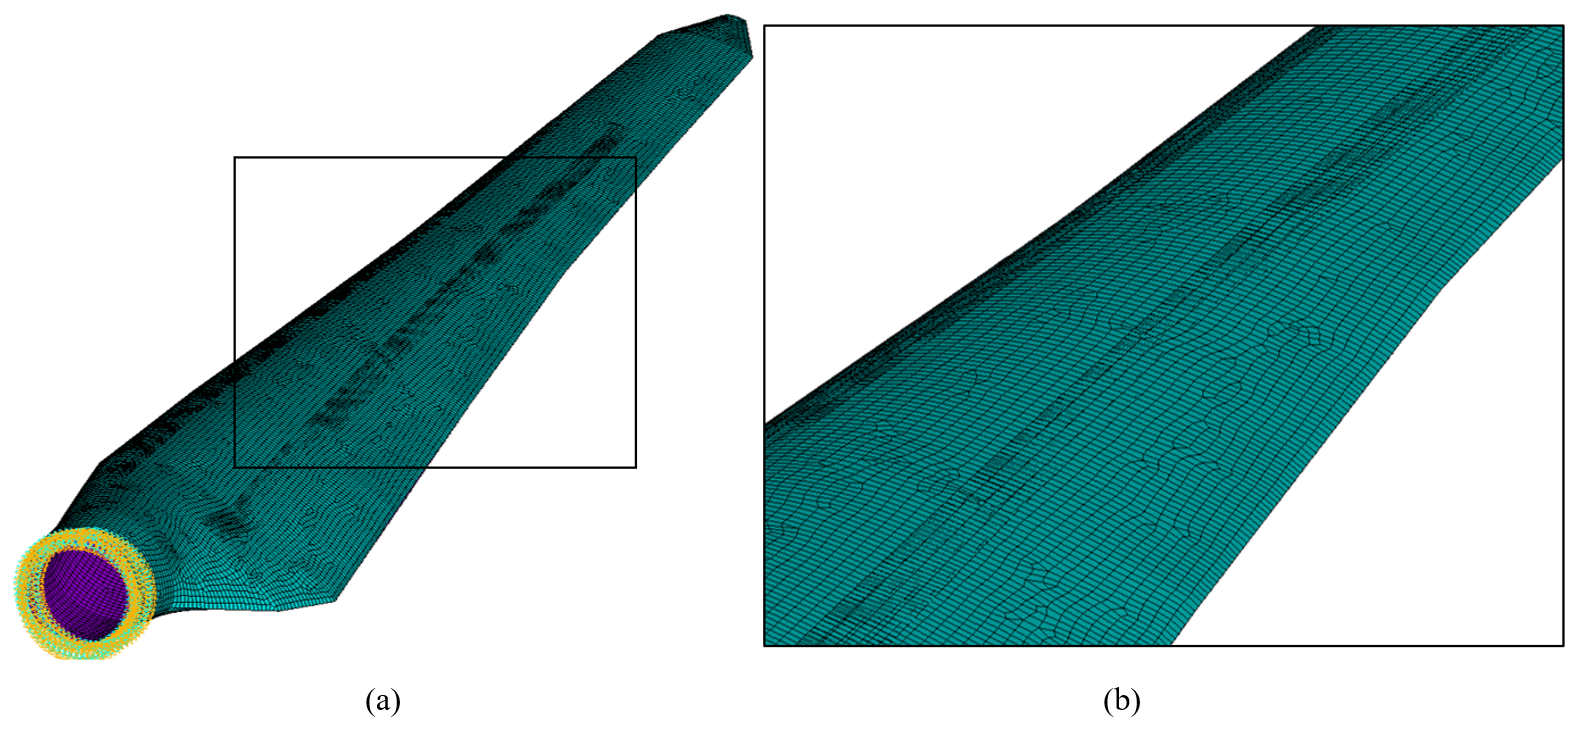
Table 2Material properties and design allowables of RÜZGEM blade for static analysis.
After geometric modeling of the blade, the material model of the blade structure is prepared in the Ansys ACP (Pre) module. Plane stress SHELL 181 quadrilateral elements are used to mesh the blade entirely in Ansys Workbench, as seen in Fig. 5. The mesh density of the FE model and the boundary conditions are depicted in Fig. 5. For the blade FE model all rotational and translational degrees of freedom at the blade root are fixed. A total of approximately 35 000 nodes are used in the finite element model, which is determined based on the mesh convergence study discussed later in this subsection. SHELL 181 elements with size 15 mm × 15 mm are used for the mesh. This element size correlates to the typical element size for small-scale wind turbine blades. Adhesive materials are used for connections: pressure side–spar–suction side, pressure side–internal flange–suction side along the leading edge, and finally between suction side and pressure side. These connections are modeled using bonded contact with the augmented Lagrange algorithm in the FE model. Different trailing edge modeling methods as presented in Haselbach (2017) can be implemented and compared with experimental data in the future.
Since the total displacement of the blade is relatively small compared to the total length of the blade under 100 % flapwise, edgewise and combined loading cases, the analysis is limited to linear geometry. Another reason for the choice of the linear geometry option is to avoid convergence problems and excessive computation time at higher load levels. In addition to this, using the global modeling of the 5 m wind turbine blade with plane stress elements, through-the-thickness stresses, which are necessary for a detailed examination of delamination and/or debonding failures, cannot be obtained.
Load–displacement curves are utilized for investigating the structural response of the blade under various loading scenarios. In Fig. 6 load and displacement measurement points are displayed. Loads are measured at the blade pitch coordinate system defined at the root center according to Germanischer Lloyd Guidelines (2010), and displacements are measured from point P at the spar tip, which is highlighted in green. The exact coordinates of the displacement point with respect to the coordinate system at blade root are , and z=4000.
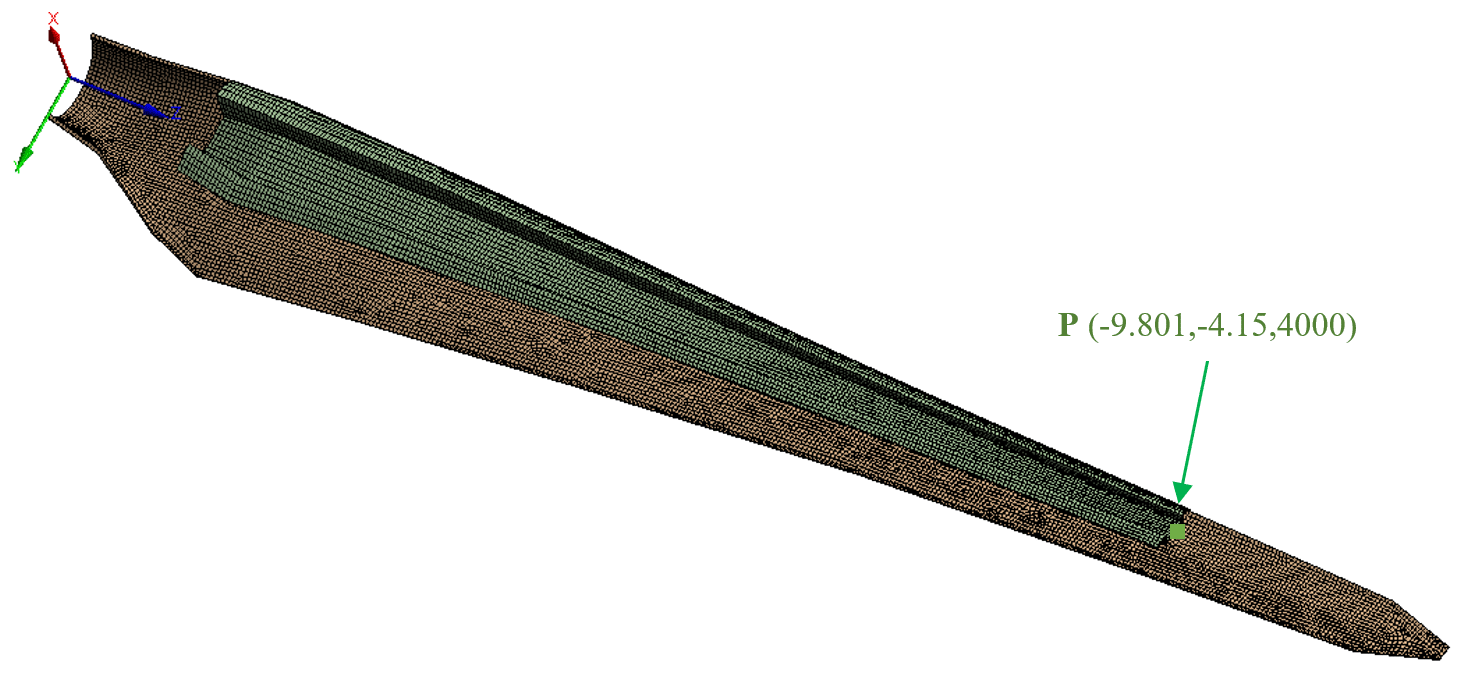
Figure 6Location of the load measurement coordinate system and the deflection measurement point P.
For the design of the RÜZGEM blade, the turbine specifications are obtained from the meteorological data in Ankara, Turkey (Weinzierl and Pechlivanoglou, 2013). These were analyzed so that average wind speed, the occurrence of gusts and wind speeds are determined. Based on this information, the turbine specifications were selected according to IEC 61400-2 Standard (2006). Loads for the structural design were selected as the worst-case load scenario for the complete set of the IEC 61400-2 Standard extreme loads provided by aeroelastic simulations performed at Smart Blade GmbH (Weinzierl and Pechlivanoglou, 2013).
A mixture of different design load cases (DLCs) and time instances are used for this study, and moments are extreme for all positions along the blade. The extreme loads were computed using the wind turbine aero-hydro-servo-elastic software tool FAST v7.01.00a-bjj (FAST, 2013). During the simulations, the turbine is simulated as a stall-regulated constant-speed turbine at 83 rpm with a gearbox and simple induction generator. Using this input, the blade is analyzed under extreme loads in the flapwise, edgewise and combined edgewise–flapwise loading. Loads are calculated at 28 stations along the blade span direction.
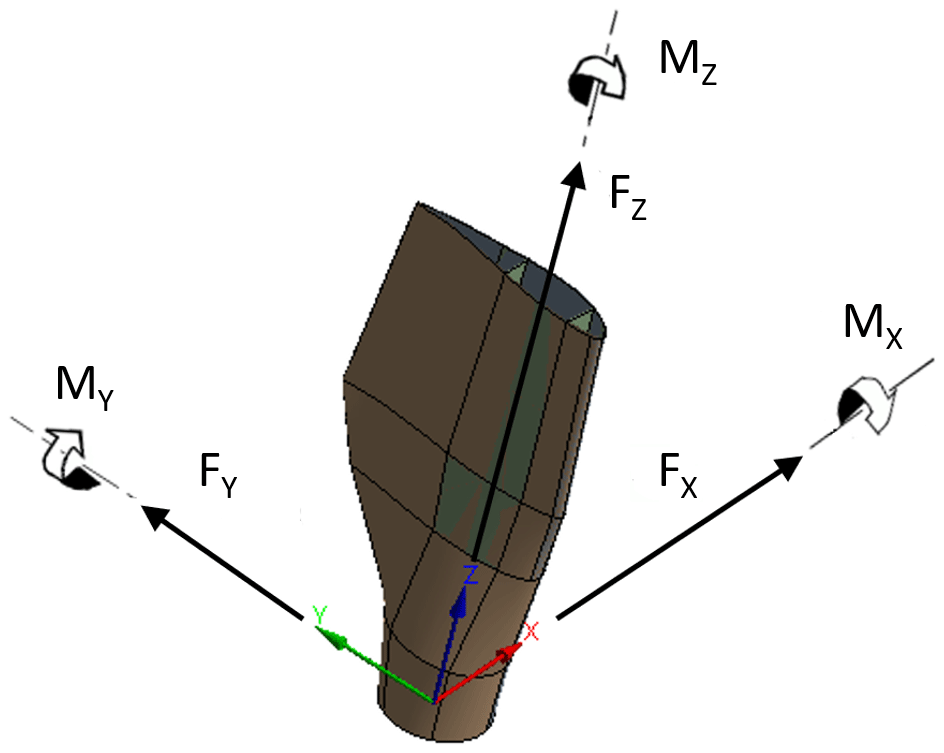
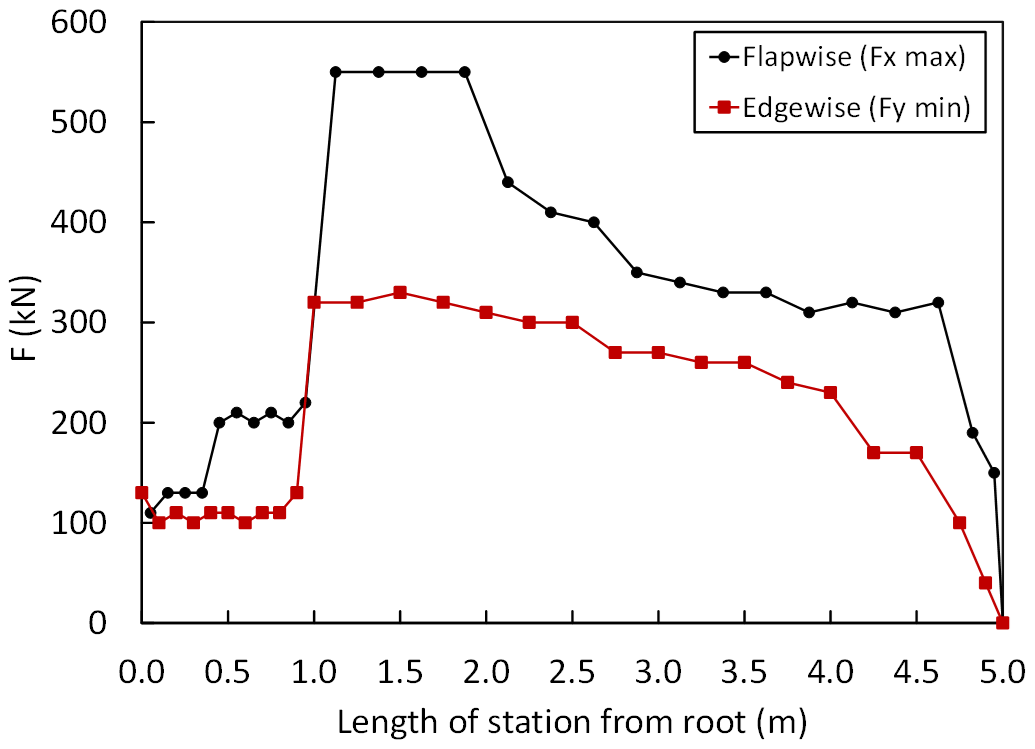
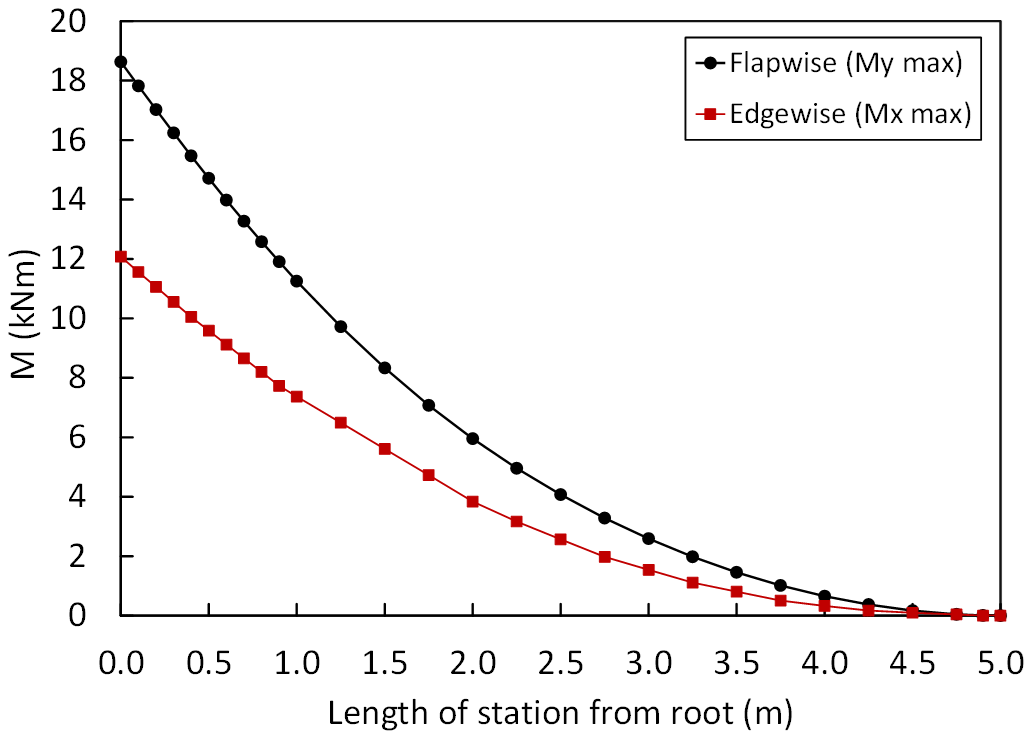
According to the recommendations of the IEC 61400-23:2002 (2002) standard a partial safety factor of 1.35 is included in the loads for the FE simulations. The forces and moments are given in the blade pitch coordinate system in Fig. 7 according to Germanischer Lloyd Guidelines (2010), where Fx, Fy and Fz are the forces in the flapwise, edgewise and axial directions, respectively. MX, MY, MZ are the moments in the edgewise, flapwise and pitch directions, respectively. After considering partial safety factors, extreme flapwise and edgewise external load distributions are plotted along the spar of the blade length in Fig. 8. Similarly, Fig. 9 shows the calculated values of the flapwise and edgewise bending moment in sections along the blade span length. These edgewise and flapwise moment values are computed from flapwise and edgewise loads, respectively. As stated in the IEC 61400-23 standard, for the FE simulations, external flapwise and edgewise loads are increased incrementally by 1 % of the extreme load case until the collapse of the blade occurs.
Extreme external loads are given over 28 stations of the blade suction and pressure sides as displayed in Fig. 10a for flapwise loading and Fig. 11a for edgewise loading. The loads at these stations are distributed among the nodes along the spar width on the suction and pressure sides as shown in Figs. 10b and 11b for flapwise and edgewise load applications, respectively.
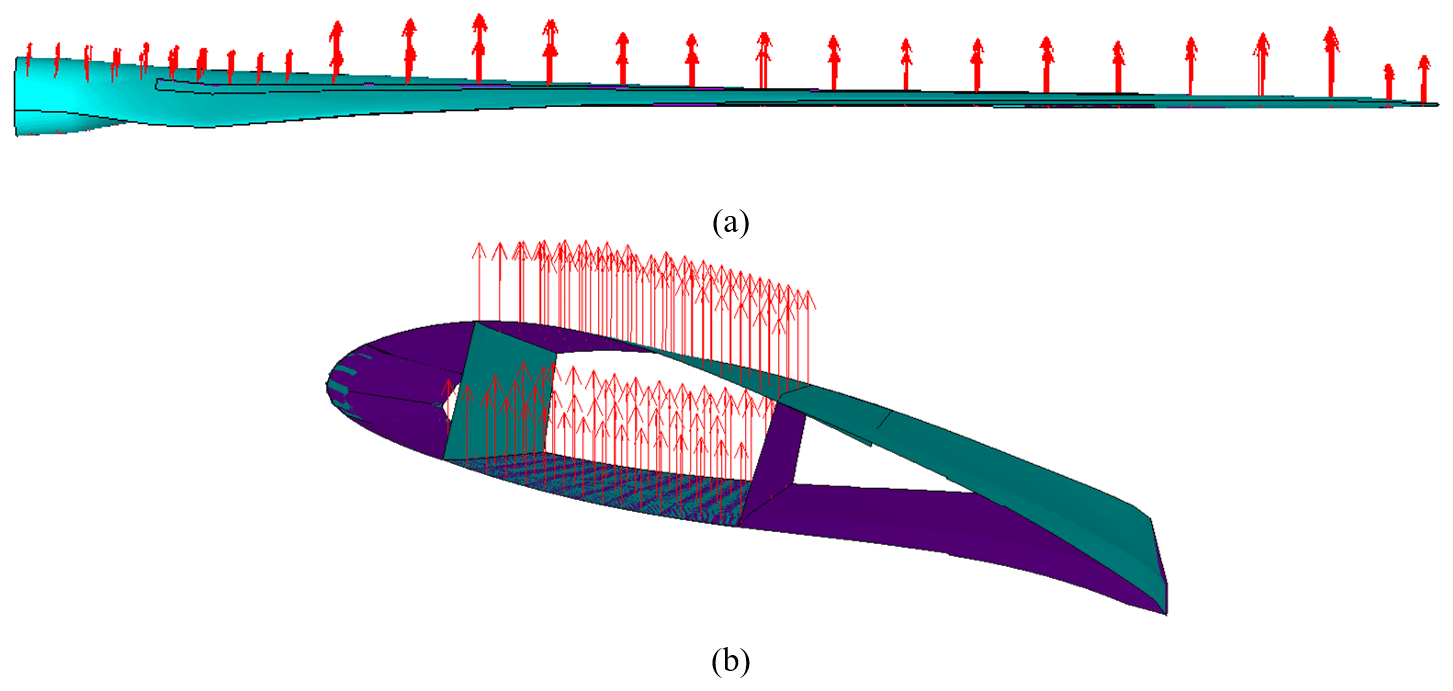
Figure 10Extreme flapwise load application to blade FE model: (a) side and (b) cross-section view.
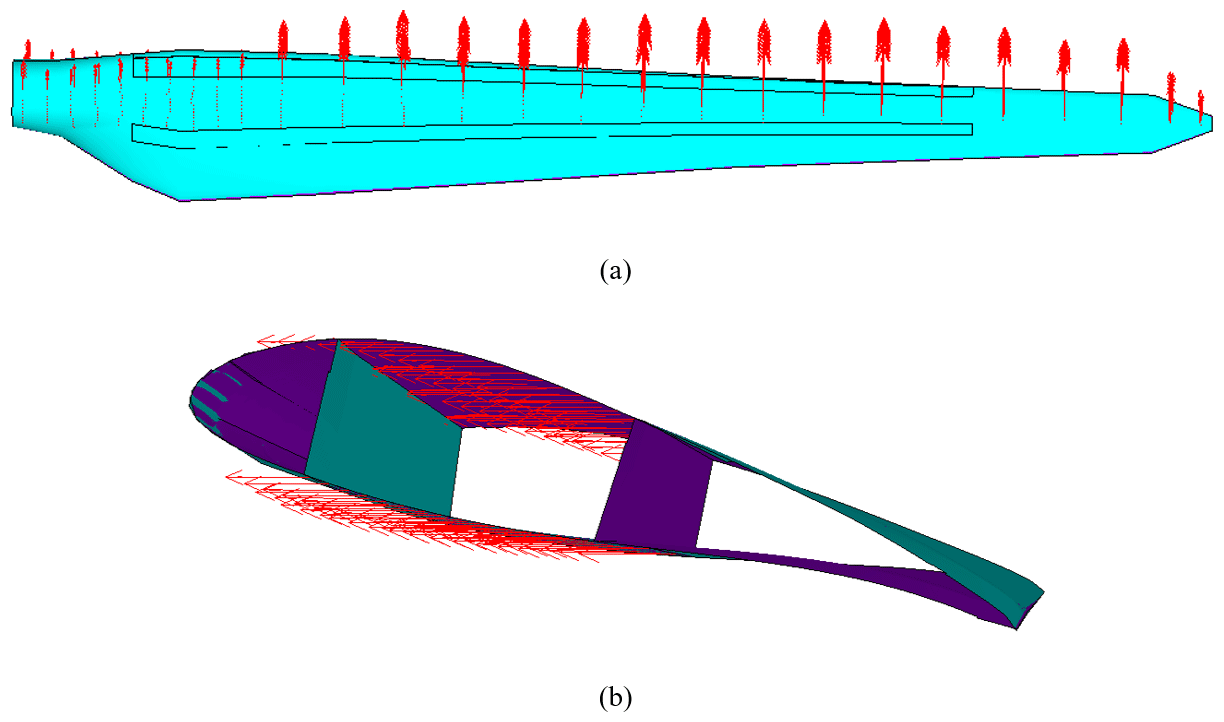
Figure 11Extreme edgewise load application to blade FE model: (a) top and (b) cross-section view.
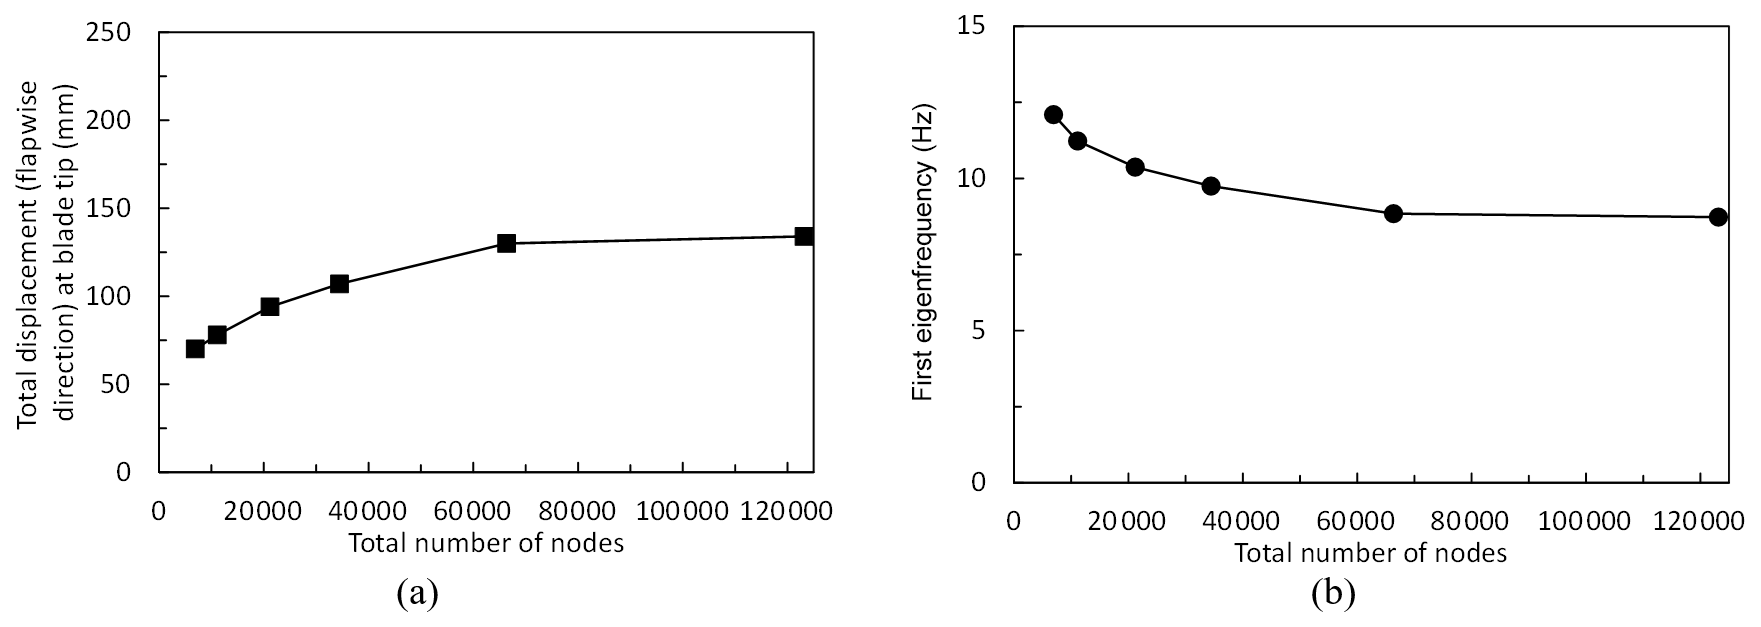
Figure 12Mesh convergence study using (a) total number of nodes vs. total displacement (flapwise direction) at blade tip under flapwise loading and (b) total number of nodes vs. first eigenfrequency.
In order to decide on the reasonable mesh density, a mesh convergence study is conducted. Mesh convergence is shown for total displacement at blade tip under extreme flapwise loading and the first eigenfrequency as seen in Fig. 12a and b, respectively. There are approximately 35 000 nodes in the FE model. The decision regarding the mesh refinement is based on a good compromise between accuracy and computing time. The analysis takes about 36 h for flapwise and combined load cases, whereas for edgewise loading around 72 h is needed with an Intel Xeon E5-1620 v3 Workstation PC with 64 GB RAM.
This section begins with a linear buckling analysis, followed by the progressive failure analysis of the blade under extreme flapwise, edgewise and combined loading conditions. This section is followed by a discussion regarding the comparative study of these three loading scenarios.
3.1 Buckling analysis
Linear buckling analysis of the blade is performed in order to investigate its buckling resistance and the location of buckling eigenmodes. The results are depicted in Fig. 13, which shows the buckling modes of the blade under the 100 % flapwise (max) loading case (Fig. 13a), 100 % edgewise (min) loading case (Fig. 13b), and 100 % combined edgewise (min) and flapwise (max) loading case (Fig. 13c). Negative buckling factors correspond to the loads applied in the opposite direction, because no critical eigenvalue could be found in the load application direction. In other words, the blade exhibits sufficient buckling resistance in the load application direction for flapwise, edgewise and combined edgewise plus flapwise loading. According to Germanischer Lloyd Guidelines (2010) the load factor should be greater than 1.25, which is fulfilled for all the load cases studied. We note that in other cases in the literature such as Paquette and Veers (2007) and Chen et al. (2015), local buckling of small-size wind turbine blades is found to be a major design concern.
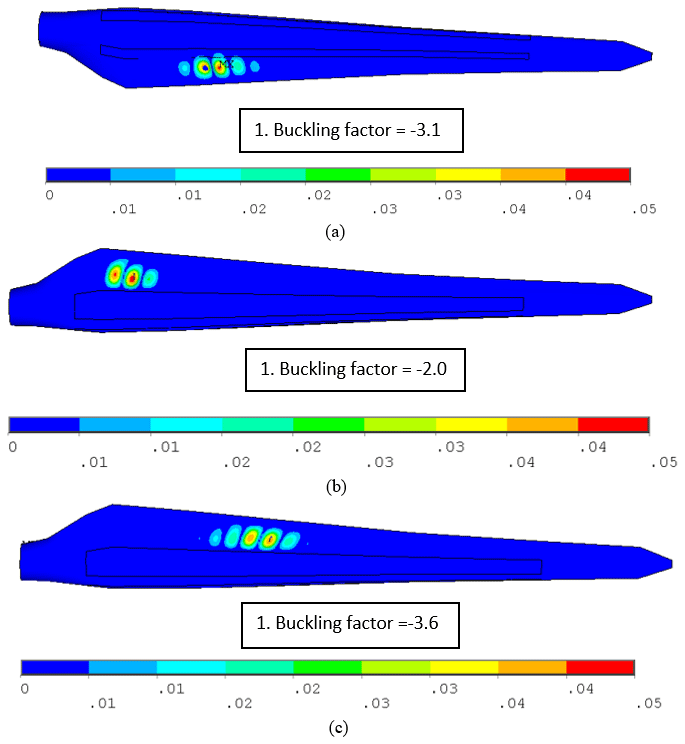
Figure 13Buckling modes of the blade under (a) 100 % flapwise (max) loading case, (b) 100 % edgewise (min) loading case, and (c) 100 % combined edgewise (min) and flapwise (max) loading. (Color bar shows total deformation.)
The locations of buckling regions are observed in the suction side and pressure side aeroshells of the trailing edge sides for the flapwise and the combined edgewise and flapwise loading cases, respectively. For the extreme edgewise load case, the buckling failure location is in the pressure side trailing edge towards the blade root. The buckling mode locations show similarity with buckling mode locations of the multi-MW blade in the study of Kim et al. (2014) and of blade configurations with PVC foam in the study of Chen et al. (2015) as they are located in the wide trailing edge region near the maximum chord. However, in the study of Paquette and Veers (2007), the buckling failure location is in the root transition region.
3.2 Progressive damage analysis
In this subsection, results from the progressive damage analysis of the RÜZGEM blade subjected to flapwise, edgewise and combined loading conditions are presented.
3.2.1 Progressive damage analysis under flapwise (max) loading
The total deformation of the nonlinear blade model versus the undeformed model under 100 % extreme flapwise loading is displayed in Fig. 14. The maximum blade deflection at the blade tip is 121 mm.
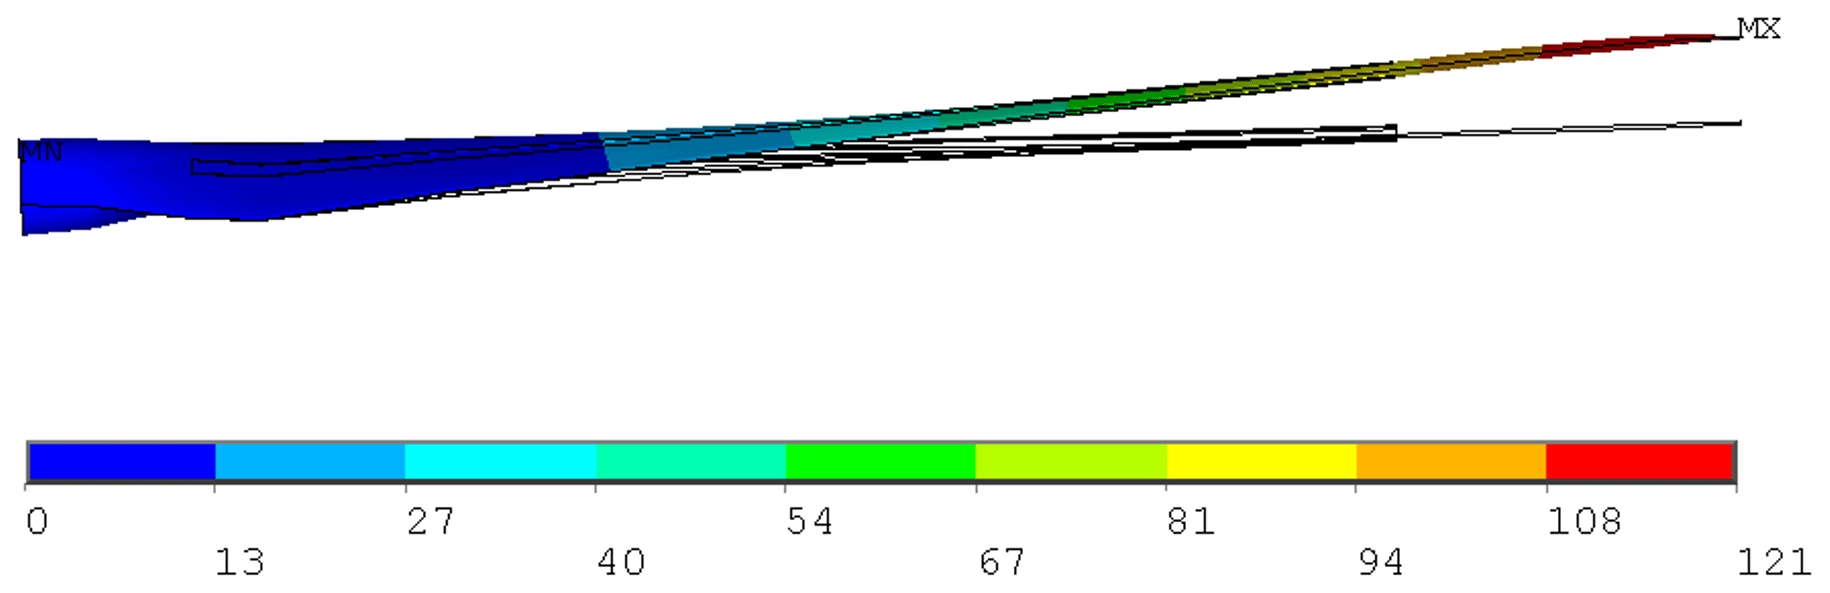
Figure 14Total deformation of the RÜZGEM blade model vs. undeformed model under 100 % extreme flapwise loading condition (scale factor: ×2).
Load–displacement curves of the blade in the range between 10 % and 120 % of extreme flapwise loading are displayed for the linear elastic model and progressive damage model (Puck) in Fig. 15. Load application and displacement measurement is carried out in the flapwise direction. Based on this load–displacement curve, element failure progression in the damaged blade components – the pressure side, internal flange and suction side – at 75 %, 100 %, 105 % and 116 % is depicted in Fig. 17. According to the implemented methodology, an element fails if FF or IFF (C) in at least one-third of the plies of a laminate is detected. It can be observed from the figure that up to 75 % of the extreme flapwise loading, the stiffness for both linear elastic and progressive damage models, remains almost the same. However, the analysis output data show that degradations in the transverse elasticity, shear moduli and Poisson's ratio starting from 13 % loading occur, but this does not play a significant role in the deflection of the blade as can be seen from Fig. 15. According to the analysis results, element failure is observed in the internal flange at 75 % loading. This is the first slope drop of the load–displacement curve and can be considered as the first turning point. As seen from Fig. 17, failure in the internal flange grows further as the load is increased to 100 %. At 105 % loading in addition to the damaged region in the internal flange, damage grows along the trailing edge and leading edge. This turning point can be regarded as the second slope drop in the load–displacement curve. Due to the element failure, deformation in the form of local buckling at the trailing edge is observed in Fig. 16.

Figure 15Load–displacement curves of the blade using the linear elastic model and progressive damage model (Puck) under extreme flapwise loading.
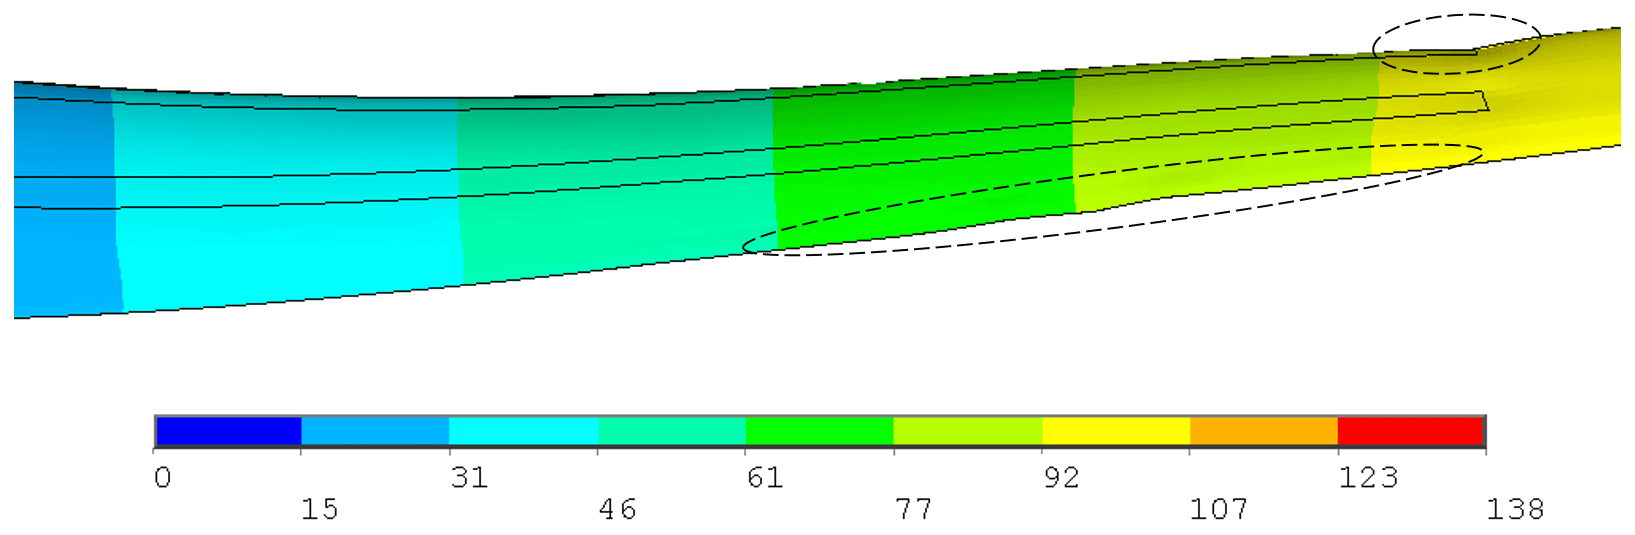
Figure 16Total deformation occurring in the form of local deformation due to failed elements at 105 % flapwise (max) loading. (Scale factor for deformation plot: ×20.)
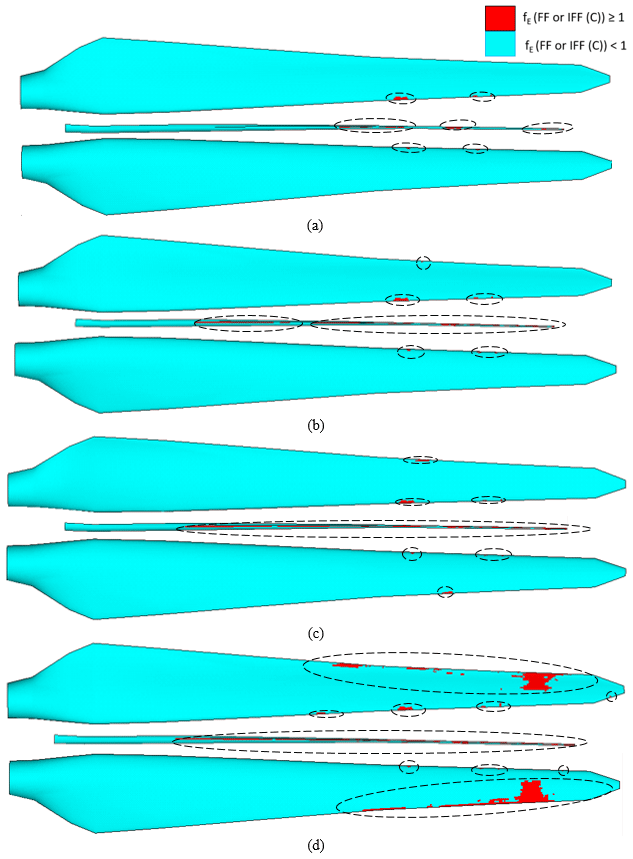
Figure 17Element failure progression in the pressure side, internal flange and suction side of the blade (from top to bottom in a panel) at (a) 75 %, (b) 100 %, (c) 105 % and (d) 116 % of extreme flapwise loading.
Shortly before collapse at 116 % loading, damaged regions at the leading and trailing edges evolve further and damage close to the blade tip occurs. The reasons for damage initiation at the blade tip at the most extreme load level can be explained by the fact that there is, although low, some loading on the blade tip as seen in Fig. 8. At 116 %, 1.16 times the extreme flapwise loading, which is read from Fig. 8, is applied to the blade, and the blade collapses afterwards. Moreover, the blade tip structure is rather thin and less stiff compared to other regions of the blade. On top of this, as seen in Fig. 17d at 116 % load level, the trailing edge and the internal flange which is used to bond the pressure and suction sides of the blade are already damaged. As a consequence, towards the blade tip the pressure and suction sides of the blade are detached at this load level. Under these circumstances, the blade tip structure is weaker and can be damaged more easily. Likewise, debonding of suction and pressure sides from the adhesive joints was reported as the main failure mechanism causing a progressive collapse of the blade structure in Yang et al. (2013). Finally, the blade collapses after 116 % of extreme flapwise loading.
In Fig. 18 interfiber failure mode A (IFF (A)) and interfiber failure mode B (IFF (B)) distribution in the pressure side, internal flange and suction side of the blade at 50 % flapwise loading are shown. If both stress exposures are present in an element, the higher-stress-exposure IFF (A) or IFF (B) is shown. Based on the output data from the FE analysis of the blade, the damage initiation begins at 13 % of extreme flapwise loading due to IFF (A) or IFF (B). As discussed in the methodology section, stress exposures greater than or equal to 1 indicate damage, and damaged regions are shown in red. The figure shows that interfiber failure is present in the internal flange and the trailing edge of the blade. It is worth noting that, IFF (A) and IFF (B) do not lead to the element failure. When IFF (A) or IFF (B) occurs, only the transverse elasticity moduli, shear moduli, and Poisson's ratio are reduced according to the degradation rules. It is noted that FF and IFF (C) initiate in the same location as IFF (A) and IFF (B), which can be considered subcritical cracks. Similar to our findings, Montesano et al. (2016) state that (referring to Lambert et al., 2012, and Sørensen, 2009) subcritical cracks can act as a precursor to more critical damage modes such as delamination or adhesive debonding. In this study, IFF (C), which is a dangerous failure mode indicating risk of delamination, and FF are the critical failure modes which lead to element failure. Recently, Chen et al. (2019) reported that matrix-dominant failure and delamination occurs before fiber-dominant failure at the trailing edge. Likewise, we observe IFF (A) or IFF (B) before FF at the trailing edge.
Figure 18Damage evolution – IFF (A) or IFF (B) – in the pressure side, internal flange and suction side of the blade (from top to bottom in a panel) at 50 % of extreme flapwise loading.
3.2.2 Progressive damage analysis under edgewise (min) loading
The total deformation of the nonlinear blade model versus the undeformed model under 100 % extreme edgewise loading is displayed in Fig. 19. The maximum blade deflection at the blade tip is 31 mm and much less than the deformation compared to pure flapwise loading.
Figure 19Total deformation of the RÜZGEM blade model vs. undeformed model under 100 % extreme edgewise loading condition (scale factor: ×8).
Figure 20Load–displacement curves of the blade using the linear elastic model and progressive damage model (Puck) under extreme edgewise loading.
Load–displacement curves in the range between 10 % and 320 % of extreme edgewise loading of the blade are displayed for the linear elastic model and progressive damage model (Puck) in Fig. 20. In the figure, the load is applied and displacement at the spar tip is measured in the edgewise direction. Figure 22 shows the element failure evolution in the blade components – the pressure side, internal flange and suction side of the blade – at 100 %, 210 %, 309 % and 314 % load levels. Stress exposures fiber failure (FF) and interfiber failure mode C (IFF (C)) distributions are shown in the same plot. Since element failure in spar is not detected within the above-mentioned loading range, it is not shown in Fig. 22. The regions where the stress exposure is equal to or greater than 1 are depicted in red. The stiffness of these failed elements is set to zero, and they do not contribute to blade strength anymore. It is seen that at 100 % loading, element failure is not detected. It can further be observed from the figure that in up to 210 % of the extreme edgewise loading, the stiffness for both models remains almost the same. After 210 % loading, the stiffness is reduced slightly due to the element failures at the internal flange tip (see Fig. 20). At 309 % loading, element failure at the leading edge in the blade root is observed. Due to edgewise (min) loading, compressive stresses are dominant in this region and the blade material is weaker in compression than in tension loading. This failure causes the more significant slope drop in the curve, and at 314 % loading the blade is close to collapse. At the turning point which corresponds to 309 % edgewise loading, the stiffness of the failed elements in the leading edge towards the blade root are set to zero and total deformation due to element failure in the form of local buckling is observed as depicted in Fig. 21.
Figure 21Total deformation occurring in the form of local deformation due to failed elements at 309 % edgewise (min) loading. (Scale factor for deformation plot: ×15.)
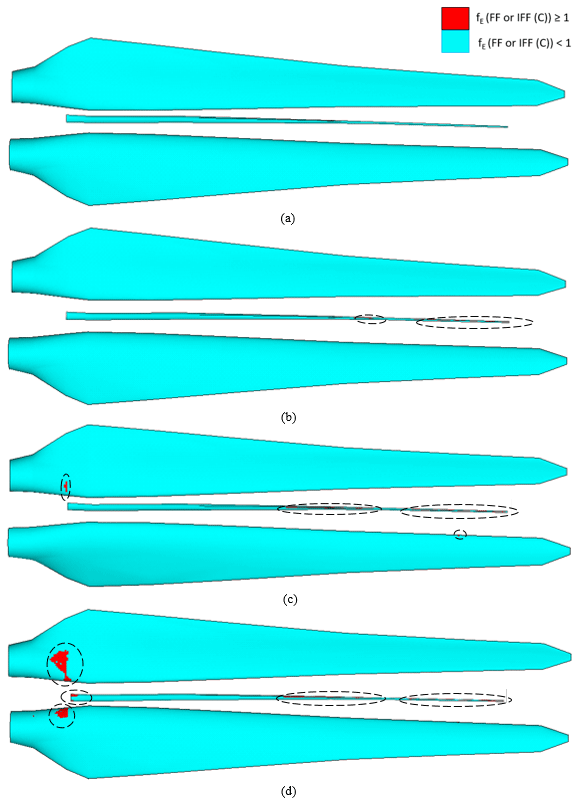
Figure 22Element failure progression in the pressure side, internal flange and suction side of the blade (from top to bottom in a panel) at (a) 100 %, (b) 210 %, (c) 309 % and (d) 314 % of extreme edgewise loading.
Based on the results, the blade design exhibits excessive safety levels in edgewise direction and is considered to be overconservative for this type of loading.
In Fig. 23, interfiber failure mode A (IFF (A)) and interfiber failure mode B (IFF (B)) stress exposure distributions in the pressure side, internal flange and suction side of the blade at 140 % edgewise loading are shown. Based on the output data from the FE analysis of the blade, the damage initiation begins at 45 % of extreme flapwise loading due to IFF (A). Stress exposures greater than or equal to 1 indicate damage, and damaged regions are shown in red. The figure shows that interfiber failure begins in the internal flange of the blade. IFF (A) and IFF (B) do not lead to the element failure but cause degradation in the transverse elasticity moduli, shear moduli and Poisson's ratio. The stress exposure at the leading edge near the root and trailing edge are higher compared to in other blade regions at this load level, which indicates damage growth at higher load levels in these areas. Under the edgewise (min) loading condition, the leading edge close to the blade root is subjected to compressive and trailing edge tensile stresses, respectively. Consequently IFF (A) caused by the combination of tensile and shear stresses and IFF (B) caused by the combination of compressive and shear stresses are seen at the trailing edge and leading edge close to the blade root, respectively. It is noted that FF and IFF (C) also initiate in the internal flange first but at a higher load level: 210 % load. At 309 % load FF and IFF (C) are seen at the leading edge close to the root, where compressive stresses are dominant. As the material has less strength under compression compared to tension, failure initiation begins at the leading edge close to the root. These failures are in the same location as IFF (A) or IFF (B) which can be considered as subcritical cracks. As was the case for flapwise loading, this observation is similar to the statement (referring to Lambert et al., 2012, and Sørensen, 2009) in Montesano et al. (2016) that subcritical cracks can act as a precursor to more critical damage modes such as delamination or adhesive debonding.
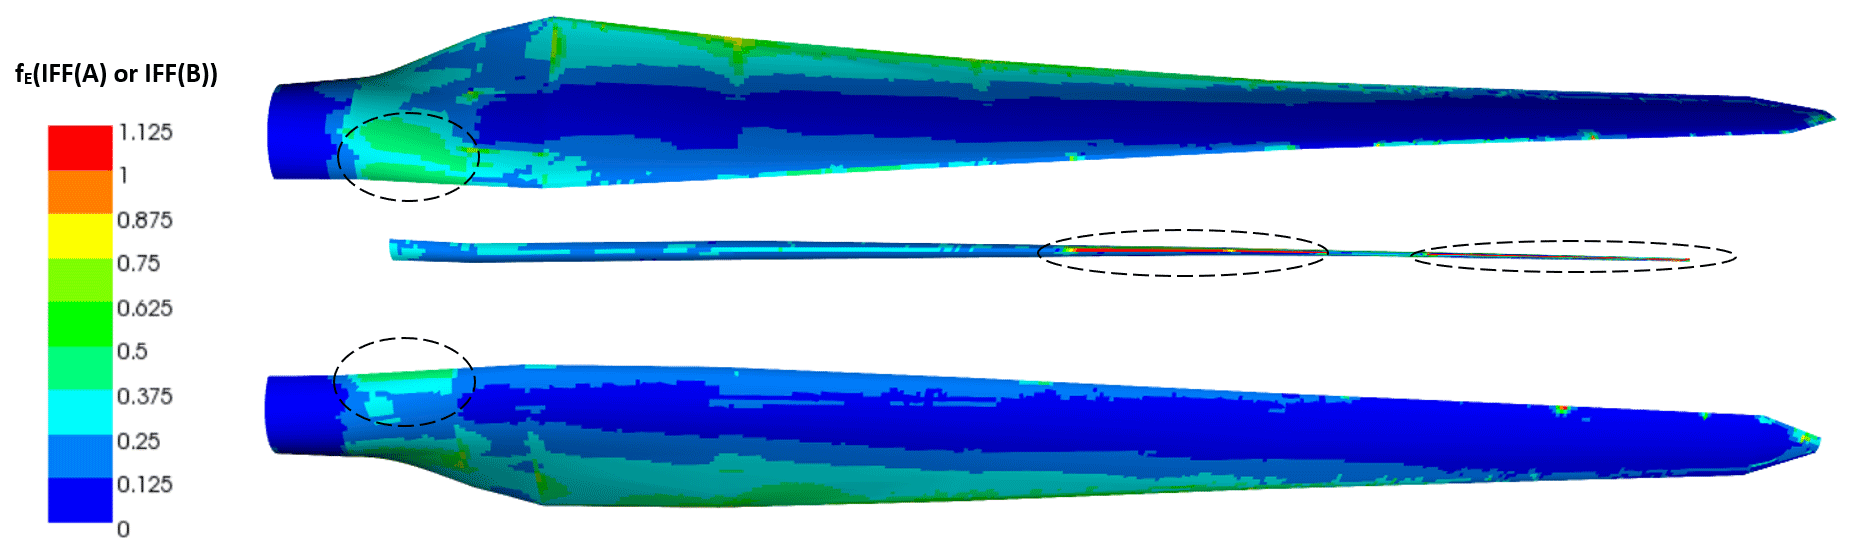
Figure 23Damage evolution – IFF (A) or IFF (B) – in the pressure side, internal flange and suction side of the blade (from top to bottom) at 140 % of extreme edgewise loading.
3.2.3 Progressive damage analysis under combined edgewise (min) and flapwise (max) loading
The total deformation of the nonlinear blade model versus the undeformed model under 100 % combined extreme flapwise and edgewise loading is displayed in Fig. 24. The maximum blade deflection at the blade tip is 104 mm and less than the deformation in pure flapwise loading. We further note that the deflection of 8 mm in the edgewise direction is much less than the deflection of 103 mm in the flapwise direction.
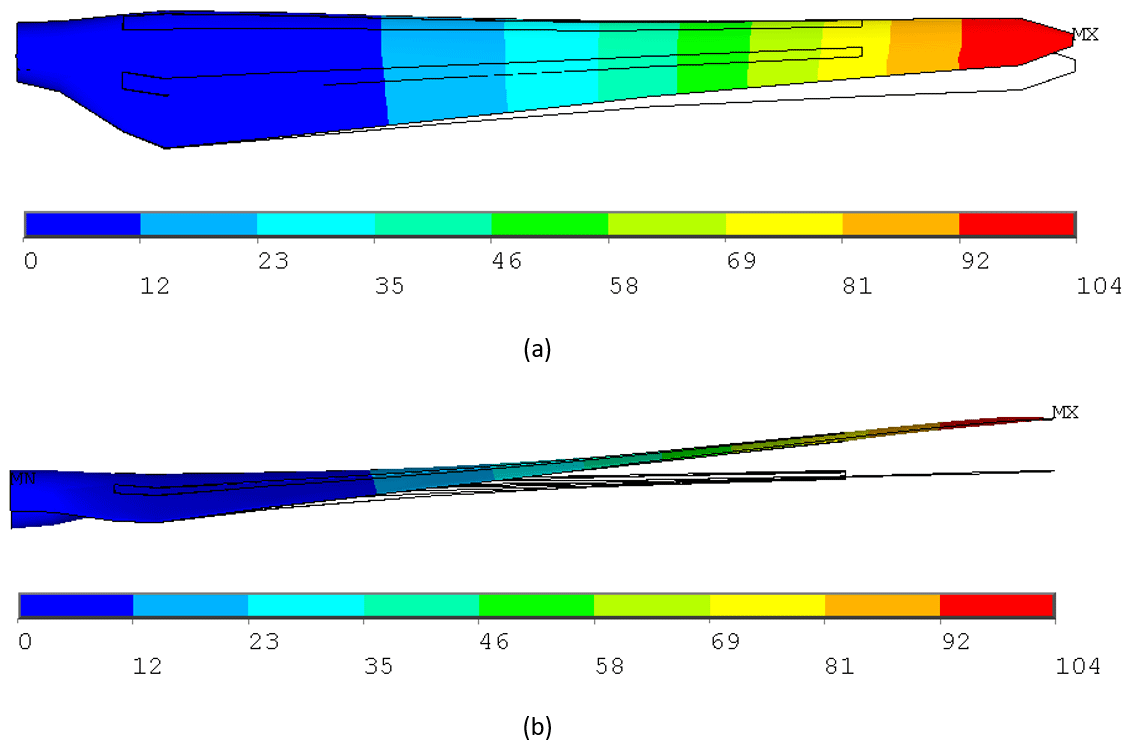
Figure 24Total deformation of the RÜZGEM blade model vs. undeformed model under 100 % combined extreme edgewise and extreme flapwise loading condition (a) top view and (b) side view (scale factor: ×2.5).
Load–displacement curves in the range between 10 % and 130 % of combined extreme flapwise and edgewise loading of the blade are displayed for the linear elastic model and progressive damage model (Puck) in Fig. 25. In the figure, resultant edgewise plus flapwise displacement versus resultant edgewise plus flapwise loading is plotted. Element failure progression in the damaged blade components – the pressure side, internal flange and suction side of the blade – is depicted in Fig. 27. The regions where the stress exposure IFF (C) or FF is equal to or greater than 1 are depicted in red. The stiffness of these elements is set to zero, and these elements do not contribute to the blade strength anymore. In general, under combined loading, element failure evolution is similar to the pure flapwise loading case, but failure occurs at higher load levels. Figure 25 shows that in up to 85 % extreme flapwise loading, the stiffness for both linear elastic and progressive damage models remains almost the same. After 85 % loading, slope reduction starts in the nonlinear progressive Puck model due to the element failures at the internal flange, suction and pressure side leading edges. This point is the first turning point in the load–displacement curve. As the loading is increased to 100 %, element failure at the internal flange, suction and pressure side leading edges grows further. A second slope reduction is detected at 118 % loading. At this load level, in addition to the damaged region in the internal flange and leading edges, element failure initiates at the trailing edge. This is a more obvious turning point compared to the first turning point at 85 % loading. At this load level Fig. 27c shows laminate failure in the internal flange and leading and trailing edges. Due to element failure, deformation in the form of local buckling at the leading trailing edge is observed as depicted in Fig. 26. In their study regarding the full-scale testing of a 34 m wind turbine blade, under combined loading Haselbach and Branner (2016) also observed laminate failure along the trailing edge. As the loading is further increased to 126 %, element failure at the leading and trailing edges covers a larger area. As a consequence, suction and pressure panels are detached and the blade integrity is lost. Finally, after 126 % loading, the blade is close to collapse. When the results in Fig. 17 are compared with Fig. 27, it can be concluded that under the same load level the number of failed elements under combined loading is less than in the pure flapwise loading case.
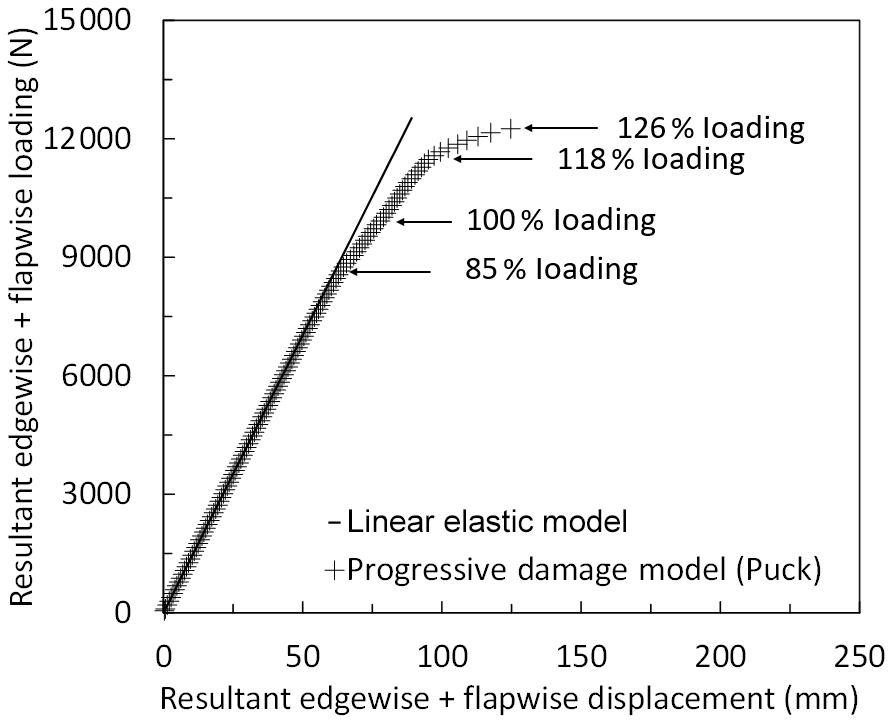
Figure 25Load–displacement curves of the blade using the linear elastic model and progressive damage model (Puck) under combined extreme edgewise (min) and extreme flapwise (max) loading.
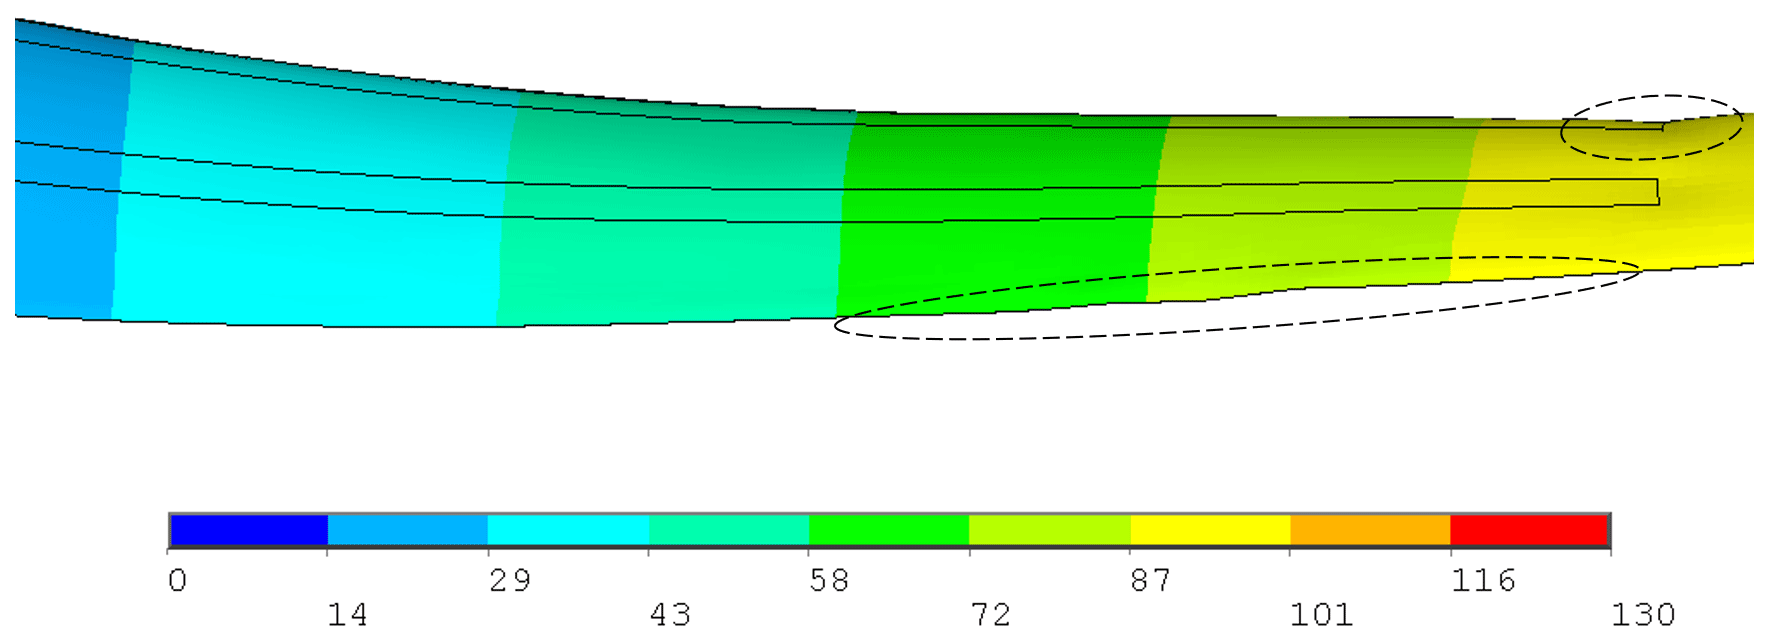
Figure 26Total deformation occurring in the form of local deformation due to failed elements at 118 % extreme combined edgewise and extreme flapwise loading. (Scale factor for deformation plot: ×15.)
Table 3Axial stress levels and stress exposures in the critical regions of blade under flapwise, edgewise and combined (flapwise plus edgewise) loading in 100 % extreme loading cases. Compressive stress components are denoted in bold.

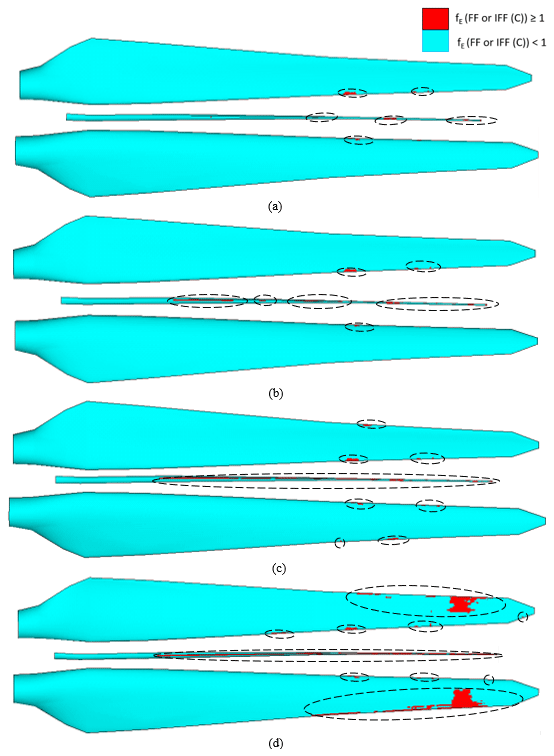
Figure 27Element failure progression in the pressure side, internal flange and suction side of the blade (from top to bottom in a panel) at (a) 85 %, (b) 100 %, (c) 118 % and (d) 126 % of combined loading.
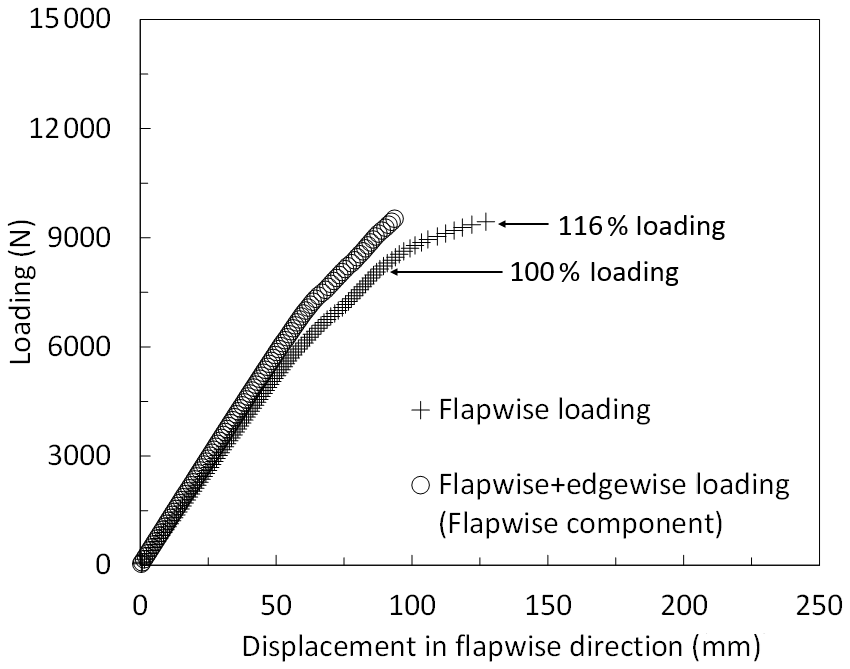
Figure 28Load–displacement curves of the blade under pure flapwise and combined loading using flapwise components of the load and displacement.
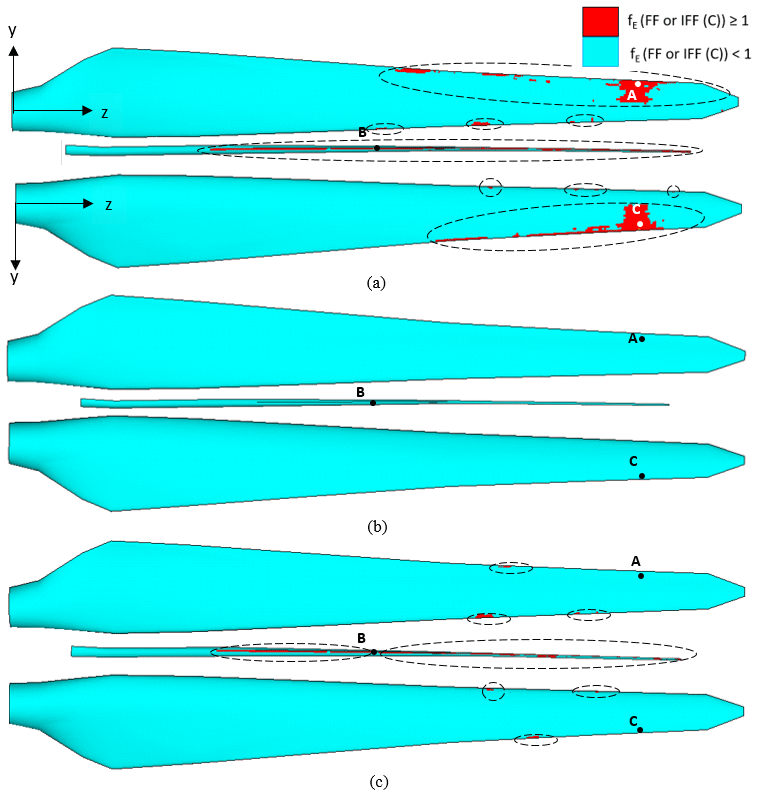
Figure 29Element failure progression in the pressure side, internal flange and suction side of the blade (from top to bottom in a panel) under (a) extreme flapwise, (b) extreme edgewise (no element failure), and (c) combined extreme flapwise and extreme edgewise conditions in the 116 % extreme loading case. Points A (48, 147, 4301) at the pressure side, B (−31, 152, 2224) at the internal flange and C (55, 176, 4288) at the suction side are used to interrogate the axial stress levels in the plies in Table 3 for 100 % extreme loading.
In this section the progressive damage behavior of the blade under flapwise (max), edgewise (min), and combined flapwise (max) and edgewise loading (min) is discussed. From Figs. 15, 20 and 25 it is seen that the slope of the load–displacement curve is highest for edgewise loading followed by edgewise plus flapwise loading. For flapwise loading, the slope of the load–displacement curve is the lowest. In Fig. 28, instead of the resultant components of the combined loading, its flapwise components, i.e., load and displacement in the flapwise direction, are plotted. It is seen that the blade exhibits a stiffer behavior in the flapwise direction under the combined loading condition compared to in the pure flapwise loading case. As a consequence, at 100 % loading the flapwise deflection component under combined loading is approximately 85 % of the flapwise deflection under pure flapwise loading. The blade is stronger under combined loading and at 116 % loading, and the damaged region is smaller under combined loading compared to under flapwise loading as shown in Fig. 29. In Fig. 29, element failure progression is compared for edgewise, flapwise, and combined loading scenarios under 116 % loading. It is observed that the degree of the failed region is highest for the flapwise loading case, followed by combined loading, and there is no failed region in the edgewise loading case. This failure development can be explained by the superposition of loads and stress components as tabulated in Table 3. For this study, points A–C are picked from the heavily damaged blade regions at 116 % flapwise loading as shown in Fig. 29a. Since stresses cannot be read in regions where element failures are present, the study is carried out at 100 % loading. The higher stress exposure fiber-failure (FF) or interfiber-failure mode C (IFF (C)), which cause laminate failure for the elements at points A–C, are computed on a ply-by-ply basis. The critical ply with the highest stress exposure is detected, and for this critical ply the axial stress component (σz) is extracted. As seen from Table 3, at the selected points and the load cases, stress exposures for the FF mode are dominant. Under the flapwise (max) loading case the critical plies are subjected to compressive axial stresses. When edgewise (min) loading is applied, tensile axial stresses are induced at the critical plies of the elements at points A–C. In the table, compressive stress components are written in bold, which are seen under flapwise and combined loading. Under combined loading, the compressive stress component due to flapwise (max) loading and tensile stress component due to edgewise (min) loading are superimposed causing an overall reduction in the axial stress level as shown in Table 3. From the table, it is noted that the reduction in the axial stresses leads to a reduction in the stress exposures. It is also seen that the decrease in stress level is approximately 10 %–25 %, which is in line with the 10 % increase observed in the ultimate failure load value under combined loading compared to under pure flapwise loading. Consequently, the stress state in the blade caused by the superimposed stress components under combined loading decreases the extent of damage at the specified blade locations.
To summarize, finite element analysis of the RÜZGEM 5 m blade using Puck's damage model indicates that laminate failure plays a major role in the ultimate blade failure. Laminate failure progression observed under flapwise, edgewise and combined loading conditions falls into type 4 (internal damage formation and growth in laminates in the skin) and type 5 (splitting and fracture of separate fibers in laminates of the skin) wind blade damage as categorized in Sørensen et al. (2004). Although local buckling of small-size wind turbine blades is found to be the major design concern in Paquette and Veers (2007) and Chen et al. (2015), the RÜZGEM 5m blade is found to exhibit sufficient resistance against buckling in our investigation.
In this work, strength characteristics of an existing 5 m RÜZGEM composite wind turbine blade under extreme flapwise, edgewise, and combined flapwise and edgewise loading conditions are investigated. For this purpose, in addition to a linear buckling analysis, progressive damage analysis of the blade using Puck's (2D) physically based phenomenological model is performed. The main conclusions are as follows:
-
Linear buckling analysis shows that the blade shows sufficient strength against buckling.
-
Failure of elements due to IFF (C) or FF are observed, and a slope reduction in the load–displacement is detected after the application of 75 % extreme flapwise loading and 85 % combined loading cases. In contrast, under 100 % edgewise loading, element failures are not observed.
-
For flapwise and combined loading scenarios, a similar damage pattern is observed; laminate failure due to IFF (C) or FF in the internal flange causes the first slope reduction in the load–displacement curve. As the load is increased, damage grows along the trailing edge, which causes a second slope reduction before collapse.
-
For edgewise loading, laminate failure observed in the internal flange is the first slight slope reduction in the load–displacement curve. As the load is further increased, due to compressive stresses, damage accumulates at the leading edge close to the blade root, which leads to a second slope reduction before collapse.
-
FF and IFF (C) initiate in the same location as IFF (A) or IFF (B). IFF (A) or IFF (B) denotes subcritical ply cracks which precede more critical damage modes such as IFF (C) (which is an indicator of possible delamination) and FF.
-
At the same load level, less damage is observed under combined loading compared to under pure flapwise loading. This damage evolution is attributed to the reduction in stresses (and thus stress exposure) caused by the superposition of stress components under flapwise (max) and edgewise (min) loading conditions.
As a summary, the trailing edge and internal flange located at the leading edge of the 5 m RÜZGEM blade are found to be damaged primarily under flapwise and combined loading conditions. For the edgewise loading, the internal flange and leading edge close to the blade root are the main damaged areas of the blade. It is noted that using the global modeling approach of the 5 m wind turbine blade with plane stress elements, through-the-thickness stresses, which are necessary for a detailed examination of delamination and/or debonding failures, cannot be obtained. In a future work using a submodeling technique with solid elements, competing failure mechanisms such as delamination and/or debonding can be investigated in the critical failure regions. As a follow-up study, full-scale structural tests for the existing 5 m RÜZGEM wind turbine blade are planned following the completion of the testing facility. Afterwards, the structural response and primary damage zones and their development obtained from simulations will be compared with the experimental findings.
Blade geometry and layup that support the results of this research have been uploaded to the Supplement.
The supplement related to this article is available online at: https://doi.org/10.5194/wes-5-1339-2020-supplement.
CM implemented the failure analysis method, conducted the numerical simulations and wrote the paper. DC is the supervisor and guided CM in the conception of the ideas and participated in the writing, structuring and reviewing of the paper.
The authors declare that they have no conflict of interest.
This article is part of the special issue “Wind Energy Science Conference 2019”. It is a result of the Wind Energy Science Conference 2019, Cork, Ireland, 17–20 June 2019.
The authors acknowledge RÜZGEM (METUWIND) Center for Wind Energy Research for the use of their computational facilities. In addition, the authors would like to thank Xiao Chen, Claudio Balzani and the anonymous reviewer for their insightful comments and valuable suggestions on this paper.
This paper was edited by Lars Pilgaard Mikkelsen and reviewed by Claudio Balzani and one anonymous referee.
Ansys Inc: Release 17.2, available at: http://www.ansys.com (last access: 22 July 2020), 2017.
Chen, X., Zhao, W., Zhao, X. L., and Xu, J. Z.: Failure test and finite element simulation of a large wind turbine composite blade under static loading, Energies, 7, 2274–2297, https://doi.org/10.3390/en7042274, 2014.
Chen, X., Qin, Z., Yang, K., Zhao, X., and Xu, J.: Numerical analysis and experimental investigation of wind turbine blades with innovative features: Structural response and characteristics, Sci. China Technol. Sc., 58, 1–8, https://doi.org/10.1007/s11431-014-5741-8, 2015.
Chen, X., Zhao, X., and Xu, J.: Revisiting the structural collapse of a 52.3 m composite wind turbine blade in a full-scale bending test, Wind Energy, 20, 1111–1127, https://doi.org/10.1002/we.2087, 2017.
Chen, X., Berring, P., Madsen, S. H., Branner, K., and Semenov, S.: Understanding progressive failure mechanisms of a wind turbine blade trailing edge section through subcomponent tests and nonlinear FE analysis, Compos. Struct., 214, 422–438, https://doi.org/10.1016/j.compstruct.2019.02.024, 2019.
Fagan, E. M., Kennedy, C. R., Leen, S. B., and Goggins, J.: Damage mechanics based design methodology for tidal current turbine composite blades, Renew. Energ., 97, 358–372, https://doi.org/10.1016/j.renene.2016.05.093, 2016.
Fagan, E. M., Flanagan, M., Leen, S. B., Flanagan, T., Doyle, A., and Goggins, J.: Physical experimental static testing and structural design optimisation for a composite wind turbine blade, Compos. Struct., 164, 90–103, https://doi.org/10.1016/j.compstruct.2016.12.037, 2017.
FAST: Release v7.01.00a-bjj, available at: https://nwtc.nrel.gov/FAST7 (last access: 18 September 2013), 2013.
Germanischer Lloyd Guidelines: Rules and Guidelines Industrial Services, Guideline for the Certification of Wind Turbines, Germanischer Llyod Industrial Services GmbH, Hamburg, Germany, 2010.
Haselbach, P. U.: An advanced structural trailing edge modelling method for wind turbine blades, Compos. Struct., 180, 521–530, https://doi.org/10.1016/j.compstruct.2017.08.029, 2017.
Haselbach, P. U. and Branner, K.: Initiation of trailing edge failure in full-scale wind turbine blade test, Eng. Fract. Mech., 162, 136–154, https://doi.org/10.1016/j.engfracmech.2016.04.041, 2016.
Hinton, M. J., Kaddour, A. S., and Soden, P. D.: A comparison of the predictive capabilities of current failure theories for composite laminates, judged against experimental evidence, Compos. Sci. Technol., 62, 1725–1797, https://doi.org/10.1016/S0266-3538(02)00125-2, 2002.
Holmes, J., Sørensen, B., and Brøndsted, P.: Reliability of wind turbine blades: An overview of materials testing, in: Proceedings of the Wind Power Shanghai 2007, Chinese Renewable Energy Industry Association, 1–3 November 2007, Shanghai, 310–315, 2007.
IEC 61400-2 Standard: Wind Turbines, Part 2: Design requirements for small wind turbine, International Electrotechnical Commission, Geneva, Switzerland, 2006.
IEC 61400-23:2002: Part 23 Full-Scale Structural Testing of Rotor Blades, International Electrotechnical Commission, London, UK, 2002.
Jensen, F., Falzon, B., Ankersen, J., and Stang, H.: Structural testing and numerical simulation of a 34 m composite wind turbine blade, Compos. Struct., 76, 52–61, https://doi.org/10.1016/j.compstruct.2006.06.008, 2006.
Kim, S. H., Bang, H. J., Shin, H. K., and Jang, M. S.: Composite structural analysis of flat-back shaped blade for multi-MW class wind turbine, Appl. Compos. Mater., 21, 525–539, https://doi.org/10.1007/s10443-013-9362-3, 2014.
Knops, M.: Analysis of Failure in Fiber Polymer Laminates: The Theory of Alfred Puck, Springer, Heidelberg, Germany, https://doi.org/10.1007/978-3-540-75765-8, 2008.
Knops, M. and Bögle, C.: Gradual failure in fibre/polymer laminates, Compos. Sci. Tech., 66, 616–625, https://doi.org/10.1016/j.compscitech.2005.07.044, 2006.
Lambert, J., Chambers, A. R., Sinclair, I., and Spearing, S. M.: 3D damage characterisation and the role of voids in the fatigue of wind turbine blade materials, Compos. Sci. Tech., 72, 337–343, https://doi.org/10.1016/j.compscitech.2011.11.023, 2012.
Montesano, J., Chu, H., and Singh, C. V.: Development of a physics-based multi-scale progressive damage model for assessing the durability of wind turbine blades, Compos. Struct., 141, 50–62, https://doi.org/10.1016/j.compstruct.2016.01.011, 2016.
Noever Castelos, P. and Balzani, C.: The impact of geometric non-linearities on the fatigue analysis of trailing edge bond lines in wind turbine rotor blades, J. Phys. Conf. Ser., 749, 012009, https://doi.org/10.15488/532, 2016.
Overgaard, L. C., Lund, E., and Thomsen, O. T.: Structural collapse of a wind turbine blade. Part A: Static test and equivalent single layered models, Compos. Part A – Appl. S., 41, 257–270, https://doi.org/10.1016/j.compositesa.2009.10.011, 2010.
Ozyildiz, M., Muyan, C., and Coker, D.: Strength Analysis of a Composite Turbine Blade Using Puck Failure Criteria, J. Phys. Conf. Ser., 1037, 042027, https://doi.org/10.1088/1742-6596/1037/4/042027, 2018.
Paquette, J. A. and Veers, P. S.: Increased Strength in Wind Turbine Blades through Innovative Structural Design (No. SAND2007-2632C), Sandia National Lab. (SNL-NM), Albuquerque, NM, USA, 2007.
Passipoularidis, V. A., Philippidis, T. P., and Brondsted, P.: Fatigue life prediction in composites using progressive damage modelling under block and spectrum loading, Int. J. Fatigue, 33, 132–144, https://doi.org/10.1016/j.ijfatigue.2010.07.011, 2011.
Philippidis, T. and Roukis, G.: Structure design report of METUWIND small rotor Blade, Confidential Interim Report, CORE team of the University of Patras, Greece, 2013.
Puck, A. and Schürmann, H.: Failure analysis of FRP laminates by means of physically based phenomenological models, Compos. Sci. Tech., 58, 1045–1067, https://doi.org/10.1016/S0266-3538(96)00140-6, 1998.
Siemens NX: Release 12.0, available at: http://www.plm.automation siemens.com (last access: 2 July 2020), 2017.
Sørensen, B. F.: Materials and structures for wind turbine rotor blades – an overview, in: Proceedings of the 17th international conference on composite materials (ICCM 17), Edinburg, 2009.
Sørensen, B. F., Jørgensen, E., Debel, C. P., Jensen, H. M., Jacobsen, T. K., and Halling, K.: Improved design of large wind turbine blade of fibre composites based on studies of scale effects (Phase 1), Summary Report, Risø National Laboratory, Roskilde, Denmark, 2004.
Weinzierl, G. and Pechlivanoglou, G.: Blade Design Loads METU-5.0, Rev. 1.5, SMART BLADE GmbH Internal Technical Specification, Smart Blade GmbH, Berlin, Germany, 2013.
Yang, J., Peng, C., Xiao, J., Zeng, J., Xing, S., Jin, J., and Deng, H.: Structural investigation of composite wind turbine blade considering structural collapse in full-scale static tests, Compos. Struct., 97, 15–29, https://doi.org/10.1016/j.compstruct.2012.10.055, 2013.
Zuo, Y., Montesano, J., and Singh, C. V.: Assessing progressive failure in long wind turbine blades under quasi-static and cyclic loads, Renew. Energ., 119, 754–766, https://doi.org/10.1016/j.renene.2017.10.103, 2018.