the Creative Commons Attribution 4.0 License.
the Creative Commons Attribution 4.0 License.
 | 30 Mar 2020
Comparing abnormalities in onshore and offshore vertical wind profiles
Mathias Møller
Piotr Domagalski
Lars Roar Sætran
Understanding the vertical wind profile is paramount for design and operation of wind turbines. It is needed not only for extrapolation of the wind velocity to hub height but also for structural load calculations, to name the most obvious issues. As wind turbines grow in size and development transitions offshore, issues such as shallow surface layers, low-level jets (LLJs) and internal boundary layers (IBLs) are raising questions concerning the applicability of the commonly used Monin–Obukhov similarity theory to accurately describe the vertical wind development at modern wind turbine hub heights. In this study the 10 min averaged vertical wind profile up to a minimum elevation of 100 m is analyzed through measurements collected from seven sites which represent a span of conditions. Three sites are located offshore in the North Sea and Baltic Sea (FINO1, FINO2 and FINO3) with varying fetch, two onshore by the Norwegian coast (Frøya and Valsneset), one further onshore by the Danish coast (Høvsøre), and one inland at a forested site in Sweden (Ryningsnäs). Through analysis of data series ranging from 8 months to several years depending on the site, the wind profile has been quantitatively categorized according to the number of exhibited local maxima which is not possible within the Monin–Obukhov similarity theory. The results reveal that the occurrence of local maxima is higher at sites of low surface roughness and a high prevalence of unstable atmospheric conditions, causing up to 17 % severely inflected abnormal profiles at the most exposed offshore site, which decreases as the location transitions from offshore to coastal to further inland and is lowest at the forested site. The results indicate that issues in predicting the vertical wind profile are most prevalent offshore, where very stable inflections cause severe deviations which may be related to an offshore internal boundary layer. These findings suggest that there is evident need of an improved vertical wind profile description in order to improve the accuracy of power predictions and load calculations, especially at offshore and coastal sites.
- Article
(4378 KB) - Full-text XML
- BibTeX
- EndNote


As the extent of wind energy extraction grows, there is and has been an increasing focus on wind energy at offshore locations (Nunalee and Basu, 2014). In 2018 wind energy accounted for 48 % of total installed power capacity in the EU, the most of any power generation (WindEurope, 2019). Of this capacity 26 % was installed offshore, down 16 % from the record year 2017. When deciding where to build and commission wind farms, knowing the wind speed which crosses the wind turbine area is crucial in assessing the site feasibility. When the rotor disc wind speed is not measured directly, the assessment relies on models to extrapolate the wind speed to the relevant elevations (Sempreviva et al., 2009). These models may also be used when extracting wind speeds retained from numerical weather prediction tools, or through predictive energy yield calculations. The accuracy of the method for extrapolating the wind speed is evidently crucial and relies on an understanding of the underlying physics causing the wind speed development. A correct vertical wind profile (VWP) description is also important in power predictions at operational wind farms, which lessens the need of short-term energy storage and increases the park efficiency (Kalvig et al., 2014). Additionally, the wind speed and the wind shear are important when assessing turbine loads (Eggers Jr. et al., 2003).
The vertical development of velocity in the surface layer of the atmosphere may be theoretically described through the framework of Monin–Obukhov similarity theory (MO theory, MOST) (Arya, 1988). MO theory assumes constant vertical fluctuations of temperature, velocity and shear stress, sufficient time averaging, and a uniform surface roughness (Foken, 2017). Under these assumptions MOST enables the description of the velocity development with height u(z) through the logarithmic law (Eq. 1). The logarithmic law describes the vertical development of velocity in the surface layer, which is typically only the shallowest 10 % of the atmospheric boundary layer. The depth of the surface layer where MO theory is valid varies with the state of the atmosphere, from only a few meters during very stable stratification to several hundred meters during conditions of vigorous turbulent mixing.
In Eq. (1) L is the Obukhov length which describes the relative importance of buoyant and mechanical effects in atmospheric turbulence, z0 is the roughness length, k is the von Kármán constant, and u* is the friction velocity (Stull, 2017). The value of ψ changes with atmospheric stability and is negative during stable atmospheric conditions, zero for the special neutral case and positive in unstable conditions. The determination of the stability function ψ must be performed empirically, which was a large focus after the theory was initially presented (Foken, 2006). The Kansas field experiment of 1968 largely validated Monin–Obukhov theory as accurately describing the vertical wind profile within the surface layer over flat homogeneous terrain using a 32 m high mast (Kaimal and Wyngaard, 1990).
Another commonly used vertical wind profile description is the empirically proven power law (Eq. 2), which is, due to its relative simplicity, commonly employed in turbine engineering (Emeis, 2013).
In Eq. (2) zr is a reference height where the wind velocity u(zr) has been measured. The power coefficient α has traditionally been assumed constant over the vertical extrapolation range, but if applied over ranges exceeding 10–20 m it should be described as a function of height and atmospheric stability (Emeis, 2014). Although the simplicity of the power law in its original form with α=const makes its use tempting, the lack of connection with the underlying physics makes it less relevant in atmospheric boundary layer (ABL) research.
MO theory has for a long time been a commonly applied theoretical framework of describing the surface-layer winds relevant for wind turbine engineering; studies are however revealing that the height limitations of its applicability may make it less suitable for common turbine heights (Gualtieri, 2019). Onshore Gryning et al. (2007) found progressive deviations from the scaling predicted by MO theory above 50–80 m in a study of wind over flat and homogeneous terrain. The study proposed additional length scalings enabling the description of the vertical wind profile through the entire atmospheric boundary layer (ABL) which better replicated measured values. In a review of issues in wind energy meteorology, Emeis (2014) also highlights the importance of implementing a unified vertical wind profile description which is not solely valid in the surface layer. The limitations of Monin–Obukhov theory are known to become more pronounced under stable stratification of the atmosphere when buoyant forces are negative, which often causes shallow surface layers (Emeis, 2013).
Onshore winds in the vicinity of obstacles and surface changes are also known to be prone to internal boundary layer formations which cause deviations in the vertical wind profile. An internal boundary layer (IBL) due solely to a change in surface roughness has been found through measurements at the onshore site Cabauw (Verkaik and Holtslag, 2007), while a combination of a step change in both surface roughness and temperature was found to cause an IBL development at the onshore site Høvsøre located less than 2 km from the sea (Peña et al., 2016). The onshore internal boundary layer is however a short-lived spatial phenomenon due to the increased mixing caused by higher surface roughness.
While the aforementioned studies describe some of the issues found in onshore environments, the low surface roughness and large heating capacity of the sea make the offshore use of MO theory complicated. Lange et al. (2004) studied the vertical wind profile 11 km offshore in the Danish Baltic Sea and found that MO theory systematically underpredicted the wind speed at 50 m during near-neutral and stable conditions. Tambke et al. (2005) also found larger-than-predicted wind speeds at 62 m at Horns Rev in the North Sea located 18 km offshore, which was observed for all stability conditions. There is however ambiguity in these findings, as Peña et al. (2008) found an opposite result, namely that surface-layer theory overpredicted the wind speed at elevations above 30–40 m during stable atmospheric conditions. Implementing the Gryning et al. (2007) correction provided better agreement with the measured wind speeds. These findings were supported by Sathe et al. (2012), who also found an overprediction of the wind speed by surface-layer theory at higher altitudes during stable atmospheric conditions, which could be accounted for by employing the Gryning et al. (2007) correction.
An explanation of these incorrectly predicted offshore wind speeds during stable conditions may be emerging in the form of a stable offshore internal boundary layer. The offshore stable internal boundary layer is associated with a change in both surface roughness and temperature, and its evolution has been described by Csanady (1974) and Smedman et al. (1997). When warm air on land transitions offshore to a colder sea, an internal boundary layer develops where the air is cooled from the sea. The lower air will after a distance approach the sea temperature, while a very stable inversion lid has developed above. Lange et al. (2004) suggest this inversion lid may be categorized by larger-than-expected wind speed gradients which were not well predicted by MOST but could be partly accounted for through an inversion height correction. While most studies on the stable offshore IBL have been performed in the Baltic Sea, the limited heat flux through this inversion lid means that coastal effects may persist for several hundred kilometers offshore before the temperature differences dissolve, and signs of a distinct thermal layering have been found in the North Sea 80 km offshore at the FINO3 research mast (Argyle and Watson, 2014).
While the issue of incorrectly predicting the vertical wind profile has mainly been associated with stable stratification at offshore sites, Riedel et al. (2005) suggest that at the FINO1 site located 45 km offshore the vertical wind gradient was overpredicted during unstable conditions and underpredicted during stable conditions. Other studies have however found that MOST is satisfactory in correctly predicting wind shear at offshore locations (Peña et al., 2008; Sathe et al., 2012; Argyle and Watson, 2014).
The deviations between vertical wind profile models and measurements at higher altitudes during stable stratification may be coupled to low-level jets which are known to cause deviations between wind speed measurements and models (Svensson et al., 2016). The main focus of research has previously been on the onshore nocturnal low-level jet (LLJ), which may occur at typical turbine hub heights of 100–200 m a.g.l. (Nunalee and Basu, 2014). The offshore low-level jet lacks the same level of understanding, but offshore low-level jets in the Baltic Sea have been found analogous to the onshore nocturnal low-level jet, which reached elevations as low as 30–150 m (Smedman et al., 1995).
Evidently the limitations of MO theory to only being applicable within one layer of uniform vertical fluctuations in the atmospheric boundary layer make its use limited for wind energy applications where internal boundary layers and shallow surface layers prevail. The identification of these phenomena is however not simple. A growing number of methods are therefore emerging for assessing deviations from the common vertical wind profile formulations. In a study of the offshore vertical wind profile at FINO1, Kettle (2014) simply categorized the VWP as abnormal if it exhibited a local maximum and thus did not conform with the monotonically increasing behavior predicted by MO theory. Most of the profiles were in fact found to exhibit one or more local maxima, and even cases of the wind monotonically decreasing with height were identified. Local maxima in the vertical wind profile were also discovered by Wagner et al. (2009), who found the negative shear above the maximum to have a large impact on available power when accounting for wind shear across the rotor diameter. Maxima or “kinks” in the vertical wind profile may be used both onshore and offshore to describe the height of a surface-layer discontinuity (Garratt, 1990). In the present study large data sets primarily comprising several years of 10 min averaged vertical wind profile measurements will be analyzed for the occurrence of abnormalities in the form of local maxima. The profiles are measured at seven locations in onshore, offshore, coastal and forested environments from near-surface elevations up to a height of 100–140 m depending on the site. The method of identifying local maxima is chosen due to its simplicity while additionally having a natural coupling with phenomena associated with discontinuities in the atmospheric boundary layer. The goal is to map how these abnormalities occur and change with site location characteristics and understand how they are correlated to atmospheric features such as wind speed and stability. The findings are also assessed in terms of the possibility of these profiles causing significant deviations in the common vertical wind profile descriptions. Based on this the applicability of the commonly used vertical wind profiles may be evaluated, and the need for more accurate vertical wind profile descriptions can be discussed. It is emphasized that the scope of the paper focuses on the applicability of the theory commonly employed today and not the validity of the theory itself.
2.1 Abnormal profile identification
In the process of identifying abnormal vertical wind profiles, the method of identifying local maxima previously implemented by Kettle (2014) is employed. In this method a 10 min averaged profile is categorized as abnormal if the velocity profile is not monotonically increasing for all heights, and the abnormal profiles can subsequently be categorized by the number of inflections they exhibit. This method was chosen due to the robustness in that all profiles can be placed with certainty within one category while simultaneously enabling the identification of discontinuities in the layering of the atmospheric boundary layer which may be associated with kinks in the velocity profile (Garratt, 1990). The time averaging of the profiles was not extended to longer periods than the 10 min average since the project aims at describing dynamical discontinuities which are simultaneously within the range of where classical MO theory becomes applicable (Petersen et al., 1998).
The number of profile maxima possible is a function of the number of measurement heights and can be described as , where Nh is the number of measurement heights, and Nmax is the highest number of maxima possible in the vertical wind profile. For a site with six measurement sites this would allow at most two profile maxima. In addition, a profile with zero local maximum may exhibit one local minimum where the velocity profile is decreasing up to this height and thereafter increasing. This category was appropriately named the −1 local maximum category, or the one minimum category. Profiles were also found where the velocity development was reversed and monotonically decreasing at all measurement heights. An example of the possible profiles for a site with six measurement heights is shown in Fig. 1, and a random selection of profiles from one measurement site are shown in Fig. 2.
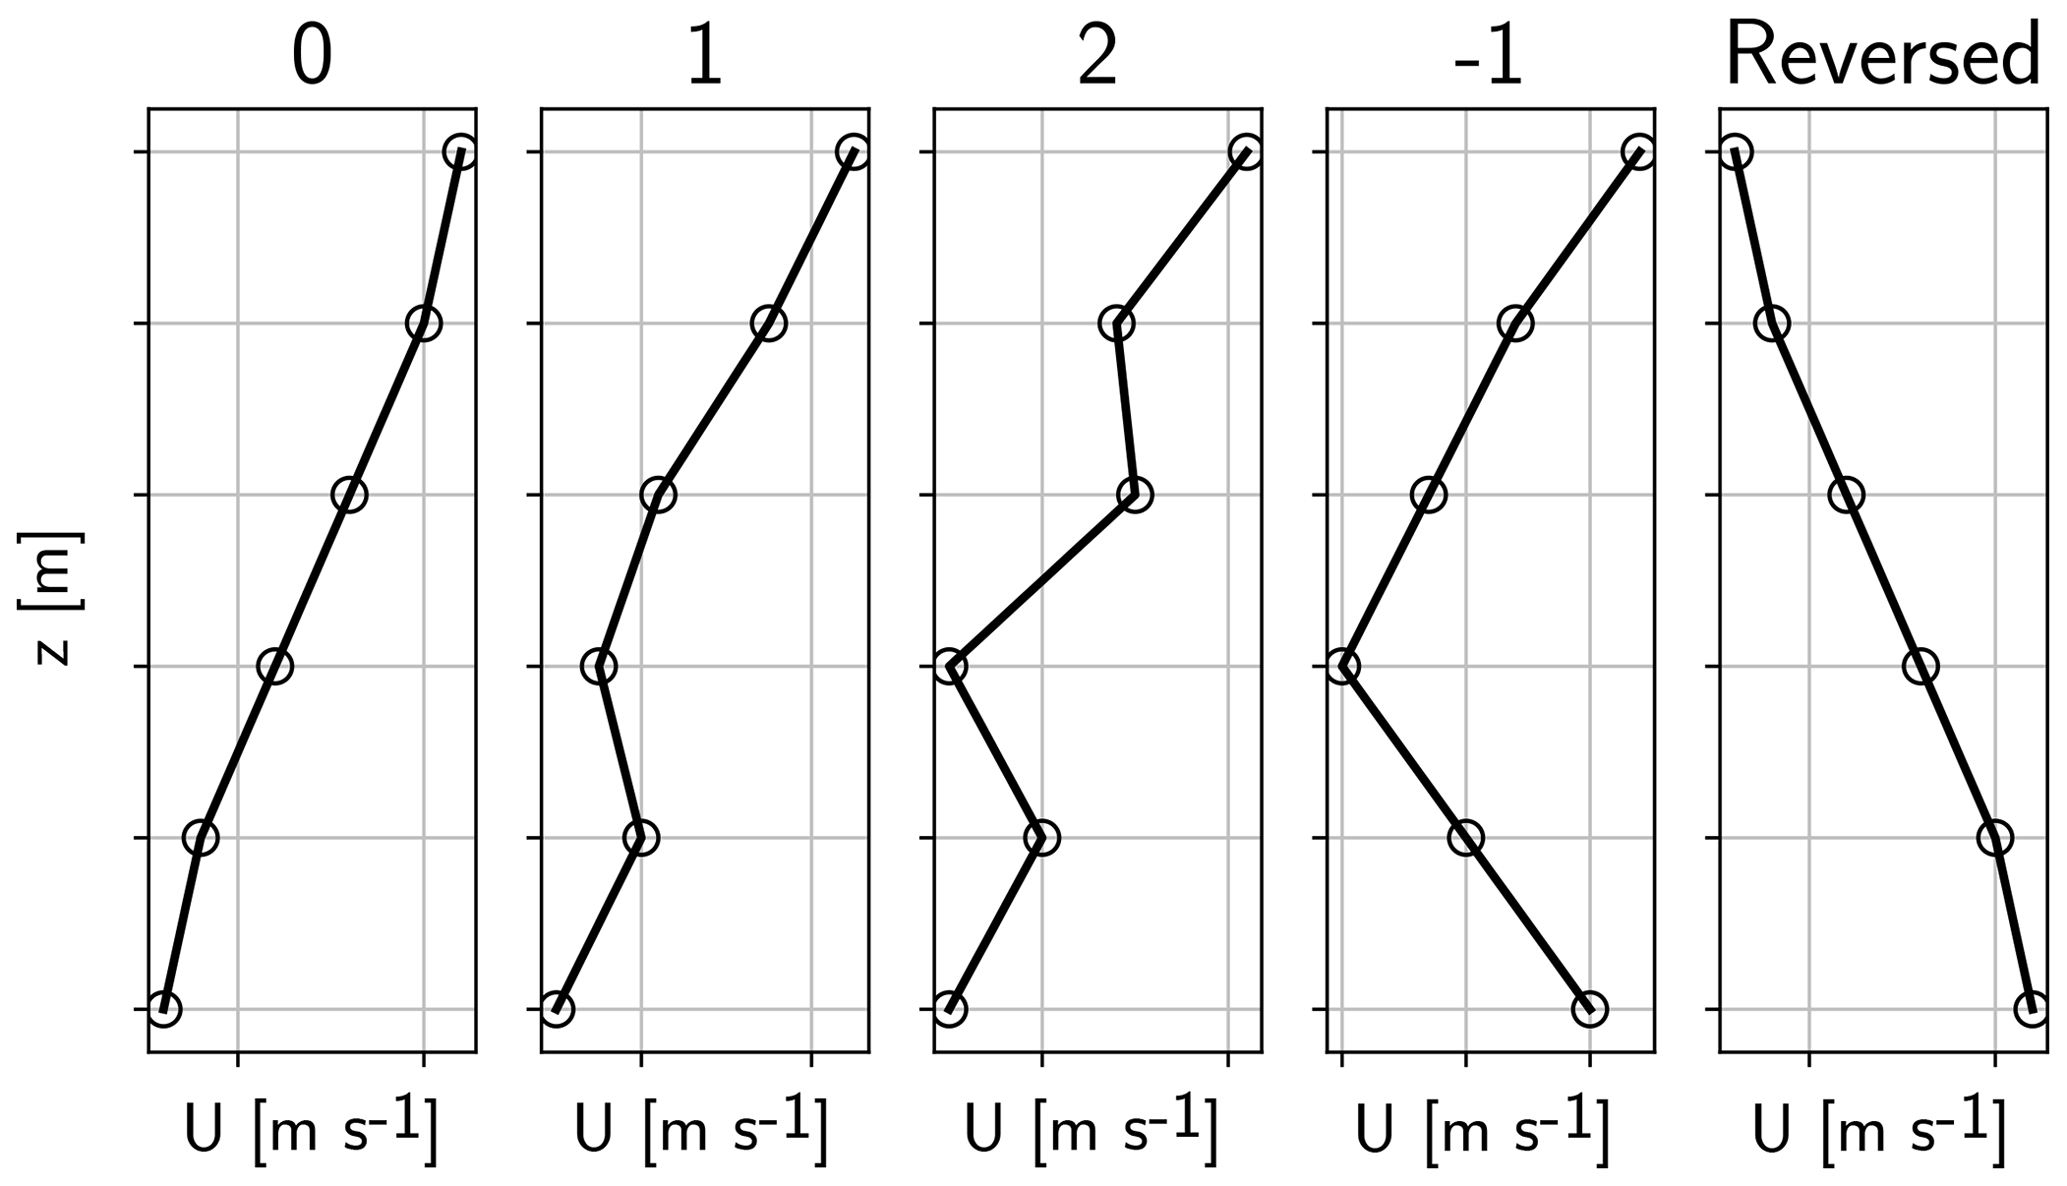
Figure 1Possible vertical wind profile categories when categorizing according to the number of local maxima at a site with six measurement heights. Titled according to the number of maxima.
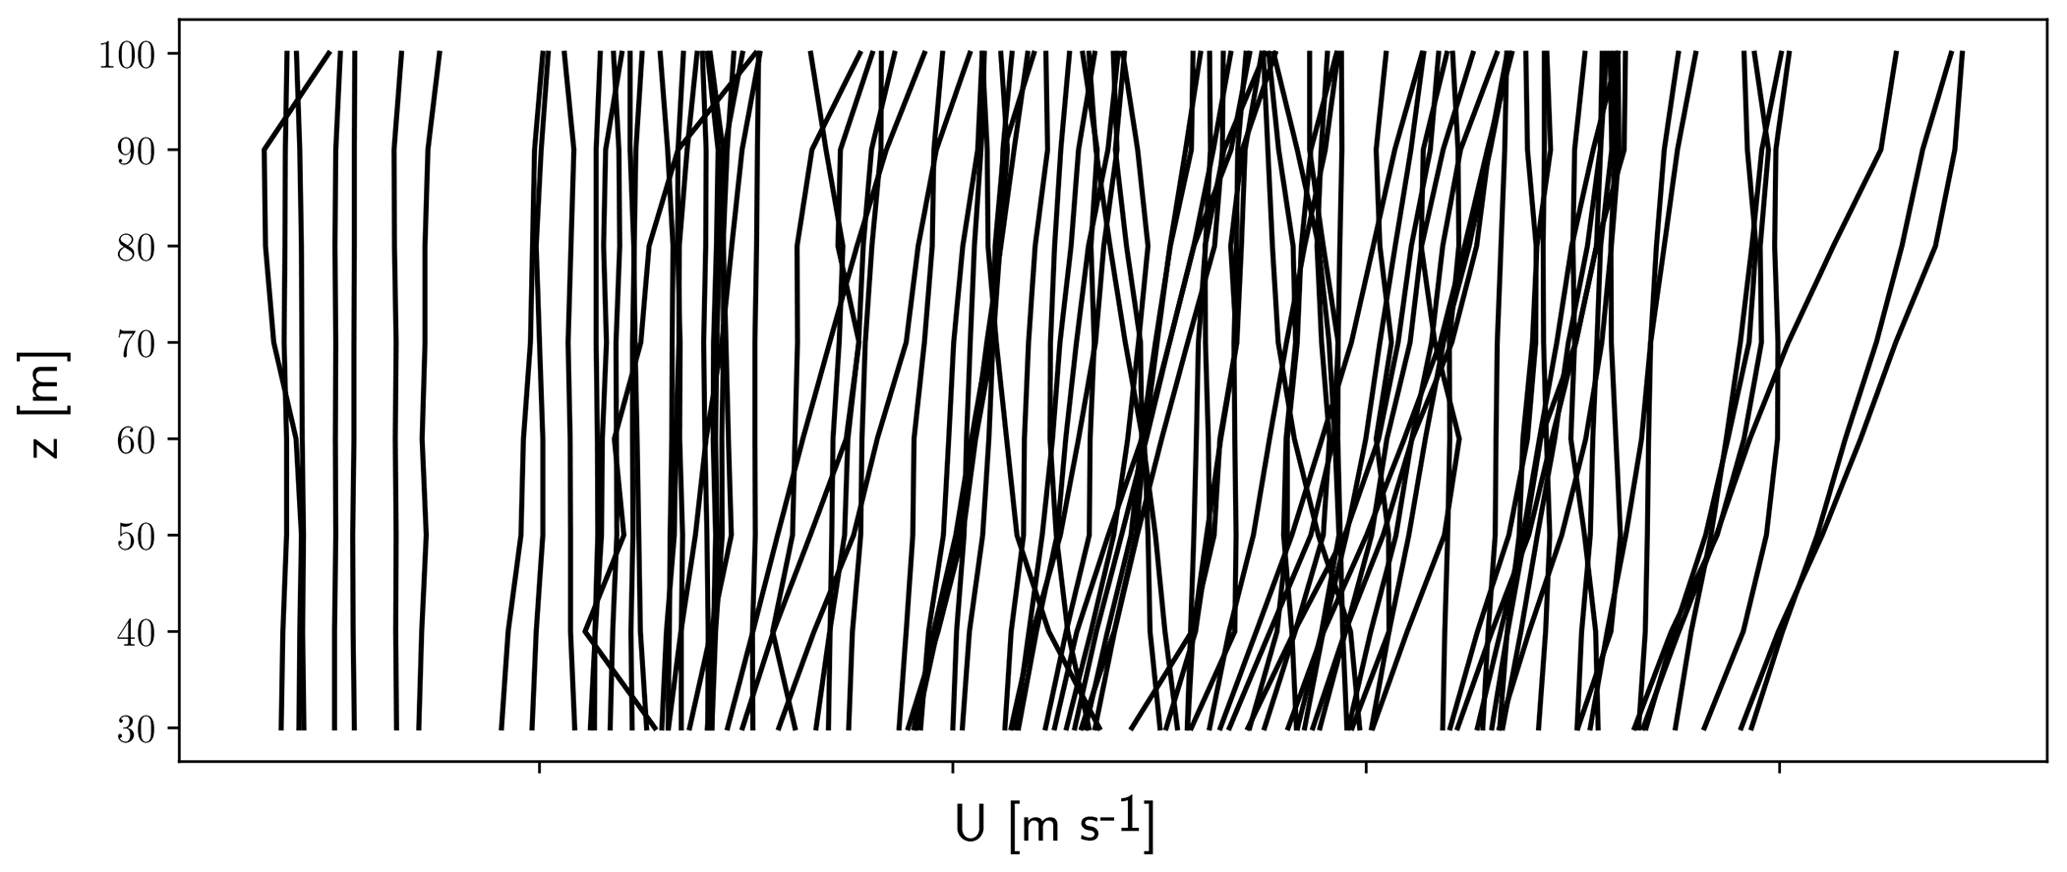
Figure 2The 10 min averaged vertical wind profiles at FINO2, where the wind speed at the lowest measuring point is shifted by 0.3 m s−1 per profile. Each profile is taken 20 h after the previous.
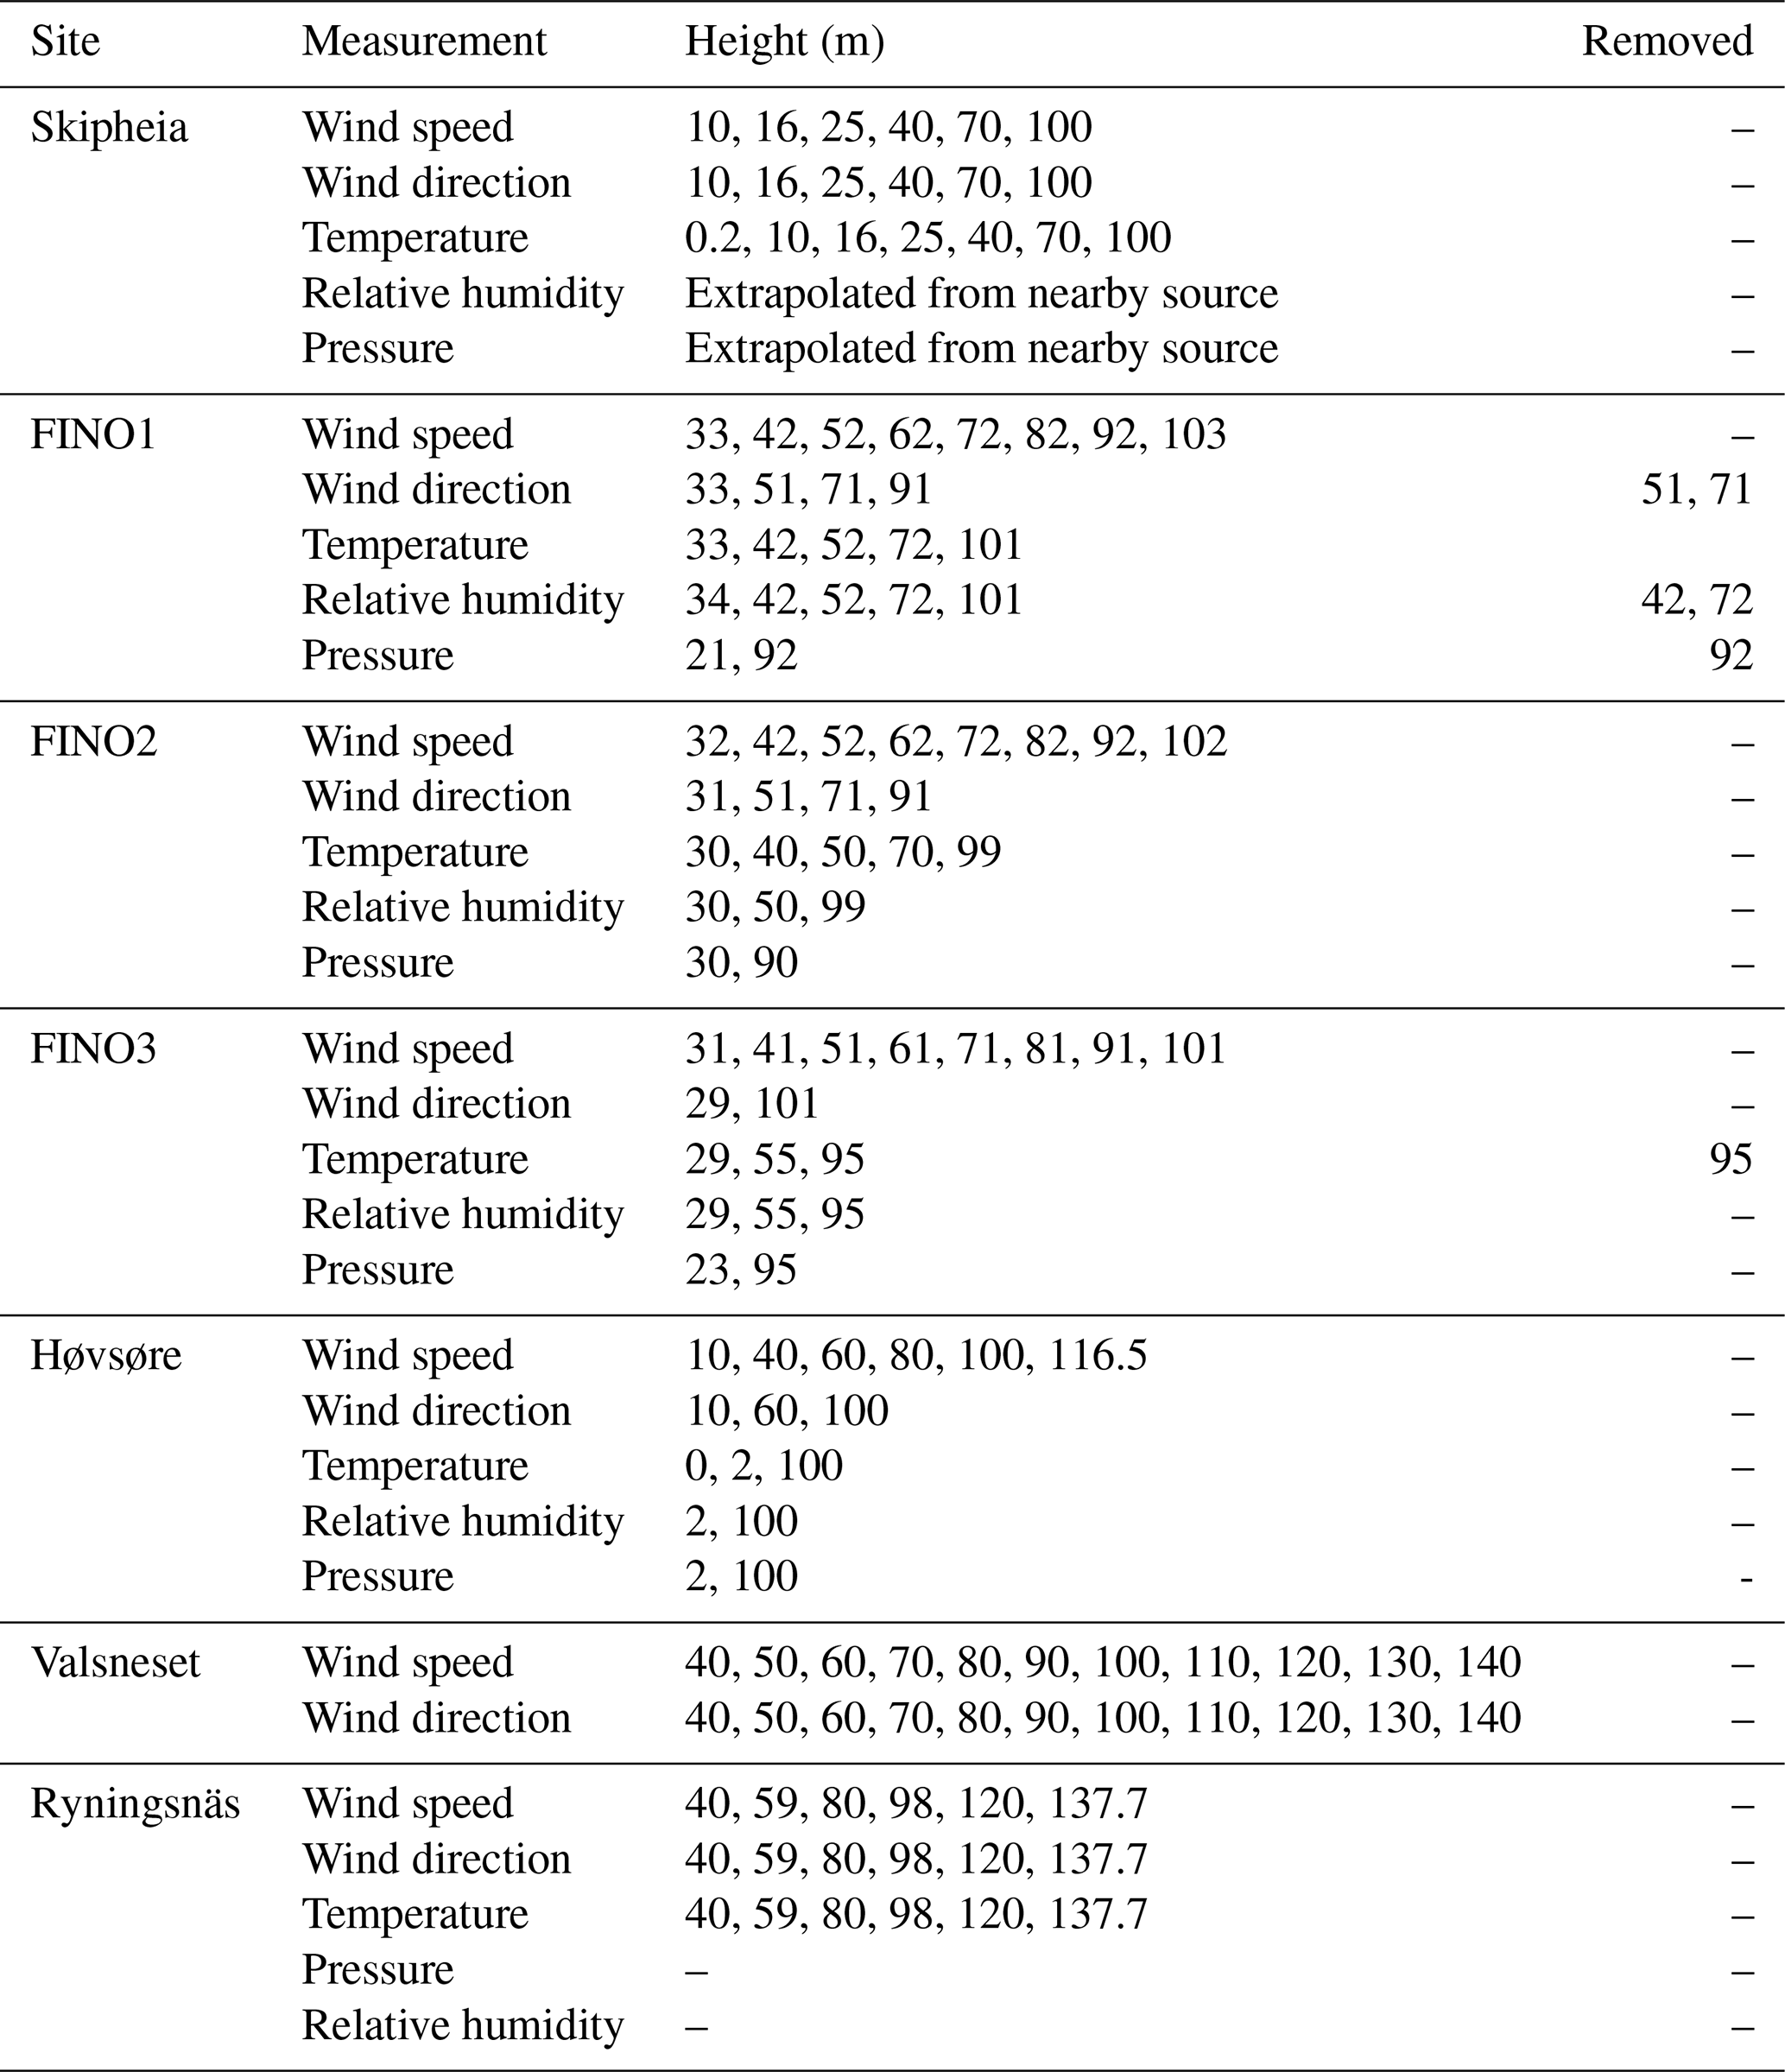
Measurements from a total of seven sites were studied in this analysis, starting at heights between 10 and 40 m and extending to 100–140 m depending on the site instrumentation. The exact measurement heights at each site used are given in Table 1. The sites were chosen based on data availability and location, with the aim of having data sets of high quality and a diversity of locations. Of the seven sites, three were located offshore (FINO1, FINO2 and FINO3) in the North Sea or Baltic Sea with varying distance to shore, and four were located onshore (Skipheia, Høvsøre, Valsneset and Ryningsnäs). The location of each site can be seen in Figs. 3 and 4. Of the four onshore sites, Skipheia and Valsneset are located in direct proximity to the sea and were therefore additionally categorized as coastal. Høvsøre is occasionally referred to as semi-coastal in this study since it is located only 1.7 km from the Danish North Sea coastline and mainly experiences offshore incoming winds.

Figure 3Map showing location of all sites used in this study.
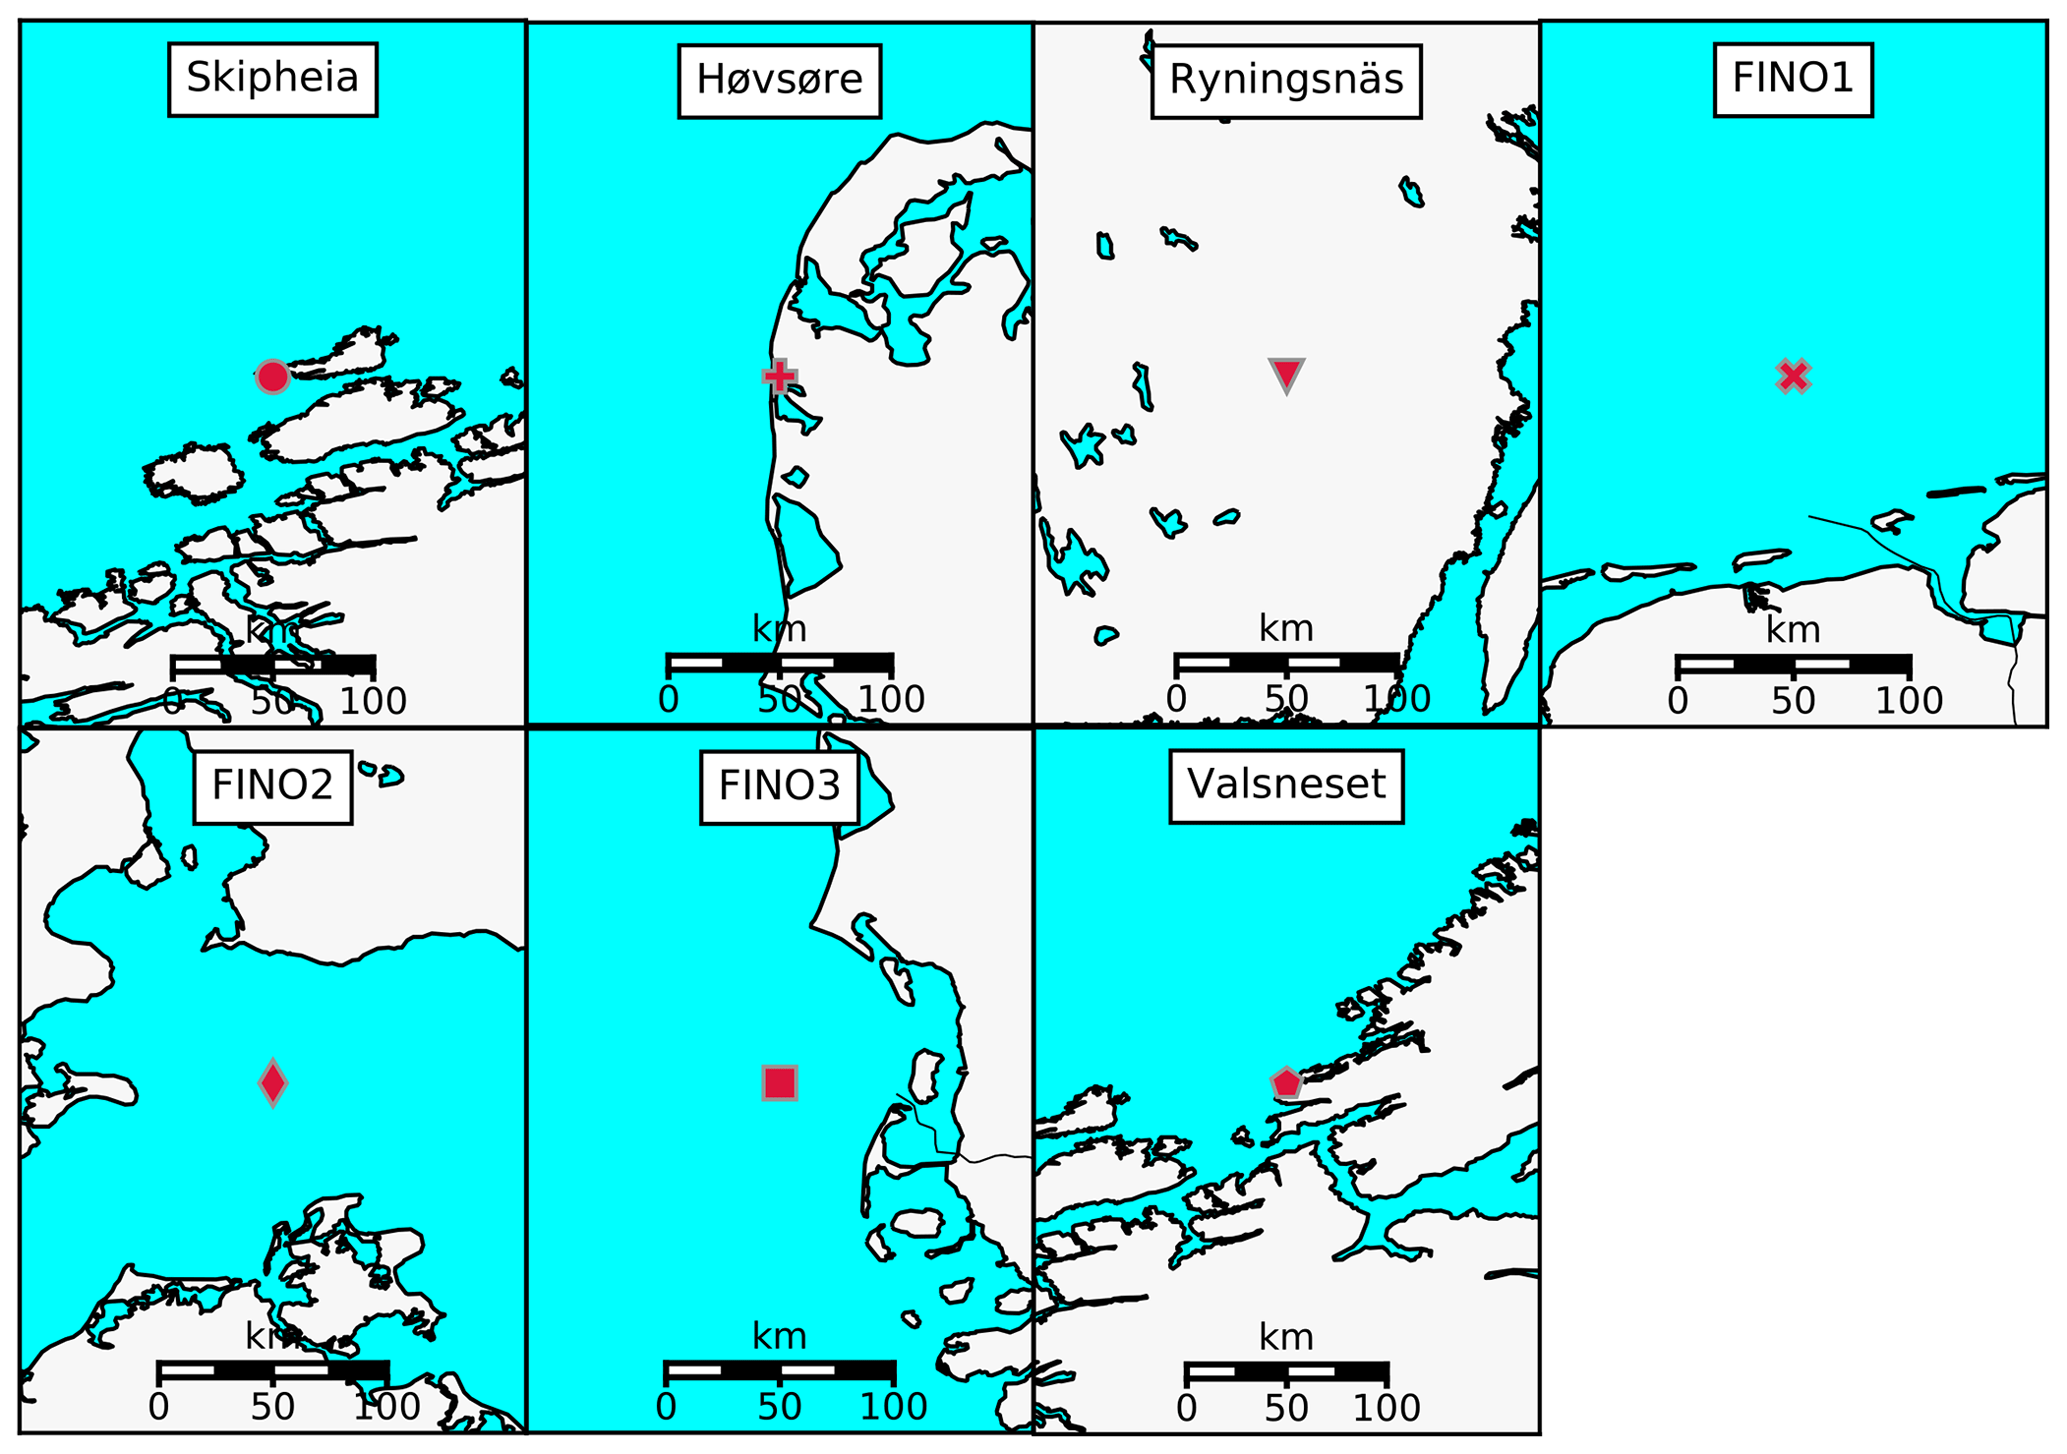
Figure 4Close-up of each site location.
Table 1Site instrumentation with measurement heights at each site. The removed quantities are explained for the individual sites in Sect. 3.1.
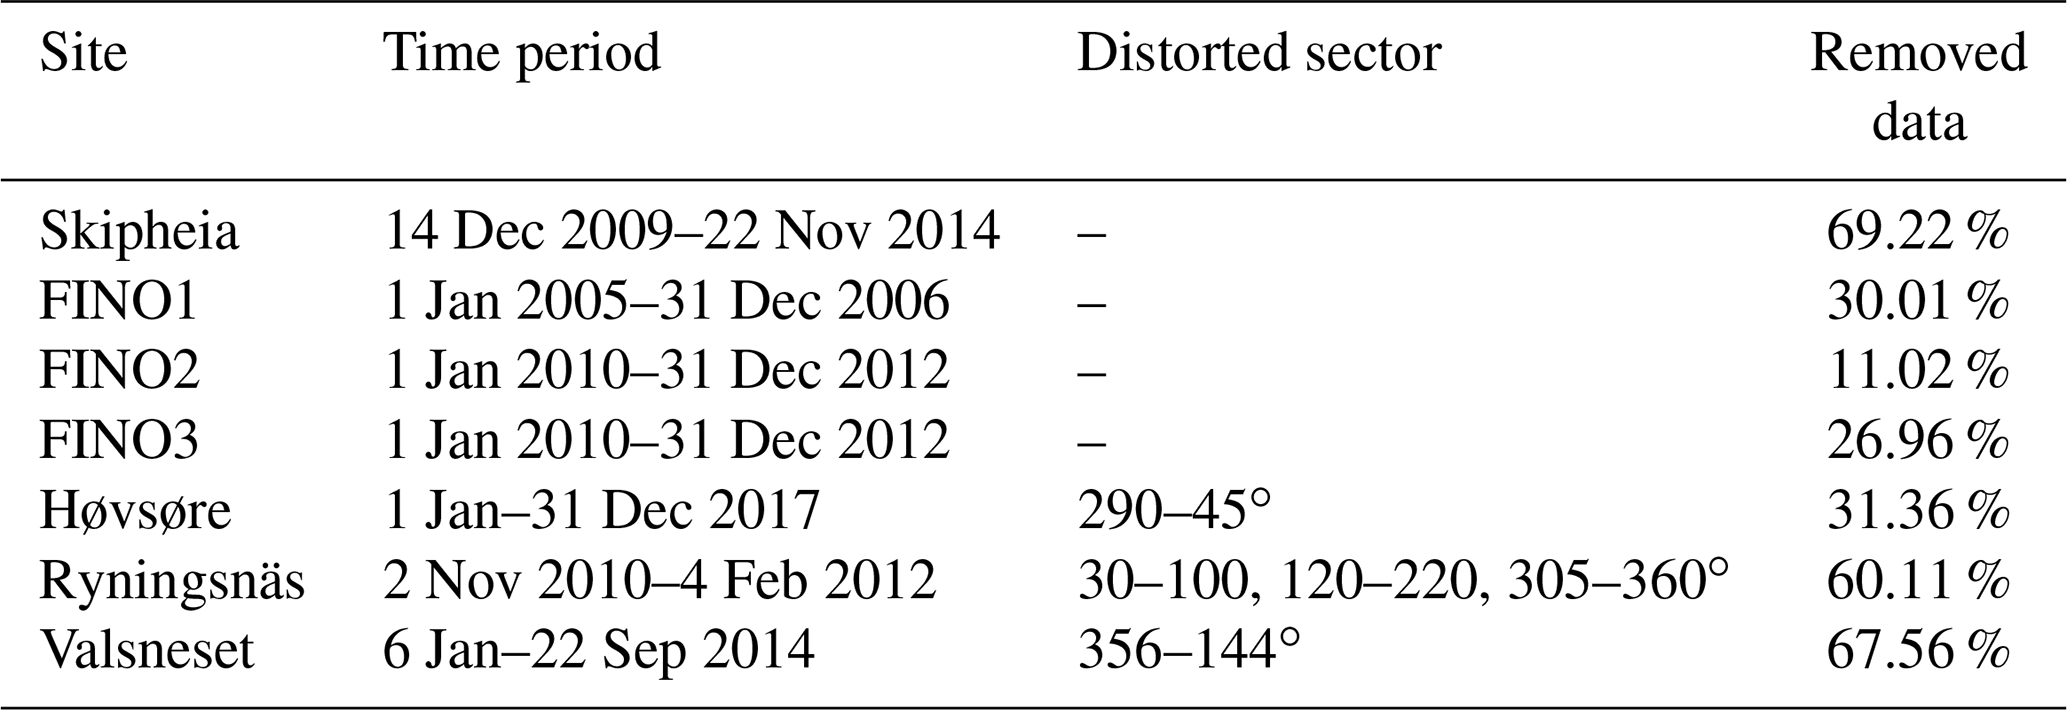
The time periods of the data recordings as well as the data availability after filtering the data according to the method described in Sect. 3.2 can be seen in Table 2. The data coverage was at least 1 year for all sites except Valsneset and several years for many sites, yielding a robust framework for conducting a thorough analysis. At the FINO sites the used time periods were chosen to be early in the mast lifetime due to high data availability and simultaneously avoiding distortion from the construction of nearby wind farms. The measurement data from all sites were provided and analyzed in the form of time-stamped 10 min averages. At the FINO sites and at Ryningsnäs, the wind speed heights were for visualization purposes named and visualized according to their nearest number divisible by 10, since some measurements had slight offsets (i.e., 32 is mentioned as 30, 51 as 50; see Table 1 for exact measurements). Section 3.1 provides a more detailed description of each site.
Table 2Time period of data extraction, the distorted sectors at each site and the percentage of data removed after filtering according to Sect. 3.2.
3.1 Measurement sites
3.1.1 Skipheia (Frøya)
The Skipheia meteorological mast is operated by Norwegian University of Science and Technology (NTNU) and located at the western mid-Norway coast on the island of Frøya. The mast is located on land, approximately 20 m a.s.l. (above sea level) and with the shortest distance to the ocean being 300 m in the south-southwestern direction. The site experiences winds coming in from the Norwegian Sea from the southwest, as well as onshore winds from the east. The site has six measurement heights from 10 to 100 m of wind velocity, direction and temperature and an additional near-ground temperature measurement. The data are available online; more information can be found in Domagalski and Sætran (2019). The wind velocity is recorded by two 2-D ultrasonic anemometers at each height mounted in two oppositely facing directions. The wind measurement not in the mast shadow was used at each time interval. The site does not record pressure or humidity; this was extracted from a nearby meteorological station for usage in the stability analysis. The uncertainty of this is discussed in Sect. 3.3. The Skipheia site had notable downtime during the measurement campaign but the length of the campaign ensured data coverage across all times of year which had a recording time equivalent to well over 1 year of measurements.
3.1.2 FINO1
The FINO1 site is located in the German Bight (North Sea) approximately 45 km north of the island of Borkum. The distance to shore varies largely with direction as seen in Fig. 3. Further information regarding the FINO1 site and instrumentation can be found in FINO1 (2019).
The FINO1 site has a research mast that is highly equipped with temperature, wind speed and wind direction measurements. The cup anemometer measurements used in this study measure the wind speed at eight heights from 30 to 100 m, which are mounted on one boom with a length of 3.0–6.5 m at each height, and the booms are mounted in the directional sector of 135–143∘. The top anemometer is mounted on top of the mast in a lightning protection cage. The relative humidity measurements at z=42 m and 72 m as well as the pressure measurement at z=92 had large data gaps and were not used for the entire study (see Table 1). The FINO1 mast has been shown to be prone to mast speedup effects (Westerhellweg et al., 2012). The handling of this issue is discussed in Sect. 3.2.1.
3.1.3 FINO2
The FINO2 site is offshore, located in the southwestern part of the Baltic Sea approximately 33 km north of the German island of Rügen. The site experiences a mixture of fetch distances, being located within the triangle of Denmark in the west, Sweden in the north and Germany in the south. Cup anemometers measure the wind speed at eight heights from 30 to 100 m and from one direction at each height (180∘). The top anemometer is mounted on top of the mast differently from the other wind speed measurements. The data set had few gaps and a high availability which can be seen in Table 2. Further information regarding the FINO2 site can be found in FINO2 (2019).
3.1.4 FINO3
The FINO3 site is located north of FINO1 in the German Bight (North Sea), approximately 80 km west from the German island of Sylt. The site is instrumented with several booms to account for flow distortion, however not at all heights. Wind speeds recorded on booms in the direction of 345∘ were used for all eight measurement heights from 30 to 100 m for consistency. At FINO3 the temperature at z=95 m was found to be missing when downloading the data regardless of the period chosen and was therefore not used in the final analysis. Further information regarding the FINO3 site can be found in FINO3 (2019).
3.1.5 Høvsøre
The Høvsøre site is located at the west coast of Denmark in the coastal farmland of west Jutland. The site is located in a flat and homogeneous area. The surrounding features include the village of Bøvlingbjerg approximately 3 km southeast, the North Sea coastline with a sand embankment 12 m high 1.7 km to the west and the Nissum Fjord 800 m to the south. The site conducts tests on several masts and turbines, and the measuring mast used in this study is located directly south of a row of five turbines which are aligned in the northern direction, and each of these turbines is additionally paired with a power mast located 200 m west of it (Smith et al., 2006). The measurements used in this study are recorded by a meteorological mast where the wind velocity is recorded at six heights from 10 to 116.5 m (see Table 2). The cup anemometers and wind vanes are all installed on south-facing booms, thus making the mast distortion in the same direction as the turbine-wake-influenced region. A 115∘ sector was excluded to avoid turbine distortion, as well as distortion due to the power masts. This was a conservative approach in comparison to the recommended practice (IEC, 2017) and the common practice when analyzing the Høvsøre data which is to disregard mast effects (Peña et al., 2016). Further information on the site as well as results on 10 years of measurements at the Høvsøre site have been published by Peña et al. (2016).
3.1.6 Ryningsnäs
Ryningsnäs is a forested location in Sweden, approximately 30km inland from the southeastern Swedish coast (Arnqvist et al., 2015). The terrain in the region is mostly flat with mild variations. Due to forestry and natural variations the landscape is however not completely homogeneous. The measurements are conducted through equipment installed on a 140 m high mast located in the northwestern corner of a 200 m × 250 m clearing. The wind velocity was recorded at six heights on the mast by 3-D ultrasonic anemometers. Two turbines are present at the site approximately 200 m from the mast in the southern and northeastern directions. The sectors affected by the nearby turbines as well as the mast (mast effects were observed) were removed in the analysis; the sectors are given in Table 2. The pressure and relative humidity were not measured at the mast, and an analysis of atmospheric stability at Ryningsnäs was therefore not conducted. Further information on the Ryningsnäs site is given by Arnqvist et al. (2015).
3.1.7 Valsneset
The Valsneset site is located northwest of Trondheim (Norway) on the peninsula of Fosen. The site is situated in the immediate vicinity of the Norwegian Sea in the north and west and with a mixture of smaller and bigger rocks as well as sea in the south and east. The data used originate from a lidar measurement campaign which ran for 10 months and measured wind speeds at 11 heights in 10 m increments from 40 to 140 m using the Leosphere Windcube v2. The lidar has a measurement frequency of 1 Hz, a velocity accuracy of 0.1 m s−1 and a directional accuracy of 2∘. The data availability was set to a requirement of >99 % in each 10 min recording interval to ensure correct 10 min averages. The lack of temperature measurements prohibited a stability analysis at Valsneset. The site has several nearby wind turbines, restricting the wind sector analyzed (see Table 2) which was removed following the recommendation of IEC (2017). A more detailed description of the Valsneset site is given by Bardal et al. (2015).
3.2 Data filtering
For all sites, the time series of the 10 min averaged data was filtered to remove any nonphysical measurements as well as wind data from distorted directional sectors if the site exhibited wind distortion. Nonphysical measurements entailed measurements which were artificially high or low compared to their typical range. In addition the FINO1, FINO2, FINO3 and Ryningsnäs data sets were obtained with attached quality tags at each time level; any data entry tagged as poor was therefore removed. The distorted sectors of a site are described in their respective site section and an overview is provided in Table 2. The effect of mast distortion is discussed in Sect. 3.2.1.
After the tagging of poor measurements, the data removal was performed as follows: if any measurement (direction, velocity, temperature, pressure, relative humidity) was missing due to downtime, from a distorted direction, found to be nonphysical or tagged with a poor quality, all data from this 10 min interval were removed and all measurements within this 10 min average were therefore discarded. Some measurements at FINO1 and FINO3 did however have longer periods of downtime which impacted the filtering to such a degree that they had to be removed, an issue which was similarly encountered by Argyle and Watson (2014) at FINO3. A quantity was only removed if the measurement was not a wind speed measurement and if the same quantity was available at other heights so that its removal did not restrict any additional analysis. The removed quantities are given in Table 1. No filter was set with regards to minimum velocity of the data or to the standard deviation of a 10 min averaged quantity. This was done intentionally to avoid the results being artificially affected by these filters and was also done in a similar study by Kettle (2014).
3.2.1 Filtering mast distortion
Wind measurements from meteorological masts in certain sectors may be affected by the mast itself, a phenomenon called mast distortion. A common way of circumventing this is to record the wind speed on booms positioned in opposite directional sectors such that there is always a direction of measurement not impacted by mast distortion. This method was enforced at Skipheia, which had wind velocity measurements in two opposite directions at all measurement heights. At Høvsøre the mast-distorted sector coalesced with a turbine-distorted sector and was subsequently removed. The Ryningsnäs data were recorded by ultrasonic anemometers which were found to show mast-distortion effects; the mast-distorted sector was therefore removed. As the Valsneset data were measured by a lidar device, a mast-distortion analysis was not necessary.
The data from the FINO sites include mast-corrected wind speeds based on a uniform ambient flow correction (UAM) algorithm (Westerhellweg et al., 2012). Mast-corrected wind speeds were however only available at all heights at the FINO2 site. The analysis in this study was conducted on both the mast-corrected and non-corrected wind speeds at FINO2, as well as both including and excluding the mast-distorted sectors at all FINO sites. The results were found to be similar in all cases; thus no mast-distortion filtering was employed. The same conclusion was drawn by Kettle (2014) when studying local maxima at FINO1.
3.3 Atmospheric stability calculation
A part of this study includes the investigation of the correlation between atmospheric stability and abnormal vertical wind profiles. The stability analysis was conducted using the Richardson number (Arya, 1988) to calculate the Obukhov length and subsequently dividing the occurrences into the five stability classes (very stable, stable, neutral, unstable, very unstable) using Obukhov length bins given by Bardal et al. (2018). The Richardson method was used for stability calculation, which excluded Ryningsnäs and Valsneset from the stability analysis due to lack of measurements. The remaining sites were however found to sufficiently describe the effect of atmospheric stability on abnormal vertical wind profiles. At sites where the pressure and relative humidity were only available at one height, they were assumed constant. When relative humidity was available at two heights but not the height of the temperature measurement, it was linearly interpolated. The effect of varying the relative humidity was tested and did not change the conclusions of the study but may be a source of uncertainty in the stability analysis, especially during neutral conditions (Peña et al., 2008). The effect of only having a pressure measurement at one height was tested and found to be minimal; the same conclusion was drawn by Argyle and Watson (2014).
For the offshore sites the gradient Richardson formulation was used due to low availability of sea temperature measurements, while for the onshore sites near-ground measurements enabled the use of the bulk Richardson number formulation. While the gradient method provides a more correct description of the dynamics of the boundary layer, it requires careful calibration of the instrumentation. The gradient method is due to the postulated thermal layering of the marine atmospheric boundary layer (MABL) also found by Argyle and Watson (2014) to be dependant on the measuring heights used. At the offshore sites, the following heights were used in the stability calculation: 50 and 70 m at FINO1 and FINO2 and 30 and 55 m at FINO3. At the onshore sites the following heights were used in addition to the surface temperature: 40 m at Skipheia and 100 m at Høvsøre. These heights were chosen due to high data availability, and where possible the main correlations between atmospheric stability and wind profile inflections have been cross-checked using different stability measurement heights. The cross-reference was found to strengthen the main findings related to atmospheric stability. There is nonetheless a degree of uncertainty related to the stability analysis, at several sites the stability distribution was therefore compared to previous studies and showed reasonable agreement (Høvsøre: Peña et al., 2016, Skipheia: Bardal et al., 2018, FINO1 and FINO3: Argyle and Watson, 2014).
To illustrate the variation in the 10 min averaged vertical wind profile, a selection of arbitrary profiles from FINO2 are plotted in Fig. 2. The profiles clearly illustrate that the 10 min averaged wind profile does not necessarily conform with the shape of neither the power law or the logarithmic law. Some profiles represent instances where the wind increases with height as expected. A significant number of the profiles do however exhibit unexpected traits of singular or multiple local maxima. Figure 2 clearly demonstrates the importance of resolving issues associated with the vertical wind profile description.
The quantity of occurrence of the different profiles categorized by the number of local maxima is the primary indicator of the in-applicability of the commonly used wind profile formulations in this study. The percentage-wise and total occurrence of the different profile categories are presented in Table 3 and as a histogram in Fig. 5. The blank spaces indicate that the site has too few measurement heights to experience such a number of local maxima (also referred to as “kinks” or “inflections”). Valsneset is the only site which had enough measurement heights to record instances of four local maxima. The occurrence was however as low as 0.03 % (four cases) and is excluded from Table 3.
Table 3Occurrence of different profile categories at all sites. Blank spaces indicate that the site had too few measurement heights for the profile category to be possible.
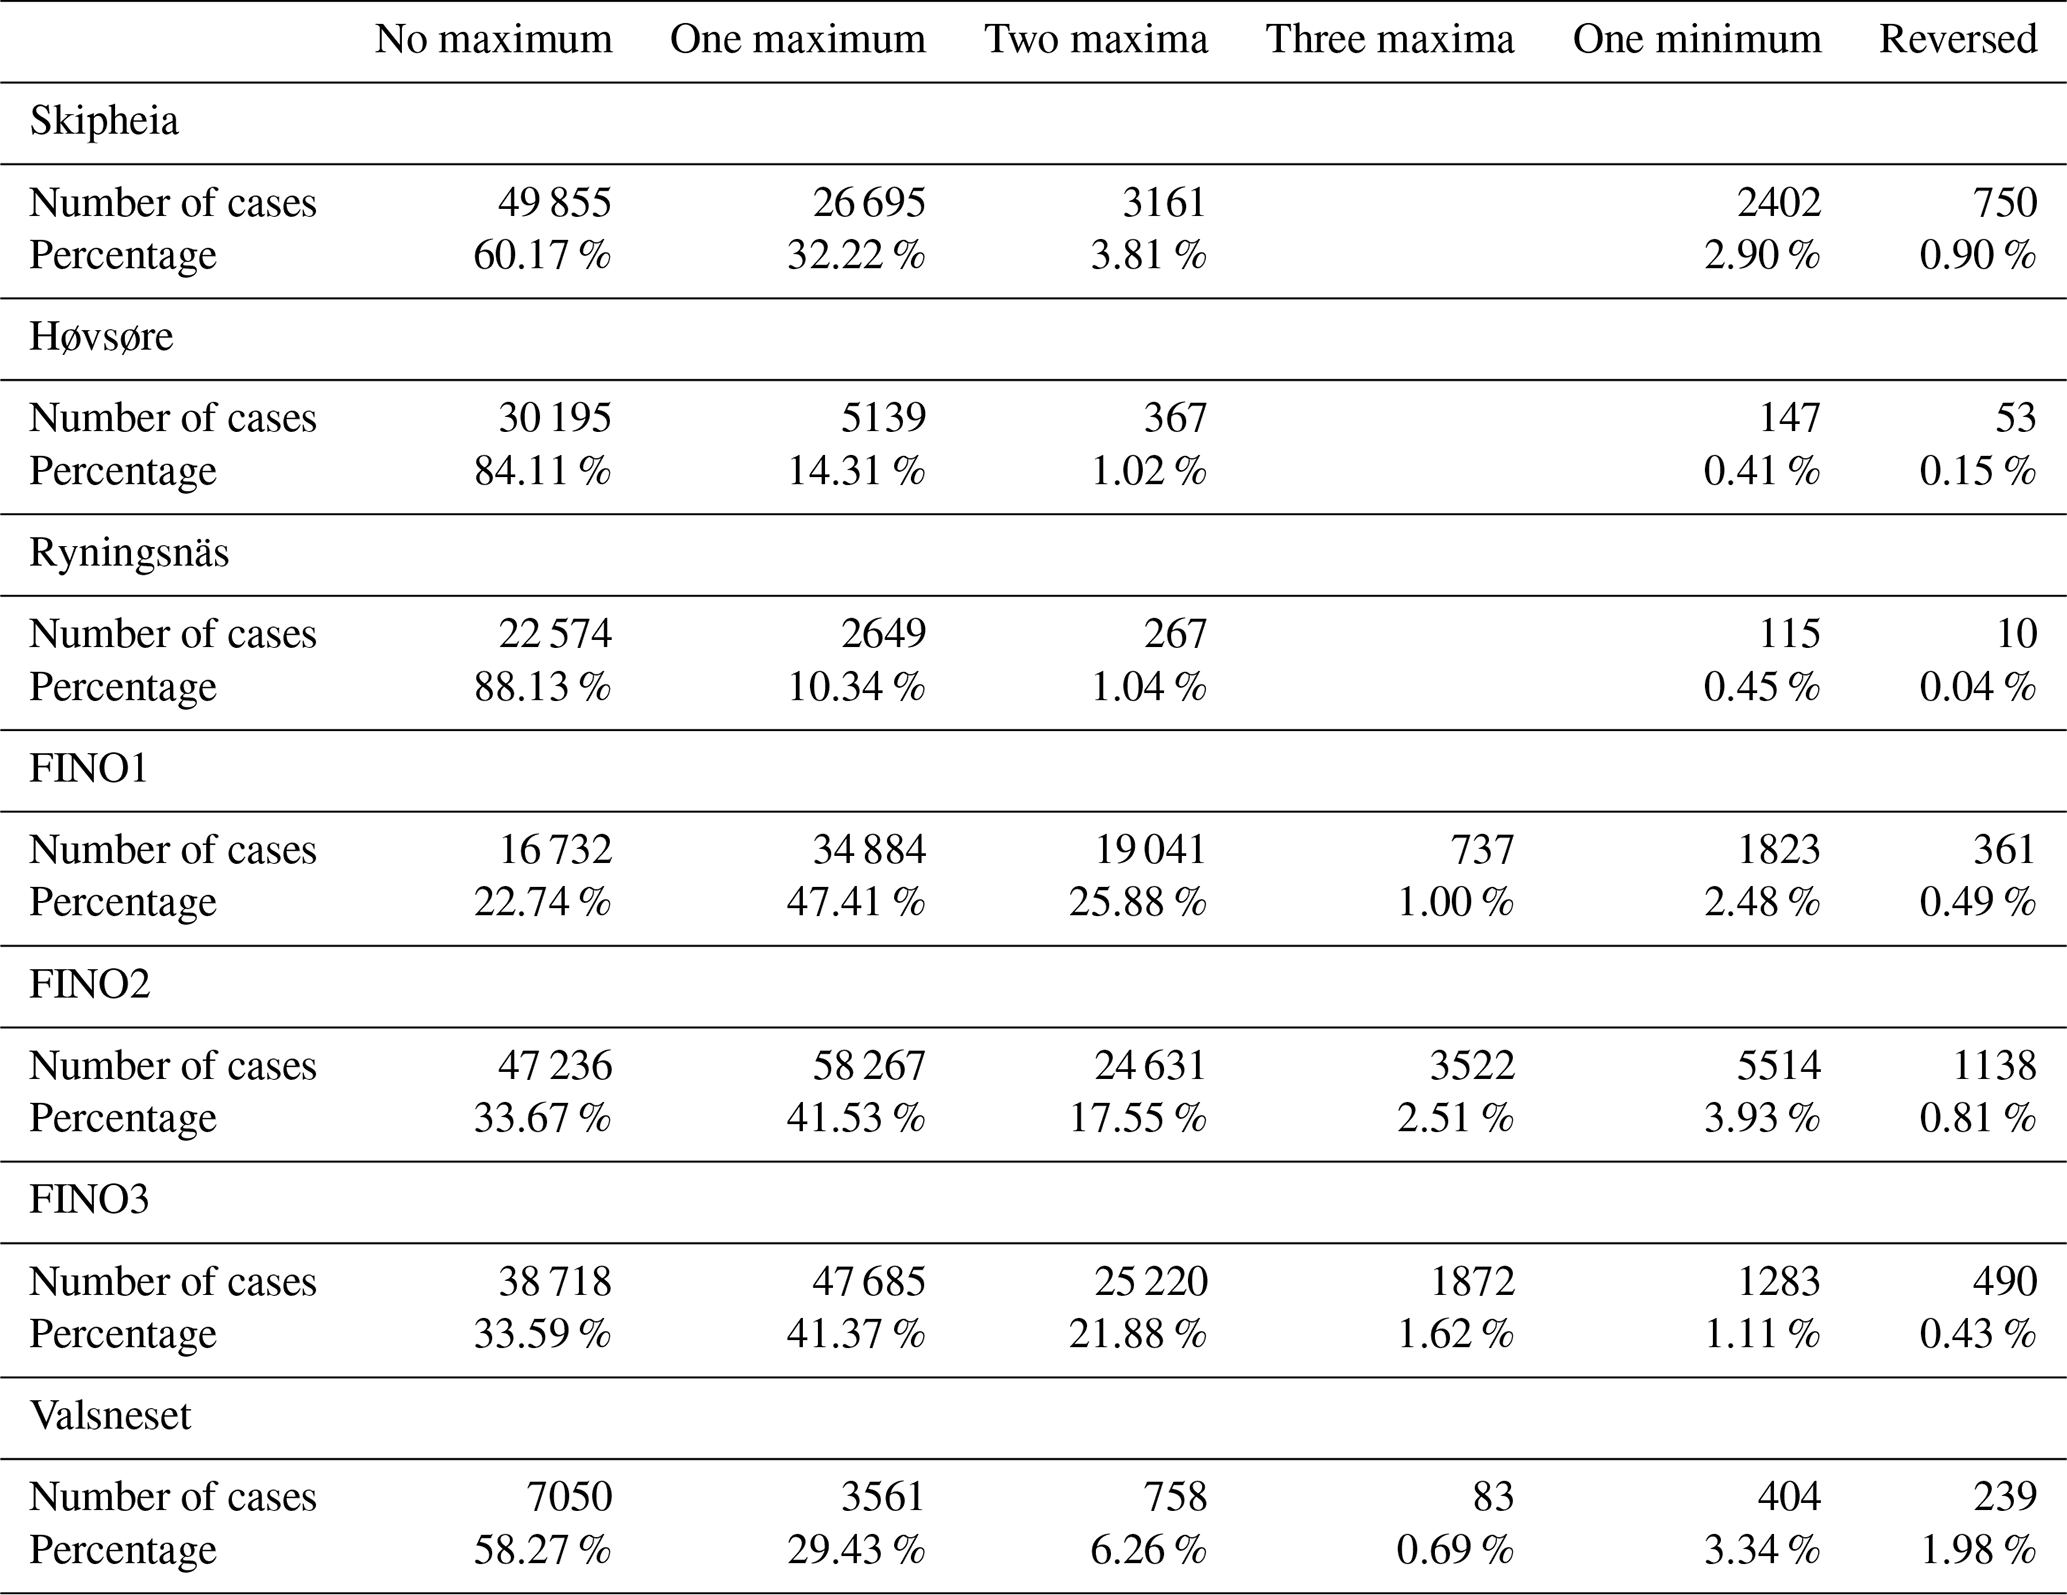
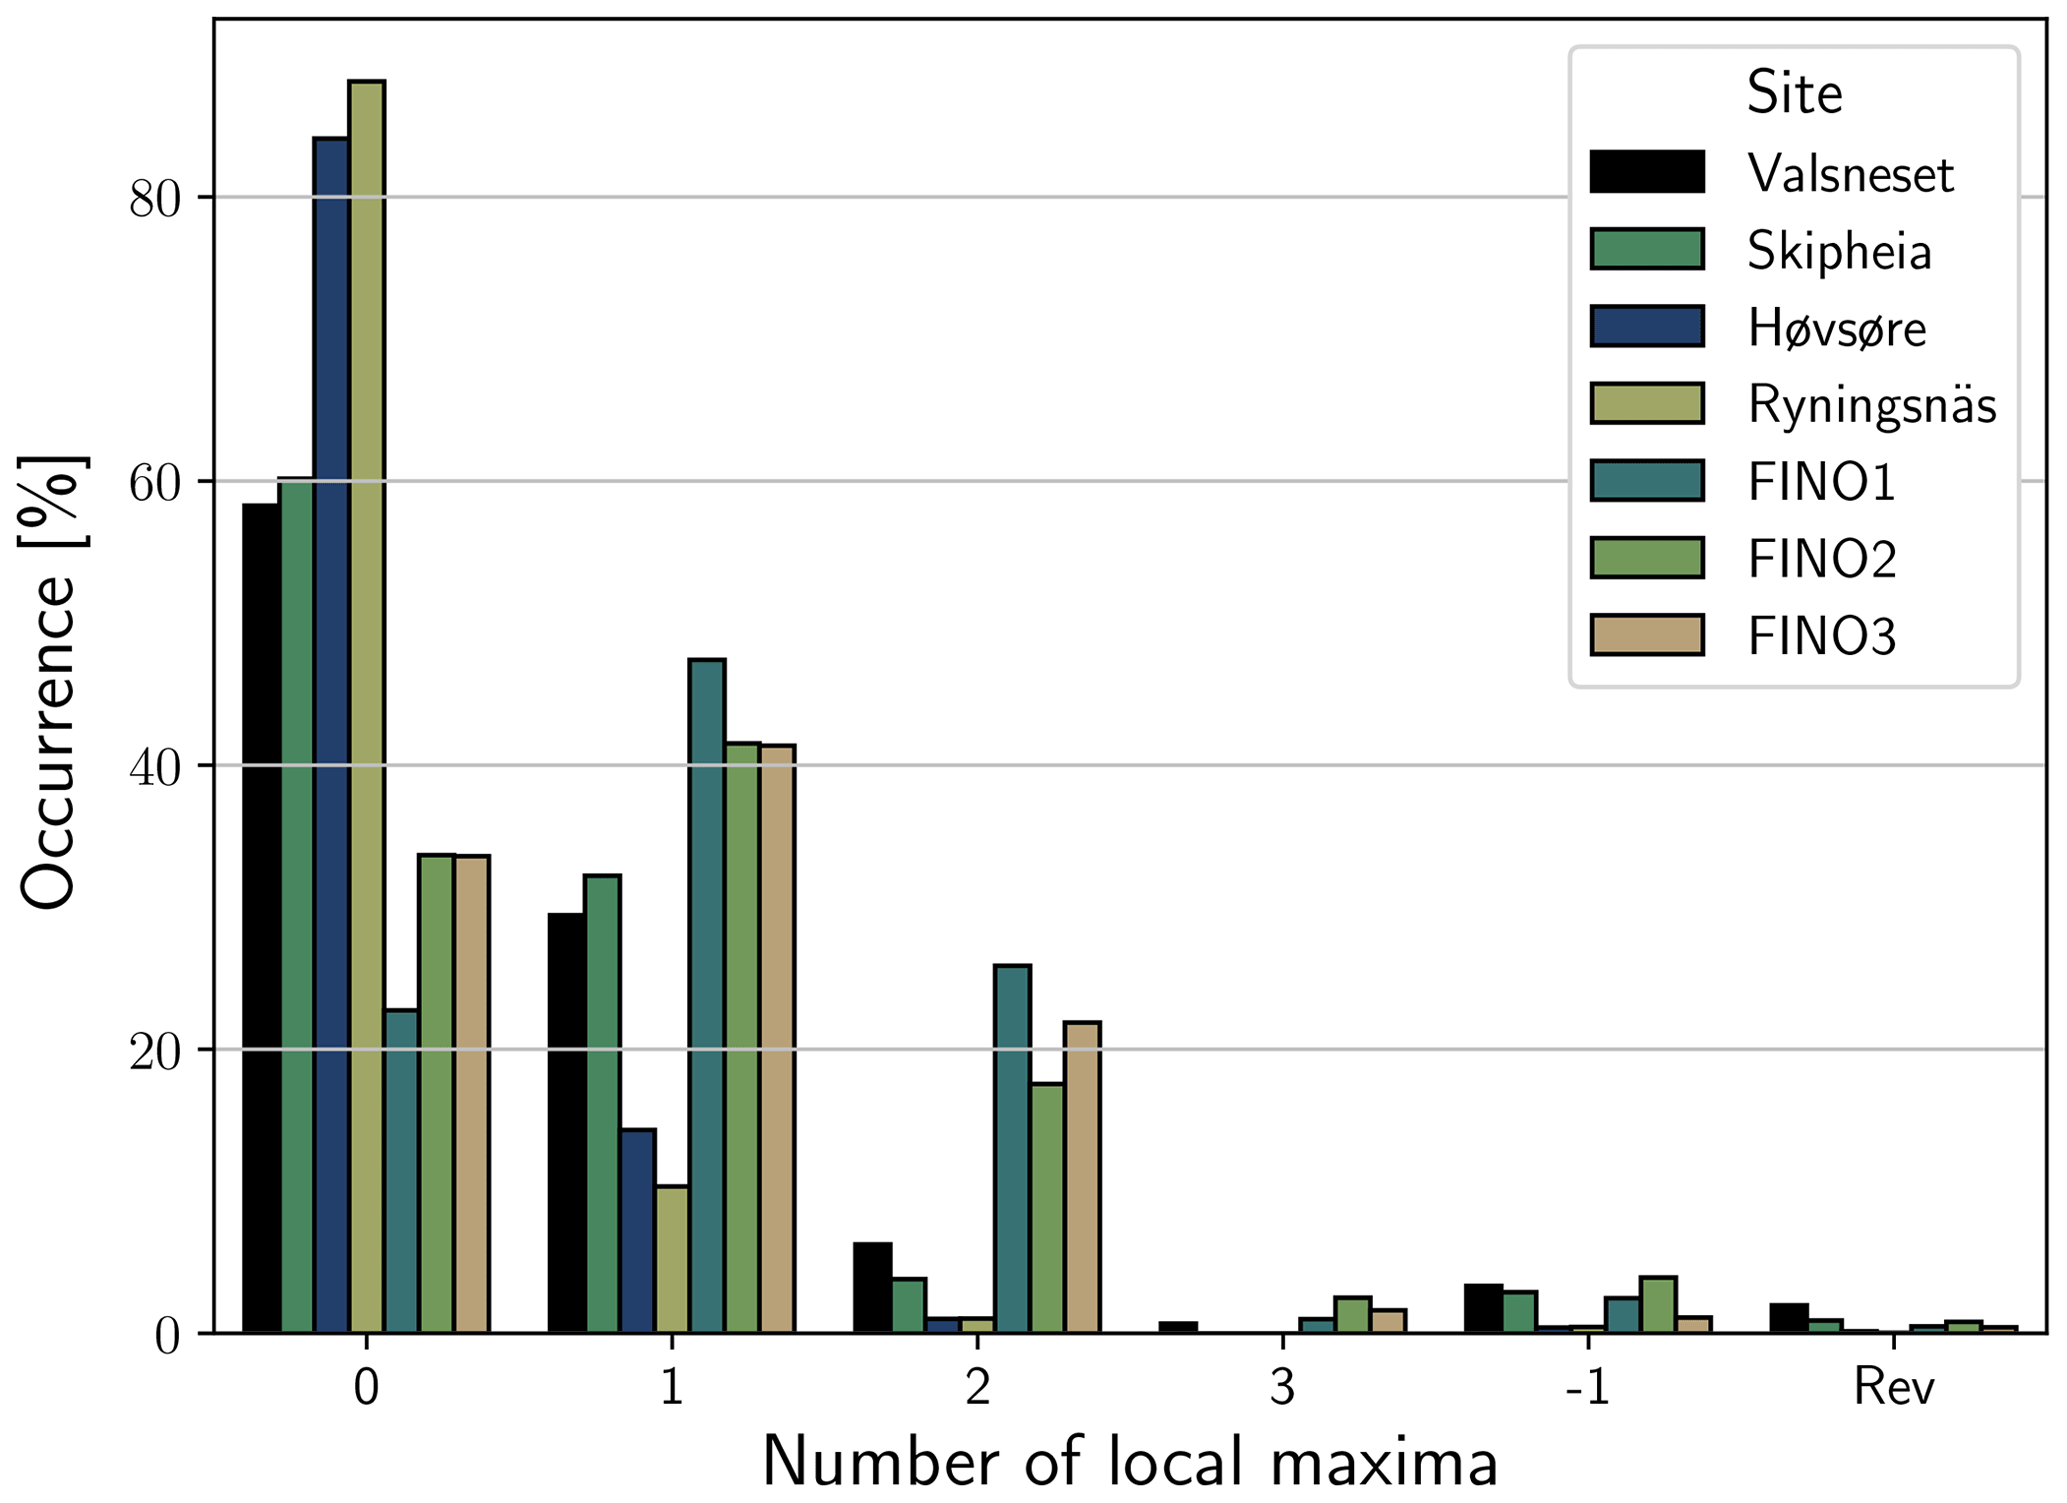
The results reveal that offshore sites are most prone to abnormal vertical wind profiles and therefore have the lowest occurrence of the expected 0-inflection vertical wind profile. At the offshore sites FINO1, FINO2 and FINO3 profiles are found to be predominantly abnormal and profiles exhibit inflections or a reversed profile in 77.26 % of profiles at FINO1, 66.33 % at FINO2 and 66.41 % at FINO3. The onshore occurrence of abnormal profiles is found to scale inversely with the distance to shore, and the two coastal sites Skipheia (39.83 %) and Valsneset (41.73 %) therefore both show a higher occurrence of abnormal profiles amongst the onshore sites. This decreases for the semi-coastal site Høvsøre (15.89 %), and abnormalities are most rare for the far-inland site Ryningsnäs (11.87 %). Although the three FINO sites have different fetch distances ranging from 30 to 80 km and are located in different offshore conditions (North–Baltic Sea), this is not observed in the results, and analysis of several years of data from the sites did not reveal a correlation between the fetch of a site and the occurrence of local maximum in the vertical wind profile. As the North Sea and Baltic Sea, where the FINO sites are located, are both to a varying degree enclosed by land, it is unclear whether this result holds for winds which are clear of coastal effects.
When abnormalities are present they are predominantly in the form of one local maximum. The 1-inflection profiles are found to occur most often at FINO1 (47.41 %), with FINO2 (41.53 %) and FINO3 (41.37 %) showing slightly lower and similar relative occurrences. The 1-inflection profiles are also the dominant abnormal profile type onshore, being present in 29.43 % of profiles at Valsneset, 32.22 % of profiles at Skipheia, 14.31 % of profiles at Høvsøre and only 10.34 % of profiles at Ryningsnäs. Here a scaling was found, namely that, of the onshore sites, the coastal sites have a higher number of profiles with multiple inflections, while further inland the 1-inflection category becomes more common among the abnormal profiles.
The results also reveal that the three offshore FINO sites exhibit the most profiles with two local maxima. All FINO sites have a percentage-wise higher occurrence of two local maxima (FINO1: 25.88 %; FINO2: 17.55 %; FINO3: 21.88 %) than the coastal Valsneset site (6.26 %), even though the number of measurement heights is 11 at Valsneset and 8 at the FINO sites, which makes a profile with several local maxima more probable at Valsneset. This clearly indicates that local maxima are more prominent at offshore sites than they are onshore. The 3-inflection profile occurs rarely and therefore does not have large implications for wind energy applications. It is also mentioned here that the results of FINO1 are as expected very similar to the results found by Kettle (2014), who studied local maxima in the VWP for the year 2005 at FINO1.
The reversed and −1-inflection profiles also occur at all sites, but similar to the 3-inflection profiles their occurrence is too low to be very relevant for wind energy applications. It should however be mentioned that the occurrence of these categories is linked; a site with a higher number of reversed profiles is also seen to have a higher occurrence of −1-inflection profiles.
From these results it is clear that abnormalities are most common offshore and are found to decrease with an increasing surface roughness. For onshore sites, locations in direct proximity to the coast (such as Skipheia and Valsneset) are found to be much more prone to abnormalities than sites only a few kilometers inland (Høvsøre). The increased surface roughness associated with the forested site Ryningsnäs results in higher degrees of turbulence, which leads to large mixing and fewer abnormal profiles. This is seen to correspond to a low occurrence of inflected vertical wind profiles.
4.1 The effect of using only four measurement heights
Evidently the probability that the vertical wind profile contains one or more local maxima increases with the number of measurement heights. In addition the varying height increment between measurements can cause differences in the occurrence of local maxima. The vertical wind profiles were therefore analyzed using only the heights z=(40, 60, 80, 100 m), which are approximately common for all sites except Skipheia. At Skipheia the closest replication of this was used, namely z=(25, 40, 70, 100 m). With four measurement heights the possible profile categories are 0, 1 and −1 inflection and reversed.
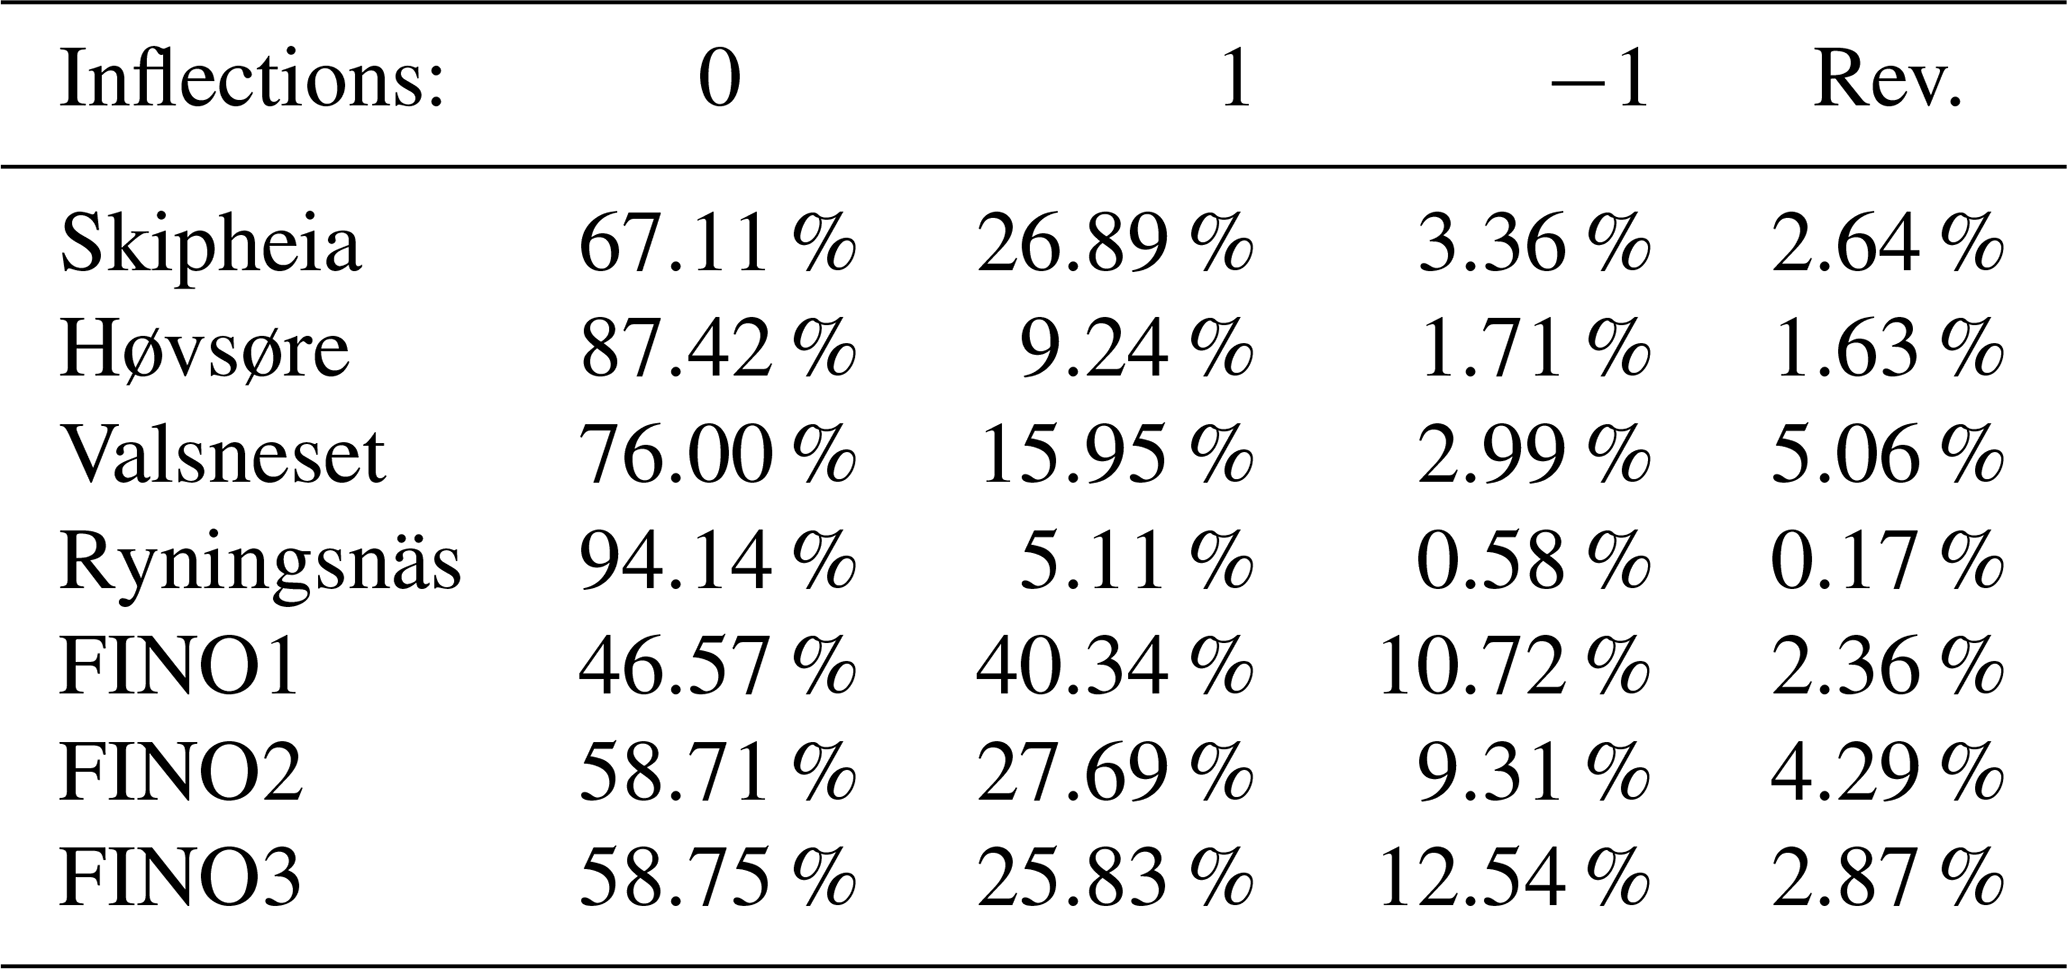
The results in Table 4 confirm that offshore sites experience a local maximum in the wind profile to a larger degree than onshore sites. Using only four heights results in an increase in the 0-inflection profile at all sites, but the differences between the sites remain the same, and similar conclusions on the abnormal profile occurrence can be drawn. Since the use of all measurement heights does not alter the main conclusions, all heights were used for the remainder of the study.
Table 4Local maxima result if all sites are restricted to only four measurement heights. At all sites except Skipheia, the common heights z=(40, 60, 80, 100 m) were used; at Skipheia, z=(25, 40, 70, 100 m) were used.
4.2 Height of local maximum
The height at which the wind profile deviates from its expected shape is essential when assessing the impact the inflected profiles have on a wind turbine. Local maxima at wind turbine hub heights were shown by Wagner et al. (2009) to significantly impact the power output due to the impact the negative shear has on the available energy across the rotor area. The inflections can however also have positive consequences, as Gutierrez et al. (2017) found the negative shear in the top half of a low-level jet to dampen motion, forces and moments acting on the turbine tower and nacelle.
4.2.1 Onshore sites
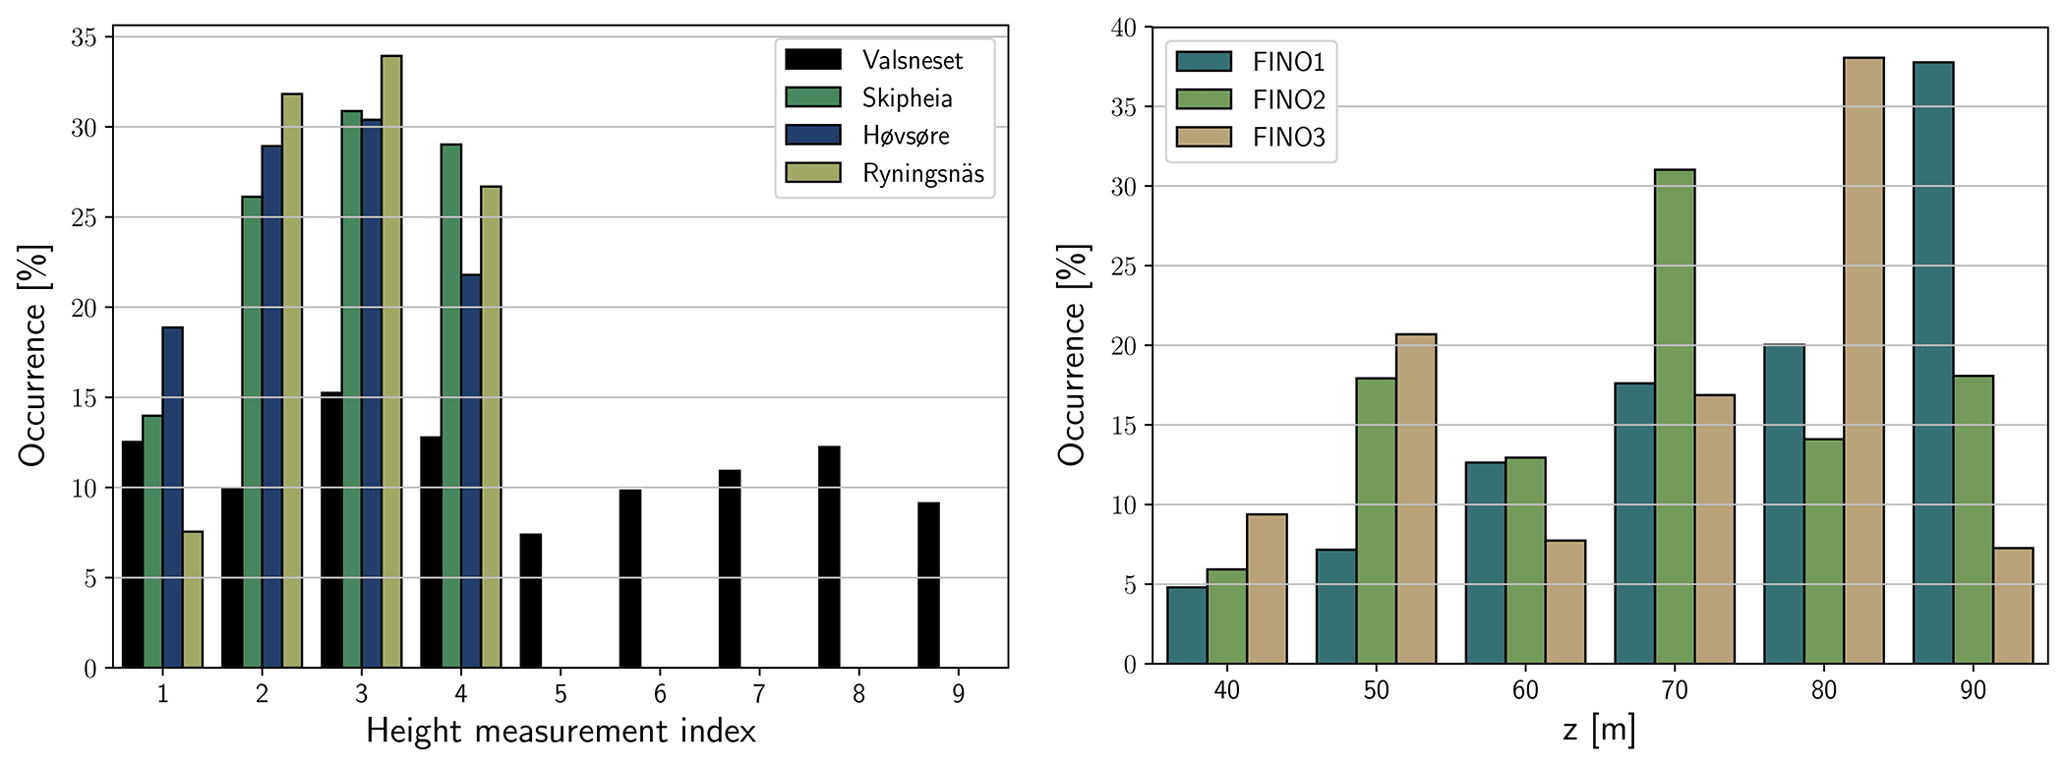
The left histogram in Fig. 6 shows the height occurrence of the local maximum at the onshore sites. Comparison of the onshore maximum heights is complicated due to the variation in the number of measurement heights and the difference in height increments and was therefore visualized as a function of the height index of the local maxima.
At all onshore sites except Valsneset the occurrence of an inflected profile is found to increase with the height of the inflection up to the second highest measurement height. From the second highest to the highest point, all these sites show a slight decrease in occurrence.
At the coastal site Valsneset the variation in local maxima occurrence stands out in comparison to the other sites. At the lower heights of z=(50, 60, 70, 80 m) the occurrence seems arbitrary and evenly distributed. After this the occurrence of local maxima decreases for z=90 m before showing the same monotonic increase in occurrence with height followed by a top height decrease as was found at the other onshore sites. The twofold variation found at Valsneset is not entirely clear, but it could be caused by a transition from the surface layer to the Ekman layer at an intermediate height, which may not be visible at the similar site Skipheia due to lower measuring heights. The aforementioned top height decrease is also visible at Valsneset but is not due to mast speedup since the measurements were performed by a lidar device. The cause of this result is not entirely clear but at the masted sites speedup effects can not be excluded as the cause.
4.2.2 Offshore sites
The right histogram in Fig. 6 shows the height of the local maximum at offshore sites for the 1-inflection case. The results show that inflections occur at all heights, but the percentage of occurrence at each height varies to a larger extent than onshore. At FINO1 this variation is however not present, and the occurrence is seen to consistently increase when the inflection occurs higher in the profiles. At FINO2 the profiles are most commonly inflected at the third highest inflection height z=70 m, and a slight general increase in occurrence with height is visible. The profiles at FINO3 show the largest variation and are found to be most commonly inflected at the second uppermost height z=80 m but least commonly inflected at the top height z=90 m.
The variation in inflection height occurrence at the offshore sites is partially explained through smaller height increments between measurements (Δz≈10 m). The occurrence at each height is however also found to be strongly coupled with the atmospheric stability at the time of profile inflection. This is discussed in Sect. 4.4.2 which addresses the changes in stability distribution when inflections occur at varying heights. The increased occurrence of local maxima at higher elevations should be a concern as these elevations are within common rotor-swept areas of modern turbines and can have a direct impact on the available energy in the wind.
4.3 Correlation to wind speed
It is of interest to describe the atmospheric conditions which cause abnormal vertical wind profile development. The wind speed is a vital part of the atmospheric conditions, as well as being the source of energy in wind turbine power generation.
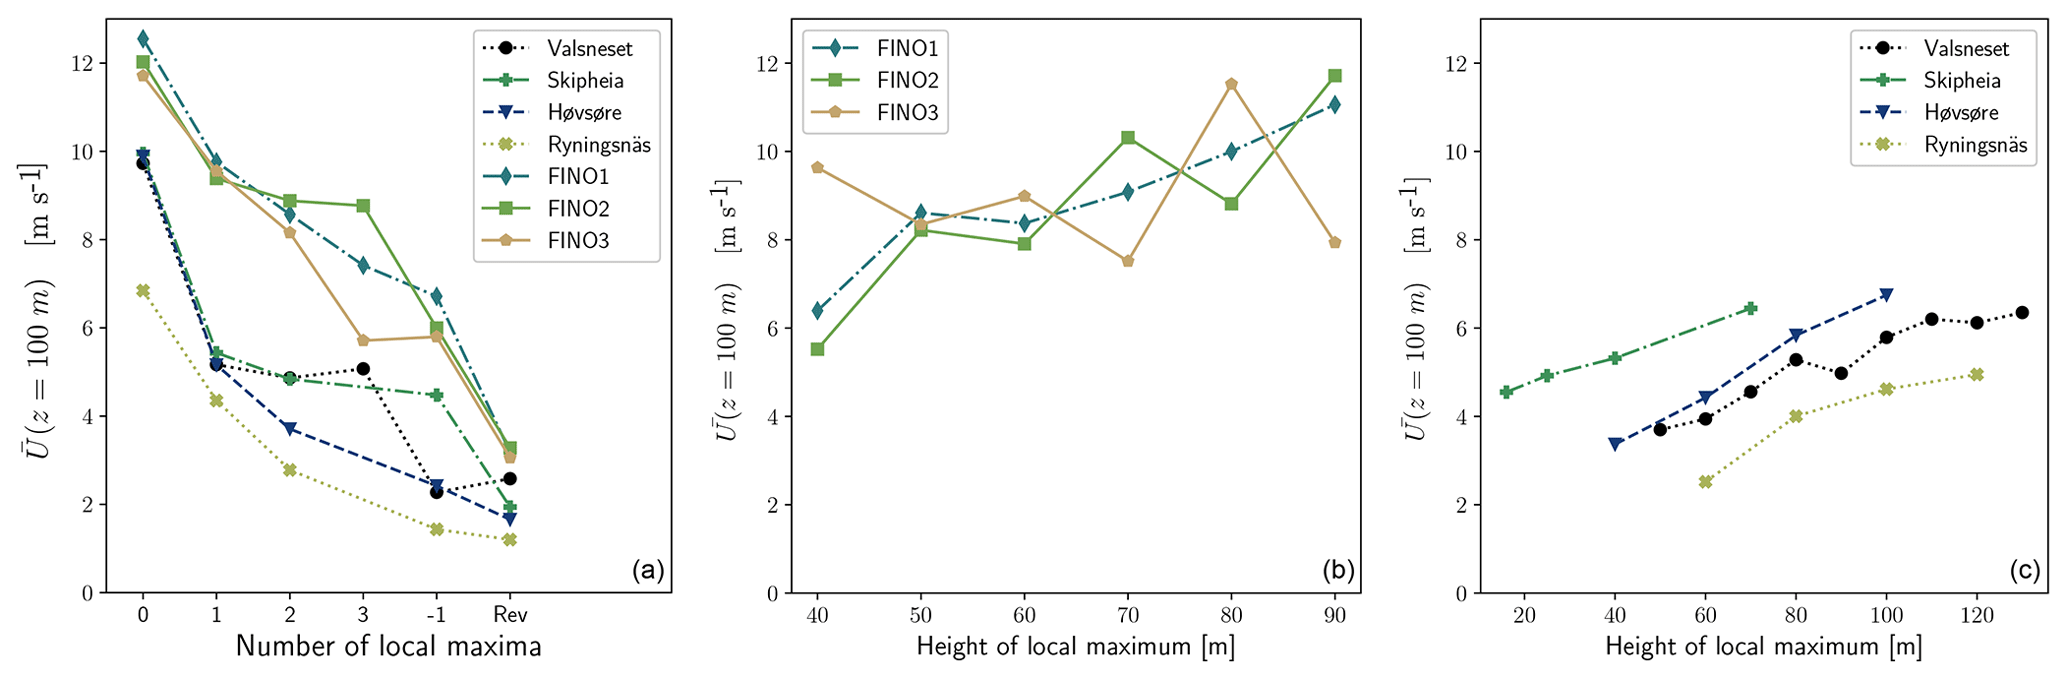
Figure 7(a) Mean wind speed at z=100 m of different profile categories. (b) Mean wind speed at z=100 m for offshore sites, with VWP maxima at different heights. (c) Mean wind speed at z=100 m for onshore sites with VWP maxima at different heights. Similar results were found when using the lowest wind speed measurement height at each site.
4.3.1 Wind speed relationship to profile categories
Figure 7a shows that the mean wind speed is decreasing with an increasing number of local maxima in the vertical wind profile and at its lowest during instances of a reversed profile or a −1-inflection profile. Such profiles are however rare instances which only comprise a few percent of the profile cases, and their low wind speeds make them even less relevant for wind energy applications. In the remaining profile categories, the mean wind speed is well above a typical cut-in speed of 4–5 m s−1 for the offshore sites, making them relevant in wind energy extraction (Cooney et al., 2017). At the coastal sites Skipheia and Valsneset the mean wind speed of the abnormal profiles lies in the approximate region of typical cut-in wind speeds. At the semi-coastal site Høvsøre and the inland forested site Ryningsnäs the mean wind speed in the abnormal profiles is however seen to decrease to below typical cut-in speeds. A further analysis showed that the range of wind speeds associated with a profile category only changes slightly from the 0 inflection to the 1-inflection profiles, and at the offshore sites it only changes slightly from the 1-inflection to the 2-inflection category. This means that the decrease in mean wind speed is predominantly due to the peak in distribution being shifted to lower velocities. Therefore, although many of the abnormalities at the onshore site occur below cut-in wind speeds, there are still instances where these inflections are relevant for wind energy extraction. At the offshore and coastal sites the mean wind speed is higher and most of the inflected profiles will have an impact on the available energy. It is also worthwhile to consider that when Lange et al. (2004) studied the effect of erroneous offshore vertical wind extrapolation methods on the error in predicted power output at a hub height of z=50 m the errors were largest at wind speeds between 5 and 9 m s−1. Therefore, even if an inflected profile has a wind speed only slightly above cut-in wind speed, it is still relevant for wind engineering purposes.
4.3.2 Wind speed relationship to maxima at different heights
The wind speed at z=100 m as a function of inflection height is also shown in Fig. 7. At the onshore sites (Fig. 7c) a maximum at a higher altitude is seen to correspond with higher wind speeds, with all sites exhibiting a somewhat consistent increase in mean velocity with inflection height. At the offshore sites (Fig. 7b) the results shows an increase in wind speed with height; there is however larger variation between the heights. The variation is especially prominent at FINO3 and slightly prominent at FINO2. The variation was found to be partially but not entirely caused by the smaller height increment of Δz≈10 m at the FINO sites. The complete picture of why this is occurring is strongly coupled to atmospheric stability and specifically the higher degree of very unstable inflections found at the offshore FINO sites. The inflections during very unstable conditions show significantly larger variation in the magnitude of the mean wind speed profile with a changing maximum height, which can be seen at FINO3 (the site with the largest variation) by the order from left to right of the profiles in the top right plot of Fig. 10 versus the bottom right plot of Fig. 10.

Figure 8Stability distribution of profile categories at the five sites which had measurements enabling this analysis. Full indicates the entire data set with no abnormal profile categorization.
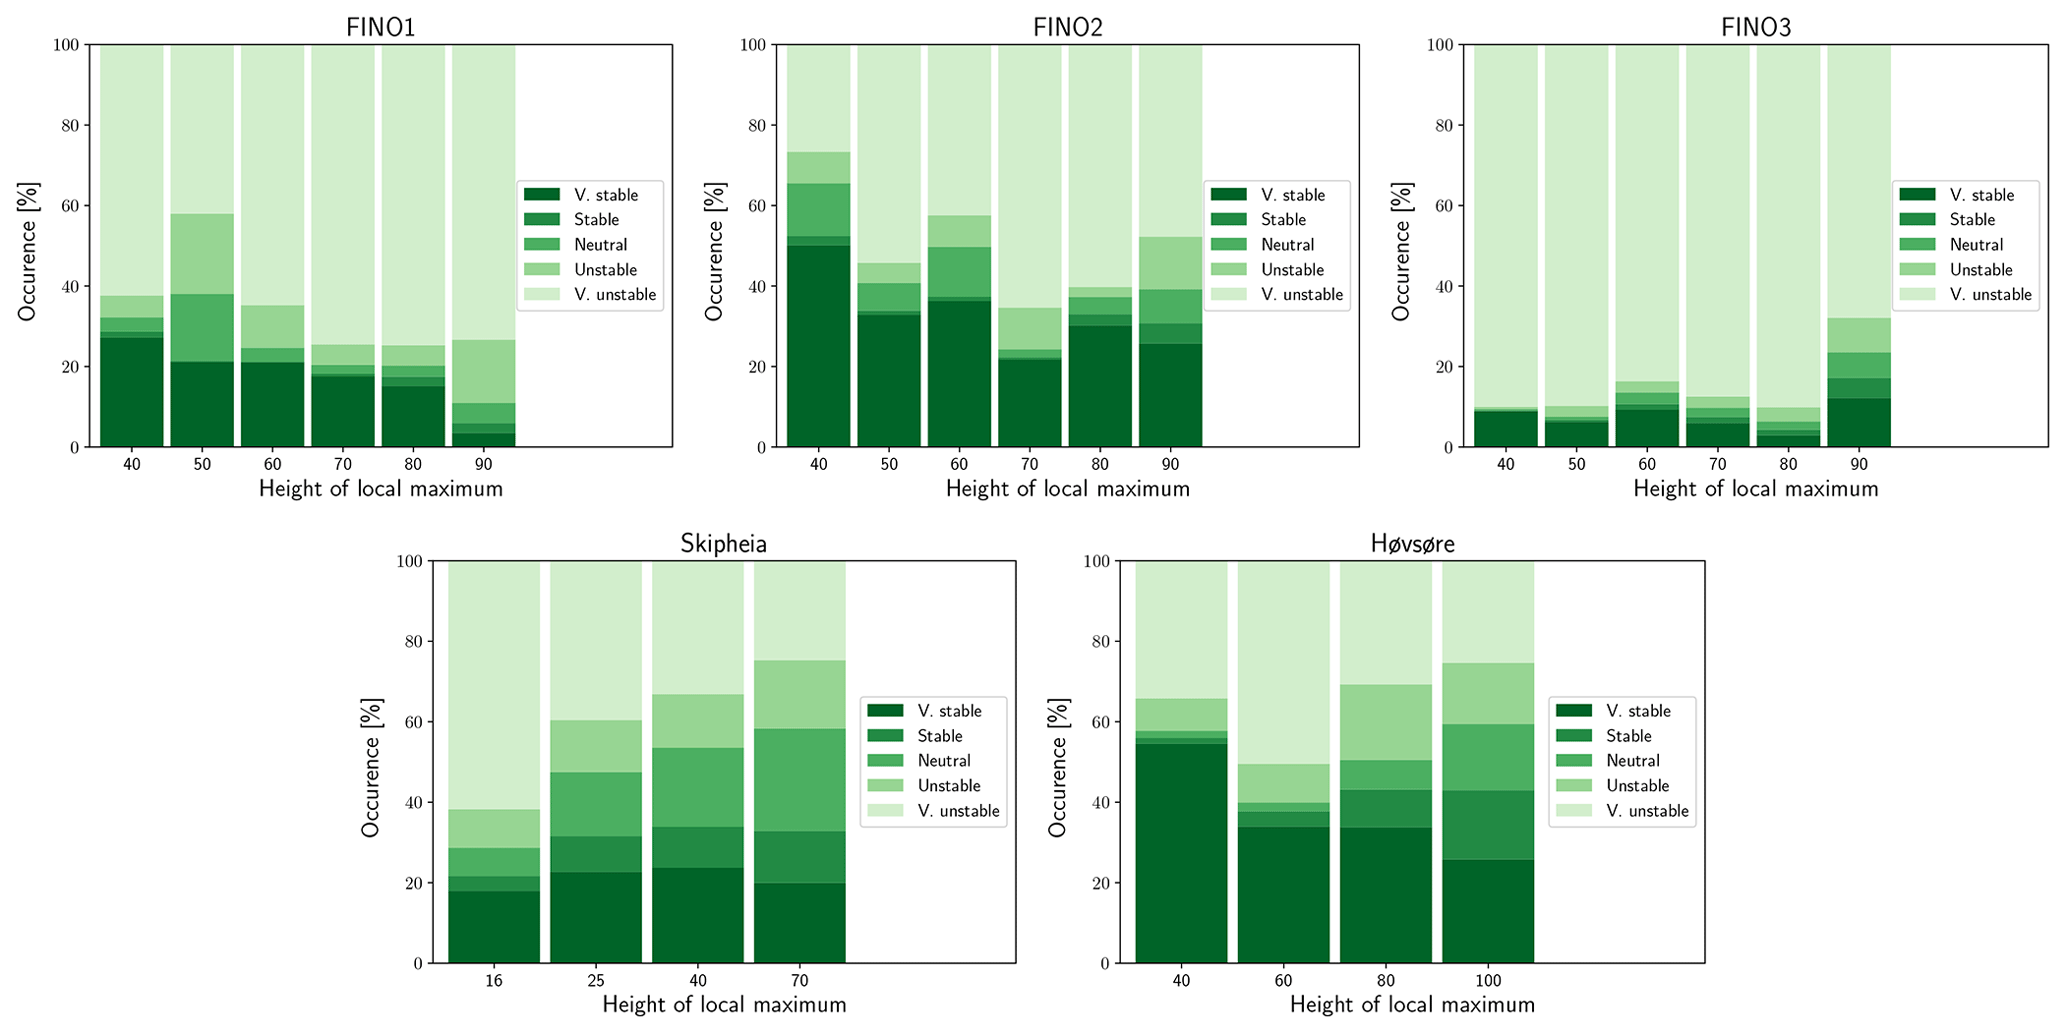
Figure 9Stability distribution of 1-inflection profiles with varying height of inflection at the five sites which had measurements enabling this analysis.
The general increase in velocity with maximum height may not have been expected if the inflections are assumed to be coupled with a boundary layer discontinuity which scales inversely with velocity. The surface-layer depth is however mainly decided by the thermal sate of the atmosphere, i.e., the atmospheric stability, which is inherently coupled to the wind speed (Stull, 2017). As wind speeds increase, the atmosphere is known to transition towards a neutral atmosphere where the surface-layer height increases in comparison to stable conditions. The importance of this result therefore lies mainly in communicating that higher-altitude inflections could be a large concern for wind energy purposes since they occur at higher wind speeds and may therefore be coupled with stronger load and energy variations.
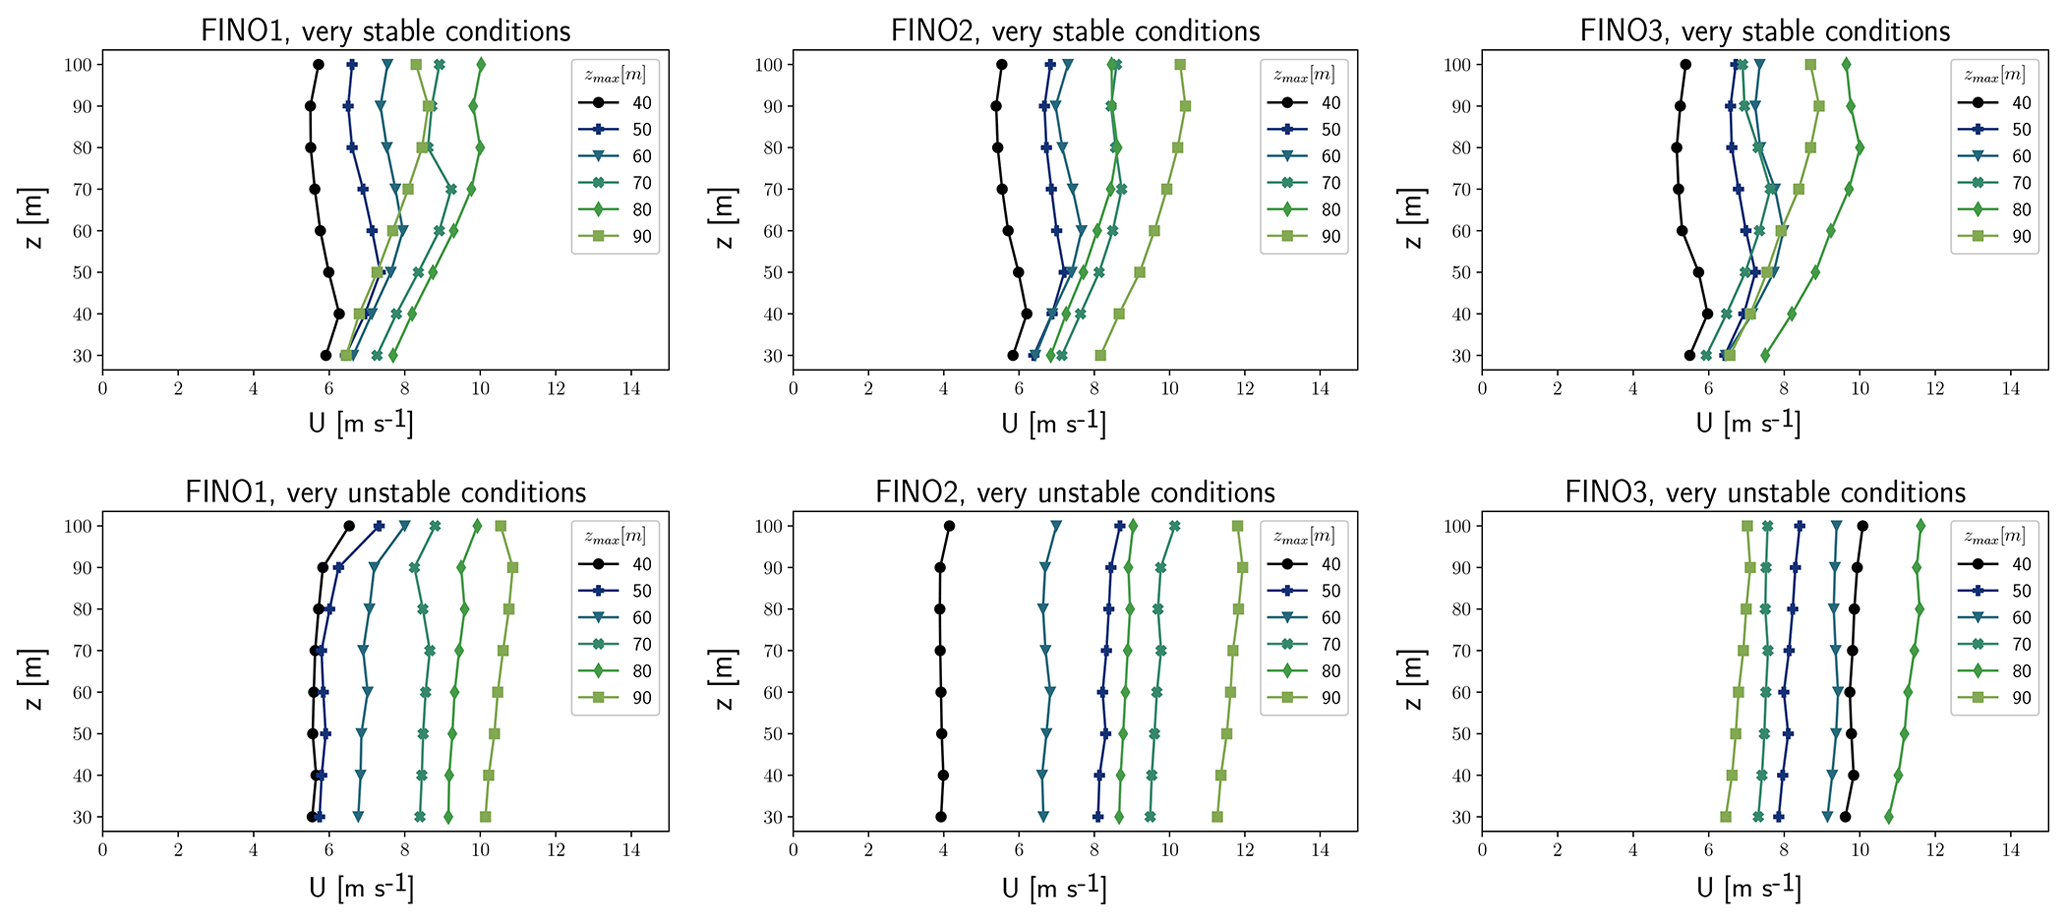
Figure 10Mean 1-inflection velocity profiles at FINO1, FINO2 and FINO3 with the maximum at different heights, during very stable and very unstable atmospheric stability. The neutral-stability condition is not shown due to a low occurrence.
4.4 Correlation to stability
Atmospheric stability describes the vertical forces exerted on the parcels in the atmosphere due to temperature differences. Put simply, during stable conditions the surface is generally cooler than the air, and the buoyant forces prevent vertical motion. During unstable conditions the ground is generally warmer than the air, parcels rise and stronger turbulent mixing is observed. Neutral conditions entail a thermal equilibrium where parcels experience no vertical buoyant forces.
In this study the stability analysis was performed using a Richardson number formulation and was not carried out at the sites Valsneset and Ryningsnäs due to lack of measurements. The forthcoming sections are therefore focused on the remaining sites, where FINO1, FINO2 and FINO3 are located offshore, Skipheia is coastal and Høvsøre is onshore/semi-coastal. The employed method used in the stability analysis is discussed in Sect. 3.3.
4.4.1 Stability distribution of abnormal profile categories
During the presence of a local maximum in the VWP, all sites show an increasing occurrence of very unstable atmospheric conditions categorized by more vigorous turbulent mixing (Fig. 8). This increase grows with the number of inflections, meaning that 2-inflection profiles have a higher occurrence of very unstable conditions than the 1-inflection profiles. This is likely linked to the flat profiles caused by this mixing state, since the inflections need less “disturbance” or severity during very unstable conditions in order to cause a maximum in an already flat development. The two onshore sites Høvsøre and Skipheia in addition show an increase in very stable conditions where turbulence is suppressed, during the presence of one or more local maxima. These increases are seen to lead to a decrease in neutral conditions, which aligns with the decreasing wind speed for inflected profiles seen in Fig. 7a since neutral conditions are more common at higher wind speeds. The 0-inflection category unsurprisingly shows an opposite change in atmospheric conditions to that of the inflected profiles.
The reversed and −1-inflection profile categories can be seen to occur more commonly during very stable conditions at all sites. The results suggest this is due to the higher occurrence of very stable conditions at the low wind speeds under which these profile categories occur.
4.4.2 Stability distribution with increasing maximum height
The atmospheric stability distribution for the 1-inflection profiles with a varying maximum height is shown in Fig. 9. Considering the offshore sites FINO1 and FINO2 first, the occurrence of a very stable atmosphere is higher when the maximum occurs at a lower altitude (≈30 % and ≈50 % respectively). However when a maximum occurs at a higher altitude the occurrence of stable conditions is lower and instead very unstable conditions become increasingly dominant. At FINO1 this decrease is present at all heights, whereas at FINO2 the occurrence of very stable conditions increases again for z=80 and z=90 m, and there is also a slight increase in very stable conditions at FINO3 when inflections occur at z=90 m. Shallow surface layers and internal boundary layers are usually coupled with very stable atmospheric conditions due to the negative buoyancy forces. The higher occurrence of very stable conditions during low-altitude inflections could therefore indicate that these inflections offshore are caused by a stable internal boundary layer formation, which is often coupled with a capping inversion where larger-than-expected wind speed gradients may be found (Lange et al., 2004). The results of Argyle and Watson (2014) suggested an IBL formation with a height of around z=50 m at FINO1 and FINO3. The higher occurrence of inflections during very stable conditions at lower altitudes supports the possibility of such an inversion.
The results at FINO3 differ from the two other offshore sites. At FINO3 the atmosphere is predominantly very unstable regardless of inflection height (top right plot, Fig. 9). Although the predominance of very unstable conditions of FINO3 was also found by Argyle and Watson (2014), those results also indicated a higher occurrence of a stable atmosphere when using temperature measurements at higher elevations. The upper temperature measurement at FINO3 (z=95 m) was however unavailable in this study. The high sensitivity of the height occurrence to the atmospheric stability could therefore indicate that the FINO3 stability distribution depicts too large percentages of very unstable conditions and too low percentages of very stable conditions.
Onshore (Skipheia and Høvsøre) there is an increase in neutral, slightly stable and slightly unstable conditions as the inflection rises. Onshore the atmosphere is predominantly neutral when strong winds are present, sometimes stable or unstable but rarely very stable or unstable. Recalling that the wind speed at z=100 m increases with inflection height, the increase in neutral, slightly stable and slightly unstable conditions at higher inflection heights simply reflects the stability distribution associated with the wind speeds at which they occur.
The Høvsøre results additionally indicate that stable conditions cause inflections at lower altitudes, similar to the results found offshore. If analyzing the height at which inflections occur during very stable conditions, the lowest height z=40 m is the most common, and the occurrence is found to monotonically decrease up to the highest inflection altitude of z=100 m. This could indicate a shallow surface layer during very stable conditions at Høvsøre and possibly be a part of the explanation for the progressive deviations in wind speed above 50–80 m found at the Høvsøre site (Gryning et al., 2007).
4.4.3 The effect of stability on profile shapes
The impact inflections have on the difference between expected and actual rotor-equivalent wind speed was assessed through studying the 1-inflection profile shapes with varying maximum height and atmospheric stability.
During neutral, stable and very stable conditions the inflections are found to have a more pronounced effect on the development of the vertical wind profile than during unstable or very unstable conditions (Figs. 10 and 11). Offshore, the very stably inflected profiles exhibit a decrease in wind speed over several measurement heights above the maxima before the velocity profile reinstates a positive shear. When one additionally considers that MOST predicts the largest wind speed gradients during very stable conditions, the very stable inflections evidently cause larger deviations from their predicted shape.
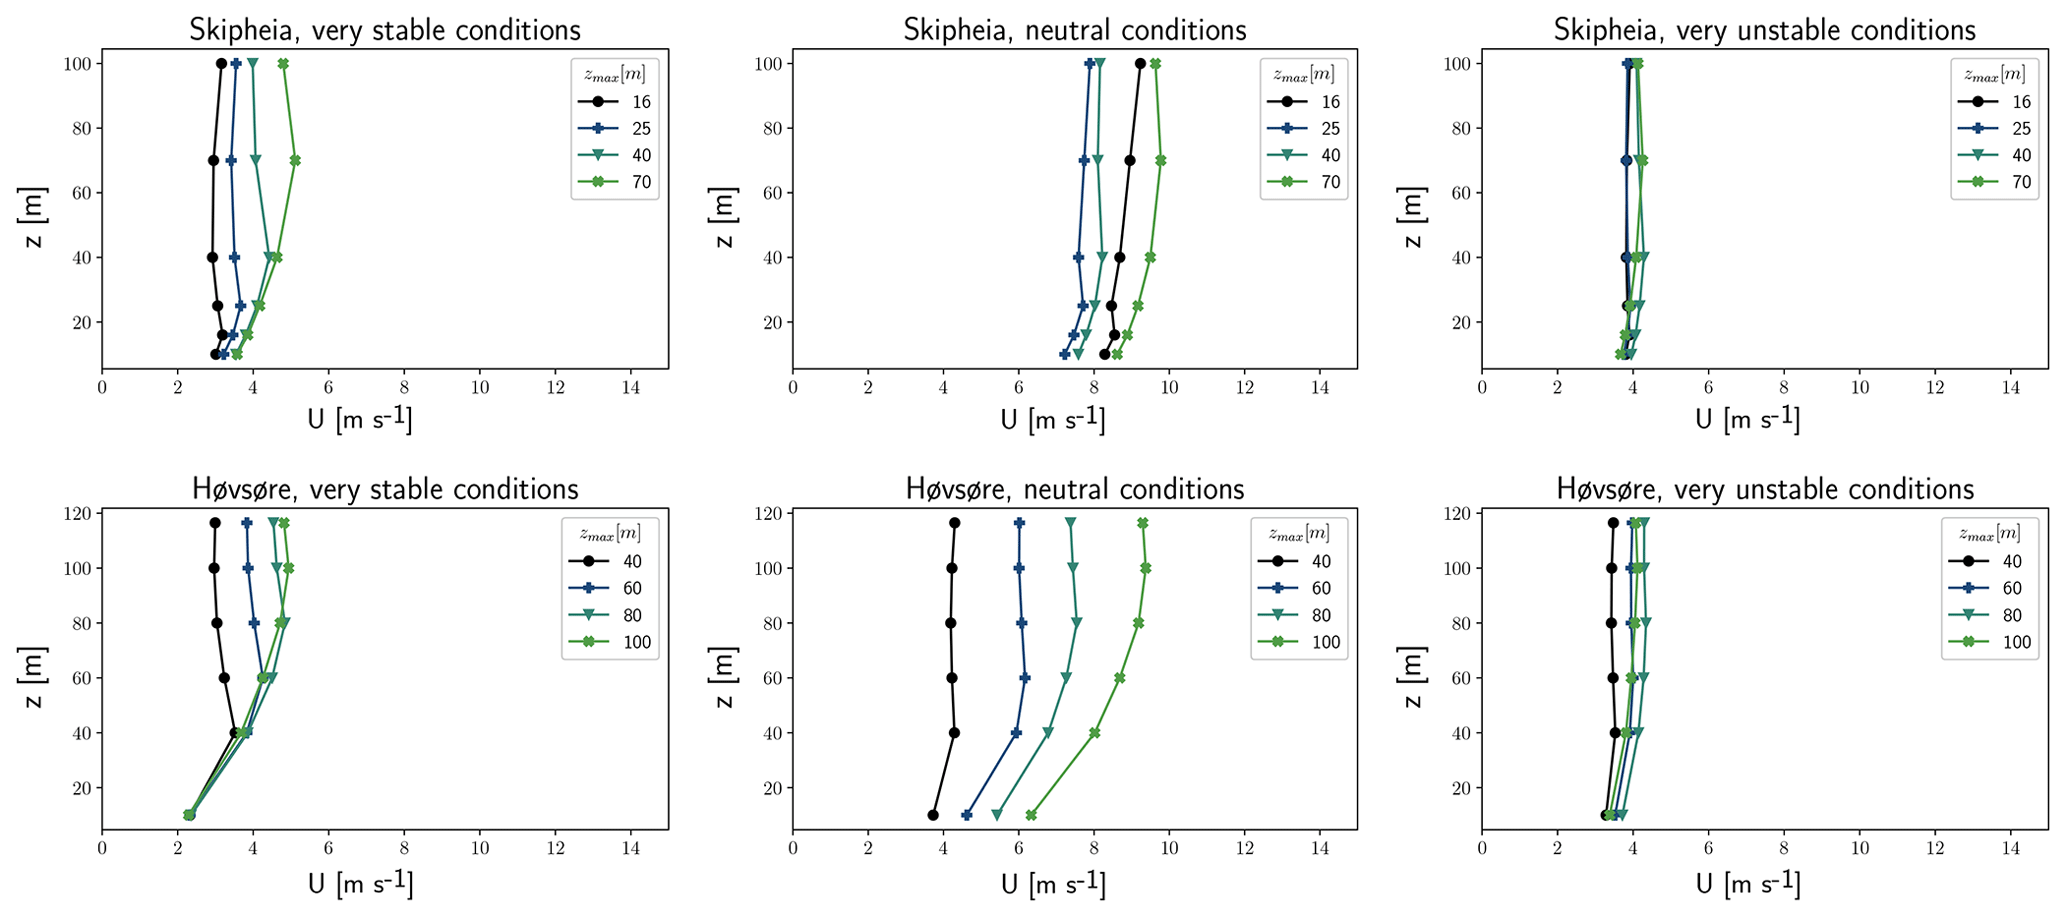
Figure 11Mean velocity profiles at Skipheia and Høvsøre with maximum at different heights, during very stable, neutral and very unstable atmospheric stability.
Very unstable conditions are contrary to the very stable profiles typically associated with low wind shear and a more uniform velocity profile both onshore and offshore, which is also reflected in the profile shapes seen in Figs. 10 and 11. Although profile inflections are not possible within the scope of MOST, a large number of these inflections are too small to be a likely cause of large deviations between the predicted and actual wind profile shape. Previous studies confirm that MOST is satisfactory in predicting the vertical wind profile during unstable conditions (Argyle and Watson, 2014). It is however seen that some of the offshore 1-inflection profiles, especially at FINO1 and slightly at FINO2, show signs of a speedup effect at the uppermost height. The most likely cause of this is thought to be the systematic speedup effects which have been shown to be present at FINO1. This explanation is assisted by recalling that FINO3 is equipped differently and thus shows fewer signs of speedup effects.
Onshore at Skipheia and Høvsøre the neutral profiles (middle plots, Fig. 11) may be of larger concern than the very stably inflected profiles, since they occur more commonly and at higher mean wind speeds. The same can be said of the stable profiles, whereas the unstable and very unstable profiles with inflections have low shear and small inflections and occur at low wind speeds, making them less relevant.
The number of inflected profiles which may have a significant impact on the power production deficit was analyzed by considering profiles with a mean wind speed at 100 m above 5 m s−1, replicating a conservative cut-in wind speed at the turbine hub height. Assuming neutral, stable and very stable conditions to have the more severely inflected profiles, the following correlations are found: 16.8 % of profiles are inflected under these conditions at FINO2, 10.0 % at FINO1 and 3.7 % at FINO3. Performing the same analysis at the coastal site Skipheia and the semi-coastal site Høvsøre, 10.43 % of the inflected profiles at Skipheia fall within this category, and this sinks to 3.6 % at Høvsøre. Offshore, such profiles predominantly occur under very stable stratification. The coastal inflections are however more of a concern under weakly stable and near-neutral conditions.
The previous studies by Peña et al. (2008) and Sathe et al. (2012) both found that MO theory overpredicted the offshore wind speed at higher elevations during stable conditions, which could be a result of the decreasing velocity found for several heights above the inflection point during stable conditions in the present study. Lange et al. (2004) found an overprediction by MO theory at z=50 m. This could however be due to the height z=50 m being within a stable capping inversion which has higher wind speeds and could in fact be a maximum in the vertical wind profile.
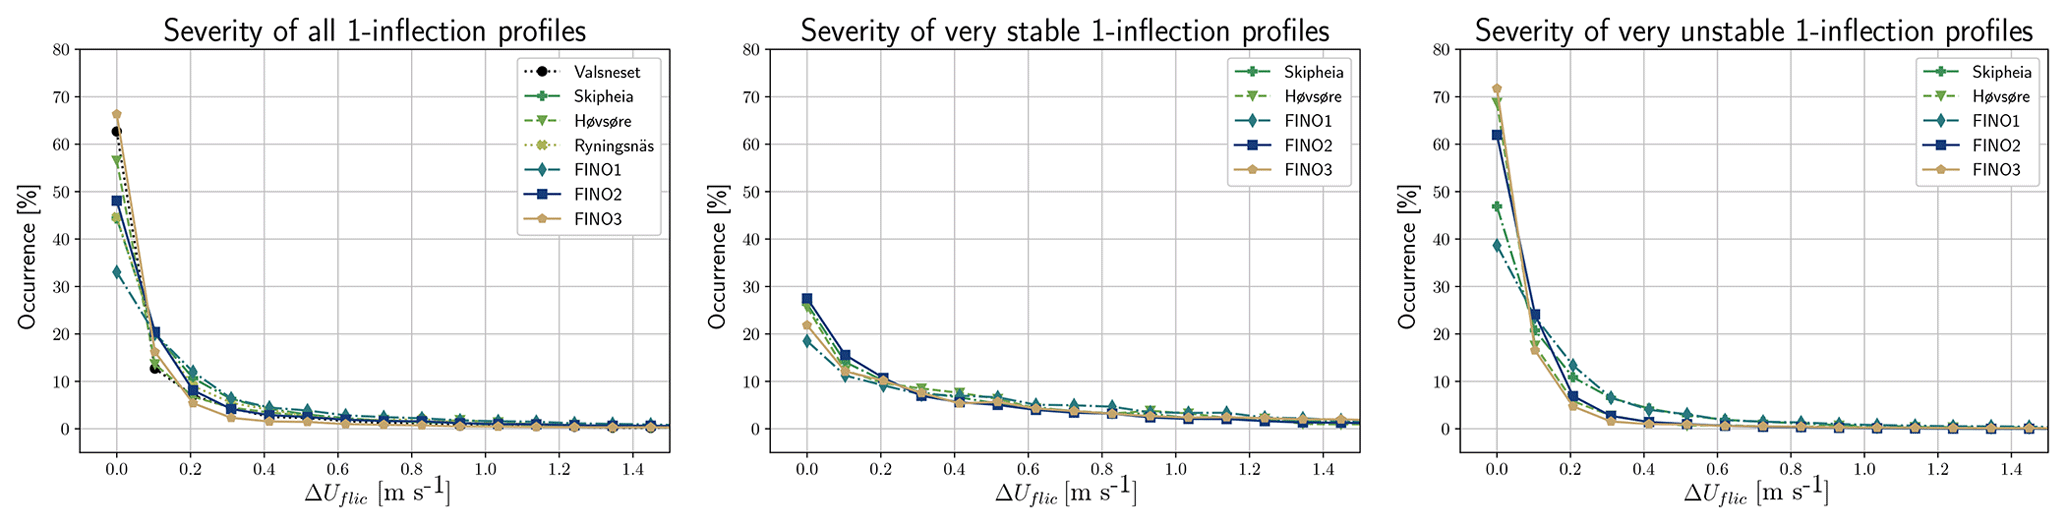
4.5 Inflection severity
The inflection severity was analyzed in order to support the findings of the profile shapes presented in Sect. 4.4.3. The severity of an inflection was defined as the difference between the wind speed at the point of the maximum and the wind speed at the point where the velocity profile retains its positive shear above the inflection (; m s−1). The results shown in Fig. 12 reveal that ΔUflic is typically small during unstable conditions which matches the flat velocity profiles described in Sect. 4.4.3. This may indicate that the very unstable inflections are to a larger degree caused by small arbitrary variations in the vertical wind speed which are possibly due to turbulent fluctuations. The very stable 1-inflection profiles are contrarily seen to have a much larger inflection severity at all sites, again showing that the very stable inflections are more critical in wind energy applications. By assuming an inflection is severe if ΔUflic>0.5, the results show that, depending on the site, 9 %–25 % of all 1-inflection profiles are categorized as severe. For the very unstable 1-inflection profiles only 3 %–14 % of profiles are severe and for very stable 1-inflection profiles as many as 35 %–48 % of the inflected profiles are severely inflected. Although slight variations between sites are found, the results clearly illustrate that once an inflected profile has been identified, the likelihood of a severe inflection is much higher during stable conditions.
4.6 Wind direction of inflected profiles
4.6.1 Offshore direction analysis
The wind rose for the very stable and very unstable 1-inflection profiles is shown in Fig. 13. The neutral case was not shown for the offshore sites due to few occurrences.
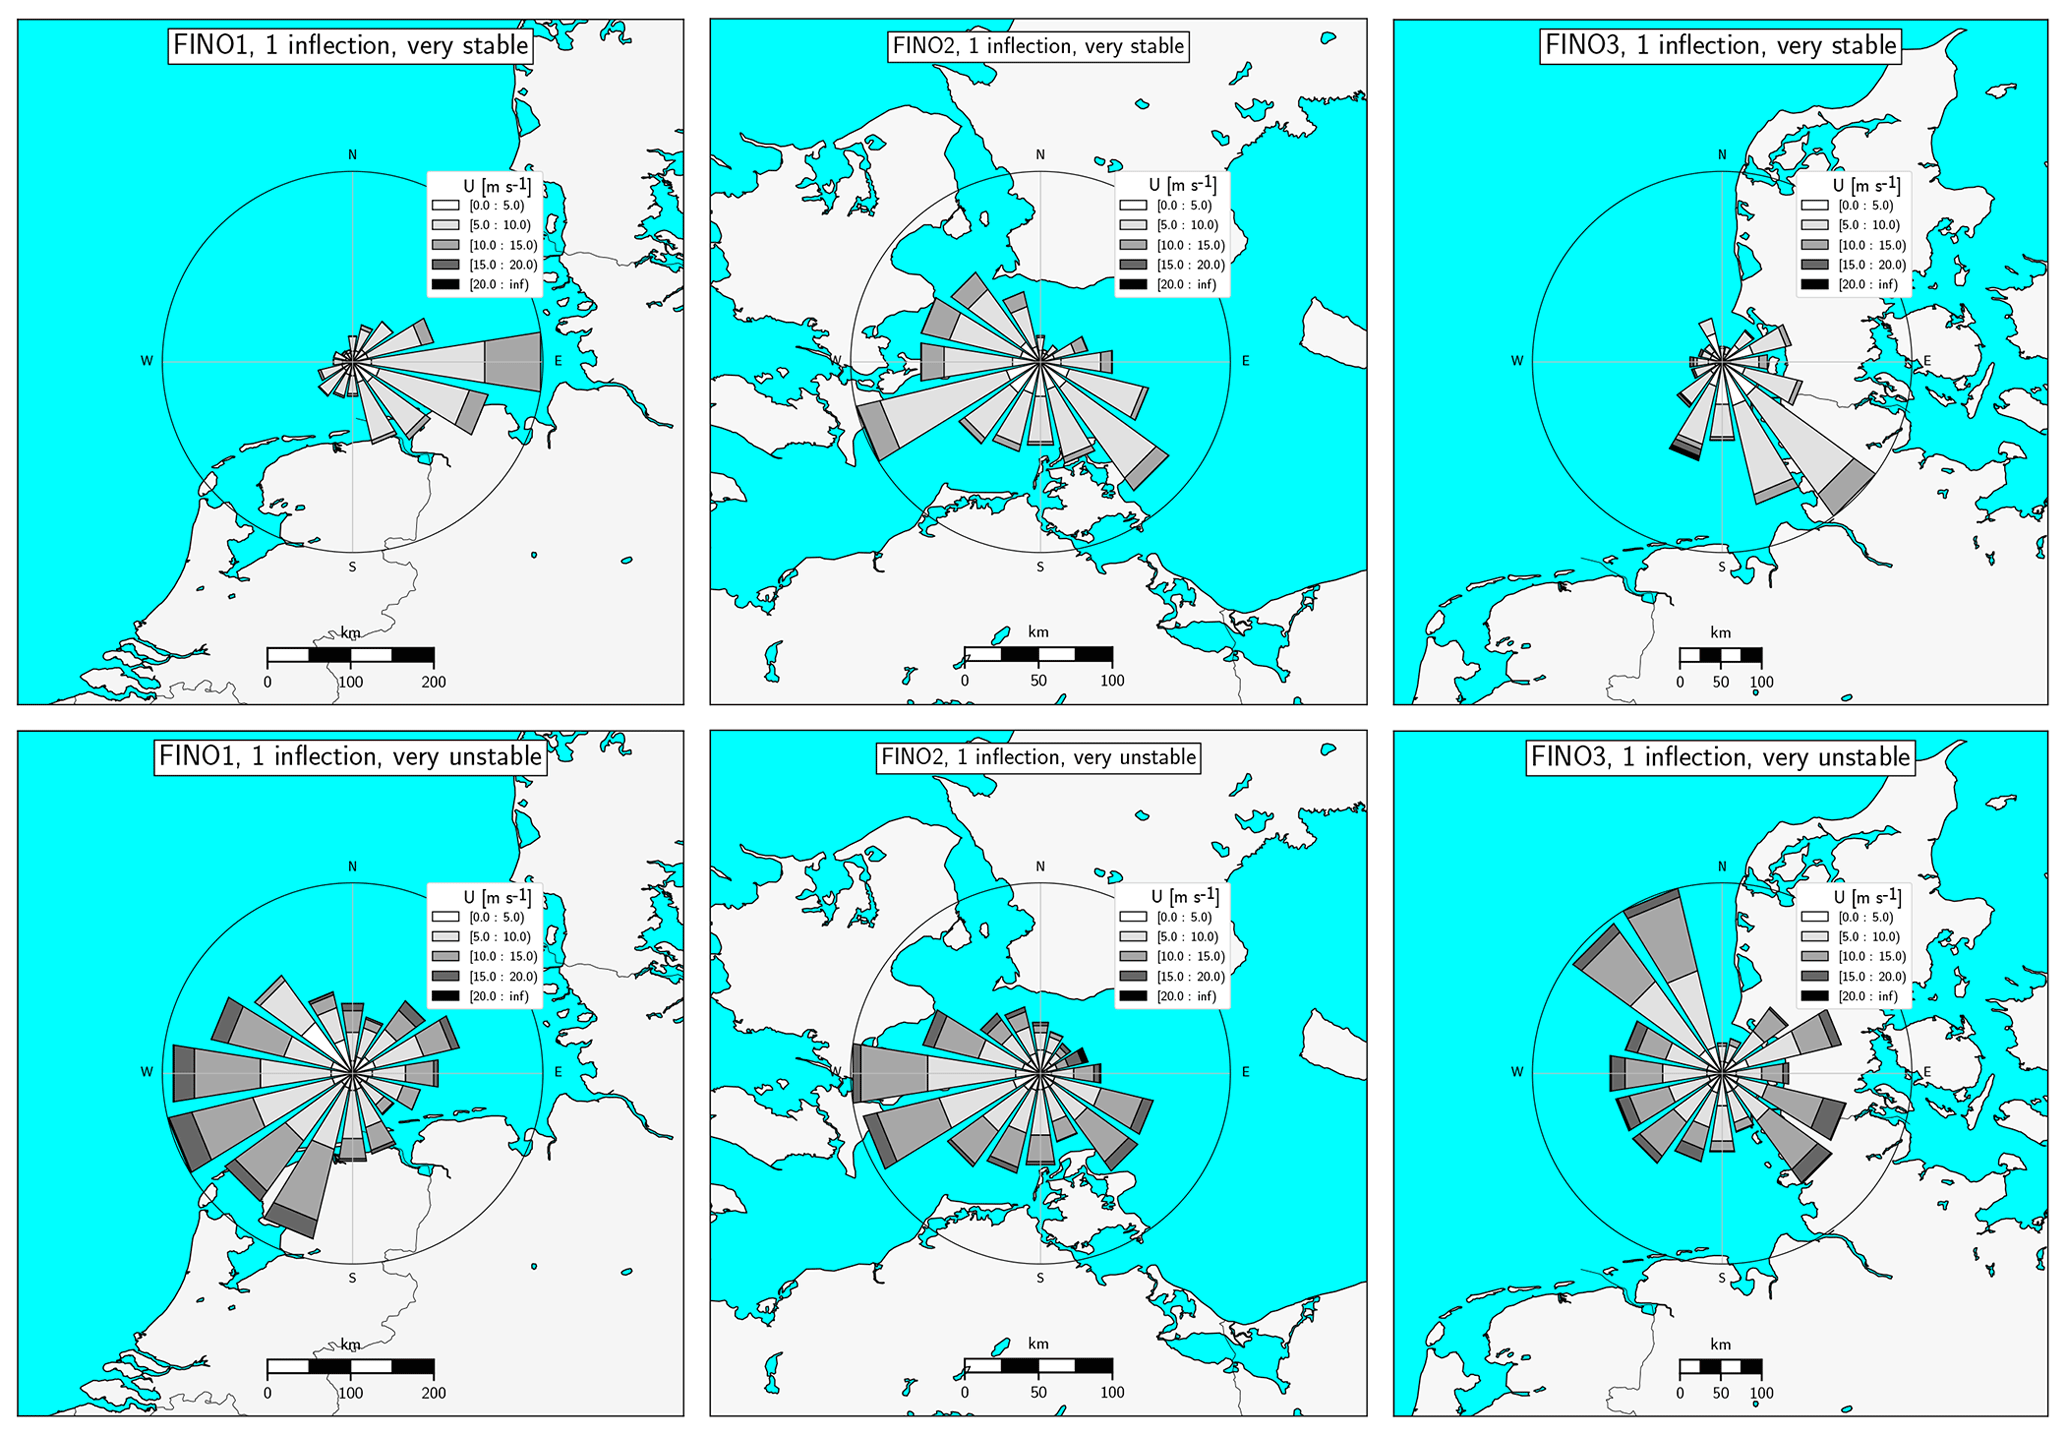
Figure 13Wind direction of very stable and very unstable 1-inflection profiles at offshore sites. The wind roses are centered on the site location.
At both FINO1 and FINO3 the inflected profiles during very stable conditions arrive from a sector of shorter fetch which was found to have a high occurrence of very stable winds at the respective sites. During very unstable conditions the inflected profiles arrive mostly from directional sectors with long fetch distances and the atmosphere is predominantly very unstable in these sectors. This result strongly indicates that the inflections during very stable conditions are occurring due to coastal effects and possibly a stable capping inversion.
At FINO2 the very unstable and very stable 1-inflection profiles do not show distinct sectors of higher occurrence. The atmospheric stability occurrence is more evenly distributed at FINO2, which causes a more even directional spread of both the very stable and very unstable inflections. The FINO2 site is located in the Baltic Sea and is more uniformly engulfed by land than FINO1 and FINO3.
4.6.2 Onshore direction analysis
The directional distribution of the 1-inflection profiles categorized during very stable, neutral and very unstable conditions at the onshore sites Skipheia and Høvsøre can be seen in Fig. 14.
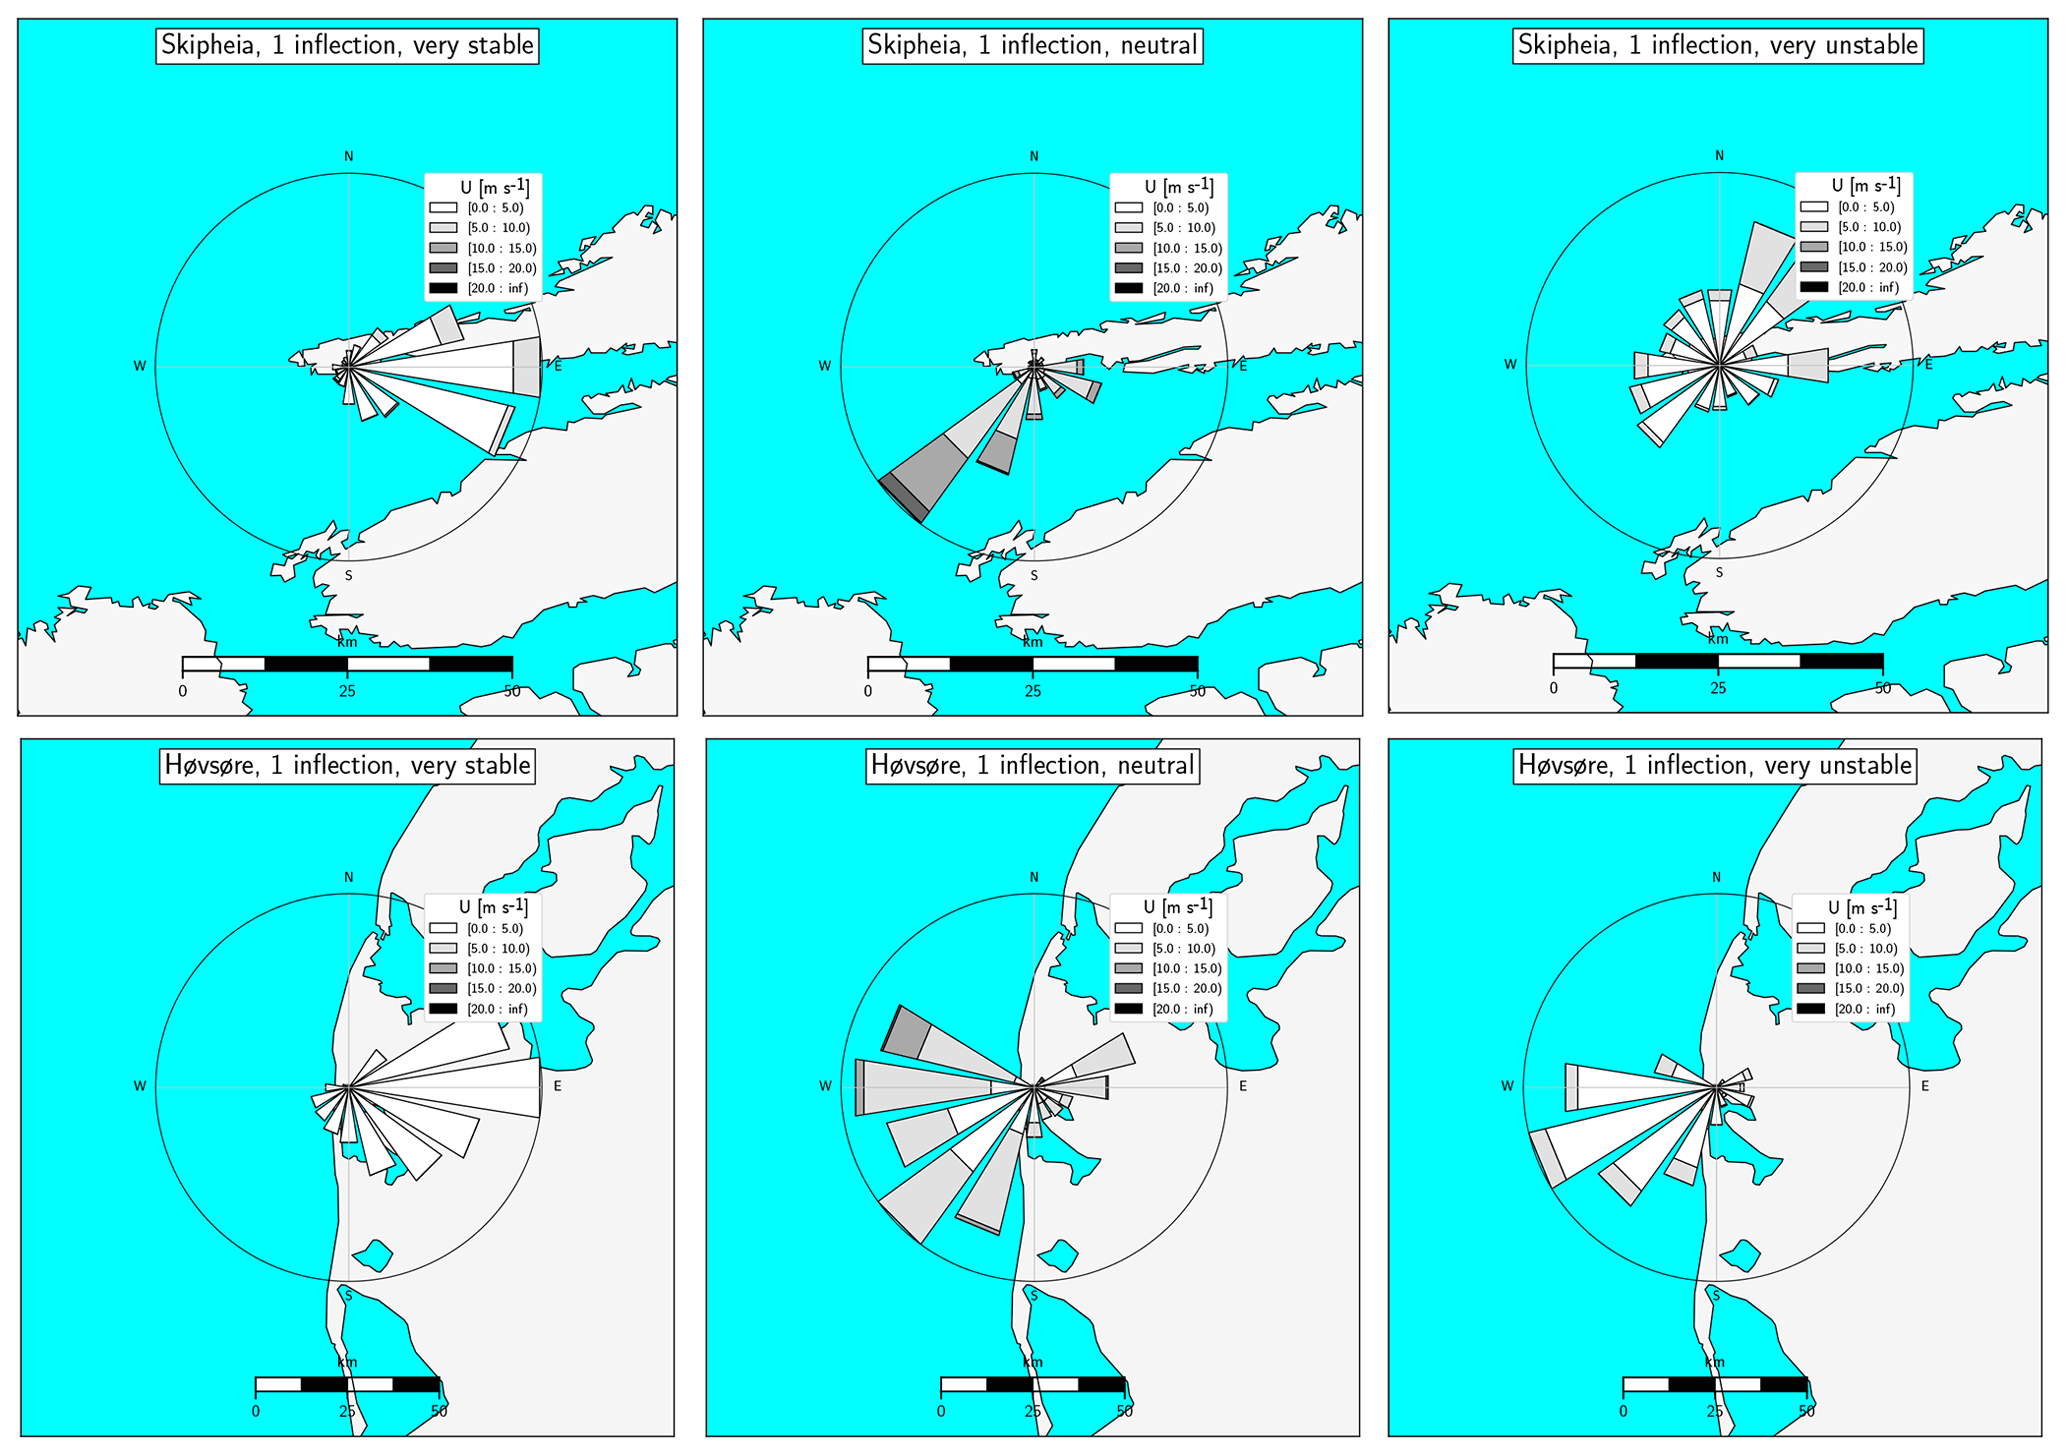
Figure 14Wind direction of very stable, neutral and very unstable 1-inflection profiles at onshore sites. The wind roses are centered on the site location.
Both the coastal site Skipheia and the semi-coastal site Høvsøre show a stability dependency on the direction of incoming 1-inflection profiles. At both sites, the directions which are dominant during very stable, stable and very unstable conditions are sectors at each site where these conditions dominate. At both sites this results in very stable inflections arriving from onshore, whereas neutral and very unstable inflections are arriving from directions of short fetch and offshore incoming flow. The neutral inflections occur at the highest wind speeds and are seen to arrive from offshore at both sites. These inflections may be related to shallow surface layers arriving from the sea.
The occurrence of abnormal vertical wind profiles has been investigated to survey the applicability of Monin–Obukhov similarity theory in short-term time-averaged vertical wind profiles. Measurements of the 10 min averaged wind profile have been analyzed at seven sites up to a height of 100–140 m depending on the site, where three of these are located offshore, two in coastal locations, one in a semi-coastal location and one inland surrounded by forest. At most sites 35 years of data were available, enabling a thorough comparison of how the occurrence of abnormalities changes with site location. The measured vertical wind profiles have been categorized in terms of the number of exhibited local maxima which are not possible within Monin–Obukhov similarity theory. With this identification method, the expected profile through MOST is the monotonically increasing profile with 0 inflections.
The results reveal that abnormal profiles are most common offshore, where data from the offshore masts FINO1 and FINO3 in the North Sea and FINO2 in the Baltic Sea reveal that inflected profiles occur in 65 %–75 % of all analyzed 10 min averages. The occurrence of abnormal profiles decreases as the roughness length increases. At the two onshore sites Valsneset and Skipheia in immediate vicinity of the Norwegian coast inflections are present in roughly 40 % of the profiles. This percentage decreases to 16 % only 1.7 km inland at the Danish site Høvsøre and is at its lowest occurrence of 12 % at the inland Swedish forested location Ryningsnäs. The abnormal profiles were mainly in the form of one or two local maxima. Profiles with more than two local maxima and cases with a reversed and monotonically decreasing profile were also identified, but these are rare events with less relevance in wind energy applications. They do however depict the limitations to MO theory in describing the range of occurring profile shapes.
The occurrence of abnormalities showed a strong correlation to wind speed and the thermal state of the atmosphere. Profiles with multiple inflections generally have a lower velocity. The spectrum of wind speeds where these profiles occur is however large, and many 1- and 2-inflection profiles occur at wind speeds relevant for wind energy applications. This is especially true at the offshore and coastal sites where the wind speed is generally higher.
Profiles inflected during positively buoyant, very unstable conditions, i.e., when there is strong turbulent mixing and low wind speed gradients, comprise the majority of abnormal profiles both onshore and offshore. The profiles inflected during conditions of neutral and negative buoyancy, i.e., neutral to very stable conditions, are less common, but due to their larger shear these profiles are proposed to be the source of the largest deviations between the predicted and measured wind speeds. The results indicate this issue is most severe offshore in the Baltic Sea, where these inflections occur at turbine operating wind speeds in 16.8 % of all profiles at FINO2 and provide a viable explanation for why previous studies have found that MOST incorrectly predicts the vertical wind profile during stable conditions offshore (Sathe et al., 2012). While the Baltic Sea is a basin largely enclosed by land, vertical wind profiles severely inflected during very stable conditions were also found at FINO1 and FINO3 located 45km and 80 km offshore in the North Sea, and the wind direction of these profiles indicates an offshore internal boundary layer which may travel distances of more than 100 km and still have large impacts on the vertical wind profile. At the coastal sites severe inflections are mainly linked with winds arriving from the sea during neutral conditions, with the coastal site Skipheia exhibiting neutral or stable inflections above cut-in wind speed in 10.4 % of all profiles. The occurrence of these profiles decreases rapidly further inland and is likely not visible more than a few kilometers onshore.
The results of this study do suggest an evident need of a more fulfilling vertical wind profile description, especially at coastal and offshore locations where high wind speeds and severe inflections occur simultaneously. A solution may be emerging through a unified vertical wind profile description which is valid through the entire atmospheric boundary layer and not inhibited by surface-layer discontinuities. Such descriptions require knowledge of typical surface-layer heights, and it is therefore important that future research continues the mapping of how the vertical wind profile develops under various surrounding conditions. This description is proposed to grow increasingly important as wind energy projects are expanding their reach to locations where little research has previously been conducted. While the study of inflected vertical wind profiles unambiguously categorizes abnormal profiles, many additional profiles may be incorrectly described by MOST without exhibiting such features. In order to better describe both the cause and implications of vertical wind profiles which deviate from the expected shape, future studies may benefit from a synthesized identification method of quantifying the error between the predicted and actual wind profiles while simultaneously describing the profile in terms of the number of local maxima.
The Skipheia (Frøya) data are available online; see the link in Domagalski and Sætran (2019). Access to the remaining data sets was granted as follows: FINO data may be granted through contact with personnel at the Federal Maritime and Hydrographic Agency of Germany (BSH) and then are available to download online. The Høvsøre data were made available through contact with Yoram Eisenberg of DTU Wind Energy. The Valsneset data were made available through contact with Lars Morten Bardal at NTNU. The Ryningsnäs data were made available through contact with Johan Arnqvist of Uppsala University.
The paper is based on MM's master thesis. LRS was the supervisor, and PD was the co-supervisor for the thesis. MM wrote the manuscript, which has been commented on and revised by both co-authors.
The authors declare that they have no conflict of interest.
This article is part of the special issue “Wind Energy Science Conference 2019”. It is a result of the Wind Energy Science Conference 2019, Cork, Ireland, 17–20 June 2019.
For access to the Skipheia data, the authors would like to acknowledge the support of the European Commission in the form of the MaRINET project (project ID: 262552) funded under the FP7-INFRASTRUCTURES program. For access to the large FINO databases the authors would like to acknowledge BMWi (Bundesministerium für Wirtschaft und Energie, Federal Ministry for Economic Affairs and Energy) and the PTJ (Projekttraeger Jülich, project executing organization), and also Anne-Christin Shulz from BSH for answering questions regarding the data sets. For access to the Høvsøre data, the authors would like to thank the DTU Wind Energy group, and especially Yoram Eisenberg for providing the data. The authors would also like to thank Johan Arnqvist at the University of Uppsala for providing access to the Ryningsnäs data and Lars Morten Bardal of NTNU for access to the Valsneset data.
This research has been supported by the European Commission (MaRINET project; project ID 262552) funded under FP7-INFRASTRUCTURES program.
This paper was edited by Sandrine Aubrun and reviewed by three anonymous referees.
Argyle, P. and Watson, S.: Assessing the dependence of surface layer atmospheric stability on measurement height at offshore locations, J. Wind Eng. Indust. Aerodynam., 131, 88–99, https://doi.org/10.1016/j.jweia.2014.06.002, 2014. a, b, c, d, e, f, g, h, i
Arnqvist, J., Segalini, A., Dellwik, E., and Bergström, H.: Wind Statistics from a Forested Landscape, Bound.-Lay. Meteorol., 156, 53–71, https://doi.org/10.1007/s10546-015-0016-x, 2015. a, b
Arya, S. P.: Introduction to micrometeorology, Academic Press Inc., San Diego, 1988. a, b
Bardal, L. M., Sætran, L. R., and Wangsness, E.: Performance Test of a 3 MW Wind Turbine – Effects of Shear and Turbulence, Energy Proced., 80, 83–91, https://doi.org/10.1016/j.egypro.2015.11.410, 2015. a
Bardal, L. M., Onstad, A. E., Sætran, L. R., and Lund, J. A.: Evaluation of methods for estimating atmospheric stability at two coastal sites, Wind Eng., 42, 561–575, https://doi.org/10.1177/0309524X18780378, 2018. a, b
Cooney, C., Byrne, R., Lyons, W., and O'Rourke, F.: Performance characterisation of a commercial-scale wind turbine operating in an urban environment, using real data, Energ. Sustain. Dev., 36, 44–54, https://doi.org/10.1016/j.esd.2016.11.001, 2017. a
Csanady, G. T.: Equilibrium theory of the planetary boundary layer with an inversion lid, Bound.-Lay. Meteorol., 6, 63–79, https://doi.org/10.1007/BF00232477, 1974. a
Domagalski, P. and Sætran, L. R.: Frøya wind data, available at: https://zenodo.org/record/2557500#.XR2mc1MzY1I, last access: 23 March 2019. a, b
Eggers Jr., A. J., Digumarthi, R., and Chaney, K.: Wind shear and turbulence effects on rotor fatigue and loads control, J. Solar Energ. Eng., 125, 402–409, https://doi.org/10.1115/1.1629752, 2003. a
Emeis, S.: Wind Energy Meteorology, Springer-Verlag, Berlin, Heidelberg, https://doi.org/10.1007/978-3-642-30523-8, 2013. a, b
Emeis, S.: Current issues in wind energy meteorology, Meteorol. Appl., 21, 803–819, https://doi.org/10.1002/met.1472, 2014. a, b
FINO1: FINO1: Research platform in the North Sea, available at: https://www.fino1.de/en/, last access: 1 June 2019. a
FINO2: FINO2: Research platform in the Baltic Sea, available at: https://www.fino2.de/en/, last access: 1 June 2019. a
FINO3: FINO3: Research platform in the North Sea, available at: https://www.fino3.de/en/, last access: 1 June 2019. a
Foken, T.: 50 Years of the Monin–Obukhov Similarity Theory, Bound.-Lay. Meteorol., 119, 431–447, https://doi.org/10.1007/s10546-006-9048-6, 2006. a
Foken, T.: Micrometeorology, 2nd Edn., Springer-Verlag, Berlin, Heidelberg, https://doi.org/10.1007/978-3-540-74666-9, 2017. a
Garratt, J. R.: The internal boundary layer – A review, Bound.-Lay. Meteorol., 50, 171–203, https://doi.org/10.1007/BF00120524, 1990. a, b
Gryning, S.-E., Batchvarova, E., Brümmer, B., Jørgens, H., and Larsen, S.: On the extension of the wind profile over homogeneous terrain beyond the surface layer, Bound.-Lay. Meteorol., 124, 251–268, https://doi.org/10.1007/s10546-007-9166-9, 2007. a, b, c, d
Gualtieri, G.: A comprehensive review on wind resource extrapolation models applied in wind energy, Renew. Sustain. Energ. Rev., 102, 215–233, https://doi.org/10.1016/j.rser.2018.12.015, 2019. a
Gutierrez, W., Ruiz-Columbie, A., Tutkun, M., and Castillo, L.: Impacts of the low-level jet's negative wind shear on the wind turbine, Wind Energ. Sci., 2, 533–545, https://doi.org/10.5194/wes-2-533-2017, 2017. a
IEC: IEC 61440: Wind turbines – Part 12-1: Power performance measurements of electricity producing wind turbines, Standard, International Electrochemical Commission, Geneva, Switzerland, available at: https://webstore.iec.ch/publication/26603 (last access: 17 April 2019), 2017. a, b
Kaimal, J. C. and Wyngaard, J. C.: The Kansas and Minnesota experiments, Bound.-Lay. Meteorol., 50, 31–47, https://doi.org/10.1007/BF00120517, 1990. a
Kalvig, S., Gudmestad, O. T., and Winther, N.: Exploring the gap between `best knowledge' and `best practice' in boundary layer meteorology for offshore wind energy, Wind Energy, 17, 161–171, https://doi.org/10.1002/we.1572, 2014. a
Kettle, A. J.: Unexpected vertical wind speed profiles in the boundary layer over the southern North Sea, J. Wind Eng. Indust. Aerodynam., 134, 149–162, https://doi.org/10.1016/j.jweia.2014.07.012, 2014. a, b, c, d, e
Lange, B., Larsen, S., Højstrup, J., and Barthelmie, R.: Importance of thermal effects and sea surface roughness for offshore wind resource assessment, J. Wind Eng. Indust. Aerodynam., 92, 959–988, https://doi.org/10.1016/j.jweia.2004.05.005, 2004. a, b, c, d, e
Nunalee, C. G. and Basu, S.: Mesoscale modeling of coastal low-level jets: implications for offshore wind resource estimation, Wind Energy, 17, 1199–1216, https://doi.org/10.1002/we.1628, 2014. a, b
Peña, A., Gryning, S.-E., and Hasager, C. B.: Measurements and modelling of the wind speed profile in the marine atmospheric boundary layer, Bound.-Lay. Meteorol., 129, 479–495, https://doi.org/10.1016/j.jweia.2014.07.012, 2008. a, b, c, d
Peña, A., Floors, R., Sathe, A., Gryning, S.-E., Wagner, R., Courtney, M. S., Larsén, X. G., Hahmann, A. N., and Hasager, C. B.: Ten Years of Boundary-Layer and Wind-Power Meteorology at Høvsøre, Denmark, Bound.-Lay. Meteorol., 158, 1–26, https://doi.org/10.1007/s10546-015-0079-8, 2016. a, b, c, d
Petersen, E. L., Mortensen, N. G., Landberg, L., Højstrup, J., and Frank, H. P.: Wind power meteorology. Part I: climate and turbulence, Wind Energy, 1, 2–22, https://doi.org/10.1002/(SICI)1099-1824(199809)1:1<2::AID-WE15>3.0.CO;2-Y, 1998. a
Riedel, V., Durante, F., Neumann, T., and Strack, M.: The First Year of Measurements on the FINO1 Platform in the North Sea – Evaluation and Analysis of the Wind Profile and Assessment of the Statistical Long-Term Mean Value, DEWI Mag., 26, 37–48, 2005. a
Sathe, A., Gryning, S.-E., and Peña, A.: Comparison of the atmospheric stability and wind profiles at two wind farm sites over a long marine fetch in the North Sea, Wind Energy, 14, 767–780, https://doi.org/10.1002/we.456, 2012. a, b, c
Sempreviva, A. M., Barthelmie, R. J., and Pryor, A. C.: Review of methodologies for offshore wind resource assessment in European seas, Surv. Geophys., 29, 471–497, https://doi.org/10.1007/s10712-008-9050-2, 2009. a
Smedman, A.-S., Bergström, H., and Högström, U.: Spectra, variances and length scales in a marine stable boundary layer dominated by a low level jet, Bound.-Lay. Meteorol., 76, 211–232, https://doi.org/10.1007/BF00709352, 1995. a
Smedman, A.-S., Bergström, H., and Grisogono, B.: Evolution of stable internal boundary layers over a cold sea, J. Geophys. Res.-Oceans, 102, 1091–1099, https://doi.org/10.1029/96JC02782, 1997. a
Smith, D. A., Harris, M., Coffey, A. S., Mikkelsen, T., Jørgensen, H. E., Mann, J., and Danielian, R.: Wind lidar evaluation at the Danish wind test site in Høvsøre, Wind Energy, 9, 87–93, https://doi.org/10.1002/we.193, 2006. a
Stull, R.: Practical Meteorology: An Algebra-based Survey of Atmospheric Science, University of British Columbia, 1.02 Edn., available at: https://www.eoas.ubc.ca/books/Practical_Meteorology/ (last access: 5 June 2019), 2017. a, b
Svensson, N., Bergstrom, H., Sahlée, E., and Rutgersson, A.: Stable atmospheric conditions over the Baltic Sea: Model evaluation and climatology, Boreal Environ. Res., 21, 387–404, 2016. a
Tambke, J., Lange, M., Focken, U., Wolff, J.-O., and Bye, J. A. T.: Forecasting Offshore Wind Speeds above the North Sea, Wind Energy, 8, 3–16, https://doi.org/10.1002/we.140, 2005. a
Verkaik, J. W. and Holtslag, A. A. M.: Wind profiles, momentum fluxes and roughness lengths at Cabauw revisited, Bound.-Lay. Meteorol., 122, 701–719, https://doi.org/10.1007/s10546-006-9121-1, 2007. a
Wagner, R., Antoniou, I., Pedersen, S. M., Courtney, M. S., and Jørgensen, H. E.: The influence of the wind speed profile on wind turbine performance measurements, Wind Energy, 12, 348–362, https://doi.org/10.1002/we.297, 2009. a, b
Westerhellweg, A., Neumann, T., and Riedel, V.: FINO1 mast correction, DEWI Mag., 40, 60–66, 2012. a, b
WindEurope: Wind energy in Europe in 2018, 1, available at: https://windeurope.org/wp-content/uploads/files/about-wind/statistics/WindEurope-Annual-Statistics-2018.pdf, last access: 17 May 2019. a