the Creative Commons Attribution 4.0 License.
the Creative Commons Attribution 4.0 License.
 | 26 May 2020
Development and feasibility study of segment blade test methodology
Kwangtae Ha
Moritz Bätge
David Melcher
Steffen Czichon
This paper outlines a novel segment test methodology for wind turbine rotor blades. The segment test mainly aims at improving the efficiency of the fatigue test as a future test method at Fraunhofer Institute for Wind Energy Systems (IWES). While resulting in reduced testing times, target fatigue bending moments over the intended test area have to be matched within an acceptable range of overload. The numerical simulation reveals that the proposed segment testing has a significant time savings of up to 43 % and 52 % for 60 and 90 m blades. When compared to the experimental data of a 60 m full-length blade fatigue test, the proposed methodology also shows better test quality over the intended area and better certifiable regions over the outboard area.
- Article
(1062 KB) - Full-text XML
- BibTeX
- EndNote


Wind turbine rotor blades are designed to sustain the 20–25-year lifetime without structural failure. Reliability of the blade is essential for keeping maintenance and operation costs low and maintaining the designed power performance. Mechanical full-scale tests are the main process available for validating the structural integrity of wind turbine rotor blades (Spera, 2009). This is also required as part of the blade certification process according to IEC 61400-23 (IEC, 2014). A typical full-scale blade test consists of the following test programs:
-
determining blade properties such as mass, center of gravity, and natural frequencies;
-
static tests;
-
fatigue load tests;
-
post-fatigue static tests.
Among all structural tests, the fatigue load test is the most time-consuming process, and therefore this step accounts for most of the test cost involved. It is executed either in the flap or lead-lag direction independently or simultaneously in both directions. Due to the large mass and low stiffness of the blades, test operating frequencies are very low, especially for flap fatigue tests. Therefore, fatigue tests take up to several months to accomplish the required cycle count of 1 to 5 million cycles, depending on the blade characteristics (Wingerde et al., 2015; Post, 2016). As blades are getting longer and bigger, both test time and costs increase significantly – especially for future offshore blade measuring more than 100 m in length (Griffin, 2002). Also, testing facilities for 100 m and longer blades are very limited at this moment. Hence, a reduction in test time and utilizing available test halls are important to accelerate the development cycle of future offshore turbines with 100 m and longer blades.
In this paper, a novel segment test methodology for wind turbine rotor blades is proposed and its benefits are investigated with a numerical simulation. The proposed test methodology decouples a blade root segment and a tip segment to improve test quality and minimize test time by performing both segment tests independently in parallel while meeting the original target bending moment within a specific overload limit (5 % for flap direction and 10 % for lead-lag direction). Two representative blade models, a 60 m onshore blade and a 90 m offshore blade, were used for numerical simulation to compare the fatigue test time and the test quality of segment blades with full-scale blades in ANSYS APDL and ANSYS Workbench 18.1 (ANSYS Inc., 2018).
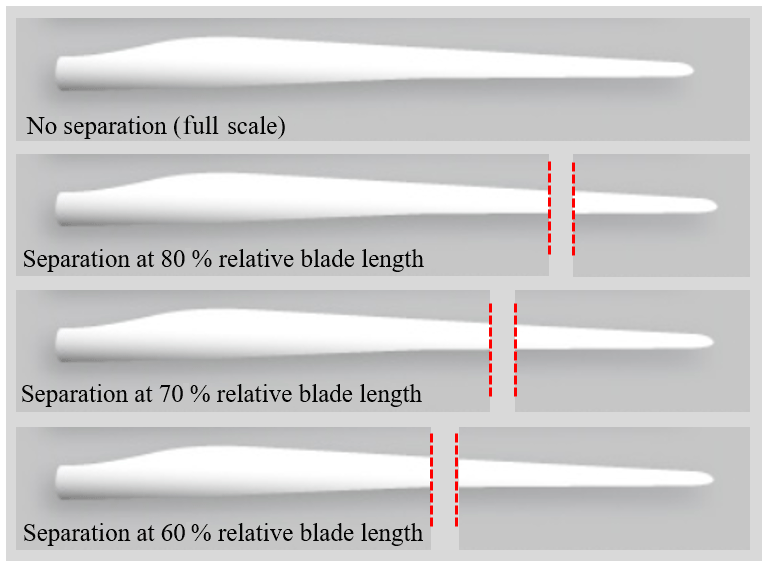
Since the tip portion of the blade is generally not very critical in terms of structural damage, the blade tip is sometimes removed during fatigue testing in order to reduce energy consumption and test time. This can also be done if space in the testing facility is limited (Spera, 2009; Al-Khudairi et al., 2017; White, 2004). The segment blade test takes this approach a step further and divides the device under testing (DUT) into a root and a tip segment as shown in Fig. 1, which can then be tested in parallel.
2.1 Differences between full-length and segment testing
The segment testing procedure remains essentially unchanged compared to the full-length blade test. However, there are several important differences in the test preparation and execution that have to be considered.
It is assumed that design-critical areas are not located near the separation points. If the areas of the separation point are to be verified in the test, a significantly greater manufacturing outlay arises, as overlapping segments have to be produced. In this work, the assumption applies that the separation point does not lie in one of the critical areas (Brondsted and Nijssen, 2013). Special care has to be taken when cutting the blade to produce reliable segment blades without any defect. However, this aspect is not considered in this study (Skelton, 2017).
The expense of equipping the rotor blade with test-specific measurement sensors does not change significantly as a result of the segmentation. However, since the blade tip test time is much shorter than the blade root test due to the higher test frequencies, the preparation work for the tip segment can be postponed. In other words, after the blade root test is prepared and started, preparation work with the blade tip segment can be executed. In this way, additional time can be saved in the overall process of the test.
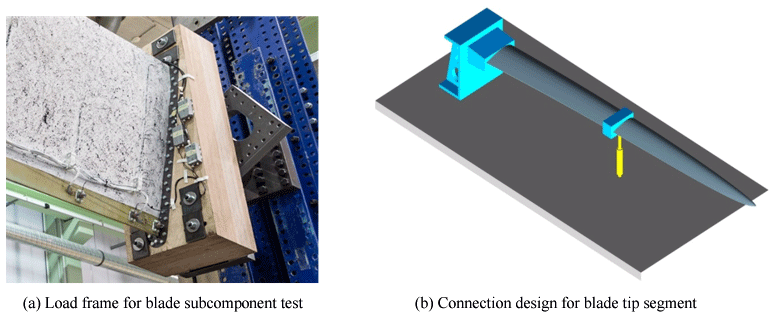
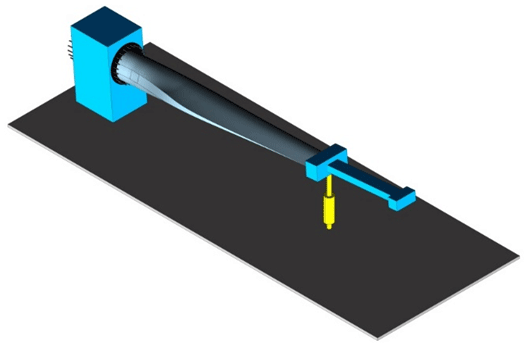
In order to improve transportability, some modern onshore blades are already produced in a modular design, where two halves are produced that are joined on the wind farm site (Peeters, 2017). For these blades, the tip already has a connection to mount the tip segment to the test stand. If the blade is only separated for test purposes, the tip segment, unlike the root segment, has no prefabricated connection for mounting to the test stand. In this case, the mounting test stand must be fabricated for the tip segment. There are several possible solutions. One solution is that the segment can be clamped by two fixed load frames arranged one behind the other. However, this leads to a reduction of the test area. Fraunhofer IWES has developed and validated an alternative fixture concept. The structure to be tested is glued firmly into a wooden frame, whereby the immediate connection point is reinforced by steel sheets (Rosemeier et al., 2018). Figure 2a shows this connection technology used in the application of a trailing edge subcomponent test, and Fig. 2b shows the connection design of the tip segment to the test bench as part of the entire test setup without additional masses. Depending on the length of the tip segment, the bonding depth to the load frame may vary to sustain the maximum strength at the clamping area.
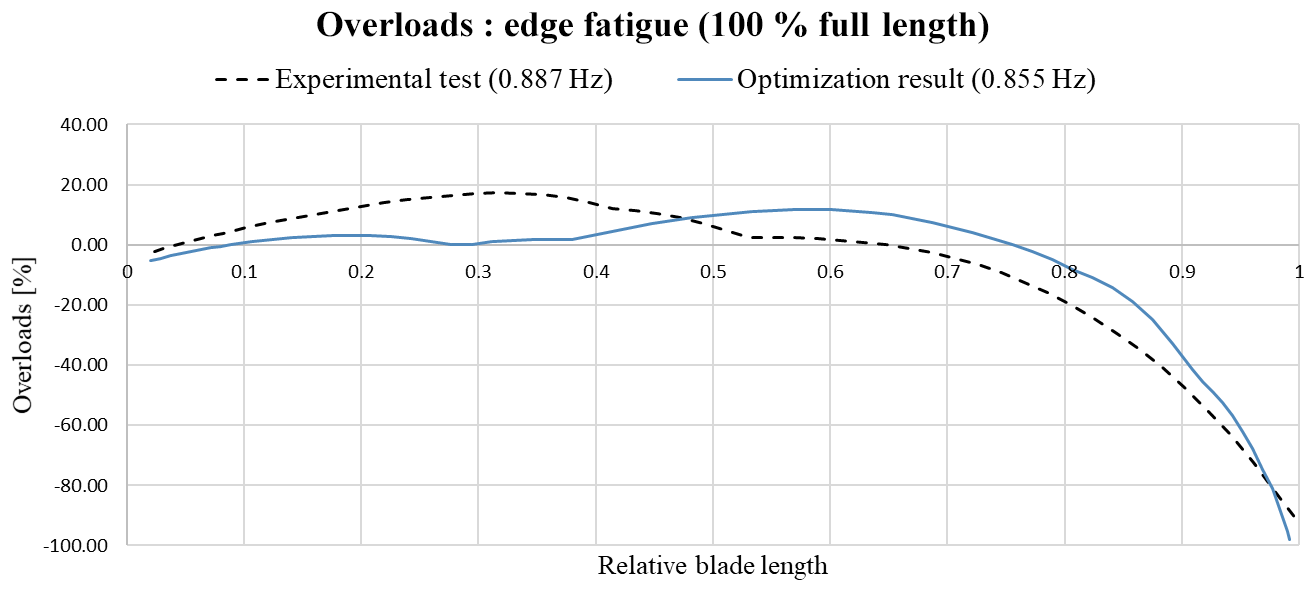
During the conventional fatigue test, the rotor blade is usually more stressed in the area near the root than in the area of the blade tip compared to the target loads. As an example, Fig. 3 shows an experimental overload distribution and an optimized overload distribution of a 60 m blade in the lead-lag fatigue test. As a result of experimental fatigue test, the inboard areas of the rotor blade have already experienced the calculated loads from 20 years of life, but the test must continue to sufficiently load the under-stressed areas over 65 % of the blade length. Due to this “over-testing” or “over-stressing” of the inboard blade area, structural damage increasingly occurs towards the end of the test, which must be inspected and if necessary repaired (DNV-GL, 2015). This can result in delays of several weeks in the process. The numerical optimization of a full-length blade fatigue test setup resulted in a better and reduced overload distribution as shown in Fig. 3, but it still shows under-stressed areas after 75 % of blade length. Most of all, the increased test time (reverse of test frequency) cannot be ignored as future offshore blades are getting bigger. Details of an optimization process will be addressed in Sect. 2.2.
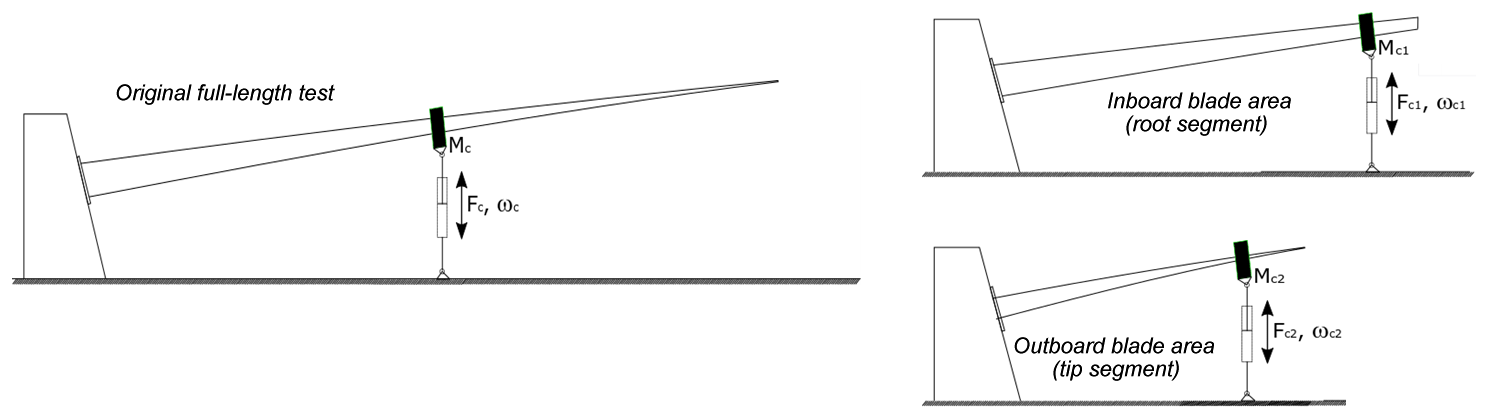
The segment test offers a major advantage regarding moment distribution over the blade length. By dividing a full-scale blade into blade root and blade tip segments, the inboard and outboard areas of the rotor blade are decoupled and loaded independently, as shown in Fig. 4. From Fig. 4, the variables, M, F, and ω represent load-frame mass, force, and frequency, respectively, and the subscript “c” represents the cylinder actuator. The respective test can be stopped when the corresponding area has reached the required target loads. Also, should damage occur that necessitates repairs to the blade structure, only the respective segment test must be stopped for the inspection.
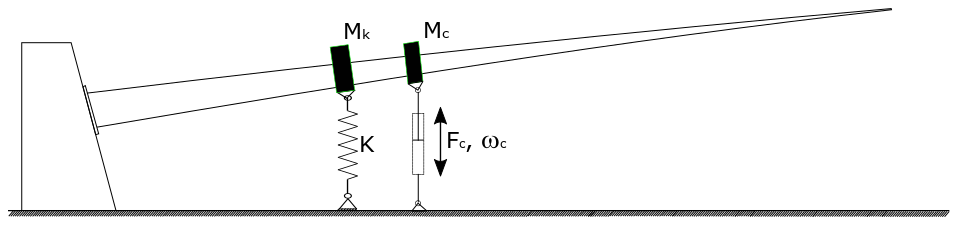
A widely used method to achieve the introduction of shear forces and bending moment to approximate the bending moment distribution to the target loads is the attachment of additional masses on the blade. However, this practice leads to a drop in the test frequency (Spera, 2009; Gasch et al., 2012). Alternatively, the bending moment distribution can be modified through artificial stiffness elements, as shown in Fig. 5 by introducing opposing forces and providing additional degrees of freedom for test quality improvement (Gere and Goodno, 2013). The stiffness elements can be implemented passively by mechanical or hydraulic springs or actively by hydraulic actuators (cylinders). In this model, a spring element with a maximum stiffness of 300 kN m−1 was implemented. In addition, the force entered by the spring into the blade was limited to 100 kN or less. Additional stiffness elements can also help to increase the systems' natural frequency and reduce test time.
Naturally, the segment test must achieve the same bending moment distribution as the full-length test. However, it is intuitively obvious that the free end of the segment will experience a zero-bending moment. In order to overcome this, a blade dummy, representing mass and moment of inertia of the tip segment, can be fixed to the root section as shown in Fig. 6, which is similar to the fixation of the blade tip segment to the test bench described above.
2.2 Numerical model for optimization of segment test setup
The purpose of this study is to quantify the advantages of segment blade testing by comparing test setups for two different test cases. For 60 and 90 m blades, an optimized test configuration is chosen using dynamic analysis of both blade and test setup.
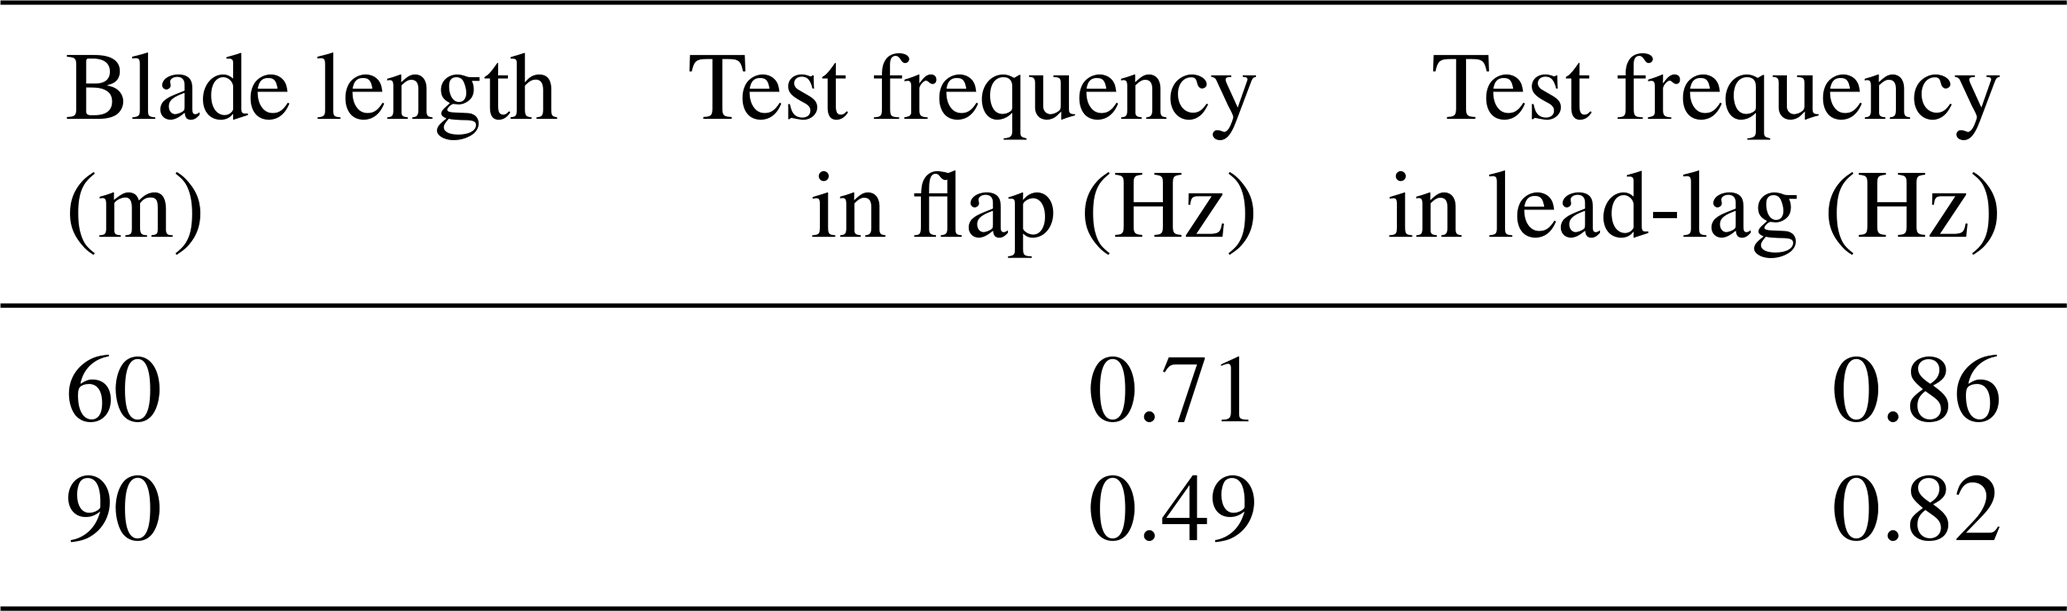
Rotor diameters of wind turbines installed in 2017 ranged from 48 to 180 m. The maximum rotor diameter was 142 m for onshore wind turbines and 180 m for offshore wind turbines (Fraunhofer IEE, 2017). In this study, two representative blade models were selected to represent current onshore and offshore wind turbine rotor blades, shown as blue dots on the scaled trend in Fig. 7. Blades that have been tested at Fraunhofer IWES are also shown as red dots in Fig. 7. Table 1 lists the frequency information of two representative blade models.

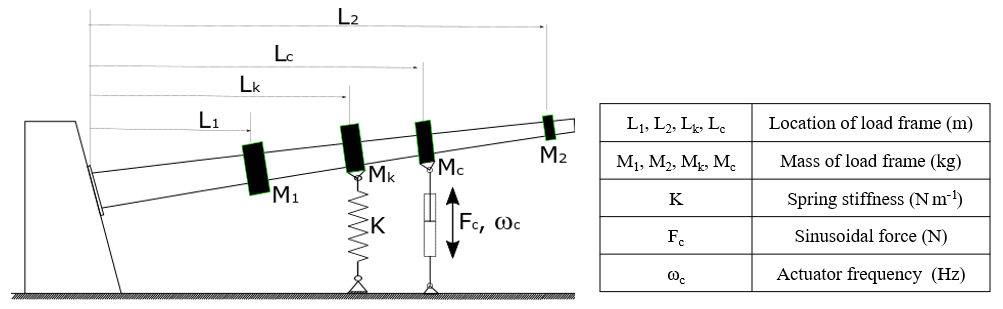
Finite element (FE) beam models of the blades were used for numerical simulation in ANSYS Workbench 18.1 in order to find the optimal test configuration. Figure 8 shows a schematic representation of the fatigue test model in the flap direction and design variables for optimization analysis. Up to four load frames are included at varying positions along the blade. Each load frame has an associated mass that can be used to tune the frequency and dynamic bending moment distribution. One load frame also acts as the connecting point for a ground-based actuator. Frequency and force amplitude of the actuator can be changed as part of the test configuration. Furthermore, a spring element can be connected to one of the load frames to further modify the system stiffness and natural frequency.
The ranges and constraints of given parameters are listed in Tables 2 and 3.
Table 2Range of variable input parameters.
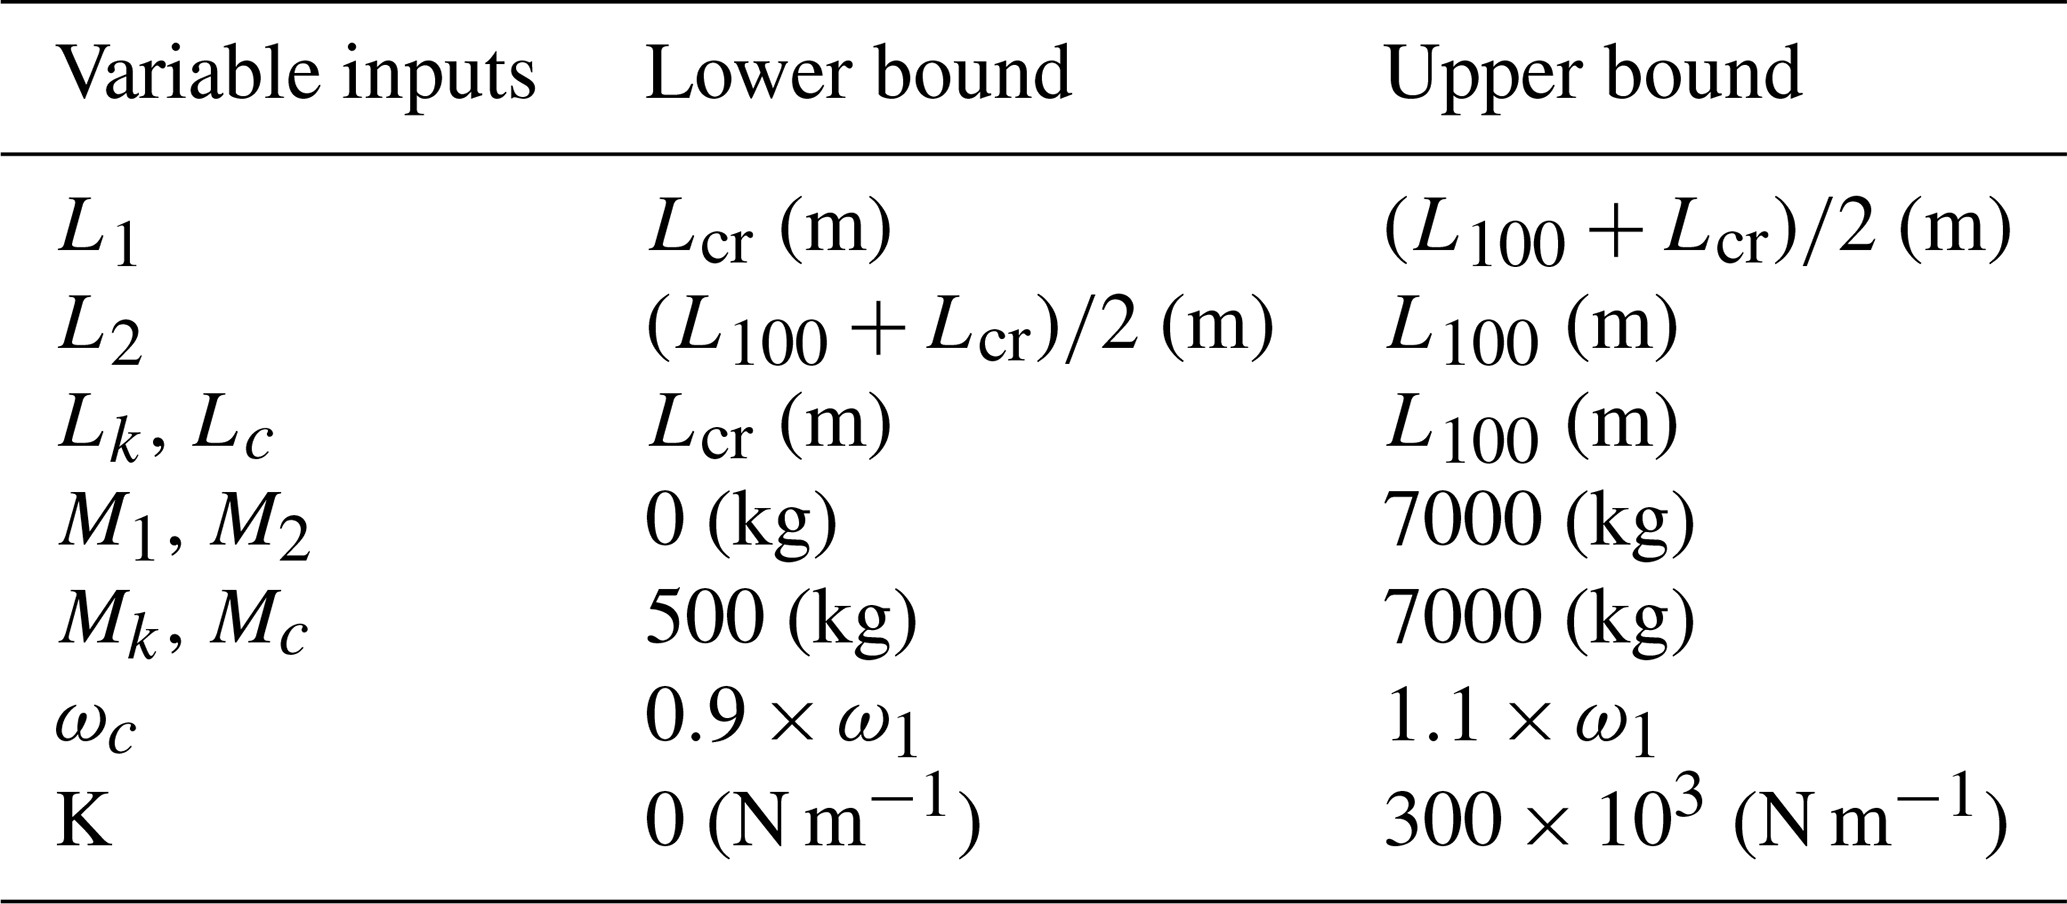
Lcr is the critical location for the 60 m blade, Lcr is the critical location for the 90 m blade L100 is the length of blade (60 m for the 60 m blade, 90 m for the 90 m blade), and W1 is shown in Table 1 for each blade (60 and 90 m).
Table 3Range of constrained parameters.
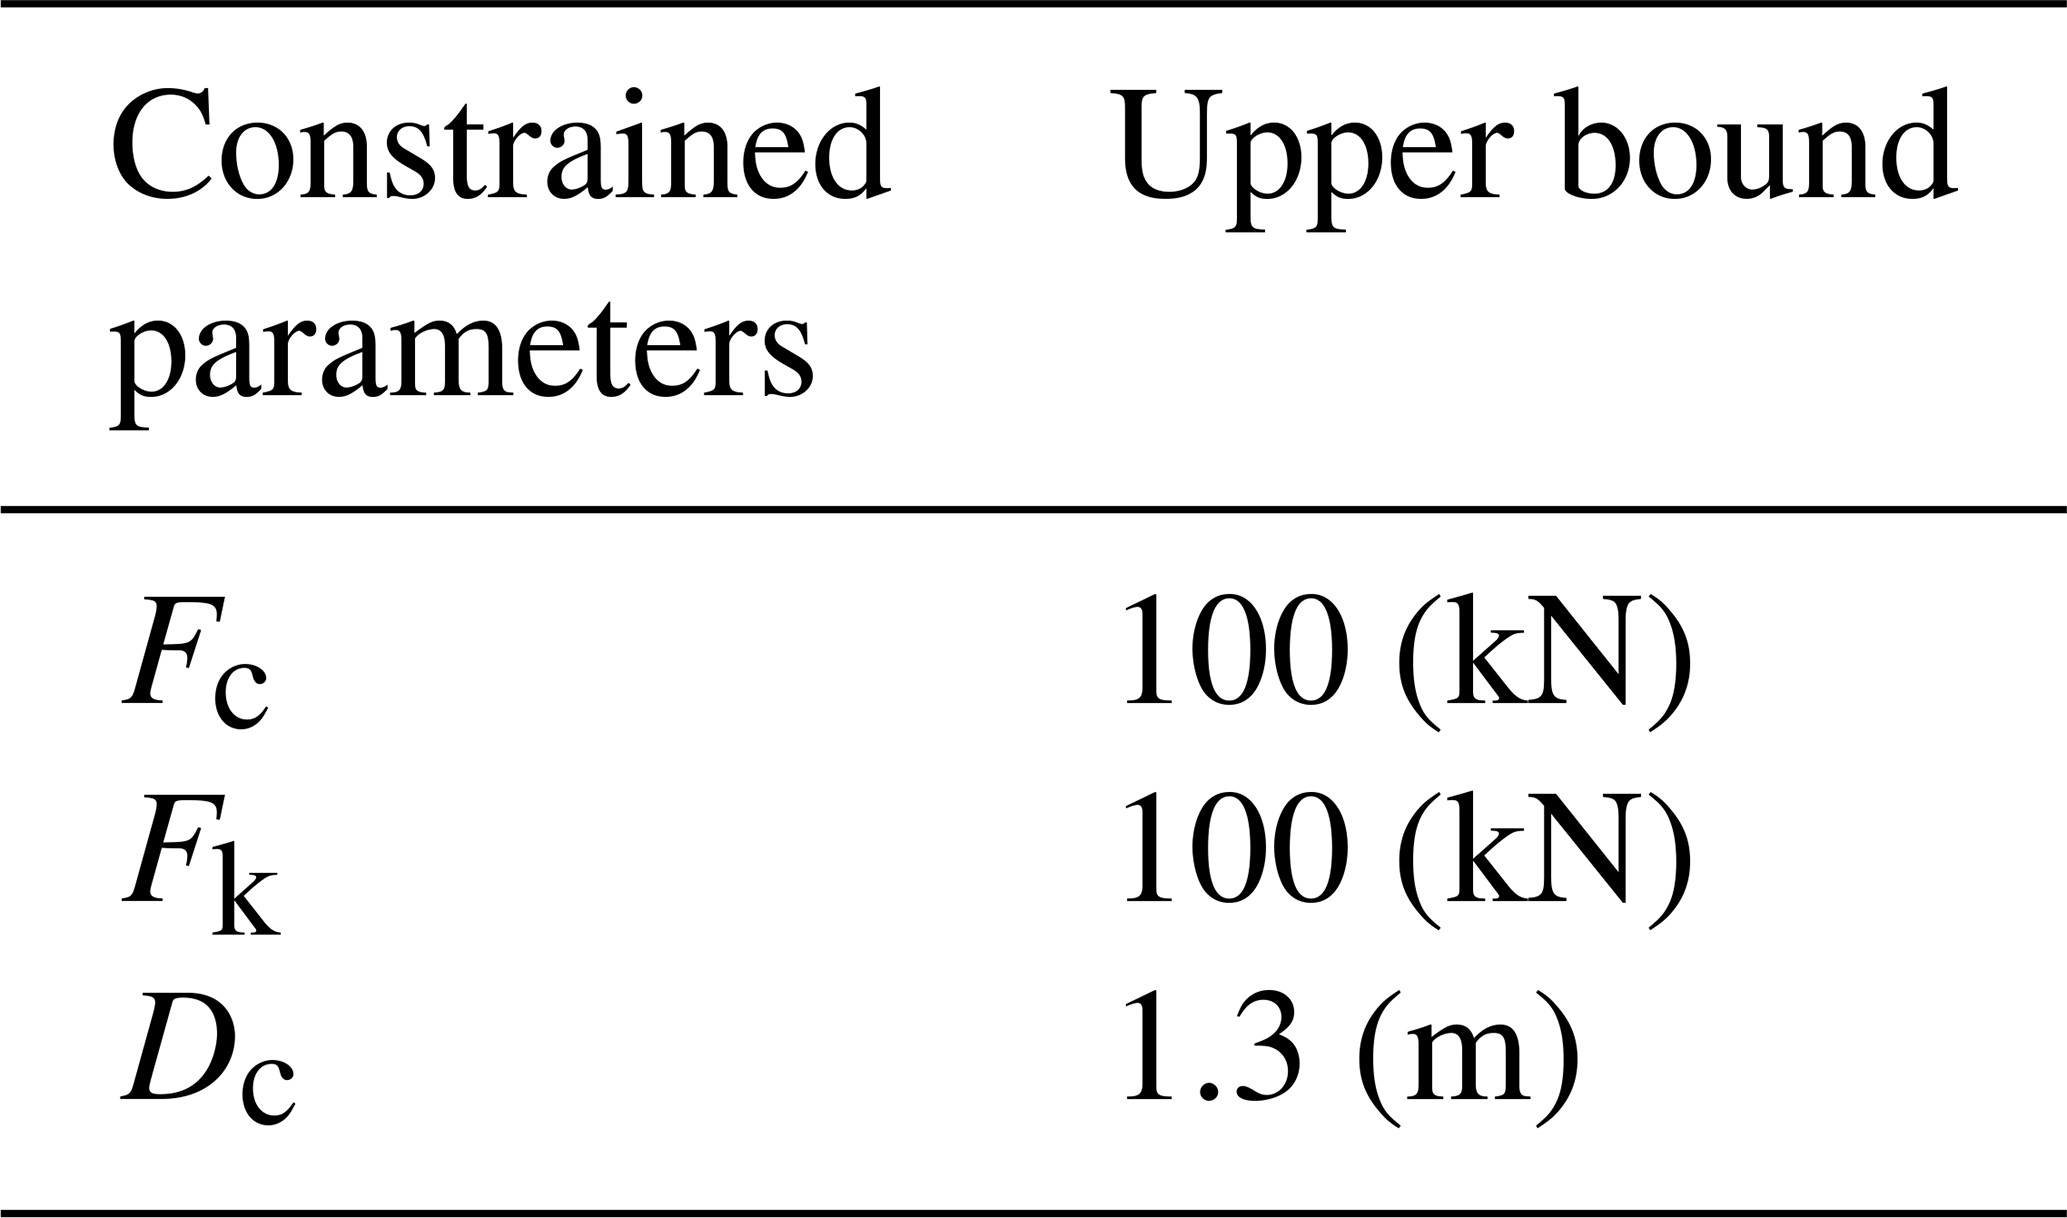
Fc: cylinder actuator force amplitude; Fk: spring force; Dc: cylinder actuator displacement amplitude.
By varying all parameters mentioned above, the system response can be modified to find an optimal test setup. The target function for the optimization process was set to maximize the excitation frequency, while keeping the overload of the bending moment distribution between 0 % and 5 % for flap and between 0 % and 10 % for lead-lag.
In Eqs. (1) and Eq. (2), M is the bending moment calculated from the segment blade fatigue simulation, and is the target bending moment of the full-scale blade. It has to be noted that the constraints are only set for an area of interest, which is defined as ranging from 5 % to 50 % of the relative blade length for blade root segment and from division point up to the relative blade length of 90 % in the case of the blade tip segment.

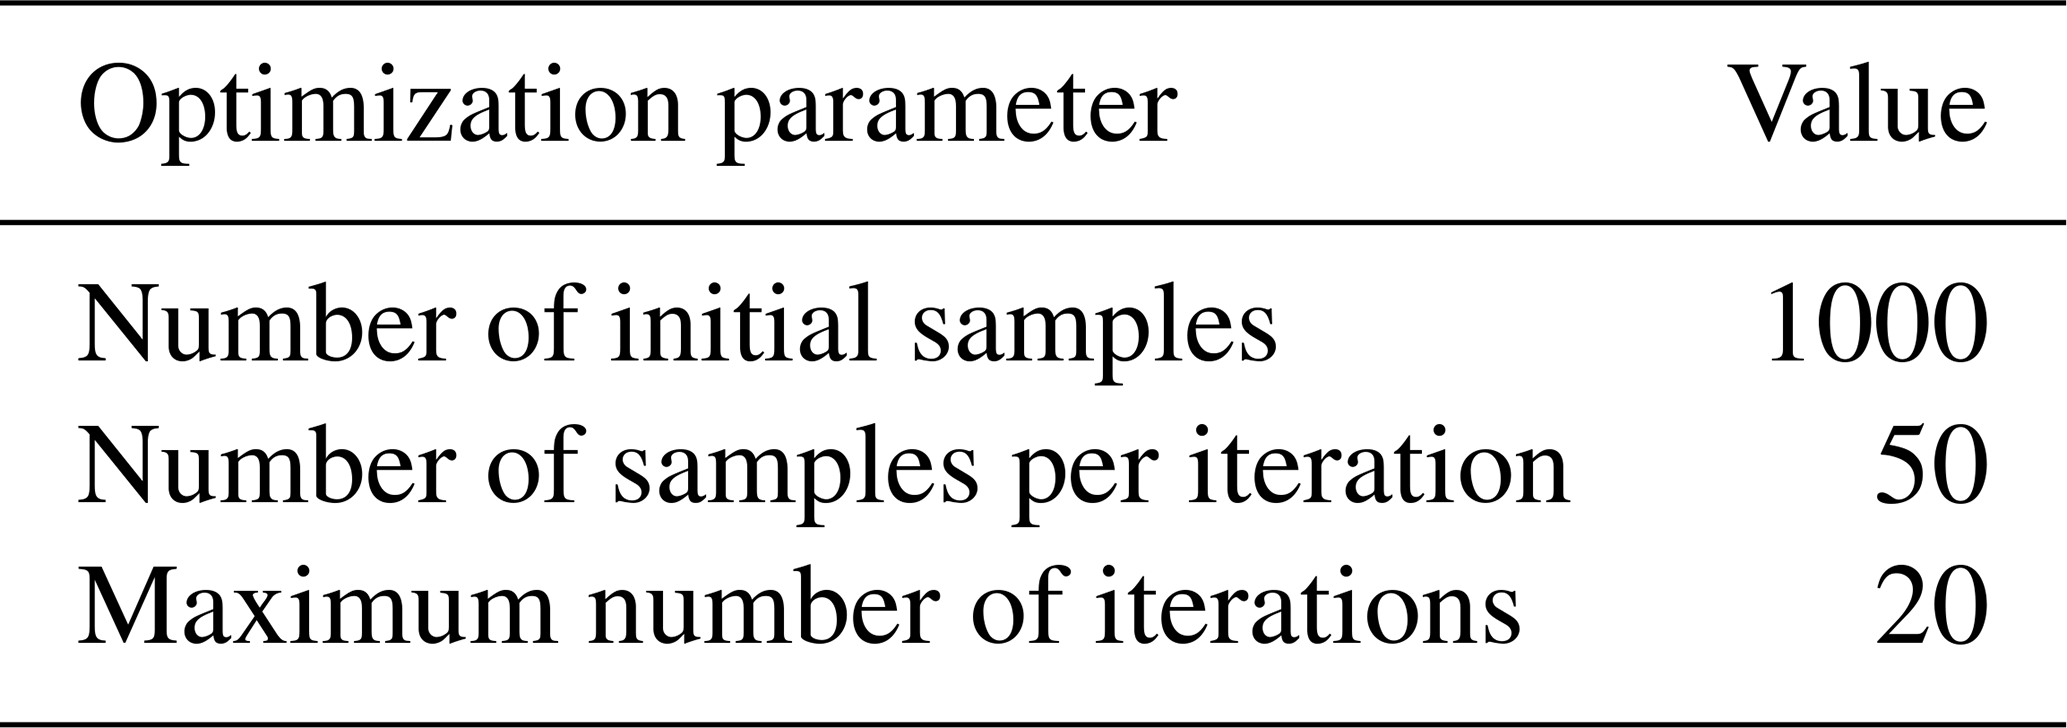
In order to reduce the computational effort for the optimization, harmonic analysis is used to avoid calculations in the time domain. For the current study, the full harmonic method based on nodal coordinates is used to apply the prescribed displacement support to simulate the realistic test environments at a specific test frequency (ωc) within the range listed in Table 2, and beta damping is used for damping the model. As a result, optimization calculations with a large number of individual cases are feasible. Comparison with computations in the time domain (transient analysis) have shown that the error introduced by this approach is small. The sequence of this test optimization is shown in Fig. 9. The optimization problem is solved using internal optimization routines provided in ANSYS Workbench. Both gradient-based methods and genetic algorithms have proven to give similar results. The optimization parameter used in MOGA (Multi-Objective Genetic Algorithm) is listed in Table 4.
Considering only the pure execution time, test duration can be directly calculated from the actuator frequency and the cycle time. For all considerations in this paper, the number of cycles of the fatigue test is assumed to be 3 million for the lead-lag fatigue test and 1 million for the flap fatigue test. The test quality is assessed based on the overloading of calculated bending moments over target bending moments. As addressed above, the overloading is restricted to below 5 % for the flap fatigue test and 10 % for the lead-lag fatigue test in the area of interest.
Optimized test setups were calculated for the 60 and 90 m reference blades using the target functions and optimization constraints above. Test duration and quality as estimated from the numerical simulation are used to evaluate the feasibility of segment blade fatigue tests.
3.1 Test time
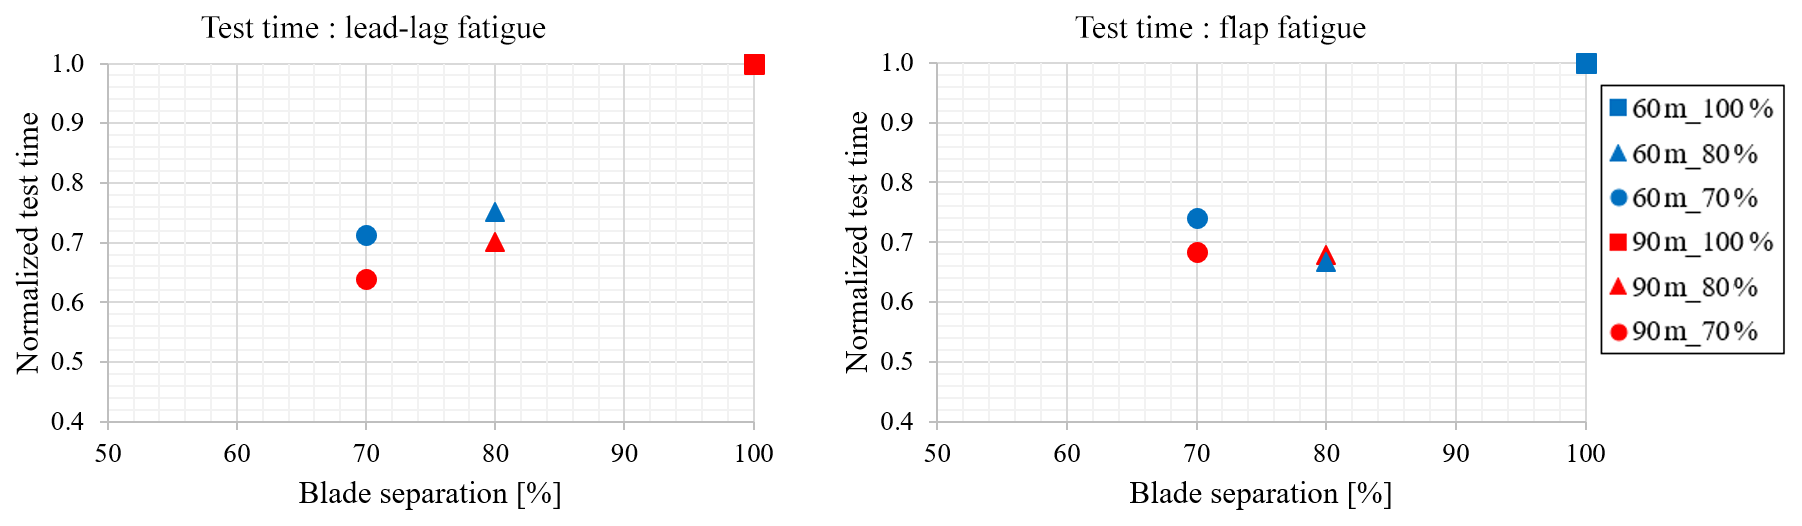
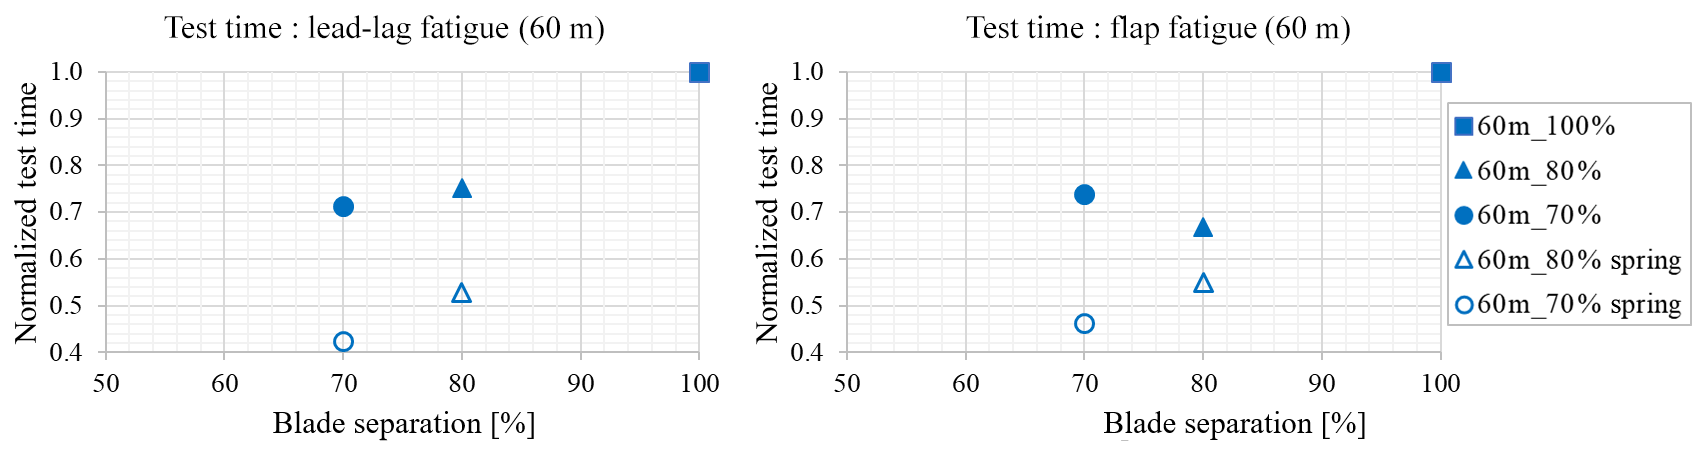
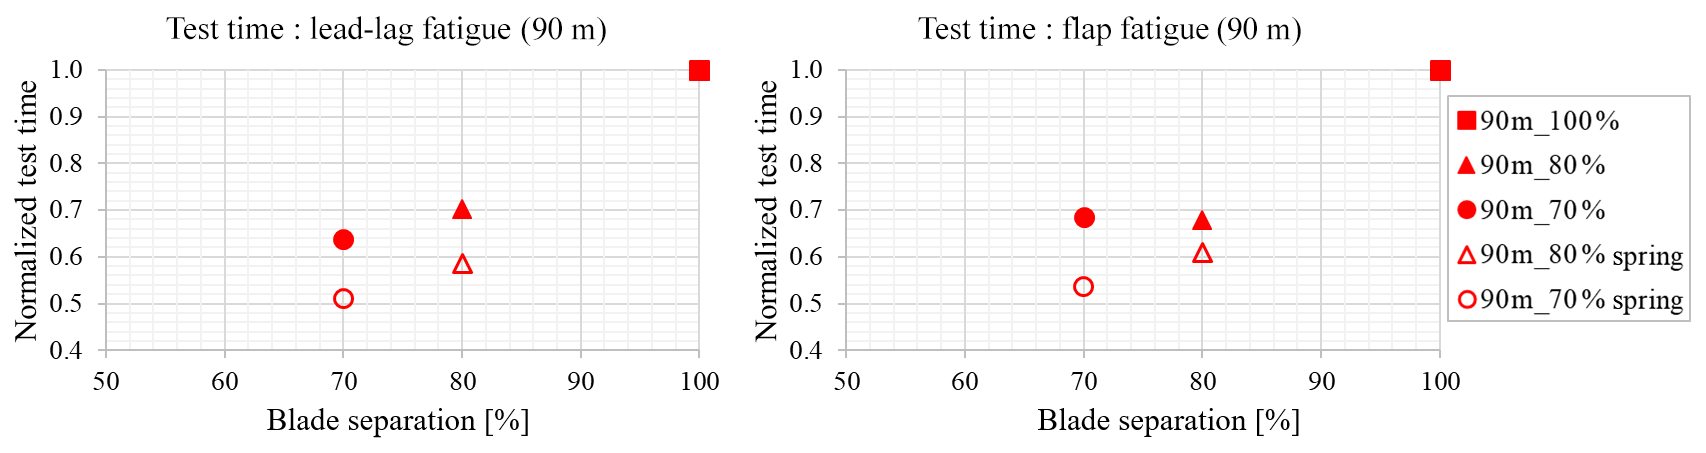
The segment blade tests imply parallel testing of root and tip segments. Due to the limitation of root segment length and its lower test frequency than that of the tip segment, the root segment test is only considered a total fatigue test duration. In a first step, the optimization was conducted without incorporating spring elements. Figure 10 shows the normalized fatigue test times for root segment tests at varying segment lengths (60 %, 70 %, 80 %, and 100 %) of the two blades (60 and 90 m) obtained from the optimization process stated in Sect. 2.2. In comparison to the full-length test, the segment test can reduce the test time by up to 67 % and 64 % for the 60 and 90 m blades, respectively. Test time reduction was found to be larger for the 90 m blade. Blade separations at 60 % of the blade length or shorter did not converge in the optimization, as the criterion for the overload was not matched. This can be explained by the fact that no dummy element as suggested in Fig. 6 was included in the simulations.
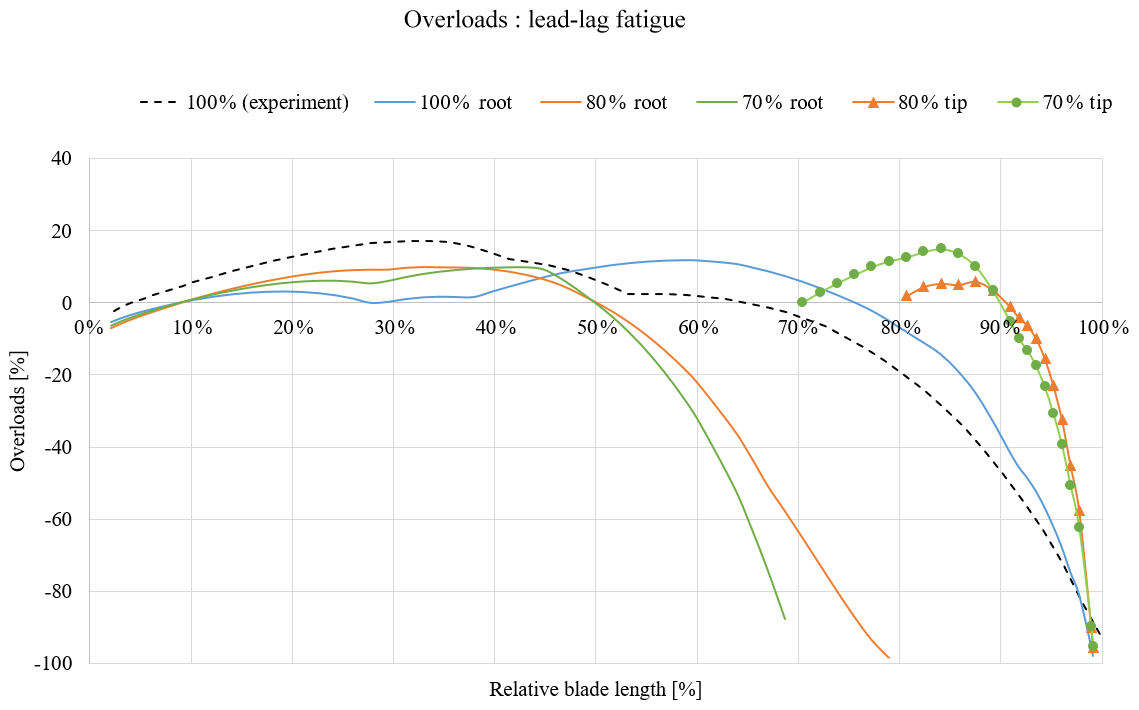
Figure 13Overload comparison in lead-lag fatigue of the 60 m blade (full scale vs. segment).
For the flap fatigue, the test time of the 70 % root segment is higher than the 80 % root segment test time. This is due to the heavy masses added at the outboard of the root segment to meet the target bending moment as explained above. For the lead-lag fatigue, test time of the 70 % root segment is lower than 80 % root segment time because the root segment is stiffer over the whole blade length in the lead-lag direction than in the flap direction, which require less mass at the outboard of the root segment to generate target curvature at the outboard of the root segment.
Figures 11 and 12 show the numerical results from the fatigue test models of 60 and 90 m segment blades with spring elements in comparison to those without spring elements. Depending on the separation point and test direction, the test duration can be reduced by up to 43 % for a 60 m blade and 52 % for a 90 m blade compared to the full-length test case without stiffness elements. The achievable effects in the lead-lag direction are particularly large.
3.2 Test quality
Figure 13 shows the overload comparison from the fatigue test in the lead-lag direction of the 60 m full-scale blade with segment blades with 100 %, 80 %, and 70 % separation points. It shows that optimized segment blade fatigue tests apparently achieve better test quality compared to the traditionally performed full-scale blade case having about 20 % overload. It should be reiterated that optimization of the 70 % segment test shows 30 % reduced test time than a 100 % full-length blade optimization, though maximum overload values are quite similar to each other due to the overload constraints in the optimization process.
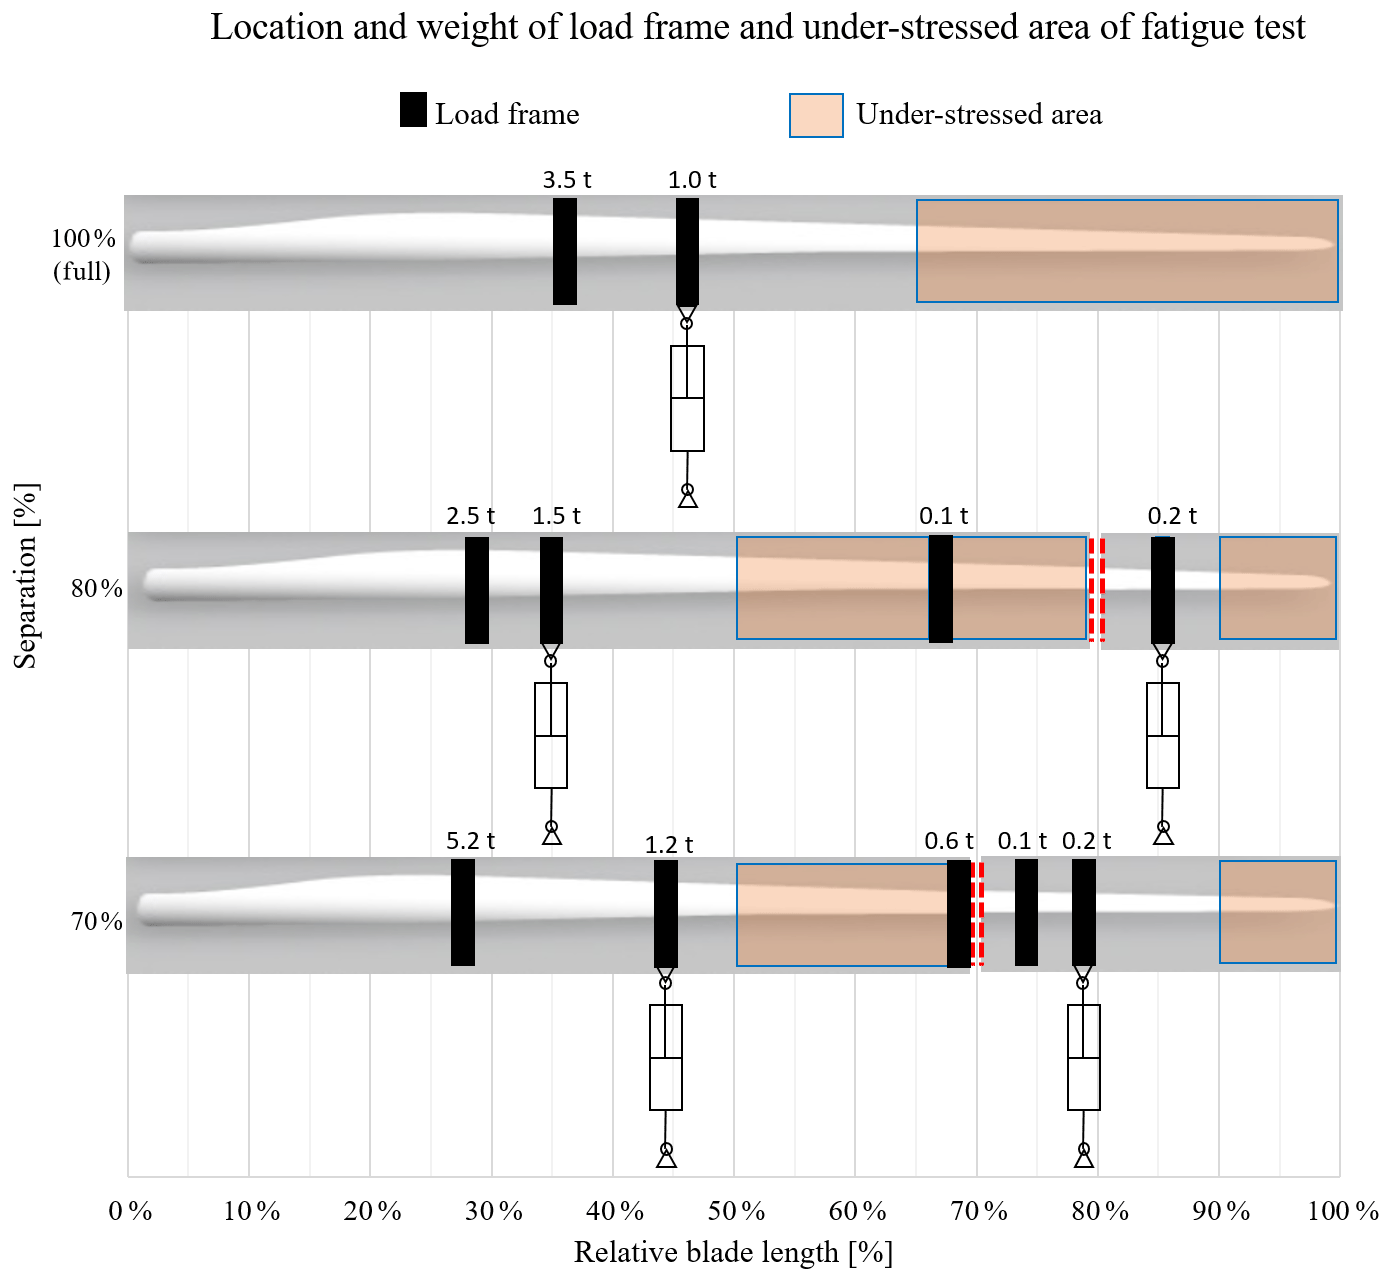
Figure 14Comparison of test setups and under-stressed areas (60 m blade, lead-lag fatigue test).
In the experimental test of a full-length blade, where all areas are tested simultaneously and at the same frequency, the possibility of sufficiently examining the total blade area is pretty much limited to 65 % of the blade length as shown in Fig. 13. The fatigue test of the tip segment, however, covers the area from separation point to 90 % of blade length sufficiently. If special interest between 50 % and 70 % is required, a significantly greater manufacturing outlay like overlapping segments needs to be performed at the separation point of the root segment, or a blade dummy representing mass and moment inertia of the tip segment could be fixed to the free end of root section as shown in Fig. 6.
Figure 14 shows the visual comparison of the lead-lag fatigue test setups and under-stressed areas from the experimental full-length test with the optimized segment test setup obtained from simulation results. The under-stressed areas are not certifiable because the target moments were not achieved during fatigue testing. While it is not possible to conclude that the overall area of certifiable regions is significantly increased in the segment blade test, this methodology is able to target regions in a larger range of locations along the blade. Depending on the specific blade design and location of critical regions, this could pose a significant advantage in the certification process.
This paper proposed a novel segment test methodology for wind turbine rotor blades which mainly aims at improving the efficiency of the fatigue test as a future test method at Fraunhofer IWES. From this study, a blade division through the separation point at 60 % of the blade length or further toward blade root was not feasible without additional structures such as cantilever structure or stiffness elements, since the test quality is poor due to its high overloads. However, the proposed segment test methodology showed the reduction of the total fatigue test time incorporating both flap and lead-lag tests by up to 72 % and 65 % for the 60 m blade and 90 m blade, respectively. A further reduction to 43 % and 52 % with an additional stiffness element in the case of the 70 % segment blade fatigue test compared to full-length fatigue test duration (100 %) was also shown.
The study also showed lower overloads in the areas of interest, compared to the full-length test. Furthermore, it was demonstrated that sufficient loading of the tip section can be achieved. It has to be noted that the optimization goal was to minimize execution time. Using the same numerical models, it is also possible to optimize the setup with respect to minimizing the overload. While this may lead to an increase in test time, it is likely that a larger certifiable region or lower overloads are obtainable.
In conclusion, this study indicates that segment testing is an effective approach to reduce the duration and increase the test quality of full-scale blade tests – increasingly so for larger turbine blades.
The data that support the finding of this research are not publicly available due to confidentiality constraints.
KH compiled the literature review, performed numerical simulations, post-processed the data, and wrote the bulk of the paper. MB helped formulate the ideas in the regular discussions. DM performed numeric simulations and supported the optimization analysis. SC participated in structuring and review of the paper.
The authors declare that they have no conflict of interest.
This article is part of the special issue “Wind Energy Science Conference 2019”. It is a result of the Wind Energy Science Conference 2019, Cork, Ireland, 17–20 June 2019.
We acknowledge the support of the Future Concept Fatigue Strength of Rotor Blades project granted by the German Federal Ministry for Economic Affairs and Energy (BMWi) (0325939) and the Senator for Health, Environment and Consumer Protection of the Free Hanseatic City of Bremen within ERDF Programme Bremen 2014–2020 (201/PF_IWES_Zukunfskonzept_Betriebsfestigkeit_Rotorblatter_Phase I).
This research has been supported by the Bundesministerium für Wirtschaft und Energie (grant no. 0325939).
This paper was edited by Michael Muskulus and reviewed by two anonymous referees.
Al-Khudairi, Othman, Hadavinia, H., Little, C., Gillmore G., Greaves, P., and Dyer, K.: Full-Scale Fatigue Testing of a Wind Turbine Blade in Flapwise Direction and Examining the Effect of Crack Propagation on the Blade Performance, MDPI, Materials, 10, 1152, https://doi.org/10.3390/ma10101152, 2017.
ANSYS Inc.: ANSYS Workbench 18.1, Release18.1, available at: http://www.ansys.com (last access: 15 October 2019), 2018.
Brondsted, P. and Nijssen, R. P.: Advances in wind turbine blade design and materials, Woodhead Publishing Series in Energy, UK, 2013.
DNV-GL: DNVGL-ST-0376 – Rotor Blades for Wind Turbines, DNV GL, December 2015.
Fraunhofer IEE: Windenergie Report Deutschland 2017, Fraunhofer Verlag, Kassel, Germany, 2017.
Gasch, R., Knothe, K., and Liebich, R.: Strukturdynamik: Discrete Systems und Kontinua, 2nd Eds., Springer Vieweg, Germany, Kapitel 9, 355–386, 2012.
Gere, J. M. and Goodno, B. J.: Mechanics of Materials, 8th Eds., Cengage Learning, chap. 4, 387–399, 2013.
Griffin, D.: Blade System Design Studies Volume I-Composite Technologies for Large Wind Turbine Blades, Sandia National Laboratories, USA, 2002.
IEC: IEC 61400-23 – Wind Turbines Part 23: Full-scale Structural Testing of Rotor Blades, International Electrotechnical Commission, Geneva, Switzerland, 2014.
Peeters, M., Santo, G., Degroote, J., and Paepegem, W. V.: The Concept of Segmented Wind Turbine Blades: A Review, MDPI, Energies, 10, 1112, https://doi.org/10.3390/en10081112, 2017.
Post, N.: Fatigue Test Design: Scenarios for Biaxial Fatigue Testing of a 60-Meter Wind Turbine Blade, NREL, USA, 2016.
Rosemeier, M., Basters, G., and Antoniou, A.: Benefits of subcomponent over full-scale blade testing elaborated on a trailing-edge bond line design validation, Wind Energ. Sci., 3, 163–172, https://doi.org/10.5194/wes-3-163-2018, 2018.
Skelton, K.: Discussion paper on managing composite blade waster, WindEurope, Wind Europe, Belgium, https://doi.org/10.13140/rg.2.2.22748.90248, March 2017.
Spera, D. A.: Wind Turbine Technology-Fundamental concepts of wind turbine engineering, 2nd Eds., ASME Press, USA, chap. 12, 709–713, 2009.
White, D.: New Method for Dual-Axis Fatigue Testing of Large Wind Turbine Blades Using Resonance Excitation and Spectral Loading, NREL, USA, 2004.
Wingerde, A. V., Sayer, F., and Putnam, E.: Testing for Certification of Rotor Blades – Today and in the Future, Brazil Wind Power 2015 Conference and Exhibition, Rio De Janeiro, Brazil, 1–3 September 2015.