the Creative Commons Attribution 4.0 License.
the Creative Commons Attribution 4.0 License.
 | 03 Jul 2020
Exploitation of the far-offshore wind energy resource by fleets of energy ships – Part 1: Energy ship design and performance
Aurélien Babarit
Gaël Clodic
Simon Delvoye
Jean-Christophe Gilloteaux
This paper deals with a new concept for the conversion of far-offshore wind energy into sustainable fuel. It relies on autonomously sailing energy ships and manned support tankers. Energy ships are wind-propelled. They generate electricity using water turbines attached underneath their hull. Since energy ships are not grid-connected, they include onboard power-to-X plants for storage of the produced energy. In the present work, the energy vector is methanol.
The aim of the paper is to propose an energy ship design and to provide an estimate for its energy performance as function of the wind conditions. The energy performance assessment is based on a numerical model which is described in the paper. Results show that the wind energy-to-methanol (chemical energy) conversion efficiency is 24 % and that such an energy ship deployed in the North Atlantic Ocean could produce approximately 5 GWh per annum of chemical energy (900 t of methanol per annum).
- Article
(1889 KB) - Full-text XML
- Companion paper
- BibTeX
- EndNote


To date, fuels such as oil, natural gas and coal account for approximately 80 % of primary energy consumption globally (BP, 2018). Although this share is expected to decrease with the development of renewable power generation and the electrification of the global economy, some sectors may be difficult to electrify (e.g., aviation, freight). Therefore, if a global temperature change of less than 2 ∘C – as set out in the Paris Agreement (UNFCCC, 2015) – is to be achieved, there is a critical need to develop low-carbon alternatives to fossil fuels.
A promising option is the production of sustainable fuel from renewable power generation sources, through power-to-gas (PtG) and power-to-liquid (PtL) processes (together PtX processes) (Gotz et al., 2016). Several demonstration projects have shown the technical feasibility of such approaches, e.g., Jupiter 1000 in France, BMWi in Germany, SOLETAIR in Finland (Vazquez et al., 2018) and the George Olah PtL plant in Iceland (Marlin et al., 2018), among others. However, the main challenge faced by PtX products from renewable-energy-based plants is cost competitiveness. Key economic drivers are the cost of input electricity to the PtX plant and the PtX plant capacity factor (Fasihi et al., 2016; Ioannou and Brennan, 2019). Unfortunately, there is currently no commercial renewable power generation technology which can combine the large-scale deployment potential, low cost of generated electricity and high capacity factor which are required for the large-scale synthesis of competitive sustainable fuel from PtX processes.
The conversion of far-offshore wind energy resources into sustainable fuel may address this challenge. Indeed, the deployment potential is enormous as over 70 % of the surface of our planet is covered by oceans. Moreover, high capacity factors could be achieved as the wind energy resource is the strongest and the steadiest in the open ocean (Liu et al., 2008). In this respect, it has already been shown that capacity factors greater than 80 % could be obtained for floating grid-connected stationary offshore wind turbines deployed in far offshore (Dupont et al., 2018; Abd-Jamil et al., 2019). However, it is not possible to deploy such turbines because grid-connection cost, moorings and installation cost, and maintenance increase dramatically as distance to shore and water depth increase (Offshore Wind Programme Board, 2016). Therefore, alternative concepts are required.
The possibilities include the sailing wind turbine concept (Vidal, 1983) and the energy ship concept (Platzer and Sarigul-Klijn, 2009). The sailing wind turbine concept consists in a floating barge equipped with a wind turbine and propellers. It is neither moored nor grid-connected. The position is controlled via the action of the propellers. The energy ship is a ship propelled by the wind and which generates electricity by means of a water turbine attached underneath its hull. In both concepts, the generated electricity is stored on board, which can be achieved by its conversion into fuel using an onboard power-to-gas (e.g., hydrogen) or power-to-liquid plant (e.g., methanol).
This study focuses on the energy ship concept. Despite the fact that the initial idea was patented as early as 1982 (Salomon, 1982), it did not receive much attention until the end of the first decade of the 2000s. Thus, there has been only a limited number of energy ship proposals to date. They include Meller (2006), Gizara (2007), Kim and Park (2010), Babarit and Gilloteaux (2017), and Ouchi and Henzie (2017). They implement quite diverse technologies for the subsystems (sails, water turbines, hull shapes, etc.) as can be seen in Fig. 1.
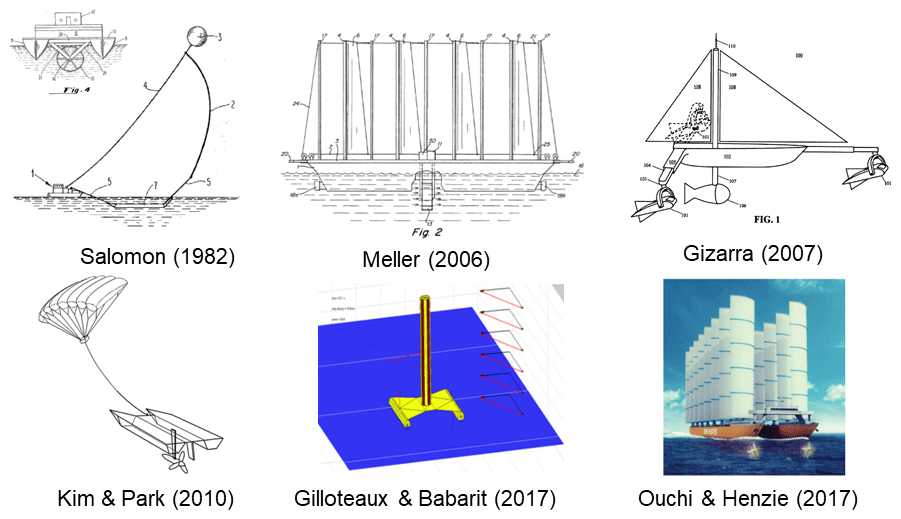
Figure 1Pictures of technology proposals of energy ships.
In 2009, Platzer and Sarigul-Klijn were the first to describe this concept in a scientific publication (Platzer and Sarigul-Klijn, 2009), proposing it as a way to increase hydrokinetic energy sources for water turbines. The following year, Kim and Park presented a concept that included kite sails flown at high altitude (1500 m) for wind propulsion, a catamaran for the hull, and hydrogen or methanol for the energy vector (Kim and Park, 2010). Using a velocity prediction program (VPP), they showed that megawatt-scale power production is possible with ships of dimensions similar to that of typical commercial ships. They also showed that the energy potential is considerable and could cover several times the global energy demand. In the following years, Platzer et al. showed that megawatt-scale power production is also possible with ships fitted with conventional sails exploiting low-altitude wind energy (Platzer et al., 2013, 2014).
With respect to energy storage aboard energy ships, the use of batteries has been proposed by Platzer and Sarigul-Klijn (2015). However, high gravimetric and high volumetric energy densities are key requirements for high-performance energy ships in order to minimize water resistance (Pelz et al., 2016; Gilloteaux and Babarit, 2017). Thus, the conversion of the produced electricity into fuel through PtG or PtL processes is the most promising solution (Chen et al., 2009), which is why hydrogen produced from water electrolysis has been chosen for the energy vector in most energy ship proposals (Platzer and Sarigul-Klijn, 2009; Salomon, 1982; Kim and Park, 2010; Gilloteaux and Babarit, 2017; Ouchi and Henzie, 2017).
However, low volumetric energy density at ambient temperature and pressure conditions is a well-known challenge for hydrogen storage and transportation. In Babarit et al. (2018), the energy cost and economic cost of hydrogen storage and transportation were estimated for far-offshore and land-based scenarios. It was found that energy losses directly related to hydrogen production would be on the order of 50 % of the generated energy and that storage and transportation costs would account for nearly half of the cost of the fuel. In contrast, the other possible energy vector options (synthetic natural gas (SNG), methanol, or Fischer–Tropsch fuel (FT fuel), Graves et al., 2011; and ammonia, Morgan, 2013) are much simpler to store, transport and distribute (particularly methanol and FT fuel, as they are liquid for standard conditions of temperature and pressure). Moreover, they can be incorporated into existing infrastructure with little to no modification. The drawback is that they each require the supply of an additional feedstock (carbon dioxide or nitrogen depending on the energy vector) and an additional conversion step in the energy conversion process. The additional conversion step decreases the overall energy efficiency and increases the size and complexity of the PtX plant. In a previous study (Babarit et al., 2019), we investigated whether these drawbacks could be compensated for by the easier storage, transportation and distribution of the products, and we found that methanol is the most promising solution; hence it is retained as the energy vector in this study.
It can be noted that Kim and Park were the first to suggest methanol production for energy ships (Kim and Park, 2010). However, their design is based on large kite sails flown at high altitude, a technology which does not exist as of today. In contrast, we propose using Flettner rotors, a technology which is commercially available (Norsepower, 2019), which is characterized by high aerodynamic performance (lift coefficients over 12 have been measured in experiments; Charrier, 1979), easy to control (the lift depends on only one control variable which is the rotor's rotational velocity) and inherently fail-safe (the aerodynamic loads are minimal when the rotors are stopped such as in the case of failure).
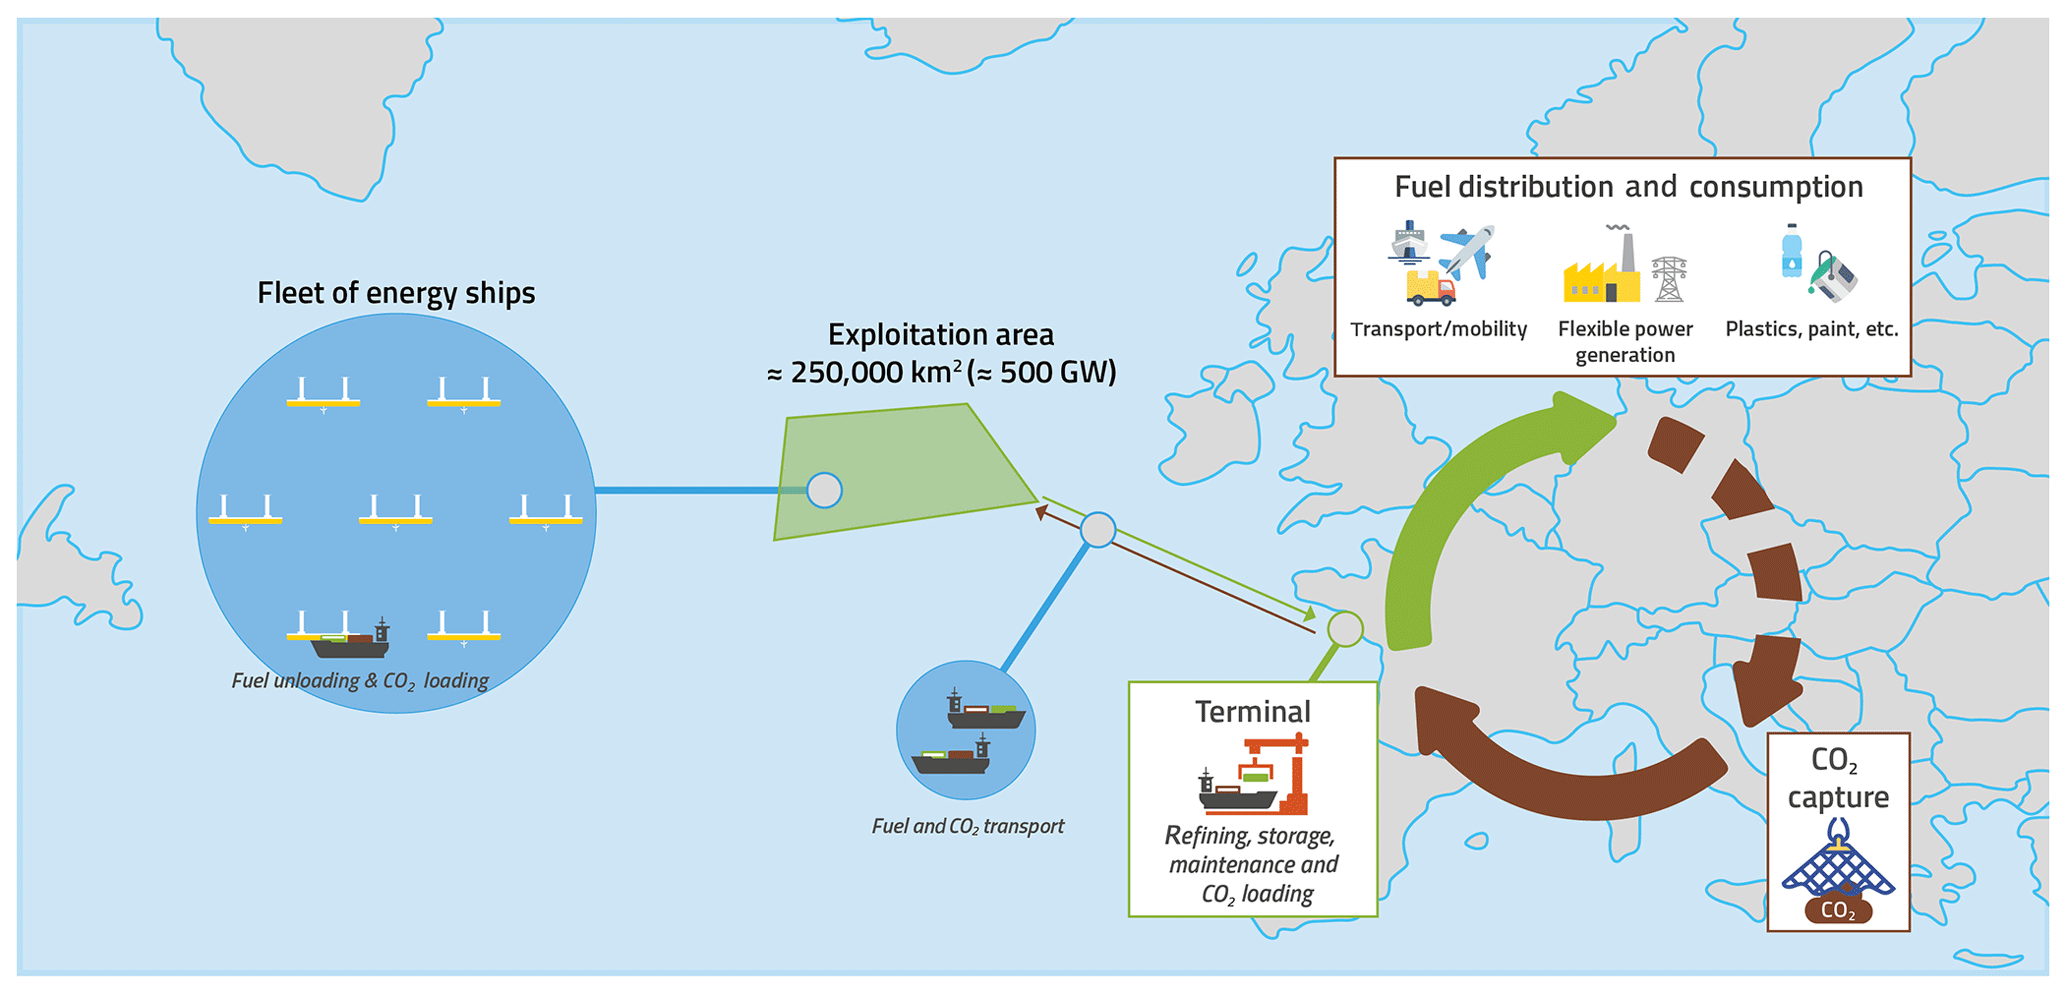
Figure 2The concept of sustainable methanol production from far-offshore wind energy by FARWIND energy systems.
A second difference with the works of Kim and Park is that we propose that the energy ships are deployed in fleets in order to produce large volumes of fuel and that the produced methanol is collected by tankers which are also used to supply the energy ships with the necessary feedstock (carbon dioxide) for power-to-methanol conversion; see Fig. 2. We call this energy system “FARWIND”. Obviously, the CO2 supply source must be sustainable for that system to produce sustainable methanol. Therefore, it must be captured directly or indirectly from the atmosphere. Today, there are several possible options including direct air capture (Keith et al., 2018), CO2 capture from flue gases from biomass or FARWIND-produced methanol combustion, and CO2 from biogas upgrading (Li et al., 2017; Irlam, 2017).
The overall aim of the present study is to investigate the energy and economic performance of the proposed FARWIND energy system. The present paper deals with the energy ship design and its energy performance. The economic performance of the whole system is analyzed in the companion to this paper (Babarit et al., 2020).
The remainder of this paper is organized as follows. In Sect. 2, the energy conversion process from wind energy to methanol aboard an energy ship is described, and mathematical models for each conversion stage are proposed. The models are quite similar to those proposed in Kim and Park (2010), Platzer et al. (2013), Pelz et al. (2016), Gilloteaux and Babarit (2017), and Ouchi and Henzie (2017). However, fundamental results regarding the effect of the water turbine on the energy conversion efficiency are highlighted which were not in previous studies. In Sect. 3, the specifications of the proposed energy ship are presented. Its energy performance and efficiency are discussed in Sect. 4. Section 5 is the conclusion of the paper.
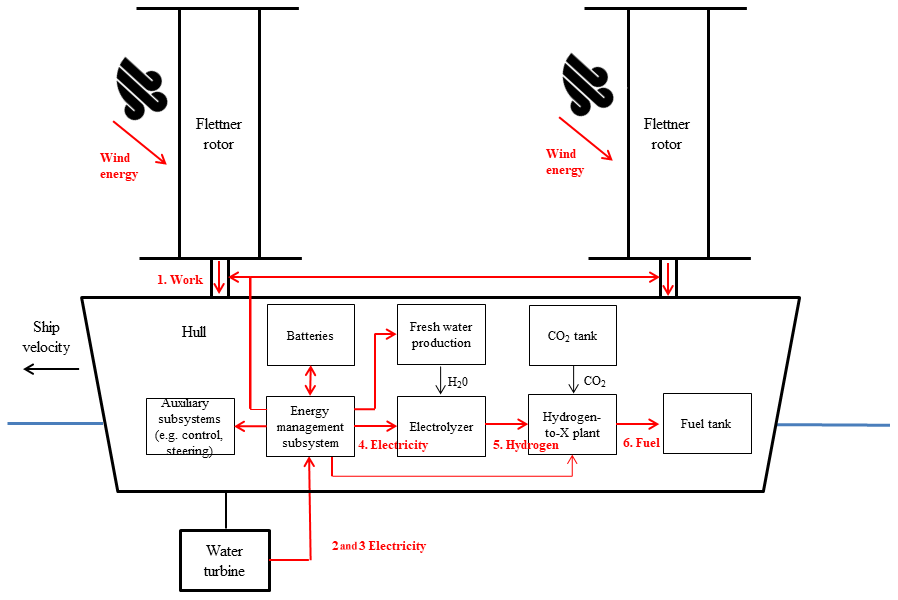
Figure 3Description of the energy flows in a methanol-producing energy ship. Note that in this schematic, the wind propulsion subsystem is Flettner rotors. However, other sail concepts can be used.
2.1 General description of the energy flow in a methanol-producing energy ship
Figure 3 shows a description of the wind-energy-to-methanol conversion process in a methanol-producing energy ship. It includes seven elementary conversion stages:
-
conversion of wind energy into work by the wind propulsion subsystem (Flettner rotors in the present study; see Sect. 3.1);
-
conversion of the work into mechanical energy by the rotor of the water turbine;
-
conversion of the mechanical energy at the shaft of the water turbine into electricity;
-
management of the electricity aboard the energy ship (some of the produced electricity will be used to power auxiliary subsystems that are required for the operation of the energy ship, e.g., the control and steering subsystem);
-
fresh water production for hydrogen synthesis;
-
conversion of electricity into hydrogen by the electrolyzer;
-
conversion of hydrogen into methanol by the methanol synthesis plant.
The first three elementary conversion stages, allowing wind power to be converted into electrical power, are strongly coupled (see next section) and are collectively defined as the wind-to-electricity subsystem.
The last three elementary stages, corresponding to the conversion of electric power into methanol, are the power-to-methanol subsystem. This includes the electrolyzer, the methanol synthesis unit and a freshwater production unit, which is necessary to supply water to the electrolyzer.
The third key subsystem, corresponding to the fourth elementary conversion stage, is the energy management subsystem. Albeit this is not strictly speaking a conversion stage, this stage is pivotal to articulate the two other stages.
In the following, models are presented for these three subsystems.
2.2 Model for the wind-to-electricity subsystem
The first conversion stage is the conversion of wind energy into propulsive work by the wind propulsion subsystem. The corresponding propulsive power, P1, is equal to the product of the thrust force T (the component of the aerodynamic force along the axis of the ship) and the ship forward velocity U:
The drift velocity (the component of the ship velocity perpendicular to the axis of the ship) is neglected.
The thrust force can be estimated from the wind speed according to
where ρa is the air density, As is the sail area (projected area), V is the apparent wind speed, α is the apparent wind angle, and CL and CD are the lift and drag coefficients of the rig.
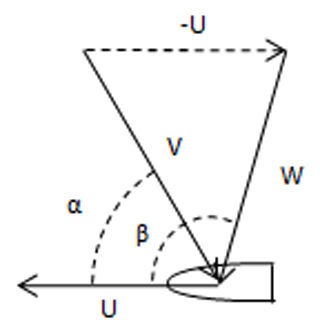
The apparent wind speed and the apparent wind angle derive from the true wind speed W and the true wind angle β (see Fig. 4) as follows:
The second conversion stage is the conversion of a part of the propulsive power into mechanical power PT by the rotor of the water turbine. According to momentum theory (Manwell et al., 2009):
where is the axial induction factor and RT is the thrust force generated by the turbine. It can be written
where ρw is the water density and AT is the turbine disk area.
In order to understand the energy loss in this conversion stage, let us consider the forces acting on the ship. In addition to the force generated by the turbine, the other forces applied to the ship are the thrust force from the wind propulsion subsystem and the water resistance Rw. The water resistance corresponds to the effect of the water resisting the forward motion of the ship (hull resistance). According to ITTC (2014), the water resistance Rw can be written
where Cf is the frictional resistance coefficient, CR is the residuary resistance coefficient, k is the form coefficient and Av is the wetted area of the ship's hull. Since the form coefficient k is usually small, it is neglected in this study. The frictional resistance coefficient can be estimated using the ITTC-1957 formula
where Re is the Reynolds number.
The residuary resistance coefficient can be calculated using dedicated software; in this study, REVA was used (Delhommeau and Maisonneuve, 1987).
In steady state, the thrust force is equal to the turbine force plus the water resistance:
Using Eqs. (2), (3), (5) and (6) in Eq. (8), it can be shown that
This last equation gives a relation between the ship velocity U and power absorption by the water turbine (through the axial induction factor a). In other words, the ship velocity depends on how much power is absorbed by the turbine.
Combining Eqs. (4) and (5), the power absorbed by the water turbine can be written in the classical form:
The fundamental difference between energy ships and fixed wind or marine current turbines is that the velocity U depends on the axial induction factor. Thus, the optimal induction factor depends on the particulars of the energy ship design. Figure 5 shows an example of the ship velocity and absorbed power as a function of the induction factor. The true wind speed is 10 m s−1 and the true wind angle is 90∘. For this example, one can see in Fig. 5 that the optimal induction factor is approximately 0.04, which is much smaller than the optimal induction factor for fixed turbines of , given by Betz theory. To our knowledge, Pelz et al. (2016) were the first to point out that this aspect is a key optimization parameter of the energy performance of energy ships. In contrast, this was not realized by Kim and Park (Kim and Park, 2010; Kim and Park, 2014), who assumed in their studies. This is an important point, as it can lead to the underestimation of the absorbed power (as can be seen in Fig. 5 in which the absorbed power for is more than 2 times less than that for the optimal induction factor).
Let us define the energy efficiency of the second energy conversion stage (conversion of propulsive power into mechanical power on the shaft of the water turbine) by
Recalling that P1=TU and using Eqs. (4), (5) and (7) in (10), one can show
which can be rewritten
Thus, using Eqs. (4), (5) and (7), one can show
This equation shows that the energy loss in the second conversion stage has two origins. The first is obviously the resistance of water to the forward motion of the ship. The second – less obvious – is proportional to the turbine force times the axial induction factor. This can be explained by the fact that the water turbine not only converts wind energy into mechanical energy, but also transfers some of that energy to the water that it passes through. Indeed, in contrast to a wind turbine or a marine current turbine, the water turbine rotates in water that is initially at rest. Once the ship has passed, some of that water has been set in motion. The second energy loss in Eq. (14) corresponds to the kinetic energy transferred to that body of water.
In practice, it may be desirable to maximize the energy efficiency η2. Using Eq. (13) and elementary algebra, one can show that η2 increases monotonically with increasing water turbine area AT and that
Thus, the efficiency of conversion of wind energy into mechanical energy by energy ships is limited to . Maximization of the energy efficiency of this conversion stage requires the water turbine area to be large and the axial induction factor to be small. In particular, one can see that setting would limit the efficiency to less than 67 %.
Figure 6 shows an example of the absorbed power and efficiency η2 as a function of the water turbine diameter. One can see that, as expected, the efficiency increases with increasing turbine diameter. However, the rate of increase in efficiency diminishes with increasing turbine diameter, which is worth noting as turbine cost will also increase with increasing diameter. Therefore, despite theory indicating that a water turbine as large as possible should be used, turbines of practical dimensions may be used with little efficiency loss.
The third conversion stage is the conversion of the mechanical energy extracted by the rotor of the water turbine into electricity by a generator. The energy efficiency of this conversion stage is denoted η3. Energy losses in this stage include friction and drag on the blades of the turbine, mechanical losses, generator losses, etc.. This efficiency is approximately 80 % for wind turbines (Burton et al., 2001). It is assumed that a similar efficiency can be achieved for the water turbines of energy ships.
The electricity generated by the water turbine Pe as a function of the true wind speed and wind direction can be estimated using
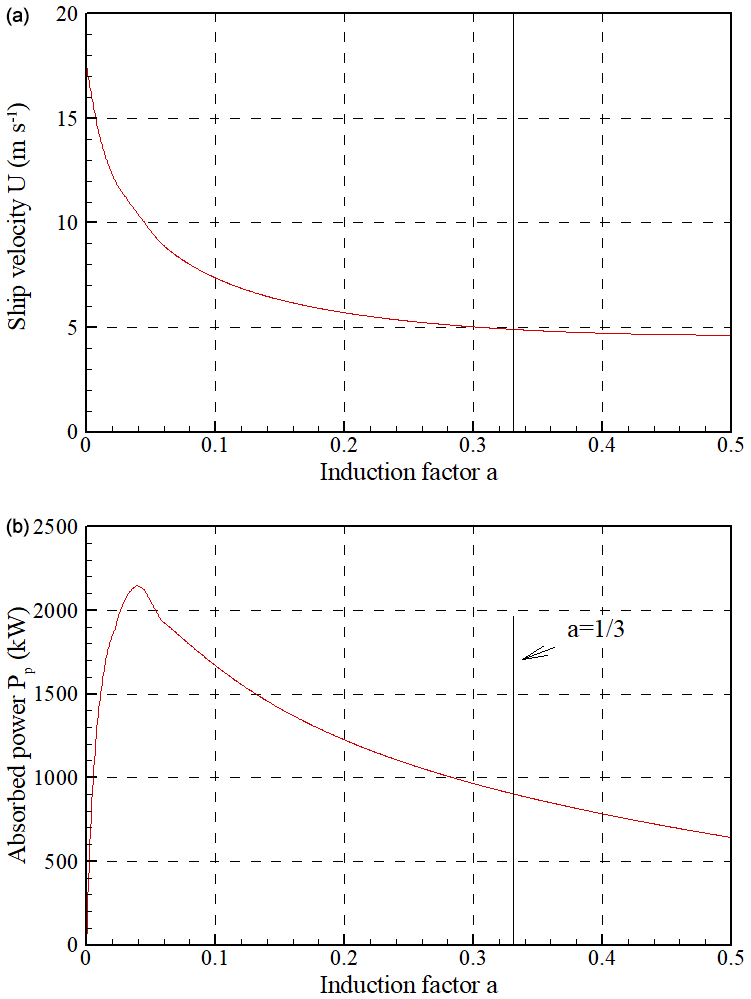
Figure 5Ship velocity (a) and absorbed power (b) as function of the induction factor. The true wind speed is 10 m s−1 and the true wind angle is 90∘. The wind propulsion subsystems are Flettner rotors. The spin ratio is 3. Constraints on maximum rotational velocity, maximal thrust and cut-out speed are not taken into account in this example.
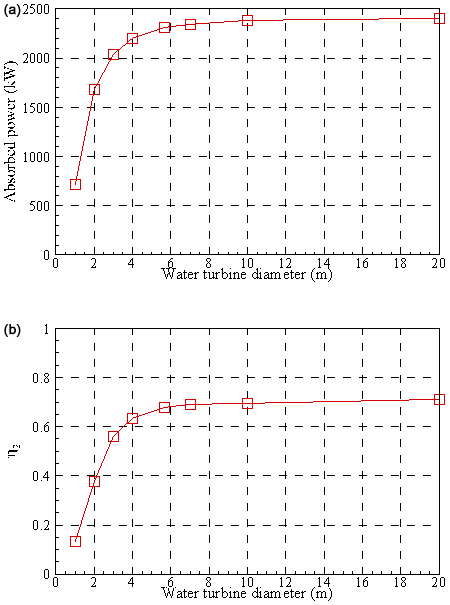
Figure 6Absorbed power (a) and propulsion power to water turbine mechanical power (b) as function of the water turbine diameter. The true wind speed is 10 m s−1 and the true wind angle is 90∘. The wind propulsion subsystems are Flettner rotors. The spin ratio is 3. Practical constraints on maximum rotational velocity, maximal thrust and cut-out speed are not taken into account in this example.
2.3 Model for the energy management subsystem
The energy management subsystem is an important subsystem in an energy ship. The main function of this system is to supply energy to all auxiliary subsystems that are required for their operation, for example the control and steering subsystem or navigation lights. It also supplies energy for the control and spinning of the Flettner rotors.
The energy management subsystem is expected to include batteries, which will be used to maintain maneuvering and communication capabilities in the absence of wind. Thus, during power production, it is expected that a small part of that power will be used for charging the batteries.
The efficiency η4 of this stage is defined as the ratio of the remaining electricity available to feed the power-to-methanol plant to the electricity produced by the generator:
where Paux is the power consumed by auxiliary subsystems.
2.4 Model for the power-to-methanol subsystem
The power-to-methanol subsystem includes two main stages: the conversion of electricity into hydrogen by an electrolyzer and the conversion of hydrogen and carbon dioxide into methanol.
2.4.1 Electrolyzer
Using electricity, water can be separated into hydrogen and oxygen:
Electrolysis technologies include alkaline electrolysis (AEL), polymer electrolyte membrane (PEM) electrolysis and solid oxide electrolysis (SOEC). Of these, AEL is the most mature technology (Gotz et al., 2016). AEL electrolyzers can last for 30 to 40 years. Their design capacity is in the megawatt range. They can be operated between 20 % and 100 % of their design capacity, and capacity can be varied from 20 % to 100 % in approximately 10 min (Agersted, 2014). Their use in the offshore environment was studied in the H2OCEAN European project (Agersted, 2014), which concluded that it is feasible. Thus, the AEL technology has been retained for the FARWINDERs.
According to Gotz et al. (2016), the power consumption of AEL electrolyzers is on the order of 55 kWh kg−1 of produced hydrogen. The corresponding energy efficiency η5 is 60 %, based on the lower heating value of hydrogen (approx. 33 kWh kg−1). The water consumption is 9 kg of fresh water per kilogram of hydrogen.
It can be noted that performance of water electrolysis technology is expected to improve in the coming decade. According to Schmidt et al. (2017), the energy efficiency of AEL technology may increase up to 67 %, and PEM technology may reach even greater efficiencies while achieving a similar lifetime to AEL technology. Moreover, despite the fact that PEM would still be more expensive than AEL, it has been shown that the advantage in efficiency may lead to better overall financial performance (McDonagh et al., 2018). Therefore, the efficiency data used in this paper can be considered conservative, and PEM electrolyzers may eventually be a better option than AEL for the FARWINDERs.
2.4.2 Hydrogen-to-methanol plant
In the hydrogen-to-methanol plant, hydrogen is combined with CO2 in order to produce methanol (and water as a by-product).
In practice, there are two processes available for methanol synthesis using CO2 and hydrogen as the reactants (Anicic et al., 2014; Connolly et al., 2014): two-step methanol synthesis (CAMERE process) and direct methanol synthesis (CO2 hydrogenation). The first step in the two-step process is the production of syngas (a mixture of carbon monoxide, carbon dioxide and hydrogen) through the reverse water–gas shift reaction and water separation. The syngas is subsequently converted into methanol. Note that, at present, methanol is produced industrially at a large scale from syngas (Machado et al., 2014) obtained from methane through steam reforming. In contrast, in the direct methanol synthesis process, the methanol is obtained directly from CO2 and H2 via the reaction
The direct process is currently used in the George Olah power-to-methanol plant, which can produce 4000 t per annum (Marlin et al., 2018). The process was modeled in Machado et al. (2014). The temperature is 245 ∘C and pressure is 80 bar. Results show that the power consumption is 0.93 kWh kg−1 of methanol, and CO2 consumption is approximately 1.38 kg kg−1 of methanol. According to Marlin et al. (2018) and Anicic et al. (2014), the direct methanol synthesis process is more energy-efficient than the two-step process. Moreover, according to Anicic et al. (2014), the production cost is comparable in the two processes. Therefore, the direct process is selected for the power-to-methanol plant of the FARWINDERs.
The efficiency η6 of this last conversion stage is the ratio of the lower heating value of the produced methanol (5.54 ) to the sum of the lower heating value of the input hydrogen (6.19 ) and the power consumption (0.93 ). Thus, the efficiency η6 is 78 %.
2.4.3 Fresh water production
The electrolyzer requires a fresh water supply of 1.69 . This can be provided by desalinating seawater, either through reverse osmosis or through distillation. According to Fasihi et al. (2016), the power consumption is on the order of 3 kWh m−3 using reverse osmosis, corresponding to a negligible 3.4 . Moreover, methanol synthesis also results in water production (see Eq. 18). Thus, a third of the freshwater needs could be met through water recycling. Although freshwater production does not contribute significantly to parasitic energy demand, freshwater recycling may improve system maintenance and lifetime.
2.4.4 Assembled model of the power-to-methanol plant
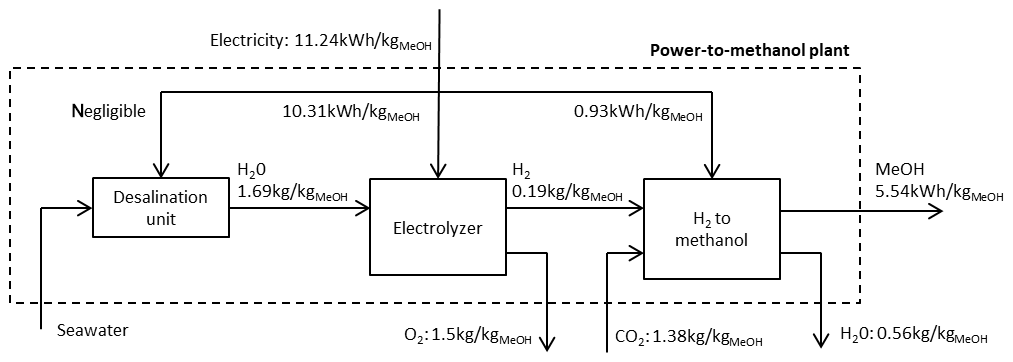
Figure 7 shows the assembled model for the power-to-methanol plant and the process flows. One can see that it takes 1.38 kg of CO2 and 11.24 kWh of electricity to produce 1 kg of methanol. The energy efficiency η7 is thus 49 % (not taking into account the energy required to produce the CO2).
The model presented in Sect. 2 allows the power production of a FARWINDER to be calculated as a function of the wind conditions (true wind angle β, true wind speed W). As explained in that section, the induction factor can be optimized in order to maximize energy production. Moreover, energy production depends on the thrust force of the chosen wind propulsion subsystem (Flettner rotors; see Sect. 3.1), which itself depends on their rotational velocity. Therefore, a numerical program was developed to determine the optimal induction factor and rotational velocity as a function of the FARWINDER design and the wind conditions. A brute-force search was used for the optimization. The constraints on the maximum rotational velocity of the Flettner rotors, maximum thrust on the rotors maximum power of the generator of the water turbine are taken into account through penalization in the optimization loop.
Using this model, we have developed, investigated and optimized a number of energy ship designs over the last 2 years. The details of this process are not reported here for the sake of conciseness.
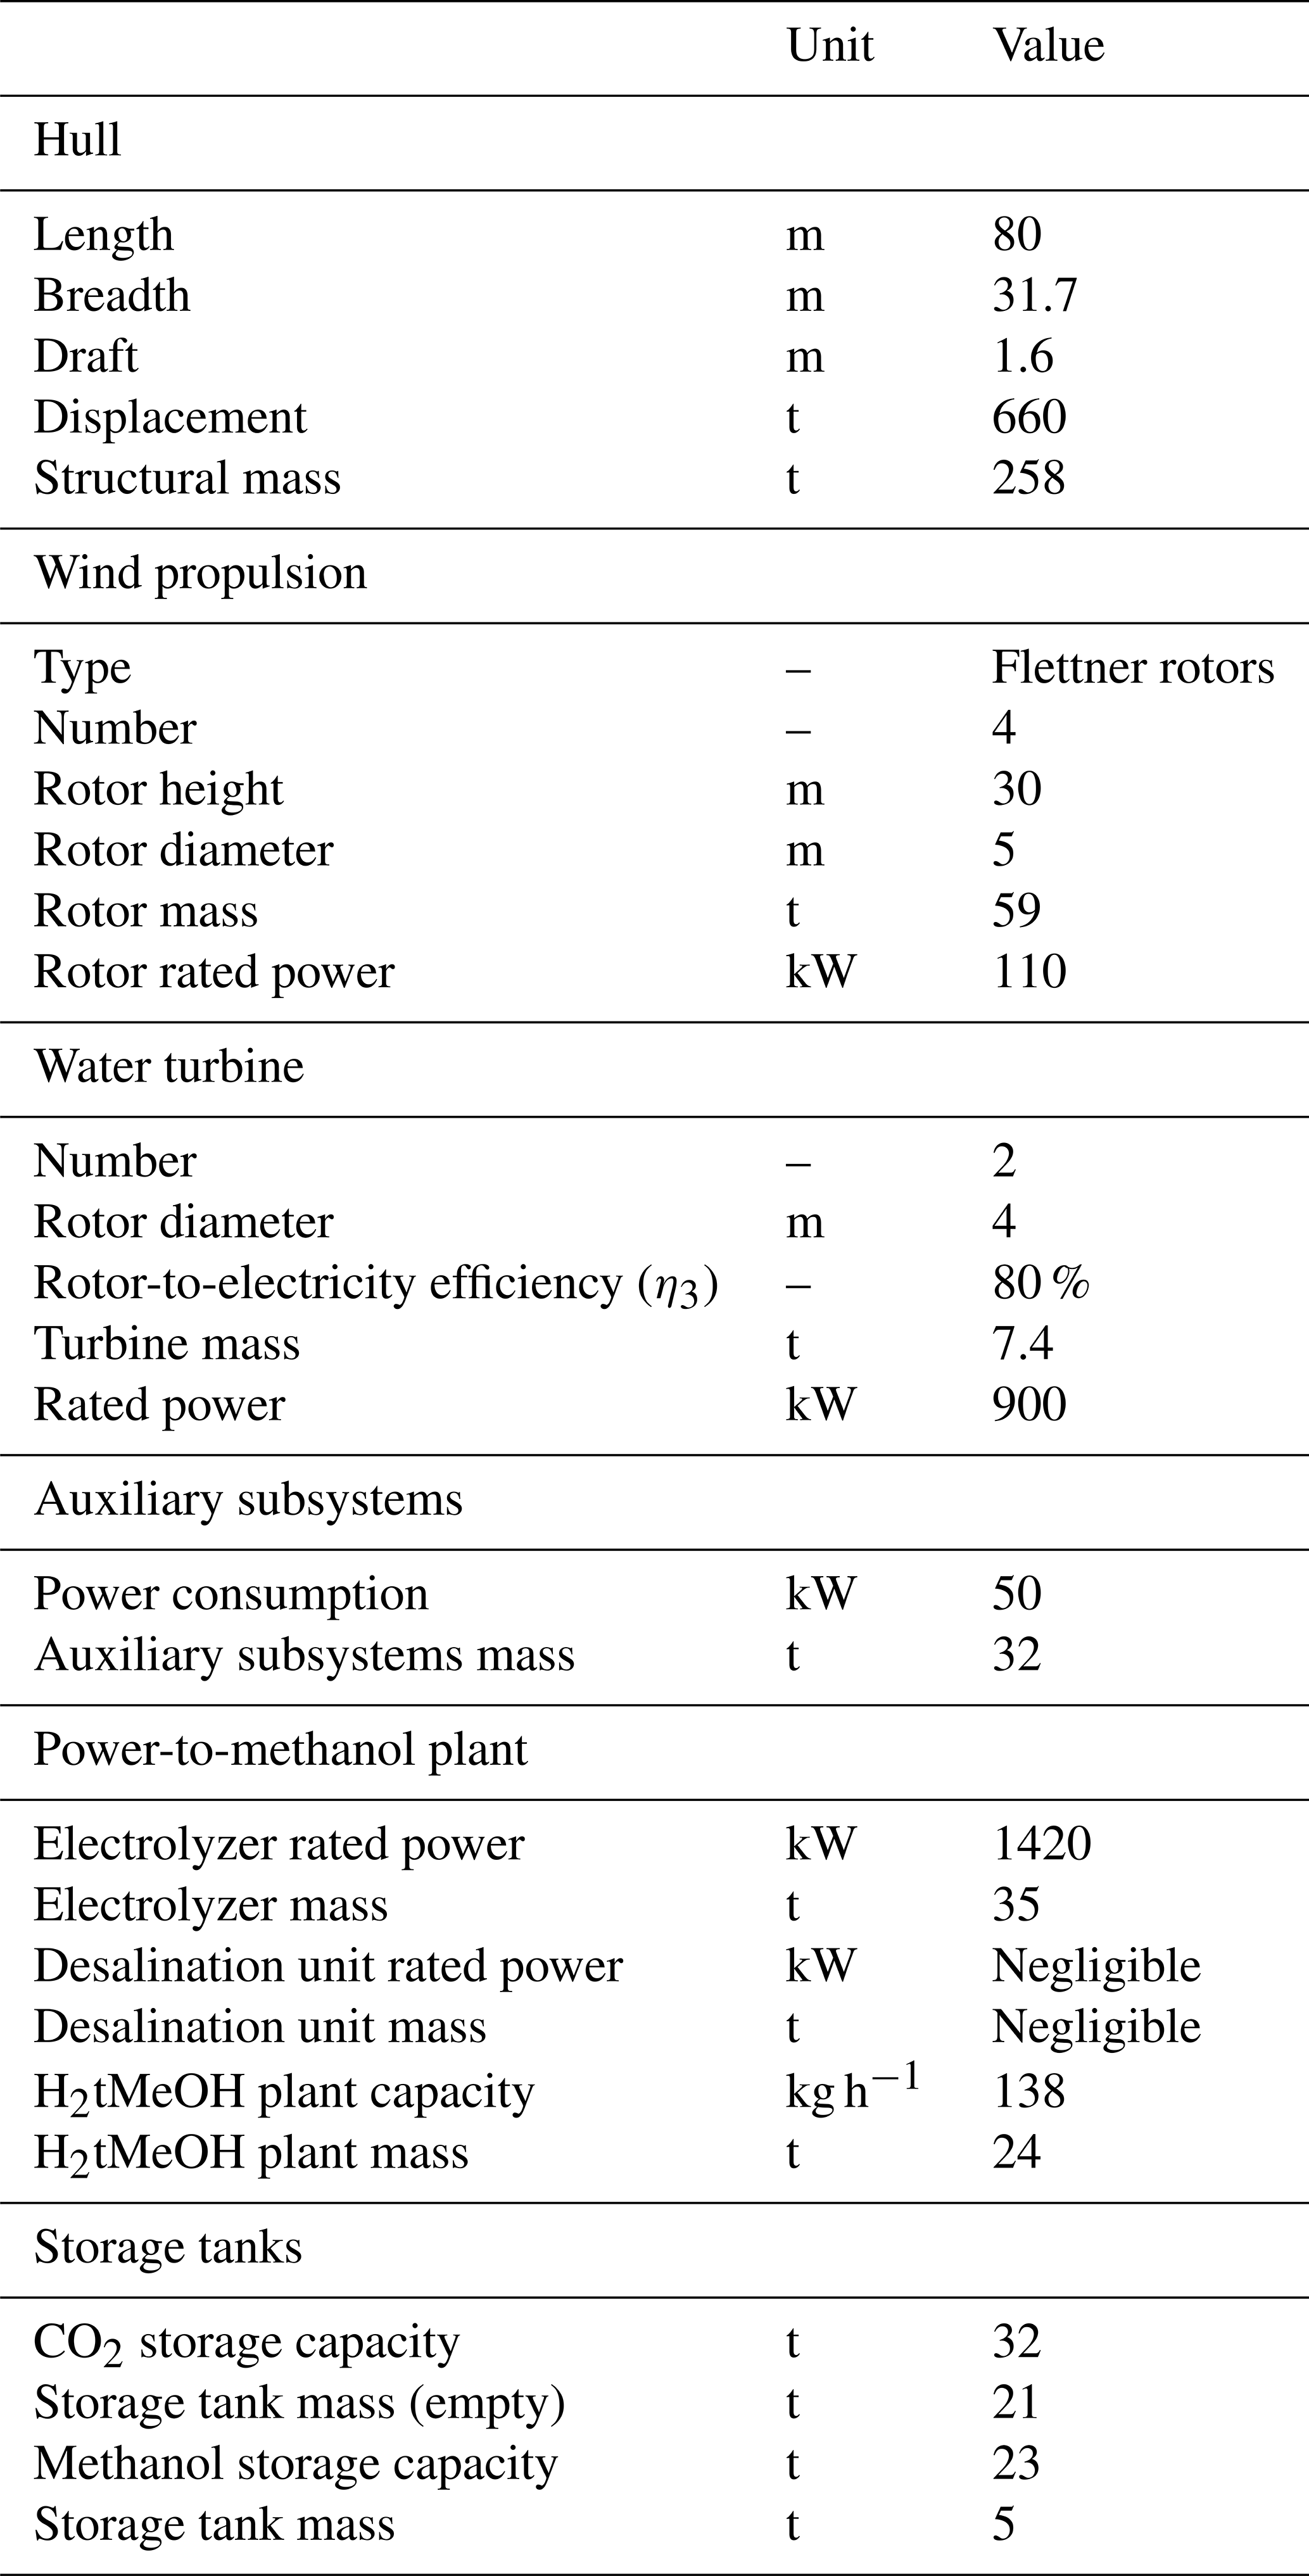
Instead, we focus on the most promising design that has been achieved. It consists of an 80 m long catamaran with four 30 m tall Flettner rotors and two water turbines with rated power of 900 kW each; see Fig. 8. The complete specifications of this design are given in Table 1. The reasons for the design choices are explained in the following sections.

3.1 Wind propulsion subsystem
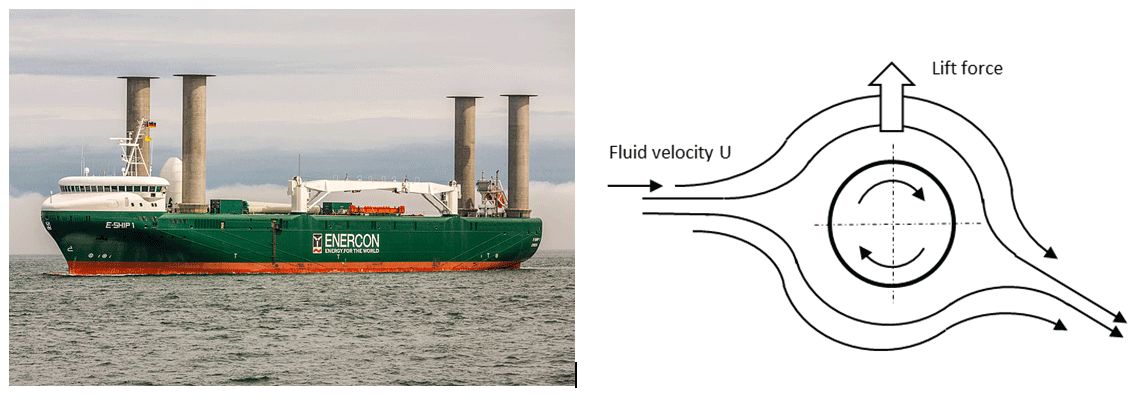
Figure 9On the left, the E-Ship 1 in 2015. It is fitted with four 27 m tall Flettner rotors. Picture by Alan Jamieson. On the right, diagram showing the Magnus effect by which lift is produced by a rotating cylinder.
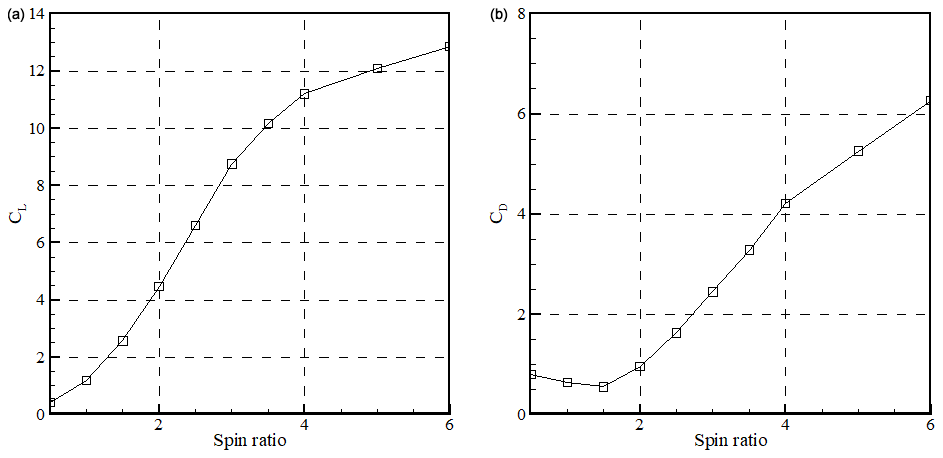
Figure 10Experimental results of Charrier (Charrier, 1979) for the aerodynamic coefficients of a Flettner rotor. Panel (a) shows the lift coefficient. Panel (b) shows the drag coefficient. In the experiments, the rotor was fitted with end disks at both ends. The diameter of the disks was twice the diameter of the rotor. The aspect ratio of the rotor was 5 and the Reynolds number was 13 200.
Flettner rotors were selected for the rigging. A Flettner rotor is a rotating vertical cylinder whose axis is perpendicular to the wind. Due to the Magnus effect, the action of the wind on the cylinder generates a lift force perpendicular to both the wind direction and the axis of the cylinder. Figure 9 shows a picture of an existing wind-assisted propulsion cargo ship, the E-Ship 1, which is fitted with four 27 m tall rotors.
Figure 10 shows the experimental results of Charrier (Charrier, 1979) for the aerodynamic coefficients of a Flettner rotor as function of the spin ratio α (ratio of rotation speed to wind speed). In the experiments, the rotor was fitted with end disks at both ends. The diameter of the disks was twice the diameter of the rotor. The aspect ratio of the rotor was 5 and the Reynolds number was 13 200.
Flettner rotors are commercially available from the company Norsepower (Norsepower, 2019). Their tallest rotor is 30 m, with a diameter of 5 m and weight of 59 t. The maximum thrust is 270 kN and the maximum rotational velocity is 180 rpm. Note that rotors need to be powered to be able to spin, which is a drawback of Flettner rotors. The rated power of the electric motor driving the rotor is 110 kW for the 30 m tall rotor. However, in practice, it has been observed that the average rotor's power consumption is significantly less than the rated power (International Wind Ship Association, 2019). In this study, an average power consumption of 40 kW has been used following advice from Norsepower (Jukka Kuuskoski, personal communication, 2019).
3.2 Hull
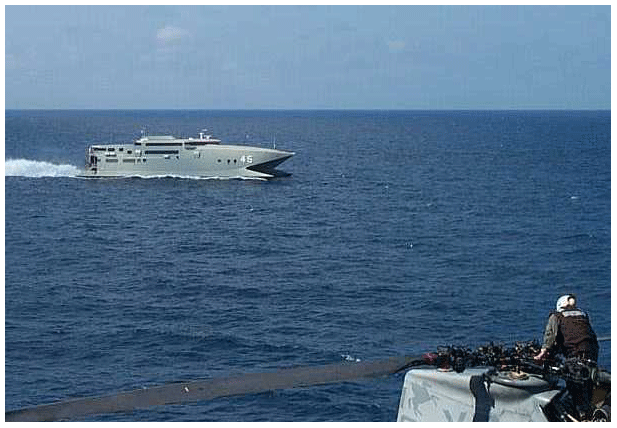
Figure 11The HMAS Jervis Bay in 2000.
Equation (1) shows that energy ships should sail fast to maximize the absorbed power from the wind. Moreover, Eq. (14) shows that hull resistance is detrimental to the energy efficiency of energy ships. For these reasons, an 80 m long, 31.7 m wide catamaran hull shape was selected, inspired by the 86 m long and 26 m wide HMAS Jervis Bay wave-piercing catamaran (Fig. 11). It can be noted that the displacement of the HMAS Jervis Bay is 1250 t.
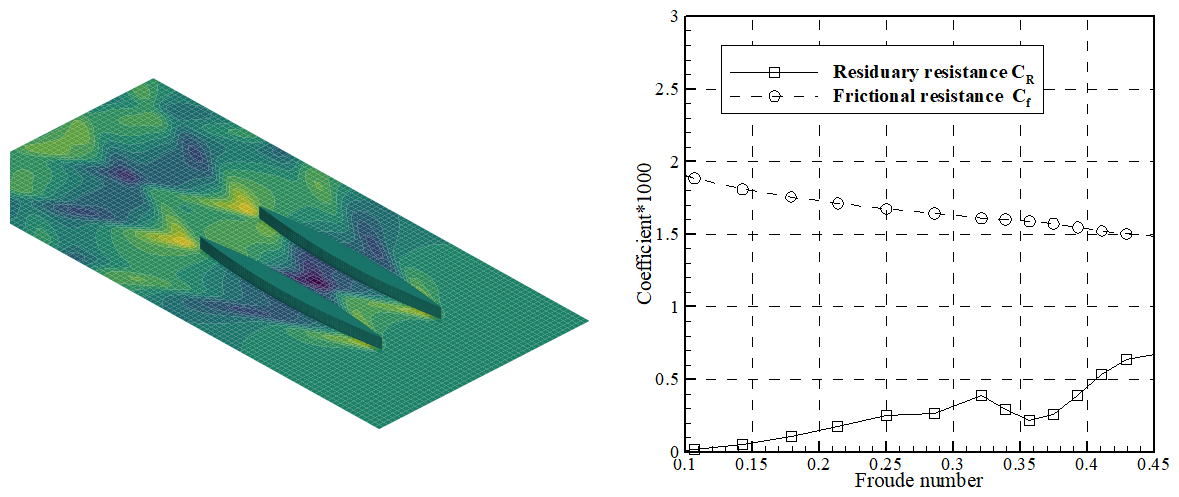
Figure 12Picture of the hull shape considered in this study and related hydrodynamic coefficients.
Figure 12 shows the shape and resistance coefficients of the proposed energy ship hull, whose displacement is 660 t. The shape of the floaters is based on the Wigley hull, which is defined by
where B is the breadth, T is the depth and L is the length. In this study, the parameters are set to B=6.67 m, T=1.88 m and L=80.0 m.
The frictional resistance coefficient was calculated according to Eq. (7), and the residuary (wave) resistance coefficient was obtained using the REVA software (Delhommeau and Maisonneuve, 1987). As shown in Fig. 12, the frictional resistance coefficient is an order of magnitude greater than the residuary resistance coefficient. This was expected as the hull shape is very thin.
The structural mass is set to 258 t. Note that it is not based on a structural analysis; rather, it was estimated by taking the difference between the displacement (660 t) and the total mass of all equipment installed on board plus the mass of the CO2 contained in the CO2 storage tank when it is full. Therefore, an important question is whether this structural mass is sufficient to ensure that the ship can withstand harsh ocean conditions, especially in the windy areas where energy ships are expected to be deployed. To address this question, we note that the ratio of structural mass to total displacement for (steel) merchant ships is in the range of 10 % to 40 % (Papanikolaou, 2014), with the lower values corresponding to large cargo ships and the higher values to ferries and passengers ships. For the energy ship design considered in this study, the ratio is 39 %, thus in the higher end of the range. Moreover, the energy ships' structure may be made of glass-fiber-reinforced polymer (GFRP) or aluminum, which requires less structural weight than steel for the same structural strength. Therefore, we expect that the current provision for structural mass will be sufficient. This needs to be validated in future work.
3.3 Water turbine
The requirements for the energy ships' water turbines are a rated power of 900 kW each, a rated flow velocity of 10.5 m s−1 (see Sect. 4.1) and a large swept area AT in order to maximize efficiency (according to Eq. 13). Unfortunately, to our knowledge, there is no water turbine commercially available whose specifications match these requirements. Indeed, the required rated power (megawatt scale) is much greater than commercial hydro-generators for sailing boats (kilowatt scale). The rated power of tidal turbines is similar to the energy ship's requirements; however their flow velocity is significantly lower (∼3 m s−1; Atlantis Resources, 2019). Therefore, appropriate dimensions and characteristics for the turbines can only be estimated.
The AR1500 tidal turbine developed by the company Simec Atlantis (Atlantis Resources, 2019) has rated power of 1.5 MW, flow velocity of 3 m s−1, diameter 18 m (corresponding to a 254 m2 swept area) and mass of 150 t. Since the rated flow velocity of energy ships is expected to be on the order of 10 m s−1, much smaller turbines can be used to achieve megawatt-scale power generation; however, turbines with a large diameter are expected to be beneficial to the energy ship's efficiency according to Eq. (13). Thus, a turbine diameter of 4 m (25 m2 total swept area for the two turbines) was selected. According to Eq. (10), an axial induction factor of a=0.04 is required to achieve a power generation of approximately 1.8 MW for a flow velocity of 10.5 m s−1. It can be noted that this is an order of magnitude less than for wind turbines.
According to Sanchez de Lara Garcia (2013), the nacelle mass of a wind turbine is approximately proportional to the square of the turbine diameter. Recalling that the AR1500 tidal turbine nacelle mass is 150 t and its diameter is 18 m, the mass of a 4 m diameter water turbine is estimated to be on the order of 7.4 t.
3.4 Power-to-methanol plant
Containerized AEL electrolyzers are commercially available from the company Nel Hydrogen (C series). The Nel C-150 electrolyzer has a capacity of 150 Nm3 H2 h−1, corresponding to a rated power of approximately 750 kW for 60 % efficiency. According to Agersted (2014), the weight of a 2400 kW electrolyzer is 60 t. Thus, we estimate that the 1420 kW rated power electrolyzer required for the proposed energy ship design will have a weight of 35 t.
For the H2-to-methanol plant, the company INERATEC develops compact containerized chemical plants that could be used for energy ships. The weight is on the order of 28 t for a 1 MW rated power capacity (Linus Schulz, personal communication, 2019). Thus, we estimate that the plant required for the FARWINDER, having a power capacity of 850 kW rated, would have a weight of 24 t.
3.5 Storage tanks
Since energy ships are mobile, their route schedules can be dynamically optimized based on weather forecasts in order to maximize energy production. This was performed by Abd-Jamil et al. (2019) for a 1 MW energy ship deployed in the North Atlantic Ocean, assuming the arrival point to be the same as the starting point, whose coordinates are 54.51660∘ N, 27.551844∘ W (mid-distance between Ireland and Newfoundland, Canada). Over the three years 2015, 2016 and 2017, it was found that an average capacity factor of over 80 % can be achieved. Moreover, they found that the average duration of the routes is 6 d.
The performance of the energy ship considered in this study is similar to that of Abd-Jamil et al. (see Sect. 4.1). Therefore, we consider that the storage tanks should be designed to be able to accommodate 7 d at full capacity, corresponding to a capacity of 32 t for the carbon dioxide tank and 23 t for the methanol tank.
Carbon dioxide is usually liquefied for transportation and storage (−20 ∘C temperature, 20 bar pressure). According to Chart (2019), the empty weight of a 26.8 t capacity vessel for liquid CO2 storage is 18 t. For methanol, the weight of a tank of 15 000 gallons (56 781 L) capacity (45 t) is 9 t. Thus, we estimate tank weights of 21 t for the liquid CO2 storage tank and 5 t for the methanol storage tank.
3.6 Auxiliary equipment
Auxiliary equipment includes mainly that required for navigation, control and communication subsystems (although this is not an exhaustive list). To account for their mass, the total mass budget excluding the hull mass is increased by 10 % (34 t).
4.1 Power production charts
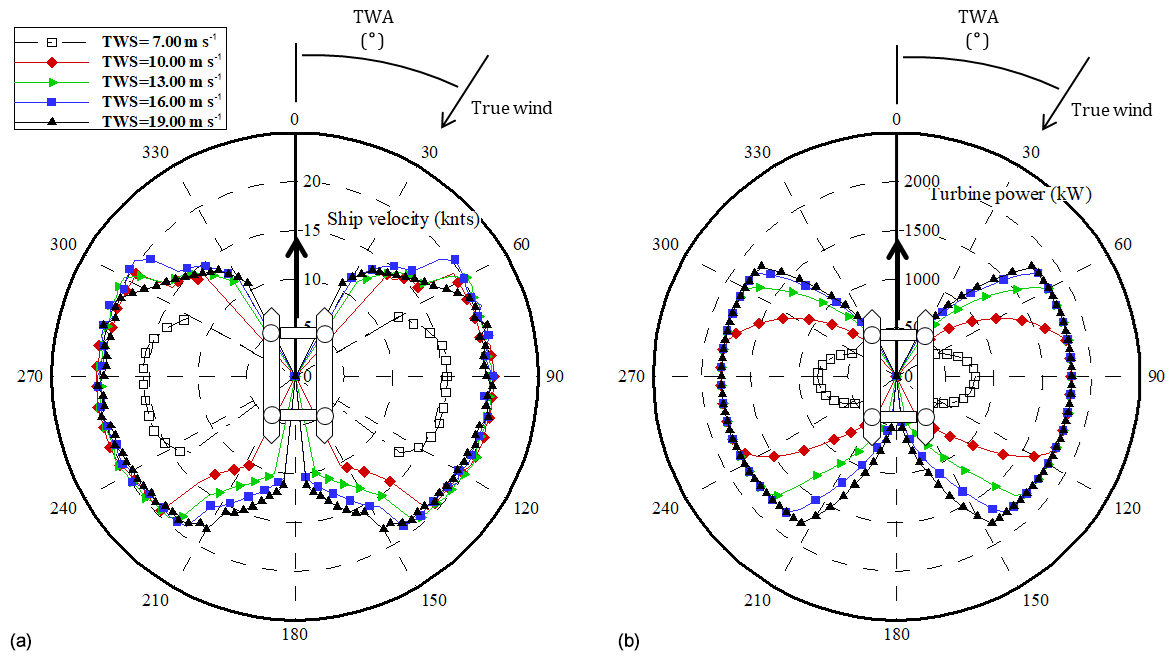
Figure 13Velocity (a) and generated power (b) polar plots of the proposed energy ship design for true wind speeds of 7, 10, 13, 16 and 19 m s−1. TWA stands for true wind angle.
The velocity and the generated power of the proposed FARWINDER are shown in Fig. 13. Five values for true wind speed were considered: 7, 10, 13, 16 and 19 m s−1 (corresponding to wind forces on the Beaufort scale of 4, 5, 6, 7 and 8, respectively). Note that for each data point, the water turbine's induction factor and the rotors' spin ratio were optimized in order to maximize power production while satisfying the constraints (maximum rotation velocity and thrust force for the rotors, maximum power generation for the water turbine).
Panel (b) shows that in terms of optimizing power production, the most favorable wind direction is beam wind, particularly for lower wind speeds. Rated power production is achieved for wind speed slightly greater than 10 m s−1. It can be observed that the range of wind directions for which rated power production achieved widens with increasing wind speed. Overall, the FARWINDER is able to operate at full capacity in a great range of wind conditions.
Panel (a) shows that ship velocity is on the order of 20 kn (10.5 m s−1) when the FARWINDER operates at full capacity. This velocity is less than half that of the HMAS Jervis Bay wave-piercing catamaran and corresponds to a Froude number of 0.37, which is well-aligned with typical Froude numbers for ships. It can be observed that velocity decreases with decreasing power.
4.2 Energy efficiency
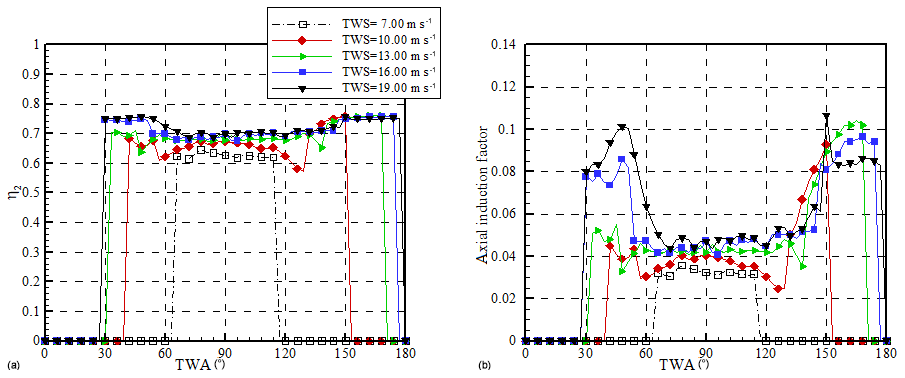
Figure 14Efficiency of the conversion of wind energy into mechanical energy by the proposed energy ship design (a) and optimal induction factor (b) as a function of the wind conditions. TWS stands for true wind speed.
Figure 14 shows the energy efficiency η2 of the wind-to-mechanical energy conversion stage (Eq. 14) and the optimal induction factor as functions of wind direction for the five wind speeds. It can be seen that depending on the wind conditions, efficiency ranges from 60 % to 75 % and the optimal induction factor is in the range of 0.02 to 0.11. In typical beam wind conditions, efficiency is on the order of 65 %–70 %, and the optimal induction factor is 0.03 to 0.05, which is an order of magnitude smaller than for wind turbines. Taking into account the efficiency of converting mechanical energy into electricity, η3=80 %, the overall efficiency of the wind-to-electricity conversion stage is typically 55 %.
The power production available to the power-to-methanol plant is the power generated by the water turbine minus the power consumed by the auxiliaries and the Flettner rotors. In this study, it has been assumed that the power consumption of the Flettner rotors is 40 kW in all wind conditions. This leads to an efficiency of η4=88 % for this energy management stage (Eq. 16). Since the efficiency of the power-to-methanol plant is on the order of 49 %, the overall wind-to-methanol efficiency is 24 %.
4.3 Annual methanol production and CO2 supply
In comparison to the power production polar plots of the FARWINDER considered in Abd-Jamil et al. (2019), the energy ship proposed in this study is able to produce more power and in a greater range of wind conditions. Therefore, its capacity factor can be expected to exceed the value of 80 % reported in Abd-Jamil et al. (2019). However, that estimation did not take into account downtime due to planned and unplanned maintenance (availability). Therefore, the estimation of annual energy production in the present study is based on a capacity factor of 75 %, resulting in estimated methanol production of approximately 905 t per annum per energy ship (approximately 5 GWh per annum of chemical energy).
As the production of 1 kg of methanol requires 1.38 kg of CO2, the annual CO2 supply must be 1250 t per annum per energy ship.
In this paper, we presented a design of an energy ship which could be used to convert the far-offshore wind energy resource into sustainable methanol, and we investigated its energy performance. Its energy conversion efficiency (wind energy to methanol) is estimated to be 24 %. The annual methanol production is estimated to be approximately 900 t per annum (5 GWh of chemical energy).
These energy ships could be deployed in fleets in order to enable large-scale production of methanol. Methanol being a liquid fuel with rather high energy density, it could represent a sustainable viable substitute to fossil fuels for many uses (including transportation), provided that the CO2 source is itself sustainable. However, there are several challenges to address first. A first challenge is the cost of energy. It is discussed in the companion to this paper (Babarit et al., 2020). Other challenges include the development and validation of the key subsystems (water turbine, autonomous power-to-methanol plant, control systems for autonomous navigation) and addressing the possible nontechnical barriers to far-offshore wind energy (legal status of autonomous far-offshore wind energy converters, environmental impacts).
The data generated during the current study are available from the corresponding author on request. Licenses of the numerical program which was used to develop the proposed energy ship and assess its energy performance may be purchased from École Centrale de Nantes.
AB and JCG conceived of the presented idea. AB developed the theory and performed the computations except the REVA computations which were carried out by GC. SD contributed to the design of the presented energy ship. All authors discussed the results and contributed to the final manuscript.
The authors declare that they have no conflict of interest.
This research was partially supported by the French National Energy and Environmental Agency (ADEME) and Région Pays de la Loire.
This research has been partially supported by the French National Energy and Environmental Agency (ADEME) and Région Pays de la Loire (PhD grant of co-author Gaël Clodic).
This paper was edited by Carlo L. Bottasso and reviewed by Michael Muskulus and two anonymous referees.
Abd-Jamil, R., Chaigneau, A., Gilloteaux, J.-C., Lelong, P., and Babarit, A.: Comparison of the capacity factor of stationary wind turbines and weather-routed energy ships in the far-offshore, J. Phys. Conf. Ser., 1356, https://doi.org/10.1088/1742-6596/1356/1/012001, 2019.
Agersted, K.: H2OCEAN D5.1 Report on expected marinised hydrogen generator performance, DTU, Denmark, 157 pp., 2014.
Anicic, B., Trop, P., and Goricanec, D.: Comparison between two methods of methanol production, Energy, 77, 279–289, 2014.
Atlantis resources: AR1500 Tidal turbine. Brochure, Atlantis resources, available at: https://www.atlantisresourcesltd.com/wp/wp-content/uploads/2016/08/AR1500-Brochure-Final-1.pdf, last access: 11 February 2019.
Babarit, A. and Gilloteaux, J.-C.: Preliminary design of a wind driven vessel dedicated to hydrogen production, in: Proc. of the ASME 36th International Conference on Ocean, Offshore and Artic Engineering (OMAE2017), Trondheim, Norway, 2017.
Babarit, A., Gilloteaux, J.-C., Clodic, G., Duchet, M., Simoneau, A., and Platzer, M. F.: Techno-economic feasibility of fleets of far offshore hydrogen-producing wind energy converters, Int. J. Hydrogen Energ., 43, 7266–7289, 2018.
Babarit, A., Gilloteaux, J.-C., Body, E., and Hetet, J.-F.: Energy and economic performance of the FARWIND energy system for sustainable fuel production from the far-offshore wind energy resource, in: Proc. Of the 14th International conference on ecological vehicles and renewable energies (EVER 2019), Monaco, 2019.
Babarit, A., Delvoye, S., Clodic, G., and Gilloteaux, J.-C.: Exploitation of the far-offshore wind energy resource by fleets of energy ships. Part B. Cost of energy, Wind Energ. Sci. Discuss., https://doi.org/10.5194/wes-2019-101, in review, 2020.
BP: BP Statistical review of world energy, 67th edn., June 2018.
Burton, T., Sharpe, D., Jenkins, N., and Bossanyi, E.: Wind energy handbook, John Wiley and Sons, Chichester, UK, 2001.
Charrier, B.: Etude théorique et expérimental de l'effet “Magnus” destiné à la propulsion des navires, PhD thesis, Université de paris VI, 1979.
Chart: Technical manual: carbon dioxide storage tank, Manual #11650869 Rev, 2019.
Chen, H., Ngoc-Cong, T., Yang, W., Tan, C., Li, Y., and Ding, Y.: Progress in electrical energy storage system: a critical review, Prog. Nat. Sci., 19, 291–312, 2009.
Connolly, D., Mathiesen, B. V., and Ridjan, I.: A comparison between renewable transport fuels that can supplement or replace biofuels in a 100 % renewable energy system, Energy, 73, 110–125, 2014.
Delhommeau, G. and Maisonneuve, J. J.: Extensions du code de calcul de résistante de vagues REVA: prise en compte des effets de fond et de portance, Compte rendu des 1ères journées de l'hydrodynamique, Nantes, France, 1987.
Dupont, E., Koppelaar, R., and Jeanmart, H.: Global available wind energy with physical and energy return on investment constraints, Appl. Energ., 209, 322–338, 2018.
Fasihi, M., Bogdanov, D., and Breyer, C.: Techno-economic assessment of power-to-liquids (PtL) fuels production and global trading based on hybrid PV-wind power plants, Energy Procedia, 99, 243–268, 2016.
Gilloteaux, J.-C. and Babarit, A.: Preliminary design of a wind driven vessel dedicated to hydrogen production, in: Proc. Of the ASME 2017 36th International conference on ocean, offshore and arctic engineering (OMAE), Trondheim, Norway, 2017.
Gizara, A. R.: Turbine-integrated hydrofoil, US Patent 2007/0046028A1, 2007.
Gotz, M., Lefebvre, J., Mors, F., McDaniel Koch, A., Garf, F., Bajohr, S., Reimert, R., and Kolb, T.: Renewable power-to-gas: a technological and economic review, Renew. Energ., 85, 1371–1390, 2016.
Graves, C., Ebbesen, S. D., Mogensen, M., and Lackner, K. S.: Sustainable hydrocarbon fuels by recycling CO2 and H2O with renewable or nuclear energy, Renew. Sust. Energ. Rev., 15, 1–23, 2011.
International WindShip Association: Quaterly newsletter, February 2019.
Ioannou, A. and Brennan, F.: A techno-economic comparison between a grid-connected and non-grid connected offshore floating wind farm, in: Proc. Of the IEEE 2019 Offshore energy and storage summit (OSES), Brest, France, 2019.
Keith, D. W., Holmes G., St Angelo, D., and Heidel, K.: A process for capturing CO2 from the atmosphere, Joule, 2, 1573–1594, 2018.
Kim, J. and Park, C.: Wind power generation with a parawing on ships, a proposal, Energy, 35, 1425–1432, 2010.
Kim, J. C. and Park, C.: Economy of hydrogen production by parafoil-pulled ships, J. Energ. Power Sources, 1, 9–16, 2014.
Li, H., Tan, Y., Ditaranto, M., Yan, J., and Yu, Z.: Capturing CO2 from biogas plants, Energy Procedia, 114, 6030–6035, 2017.
Irlam, L.: Global costs of carbon capture and storage – 2017 update, Global CCS institute, June 2017.
ITTC: General guidelines for uncertainty analysis in resistance tests, ITTC – Recommended procedures 7.5-02-02-02, 2014.
Liu, W. T., Tang, W., and Xie, X.: Wind power distribution over the ocean, Geophys. Res. Lett., 35, L13808, https://doi.org/10.1029/2008GL034172, 2008.
Machado, C. F. R., De Medeiros, J-L., Araujo, O. F. Q., and Alves, R. M. B.: A comparative analysis of methanol production routes: synthesis gas versus CO2 hydrogenation, in: Proc. of the 2014 International conference on industrial engineering and operations management, Bali, Indonesia, 2014.
Manwell, J. F., McGowan, J. G., and Rogers, A. L.: Wind energy explained: theory, design and application, Wiley, Chichester, United Kingdom, 2009.
Marlin, D. S., Sarron, E., and Sigurbjornsson, I.: Process advantages of direct CO2 to methanol synthesis, Front. Chem., 6, 2018.
McDonagh S., O'Shea R., Wall D. M., Deane J. P., and Murphy J. D.: Modelling of a power-to-gas system to predict the levelised cost of energy of an advanced renewable gaseous transport fuel, Appl. Energ., 215, 444–456, 2018.
Meller M.: Wind-power linear motion hydrogen production systems, US Patent 7,146,918 B2, 2006.
Morgan, E. R.: Techno-economic feasibility study of ammonia plants powered by offshore wind, Dissertations 697, University of Massachussets – Amherst, 2013.
Norspower: Norsepower rotor sails solution, Technical brochure, 2019.
Offshore wind programme board: Transmission costs for offshore wind – final report, Offshore renewable energy catapult, United Kingdom, April 2016.
Ouchi, K. and Henzie, J.: Hydrogen generation sailing ship: conceptual design and feasibility study, in: Proc. Of IEEE OCEANS 2017 conference, Aberdeen, UK, 2017.
Papanikolaou, A.: Chapter 2: Selection of main dimensions and calculation of basic ship design value, in: Ship Design: methodologies of preliminary design, Springer, 628 pp., 2014.
Pelz, P. F., Holl, M., and Platzer, M.: Analytical method towards an optimal energetic and economical wind-energy converter, Energy, 94, 344–351, 2016.
Platzer, M. F. and Sarigul-Klijn, N.: A novel approach to extract power from free-flowing water and high-altitude jet streams, in: Proc. Of the ASME 2009 3rd International conference on energy sustainability, Vol. 1, San Francisco, California, USA, 2009.
Platzer, M. F., Lennie, M., and Vogt, D. M.: Analysis of the conversion of ocean wind power into hydrogen, in: Proc. Of the World Renewable Energy Conference, Perth, Australia, 2013.
Platzer, M. F., Sarigul-Klijn, N., Young, J., Ahsraf, M. A., and Lai, J. C. S.: Renewable hydrogen production using sailing ships, J. Energ. Resour.-ASME, 136, 021203, https://doi.org/10.1115/1.4026200, 2014.
Platzer, M. F. and Sarigul-Klijn, N.: Energy ships and plug-in electric vehicles: are they the key for a rapid transition to an emission-free economy?, in: Proc. Of the ASME 2015 International Mechanical Engineering Congress and Exposition (IMECE), Houston, Texas, USA, 2015.
Salomon, R. E.: Process of converting wind energy to elemental hydrogen and apparatus therefor, US Patent 4335093A, 1982.
Sanchez de Lara Garcia, J. P.: Wind turbine database: modelling and analysis with focus on upscaling, Masters thesis, Chalmers University of Technology, Gothenburg, Sweden, 2013.
Schmidt, O., Gambhir, A., Staffel, I., Hawkes, A., Nelson, J., and Few, S.: Future cost and performance of water electrolysis – an expert elicitation study, Int. J. Hydrogen Energ., 42, 30470–30942, 2017.
UNFCCC: Paris agreement, 2015.
Vazquez, F. V., Koponen, J., Russkanen, V., Bajamundi, C., Kosonen, A., Simell, P., Ahola, J., Frilund, C., Reinikainen, M., Heikkinen, N., Kauppinen, J., and Piermartini, P.: Power-to-X technology using renewable electricity and carbon dioxide from ambient air: SOLETAIR proof-of-concept and improved process concept, J. CO2 Util., 28, 235–246, 2018.
Vidal, J. P.: System for propulsion of boats by means of winds and streams and for recovery of energy, US Patent 4,371,346, 1983.
- Abstract
- Introduction
- Models of the processes and energy flow in a methanol-producing energy ship
- Development and specifications of the proposed energy ship design
- Energy production and efficiency
- Conclusions
- Code and data availability
- Author contributions
- Competing interests
- Acknowledgements
- Financial support
- Review statement
- References