the Creative Commons Attribution 4.0 License.
the Creative Commons Attribution 4.0 License.
 | 03 Aug 2020
New strategies for optimized structural monitoring of wind farms: experimental campaign
João Pacheco
Silvina Guimarães
Carlos Moutinho
Miguel Marques
José Carlos Matos
Filipe Magalhães
The main goal of the recently started WindFarmSHM research project is the development, validation and optimization of monitoring strategies to be applied at the level of the wind farm. These strategies should be able to evaluate the structural condition of a set of wind turbines and their consumed fatigue life using the response to operation loads. In this context, a quite extensive experimental campaign is being performed at the Tocha wind farm, an onshore wind farm located in Portugal, which includes the simultaneous instrumentation of several wind turbines, adopting strain gauges, clinometers and accelerometers distributed in the tower and blades. This paper introduces the Tocha wind farm, presents the different layouts adopted in the instrumentation of the wind turbines and shows some initial results from the already fully instrumented wind turbine. At this preliminary stage, the capabilities of the very extensive monitoring layout are demonstrated. The results presented in this paper demonstrate the ability of the different monitoring components to track the modal parameters of the system composed of a tower and rotor and to characterize the internal loads at the tower base and blade roots.
- Article
(6274 KB) - Full-text XML
- BibTeX
- EndNote


Wind energy is one of the most promising renewable energy sources, having registered a truly remarkable evolution in the last 2 decades. This evolution, practically worldwide, is verified in terms of both installed capacity and technological evolution. In the EU, wind was the fastest-growing energy source between 2005 and 2017, surpassing coal in 2016 as the energy source with the second-largest total installed power generation capacity (EWEA, 2018). Future forecasts are equally optimistic. It is expected that the cumulative capacity of wind energy in the EU will continue to grow and that it will even double in 10 years, according to the most optimistic forecast (EWEA, 2017). Thus, based on this scenario, it is possible to identify several challenges that will arise in the coming years. Among them, the following stand out:
-
Costs of energy production. The reduction in the unit cost of wind energy is a major factor for guaranteeing the competitiveness and growth of the wind sector. Reducing operation risk through monitoring is one way to reduce the wind energy production cost.
-
The extension of the lifespan of the existing wind turbines. Wind turbines were designed to operate for 20 years, so it is estimated that about one half of the accumulated capacity currently installed in the EU will reach the end of design life in 2030 (EWEA, 2017). It is therefore essential to create a regulatory framework that defines the rules for the actions to be taken when the expected design life of the structures is exhausted.
-
Limited technical knowledge. The increase in the size of wind turbines and the exploration of offshore sites still involve a certain degree of uncertainty.
Considering this background and previous research (Weijtjens et al., 2016, 2017; Lorax and Brühwiler, 2016), the main goal of the WindFarmSHM research project is the development, validation and optimization of new methodologies to continuously assess the structural elements of wind turbines: tower, blades and foundation. The monitoring strategy is being designed to be applied in the context of a wind farm; it is adequate for onshore and floating solutions (the two types of foundation used in Portugal), uses optimized instrumentation layouts at a subgroup of wind turbines, and makes use of the data provided by the acquisition systems already available in all wind turbines (SCADA) for the use of extrapolation techniques to assess all the wind turbines of the same wind farm (Fig. 1).
The research project will include three monitoring layouts of wind turbines of an onshore wind farm, incorporating accelerometers, strain gauges and clinometers, as well as the development of numerical models for the generation of virtual monitoring data to validate the monitoring strategy in floating wind turbines.
The data processing will be based on the continuous evaluation of the parameters that drive the structural dynamic behaviour (vibration frequencies and damping) estimated from the structure response to ambient excitation (wind, waves, currents, soil vibrations) and advanced statistical modelling, keeping two main goals in mind: detection of stiffness reductions motivated by the appearance of damage (as performed in Oliveira et al., 2018a) and evaluation of the remaining fatigue life of the main structural components (Fig. 1).
In the project a very extensive instrumentation is being deployed in order to evaluate different monitoring layout alternatives, but the final goal is to propose a minimal optimized monitoring layout based on a reduced number of sensors that can be easily installed.
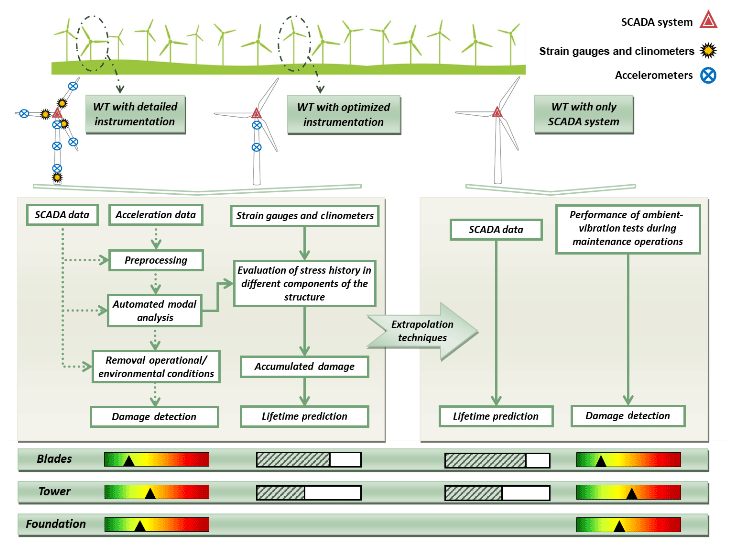
Figure 1Monitoring strategy. Meaning of the horizontal bars at the bottom: the colour bars represent in a simplistic fashion the structural health; the green and white bars represent the consumed fatigue life.
The Tocha wind farm is owned by EDP Renewables and was put into operation in May 2012. It is located in the central region of Portugal, approximately 3 km from the coastline. It consists of five Vestas wind turbines (model V100) with 1.8 MW of rated power, totalling 9.0 MW of installed power. Figure 2 presents the geographic location of the wind farm and the distribution of the five wind turbines, identified with numbers that are used throughout this work. This figure also identifies a substation position as well as a meteorological mast.
It is important to note that the wind farm fits in a coastal area with very soft orography of the terrain and where the foundation's soil is predominantly sandy, which is why deep foundations are used in all wind turbines. Thus, the steel tower of the turbines is connected to a 14 m×14 m concrete slab with variable height (1.50 m at the ends and 3.00 m in the central area). In turn, 16 concrete piles with 1 m diameter support the slab.
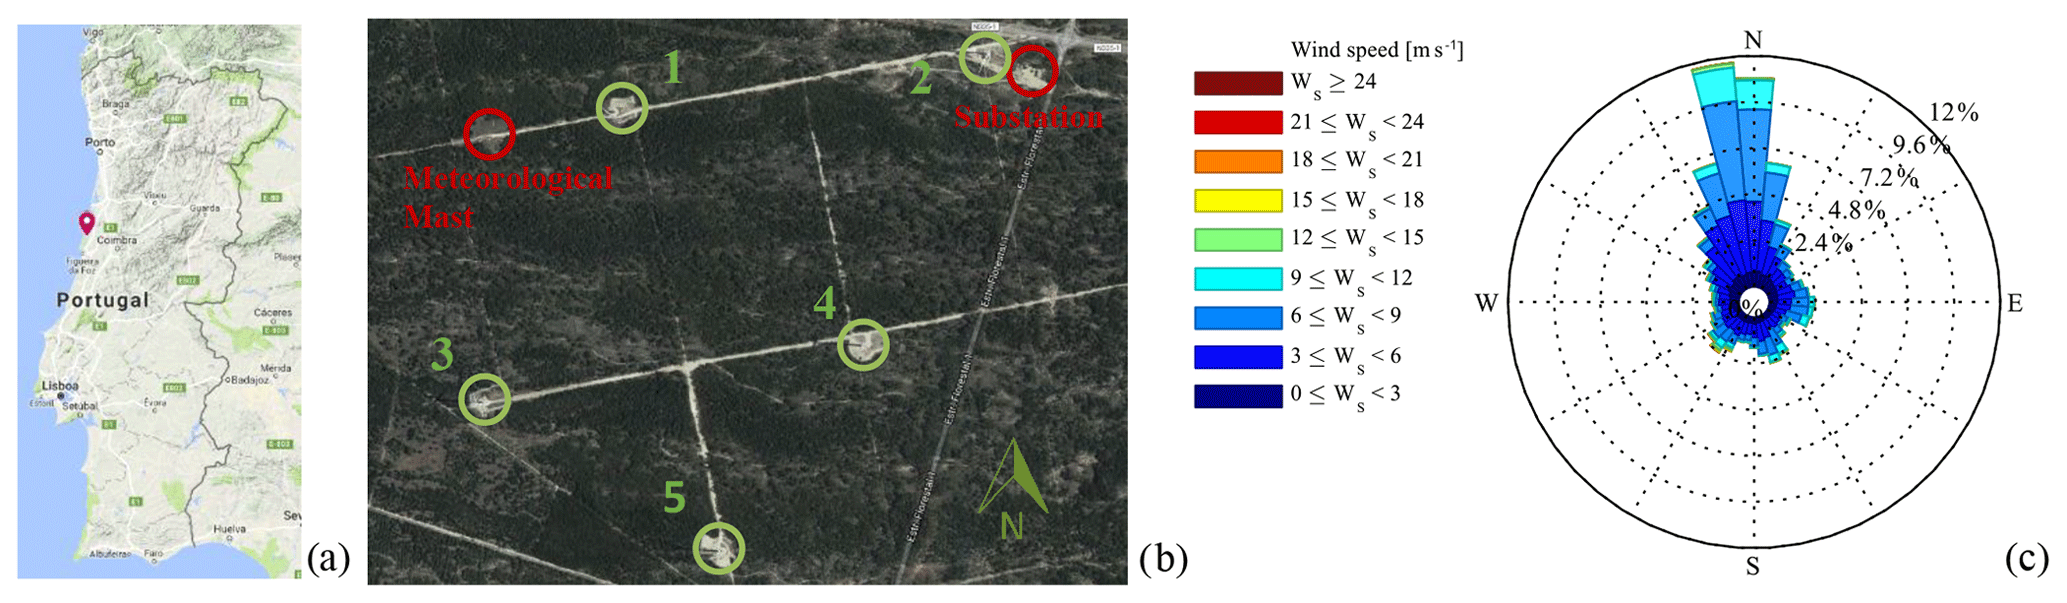
Figure 2Tocha wind farm: (a) geographic location in Portugal (© Google, 2018a), (b) identification of wind turbines and auxiliary structures (© Google, 2018b), (c) characterization of the wind conditions observed in 2017 (SCADA data of WT1).
Figure 2c shows a wind rose, which characterizes the wind speed and direction for the year 2017 at the Tocha wind farm. The predominant wind direction is approximately north. Thus, considering the very smooth terrain and the proximity of the coast, wind turbines 1, 2 and 3 are exposed to slightly disturbed offshore winds, while the remaining generators are exposed to wind with additional turbulence caused by wake effects.
The Vestas 1.8 MW V100 wind turbine is an onshore turbine model with a 100 m diameter rotor. It is a variable-speed, three-blade rotor with individual pitch control for each blade. The hub is placed at a height of 95 m and is supported by a steel tower, with a hollow circular cross section of variable diameter and thickness and composed of four segments that are linked on-site with bolted connections. The wind turbines operate for wind speeds between 4 and 20 m s−1 and achieve the rated power for wind speeds of about 12 m s−1 (Fig. 3c).
In order to obtain an initial estimate of the wind turbine dynamic properties before the installation of the monitoring systems, a set of ambient-vibration tests was performed in four of the five wind turbines in operating and non-operating conditions. Additionally, a numerical model of the wind turbines was deployed. In the next sections, the preliminary evaluation of the modal properties of the wind turbines is described.
3.1 Numerical models
In order to better interpret the experimental results, a numerical model of the wind turbine was developed using ROBOT STRUCTURAL ANALYSIS software (Autodesk, 2016) following the technical drawings provided by the manufacturer. It is a simplified model in which the operation of the turbine is not modelled. Rotational movement of the rotor and all control systems are disregarded as the main purpose of the numerical model is the simulation of the dynamic behaviour of the tower under the test conditions presented in the following section.
It is considered that the foundation does not allow any kind of relative movement, and the opening of the door at the tower bottom is not considered (a specific numerical model for this detail has shown that it has a reduced influence on global behaviour). Thus, the modelling of the tower was based on 3D bar elements to which the corresponding cross sections were assigned.
Regarding blade modelling, very detailed information was not available at the time. Alternatively, starting from the National Renewable Energy Laboratory (NREL) 5 MW reference wind turbine (Jonkman et al., 2009), the characteristics of the blades were scaled to be compatible with the wind turbine under study. The blades are modelled by 3D bar elements, which are divided into multiple sections to which the average mass, stiffness and inertia characteristics have been attributed. Since there is no rotation of the rotor, the blades were modelled with the pitch angle observed during the ambient-vibration tests.
The nacelle and hub are represented by concentrated loads applied at their centres of gravity. The connection between the tower, blades and the geometric centres of the nacelle and hub is modelled with rigid links of negligible mass. Still, it is important to note that advanced models are currently being developed in the software FAST (Fatigue, Aerodynamics, Structures, and Turbulence Code; Sprague et al., 2015) using some structural information that was derived from the previously described model. All the details of the FAST model are presented in Pimenta et al. (2019).
3.2 Ambient-vibration tests
The set of ambient-vibration tests was divided into two campaigns. In the first campaign, the main goal was to accurately identify the natural frequencies and the configuration of the tower vibration modes, considering two different situations: wind turbines in operating conditions and wind turbines in non-operating conditions (the rotor was stopped or idling). At this stage, only wind turbine 1 was tested. Several time series of 10 min of acceleration were measured (sample rate of 100 Hz) with four stand-alone seismographs (Fig. 3a) containing internal triaxial force balance sensors that were placed in the horizontal platforms of the tower (Fig. 3b).
In the second campaign, the main objective is to identify the natural frequencies of all wind turbines of the wind farm in order to characterize the variability of the natural frequencies. The same equipment and data acquisition parameters were used, but only the two highest sections of the towers were instrumented. It should be noted that in this second test the rotor of the wind turbines was stopped.
The collected acceleration time series were first analysed in the frequency domain and then processed with the covariance-driven stochastic subspace identification method (SSI-COV; Magalhães and Cunha, 2011). The operating scenarios observed during the performance of the ambient-vibration tests are shown in Fig. 3c (first campaign: red circles; second campaign: green triangle). It can be seen that the wind conditions observed during the two tests are quite different. The owner of the wind farm provides SCADA data with the mean, maximum and minimum value from a 10 min period, which is important information for acceleration processing.
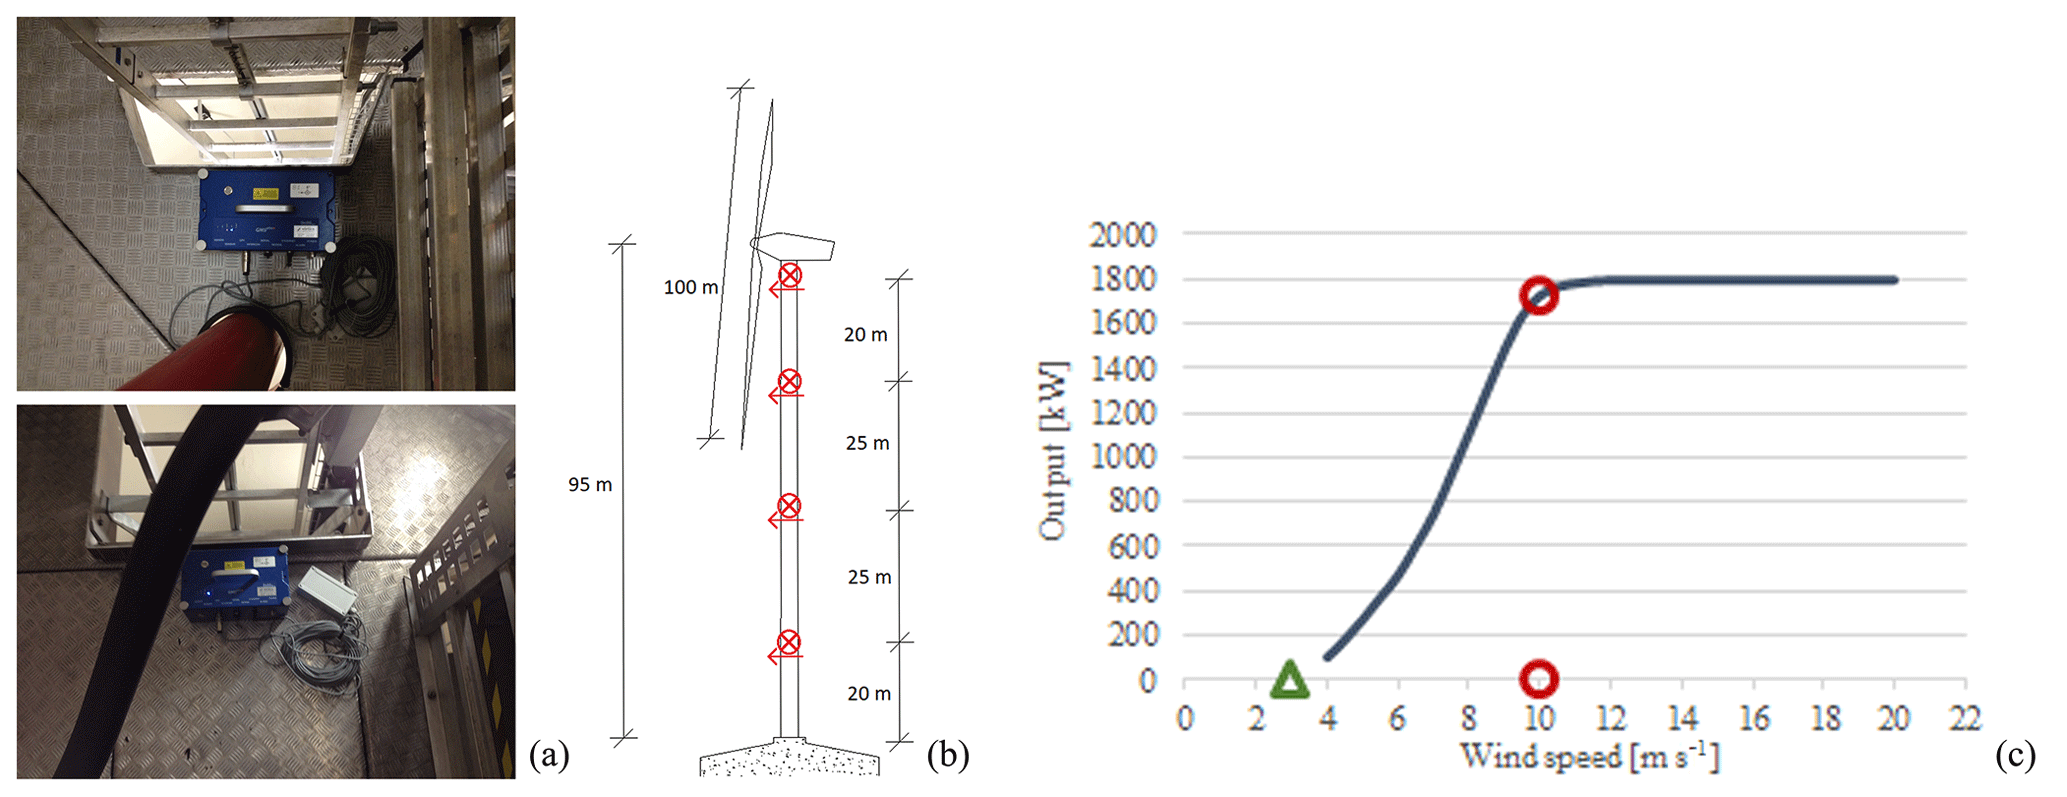
Figure 3Ambient-vibration tests: (a) sensors, (b) section instrumented, (c) operating scenarios and power curve of Vestas V100 wind turbine (https://en.wind-turbine-models.com, last access: 4 November 2019).
Figure 4 shows some of the results obtained from the first campaign in non-operating condition. The top left plot shows two averaged normalized spectra: one for the fore–aft direction (FA; perpendicular to the rotor plane) and another for the side–side direction (SS; parallel to the rotor plane). It is possible to identify several abscissa in correspondence with the most relevant peaks of the spectrum, which represent good estimates of natural frequencies. Among the various peaks identified, there are two that clearly stand out: one near 0.25 Hz and another near 1.80 Hz. Comparing the experimental results with numerical ones (Fig. 5), it is confirmed that these peaks correspond to the first and second pairs of tower-bending modes. In the stabilization diagram covering the full frequency range under analysis, the position of the first three pairs of tower-bending modes is marked. The two enlargements presented at the bottom of Fig. 4 show that with the SSI-COV method it is possible to separate the very close modes within the first two pairs of frequencies. There are still other stable pole alignments relevant to the dynamic characterization of the structure; however, they are probably associated with vibration modes dominated by the rotor, which can only be identified and characterized using the more detailed instrumentation, which is described in the next section.
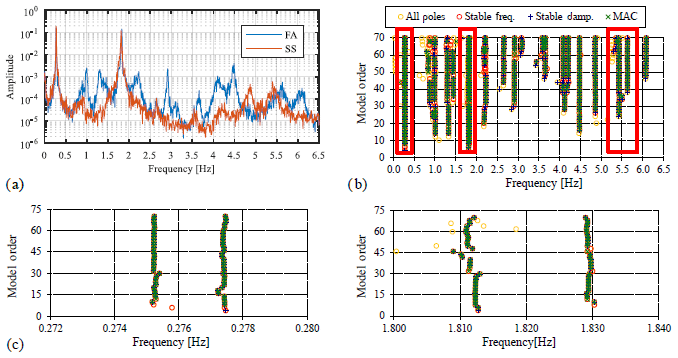
Figure 4Ambient-vibration test results for wind turbine 1: (a) average power spectra for FA and SS directions, (b) stabilization diagram produced by the SSI-COV method, (c) two enlargements of the stabilization diagram to show the two pairs of tower-bending modes.
Figure 5 presents the identified mode shapes and natural frequencies, which are compared to numerical results obtained from a simple preliminary numerical model. There is an excellent relationship between numerical results (blue line) and experimental results (red circles).
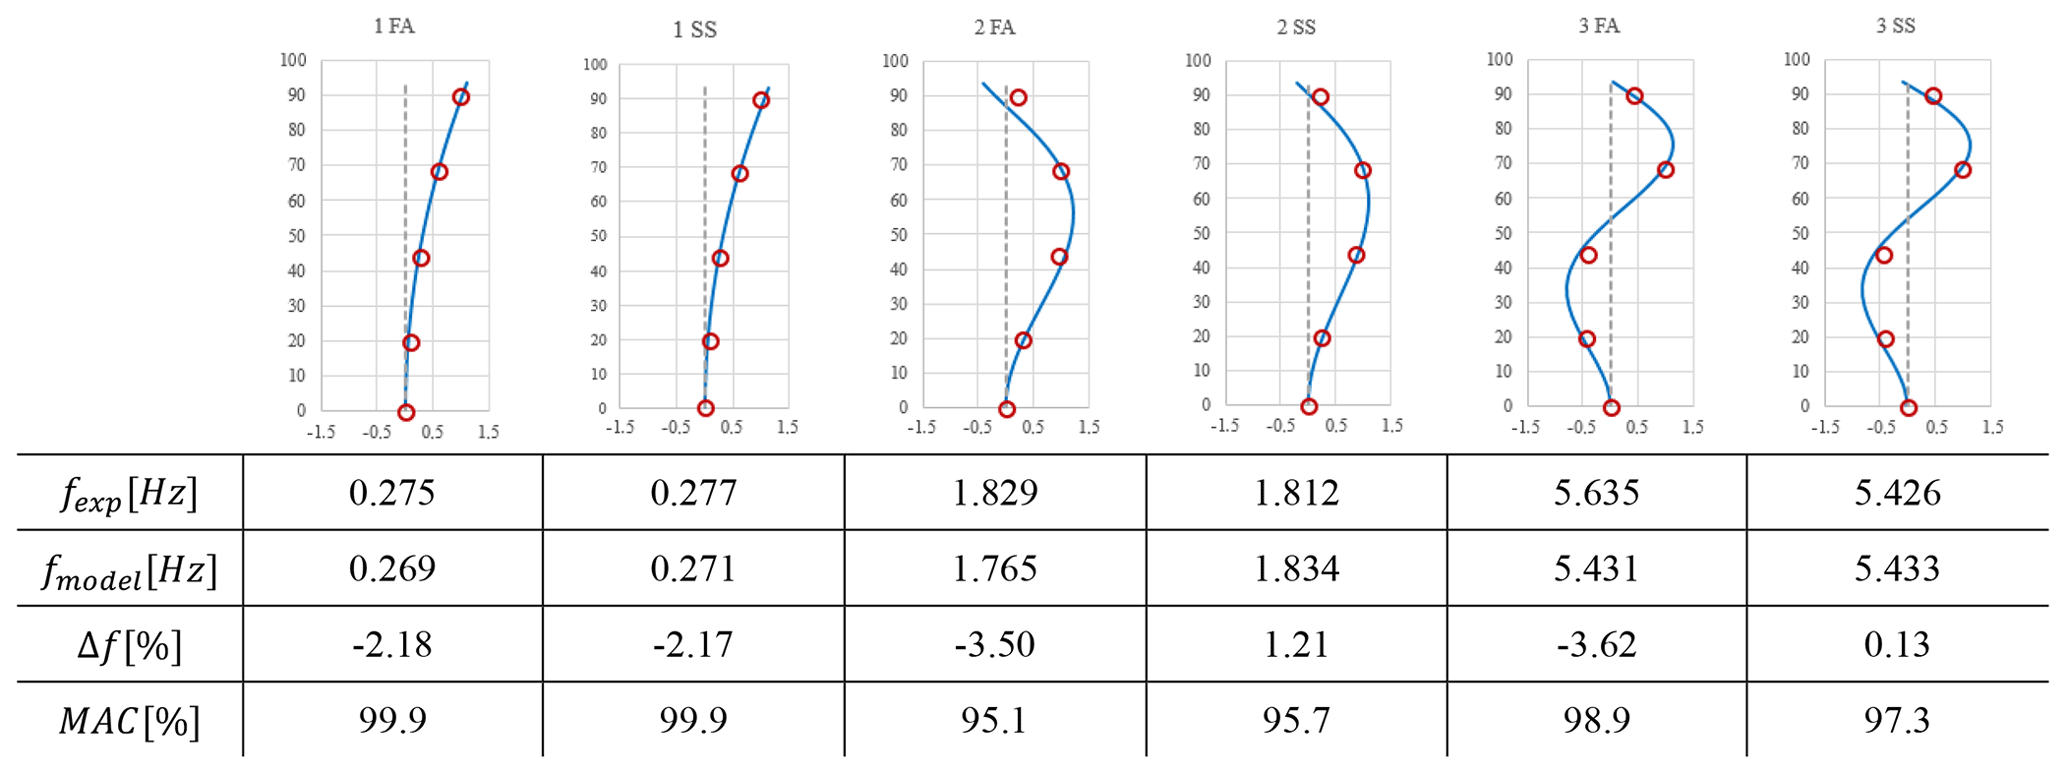
Figure 5Mode shapes and natural frequencies identified with the ambient-vibration test and numerical model of wind turbine 1.
Still, for the first test campaign, it is important to understand the influence that the normal operation of the rotor has on the dynamic characteristics of the structure. Thus, Fig. 8 compares the ANPSD (average normalized auto-spectral density function) obtained for a stopped rotor and a rotor in operation. It should be noted that the represented ANPSDs were calculated considering the signals measured along the FA and SS directions. The dashed vertical lines represent the harmonic frequencies associated with the rotor operation (). The results obtained in terms of natural frequencies (f) are also compared for the identified vibration modes for the two analysed situations (environment and operational parameters shown at the bottom of Fig. 6). For the first tower-bending modes there are two very pronounced peaks for the two operating conditions considered. For the second pair of tower-bending modes, there is only a clear peak in the ANPSD in non-operating conditions. In Fig. 11 this comparison is addressed again.
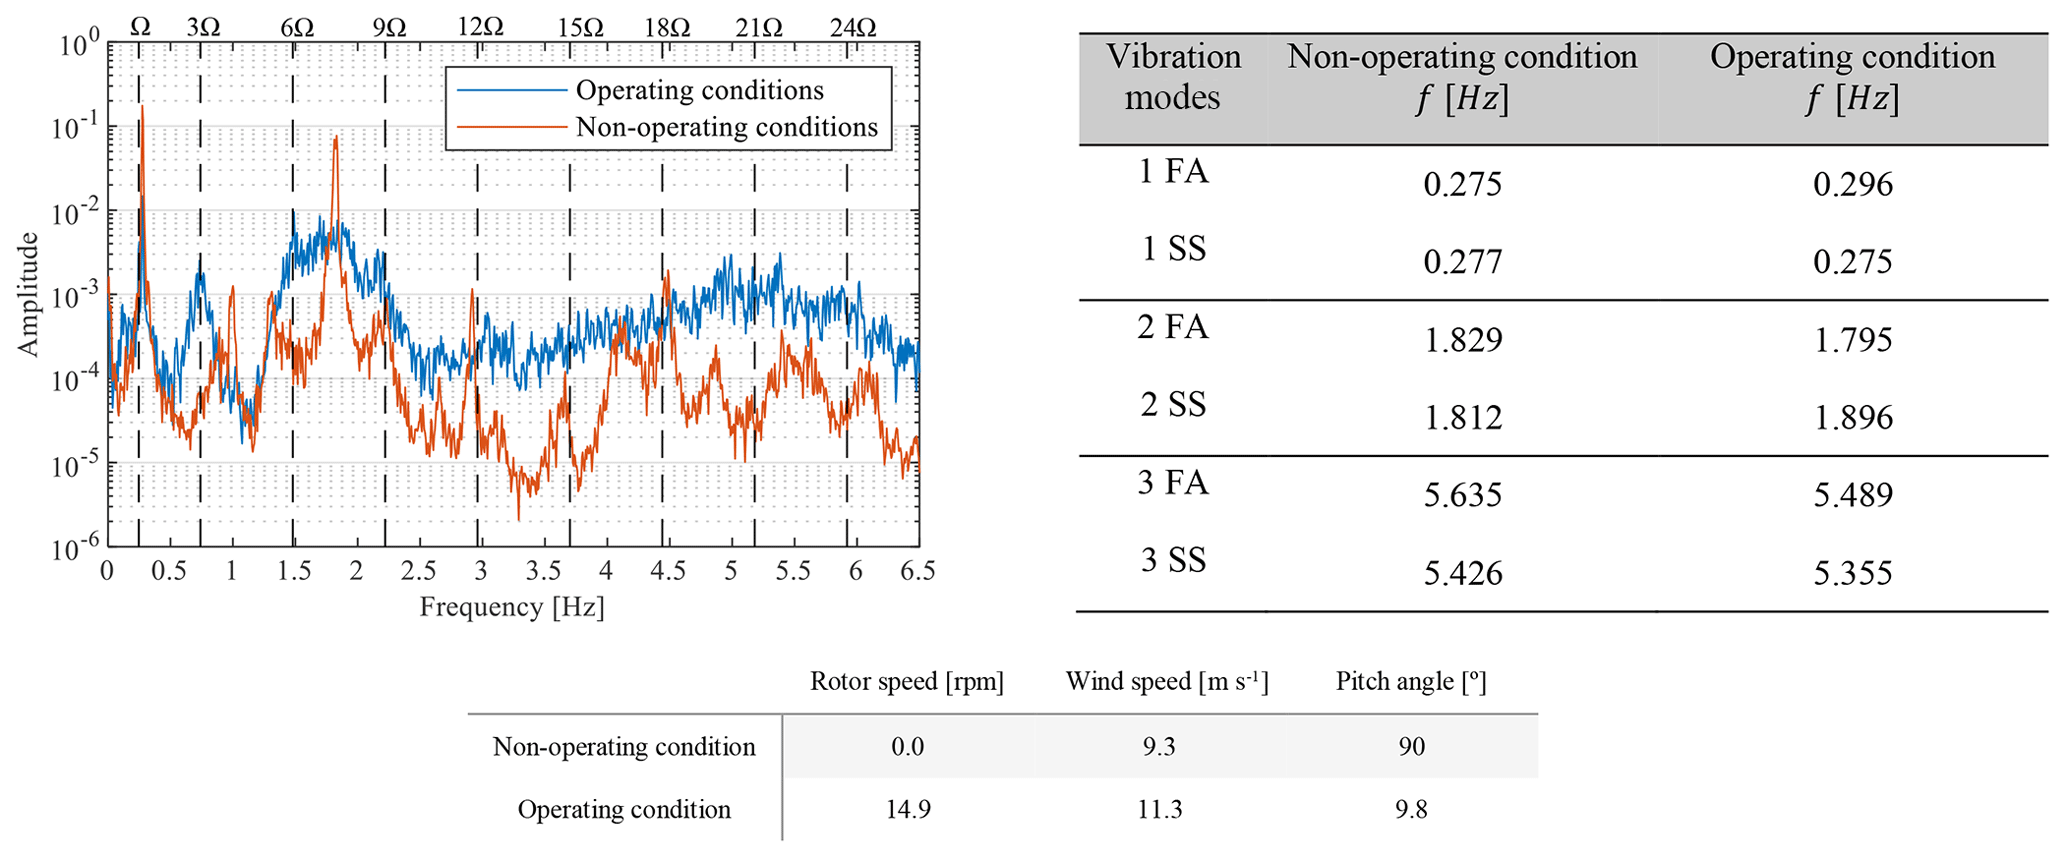
Figure 6Ambient-vibration test results for wind turbine 1 in operating and non-operating conditions: average power spectra and natural frequencies (results obtained from single 10 min observation set-ups with very low variance of the environment and operational parameters).
Figure 7 compares the results obtained for the four tested wind turbines. All of them present quite similar natural frequencies, but wind turbine 5 seems to present a slightly different behaviour, expressed by the differences observed in the values of the natural frequencies of the first and second tower-bending modes associated with the side–side direction (1SS is lower than the others, and 2SS is higher than the others). For this reason and because this is the wind turbine for which higher turbulence is expected, the monitoring campaign will be focused on wind turbines 1 and 5.
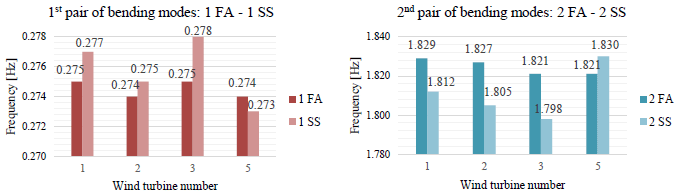
Figure 7Comparison of the natural frequencies of four wind turbines in non-operational conditions (first and second pairs of bending modes).
The experimental campaign at the Tocha wind farm involves the simultaneous monitoring of several wind turbines during a period of about 2 years. In order to obtain data representative of the dynamic behaviour of all wind turbines and based on the results of the ambient-vibration tests described above, the experimental campaign includes the following three instrumentation layouts:
-
an extended monitoring layout installed on wind turbine 1;
-
an intermediate monitoring layout installed on wind turbine 5;
-
a simple monitoring layout to be installed on the other wind turbines, considering shorter instrumentation periods.
The distribution of the alternative monitoring layouts in the wind turbines of the farm was conditioned by the available time slot for the installation of equipment (usually scheduled during other maintenance operations) and our desire to instrument the rotor of one wind turbine that, for the predominant wind direction (north), is loaded by an unperturbed flow and another one that is influenced by the wakes of the other turbines (see Fig. 2). For this reason, wind turbine 1 was instrumented according to the complete layout, while the intermediate layout was applied in wind turbine 5.
The simple monitoring layout has two main objectives: (i) to characterize and identify differences in the dynamic behaviour of wind turbines and (ii) to understand the interaction of the wake effects between nearby wind turbines. This simple layout will be applied to all other structures, considering time periods limited to 2 or 3 months. If justified or atypical behaviours are identified, these wind turbines can be instrumented by adopting a complementary layout suitable for each situation that is intended to be analysed.
The complete monitoring layout includes the following components:
-
two alternative systems to characterize accelerations at the tower – a commercial system based on a set of very-low-noise accelerometers and a customized low-cost system based on MEM (microelectromechanical system) accelerometers designed and assembled at the Faculty of Engineering at the University of Porto (FEUP; Moutinho and Cunha, 2019);
-
strain gauges at the tower base to characterize the stresses during different operating conditions;
-
clinometers to characterize the rotations and, indirectly, the bending moments at the base of the tower;
-
a set of fibre-optic strain gauges to estimate bending moments at the blade roots;
-
MEM accelerometers placed at the blades (10 m from the root) to characterize their dynamics.
The intermediate layout includes the characterization of the accelerations at the tower through the optimized low-cost MEM accelerometer system and the characterization of the rotor dynamic behaviour through fibre-optic strain gauges and MEM accelerometers installed on the blades.
Finally, the simple monitoring layout consists solely of using the MEM accelerometer system to collect data regarding tower vibrations. As mentioned, this system will be applied to all other wind turbines and may be supplemented as appropriate.
It should be noted that data on the environmental and operational conditions of each wind turbine are being obtained through the SCADA system (10 min averages and sampled at 15 s). The meteorological mast is also important to characterize the history of environmental conditions at the wind farm (wind direction and wind speed) since the beginning of its operation. This information is very useful for estimating the current state of fatigue of the various structures.
Wind turbines 1 and 5 are already instrumented. The following section describes the various instrumentation systems adopted as well as presents and analyses preliminary results for wind turbine 1. Since the installation of these components is still being adjusted and the amount of data acquired is still limited, the results presented here are intended to demonstrate what is being measured to certify the correct functioning of the systems and to demonstrate the capabilities of the most complete monitoring layout.
4.1 Tower-monitoring system: accelerometers
In order to obtain the best possible characterization of the tower accelerations, a commercial system based on six force-balance unidirectional accelerometers connected to a 24 bit acquisition system was deployed. As depicted in Fig. 10a, this involved the instrumentation of three sections of the tower along two orthogonal horizontal directions. These three sections coincide with the height of the technical platforms in order to facilitate the installation and maintenance of the monitoring equipment. The sensors are connected by cables to a central acquisition system that continuously records acceleration time series with a sample rate of 20 Hz. These data are accessible from FEUP through an internet connection.
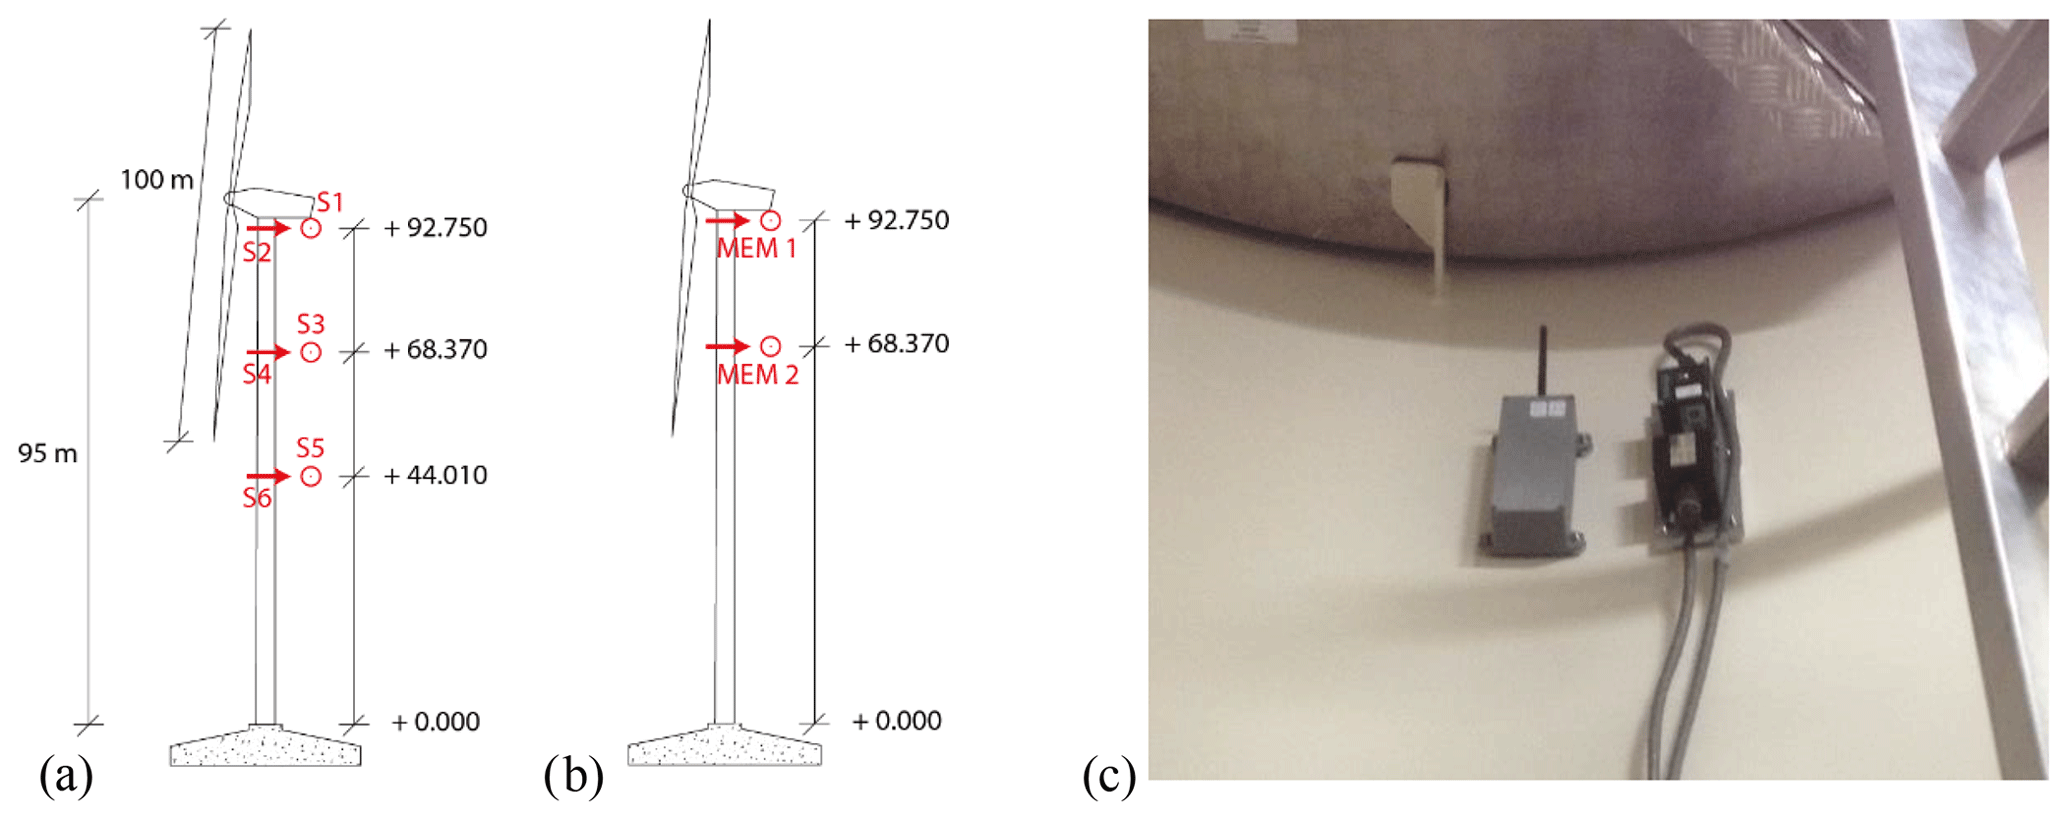
Figure 8Sections instrumented with accelerometers: (a) force balance sensors, (b) MEM sensors, (c) photos of the force balance sensors (connected to cables) and of the MEM-based acquisition system (grey box with antenna).
A complementary MEM-based system was also installed. This is a stand-alone system developed at FEUP that integrates a triaxial acceleration sensor (in this application just the two horizontal directions are being recorded with a sample rate of 62.5 Hz), a set of batteries that ensure 5 months of continuous operation, a memory card for data storage, high-precision clocks and a radio for data transmission (in the present application the data transmission is limited to state-of-health parameters to increase the system autonomy). Two of these devices were installed in the tower in the positions marked in Fig. 8b. One of the project goals is the development and test of easy-to-deploy and cost-effective systems for wind turbine testing and monitoring, so the evaluation of the performance of these devices designed and assembled at FEUP is very relevant.
Figure 11 shows two examples of spectra obtained from acceleration series recorded by the two alternative sensors tested, considering the wind turbine in production (figure on the right) and parked (figure on the left). It appears that the system designed at FEUP demonstrates a performance that is comparable to the more expensive and difficult-to-install commercial system (KMI – KINEMETRICS commercial monitoring system). These figures are in accordance with the results of the ambient-vibration test presented above. Under non-operating conditions, the peak pairs associated with the first two tower mode pairs clearly stand out. In operating conditions, additional peaks associated with the rotor rotation frequency appear. The peaks associated with the second pair of bending modes become much more diffuse, which makes their tracking over time quite challenging.
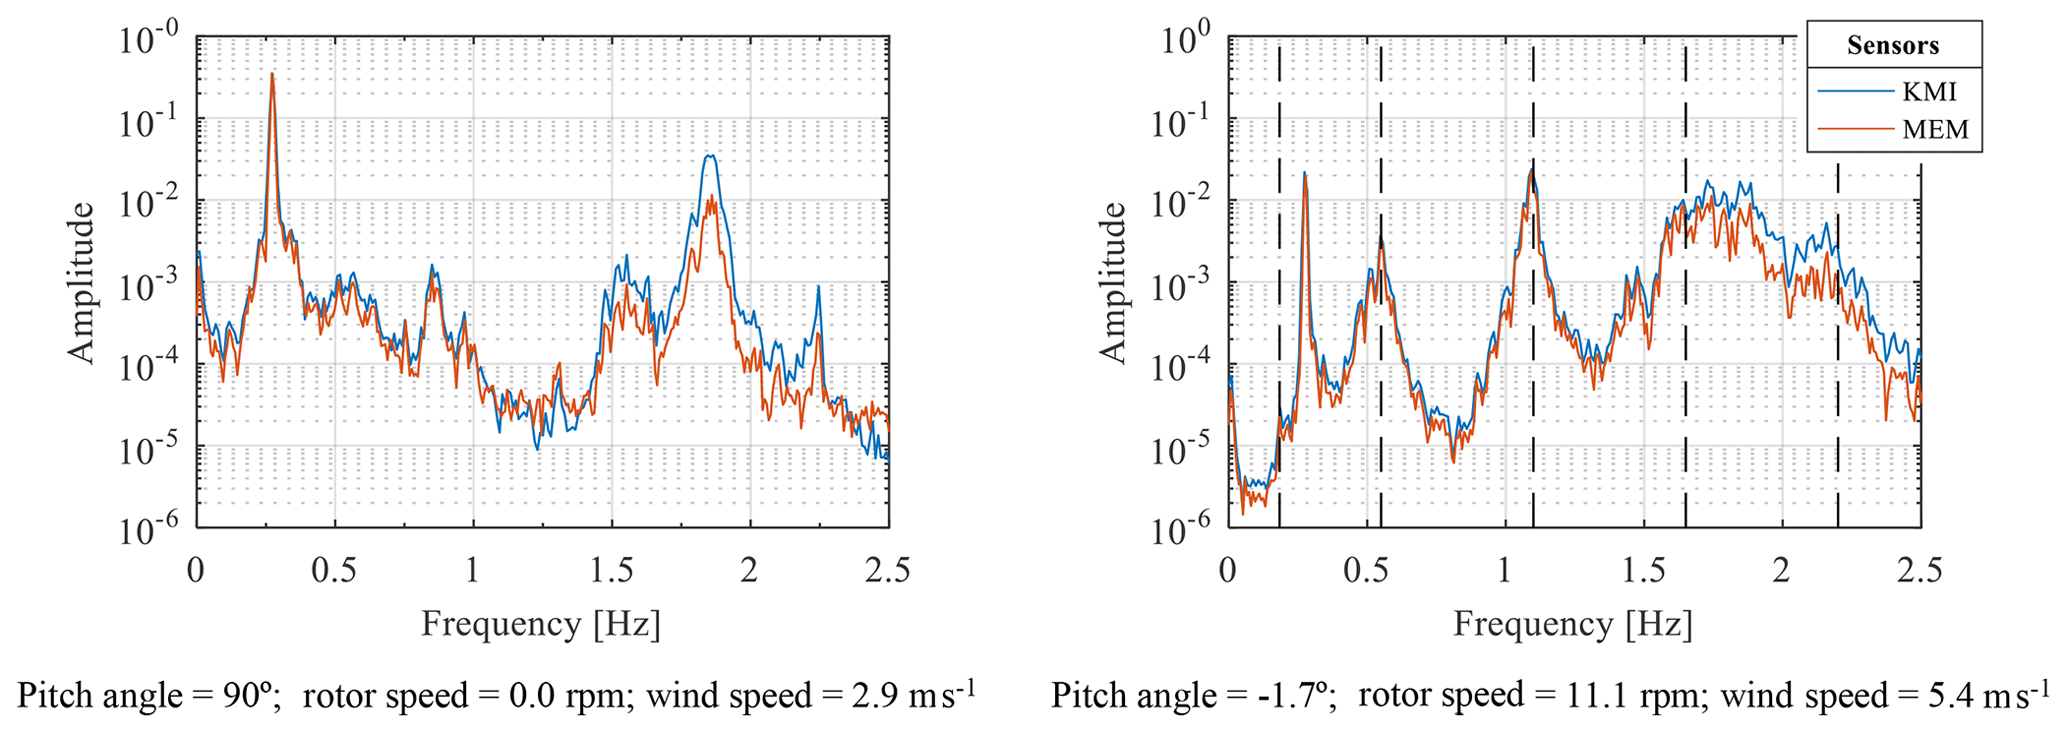
Figure 9Power spectra from force balance (KMI) and MEM sensors (1Ω, 3Ω and 6Ω marked with dashed vertical lines).
Figure 12 shows the colour maps obtained from spectra of singular values calculated with the acceleration time series acquired with the commercial system in January 2019, after their projection according to the FA and SS directions. As might be expected, variations in frequency content are observed over time due to varying operating conditions. It is also possible to visually track the time evolution of the natural frequencies associated with the first two pairs of tower modes.
The data collected by both systems are being processed with the algorithms presented in Oliveira et al. (2018b).
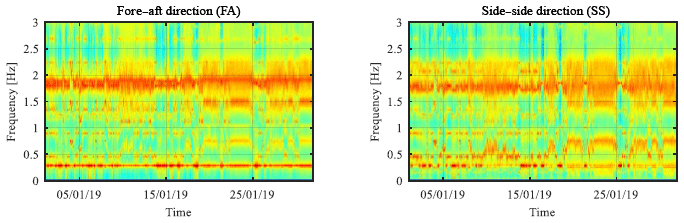
Figure 10Colour maps with singular-value spectra for the FA and SS directions in January 2019.
4.2 Tower-monitoring system: strains and rotations
These monitoring components are essential for fatigue assessment of the tower, and one important goal is the evaluation of two alternatives for estimating static and dynamic bending moment diagrams along the tower: using strain and rotation measurements combined with accelerometers.
The strain system is composed of six 2D rosette strain gauges (measurement of the strain in two orthogonal directions) and four temperature sensors. In order to try to evaluate the static bending moment diagram evolution along the tower, the six strain gauges are distributed in two sections: four sensors 6.5 m from the base of the tower (bottom section) and two sensors 7.7 m from the base of the tower (top section), as shown in Fig. 11. The four temperature sensors are located in the bottom section, close to the strain gauges. Measuring deformation in the direction perpendicular to the tower axis as well as temperatures is important to allow the evaluation of alternative procedures to minimize the influence of temperature on the measured longitudinal deformations.
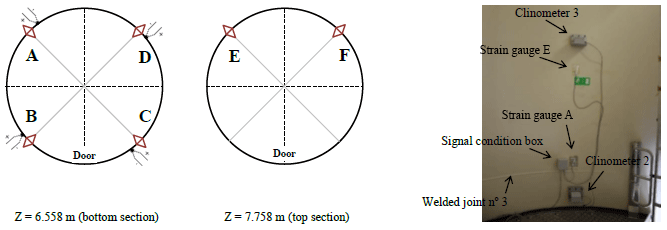
Figure 11Locations of the strain gauges (◇) and temperature
sensors (![]() ) and photograph of the position of the clinometers and strain gauges along
the same vertical alignment (strain gauges A and E).
) and photograph of the position of the clinometers and strain gauges along
the same vertical alignment (strain gauges A and E).

Figure 12Tower-monitoring system strains and rotations: (a) example of strain time series; (b) strain and rotations during nacelle yawing; SG: strains measured by strain gauges; CL: rotations measured by clinometers (see sensor positions in Fig. 11).
The installation of the clinometers aims to measure the rotation at the base of the tower and to alternatively estimate the extensions from the measurement of rotations in two close sections. The main advantage of estimating bending moments from rotations is that the installation of the clinometers is less intrusive than the installation of strain gauges, which involves removing tower painting. The three clinometers were installed along the vertical alignment formed by strain gauges A and E. One of the clinometers was installed close to the foundation (near the base flange), while the other two are positioned according to Fig. 11.
The two monitoring components are connected to a National Instruments digitizer and processor (model cRio 9056, http://www.ni.com, last access: 4 November 2019) installed at the base of the tower. Data acquisition is ensured by a program developed in LabView for this specific application (sample rate of 100 Hz).
Figure 12a shows an example of the strain time series obtained for a stop event of the rotor. Although the main purpose of this monitoring system is to characterize the static component of the response, it is possible to characterize the dynamic component with good accuracy. With this data, it will be relevant to test and compare the various approaches for estimating the dynamic stresses in the tower from acceleration measurements (Maes et al., 2016).
The records obtained from strain gauges are influenced by several factors, including the effect of temperature. Thus, the experimental determination of bending moments in the tower requires the acquired raw data to be preprocessed to obtain the real deformation. In the present application, as a first trial, the methodology presented in Loraux (2018) is being followed. In a general way, this methodology consists of the following steps: (a) correction of the effect of temperature on strain gauges, (b) signal correction based on the average value of the extensions recorded on diametrically opposed sensors and (c) signal calibration according to IEC 61400-13 (2015). For this last step, it is necessary to have a record of strain time series measured during a 360∘ nacelle rotation, with wind speeds lower than the generator cut-in wind speed. The eccentricity of the nacelle and rotor mass generates a sinusoidal signal in the sensors; the mean value of this signal is the zero baseline (Fig. 12b). Applying the described method to the recorded series, the temporal evolution of the bending moments observed in the bottom instrumented section is presented in Fig. 13 for the two main directions, considering two alternative turbine operation scenarios. The experimental results are compared with numerical ones, obtained from a model developed in FAST and calibrated using the methodology described in Pimenta et al. (2019). Please note that this is just a qualitative comparison; the inflows in the experiment and numerical model are different, and only the average wind speed and turbulence intensity are the same.
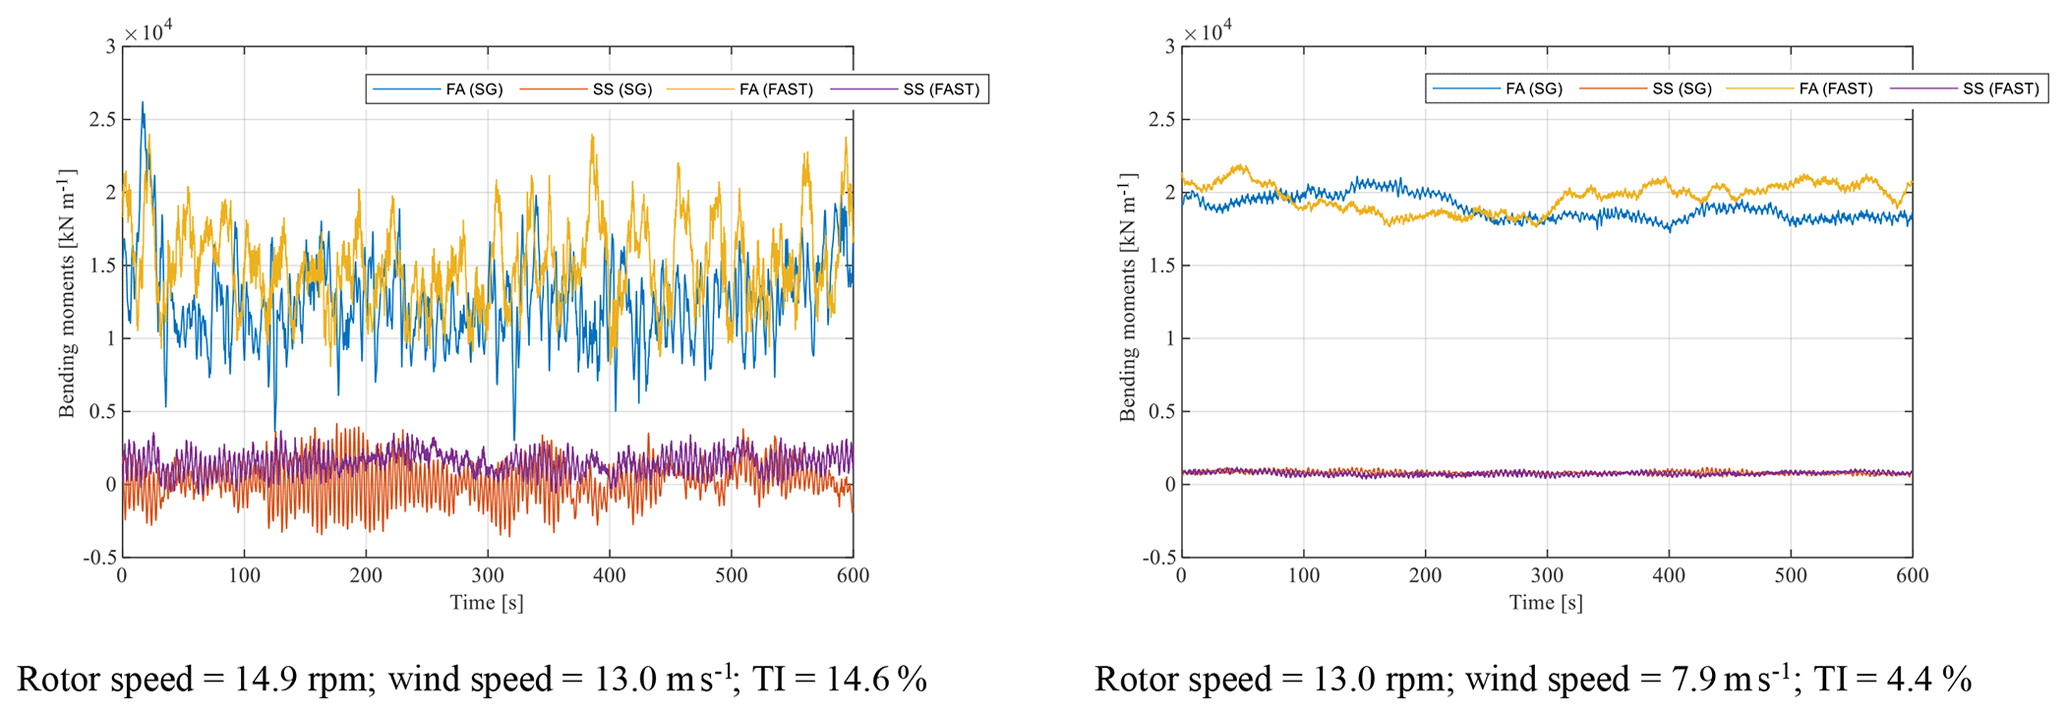
Figure 13FA and SS bending moments in the bottom instrumented section, considering two different operating situations and comparing with numerical FAST results (TI: turbulence intensity).
Figure 14 shows the average spectra of the six force-balance accelerometers (first row); longitudinal deformations recorded by sensors A, B, C and D (second row); and clinometer 3 (third row). Here the parked rotor (left) and the rotor in operation (right) are considered. These spectra show excellent agreement of the results between the alternative monitoring components and demonstrate that it is possible to perform operational modal analysis from the data collected by all these systems.
Comparing the spectra with those shown in Fig. 9, it is clear that the peaks corresponding to the tower-bending modes are more pronounced and clearer, so measuring strains can be very useful in distinguishing tower modes from the rotor modes observed in the tower.
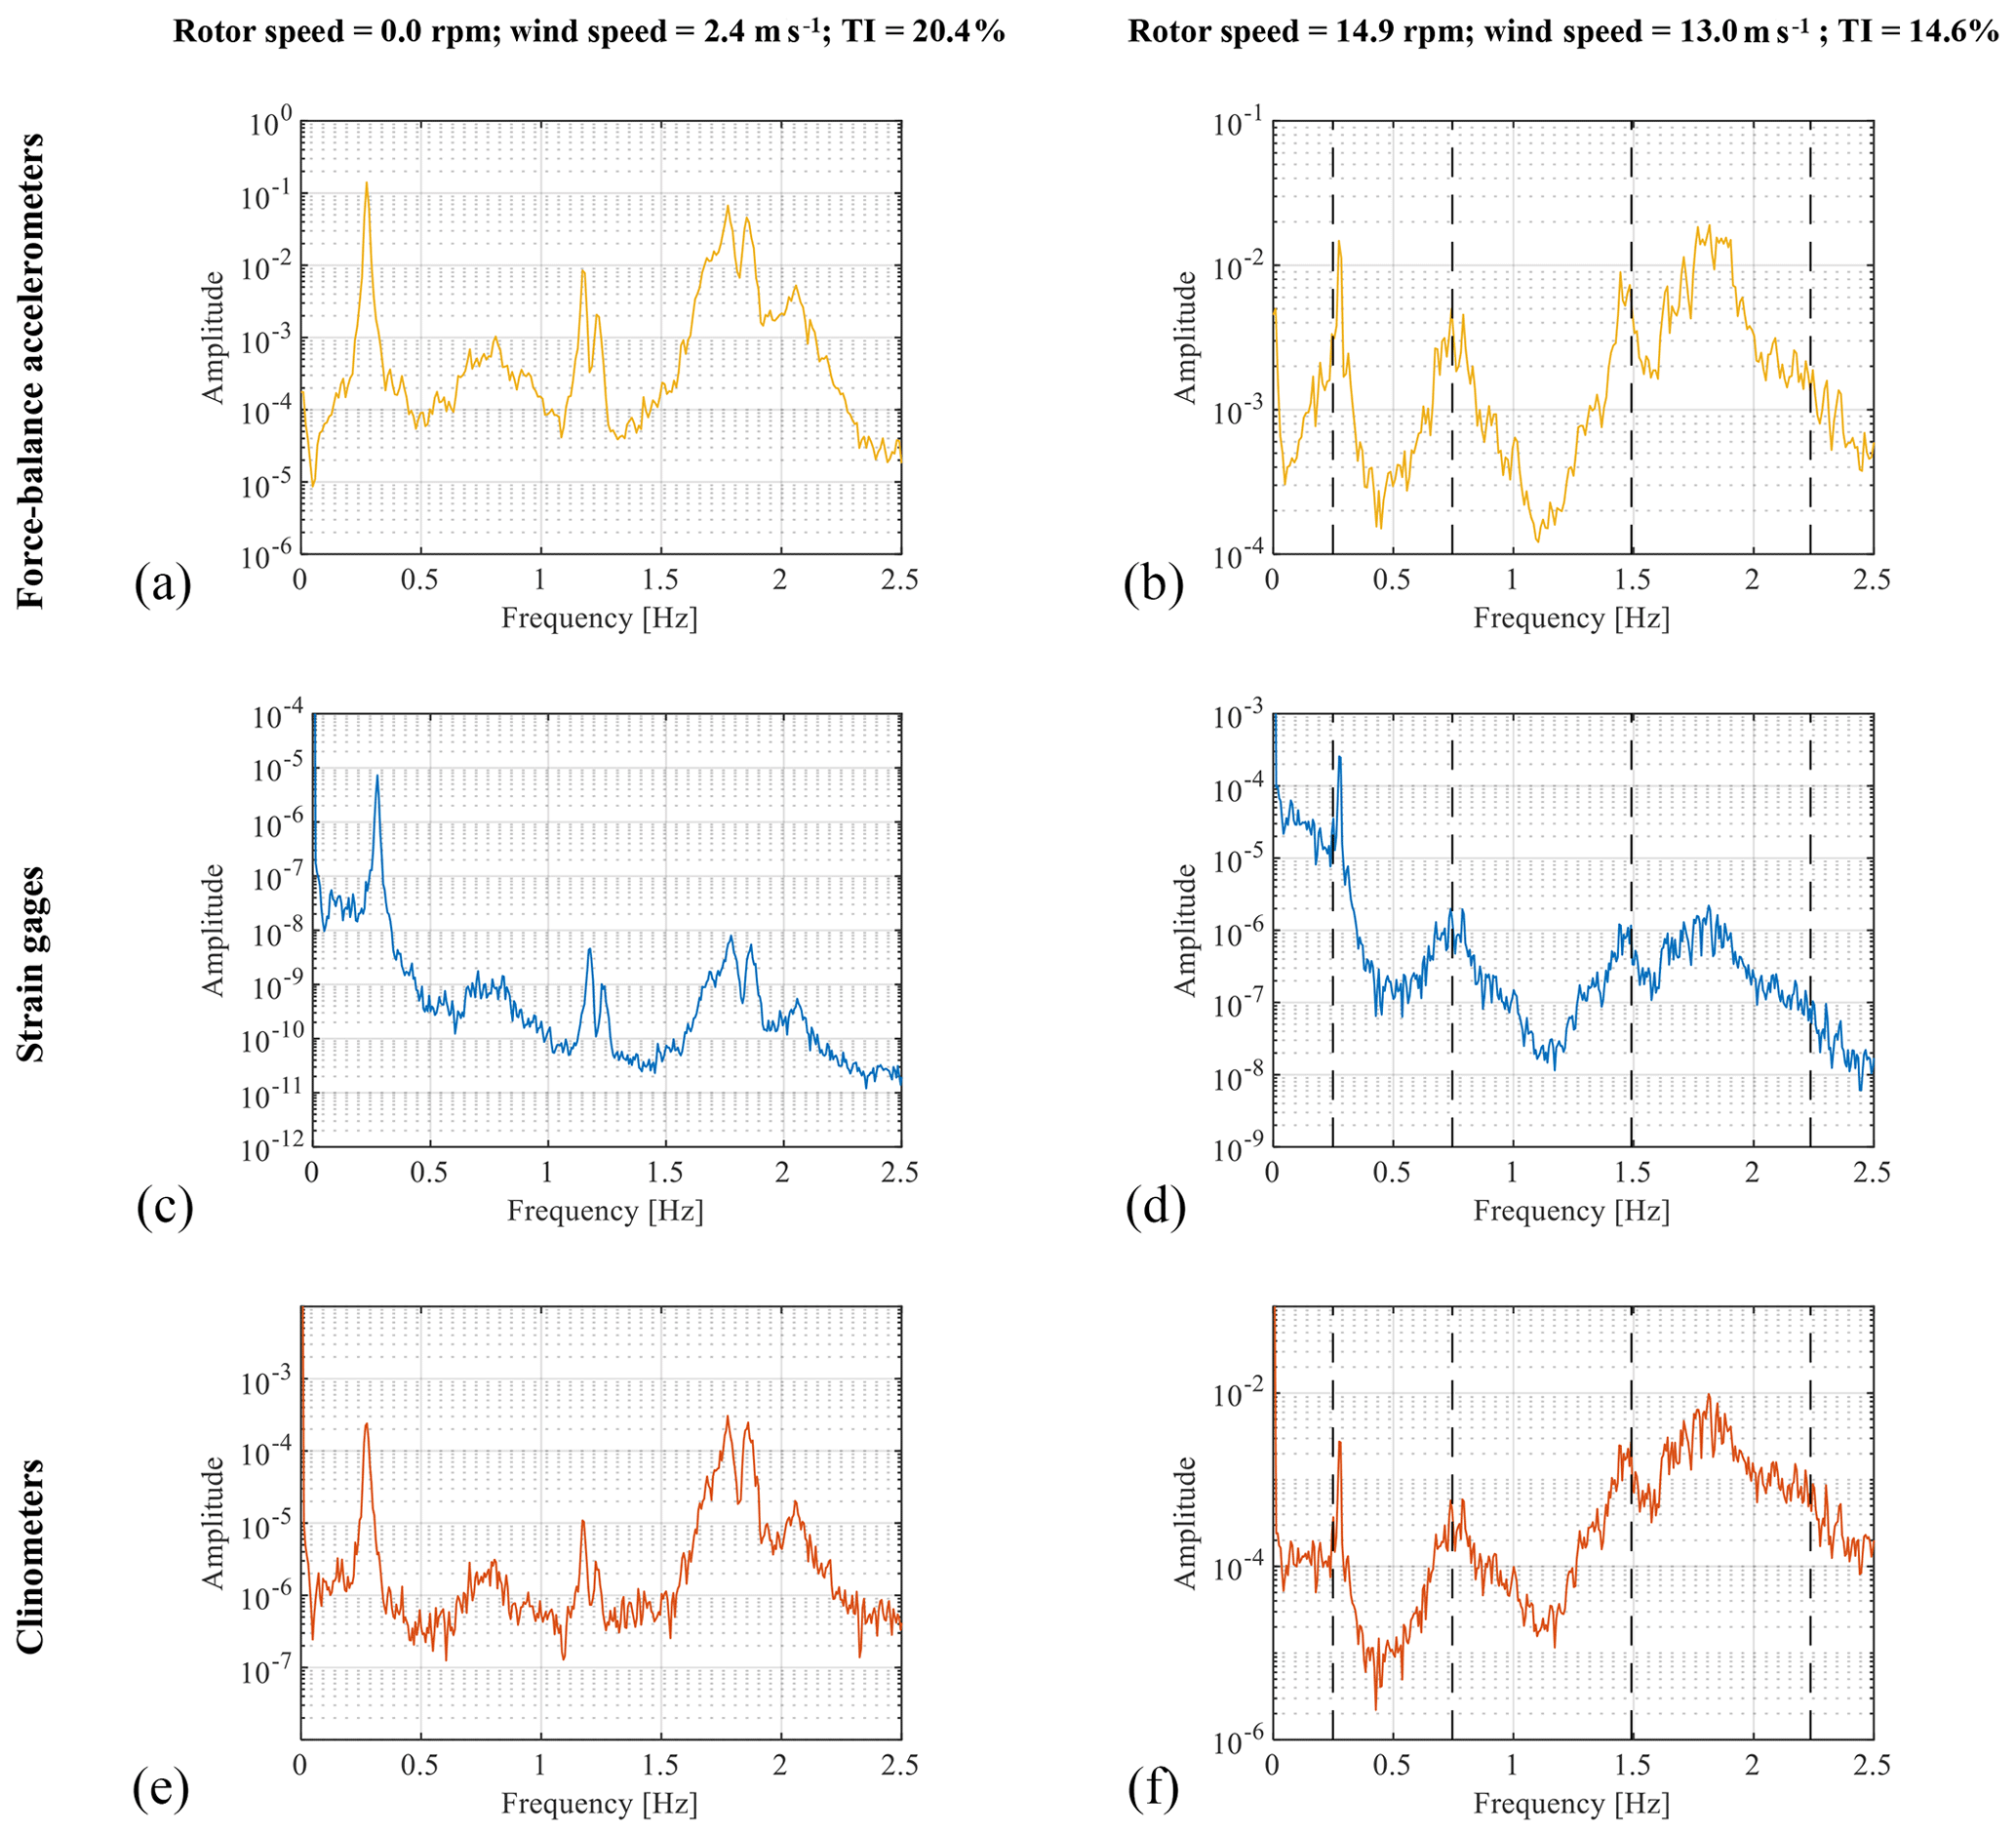
Figure 14Averaged power spectra: longitudinal strains A to D (a, b) and rotation at clinometer 3 (c, d) in non-operating condition (a, c, e) and operating condition (b, d, f).
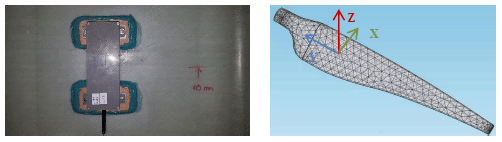
Figure 15MEM-based system installed inside one blade and direction of measurements (X approximately aligned with edge-wise direction).
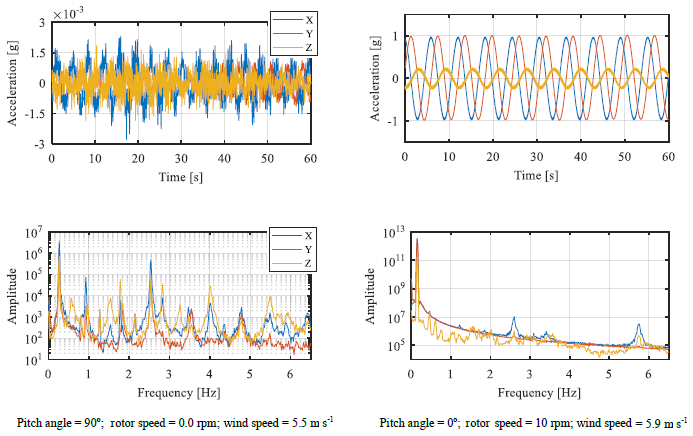
Figure 16Example of acceleration time series, corresponding operation parameters and power spectra.
4.3 Rotor-monitoring system: accelerometers
The goal of this monitoring system is the characterization of the rotor under different operating conditions. The analysis of the results of the ambient-vibration tests shows the existence of several resonance frequencies that could not be attributed to the tower fundamental modes. These are certainly related to modes more dominated by the rotor. In addition, direct identification of rotor modes may be beneficial for automatically detecting blade changes driven by either reduced stiffness due to damage or additional mass due to ice formation. In this way, the same MEM-based devices that were installed in the tower were also installed inside the blades: one in each blade, 10 m from the blade root, as shown in Fig. 15 (sample rate of 62.5 Hz).
From the simultaneous recording of the acceleration time series on the blades it is possible to estimate the modal parameters of the rotor, in particular their modal configurations. However, as this is a preliminary step and since the data available so far are limited, only examples of the time series and their spectra are shown in Fig. 16, considering the stopped rotor (left) and the rotor in operation (right). Signals X,Y and Z are in accordance with the referential signals presented in Fig. 15.
Considering the figures obtained with the parked rotor in addition to the various peaks corresponding to the main tower modes, peaks are also identified for other various resonant frequencies that are certainly associated with the rotor modes. The adopted sensors already measure gravity, as the registered acceleration dominated by the rotor rotation frequency, when the rotor is in operation. Several other frequencies associated with vibration modes in flap-wise (Z) and edge-wise (X) directions can still be observed.
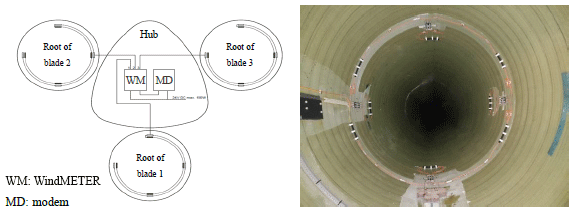
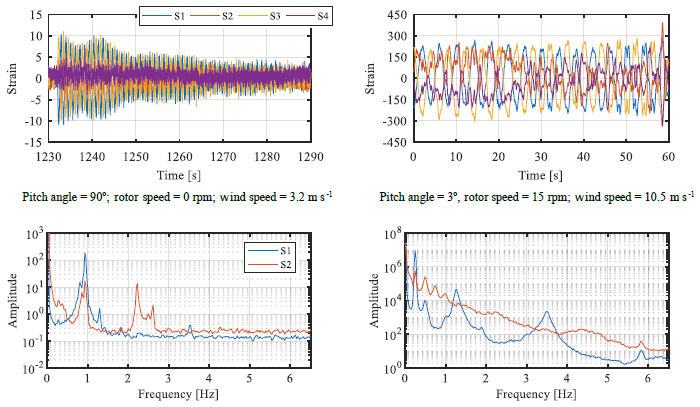
Figure 18Example of detrended strain time series (static component was removed) and corresponding operation parameters (S1 and S3 bending in the edge-wise direction; S2 and S4 bending in the flap-wise direction) and power spectra.
4.4 Rotor-monitoring system: strains
The main goal of blade strain monitoring is to collect data to estimate the fatigue condition of these elements as well as to evaluate their structural performance from the evolution of the continuously estimated modal parameters. On the other hand, the joint analysis of the wind characteristics, the moments acting at the blades and the bending moments at the tower will also be relevant to understand the mechanism of transmission of loads from the rotor to the tower and to validate numerical modelling.
The solution adopted is based on a commercial system provided by HBM FiberSensing called WindMETER (https://www.hbm.com, last access: 4 November 2019), with a sample rate of 100 Hz. Each blade is instrumented with four fibre-optic strain sensors and temperature sensors for compensation of the temperature effects. As shown in Fig. 17, each set of sensors is connected to a central acquisition system installed on the hub, which in turn allows remote access to data via a 3G modem.
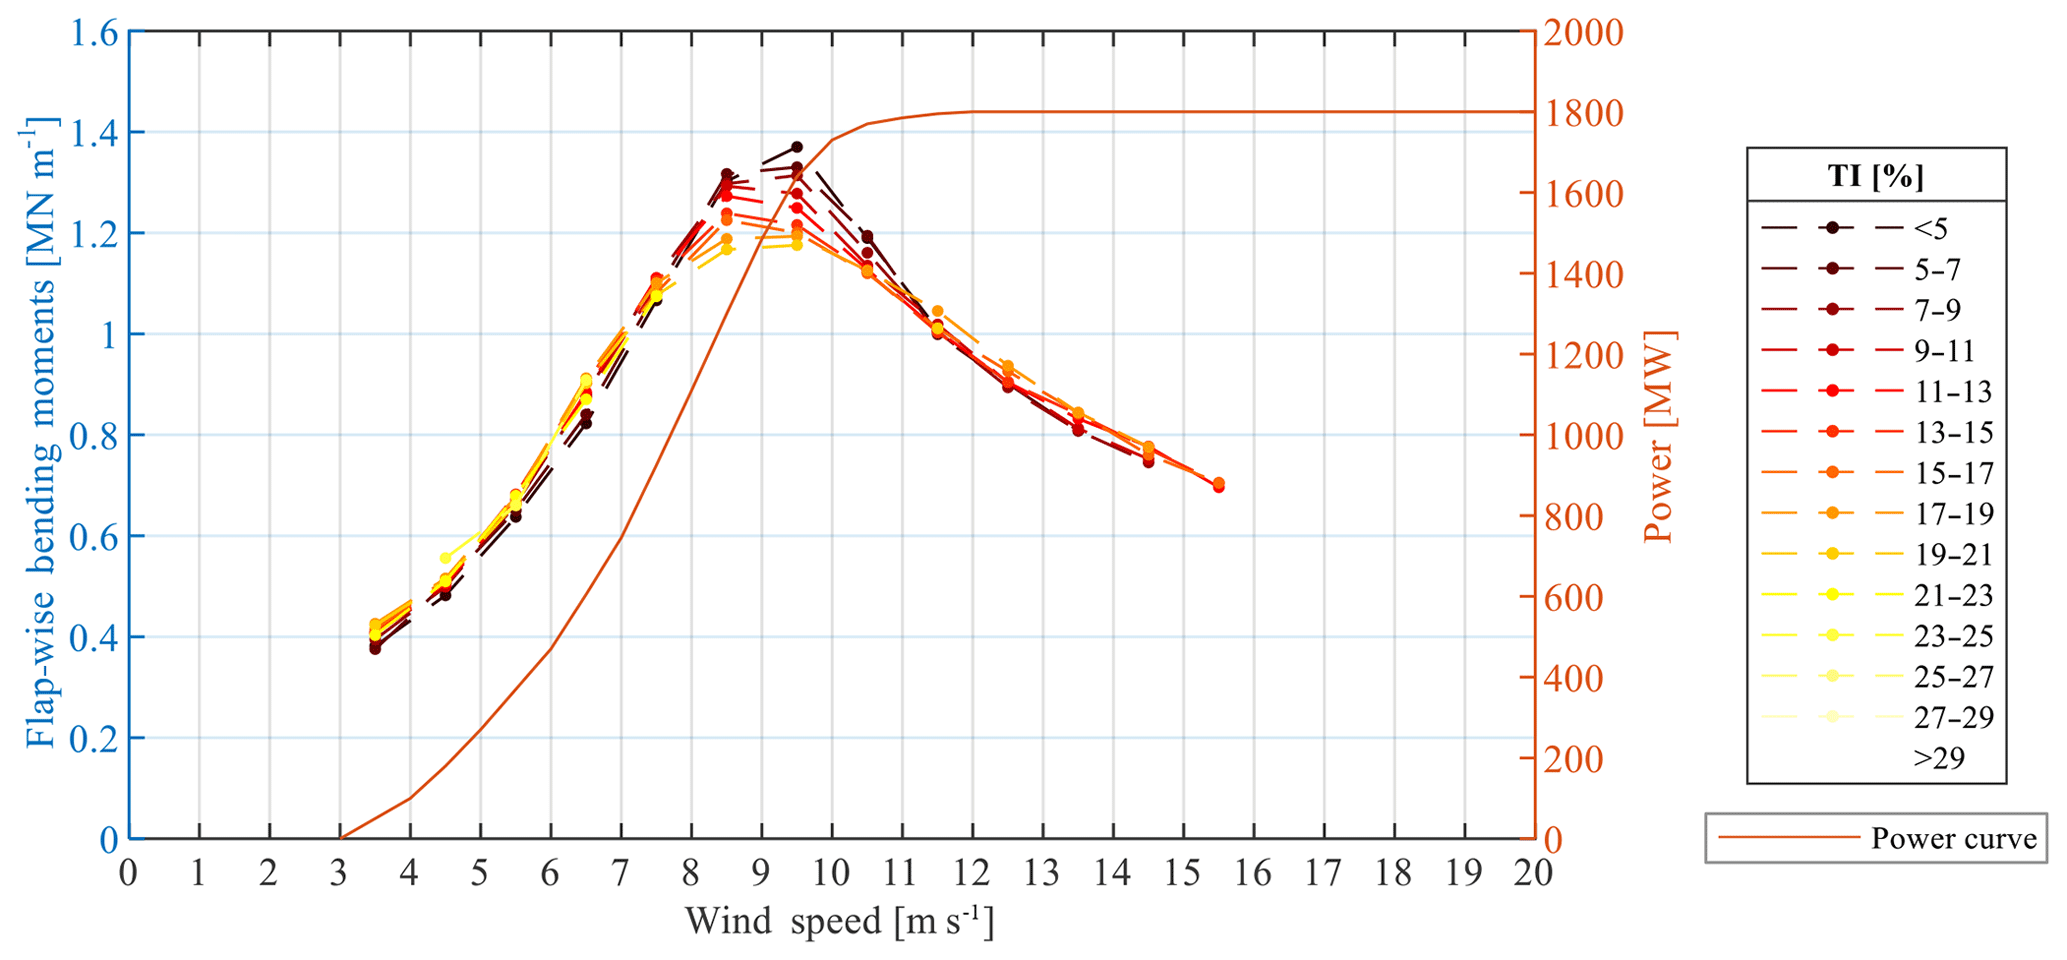
Figure 19Wind turbine power curve and bending moments recorded at blade root B according to flap-wise direction as a function of wind speed and considering different turbulence intensities (5 February to 17 December 2019: 20 027 10 min time series).
As an example, Fig. 18 shows the spectra of two strain time series, considering the stopped rotor (left) and the rotor in operation (right). Sensors S1 and S3 correspond to blade bending according to edge-wise direction, while sensors S2 and S4 correspond to the flap-wise direction. The following results show that the acquired data, besides being fundamental to obtaining the stress history for fatigue analyses, can also be used for operational modal analysis of the structure.
It should be noted that the deformations measured on the blades are not as sensitive to the tower-bending modes as in the case of accelerations since tower movement does not lead to relevant bending levels, although it produces blade movement. Thus, the spectra peaks shown in the spectra can only be motivated by the contribution of the blade modes.
By comparing the spectra of Figs. 17 and 18 for the parked situation, it is possible to identify several coincident peaks for the same frequencies. While in operation, the observed resonant frequencies depend on the rotor speed of the rotor, so the peaks do not coincide.
As noted with respect to measuring tower extensions, a similar methodology was also followed for processing the blade strain records. Note that the calibration step according to the standard IEC 61400-13, 2015 is not yet fully tuned. However, the data acquired so far allow the elaboration of Fig. 19, which represents the evolution of the bending moments at blade root B (wind turbine 1) in the flap-wise direction as a function of wind speed and considering different turbulence intensities. Firstly, the moment value increases as the wind speed increases. When the wind turbine's nominal wind speed (12 m s−1) is reached, the actuation of the pitch angle mechanism causes the momentum to decrease even though the wind speed continues to increase.
This paper presents the quite extensive monitoring campaign that is being conducted at the Tocha wind farm, describes the installation of the monitoring components that are already in operation and presents some preliminary results.
The preliminary analyses performed in the frequency domain show that operational modal analysis has the potential to extract useful information from both strain and acceleration measurements performed in either the tower or the blades.
A deeper processing of the data that are being continuously collected by all the monitoring components will certainly contribute to a better understanding of the in-operation dynamic behaviour of these quite complex structures and allow processing procedures for the effective evaluation of their structure health to be devised and accumulated damage due to fatigue to be calculated. This step will be instrumental in defining the most effective procedures for assessing structural performance and for estimating accumulated fatigue damage.
The analysis of the data simultaneously collected in several wind turbines will be very important for understanding the relationship between the observed fatigue wear and for devising techniques to extrapolate results from some wind turbines to the others.
The data collected with the monitoring system installed at the wind farm as well as the technical information provided by EDP Renewables and Vestas are confidential and only available to the authors.
JP is responsible for the processing of the monitoring data collected at the tower and coordinated the writing of the paper. SG, MM and JCM are responsible for the installation of the strain gauges in the blades and corresponding data processing. CM coordinated the design and development of the MEMS-based accelerometers installed in the tower and blades. FM is the principal investigator of the project and coordinated the monitoring activities and the preparation of the paper. All authors have read and agreed to the published version of the paper.
The authors declare that they have no conflict of interest.
This article is part of the special issue “Wind Energy Science Conference 2019”. It is a result of the Wind Energy Science Conference 2019, Cork, Ireland, 17–20 June 2019.
The authors would like to acknowledge all the collaboration and support provided by INEGI, EDP Renewables, Vestas Design Centre Porto, Vestas O&M Portugal and HBM FiberSensing, S.A.
This work was financially supported by (1) a PhD grant of João Pacheco (SFRH/BD/129688/2017), (2) UID/ECI/04708/2019 – CONSTRUCT – Instituto de I&D em Estruturas e Construções and (3) research project PTDC/ECI-EST/29558/2017, all funded by national funds through the FCT/MCTES (PIDDAC).
This paper was edited by Athanasios Kolios and reviewed by Lisa Ziegler and one anonymous referee.
Autodesk: Robot Structural Analysis Professional (Version 29.0.05650(x64)), 2016.
EWEA: Wind energy in Europe: Scenarios for 2030, Brussels, Belgium, 2017.
EWEA: Wind in power 2017 – Annual combined onshore and offshore wind energy statistics, Brussels, Belgium, 2018.
Google: Google Maps location of Tocha Wind Farm, Tocha, Cantanhede, Coimbra, Portugal, available at: https://www.google.com/maps/@39.5170771,-9.4259083,7.5z, last access: 21 March 2018a.
Google: Google Maps location of Tocha Wind Farm, Tocha, Cantanhede, Coimbra, Portugal, available at: https://www.google.com/maps/@40.3244121,-8.8220541,7848m/data=!3m1!1e3, last access: 21 March 2018b.
IEC 61400-13: IEC 61400-13 Wind energy generation systems – Part 13: Measurement of Mechanical Loads, International Electrotechical Commission (IEC), 2015.
Jonkman, J., Butterfield, S., Musial, W., and Scott, G.: Definition of a 5-MW Reference Wind Turbine for Offshore System Development, National Renewable Energy Laboratory (NREL), 2009.
Loraux, C. and Brühwiler, E.: The use of long term monitoring data for the extension of the service duration of existing wind turbine support structures, J. Phys. Conf. Ser., 753, 1742–6596, 2016.
Loraux, C. T.: Long-term monitoring of existing wind turbine towers and fatigue performance of UHPFRC under compressive stresses, École Polytechnique Fédérale de Lausanne, Lausanne, 2018.
Maes, K., Iliopoulos, A., Weijtjens, W., Devriendt, C., and Lombaert, G.: Dynamic strain estimation for fatigue assessment of an offshore monopile wind turbine using filtering and modal expansion algorithms, Mech. Syst. Signal Pr., 76, 592–611, https://doi.org/10.1016/j.ymssp.2016.01.004, 2016.
Magalhães, F. and Cunha, A.: Explaining Operational Modal Analysis with data from an arch bridge, Mech. Syst. Signal Pr., 25, 1431–1450, 2011.
Moutinho, C. and Cunha, A.: Contribution to new solutions of instrumentation of Civil structures for continuous dynamic monitoring, IX ECCOMAS Thematic Conference on Smart Structures and Materials (SMART 2019), Paris, France, 2019.
Oliveira, G., Magalhães, F. Cunha, A., and Caetano, E.: Vibration based damage detection in a wind turbine using one year of data, Structural Control and Health Monitoring, 25, e2238, https://doi.org/10.1002/stc.2238, 2018a.
Oliveira, G., Magalhães, F., Cunha, A., and Caetano, E.: Continuous dynamic monitoring of an onshore wind turbine, Eng. Struct., 164, 22–39, 2018b.
Pimenta, F., Branco, C. M., Teixeira, C. M., and Magalhães, F.: Calibration of onshore wind turbine numerical model using experimental data, 15th EAWE PhD Seminar on Wind Energy, Nantes, France, 2019.
Sprague, M., Jonkman, J. M., and Jonkman, B.: FAST Modular Framework for Wind Turbine Simulation: New Algorithms and Numerical Examples, in: Proc. 33rd Wind Energy Symposium, Kissimmee, Florida, 2015.
Weijtjens, W., Noppe, N., Verbelen, T., Iliopoulos, A., and Devriendt, C.: Offshore wind turbine foundation monitoring, extrapolating fatigue measurements from fleet leaders to the entire wind farm, J. Phys. Conf. Ser., 753, 1742–6596, 2016.
Weijtjens, W., Verbelen, T., Capello, E., and Devriendt, C.: Vibration based structural health monitoring of the substructures of five offshore wind turbines, Procedia Engineer., 199, 2294–2299, 2017.
- Abstract
- Introduction
- Tocha wind farm
- Preliminary evaluation of the modal properties of the wind turbines
- Monitoring systems and preliminary monitoring results
- Conclusions
- Data availability
- Author contributions
- Competing interests
- Special issue statement
- Acknowledgements
- Financial support
- Review statement
- References