the Creative Commons Attribution 4.0 License.
the Creative Commons Attribution 4.0 License.
 | 16 Sep 2021
Statistical impact of wind-speed ramp events on turbines, via observations and coupled fluid-dynamic and aeroelastic simulations
Søren Juhl Andersen
Ásta Hannesdóttir
Via 11 years of high-frequency measurements, we calculated the probability space of expected offshore wind-speed ramps, recasting it compactly in terms of relevant load-driving quantities for horizontal-axis wind turbines. A statistical ensemble of events in reduced ramp-parameter space (ramp acceleration, mean speed after ramp, upper-level shear) was created to capture the variability of ramp parameters and also allow connection of such to ramp-driven loads. Constrained Mann-model (CMM) turbulence simulations coupled to an aeroelastic model were made for each ensemble member, for a single turbine. Ramp acceleration was found to dominate the maxima of thrust-associated loads, with a ramp-induced increase of 45 %–50 % for blade-root flap-wise bending moment and tower-base fore–aft moment, plus ∼ 3 % per 0.1 m/s2 of bulk ramp-acceleration magnitude.
The ensemble of ramp events from the CMM was also embedded in large-eddy simulation (LES) of a wind farm consisting of rows of nine turbines. The LES uses actuator-line modeling for the turbines and is coupled to the aeroelastic model. The LES results indicate that the ramps, and the mean acceleration associated with them, tend to persist through the farm. Depending on the ramp acceleration, ramps crossing rated speed lead to maximum loads, which are nearly constant for the third row and further downwind. Where rated power is not achieved, the loads primarily depend on wind speed; as mean winds weaken within the farm, ramps can again have U < Vrated. This leads to higher loads than pre-ramp conditions, with the distance where loads begin to increase depending on inflow Umax relative to Vrated. For the ramps considered here, the effect of turbulence on loads is found to be small relative to ramp amplitude that causes Vrated to be exceeded, but for ramps with Uafter < Vrated, the combination of ramp and turbulence can cause load maxima. The same sensitivity of loads to acceleration is found in both the CMM-aeroelastic simulations and the coupled LES.
- Article
(8893 KB) - Full-text XML
- BibTeX
- EndNote


The passage of ramp-like events, whereby wind speed increases significantly over a span of seconds or minutes, can significantly affect the performance of megawatt-scale wind turbines, in terms of loads as well as power production. These events are often associated with the passage of cold fronts (e.g., Musilek and Li, 2011) but are also caused by a number of other mechanisms, depending on the surroundings (Gallego-Castillo et al., 2015; Hannesdóttir and Kelly, 2019). Wind ramps can persist through entire wind farms (as we also show below) – more so than turbulent fluctuations, which are limited in scale and become affected by the turbines themselves (Andersen et al., 2017b).
The basic ramp quantities directly associated with wind-speed ramp events are the rise time (Δt) and ramp amplitude (ΔU). In addition to these, a number of observable atmospheric flow quantities can affect turbine loads and performance during the passage of such events; the ramp acceleration can affect the loads and production more significantly than ΔU or Δt alone (e.g., Hannesdóttir, 2019; Hannesdóttir et al., 2021). The primary observable non-ramp quantity, which is expected to affect a wind farm's response to ramps, is the above-rotor shear connected with the capping inversion of the atmospheric boundary layer (Abkar and Porté-Agel, 2013; Kelly et al., 2019a); it impacts how much momentum can mix downward into the farm (e.g. Allaerts and Meyers, 2014) and presumably affects the ramp decay (e.g., Porté-Agel et al., 2020). Although the standard deviation of streamwise velocity fluctuations (σu) and turbulence length scale (Lt) generally affect turbine loads and performance, for ramp-like events Hannesdóttir et al. (2019) found them to be secondary compared to ramp-associated quantities. Thus we are considering the effects on turbine loads and power for a given rated speed Vrated, in terms of the variable space consisting of ΔU, Δt, , Ubefore, σu, and Lt. More specifically, we aim to connect the variability in turbine loads to the long-term statistics of ramps; i.e., to find the statistical effect of wind ramps on wind farms.
There are a number of limitations within commonly used models and observations, which motivate the methods we will use in this study. Within weather-forecasting models, the inability of planetary-boundary-layer schemes to represent various physical processes giving rise to ramps has limited the ability of the former to predict ramp-like events (Jahn et al., 2017).
Regarding observations, DeMarco and Basu (2018) looked at statistics primarily based on 10 min averages, with limited analysis based on 1 min averages from a site in the lee of steep mountains; others have also considered 10 min mean statistics, but these do not reliably capture the accelerations (or variability) inherent in ramps – nor do they permit systematic connection of ramp characteristics with turbine loads, due to the shorter timescales involved (e.g., Alcayaga, 2017; Dimitrov and Natarajan, 2017). Thus we examine observational data with sampling rates high enough to adequately characterize ramp-like events (1 Hz) and employ models which can also resolve velocity fluctuations to such a fine timescale as well as resolving velocity fields with a resolution significantly smaller than turbine blades.
We first report on the probabilistic characterization of wind-speed ramps and then describe two associated model chains developed and employed to simulate the propagation of ramps through a wind farm; this is followed by analysis of the modeling results for relevant turbine loads. The probabilistic characterization involves reduction of atmospheric quantities to a more compact and universal space, as well as creation of a statistically representative ensemble of events which can be simulated in the two model chains. The two model chains are both driven by Mann-model turbulence (Mann, 1994, 1998), with the synthesized turbulence constrained (Dimitrov and Natarajan, 2017) to include wind-speed ramps (Hannesdóttir et al., 2019). The simpler model chain also has the aeroelastic model Flex5 for a single turbine; the other embeds constrained ramp simulations within large-eddy simulation (LES) of a wind farm with actuator-line modeling (Sørensen and Shen, 2002) coupled to Flex5.
In order to obtain statistics describing offshore wind-speed ramps, we analyzed the longest time series of high-frequency wind data available at common turbine hub heights: 11 years of 1 Hz wind velocity data from the Høvsøre turbine test center on the western coast of Denmark (Peña et al., 2016). Using the streamwise velocity at 100 m height, for the dominant winds crossing the coastline, we are able to effectively obtain offshore statistics at and above this height from Høvsøre (see also, e.g., Berg et al., 2015). To detect ramp events, 10 min records with the largest variances relative to turbulence strength are selected; the top 0.1 % of values of m/s) are found, where σu,hpf is the turbulent (high-pass filtered) part of σu – as in Hannesdóttir and Kelly (2019)1. Keeping events where the wind speed is increasing, we identify 216 wind ramp events. Distributions of ΔU and Δt, which are obtained by the ramp-detection method for each ramp, are shown in Fig. 1.

Figure 1Distributions of ramp amplitude and rise time. Yellow: all events; blue/gray: excluding events which exceed cutout or start above rated speed.
One consideration we add is whether the ramps begin below rated wind speed and subsequently cross over it – as well as whether the wind speed exceeds the turbine cutout speed (Vcut) for a given ramp. Our aeroelastic modeling employs a NEG Micon (Vestas) NM80 turbine (Aagard Madsen et al., 2010; Galinos and Larsen, 2015), with upscaled rated power of 2.75 MW at Vrated=14 m/s and cutout speed Vcut=25 m/s (Andersen et al., 2017a)2. The dominant ramp effects on power and loads occur during normal operation (Hannesdóttir et al., 2019), and ramps have a relatively smaller effect on operation at speeds above Vrated because the blades have already pitched; thus we exclude ramp cases where the starting speed is above Vrated or where the ramp-end speed is above Vcut. The effect of this can be seen in Fig. 1; while the frequency of occurrence is slightly reduced, the shapes of both P(ΔU) and P(Δt) are essentially unaffected. We further note that both distributions (particularly the rise time) are better represented in log space, with the distribution of ramp amplitude appearing to be lognormal.
Similar to the ramp magnitude and duration, the distribution of acceleration is also seen more conveniently in logarithmic space; this is shown in Fig. 2. Unlike P(ΔU) and P(Δt), the shape of the ramp-acceleration distribution is affected by rejection of events which exceed cutout turbine speed and start above rated speed. From Fig. 2 one can see the smallest accelerations being filtered out; those below 0.01 m/s2 are roughly halved. These do not affect the turbine, since turbulent accelerations override the ramp for such small ; furthermore, the high-acceleration tail remains essentially unchanged by the filtering, as seen in the figure.
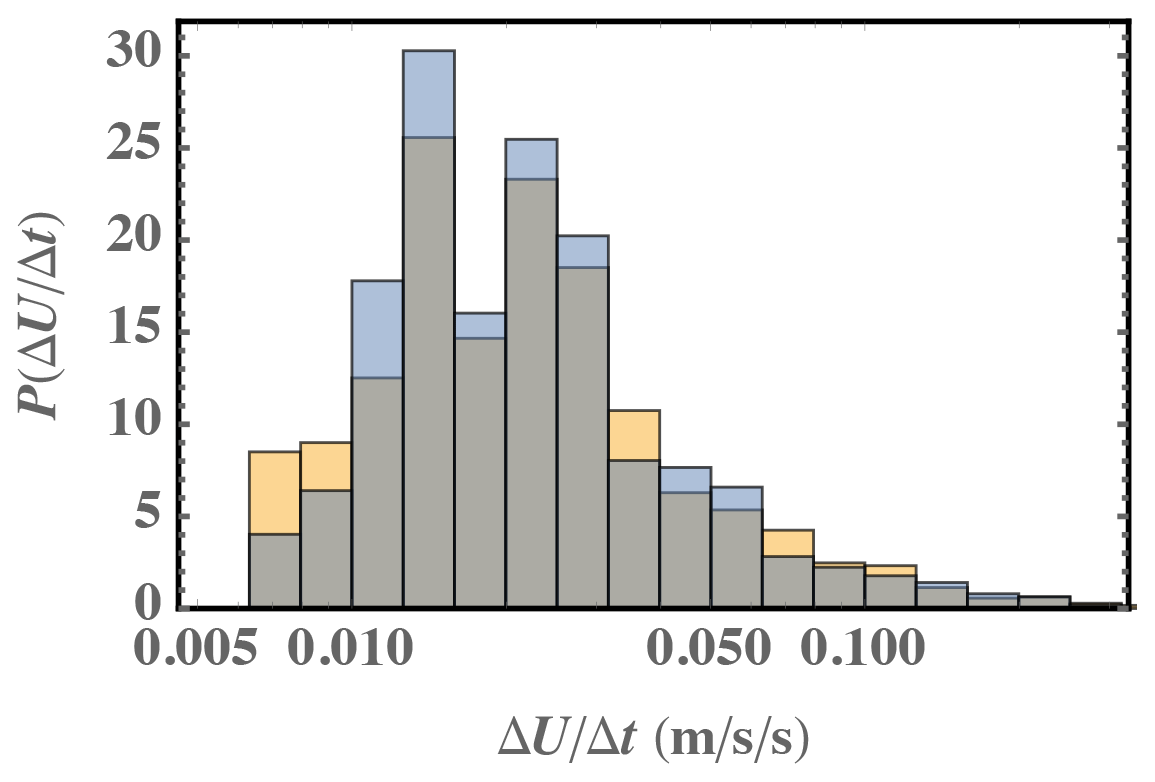
Figure 2Probability density function of (mean) ramp accelerations, with logarithmic axis for . Yellow: all events; blue: excluding events which exceed cutout or start above rated speed (as in Fig. 1); gray: overlap of blue/yellow.
The upper-rotor shear is also calculated, using the anemometer at 160 m along with that at 100 m. Although some ramps can be tilted in the streamwise direction (i.e., closer to the ground the ramp arrives later) and possess a transient shear associated with such tilt, this has a relatively small effect on the loads considered (Hannesdóttir et al., 2017)3 and is beyond the scope of the current study. The shear () tends to be different before and after ramps, especially because most of these events are related to the passage of fronts. As mentioned above, the shear above the rotor is the most readily measured external factor that can be used to diagnose downward entrainment of momentum and turbulent mixing into the farm. It is connected with atmospheric stability (Kelly et al., 2014) and particularly influenced by the capping temperature inversion and thus the depth of the atmospheric boundary layer (Kelly et al., 2019a). Distributions of the free-stream shear across the rotor (calculated as U160 m−U60 m) and the upper/above-rotor shear (U160 m−U100 m), both before and after ramp passage, are shown in Fig. 3. We examine instead of the shear exponent () because is directly involved in the momentum (entrainment) flux.4 Figure 3 also shows that the shear before the ramps is on average slightly larger than after the passage of a ramp event, and the upper-rotor is smaller than the full-rotor shear. We note the shear before and after ramp events is unrelated, with an increase or decrease possible; the distribution of the difference between shear before and after (not shown) is centered around 0 but has a width comparable to the shear distributions themselves.

Figure 3Probability distribution of shear in the periods before (black) and after (red) the detected ramp events. Solid line denotes whole-rotor shear (as U160 m−U60 m); dotted/dashed line denotes upper-rotor shear (U160 m−U100 m).
We do not directly address the strength of turbulent fluctuations (σu), i.e., the turbine response statistics related to variability in σu, because the ramp amplitudes and associated accelerations are generally large enough to be more significant than such background turbulence. This is supported by comparison of Fig. 1 with distributions of σu shown in Fig. 4, where each σu sample is calculated over the full (10 min) period corresponding to a given ramp, and the probability density function (PDF) is the collection of all ramp-period samples. The portion of wind variation due to turbulence (σu,hpf), apart from the ramp, is also shown; this is calculated using a second-order high-pass Butterworth filter and filter frequency of , where U is the 10 min mean wind speed and Lc=2 km as in Hannesdóttir and Kelly (2019). In Fig. 4 one sees that the turbulence variation σu,hpf is small compared to the ramp amplitudes ΔU and the σu associated with the ramps: the peak of P(σu,hpf) is at less than 1 m/s, whereas the peak of P(σu) is ∼ 2.5 m/s, and the peak of P(ΔU) is about 7 m/s with ΔU ranging from 3–15 m/s for the events considered. One also sees that rejection of the cases exceeding cutout does not affect σu, though it is tied to a slight reduction in the turbulence strength σu,hpf. However, this is not significant, given that the ramps dominate the inflow to the turbines.

Figure 4Probability density functions of standard deviation of wind speed over all ramp periods. Dashed-blue line is unfiltered σu over all ramps; dashed-orange line is high-pass filtered turbulence (σu,hpf); solid green line is σu excluding events exceeding Vcut or starting above Vrated; solid red line is σu,hpf also excluding such events.
2.1 Joint statistics: practical and systematic event characterization
In order to investigate the relevant statistical space describing the inflow encountered by turbines during ramp events, we look deeper than the marginal distributions shown above. An initial picture of the ramp event probability space is given by Fig. 5, which displays each ramp as a point {Δt,ΔU}. Due to the consideration of Vrated and Vcut it is useful to include the wind speed; the figure also displays Ubefore for each ramp-like event found. Figure 5 indicates a concentration of most likely rise times and amplitudes around 7–8 m/s, 300–400 s}, which can also be seen in the joint distribution of Δt and ΔU (not shown) and consistent with the distributions P(Δt) and P(ΔU) shown earlier in Fig. 1. Further, one can see that ramps are more often preceded by relatively strong winds; this is consistent with passage of cold fronts in midlatitude areas.
For a given turbine, the rated speed is expected to have an impact on its response to ramps. So in Fig. 6a we show the joint distribution of ramp amplitudes and pre-ramp wind speeds, P(ΔUUbefore), as well as indicating which events cross Vrated. Figure 6b shows the distributions of mean wind speeds before and after ramp events. From this P(ΔUUbefore) and Fig. 1 we note that the most likely ramp events with amplitudes below the peak of P(ΔU) tend to occur with initial speeds larger than what the peak of the simple marginal distribution P(Ubefore) would seem to imply; i.e., there is a joint trend where smaller ramp amplitudes tend to occur with larger pre-ramp wind speeds. One further sees in Fig. 6a the number and distribution of events which involve wind speed crossing Vrated, indicated by the yellow line; a fraction of ramps (∼ ) have Uafter<Vrated. Figure 6a also indicates the small number of rejected events (∼ 5 %) exceeding turbine cutout speed, which lay above the blue line.
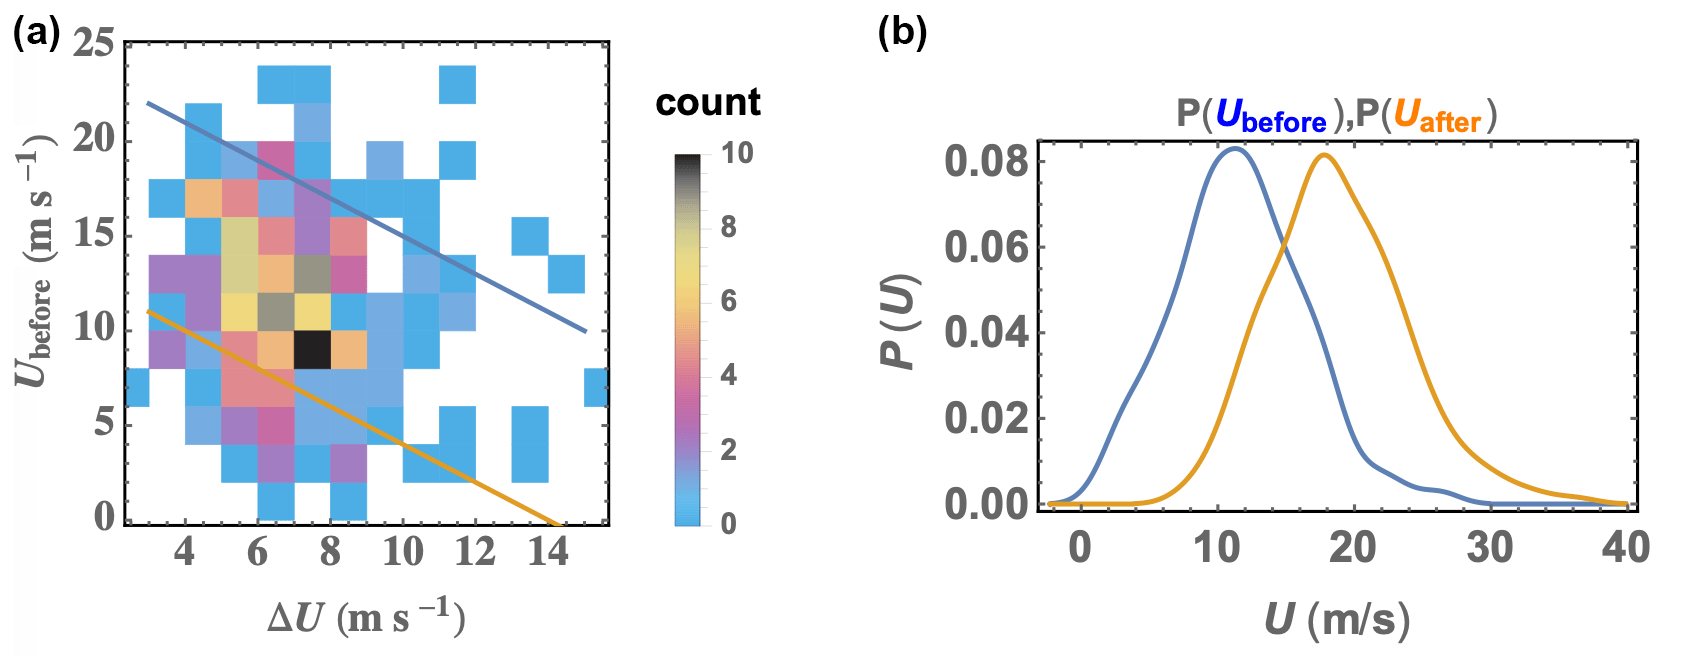
Figure 6(a) Joint distribution of ramp amplitude and speed before ramp; points above blue line are above cutout (rejected), and points below yellow line do not cross from below to above Vrated. (b) Distribution of speed before and after ramp events.
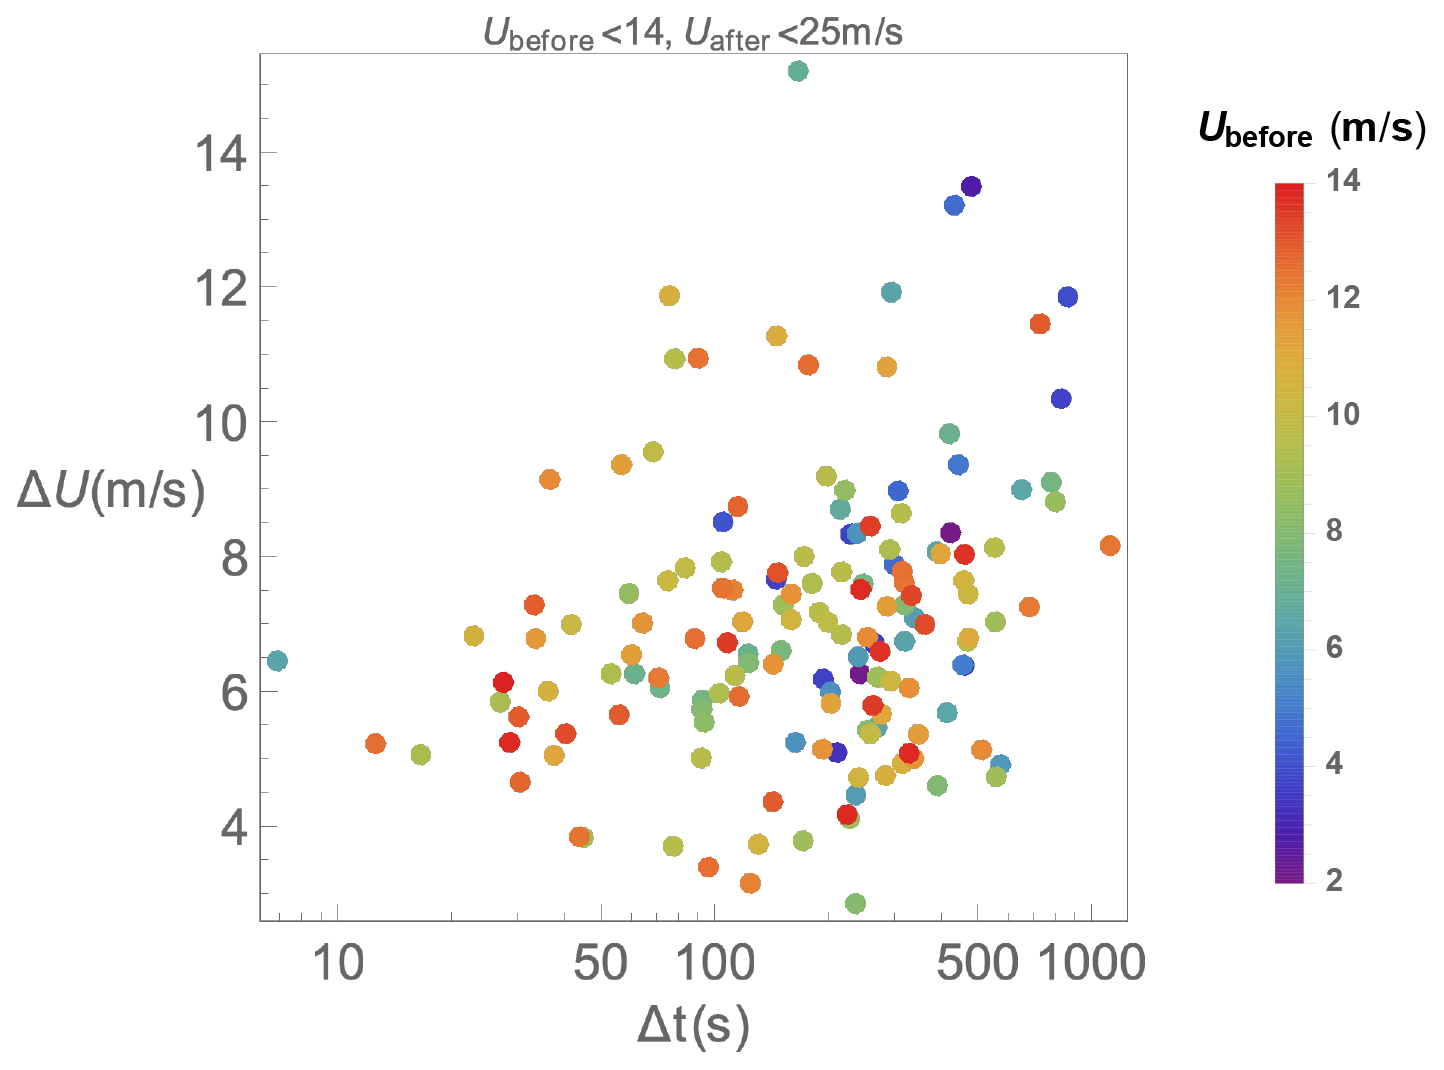
As mentioned above, in previous related work with aeroelastic simulations, wind turbines have shown more sensitivity to ramp acceleration ( than to ramp amplitude (ΔU). But aside from its contribution to , the ramp amplitude can have primary significance for events which do not exceed Vrated (points falling below the yellow line in Fig. 6), as we will see in the next section. The strongest ramp accelerations appear to be correlated with the wind speed before ramp passage; this is demonstrated by Fig. 7, which displays ). For the largest bulk accelerations, one sees that roughly follows Ubefore.
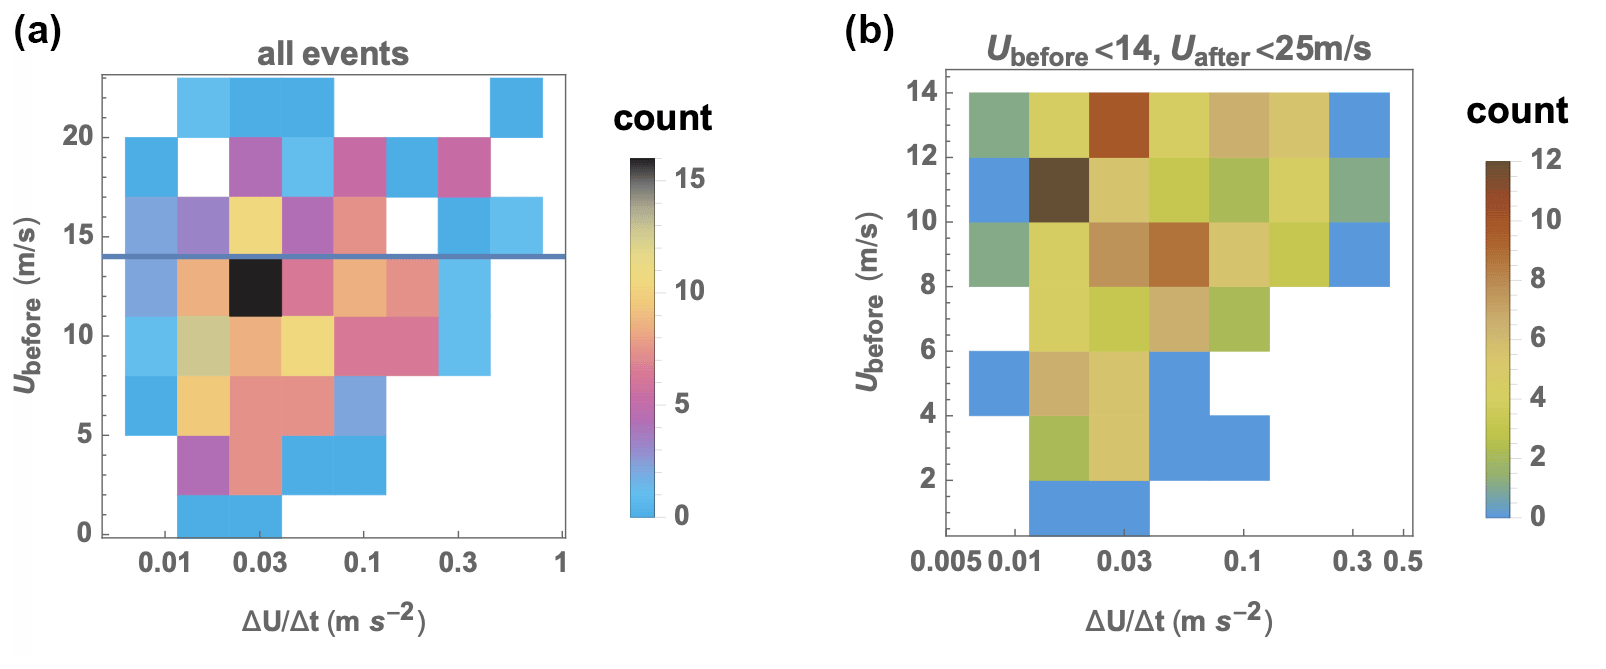
Figure 7Distribution of accelerations per wind speed before ramp. (a) All events, where horizontal blue line shows lower limit of rejected events; (b) events considered here.
Given the primary impact of ramp acceleration ( on lone turbines and the influence of above-rotor shear on mixing within wind farms, we examine their joint behavior. Figure 8 shows each event's acceleration and the upper-rotor shear after passage, as well as the pre-ramp speed. Recalling the essentially offshore conditions (again the ramps are from the west, and the speed at 100 m height is unaffected by the thin strip of land between mast and coastline), the relatively small shear matches previous observations, with a moderately skewed distribution for α (Kelly et al., 2014) and associated . The range of shear appears wider for the most commonly occurring accelerations (0.02–0.04 m/s2) – particularly for events with lower speeds – though there is little evidence of shear correlating with the bulk ramp acceleration. For “stronger” ramps, i.e., with the highest accelerations, the shear is weaker, which in part justifies use of neutral conditions in the simulations; e.g., for m/s2, basically per second. The character of , evinced by Fig. 8, motivates our choice of event ensemble for simulations shown in the next section.
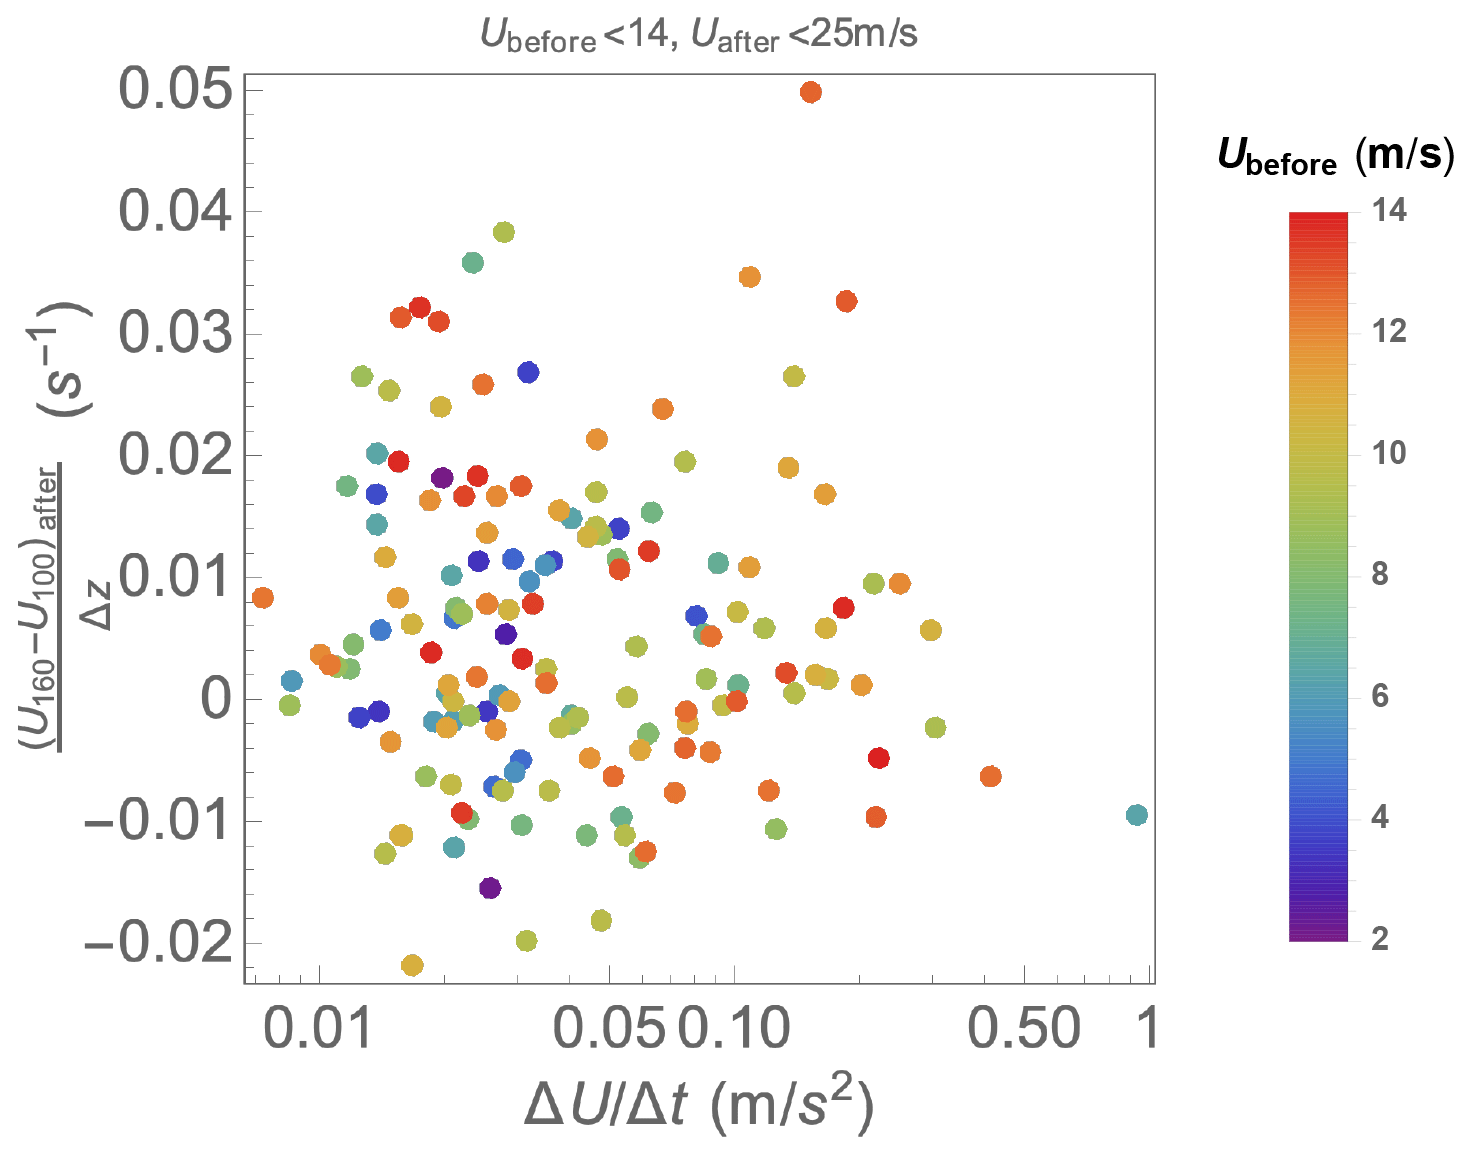
Figure 8Detected ramp events: upper-level shear after event, ramp acceleration, and wind speed before ramp.
2.2 Ensemble of ramp events for coupled simulations
Due to the computational demands of the model chain used, an ensemble of eight members was created based on the joint statistics presented in the previous section. Each ensemble member corresponds to one model-chain simulation. The model chain starts with a constrained turbulence simulation, which employs the Mann model (Mann, 1994, 1998); output from the constrained Mann model (CMM) is used to drive the coupled LES and aeroelastic models, as detailed in the next section.
The ensemble members are chosen to cover the relevant load-driving parameters: the ramp acceleration, with the latter dictated by the ramp duration and amplitude; the pre-ramp hub-height wind speed (shown previously in Fig. 8); and the above-rotor shear. Based on the marginal PDF of background turbulence strength σu,hpf (Fig. 4) and joint distributions of it with the other parameters (not shown), a single representative value for σu,hpf was chosen. Since we are not investigating sensitivity to σu,hpf, and because it (and its effect) is small compared to ΔU, we choose a value equal to the observed mean, which is approximately equal to the mean within the space considered. Two values of ΔU and several values of Δt, corresponding to three significant accelerations m/s2, were chosen; this was done in such a way as to (1) cover the most populated part of the statistical space and (2) facilitate estimation of the sensitivity of turbine response to wind-speed ramps, particularly via .
Similarly, three values of pre-ramp shear were chosen to investigate dependence of ramp propagation through the farm and sensitivity. A representative value of the turbulence length scale LMM is also needed for constrained turbulence simulations. Since LMM is not expected to be a significant driver of loads due to the dominance of the ramps (it has less influence than σu,hpf, as shown in, e.g., Dimitrov et al., 2018), it was calculated as following Kelly (2018)5. Table 1 shows the ensemble members and chosen characteristics.

The ensemble members defined according to the specified parameters , Ubefore, σu,hpf, and LMM, shown in Table 1, were each used to generate a constrained turbulence simulation with Mann-model background turbulence (Dimitrov and Natarajan, 2017) – as done by Hannesdóttir et al. (2019) for wind ramps. The duration of the simulations was 1550 s, producing a three-dimensional turbulence box of atmospheric turbulence velocity field including the ramp for each member. The ramps begin 800 s after simulation start to ensure fully developed flow through the farm without initial transients and are of sufficient duration to include both the ramp and at least 500 s of high-wind turbulence after the ramp (as in the observations).
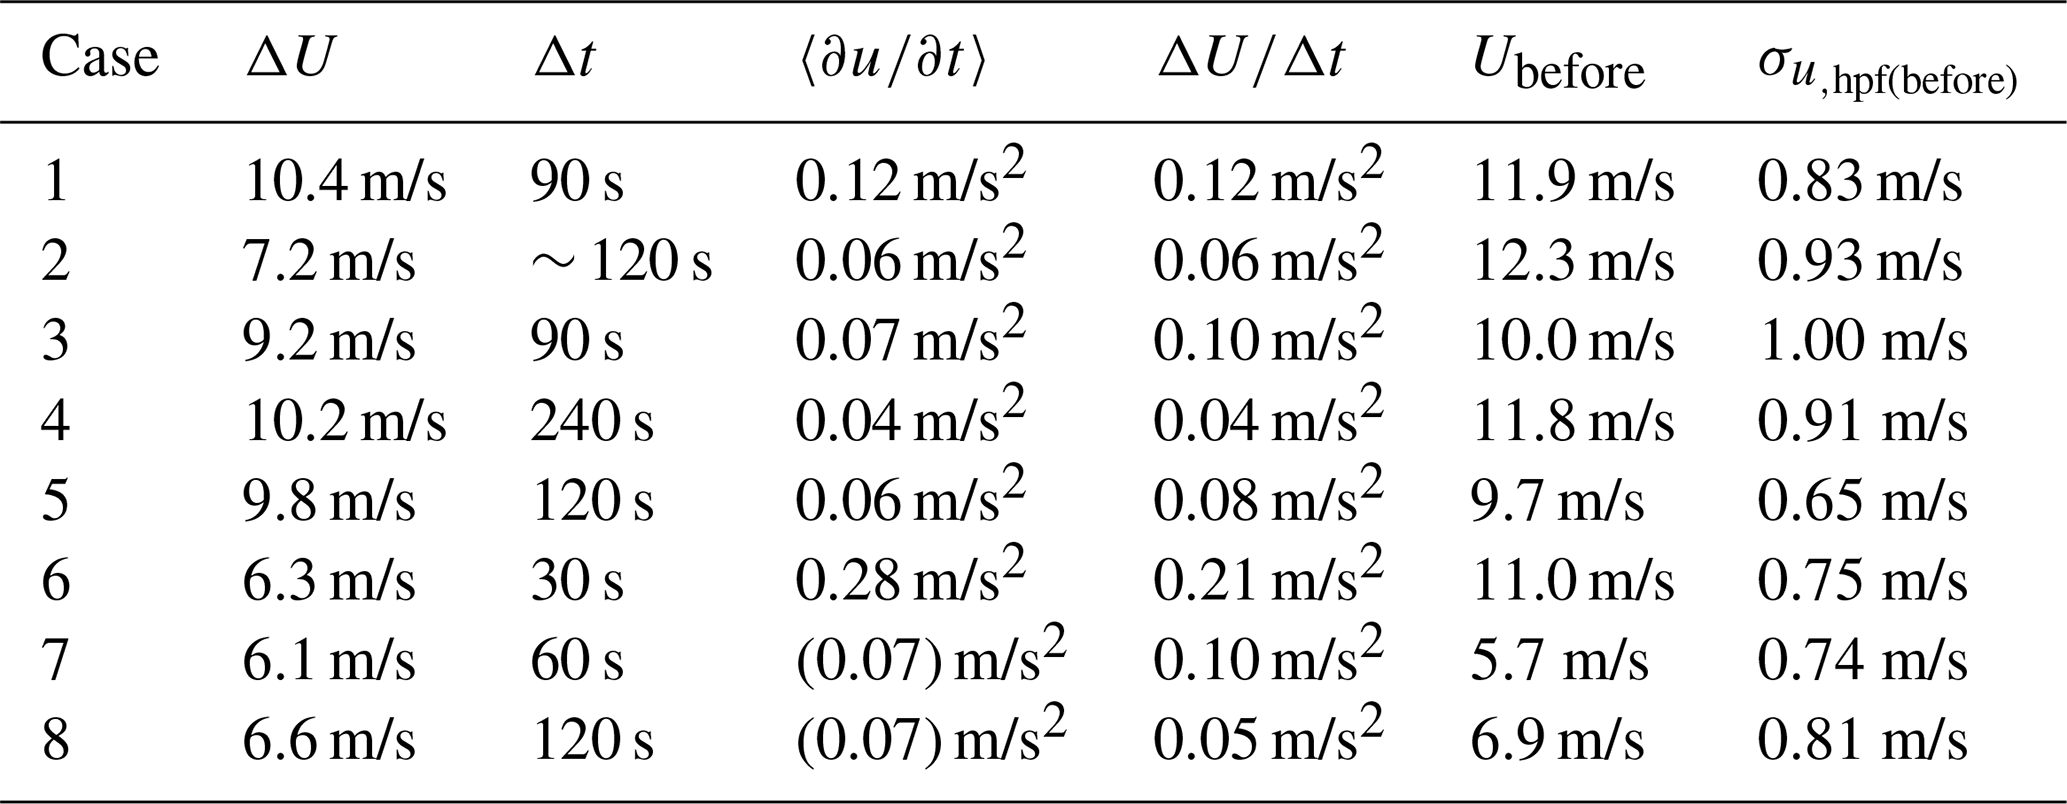
The simulations are stochastic, including turbulence generated by the Mann model for atmospheric turbulence (cf. Mann, 1994, 1998; IEC 61400-1, 2019), so the resulting ramps simulated by LES are not exactly as specified in Table 1. The superposed turbulence with the ramps can cause deviations in wind speed, which may either change the duration or amplitude of an event. This is shown in Table 2, which presents the diagnosed ramp parameters from the ensemble of simulations. For example, the ramps in cases 2 and 4 are prolonged, while case 5 and 7 have shortened ramps compared to the durations chosen. The resultant accelerations are affected and diagnosed in two ways: the mean of the accelerations calculated via first-order finite difference over each ramp duration (with ∂t corresponding to 0.04 s) and the bulk ramp value (again where and Δt is ramp duration). The table includes each, with reflecting the nonlinear stochastic aspect and effect on the simulated ensemble. Case 2 has a reduced acceleration, while cases 5 and 7 have larger accelerations than prescribed. The bulk acceleration is closer to prescribed accelerations than the average of instantaneous accelerations , because the latter includes more effects of simulated turbulence. Further, because the latter may also be sensitive to temporal resolution of the data6 we refer hereafter to the bulk value as the diagnosed ramp acceleration; because we have prescribed the before- and after-ramp speeds and simulated well beyond 10 min duration, this bulk acceleration is also equivalent to that found via the detection algorithm used to identify the ramp events in the original measured data.
Table 2Diagnosed parameters from ensemble of constrained (CMM) simulations; ramp acceleration is shown both as average acceleration over the ramp event ( including turbulence) and based on ratio of [〈Uafter〉−〈Ubefore〉] to ramp duration Δt.
Note that although there are minor deviations in several cases from the initial ensemble-member choices, this is permissible, given that the cases with deviations are still representative of the joint space – still falling within the populated regions shown in Fig. 8, and allowing estimation of sensitivities as originally planned. The ramps from the CMM simulations are shown in Fig. 9, where these time series correspond to the speeds at {y,z} of the rotor center.
3.1 Stand-alone aeroelastic calculations driven by the turbulent ramp simulations
The three-dimensional turbulence time series for each case were input into the stand-alone aeroelastic code Flex5 (Øye, 1996). The turbine model and controller employed in Flex5 correspond to the NM80 (Aagard Madsen et al., 2010), as mentioned previously; this turbine has a rotor diameter D=80 m and hub height zhub=80 m. The wind speed at hub height in Flex5 is identical to the input speed, as displayed in Fig. 9 for the ramp portion of all cases. The plotted time series is smoothed using a 20 s moving average to show the wind speed experienced by a single simulated turbine – since it reacts like a low-pass filter with characteristic timescale of ∼ 20 s or longer (e.g., Frandsen et al., 2008). As prescribed in Table 1, from Fig. 9 (and Table 2) one can note that cases 7–8 start at a lower wind speed and are not designed to exceed rated wind speed, though case 8 does momentarily exceed Vrated; however, we note that 〈Uafter〉 is 11.8 and 13.5 m/s, respectively, for these two cases. The turbine power becomes constant during the ramp in cases 1–6, with maximum loads tending to occur during the ramp (shown further below).

Figure 9Wind speed at hub height, for ramps in the stochastic constrained Mann-model simulations (CMM). Horizontal gray line indicates rated wind speed. Ensemble-member (case) numbers indicated on the right.
From the stand-alone Flex5 simulations, we note the trend of ramp acceleration dominating the maximum blade-root flap-wise bending moments, as well as the maximum tower-base fore–aft moments (hereafter these two loads are denoted symbolically by Mbrfw and Mtbfa, respectively). This is shown in Fig. 10, which displays max{Mbrfw} and max{Mtbfa} versus ramp acceleration for the seven cases where the speed rises above Vrated. The acceleration is calculated at rotor center (hub height); the maximum from the three blades is used for the blade-root bending moment shown, which was calculated integrating to the first radial computation point in Flex5 (1.24 m from hub). There is some scatter in the results shown due to the spatial variation of turbulence, the shear, and blade positions during the ramp, since was calculated at rotor center. However, a trend is evident in the plots, and sensitivity of Mbrfw and Mtbfa to bulk ramp acceleration can be estimated. For the maximum tower-base fore–aft moment, the sensitivity is roughly 3 % of Mtbfa per 0.1 m/s2 acceleration due to the ramp, and the sensitivity for maximal flap-wise blade-root bending moment Mbrfw is approximately the same: 3 % per 0.1 m/s2 acceleration. The figure also includes an inset plot where the load was calculated using an averaging time of 4 s, which removes scatter and makes the sensitivity yet clearer – with the same slope on this plot as without averaging; it gives the same sensitivity, though the Mbrfw is simply shifted downward by several percent. In addition to the 3 % increase per 0.1 m/s2 of , there is an increase of ∼ 45 % in Mbrfw and ∼ 50 % in Mtbfa for ramp-affected loads, regardless of the ramp amplitude.
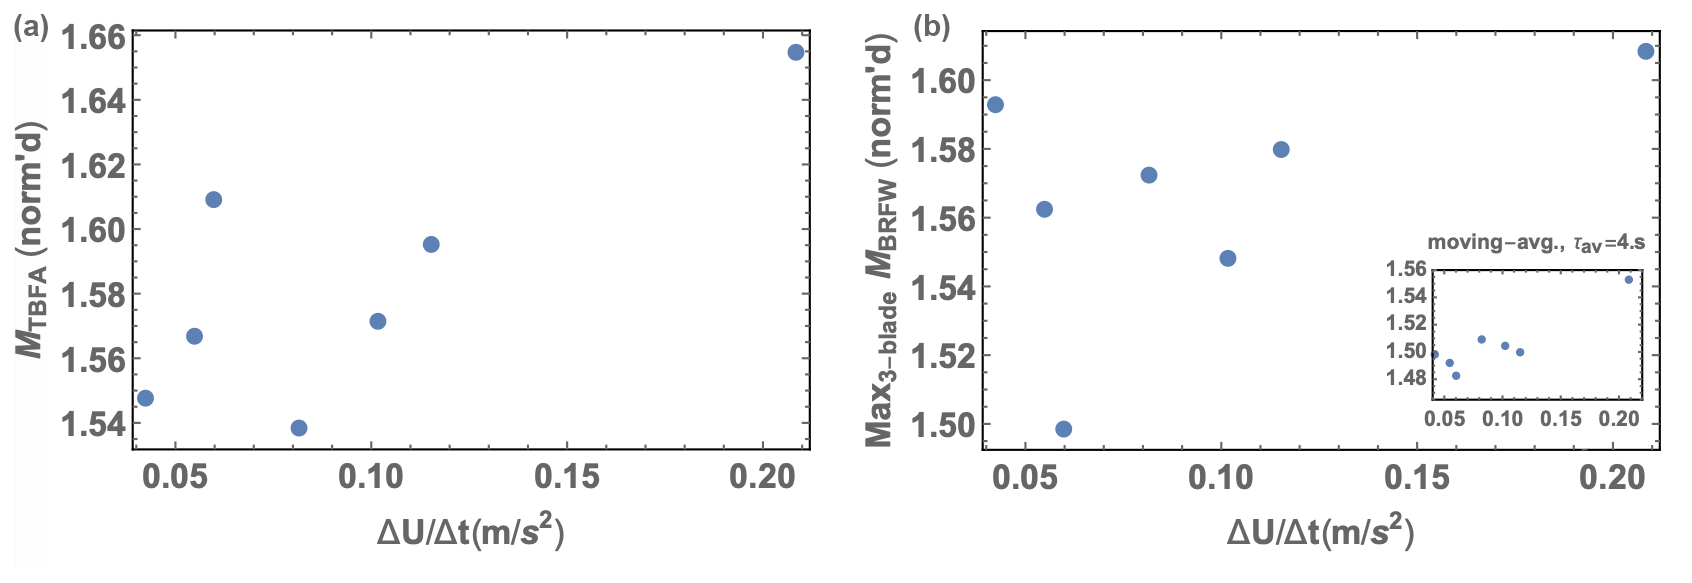
Figure 10Tower-base fore–aft moment (a) and blade-root flap-wise bending moment (b) versus ramp acceleration, for ramp cases exceeding rated speed, from constrained Mann-turbulence (stand-alone) simulations. Loads normalized by mean values outside of ramp events, over all cases. Right inset shows same plot but with averaging time of s.
4.1 Large-eddy simulation code
Large-eddy simulations (LES) have been performed using EllipSys3D, which is parallelized Fortran code developed at the Technical University of Denmark (DTU) and the former Risø National Laboratory (Michelsen, 1992; Sørensen, 1995). EllipSys3D solves the discretized incompressible Navier–Stokes equations in general curvilinear coordinates, using a block-structured finite-volume approach. Employing LES implies that resolved (large-scale) motions are solved directly in time and space, while motions and stresses at unresolved (small) turbulent scales are parameterized using a subgrid-scale (SGS) model. The resolution is usually limited by the grid size of the domain and in the present case is twice the grid spacing, where we employ the mixed-scale SGS parameterization of Ta Phuoc (1994; see also Ta Phuoc et al., 1994; Andersen et al., 2017b). Additionally, body forces are included in the equations and utilized to model the turbines and the turbulent inflow including ramps, as explained below. See Sørensen et al. (2015) for a detailed description of the entire numerical setup.
4.1.1 Actuator-line modeling of turbines and aeroelastic coupling
The turbines are modeled using the actuator-line method as developed by Sørensen and Shen (2002). The actuator-line method consists of imposing body forces along rotating lines in the computational domain, which corresponds to the aerodynamic loads on the rotor blades. The body forces are determined through a full coupling to the aeroelastic tool Flex5 (Øye, 1996). Flex5 computes both the aforementioned forces and blade deflections, based on the instantaneous flow solution along the rotating lines. Forces and deflections are transferred back to the flow solver. Flex5 also includes a realistic wind turbine controller, which is particularly important for the current simulations, as the operational regime changes from below rated to above rated as the ramps propagate through the wind farm.
4.1.2 Embedded body-force implementation to drive the LES
In LES the flow is typically driven via boundary conditions. However, modeling ramps propagating through a domain (which includes wind turbines) is a particularly challenging task: it violates a fundamental assumption, conservation of mass. The sudden increase in momentum – particularly the large velocity gradient defining the ramp – can result in an unphysical acceleration through the simulation domain, due to enforcement of the continuity equation by the pressure solver. Therefore such persistent transient features cannot be applied simply on the inlet boundary. However, use of body forces internally within the numerical domain facilitates simulation of such flows. The turbulent inflow including the ramp is introduced via body forces (Gilling et al., 2009), imposed in a plane upstream of the turbine(s) as in Troldborg (2009). If modeling a single turbine, the plane is often limited in extent. However, as shown in Andersen (2014), limiting the spatial extent of the turbulence plane can affect the overall mixing in large wind farms.
Here we apply the body-force method with several adaptations, to mitigate the flow degradation within the wind farm and avoid numerical blockage, which could otherwise occur as an imposed ramp propagates through the simulated domain. Flow degradation is prevented by ensuring that the imposed inflow covers a large enough area to maintain the ramp throughout the wind farm; i.e., large-scale compensation for the ramp-induced divergence (via the pressure solver) is kept outside the central area of interest, such that it has negligible effect within the simulated wind farm. Additionally, the forcing is spatially tapered with a half-Gaussian profile (with scale 1.75D in the lateral and 1D in the vertical) to reduce anomalous shear, which would otherwise introduce unintended mixing. Artificial numerical blockage of the imposed ramp inflow is reduced by utilizing a domain extent of Ly=7D, Lz=50D that is much larger than the size of the body-forcing area, which has a core area of 4D×2.625D; this has the additional advantage of distributing any divergence-related compensation over a large volume such that the induced velocities are small compared to the background speed. The full details of the methodology are presented in Andersen et al. (2021).
4.1.3 Numerical setup
The numerical domain used for the simulations is 5440 m × 560 m × 4000 m in the streamwise, lateral, and vertical directions, respectively. The domain is uniform in the center (where the turbines are placed) and stretched towards the boundaries. The resolution in the center region is 4 m in each direction. There are 1280 × 80 × 64 points in each direction, corresponding to a total of about 6 million cells. This would appear to be relatively coarse for actuator-line simulations, but the wake is predominantly governed by CT (van der Laan et al., 2020), and the current resolution gives rise to a difference in CT of only ∼ 1 % (Hodgson et al., 2021).
The flow has been initialized with a power-law wind profile (constant shear exponent), which at hub height corresponds to the vertical velocity gradient given in Table 1. This is also used as the inflow boundary condition. The simulated wind farm contains nine turbines separated in the streamwise direction by a spacing of seven rotor diameters (560 m). There are periodic boundary conditions, so in effect the farm can be considered infinite in the crosswind direction, with a lateral spacing of roughly nine rotor diameters (∼ 700 m) due to the lateral size of the domain. The layout of the simulated wind farm can be seen in the next section (Fig. 13), where flow is first visualized for two cases.
4.2 Results
The constrained Mann-model turbulence fields (discussed in Sect. 3) were used to drive LES of each member in the ensemble of eight cases, including aeroelastic calculations for the nine turbines of the simulated farm via the Flex5 coupling.
4.2.1 Analyses of cases and comparison with stand-alone simulations
We start by considering the results from the large-eddy simulations for the first (upwind) turbine. This is done to evaluate the parameter space represented by the cases simulated with LES, in comparison to the stand-alone Flex5 simulations discussed in the previous section; this is because the forcing technique is expected to potentially modify the ramp characteristics (but not substantially change the ensemble's utility in representing the parameter space shown previously in Fig. 5). To check the ramps themselves, Fig. 11 shows the wind speeds at hub height for the first turbine; these are taken from the Flex5 channel which reports speed at a distance of R=40 m upwind.
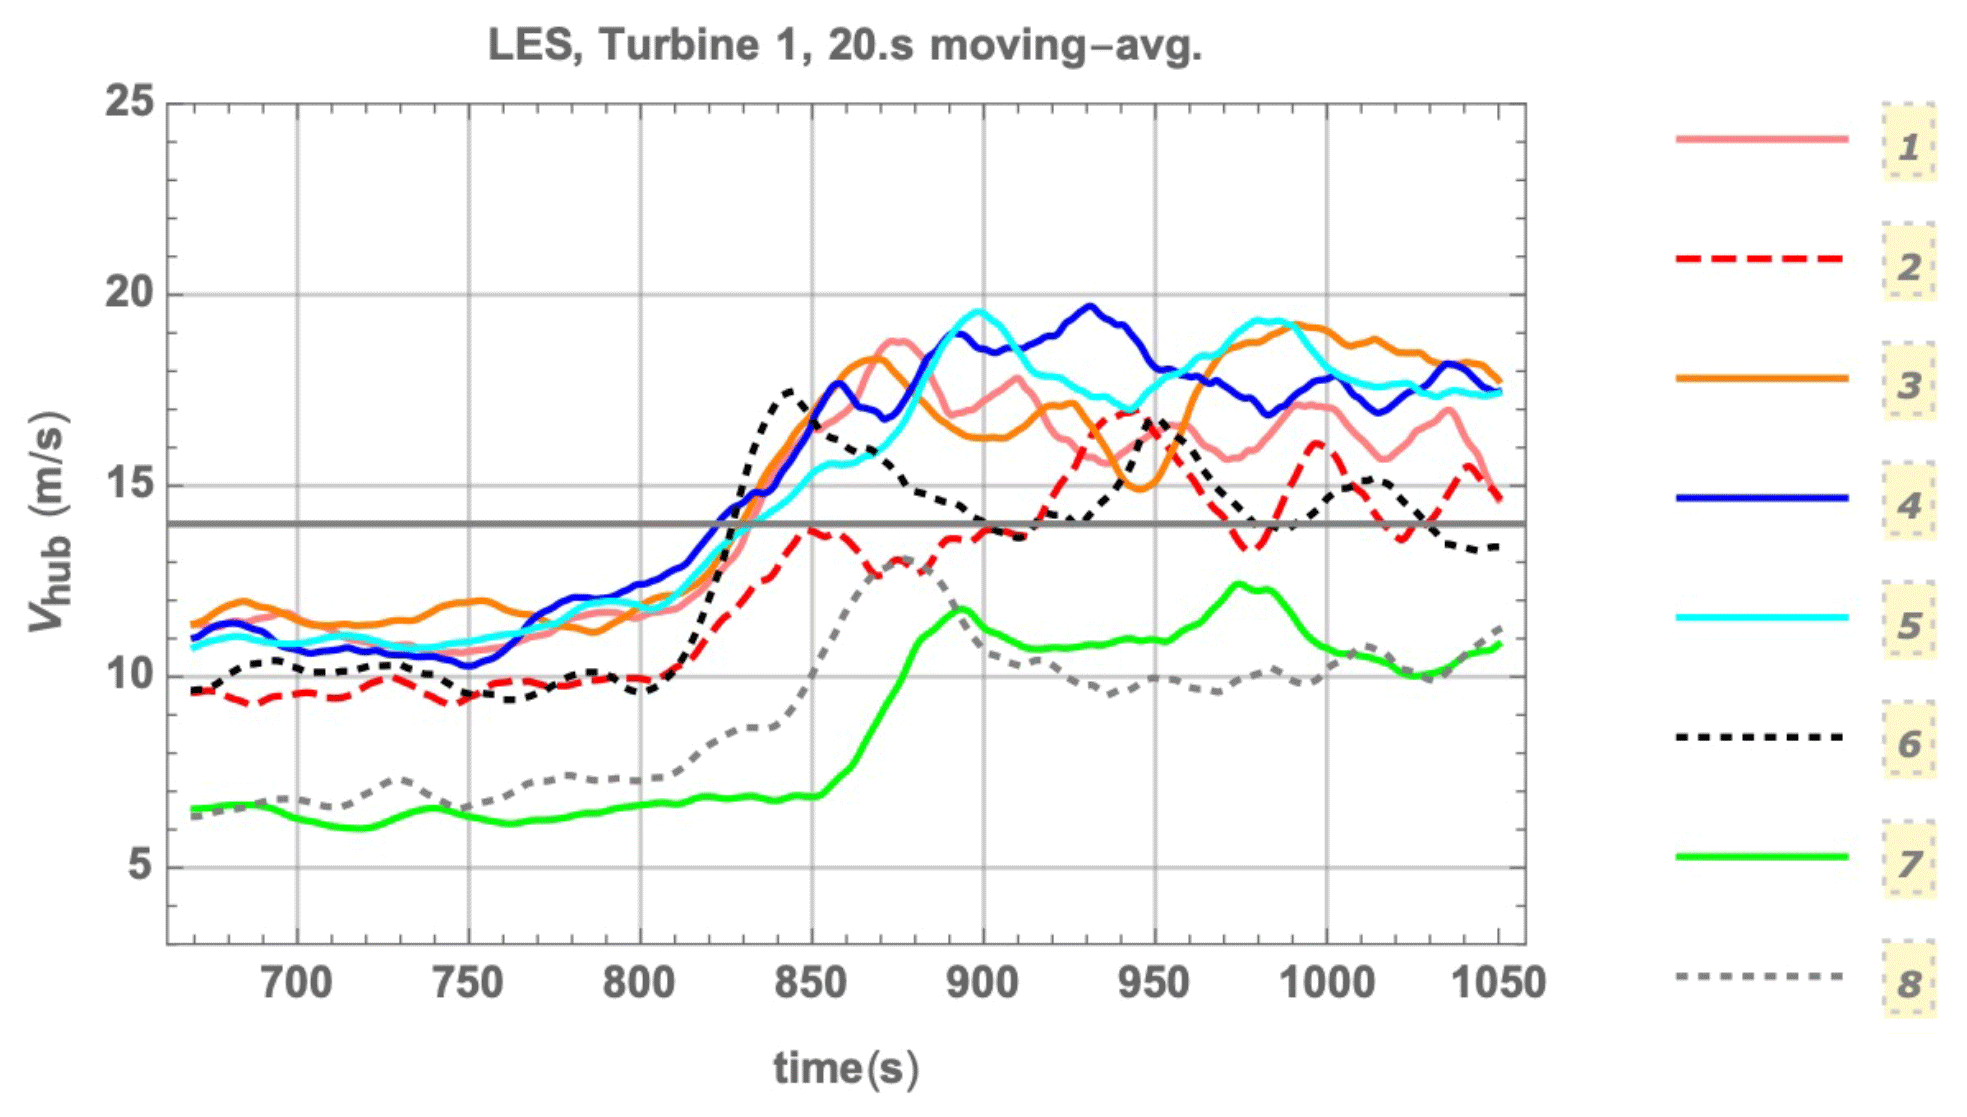
Figure 11Wind-speed ramps from LES driven by Mann-model simulation, for upwind/first turbine. (Compare to stand-alone Flex5 simulations driven by the Mann model, shown in Fig. 9.)
In comparison with Fig. 9 for the stand-alone Flex5 model driven by constrained Mann-model turbulence including the ramps, one can see in Fig. 11 for the LES that for most cases the ramp amplitudes are somewhat damped (∼ 10 %–30 %), and some of the cases have swapped. However, the ramp accelerations are not appreciably affected: essentially the same space of is covered by the ensemble, both as planned and simulated in the stand-alone runs. For the downwind (waked) turbines, Fig. 12 shows the wind-speed ramps in the LES at turbines 2, 4, 8, and 9.
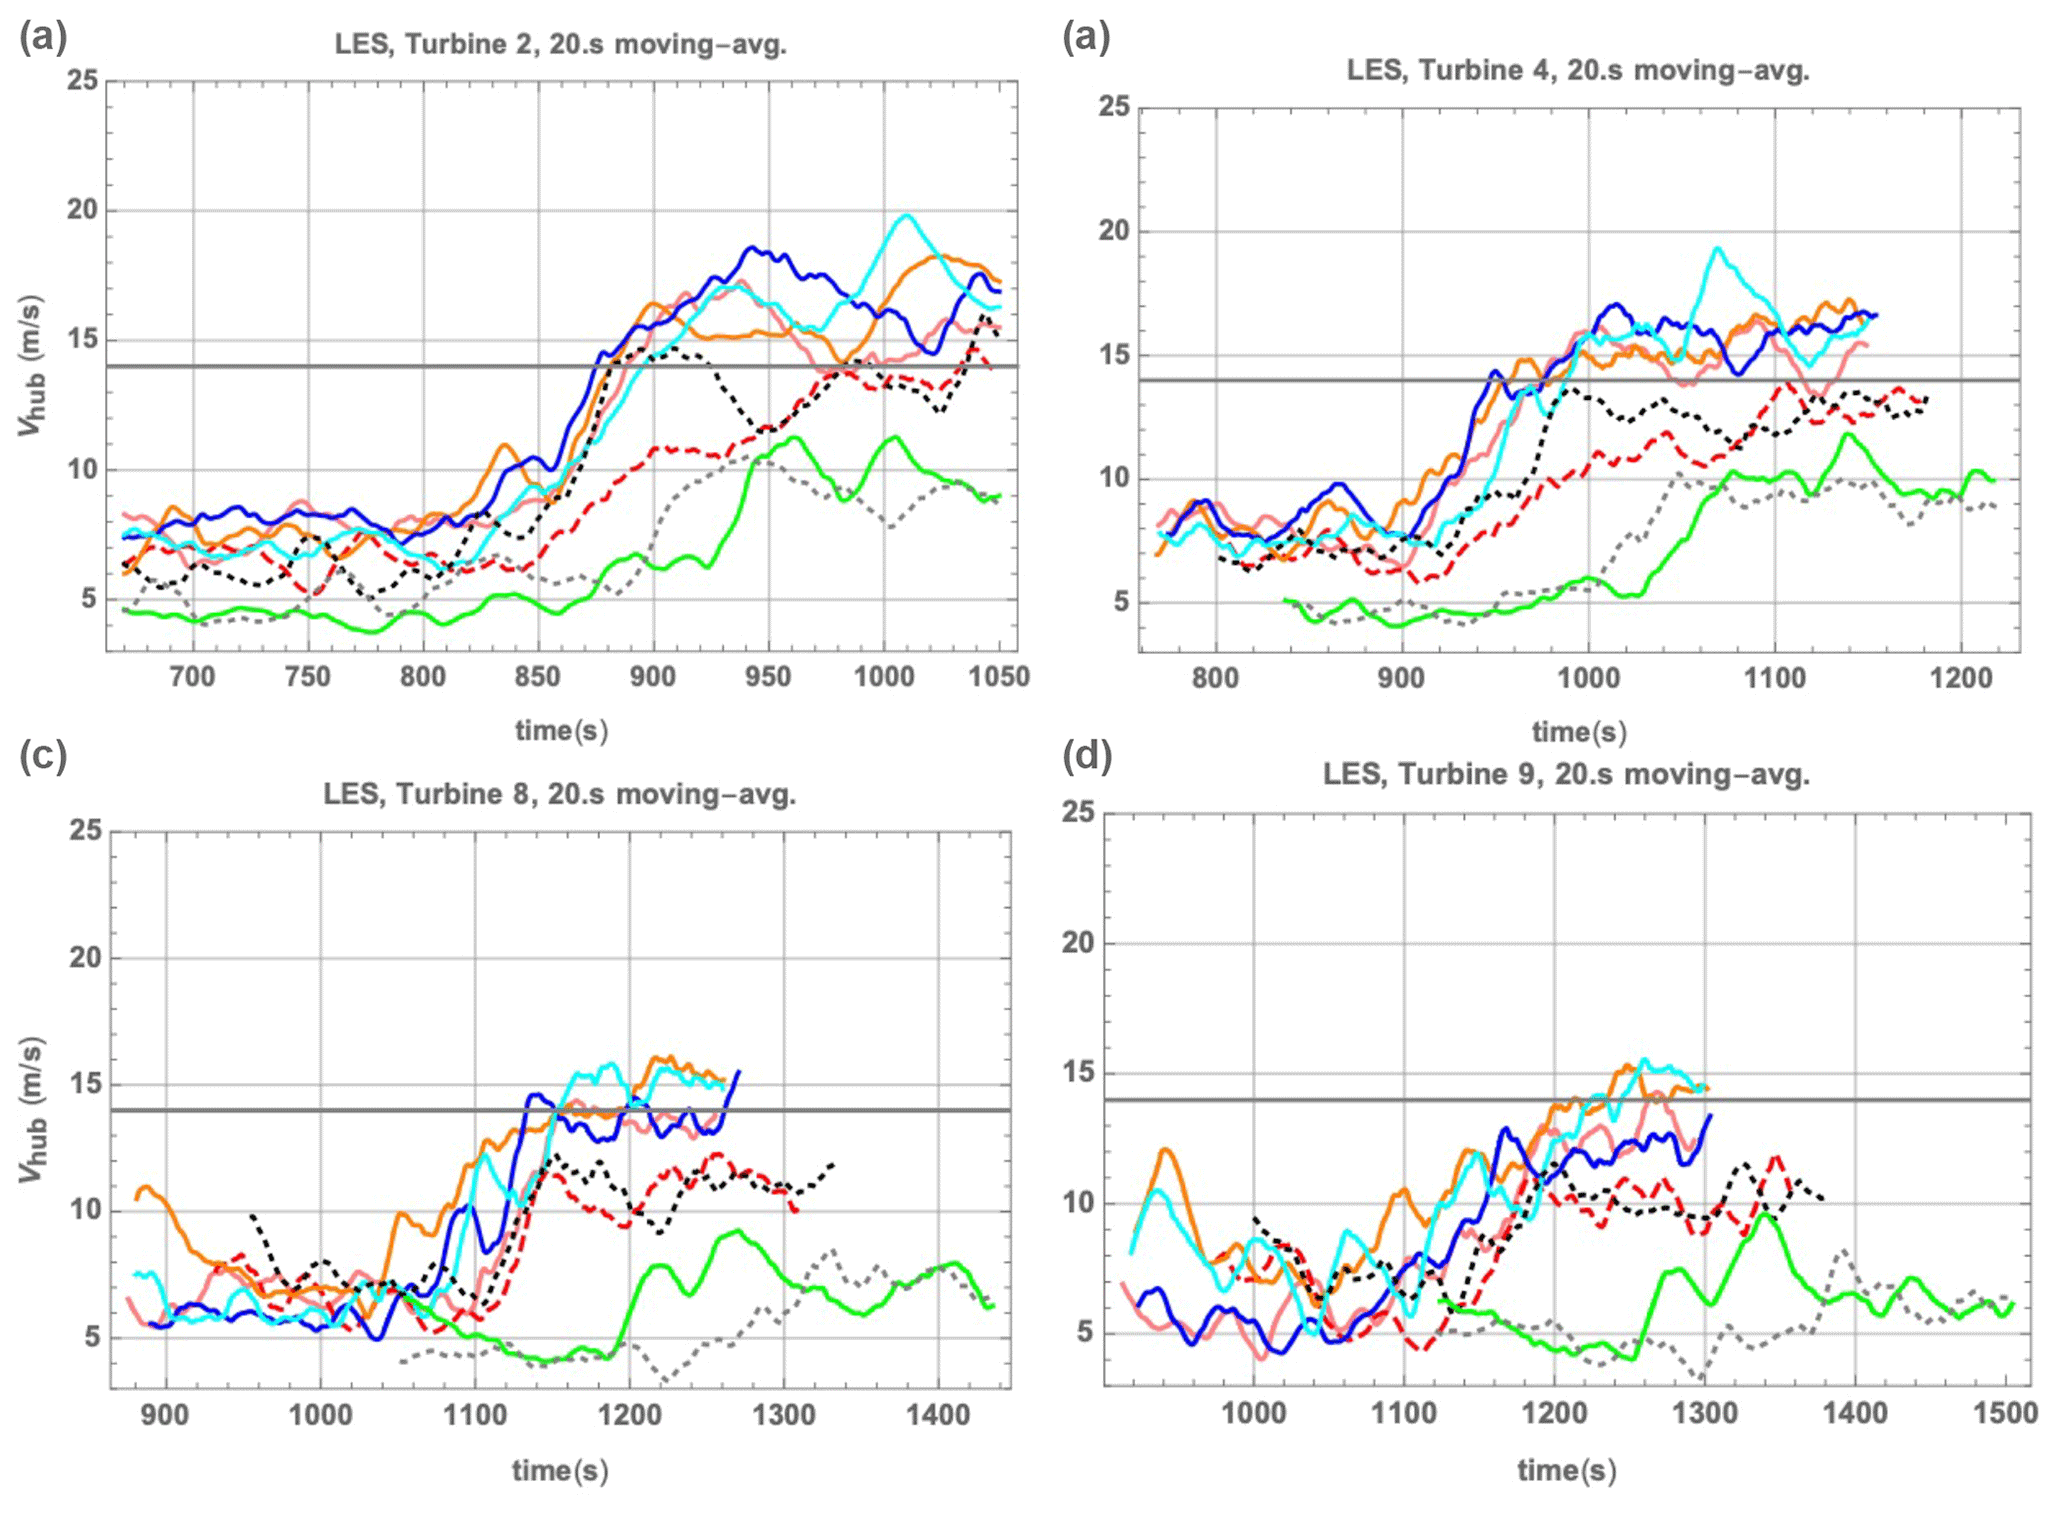
Figure 12Wind-speed ramps at hub height in LES driven by constrained Mann-model simulation. (a) At the second turbine; (b) at the fourth turbine; (c) at the eight turbine; (d) at the ninth turbine. Color/case legend follows Fig. 11.
The progressive damping of wind speeds at increased distances within the simulated farm is evident in Fig. 12, which shows the wind speeds at all turbines (for more plots see also Fig. 27 and Appendix of Kelly et al., 2019b). The figure also demonstrates that as the speeds diminish due to the wake effect, for various cases the wind speed does not exceed Vrated in parts of the wind farm's interior. Higher loads within the farm are expected when this happens, such as for case 4 between turbines 8 and 9 (blue line in bottom plots of Fig. 12). The ramps remain relatively intact, particularly for higher wind speeds. The maximum ramp accelerations simply persist for shorter times due to wake turbulence; i.e., “wiggles are added” to the time series U(t) as a ramp progresses through the farm.
The behavior of ramp events propagating through a wind farm is illustrated in Fig. 13, which displays a snapshot of the wind-speed field in the farm simulated by LES; cases 6 and 7 are shown at the same time after simulation start. In the figure it is evident that the ramp has not traveled as far through the farm in case 7 as in case 6 due to the latter case having higher speeds (note the color scale is different in the two plots); in case 7 the mean flow at hub height does not exceed Vrated within the wind farm. In case 6 the flow at hub height ceases to exceed Vrated between turbines 3 and 4, causing the ramp-affected loads to be different downwind of turbine 3; there the loads become a bit more consistently higher after the ramp, compared to turbine 3.

Figure 13Cross section of wind fields from LES, taken along turbine center (y=0): cases 6 (a) and 7 (b), shown at the same time after start. Vertical axis is height above the surface [m], horizontal axis is streamwise position [m], and flow travels from left to right. Black lines indicate turbine rotor positions, and color is streamwise wind velocity component in meters per second.
The predicted power tracks the wind speed up to rated power. This is shown for both the stand-alone (CMM/Flex5) and upwind turbine of the large-eddy simulation model chain in Fig. 14. A similar simple behavior occurs for all downwind turbines in the LES and is thus not investigated further in this work.7
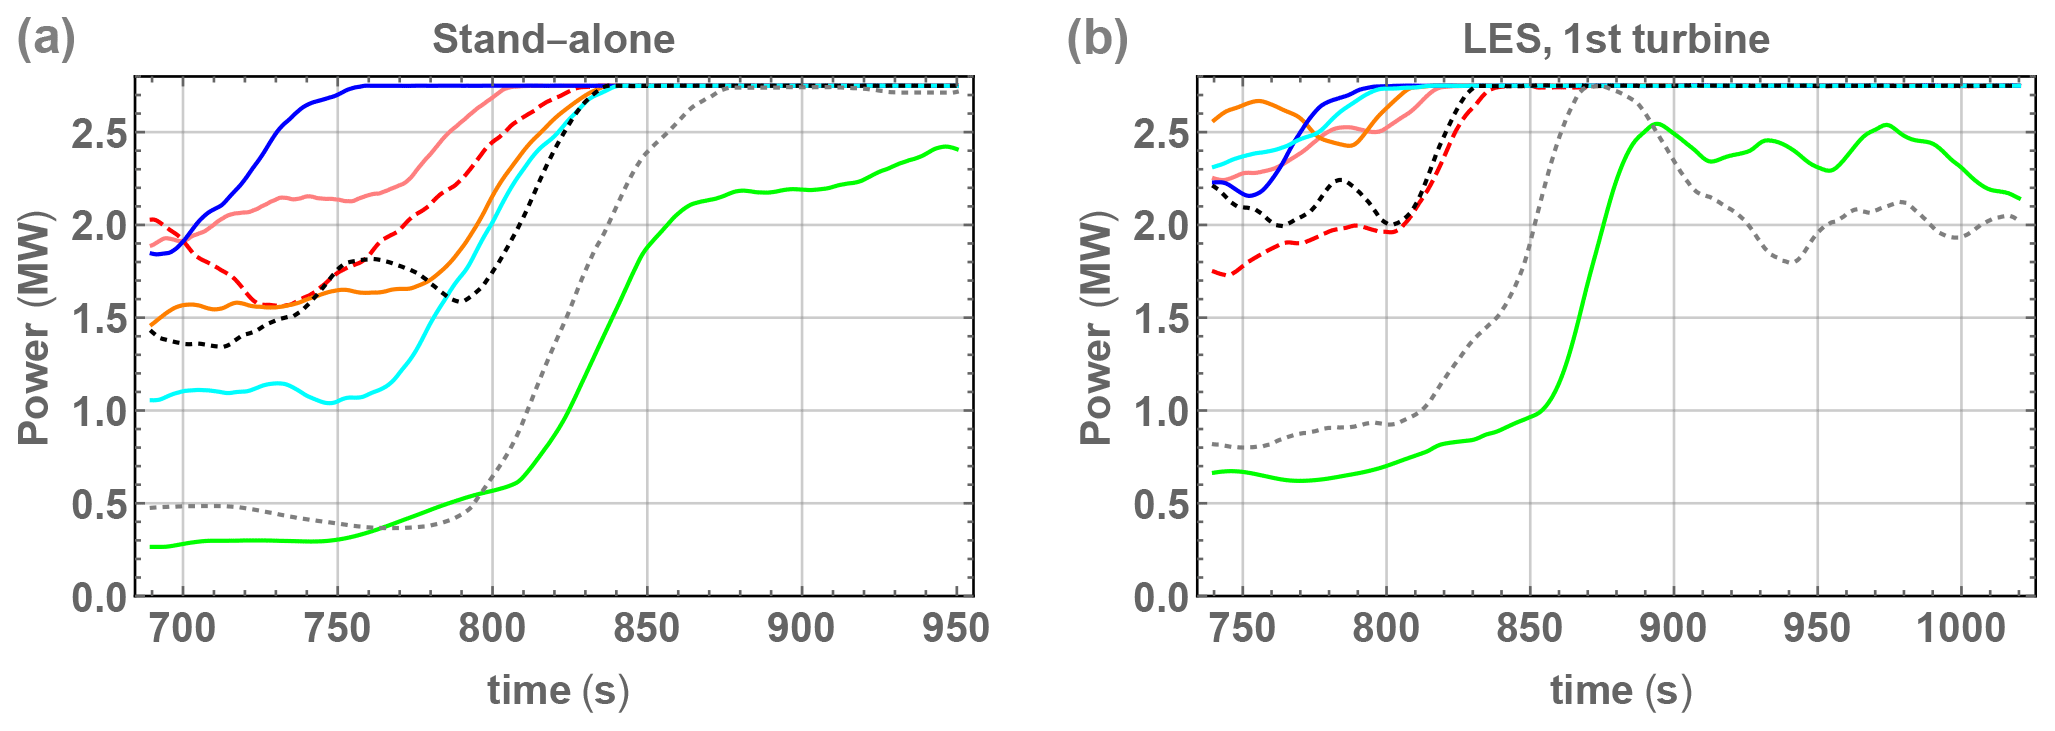
Figure 14Power output through all simulated ramp events of the ensemble. (a) Stand-alone Flex5 simulations driven by CMM. (b) CMM-LES-Flex5 simulated power, for first (upwind) turbine.
Figure 15 shows tower-base fore–aft moments over passage of the ramps for both the stand-alone CMM/Flex5 simulations and first turbine in the large-eddy simulations, normalized by the respective pre-ramp values for each case. Figure 16 further shows these dimensionless loads for two downwind turbines (numbers 2 and 5) from the LES.

Figure 15Tower-base fore–aft moment Mtbfa, normalized by pre-ramp mean values, for all eight ramp cases (colors same as in Fig. 11). (a) Stand-alone Mann-model/Flex5 simulation; (b) coupled LES, first (upwind) turbine.
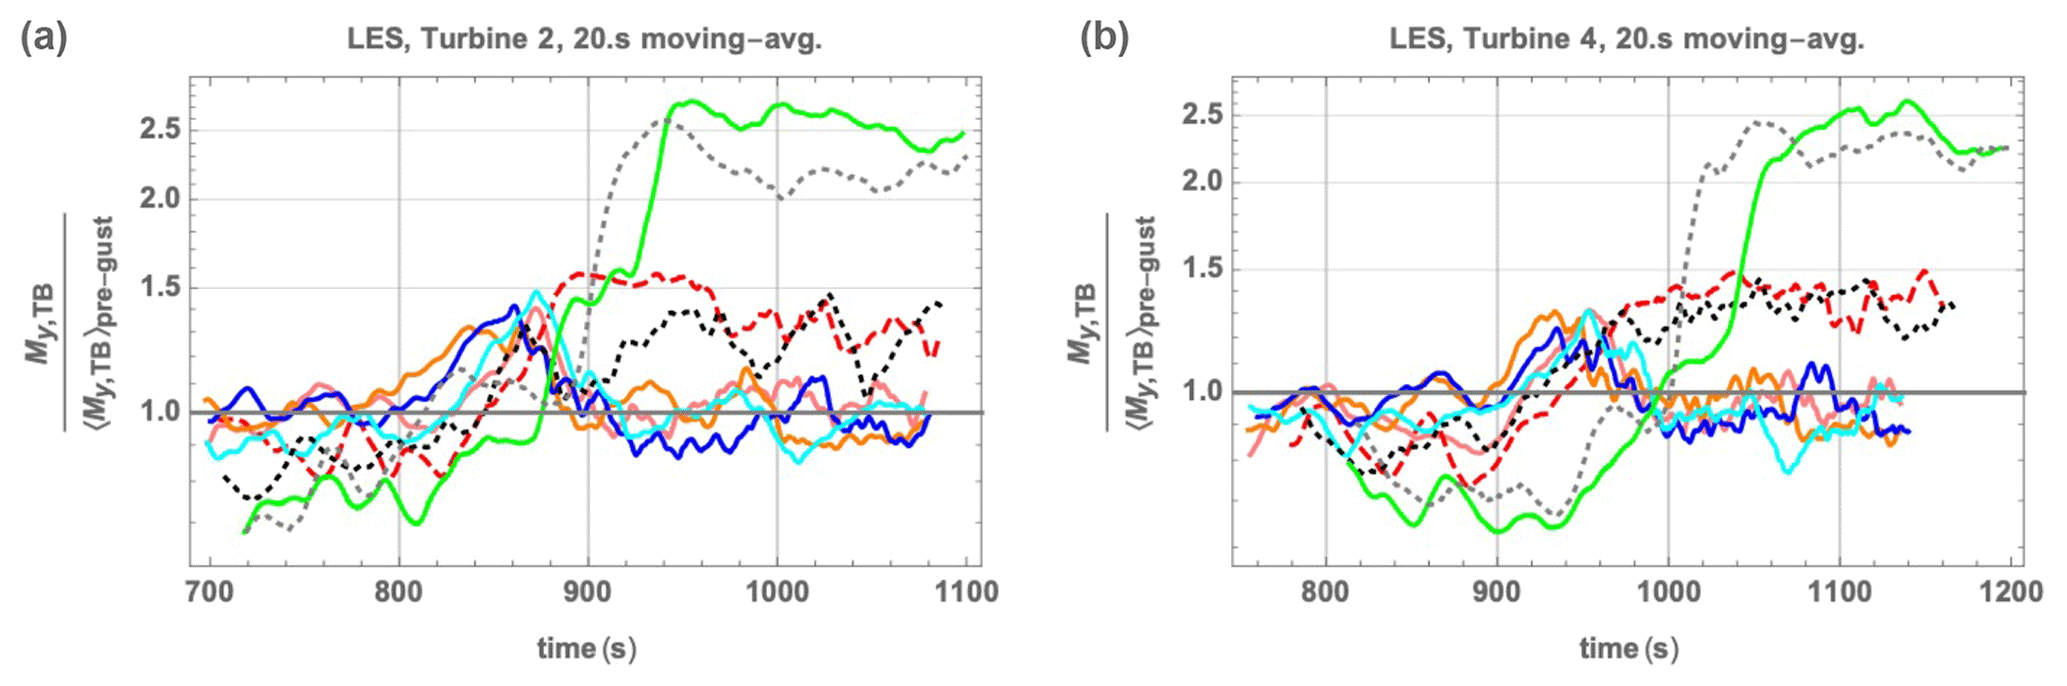
Figure 16Tower-base fore–aft moment Mtbfa normalized by pre-ramp mean values (as in Fig. 15b), for the second and fourth turbines in LES of wind farm. Color/case legend follows Figs. 11–12 and 14–15.
From Figs. 15–16 we note several trends. The tower-base loads, relative to their pre-ramp values, exhibit two simple behaviors: for cases in which rated speed is exceeded, the maximum load occurs during the ramp before Vrated is reached; in cases not exceeding Vrated the maximum loads simply correspond to maximum wind speeds attained. For the turbines not in the wake of others (i.e., stand-alone or first row of LES), in cases where U exceeds Vrated the peak loads are essentially the same per given acceleration. For cases not attaining rated power, the LES loads are lower due to lower overall mean wind speed. In terms of physical (not relative) tower-base loads, ramps not exceeding rated speed have lower overall loads; this is shown in Fig. 17.
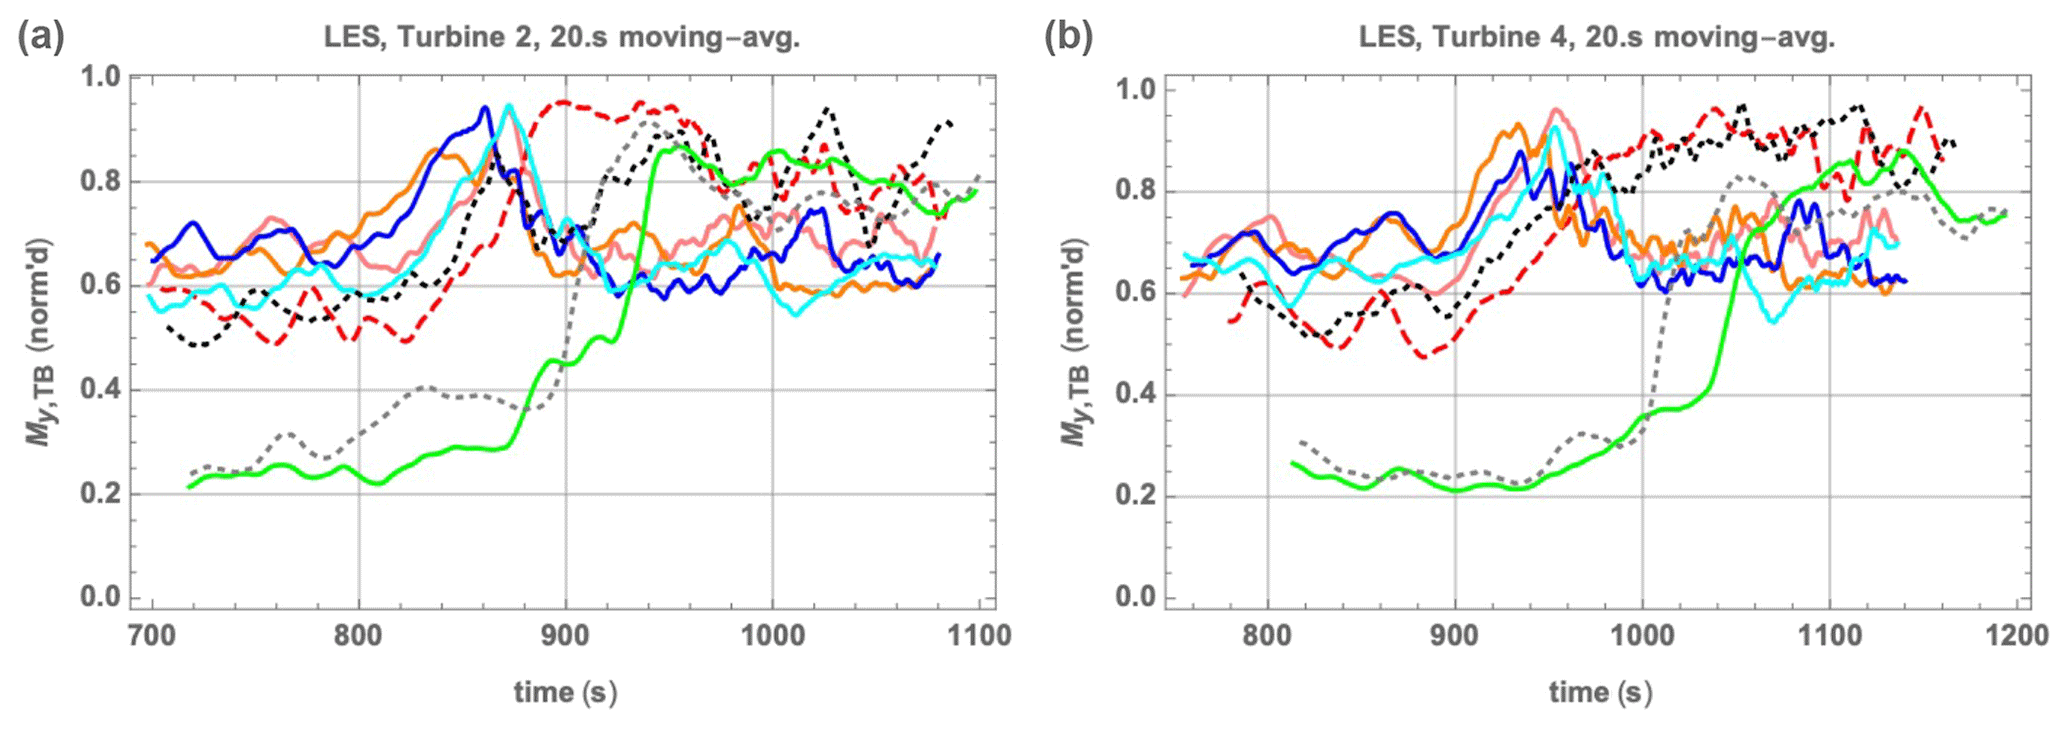
Figure 17Raw tower-base fore–aft moment Mtbfa for turbines 2 and 4; note that for commercial/proprietary reasons, all values have been non-dimensionalized by a single constant. Color/case legend as in Figs. 11–12, 14–16, 18–19, and 22–23.
Figure 18 shows the largest of the three blades' flap-wise blade-root bending moments for each case; these exhibit similar behavior as the tower-base fore–aft moments considered above. Again, some differences exist between the stand-alone CMM/Flex5 simulations and the coupled LES due to the slightly weaker mean wind speeds in the LES, but the peak loads for cases crossing Vrated are notably similar per ramp acceleration. The blades' flap-wise loads for downwind, i.e., waked, turbines exhibit the same behavior (not shown; see Fig. 29 of Kelly et al., 2019b). Figure 19 further displays the relative flap-wise bending moments, i.e., Mbrfw normalized by the respective pre-ramp mean values (again for the stand-alone and unwaked LES results); it more clearly demonstrates the similarities between cases exceeding rated speed, similar to the peak tower-base loads Mtbfa.
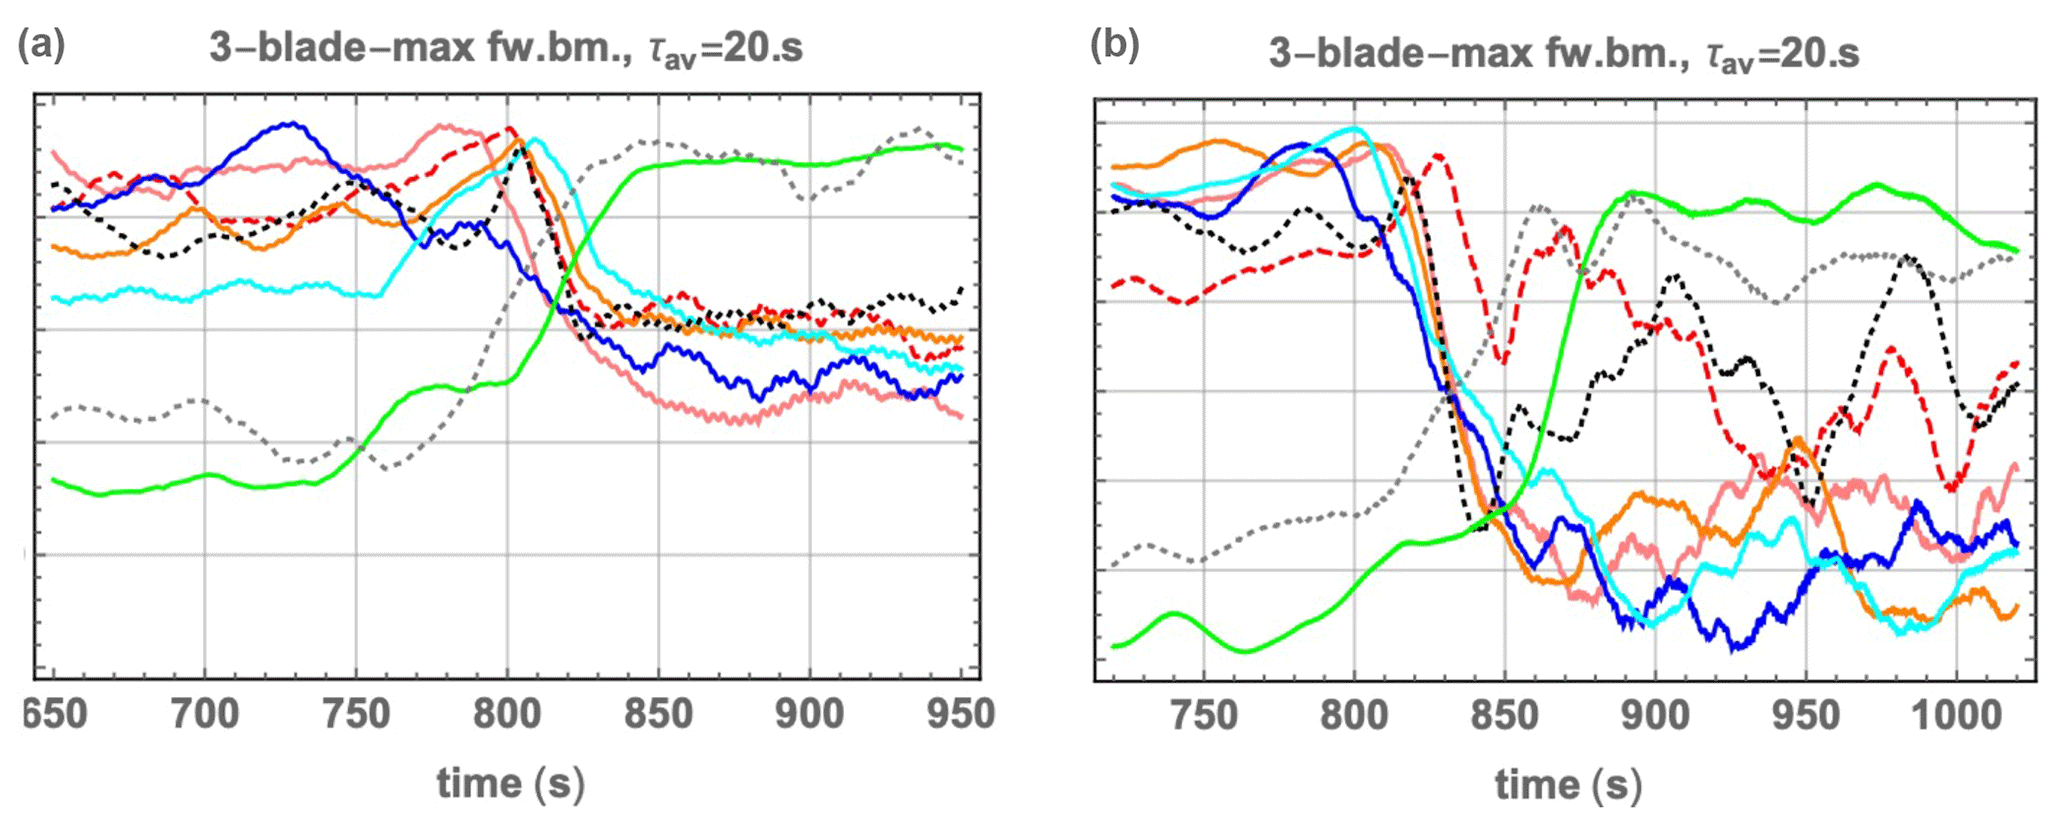
Figure 18Maximum flap-wise blade-root bending moment Mbrfw over all three blades. (a) Stand-alone Flex5 simulations driven by constrained Mann model (CMM). (b) Coupled LES outputs for first (upwind) turbine. Dimensional results shown on same axes; values hidden to protect proprietary information. Color/case legend as in Figs. 11–12, 14–17, 19, and 22–23.
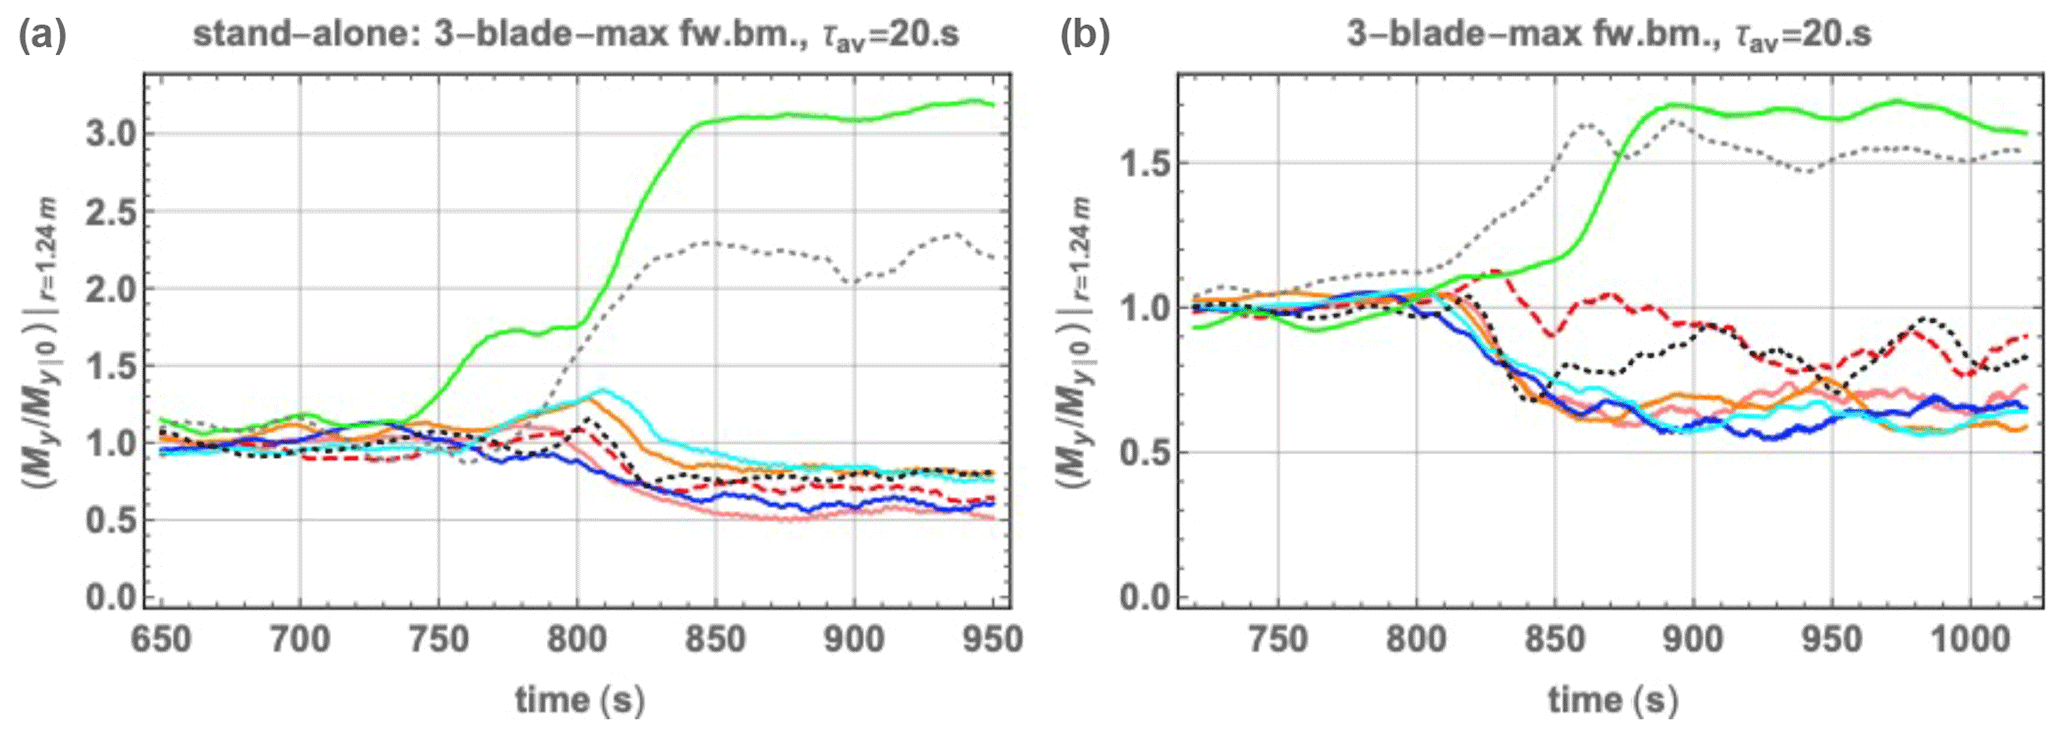
Figure 19Flap-wise blade-root bending moment Mbrfw (maximum of three blades); normalized by pre-ramp values. (a) Stand-alone CMM/Flex5 simulations. (b) Coupled LES outputs for first (upwind) turbine. Color legend as in Figs. 11–12, 14–18, and 22–23.
The behavior of ramp-affected Mbrfw does not vary much from blade to blade in the stand-alone simulations ( 3 %); this is shown in Fig. 20, and such variation is even smaller for the corresponding (upwind) turbines in the LES (not shown, see Fig. 4.9 of Kelly et al., 2019b). For the peak loads, including those which are ramp-induced, the same behavior is exhibited by both the LES and stand-alone model chains, including the waked turbines in the LES: peaks for ramps exceeding Vrated occur during the ramp and are dependent upon the ramp-associated , while load peaks for weaker ramp events (not exceeding rated speed) are determined more by the maximum wind speed. In general, the behavior of both dimensional and normalized loads seen above for single or upwind turbines is also exhibited for downwind turbines in the LES; the blade-root and tower-base loads depend primarily upon the ramp acceleration, for the cases in which rated power is achieved during the ramp event.
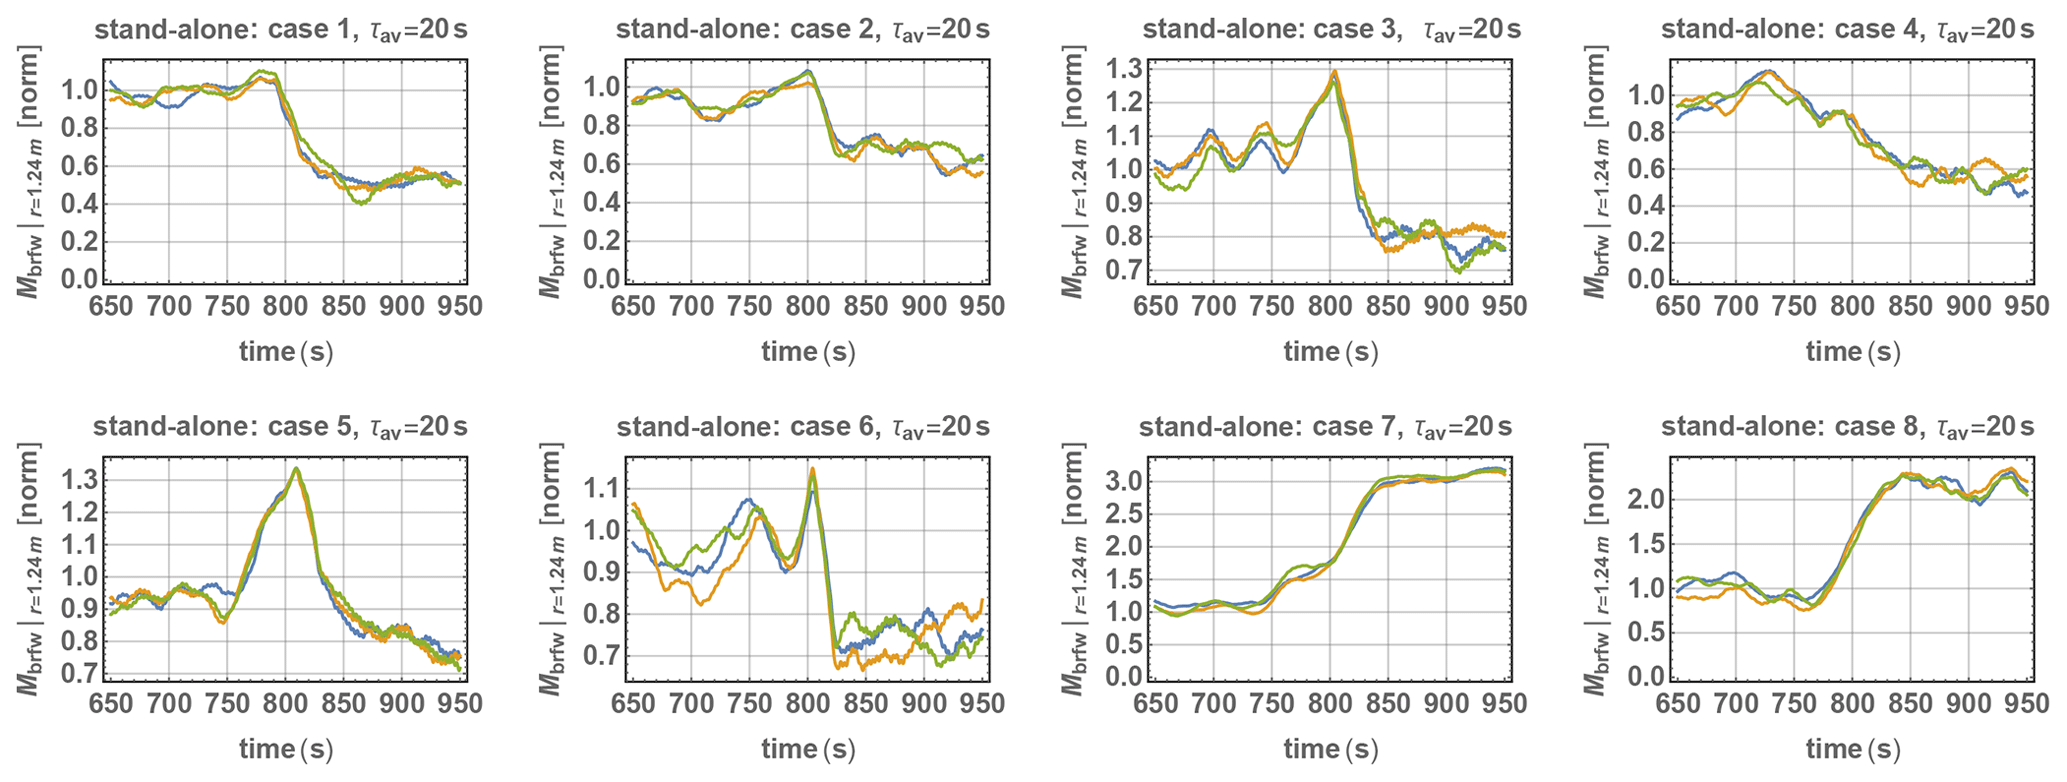
Figure 20Stand-alone CMM/Flex5 simulations: normalized blade-root flap-wise bending moment [Mbrfw] near base (r=1.24 m) for each blade (blue/gold/green); loads are normalized by respective pre-ramp mean value.
To better illustrate the load behavior with ramp passage, Fig. 21 shows both the hub-height wind speed and normalized flap-wise blade-root bending moment for case 5, on the same plot. In the figure one can see Mbrfw (normalized by its pre-ramp mean value) reaches its maximum as the ramp crosses rated wind speed (14 m/s, denoted by dotted line) and becomes smaller afterwards as the turbine pitches the blades (goes into rated operation); the mean bending moment across the ramp can thus actually be lower than the pre-ramp mean bending moment in some cases.

Figure 21Stand-alone CMM/Flex5 simulation for case 5: hub-height wind speed (cyan), along with blade-root flap-wise bending moment [Mbrfw] near base (r=1.24 m) for each blade (blue/gold/green); loads are normalized by respective pre-ramp mean value.
Maxima of Mbrfw are shown versus bulk ramp accelerations in Fig. 22, for turbines 3 and 8 in the coupled LES. The bulk accelerations are calculated directly using the before–after wind-speed difference ΔU divided by the ramp's rise time Δt. We remind that the accelerations (and to a lesser extent the loads) obtained can depend on the averaging time, particularly in the stand-alone (CMM-Flex5) simulations. From Fig. 22 one can see the loads following proportionally to , particularly for turbine 3. Further downwind, where the ramps begin failing to exceed rated power, the wakes can add noise to this picture, as demonstrated for turbine 8 in the figure. However, in the coupled LES the sensitivity of loads to acceleration (slope of the plots in the figure) remains relatively constant progressing into the farm, though we note this corresponds to an increase as percentage of the loads. As the post-ramp speed begins to not exceed Vrated deeper into the farm, then (wake) turbulence can tend to cause the highest loads, instead of ramp accelerations. The sensitivity of the flap-wise blade-root bending moments and the tower-base fore–aft moments in the LES model chain is essentially equal to that found in the stand-alone simulations: again ∼ 3 % of Mbrfw or Mtbfa per 0.1 m/s2 of , though it varies, as is shown below.

Figure 22Flap-wise blade-root bending moment Mbrfw (maximum of three blades) versus ramp bulk acceleration, for cases with ramp-induced U>Vrated: turbine 3 (a) and turbine 8 (b), from LES/Flex. Vertical-axis values obscured for proprietary reasons.
As long as rated power is achieved, the loads during the ramp events are relatively constant into the farm (Mbrfw and Mtbfa vary 10 %), with the exception of the first two turbines (due to the wake first arising). This is demonstrated for the blade-root flap-wise bending moments of the blades in Fig. 23, which shows the mean Mbrfw over all three blades during ramp passage at each turbine. For cases with wind speeds not exceeding Vrated, the loads decrease progressing further into the farm. For these sub-rated cases (6 and 7) the right-hand plot also shows how the loads first grow relative to their pre-ramp values and then decay as the ramp propagates through the farm and U decreases. The left-hand plot in Fig. 23 is consistent with the ramp accelerations remaining undamped from turbine to turbine, while the right-hand plot further shows that for all cases the ramps tend to increase loads after the first turbine, at least due to the associated increase in wind speeds (with subsequently reduced CT) and wake. Nearly identical results arise when considering the normalized tower-base fore–aft moments Mtbfa (not shown). In Fig. 23 one can also see that when rated power is achieved, the dominant blade loading is relatively constant throughout the wind farm; when Vrated is not exceeded, then the loads tend to decrease within the farm along with the speed. One can see within the farm where U>Vrated that the rotor-mean loads do not differ much from their pre-ramp values; however, in some cases the speed falls below rated (e.g., case 2 downwind of turbine 1) and the loads are higher than their pre-ramp values.
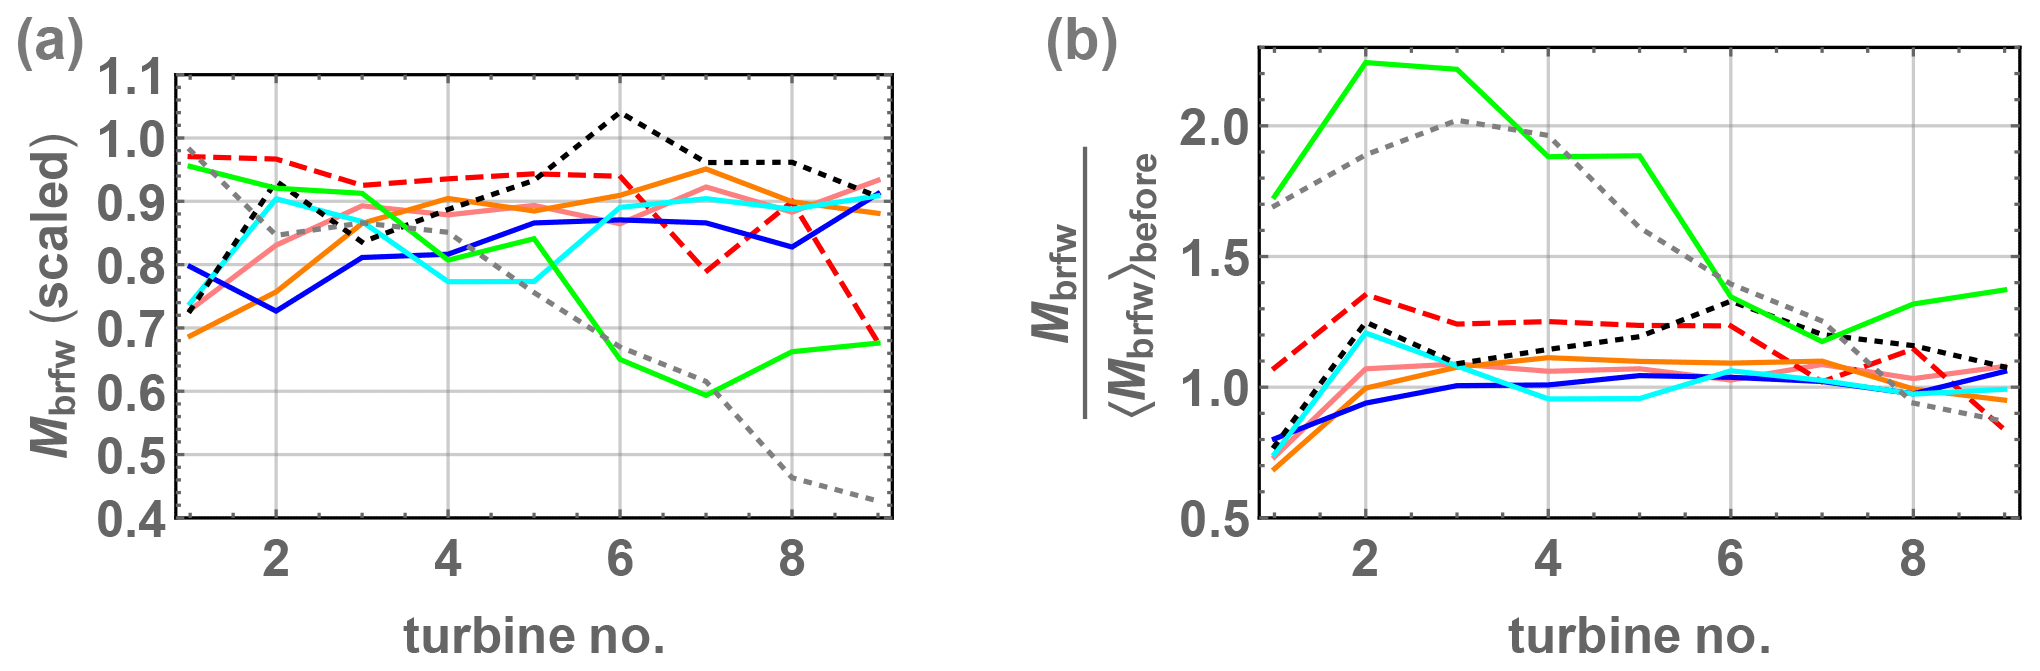
Figure 23Mean flap-wise blade-root bending moment Mbrfw during ramp passage for all cases (averaged over all blades) versus distance into the farm (recalling turbine separation of 7D=560 m). (a) In arbitrary units (proprietary); (b) normalized by pre-ramp values. Color/case legend same as Figs. 11–12, 14–19, and 23.
The maximum simulated ramp-induced loads found at each turbine behave similarly to the mean values shown above in terms of evolution through the farm but not in terms of magnitude. Figure 24 shows the maximum flap-wise blade-root bending moment versus turbine number for each case simulation. Relative to their values before the ramps, the loads are significantly larger, particularly within the wind farm. The ramps are seen to increase the maximum loads, even as Vrated is exceeded and obviously when Vrated is not exceeded, since the wind speed is simply higher. This is also the case for the tower-base fore–aft moments.
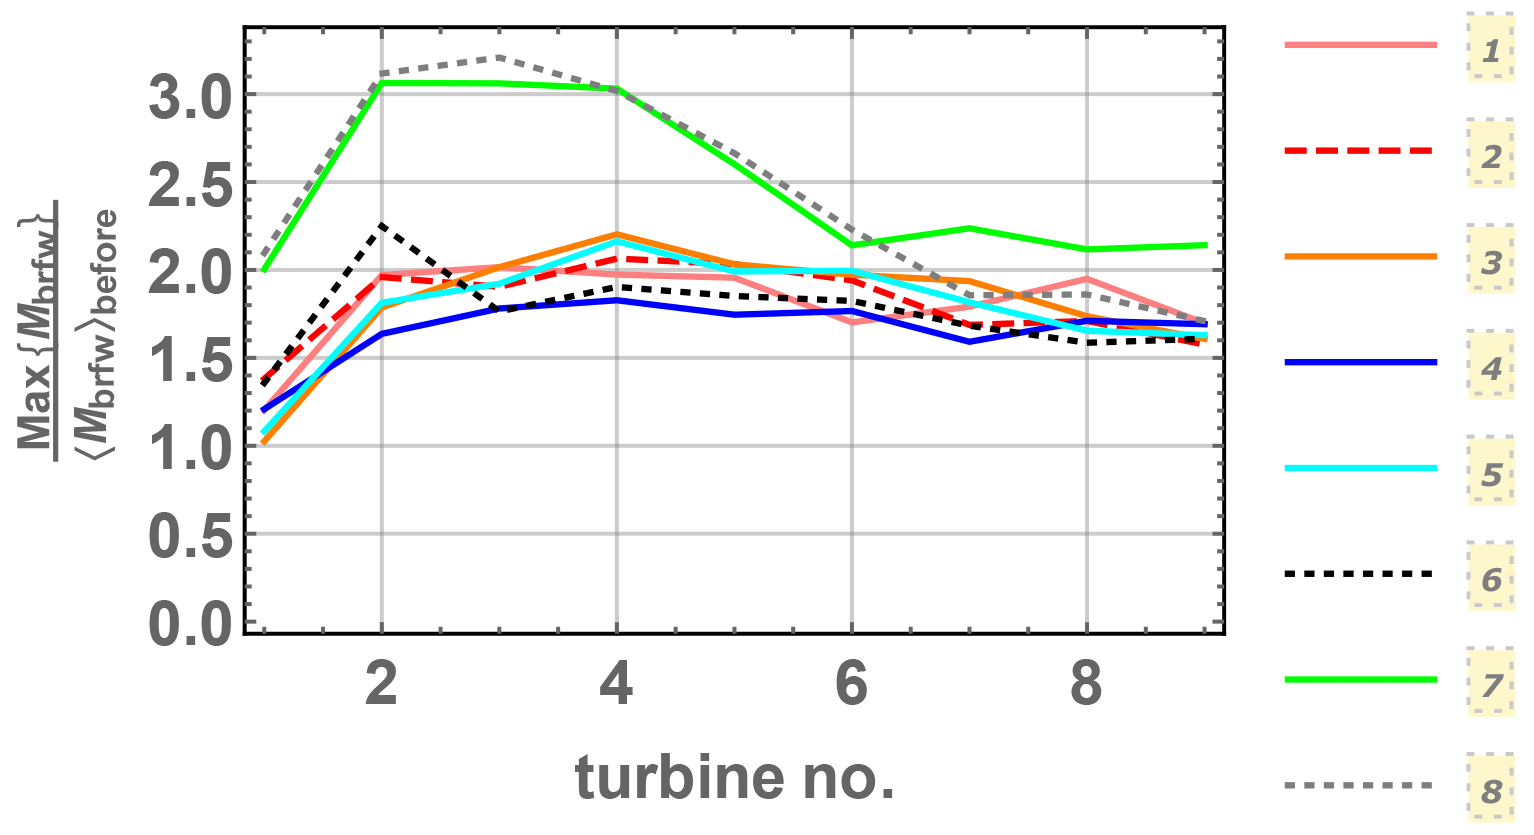
Figure 24Maximum flap-wise blade-root bending moment Mbrfw for all ramp cases from coupled LES, as a function of distance into the farm (turbine number, where turbine separation is 560 m). Color/case legend same as in Figs. 11–12, 14–19, and 22.
4.3 Ensemble ramp-parameter space and effect on loads
Thus far we have discussed the effects of two of the three input parameters defining the wind ramp simulation ensemble, i.e., ramp acceleration and wind speed. The input space also included shear above hub height, in order to address the variable amount of entrainment expected, and its effect on the flow and wind farm during ramp events. The pre-ramp shear in some cases was shifted in the full model chain, compared to ensemble prescription (Table 1). In case 5 the LES gave an upwind shear before the ramp of −0.005 per second instead of 0, and the nonzero (positive) shear cases () had inflow diagnosed to be approximately half the design choice. Regardless of its magnitude, the upwind pre-ramp shear was not found to directly impact the shear or entrainment above and within the simulated farm, and the LES fields exhibited little correlation between upwind and within/over the farm; this is consistent with a wind farm boundary layer developing (e.g., Porté-Agel et al., 2020). Before ramp passage, the cases with lowest speeds have smaller between turbines, but after passage the cases with lowest wind speed tend to exhibit higher upper-rotor shear in the farm, especially downwind of the first three turbines. Both before and after ramp passage, within the farm over the upper half-rotor ranges from 0 to 0.16 per second (up to ∼ 8 times ambient values) due to the turbines, with the difference of being positive or negative depending on distance downstream and case. There is no straightforward relationship between shear before and after ramp passage at these heights, as with the ambient-condition observations; thus we do not include plots of the shear here (Kelly et al., 2019b include such).
Returning to the effects of ramps on loads, we note the ramp accelerations shown earlier with loads (e.g., Fig. 22) were calculated in bulk, as the ratio of ramp amplitude to duration, . But if one considers the accelerations calculated directly at each time step of the simulated time series (every 0.04 s), then its relation to loads becomes difficult to see, especially if is only considered at a single point in space. Using different averaging times (e.g., from 5–60 s), a correlation between loads and appears, but the optimal averaging time depends on the ramp duration, and such dependence was not clear; more work involving filtering and turbine response would better clarify this.8 The accelerations are dependent on the averaging time used, and we remind that turbines act as low-pass filters, responding less to shorter duration accelerations. The spectral response of wind turbines – as well as their control systems – is beyond the scope of this work, though it can be considered relative to the spectral content of accelerations. Given all this, and that we are using only a particular control system and turbine, we have focused on response to the bulk acceleration as above.
For the tower-base fore–aft and blade-root flap-wise bending moments considered here, the maximum loads for each turbine and case occur during the ramp events, near the time when wind speed crosses Vrated. The maximum of tower-base fore–aft moment (Mtbfa,peak) and blade-root flap-wise bending moment (Mbrfw,peak) are generally correlated to maximum acceleration for single (unwaked) turbines, as previously shown by, e.g., Hannesdóttir et al. (2019). But in a wind farm the peak accelerations can be comprised of both the turbulence (primarily from the wake) and the ramp acceleration. Short-duration accelerations (with characteristic timescales much smaller than the ramp rise time Δt) due to the wake are not directly relatable to the ramp acceleration and can be ∼ 10–30 times larger than the bulk acceleration . Thus when plotting maximum load versus maximum acceleration, there is some noise in addition to the trend that one sees. This is shown in Fig. 25, which includes all turbine responses where a ramp causes wind speed to exceed Vrated. The sensitivity of peak loads to peak acceleration appears to be an order of magnitude smaller than the sensitivity to bulk ramp acceleration: % per m/s2 and % per m/s2. However, this is again via single-point calculations, which are not representative of the whole rotor or turbine, and partly due to wake-related accelerations uncorrelated to the ramp.
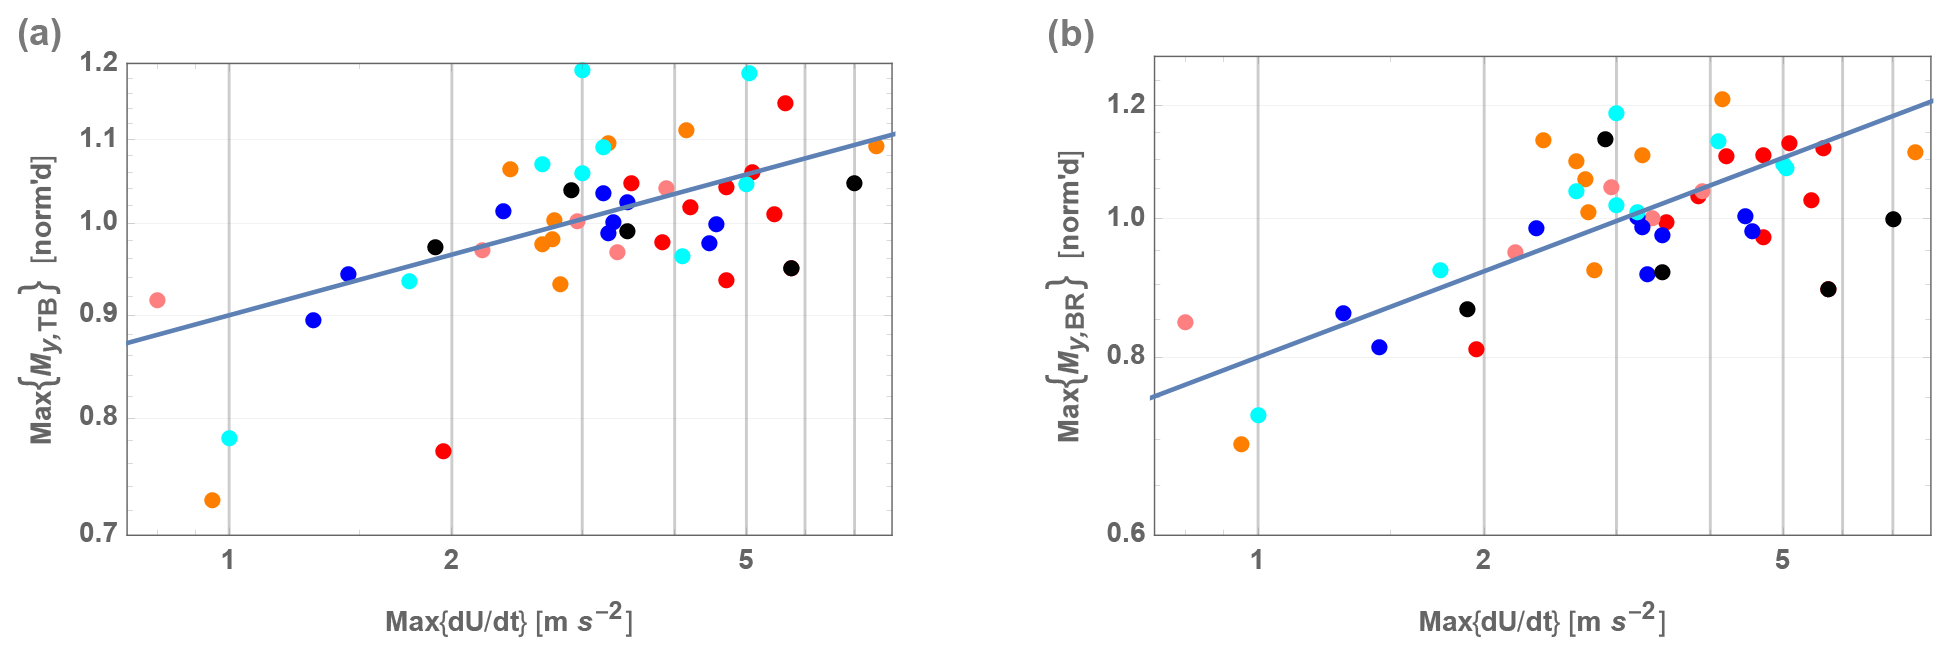
Figure 25Maximum loads (Mtbfa on the left and Mbrfw on the right) versus maximum acceleration: all cases and turbines where speed exceeds rated speed. Load values normalized by mean of all points to protect proprietary information. Colors correspond to cases following previous figures. Lines indicate sensitivity: log–log slope of 0.1 on the left and 0.2 on the right.
For context, we revisit the sensitivity of flap-wise blade-root bending moment Mbrfw and tower-base fore–aft moment Mtbfa to bulk ramp acceleration : and were seen to be the same in both stand-alone and LES coupled simulations (expressed as percentage change in load per acceleration). This is not completely unexpected, recalling that both load types are directly driven by the thrust force. Perhaps more importantly, the loads are increased by roughly 45 % for Mbrfw and 50 % for Mtbfa relative to their values during the non-ramp conditions simulated (Fig. 10); this is also true for the unwaked turbines in the LES. For the NM80 turbine and its control system used here it is expected that the Mbrfw and Mtbfa for unwaked turbines will vary by ∼ 45 % or 50 %, respectively, plus ∼ 3 % per 0.1 m/s2 of based on the simulated ensemble derived from a decade of observed ramps. Thus the maximum observed ramp acceleration of 1 m/s2 from the 11 years of data could correspond to an increase in loads of ∼ 75 % or more relative to nominal conditions. The sensitivity to ramp acceleration is also found to be the same for downwind turbines in wakes (implicit in Fig. 22), though we remind that the bulk ramp accelerations can differ from the upwind incoming ramp . We note that the range of in the ensemble (Table 2) roughly corresponds to ramps expected to occur about twice per year offshore, though weaker ramps obviously occur more frequently (Fig. 2). The ramp-parameter distributions shown in Sect. 2 and the results given in Sects. 3–4 are also consistent with the rate at which offshore ramp events are expected to give conditions exceeding the IEC 61400-1 standard in terms of 10 min standard deviations of wind speed, following the findings of Hannesdóttir et al. (2019).
The statistics of wind-speed ramps and their effects on loads within a wind farm – including sensitivities of loads to ramp characteristics – have been investigated here. Specifically, we focused on the tower-base fore–aft bending moment and flap-wise blade-root bending moment. Such quantitative work was facilitated by (1) statistical reduction based on low-order physics and micrometeorology, via (2) long-term high-frequency observations, and with (3) the incorporation and use of an appropriately coupled high-fidelity model chain. The coupled models comprising the latter are the constrained Mann-model turbulence simulation, large-eddy simulation including an actuator-line model, and the aeroelastic loads model Flex5. Through two model chains of coupled simulations (Mann model to Flex5, and Mann model to LES with actuator-line modeling and Flex5), using a statistically representative ensemble of cases based on the reduced-parameter probability space derived from effectively offshore observations, we were able to find and explain a number of effects. The main results are summarized in the list below.
-
A compact distribution of relevant parameters describing wind-speed ramps in offshore conditions was found, based on long-term observations and accounting for the dominant physics.
-
Ramps causing the wind to exceed rated speed (U>Vrated) offer the highest maxima of blade-root flap-wise bending moment and tower-base fore–aft moment; in these cases the load maxima depend primarily on ramp acceleration.
-
For ramps that do not exceed rated speed (U < Vrated), the loads depend on U more than on ramp acceleration; however, in these cases the speed and turbulence combined can result in load maxima.
-
The bulk ramp accelerations persist through the farm, despite generation of wake turbulence and the decrease of mean winds into the farm.
- –
Downwind of the second turbine, if/where rated speed is exceeded, ramp-associated peak loads are relatively constant through the farm.
- –
-
As mean wind decreases further into the farm, ramps can begin to have U < Vrated (again crossing rated speed), leading to higher loads relative to pre-ramp values.
- –
The distance into the farm where this happens depends on the ratio .
- –
-
The maxima of blade-root flap-wise bending moments (Mbrfw) and tower-base fore–aft moments (Mtbfa) each had a sensitivity of roughly 3 % per 0.1 m/s2 of bulk ramp acceleration for the turbine considered (NM80). This was found in both in stand-alone and coupled LES simulations.
-
In unwaked conditions the total increase in Mbrfw and Mtbfa due to wind-speed ramps was 45 % and 50 %, respectively, plus 3 % per 0.1 m/s2 of for the turbine considered.
With regard to further work and improvements, we note several things. The simulated flows lack the effect of stability, particularly the stable capping inversion, which acts to maintain shear above the farm while moderating entrainment into the farm from above. LES of such events through wind farms can incorporate different capping-inversion strengths and inversion heights, in order to investigate the effect of the shear as well as the inversion height and strength. However, we note the rarity of atmospheric boundary layer depths below 300 m (Liu and Liang, 2010), i.e., twice the upper rotor tip of the wind turbines simulated here. The wind ramp results are not expected to be significantly affected by such inclusion of stable capping inversions in most cases, though future analysis of both observations and simulations can address this issue. We also note the results here were obtained using wind turbines with a rated speed of 14 m/s, whereas Vrated of 12–13 m/s is commonly seen. Lower Vrated will increase the occurrence of ramp-affected speeds crossing into the rated power regime, but the joint distributions found here do not change significantly when considering different Vrated; the sensitivity of loads to the ramp accelerations will not necessarily change either. However, for different turbines and control systems (or operational regimes), one can expect different sensitivity to ramp events; the statistics and findings here can be useful to estimate expected impacts upon wind farms with other turbines.
The three primary codes used here are not publicly accessible, for a number of reasons. Ellipsys3D is licensed software, which can be purchased from DTU. The constrained Mann-model code is experimental and research grade, though the Mann-model turbulence synthesis is available as licensed software (within the program WAsP Engineering) via DTU. The stand-alone Flex5 code is also licensed software.
The Høvsøre database is not open to the public, with direct access to the database possible from within DTU's network; however, for research purposes an agreement can be made between the university and the interested organization (https://windenergy.dtu.dk/english/test-centers/hoevsoere_uk/data-management, last access: September 2021).
MK conceived the statistically driven model chain and sensitivity concepts, performed the statistical analysis and probabilistic characterization, derived the case ensemble, analyzed and visualized the results, and wrote the manuscript draft. SJA performed the coupled large-eddy/actuator-line/aeroelastic simulations, designed the LES setup (with MK), designed and implemented Mann-model forcing in the large-eddy simulation code (Ellipsys), and wrote the basis of Sect. 4.1. ÁH executed her ramp-detection algorithm to identify observed ramps and retrieve ramp parameters and ran the constrained Mann-model simulations for input into Flex5 and LES. All authors have contributed to correcting the manuscript.
The contact author has declared that neither they nor their co-authors have any competing interests.
Publisher's note: Copernicus Publications remains neutral with regard to jurisdictional claims in published maps and institutional affiliations.
We thank Hans Ejsing Jørgensen for informing us of Carbon Trust's Offshore Wind Accelerator funding call and connecting us with the Frazer-Nash Consultancy, who helped to secure funding for (and administer) this project; we also thank Niels N. Sørensen for input on the numerical methodology.
This paper was edited by Sandrine Aubrun and reviewed by two anonymous referees.
Aagard Madsen, H., Bak, C., Paulsen, U. S., Guanaa, M., Fuglsang, P., Romblad, J., Olesen, N. A., Enevoldsen, P., Laursen, J., and Jensen, L.: The DAN-AERO MW Experiments Final report, Tech. Rep. Risø-R-1726-(EN), Risø National Laboratory, Roskilde, Denmark, 2010.
Abkar, M. and Porté-Agel, F.: The Effect of Free-Atmosphere Stratification on Boundary-Layer Flow and Power Output from Very Large Wind Farms, Energies, 6, 2339–2361, https://doi.org/10.3390/en6052338, 2013.
Alcayaga Román, L. A.: From Gusts to Turbulence: Vertical Structure (Fra Vindstød Til Turbulens: Vertikale Struktur), MSc Thesis, Danish Technical University/Oldenburg University, 2017.
Allaerts, D. and Meyers, J.: Wind farm performance in conventionally neutral atmospheric boundary layers with varying inversion strengths, J. Phys. Conf. Ser., 524, 012114, https://doi.org/10.1088/1742-6596/524/1/012114, 2014.
Andersen, S. J.: Simulation and Prediction of Wakes and Wake Interaction in Wind Farms, PhD Dissertation, Danish Technical University, 2014.
Andersen, S. J., Sørensen, J. N., and Mikkelsen, R. F.: Performance and Equivalent Loads of Wind Turbines in Large Wind Farms, J. Phys. Conf. Ser., 854, 012001, https://doi.org/10.1088/1742-6596/854/1/012001, 2017a.
Andersen, S. J., Sørensen, J. N., and Mikkelsen, R. F.: Turbulence and entrainment length scales in large wind farms, Philos. T. R. Soc. A, 375, 20160107, https://doi.org/10.1098/rsta.2016.0107, 2017b.
Andersen, S. J., Sørensen, N. N., and Kelly, M.: LES Modelling of Highly Transient Wind Speed Ramps in Wind Farms, J. Phys. Conf. Ser., 1934, 012015, https://doi.org/10.1088/1742-6596/1934/1/012015, 2021.
Berg, J., Vasiljevic, N., Kelly, M., Lea, G., and Courtney, M.: Addressing Spatial Variability of Surface-Layer Wind with Long-Range WindScanners, J. Atmos. Ocean. Tech., 32, 518–527, 2015.
DeMarco, A. and Basu, S.: On the tails of the wind ramp distributions, Wind Energy, 21, 892–905, https://doi.org/10.1002/we.2202, 2018.
Dimitrov, N., Kelly, M. C., Vignaroli, A., and Berg, J.: From wind to loads: wind turbine site-specific load estimation with surrogate models trained on high-fidelity load databases, Wind Energ. Sci., 3, 767–790, https://doi.org/10.5194/wes-3-767-2018, 2018.
Dimitrov, N. K. and Natarajan, A.: Application of simulated lidar scanning patterns to constrained Gaussian turbulence fields for load validation, Wind Energy, 20, 79–85, https://doi.org/10.1002/we.1992, 2017.
Frandsen, S. T., Jørgensen, H. E., and Sørensen, J. D.: Relevant Criteria for Testing the Quality of Models for Turbulent Wind Speed Fluctuations, J. Sol. Energ. T-ASME, 130, 31016–31022, https://doi.org/10.1115/1.2931511, 2008.
Galinos, C. and Larsen, T. J.: Investigation of rotor imbalance on a NEG-Micon 80 Wind Turbine, DTU Wind Energy Tech. Report I-0386, Roskilde/Risø Campus, 13 pp., 2015.
Gallego-Castillo, C., Cuerva-Tejero, A., and Lopez-Garcia, O.: A review on the recent history of wind power ramp forecasting, Renew. Sust. Energ. Rev., 52, 1148–1157, https://doi.org/10.1016/j.rser.2015.07.154, 2015.
Gilling, L., Sørensen, N. N., and Réthoré, P.-E.: Imposing resolved turbulence by an actuator in a detached eddy simulation of an airfoil, Proc. Of the 2004 European Wind Energy Conference, European Wind Energy Association (EWEA), Marseille, 2009.
Hannesdóttir, Á.: Extreme wind speed ramps – probabilistic characterization for turbine loads, PhD Dissertation, Danish Technical University, 2019.
Hannesdóttir, Á. and Kelly, M.: Detection and characterization of extreme wind speed ramps, Wind Energ. Sci., 4, 385–396, https://doi.org/10.5194/wes-4-385-2019, 2019.
Hannesdóttir, Á., Kelly, M., and Dimitrov, N. K.: Extreme variance vs. turbulence: What can the IEC cover?, Wind Energy Denmark 2017, poster session, Herning, Denmark, 2017.
Hannesdóttir, Á., Kelly, M., and Dimitrov, N.: Extreme wind fluctuations: joint statistics, extreme turbulence, and impact on wind turbine loads, Wind Energ. Sci., 4, 325–342, https://doi.org/10.5194/wes-4-325-2019, 2019.
Hannesdóttir, Á, Urbán, A. L., and Verelst, D. R.: Extreme coherent gusts with direction change – observations, yaw control and wind turbine loads, Wind Energ. Sci. Discuss., in preparation, 2021.
International Electrotechnical Commission: IEC 61400-1 Wind turbines – Part 1: Design requirements, 4th Edn., International Electrotechnical Commission, Geneva, Switzerland, 2019.
Jahn, D. E., Takle, E. S., and Gallus Jr., W. A.: Wind-Ramp-Forecast Sensitivity to Closure Parameters in a Boundary-Layer Parametrization Scheme, Bound.-Lay. Meteorol. 164, 475–490, https://doi.org/10.1007/s10546-017-0250-5, 2017.
Kelly, M.: From standard wind measurements to spectral characterization: turbulence length scale and distribution, Wind Energ. Sci., 3, 533–543, https://doi.org/10.5194/wes-3-533-2018, 2018.
Kelly, M., Larsen, G. C., Dimitrov, N. K., and Natarajan, A.: Probabilistic Meteorological Characterization for Turbine Loads, J. Phys. Conf. Ser., 524, 012076, https://doi.org/10.1088/1742-6596/524/1/012076, 2014.
Kelly, M., Cersosimo, R. A., and Berg, J.: Universal wind profile for the inversion-capped neutral atmospheric boundary layer, Q. J. Roy. Meteor. Soc., 145, 982–992, 2019a.
Kelly, M., Andersen S. J., and Hannesdóttir, Á.: Impact of wind-speed ramps on turbines: from fluid-dynamic to aeroelastic simulation, via observed joint statistics, Tech. Rep. DTU Wind Energy E-0194, Danish Technical University, Risø Campus, Roskilde, Denmark, 2019b.
Liu, S. and Liang, X.-Z: Observed Diurnal Cycle Climatology of Planetary Boundary-Layer Height, J. Climate, 23, 5790–5809, 2010.
Mann, J.: The spatial structure of neutral atmospheric surface-layer turbulence, J. Fluid Mech., 273, 141–168, 1994.
Mann, J.: Wind Field Simulation, Prob. Eng. Mech., 13, 269–282, 1998.
Michelsen, J. A.: Basis3D – a platform for development of a multiblock PDE solver, Tech. Rep. DTU AFM 92-05, Danish Technical University, 1992.
Musilek, P. and Li, Y.: Forecasting of wind ramp events – analysis of cold front detection, Proc. 31st International Symposium on Forecasting, Prague, Czech Republic, June 2011.
Nygaard, N. G. and Hansen, S. D.: Wake Effects between Two Neighbouring Wind Farms, J. Phys. Conf. Ser., 753, 032020, https://doi.org/10.1088/1742-6596/753/3/032020, 2016.
Øye, S.: FLEX5 simulation of wind turbine dynamics, Proc. 28th IEA Meeting of Experts Concerning State of the Art of Aeroelastic Codes for Wind Turbine Calculations, International Energy Agency, Lyngby/DTU, Denmark, 1996.
Panofsky, H. A. and Dutton, J. A.: Atmospheric Turbulence, Wiley, New York, 397 pp., 1984.
Peña Diaz, A., Floors, R., Sathe, A., Gryning, S.-E., Wagner, R., Courtney, M. S., Larsén, X. G., Hahmann, A. H., and Hasager, C. B.: Ten Years of Boundary-Layer and Wind-Power Meteorology at Høvsøre, Denmark, Bound.-Lay. Meteorol., 158, 1–26, 2016.
Porté-Agel, F., Bastankhah, M., and Shamsoddin, S.: Wind-Turbine and Wind-Farm Flows: A Review, Bound.-Lay. Meteorol., 174, 1–59, https://doi.org/10.1007/s10546-019-00473-0, 2020.
Sørensen, J. N. and Shen, W. Z.: Numerical modelling of Wind Turbine Wakes, J. Fluids Eng., 124, 393–399, https://doi.org/10.1115/1.1471361, 2002.
Sørensen, J. N., Mikkelsen, R. F., Henningson, D. S., Ivanell, S., Sarmast, S., and Andersen, S. J.: Simulation of wind turbine wakes using the actuator line technique, Philos. T. R. Soc. A, 373, 20140071, https://doi.org/10.1098/rsta.2014.0071, 2015.
Sørensen, N. N.: General purpose flow solver applied to flow over hills, PhD Dissertation, Danish Technical University, Risø National Laboratory, 1995.
Ta Phuoc, L.: Modèles de sous-maille appliqués aux écoulements instationnaires et décollés, Journée thématique DRET – Aérodynamique instationnaire turbulente, aspects numériques et expérimentaux, 1994.
Ta Phuoc, L., Lardat, R., Coutanceau, M., and Pineau, G.: Recherche et analyse de modeles de turbulence de sous maille adaptés aux écoulements instationnaires décollés, Tech. Rep. LIMSI 93074, Lab. d'Inf. pour la Mecanique et les Sci. de l'Ingenieur, Orsay, 1994.
Troldborg, N.: Actuator line modeling of wind turbine wakes, PhD Dissertation, Danish Technical University, 2009.
Wyngaard, J.: Turbulence in the Atmosphere, Cambridge Univ. Press, Cambridge, UK, 393 pp., 2010.
This method finds the strongest ramps relative to turbulence, while also rejecting cases with weak turbulence where σu,hpf is appreciably smaller than 1 m/s. Further explanation is included in the next section, and more details can be found in Hannesdóttir and Kelly (2019).
The choice of turbine was due to the supporting project applying the Rødsand II wind farm (e.g., Nygaard and Hansen, 2016).
The transient shear was shown in Hannesdóttir et al. (2017) to induce tower-top yaw (and possibly tilt) moments stronger than those induced by the design-load case prescription for transient shear (DLC1.5) in the IEC 61400-1 standard, but these magnitudes do not exceed the IEC extreme turbulence prescription (DLC1.3). Here we consider primarily the tower-base fore–aft moment and blade-root flap-wise bending moments, which for the observed ramps exceed DLC 1.3 in the 61400-1 (see also Hannesdóttir et al., 2019).
We remind that tends to be well correlated with (at least monotonic in) the momentum flux 〈uw〉; the latter is typically parameterized as proportional to the former via first-order closure and mixing-length turbulence models (e.g., Panofsky and Dutton, 1984). Production of turbulent kinetic energy (TKE) is also proportional to . The vertical (entrainment) flux of mean kinetic energy ( can be nonlinear in the shear but is yet more sensitive to (see, e.g., chap. 5 of Wyngaard, 2010). Comparing with Kelly et al. (2014), and noting the logarithmic character of α, one can see these fluxes are not as directly related and are less sensitive to α. However, use of α for flux parameterizations can certainly be explored further.
In the zero-shear cases, LMM=200 m was assigned based on the spectral length scales diagnosed in Kelly (2019) from these same data, under the condition dU/dz≃0
The Mann-model output velocity components and consequent accelerations follow the Kolmogorov spectrum, without the high-frequency noise characteristic of measurements. However, given their (and thus ) dependence, the acceleration still depends slightly on output time step.
The power for all downwind turbines can be seen in the Appendix of the technical report by Kelly et al. (2019b).
Note that different turbines, as well as different control systems/strategies, will have markedly different spectral responses; thus an optimal averaging time is not certain or trivial.
- Abstract
- Introduction
- Statistical characterization for model-chain simulations of wind-speed ramps
- Constrained turbulence simulation with ramps
- Coupled large-eddy simulation (LES) of ramps through a simple farm
- Conclusions
- Code availability
- Data availability
- Author contributions
- Competing interests
- Disclaimer
- Acknowledgements
- Review statement
- References