the Creative Commons Attribution 4.0 License.
the Creative Commons Attribution 4.0 License.
 | 20 May 2021
A fracture mechanics framework for optimising design and inspection of offshore wind turbine support structures against fatigue failure
Peyman Amirafshari
Feargal Brennan
Athanasios Kolios
Offshore wind turbine (OWT) support structures need to be designed against fatigue failure under cyclic aerodynamic and wave loading. The fatigue failure can be accelerated in a corrosive sea environment. Traditionally, a stress–life approach called the S–N (stress–number of cycles) curve method has been used for the design of structures against fatigue failure. There are a number of limitations in the S–N approach related to welded structures which can be addressed by the fracture mechanics approach. In this paper the limitations of the S–N approach related to OWT support structure are addressed and a fatigue design framework based on fracture mechanics is developed. The application of the framework to a monopile OWT support structure is demonstrated and optimisation of in-service inspection of the structure is studied. It was found that both the design of the weld joint and non-destructive testing (NDT) techniques can be optimised to reduce in-service inspection frequency. Furthermore, probabilistic fracture mechanics as a form of risk-based design is outlined and its application to the monopile support structure is studied. The probabilistic model showed a better capability to account for NDT reliability over a range of possible crack sizes as well as to provide a risk associated with the chosen inspection time which can be used in inspection cost–benefit analysis. There are a number of areas for future research, including a better estimate of fatigue stress with a time-history analysis, the application of the framework to other types of support structures such as jackets and tripods, and integration of risk-based optimisation with a cost–benefit analysis.
- Article
(4541 KB) - Full-text XML
- BibTeX
- EndNote


Wind turbines are playing a key role in decarbonising world power production systems. The share of energy from renewable sources in the European Union (EU) countries set out by national energy and climate plans (NECPs) is targeted to reach 32 % by 2030 and 100 % by 2050. In 2018 the total share of energy from renewable sources was 18 % in the EU and 16 % in the United Kingdom (European Environment Agency, 2019). Thanks to the commitment of European countries to achieve the above targets the prospects for the offshore renewable industry for further growth continue to be strong (Fraile et al., 2019).
Since the power production of a wind turbine is directly related to the wind velocity at the hub, the developments of offshore wind turbines (OWTs) are expected to grow in order to harvest more power from offshore sites where wind speed is generally higher compared to onshore. Furthermore, OWTs are socially more accepted as there are concerns about onshore wind turbines regarding their astatic aspects, noise pollution, and their risk for birds (Tavner, 2012).

Despite their higher wind power capacity, the biggest disadvantage of OWTs is their construction and maintenance costs. Due to their remote location, their inspection and maintenance are challenging and expensive. Therefore, optimising the design and maintenance of these structures can decrease the levelised cost of electricity (LCOE) (Baum et al., 2018; Luengo and Kolios, 2015).
OWT support structures constantly experience cyclic stress imposed by wind turbulence and wave loading which makes them prone to fatigue failure (Barltrop and Adams, 1991). The fatigue damage accumulation could be further accelerated if exposed to the corrosive marine environment.
There are two approaches for quantifying fatigue damage: the S–N (stress vs. number of cycles) method and the fracture mechanics (FM) approach.
Standards such as IEC 61400-3 (IEC, 2009), DNVGL-ST-0126 (DNVGL, 2016a), DNVGL-ST-0437 (DNVGL, 2016b), and DNVGL-RP-C203 (DNV, 2010) are commonly used for the design of offshore wind turbines against fatigue failure. Current design approaches are solely based on the S–N method. In this approach, the fatigue life of a structural element is determined using a relevant S–N curve, recommended by one of the standards or derived from bespoke fatigue test programmes. Service-induced stresses, contributing to fatigue damage accumulations, are determined from structural analysis; then a suitable joint class capable of resisting those stresses is specified. Alternatively, if the joint class is known, maximum allowable fatigue stresses for the intended life of the structure are determined from the relevant S–N curve (Hobbacher, 2016).
Fatigue design of steel structures using S–N data is commonly preferred to the fracture mechanics approach due to its simplicity (Naess, 1985). The S–N approach is also considered more reliable since it is based on fatigue testing compared to fracture mechanics which is based on calculations where additional input variables (e.g. crack growth rate, toughness, and residual stress distributions) need to be considered (Anderson, 2005).
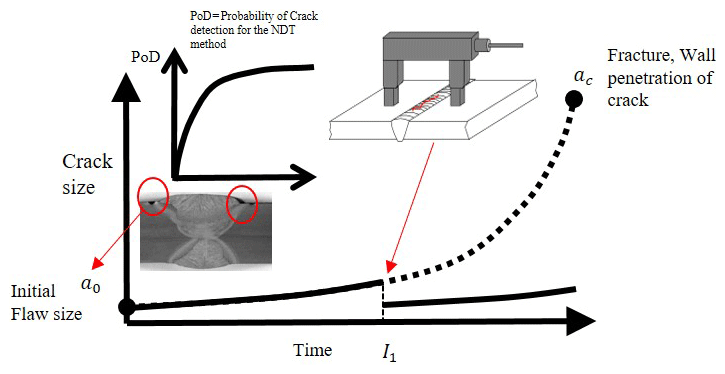

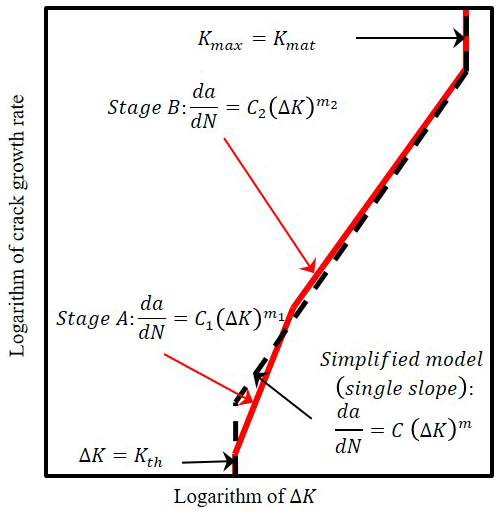
Figure 3Schematic of crack propagation curve according to the Paris–Erdogan law (Amirafshari, 2019).
Despite its popularity, a number of limitations exist with the S–N data approach concerning offshore wind turbine structures:
Design for inspection. Many structures are designed considering a damage-tolerant philosophy where the structure is expected to tolerate certain levels of fatigue damage until the next scheduled inspection (Fig. 1). The expected crack size at the time of the inspection is estimated using fracture mechanics, and a suitable non-destructive testing (NDT) technique capable of detecting the critical crack size is prescribed. The S–N approach can only quantify the accumulated damage without providing any information about the size and dimensions of the damage. Fracture mechanics on the other hand estimates time-dependent fatigue crack size. In OWT structures, due to access restrictions, the choice of the NDT method can be limited to a certain NDT method with a specific detection capability. Therefore, it may be necessary to consider the probability of non-detection (PoND) and improve the design for such a scenario.
Effect of larger defect sizes. S–N data are based on the assumption that the initial defect sizes are small, typically between 0.04 and 0.2 mm (BSI7608, 2015), assuming that an appropriate fabrication quality control programme is in place which can detect larger fabrication defects. In practice, the reliability and efficiency of such a programme and the NDT techniques are uncertain and vary considerably among fabrication yards (Amirafshari, 2019). Assessment and design of the welded joints considering the presence of large defects is only possible using a fracture mechanics approach. An improved joint design can be achieved allowing for possible fabrication defects by specifying, for example, larger thicknesses, higher-toughness steels, or post-weld heat treatment (Zerbst et al., 2015).
New welding processes. There are always efforts to improve structural resistance, fabrication efficiency, and weld quality by developing and implementing new welding technologies. Those processes may inevitably have altered characteristics (defect rates, sizes, and geometry; residual stresses; material toughness; etc.), which affect fatigue failure of the joint. Considering these variables using S–N data requires the development of a bespoke fatigue test programme which is not always feasible (Lassen and Recho, 2013). A more efficient and cost-effective solution is the application of fracture mechanics.
New materials. Development and use of new steel grades with higher tensile strength and weld consumables with superior weldability characteristics affect fatigue life; i.e. higher-strength steel will be capable of resisting higher stresses, but the fatigue resistance does not increase proportionally (Okumoto et al., 2009). Contrary to the S–N method, these variables can be directly considered in the fatigue life prediction using fracture mechanics.
Shakedown and compressive residual stresses. Fracture failure of welded joints is directly related to weld residual stresses. Tensile residual stresses reduce fatigue life by reducing fracture capacity and moving the compressive part of cyclic stress to the tensile stress region. Part of these stresses can be relieved under service or fabrication loads, which is commonly known as the “shakedown” effect (Li et al., 2007). In pile foundations, on the other hand, since the structure is driven to the soil, a considerable number of compressive residual stresses are induced into the pile (Da Costa et al., 2001), which can potentially improve the fatigue and fracture performance. The effect of compressive residual stress and the shakedown phenomena and its interaction with various flaw sizes can be addressed using a fracture mechanics approach.
In this paper the fracture mechanics principals are briefly described, and a framework for an optimised design of structures based on fracture mechanics is developed. Then, probabilistic fracture mechanics for risk and reliability-based design approaches is outlined. Finally, the application of the developed methods to a monopile support structure is demonstrated.
Fatigue cracks in welded structures are initiated from weld fabrication defects at the joints. Even sound welded joints often contain small undercuts (Fig. 2).
The fracture mechanics approach uses the Paris equation to predict crack growth under cyclic stress. The method is based on the assumption that an initial flaw is present in the structure. The initial flaw size depends on the rigour of the fabrication quality control (QC) programme (Jonsson et al., 2016). The reliability of the NDT method that is used during the QC, the extent of the inspection (100 % or partial), and the flaw acceptance criteria will influence such rigour.
The fracture mechanics enables the efficient application of NDT methods for in-service inspection by specifying inspection interval(s) and the most effective NDT method which has the capability to reliably detect the predicted crack size with required confidence. This is illustrated in Fig. 2, where the NDT inspection (I1) detects cracks greater than the initial flaw size (a0). If all such cracks are found and repaired, the crack growth curve will be shifted down.
2.1 Crack growth prediction
Fracture mechanics (FM) enables the prediction of crack propagation by using the crack growth rate, illustrated in Fig. 3. Region A is where the crack growth rate occurs as soon as ΔK≥ΔKth, where ΔKth is the threshold value of ΔK. The threshold value depends on a number of factors such as the stress ratio , sequence effect, residual stresses, loading frequency, and environment. Region B is where the crack growth rate increases with ΔK to a constant power. Region C is where the crack growth rate increases rapidly until failure occurs as soon as K≥Kcritical.
In the FM approach crack growth rate is commonly described by the Paris–Erdogan equation (Eq. 1):
where is the rate of crack growth to load cycles, ΔK is the change in stress intensity factor, and C and m are material constants. Recently a bilinear crack growth model has been used as well (Fig. 4). The BS 7910:2019-recommended model (British Standard, 2019) is the bilinear model, and the simplified model is cited as well.
Stress intensity factor is described by
where a is flaw size, σ is stress at the flaw, and Y is the geometry function which depends on both the geometry under consideration and the loading mode. There are several ways in which solutions for Y can be obtained. Although it is possible to derive solutions for simple geometries analytically, e.g. using “weight functions”, numerical techniques are more commonly used (finite element, finite difference, or boundary element methods).
The number of cycles to failure is calculated by rearranging and rewriting Eq. (1):
Offshore structures are not subjected to constant-amplitude stress but a variable-amplitude stress spectrum. If the long-term stress distribution is converted into a step function of n blocks, generally of equal length in log N, the crack size increment for step i is
Moreover, the final crack size at the end of the N cycles is obtained by summing Eq. (4) for the n stress blocks:
Equation (4) is only valid for small values of Δai since ΔKi depends on the crack size, which requires dividing the stress range spectrum into a large number of stress blocks.
The number of cycles to failure may, alternatively, be calculated according to Eq. (6) using an equivalent constant-amplitude stress range Δσeq giving the same amount of damage (Naess, 1985):
where β is the contribution factor. For the central part of the crack growth curve, β is often taken as the slope of the of the crack growth line. pΔσ(Δσ) is the probability density function of the stress range Δσ.
2.2 Failure criteria
2.2.1 Through thickness
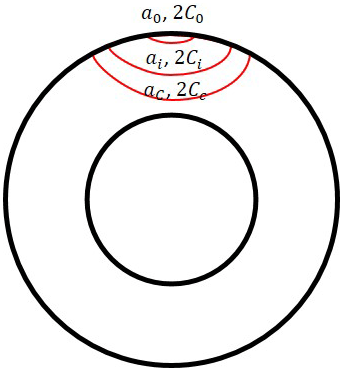
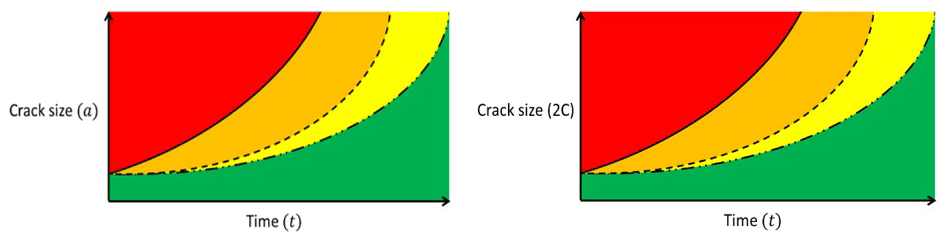
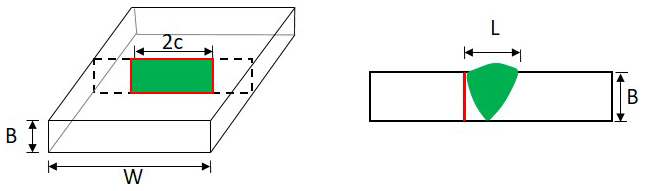
In the through-thickness criterion, the initial fatigue crack is assumed to be a surface-breaking flaw growing along the height (a) and length (2C) of the flaw. The failure happens when the crack height penetrates through the thickness of the wall (Fig. 5). This criterion is, particularly, commonly adopted for structures containing pressurised containments, e.g. pipelines, pressure vessels, or for air-filled offshore structures, where the pressure or absence of water inside the structure can be used as a simple way to detect through-thickness cracks.
2.2.2 Total collapse criteria
Many structures have the capacity to sustain through-thickness cracks until the crack length reaches a critical length. Thin wide plates that are primarily subjected to membrane stress and redundant structures such as jacket type platforms and stiffened plate hull structures are examples of such structures.
In structural reliability analysis, the probability of a collapse can be considered the probability of a fatigue crack failure, PF, times the probability of a collapse given that there is a fatigue failure in the structure, PSYS. The probability of the total structural collapse due to fatigue failure should be below a target probability of failure, Pt:
For jacket structures, the method of removing one member has been commonly used to assess the residual capacity against overall collapse (DNV, 2015).
2.2.3 Critical crack size
Fatigue failure is considered to occur when the crack size reaches a critical value. There are generally two ways to determine the critical size, which are explained in the coming sections:
-
based on the geometry of the structural member
-
based on the failure assessment diagram.
The critical size may then be reduced to account for further safety factors.
Based on the geometry of the structural member
For ductile structures, it is common to take the material thickness as the critical crack height (). However, normally the assumption is that the crack grows under cyclic loading which corresponds to normal service loading until it occurs through the thickness. In reality, failure often happens during extreme load occurrences. The cracked structure may fail under such extreme loading through the failure of the thickness ligament (Fig. 6). The brittle or elastoplastic ligament failure may also occur in structures with low fracture toughness.

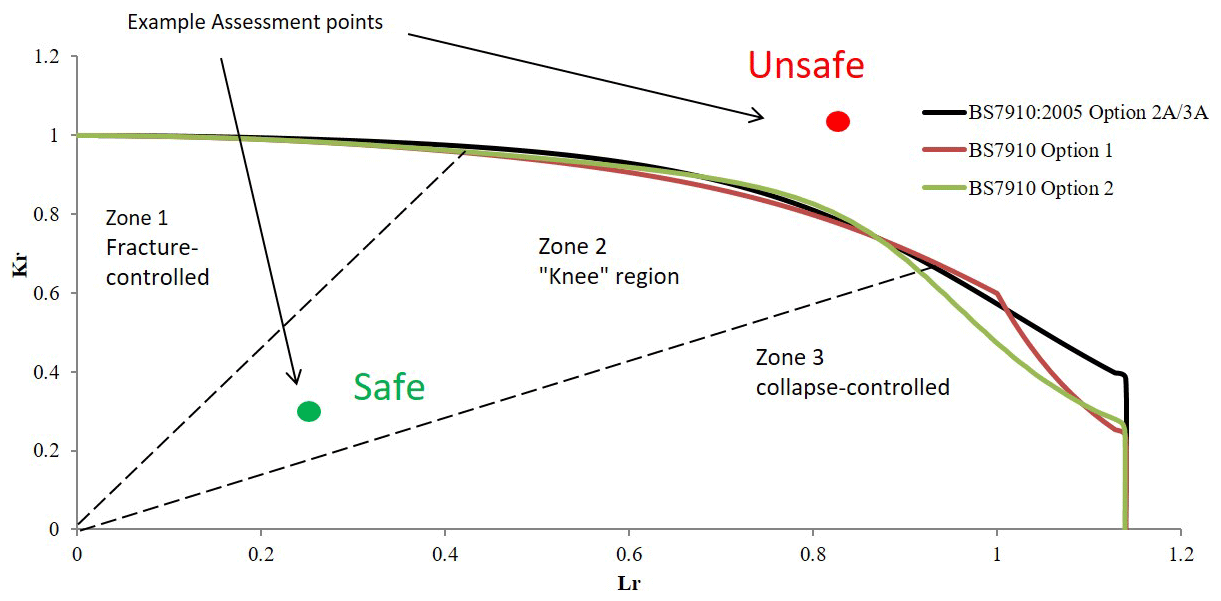
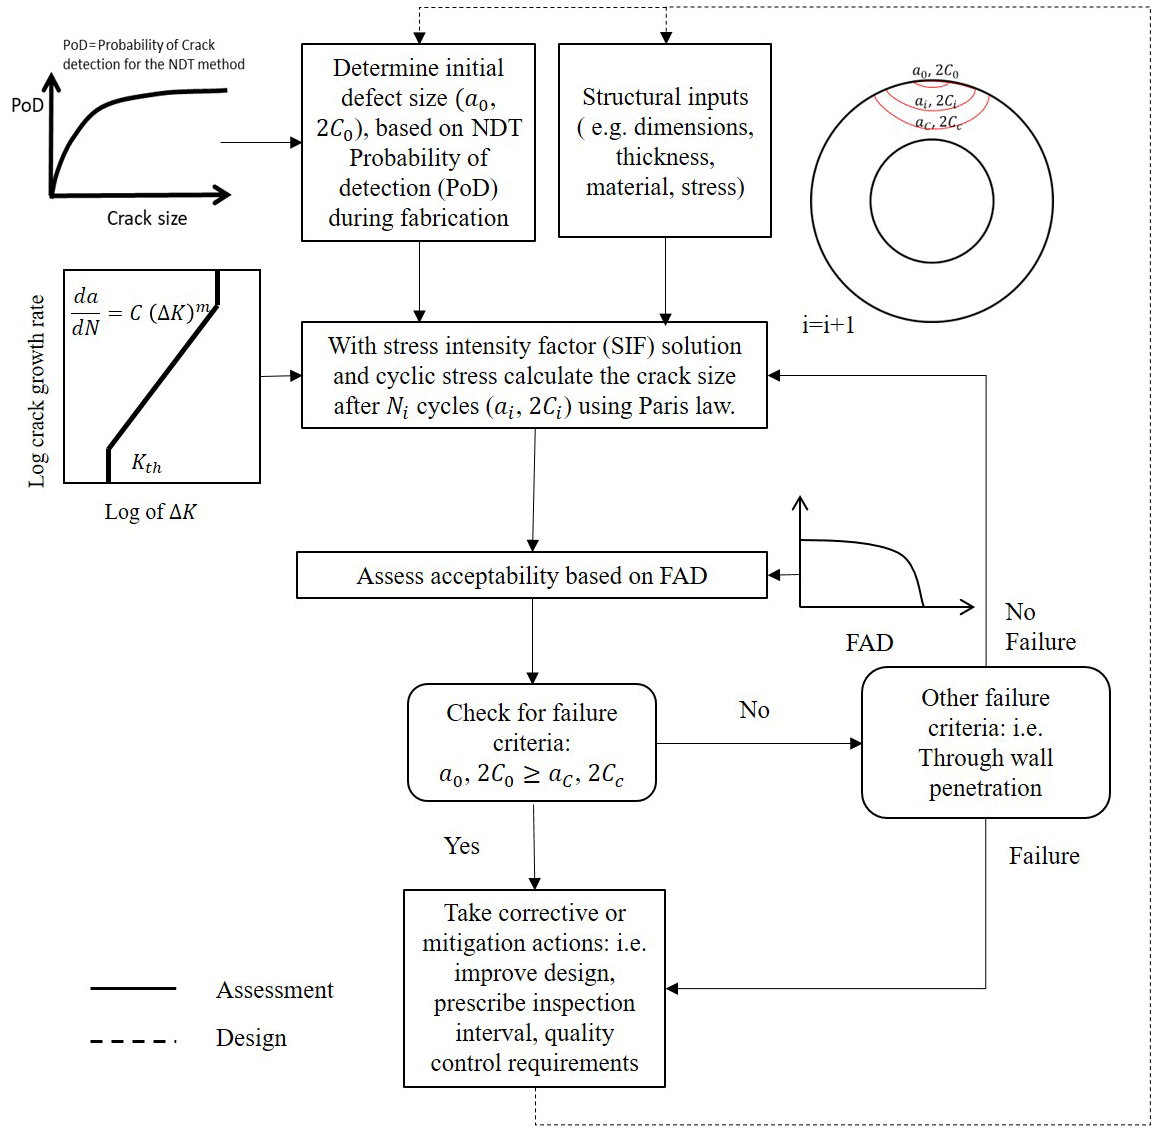
Figure 8Fracture mechanics flow diagram for assessment and design of structures against fatigue failure.
To address the above limitation a failure assessment diagram (FAD) may be adopted.
Based on the failure assessment diagram (FAD)
A failure assessment diagram (FAD) can assess the failure of the through-thickness crack as well as implement extreme load occurrences by treating them as the primary stress. The approach is explained below.
When a crack propagates through a structure, the crack size ultimately reaches a critical size af. af corresponds to a critical stress intensity factor, usually taken as characteristic of the fracture toughness Kmat, at which fracture happens. Alternatively, if the applied load is high and the structure tensile strength is low, the structure may reach its tensile strength capacity and fail by plastic collapse. The latter is more favourable as it is usually associated with large deformations prior to failure providing some level of warning. In between brittle fracture and global collapse is an elastoplastic failure mode, where failure occurs before reaching the plastic capacity or toughness limit; this has been best described by a failure assessment diagram (FAD) in the R6 procedure in 1976 and improved over time by e.g. including the options available to model specific material properties. The body of knowledge encapsulated in R6 has affected the development of British Standards Institution documents in various ways over the years, leading to BS 7910:1999 and the latest version at the time of writing (British Standard, 2019).
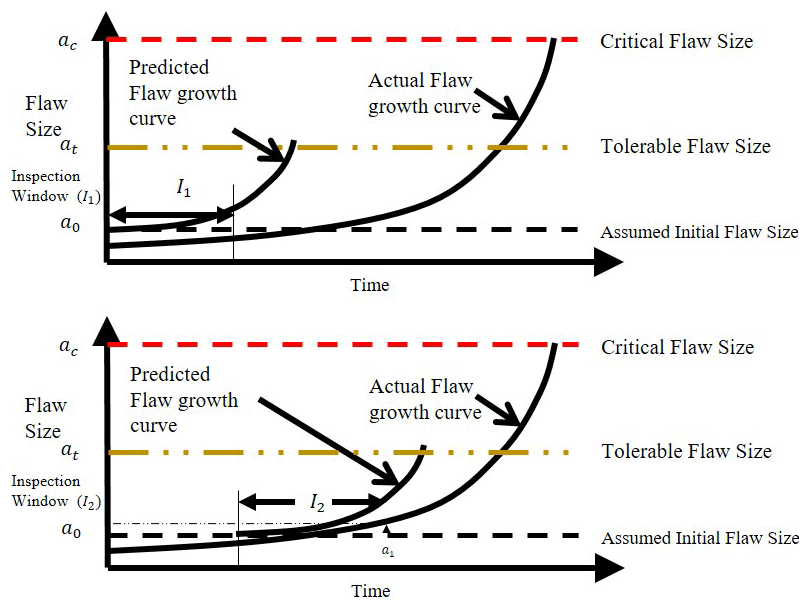
Figure 9Schematic representation of damage-tolerant fracture mechanics approach, adapted from Anderson (2005).
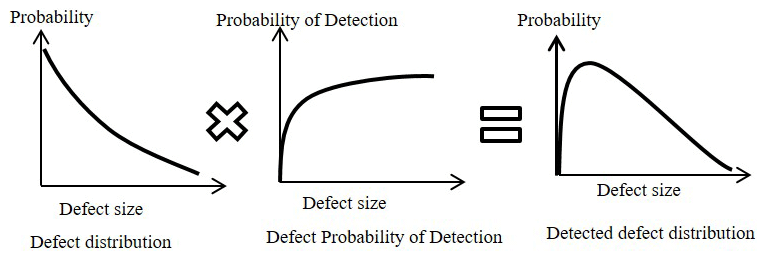
Figure 10Relationship between crack size distribution, probability of detection, and detected crack size distribution (Amirafshari, 2019).
The failure assessment line (FAL) represents the normalised crack driving force:
Kr is equal to 1 where the applied load is zero and declines as the ratio between the applied load and yield load (Lr) increases towards the collapse load (see Fig. 7).
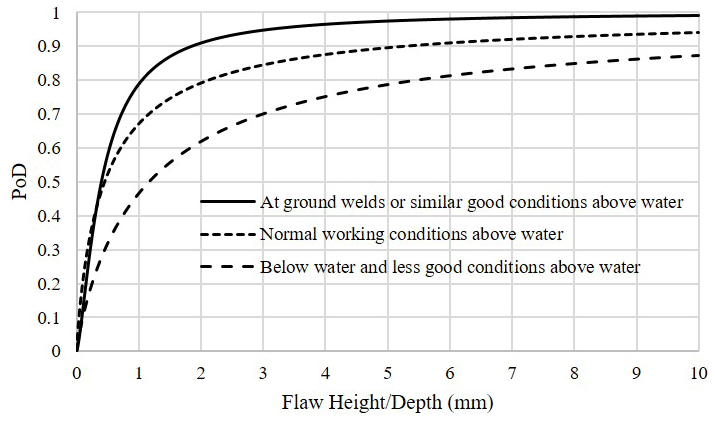

Figure 12Probabilistic fracture assessment using the Monte Carlo method and based on FAD (Amirafshari, 2019).
The plastic collapse load is calculated based on yield stress. However, the material has further load carrying capacity as it work hardens through yield to the ultimate tensile stress. To take this into account the rightward limit of the curve is fixed at the ratio of the flow stress to the yield stress:
The flow stress is the average of the yield and ultimate stresses:
If the assessment point lies inside the envelope (below the FAL), the fracture mechanics driving parameter is lower than the material resistance parameter and the part should be safe; otherwise, there is a risk of failure. The failure assessment diagram can be determined with one of the procedures provided by British Standard (2019). As it is illustrated in Fig. 7, FAD may be categorised into three different zones: Zone 1 is the fracture-dominant zone; Zone 2 is the elastoplastic region or the knee region; and Zone 3 is the collapse-dominant zone.
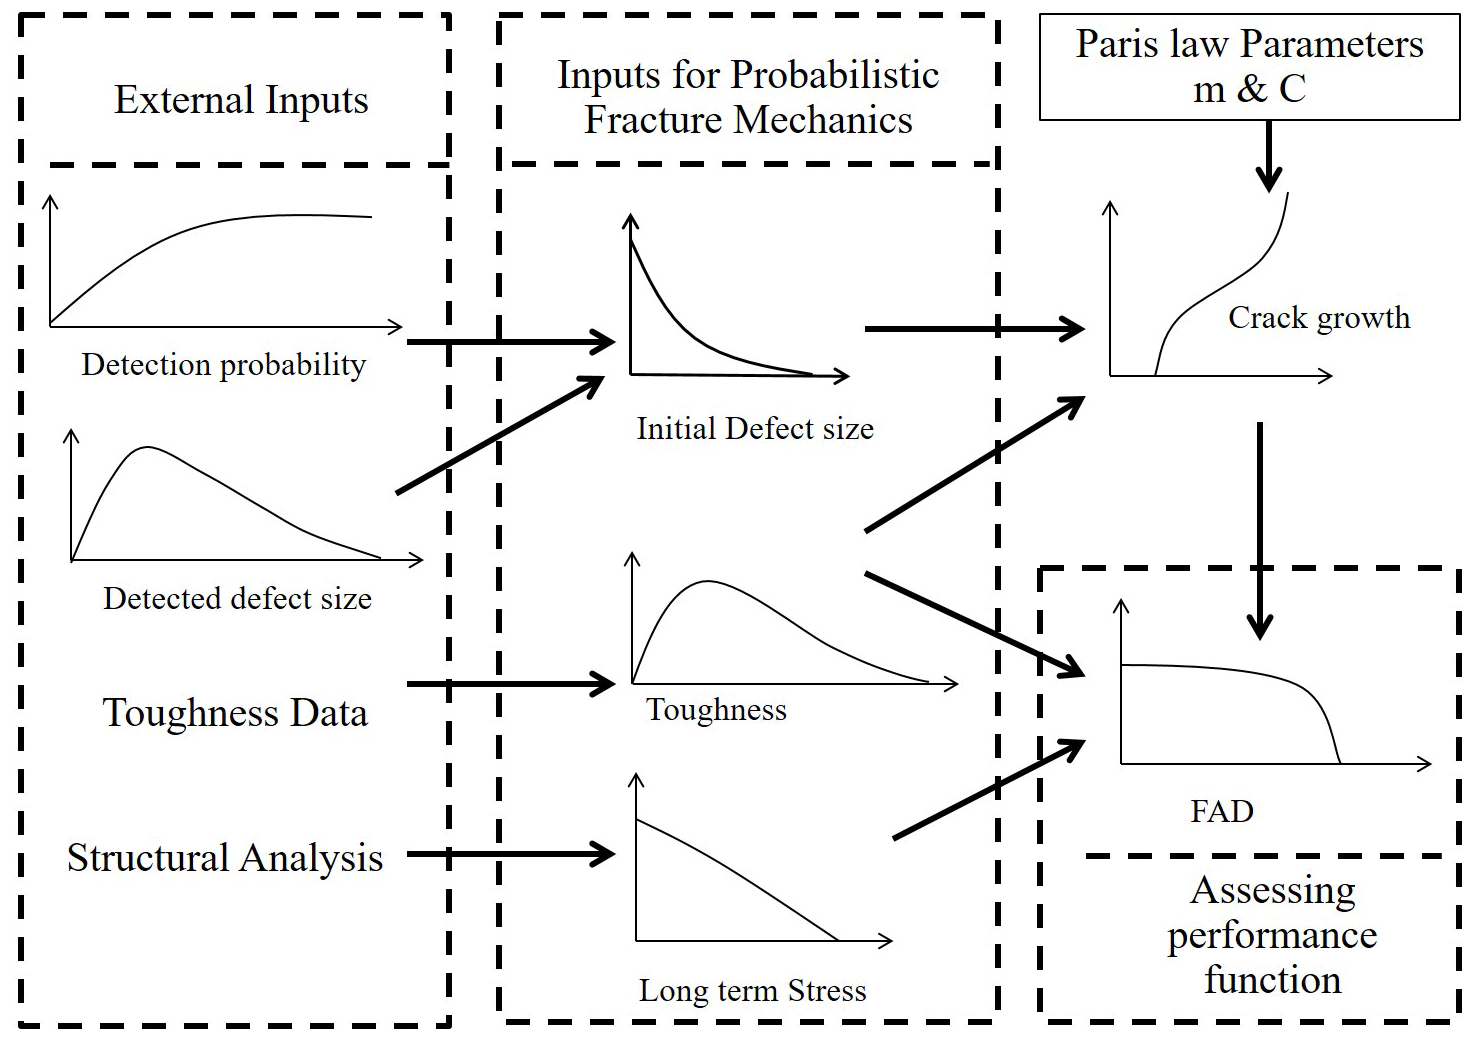
Figure 13A schematic presentation of the inputs to probabilistic fracture mechanics (Amirafshari, 2019).
British Standard (2019) has three alternative approaches: Option 1, Option 2, and Option 3. These are of increasing complexity in terms of the required material and stress analysis data but provide results of increasing accuracy.
Options 1 and 2 (British Standard, 2019) and options 2A and 3A (British Standard, 2019) for structural steel with ultimate tensile stress of 550 MPa and yield stress of 450 MPa are illustrated in Fig. 7. It can be seen that the greatest difference between the three plotted loci is in the collapse region. For discussions about BS 7910 options, reference is made to British Standard (2019) and TWI (2015).
The common practice in structural design is to specify dimensions of the structural component based on the most critical limit state, usually ultimate limit state (ULS), and check or modify the design based on other limit states such as the serviceability limit state (SLS) or fatigue limit state (FLS).
In OWT support structures fatigue failure initiates from the welded connection; thus, the fatigue design often involves prescribing local improvements to the welded connection. However, since fatigue life is related to dynamic characteristics of the structure, the global dimensions of the structure may also need alterations to achieve higher fatigue resistance.
The fatigue damage prediction model could be the S–N curve method or linear elastic fracture mechanics (LEFM). Here, a LEFM method is adopted to address the limitations of the S–N curve method. Figure 8 shows the proposed framework.
First, the required inputs, such as structural dimensions (determined by structural design based on the ULS), initial flaw size, material toughness and tensile properties, stress at the flaw, and parameters of the Paris equation, are determined. Using the Paris equation for a chosen increment of time (Ni), the increase in initial crack size is estimated. The predicted crack size is then compared against failure criteria. The procedure is repeated for the next time increment until the failure. If the failure is predicted to occur before the intended life of the structure, the fatigue life may be enhanced by changing variables that affect the fatigue failure such as structural dimensions, quality control requirements (initial flaw size), or post-fabrication improvements (e.g. post-weld heat treatment) or by specifying inspection interval(s).
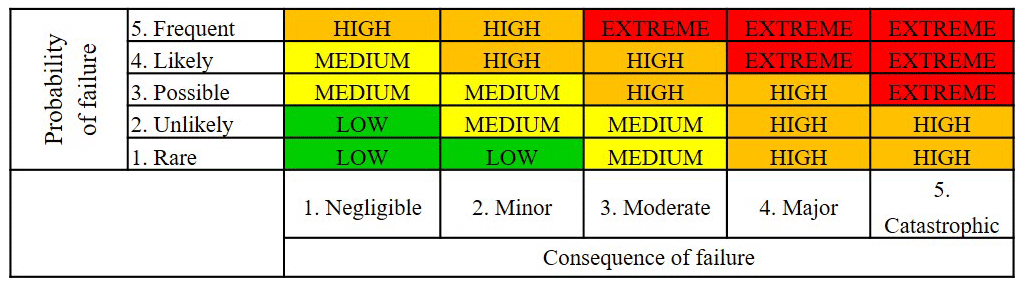
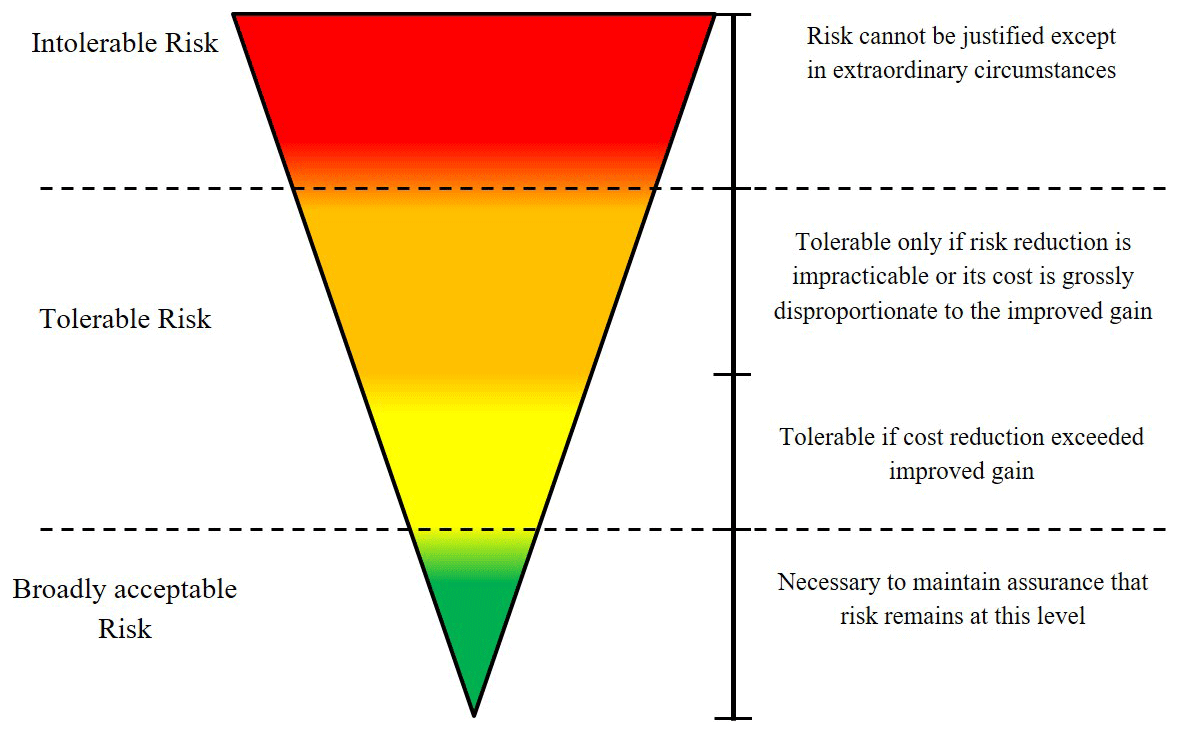
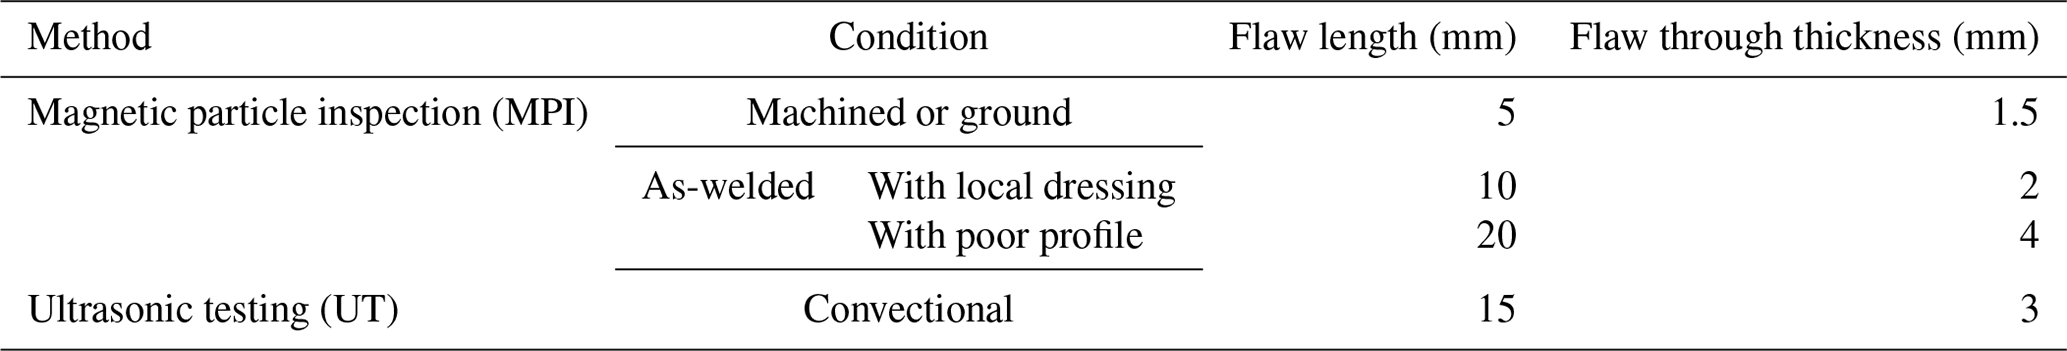
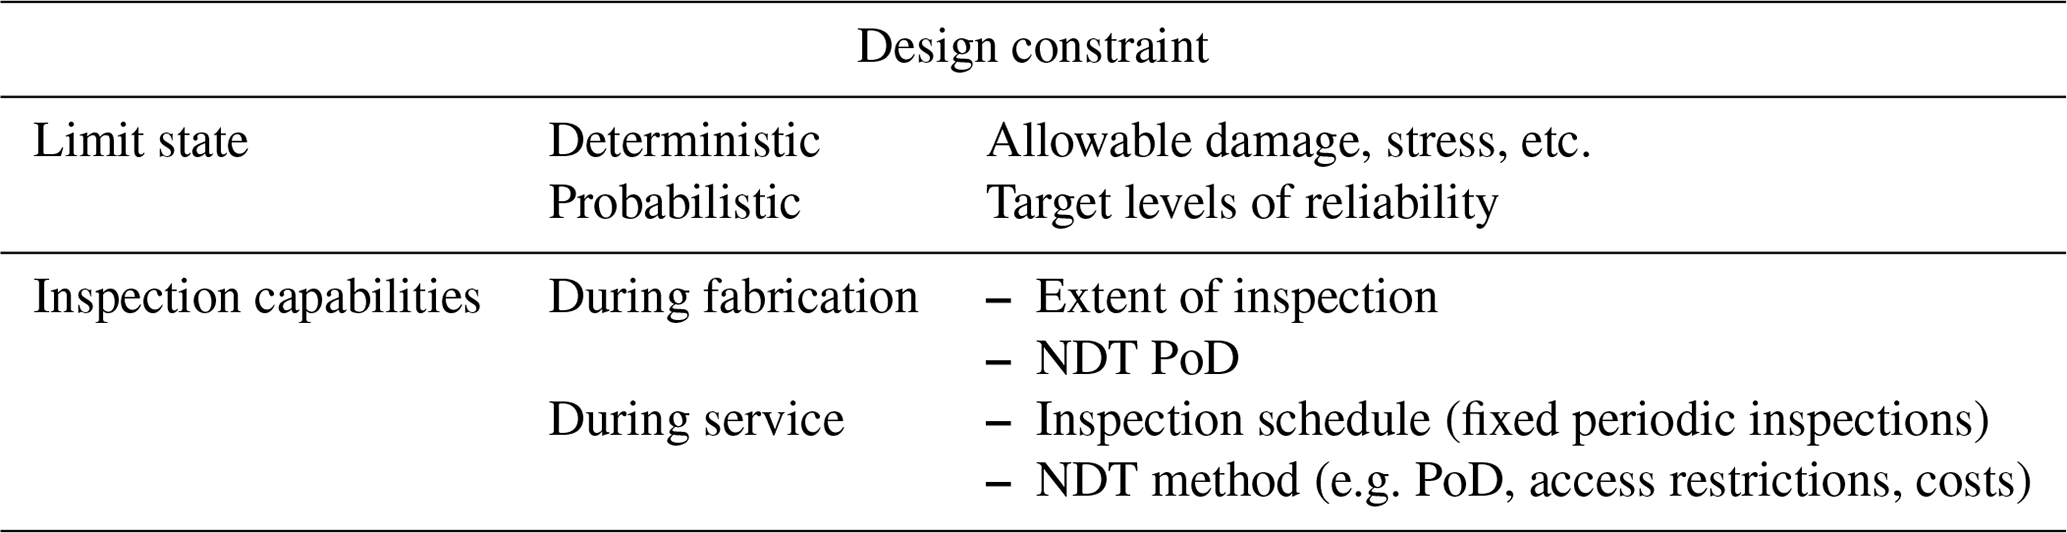
Table 2Design constraints for damage-tolerant fracture mechanics design.
3.1 Damage-tolerant design
The term damage-tolerant fracture mechanics normally refers to a design methodology in which fracture mechanics analyses predict remaining life and specifies inspection intervals. This approach is typically applied to structures prone to time-dependent crack growth. The damage tolerance philosophy allows flaws to remain in the structure, provided they are well below the critical size.
Once the critical crack size, ac, has been estimated, a safety factor is applied to determine the tolerable flaw size at. The safety factor should be based on uncertainties in the input parameters (e.g. stress, parameters in the Paris equation, and toughness). Another consideration in specifying the tolerable flaw size is the crack growth rate; at should be chosen such that at this flaw size is relatively small, and a reasonable length of time is required to grow the flaw from at to ac (Anderson, 2005). This is shown schematically in Fig. 9.
3.2 Inspection reliability
NDT techniques can only detect a limited number of defects of a certain size. For instance, an NDT method with 50 % probability of detection at a certain size is expected to miss 50 % of the defects of that size; in other words, the real number of defects with that size is likely to be 100 % more than the number detected. In structural integrity assessment, it is often convenient to plot detection probability against defect size, which constructs the so-called probability of detection curve (Fig. 11). Detection capabilities of NDT methods are directly related to the sizing of flaws (Georgiou, 2006). The bigger the flaw sizes, the more likely that they are detected. Figure 10 shows the relationship between detected defect size distribution, the probability of detection of defect sizes, and the actual defect size distribution that is present in the structure.
Probabilities of detection (PoDs) for NDT methods are highly dependent on various factors such as the operator skills, testing environment, test specimen (thickness, geometry, material, etc.), type of flaw, and orientation and location of the flaw (Førli, 1999). Hence, an accurate estimation of PoD curves requires individual PoD test programmes for specific projects. However, a number of lower-bound generic models are available in the literature for some specific NDT methods. Two such models that are relevant to this work are given in Fig. 11 and Table 1.
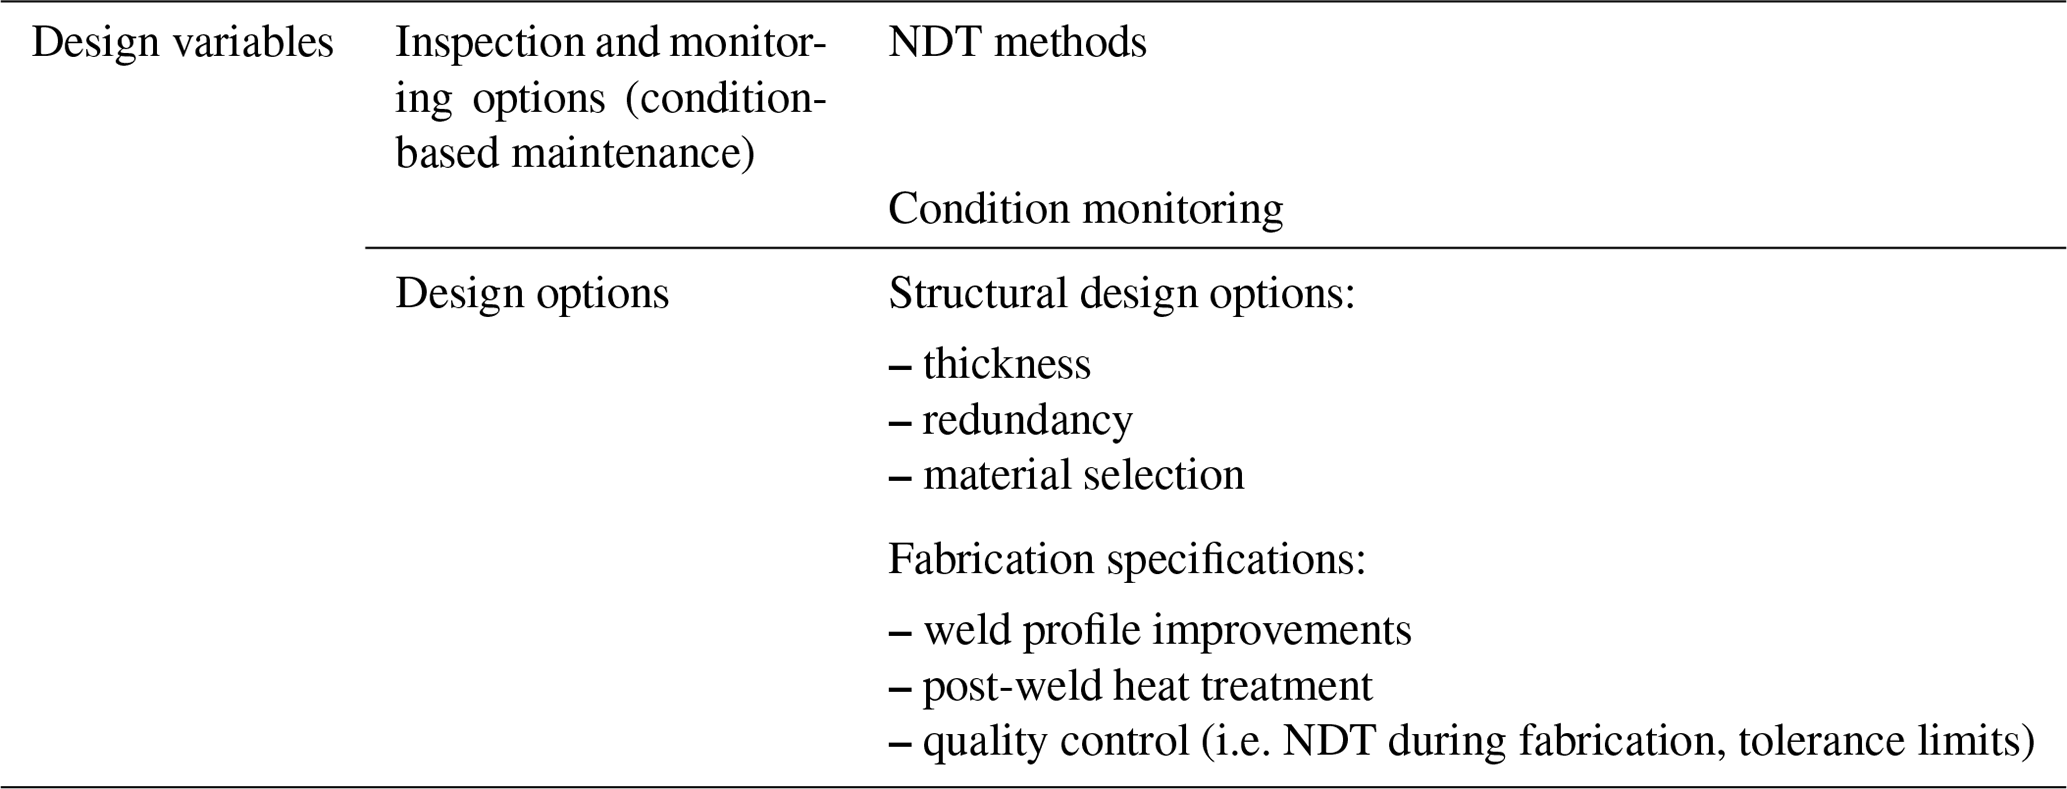
Table 3Design variables for damage-tolerant fracture mechanics design.
Further information about derivation, application, and limitations of PoDs can found in Georgiou (2006).
3.3 Inspection strategy
Fracture mechanics assessment is closely tied to the inspection method. The inspection method provides input to the fracture mechanics assessment, which in turn helps to define inspection intervals. A structure is inspected during construction for quality control purposes. Choice of the NDT method varies between fabrication yards, but as a general rule, all weldments are visually inspected and may be complemented by inspection of a limited number of checkpoints using more reliable NDT techniques on a sampling basis (Amirafshari et al., 2018). If no significant flaws are detected, the initial flaw size is set at an assumed value a0, which corresponds to the largest flaw that might be missed by NDT.
Generally, there are two strategies in the inspection of structures that are susceptible to damage mechanisms: fixed (periodic maintenance) and non-fixed (condition-based maintenance) inspection schedules.
3.3.1 Inspection schedules are fixed (periodic maintenance)
Here, the fracture mechanics can be used to design the structure so that the possible fatigue cracks remain below tolerable limits. The crack size at the time of the inspection is predicted using the Paris law to select an appropriate NDT method.
3.3.2 Inspection schedules are not fixed (condition-based maintenance)
In this case, the inspection interval and the NDT method can be optimised in such a way that the inspection results in a safer condition or a minimised cost of maintenance and failure.
3.4 Design inputs
Design inputs can be categorised into design constraints (Table 2) and design variables (Table 3). Here, only design variables related to a fracture mechanics method are considered. Further information about the design of offshore wind turbine support structures can be found in Arany et al. (2017) and Van Wingerde et al. (2006).
Depending on the chosen maintenance strategy, the inspection capabilities may be considered a design constraint or a design variable.
If a probabilistic approach is employed instead of the conventional deterministic approach, the variables are considered stochastically and target probabilities of failures are used instead of allowable deterministic values (Table 2).


Fracture mechanics approaches are commonly used deterministically and generally have a hierarchical nature; i.e. the analyst may progressively reduce the level of conservatism in assumptions by increasing the complexity level of the analysis and consequently the precision of results until the operation of the structure is found to be fit for service. Otherwise, the structure will require a repair, a reduction in service (for example lowering primary stress), or resistance improvements (i.e. reduction in secondary stresses by stress relief techniques). This type of approach is particularly useful in the assessment of safety cases where the aim is to demonstrate that the structure is safe.
In deterministic analyses, uncertainty in variables is dealt with by taking the upper bound and lower bound of those variables – upper-bound values of applied variables such as stress and flaw size, with lower-bound values of resistance variables such as fracture toughness. In reality, the probability of all unfavourable conditions occurring at the same time is very low and often a too-conservative assumption. An alternative approach is a probabilistic analysis, in which uncertain variables are treated stochastically and as random variables.
In probabilistic assessments, all possible combinations of input variables leading to failure are compared against total possible combinations, and a probability of failure is estimated instead of a definite fail or not-fail evaluation. Probabilistic analysis is also in line with the damage-tolerant philosophy. The failure probability for the limit state function may be estimated using one of the available analytical, numerical, or simulation methods such as the Monte Carlo simulation. Figure 12 shows a probabilistic fracture assessment using the Monte Carlo method and based on the FAD.
One limitation of deterministic fracture mechanics is that conservative prediction of critical defect size and the time to the failure may reduce inspection efficiency by targeting the wrong defect sizes at the wrong time in service, whereas probabilistic assessment will provide a more efficient result (Lotsberg et al., 2016). Probabilistic failure assessment of the structures is also known as reliability analysis. These two terminologies are often used interchangeably.
Figure 13 shows the schematic presentation of the inputs to probabilistic fracture mechanics. Probabilistic fatigue and fracture analysis will predict the time-dependent failure probability of the structure (Fig. 14). The predicted reliability will then need to be compared against an appropriate target reliability level.
4.1 Target reliability levels
Target reliability values may be employed to ensure that a required level of safety is achieved. The target reliability measures depend on the failure consequence as well as on the cost and effort to reduce the risk of failure. The consequences of failure can be the risk of human injury and fatality, economic consequences, and social impacts. The target reliability should always correspond to a reference period, e.g. annual or service life probability of failure. If the relevant consequence is the risk to human life, annual failure probabilities are preferred to ensure a consistent level of tolerable risks at any time. Target reliabilities may be defined in four different ways:
-
The standard developers recommend a reasonable value. This method is used for novel structures.
-
Reliability is implied by standards. The level of risk is estimated for a design standard that is considered to be satisfactory. This method has been commonly used for standard revisions, particularly where the intention has been to provide a more uniform safety level for different structural types and loading types. By carrying out a reliability analysis of the structure satisfying a specific code using a given probabilistic model, the implicit required level in this code will be obtained, which may be applied as the target reliability level. The advantage with this approach compared to applying a predefined reliability level is that the same probabilistic approach is applied in the definition of the inherent reliability of the code-specified structure and the considered structure, reducing the influence of the applied uncertainty modelling in the determination of the target reliability level.
-
The target level for risk assessment is based on failure experiences. This method is particularly useful when the functional reliability of the system is more important than the reliability of individual components. In the automotive industry or electronic-component manufacturing, component reliability is determined by failure rate data of real components. The failure rate data are then used in system reliability calculations (Bertsche, 2008).
-
Economic value analysis (cost–benefit analysis) is performed. Target reliabilities are chosen to minimise total expected costs over the service life of the structure. In theory, this would be the preferred method, but it is often impractical because of the data requirements for the model.
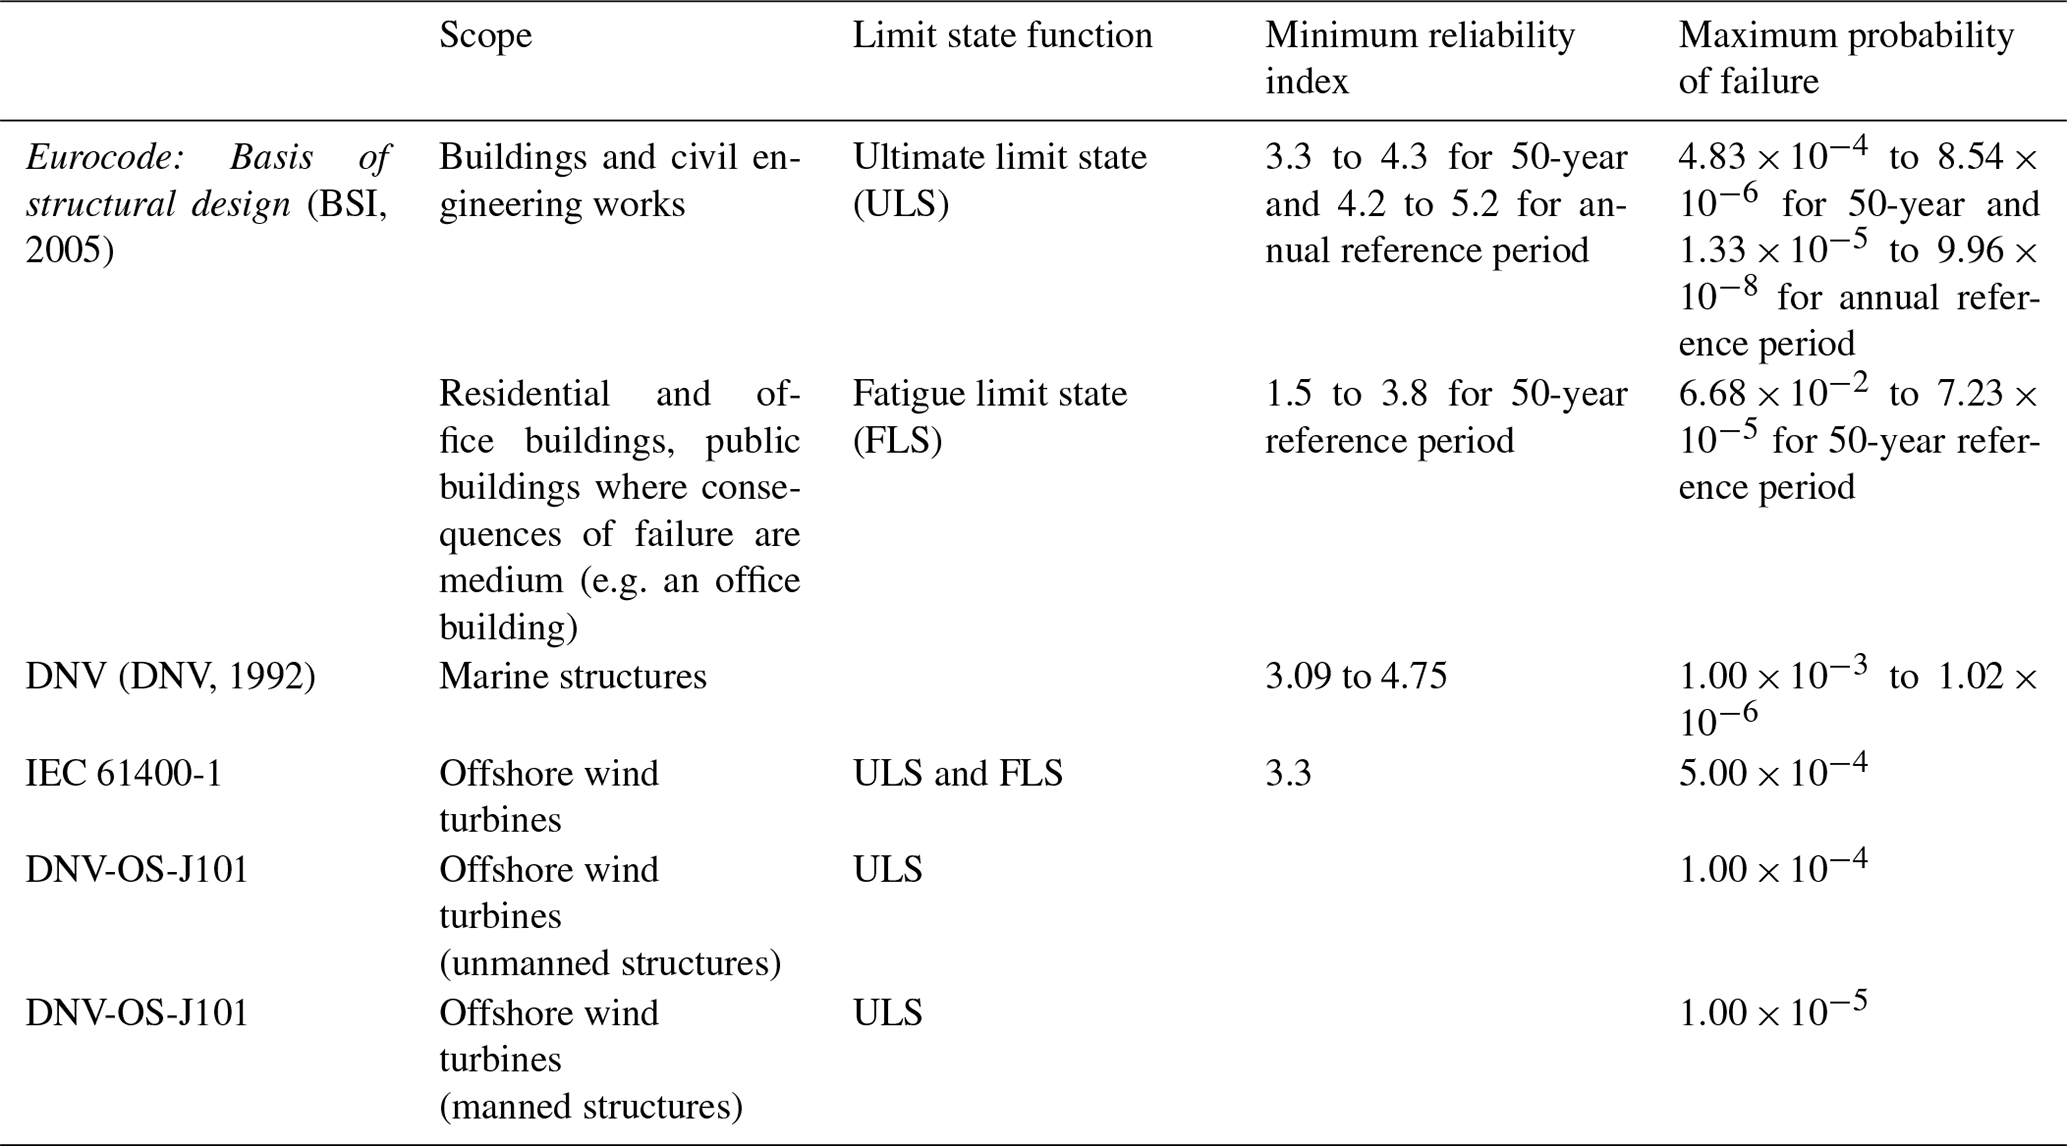
Examples of target reliabilities prescribed by codes and standards are listed in Table 4. For further information about available models for developing target reliability levels for novel structures, reference is made to Bhattacharya et al. (2001).
Table 4Examples of target levels of reliabilities specified by standards.
4.2 Risk-based design
The purpose of risk analysis is to comprehend the nature of risk and its characteristics including, where appropriate, the level of risk. Risk analysis involves a detailed consideration of uncertainties, risk sources, consequences, likelihood, events, scenarios, and controls and their effectiveness. An event can have multiple causes and consequences and can affect multiple objectives (ISO-31000, 2018). The risk remaining after protective measures are taken is called residual risk (ISO-14971, 2012). The purpose of risk evaluation is to support decisions. Risk evaluation involves comparing the results of the risk analysis with the established risk criteria to determine where additional action is required (ISO-31000, 2018). The overall procedure for risk analysis and risk evaluation is a risk assessment (ISO-31000, 2018).
A commonly used method of risk evaluation is the so-called risk matrix model in which the failure probability is shown on one axis and the consequence of failure on the other. The failure probability and consequence failure may be specified quantitatively, qualitatively, or semi-quantitatively, depending on the complexity of the model and the availability of data. Each combination of failure probability and consequence of failure will then be assigned a corresponding risk level. It is useful to show these levels according to a specific colour-coding convention. One such convention is an adapted traffic light convention in which low risk levels are shown in green, extreme risks in red, and medium risk levels in yellow. It is also possible to refine this colour coding further, for example, by including light yellow and dark yellow, to allow for more risk levels. An example risk matrix is shown in Fig. 15.
To assign an appropriate risk level (i.e. colour in the risk matrix) it is necessary to establish risk acceptance levels. If a system has a risk value above the accepted levels, actions should be taken to improve safety through risk reduction measures. One challenge in this practice is defining acceptable safety levels for activities, industries, structures, etc. Since the acceptance of risk depends upon society perceptions, the acceptance criteria do not depend on the risk value alone (Ayyub et al., 2002).
Another common risk evaluation method is the ALARP, which stands for “as low as reasonably practicable”, or ALARA (as low as reasonably achievable) method (HSE, 2001). The ALARP basis is that tolerable residual risk is reduced as far as reasonably practicable. For a risk to be ALARP, the cost in reducing the risk further would be grossly disproportionate to the benefit gained. The basis of the ALARP method is illustrated by the so-called carrot diagram in Fig. 16.
By adopting a risk-based approach in fracture mechanics for a chosen design parameter the structural design may be assessed against the corresponding risk. As an example, the design stress levels for a particular initial crack size will be associated with the corresponding risk levels, as schematised in Fig. 17.
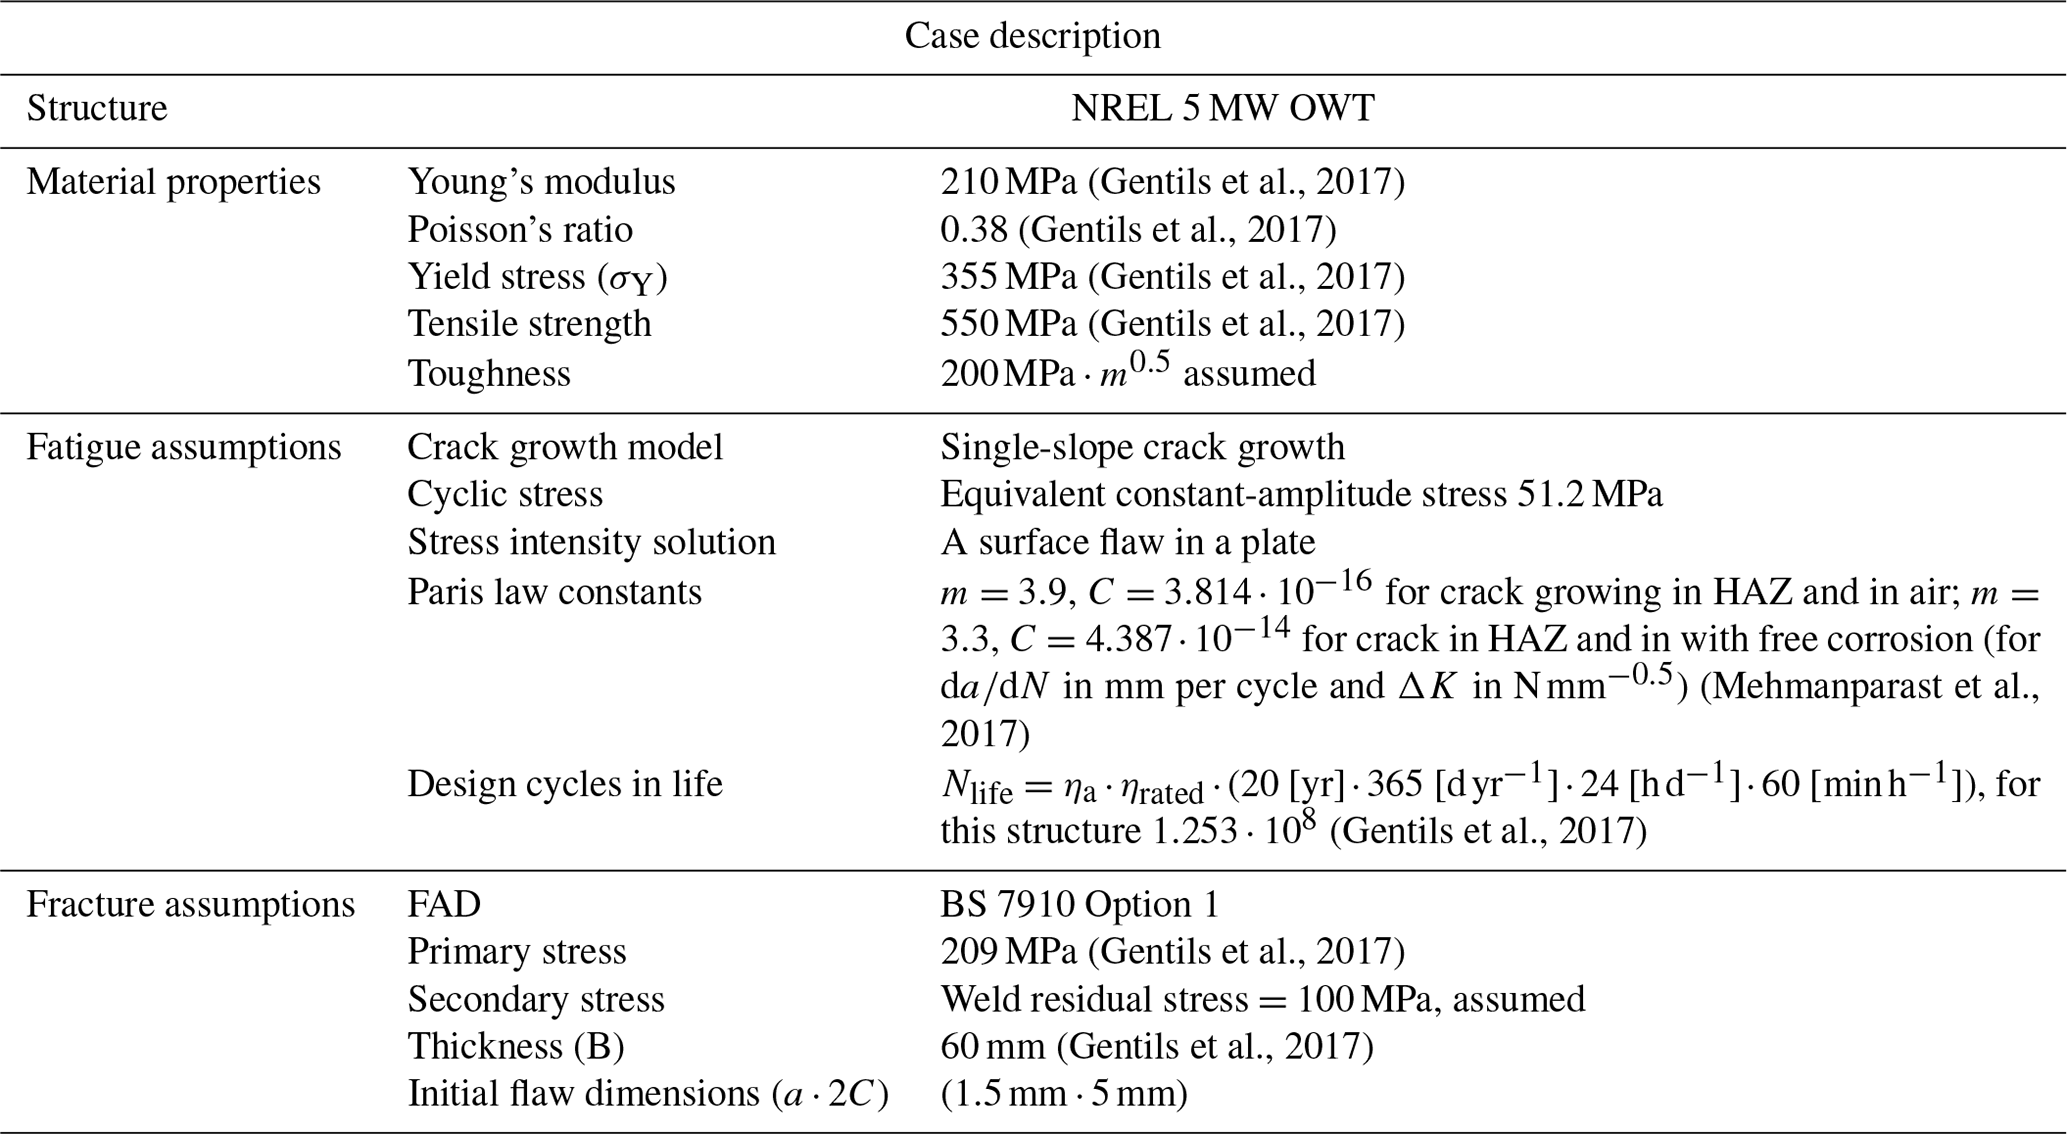
Fatigue design based on a baseline NREL 5 MW offshore wind turbine (OWT) supported on a monopile structure (Fig. 19) is presented here. The framework illustrated in Fig. 8 is used to conduct the fracture mechanics assessment. Table 5 summarises the input parameters used in this study. Further information about the structure and the finite element analysis can be found in Gentils et al. (2017).
Transverse butt welds (weld line perpendicular to the normal stress) are more prone to fatigue damage than the longitudinal butt joints (weld line parallel to the normal stress). Figure 18 shows these joints in a monopole structure. A fatigue crack growing at the transverse butt weld toe located in the mud-line (Fig. 19) is considered the most critical location.
Fatigue cracks normally initiate from small toe undercut weld defects (Fig. 2); thus, in this study, a semi-spherical flaw growing in the heat-affected zone (HAZ) of the joint is considered. NDT inspection techniques are used during fabrication as part of the quality control scheme. MPI and UT are effective and commonly used methods to detect surface breaking and embedded flaws, respectively. Here, the initial flaw size is conservatively assumed to be equal to 90 % PoD of the chosen NDT methods (Table 1). The primary fracture stress is taken as caused by ultimate limit state (ULS) design stress (Fig. 19) corresponding to the parked wind turbine, under the 50-year extreme wind model (EWM) with the 50-year reduced wave height (RWH) and extreme current model (ECM), defined as in the Design Load Case (DLC) 6.1b and 2.1 for IEC (2019) and DNV (2013) standards, respectively. The crack growth stress is taken as the fatigue load case which corresponds to an operating state under the normal turbulence model (NTM) and normal sea state (NSS) where wave height and cross zero periods are obtained from the joint probability function of the site, assuming no current; it corresponds to DLC 1.2 from the IEC standard (IEC, 2019) and is assumed to represent the entire fatigue state (Gentils et al., 2017). Paris law parameters reported by Mehmanparast et al. (2017) for offshore wind monopile weldments have been adopted. Other key assumptions and inputs for fatigue and fracture mechanics assessment are given in Table 5.
5.1 Crack growth in air environment
Crack growth parameters in the Paris equation for ferritic steels depend on the cyclic stress ratio and environmental conditions (Amirafshari and Stacey, 2019). In the presence of effective corrosion protection measures, in-air conditions apply (British Standard, 2019).
Fatigue and fracture assessment results for cracks propagation in the air environment are given in Table 6. In a damage-tolerant design, the tolerable crack sizes need to be selected far below critical sizes by considering some level of safety factors (Anderson, 2005). As described earlier, the chosen tolerable crack size needs to be determined in a region of the crack size where the crack growth rate with respect to time is small to allow for a long time before failure but large enough to be detected by the in-service inspection technique. Here, a tolerable crack height of 5.2 mm is chosen which, depending on the inspection condition (Fig. 11), gives a 70 % to 90 % PoD. As shown in Fig. 20, this will provide a good margin of safety and at least 6 years before failure (Fig. 21).
Table 6Results for crack growth in HAZ and in Air environment.
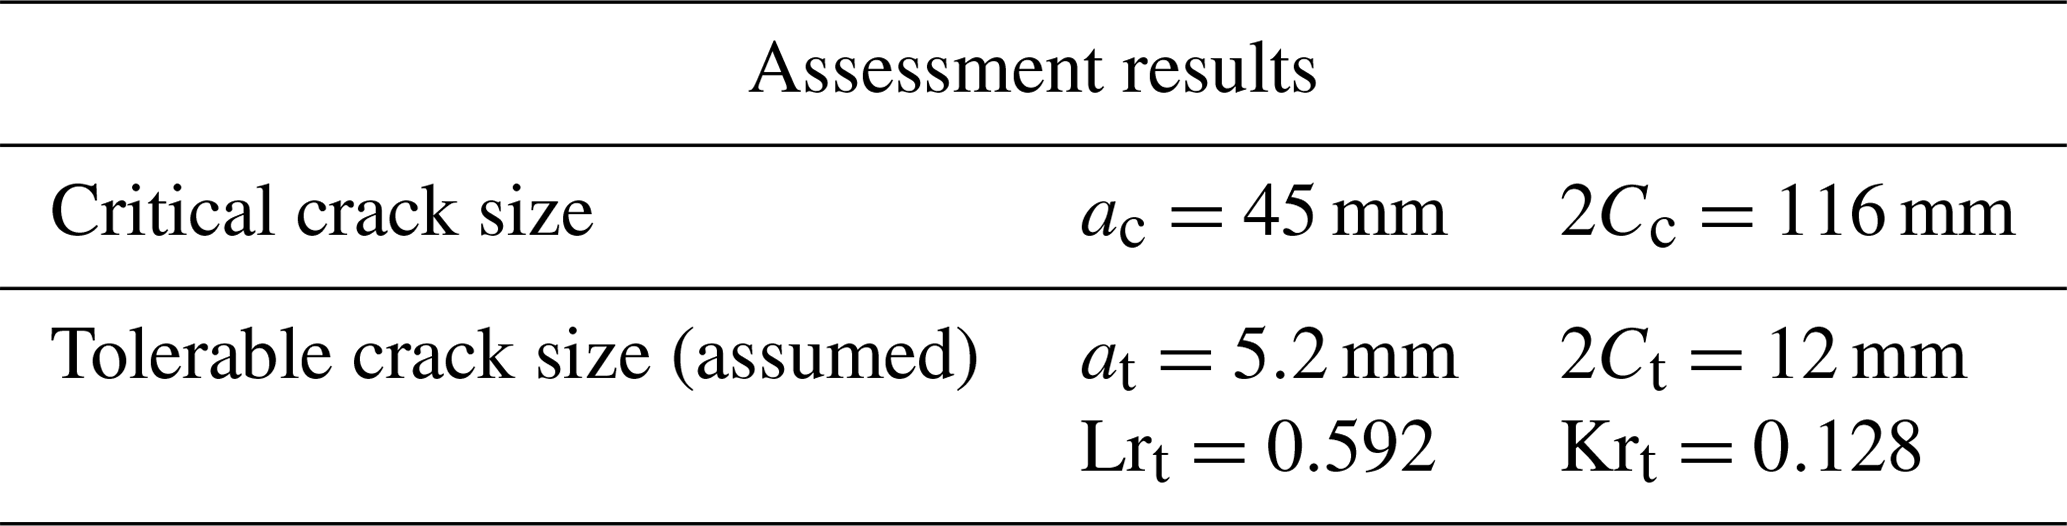
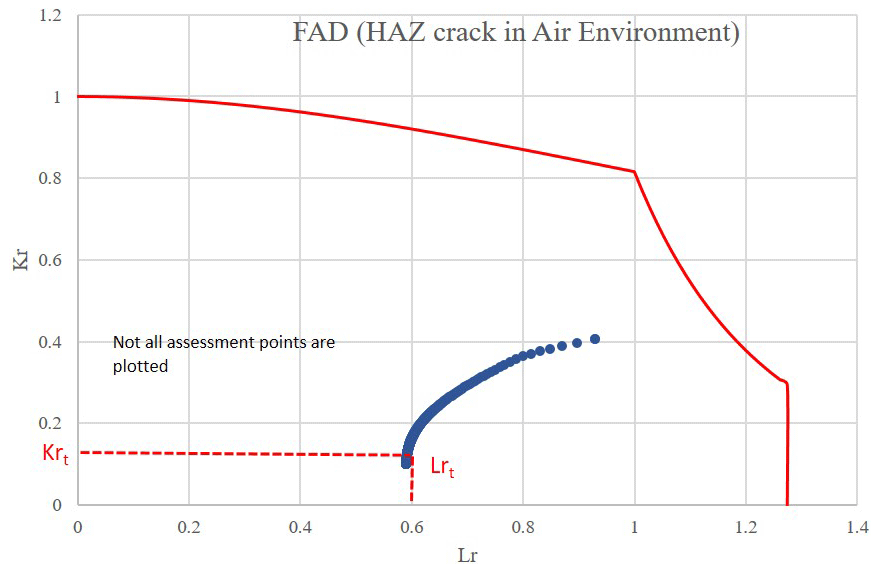
Figure 20Failure assessment diagram (FAD) for crack growth in HAZ and in air environment without inspection.
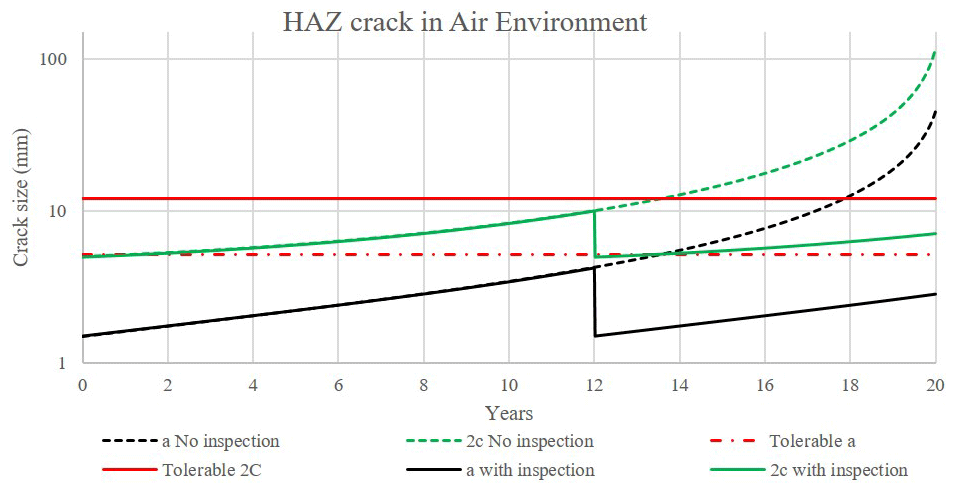
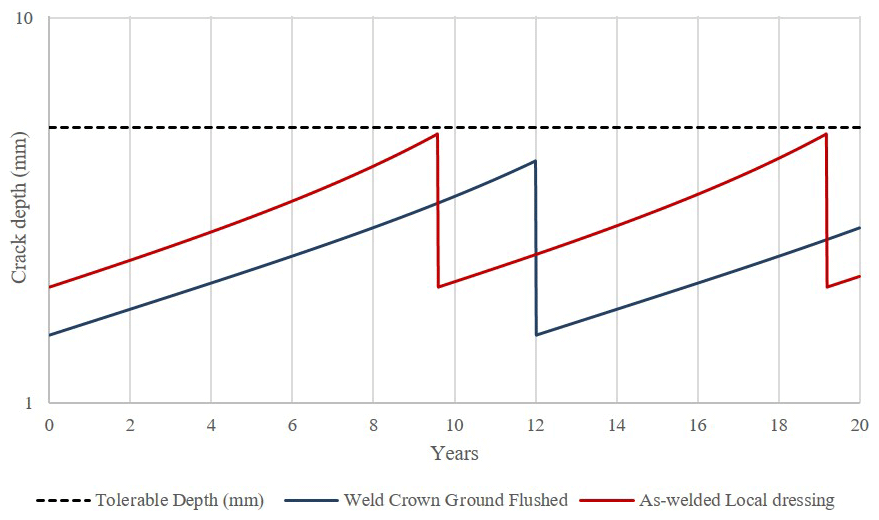
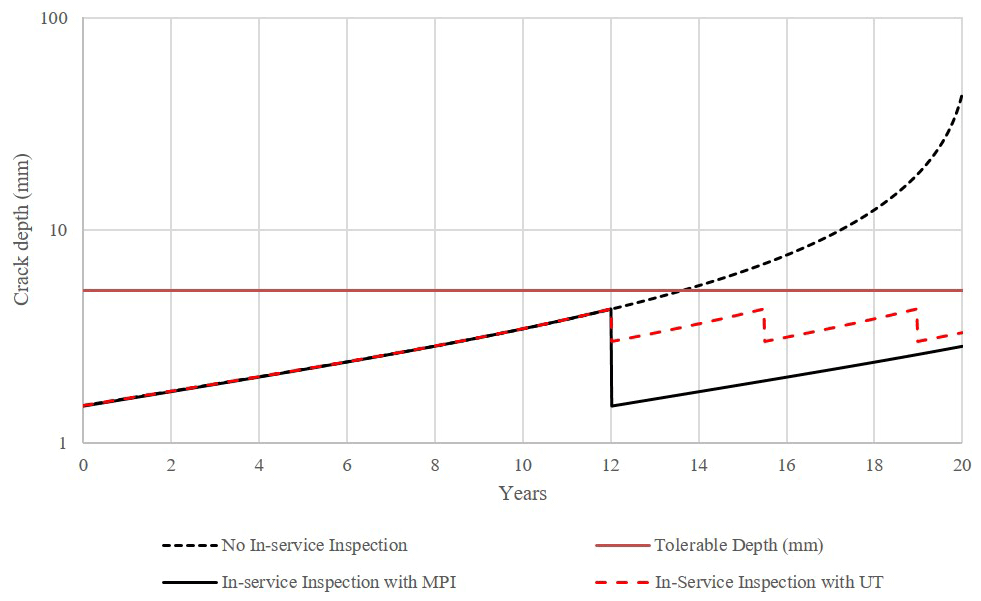
Figure 23Selection of NDT method based on probability of detection and crack size at the time of inspection.
Figure 20 shows assessment points from initial crack propagation at the start of service life to the final year of service. If the service continues beyond the design life (20 years), the structure is likely to fail in the elastoplastic mode, providing a reasonable level of plasticity from a safety point of view.
As explained earlier a damage-tolerant design is closely tied to in-service inspection. Here, it is assumed that an MPI is carried out at year 12. When no crack is detected or repaired if detected, the predicted crack size is updated and reduced back to the initial crack size. This is shown with solid lines after year 12 in Fig. 21. The final-year crack size remains below the tolerable limits.
The weld profile condition may be as-welded or ground flushed depending on fabrication specification and could be altered by the design engineer. The effect of such a condition was studied by considering the influence of the weld profile on the PoD for the MPI method. MPI can find smaller cracks in the welds with ground-flushed crowns (Table 1). As shown in Fig. 22, improving the weld joint design by specifying the ground flushing requirement reduces the inspection frequency from twice to once in 20 years of service.
The effect of choice of NDT for in-service inspection was studied by considering a case were UT is chosen as the inspection method. The detection reliability specified in Table 1 is used to determine the crack size that can be left undetected after inspection. Figure 23 shows the predicted crack size compared to inspection with MPI. It is observed that to keep the crack size below a tolerable size, three inspections are required instead of one inspection using MPI.
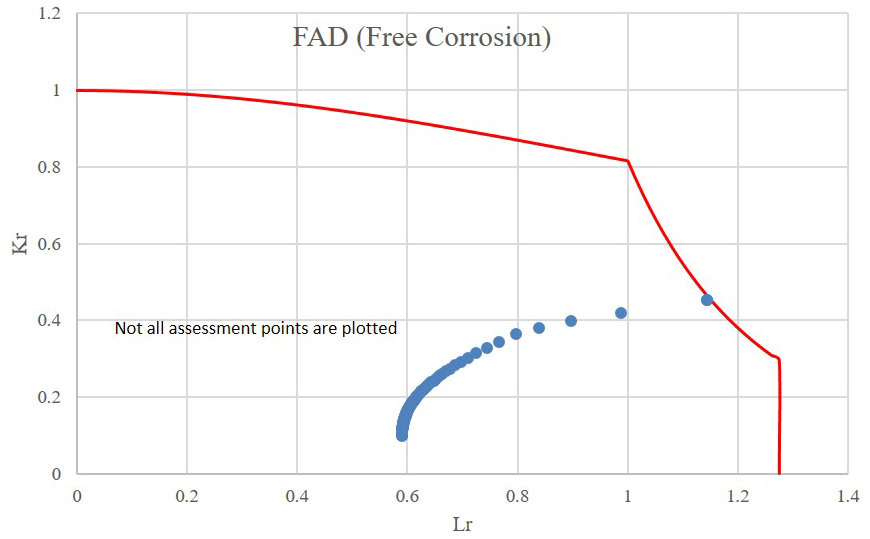
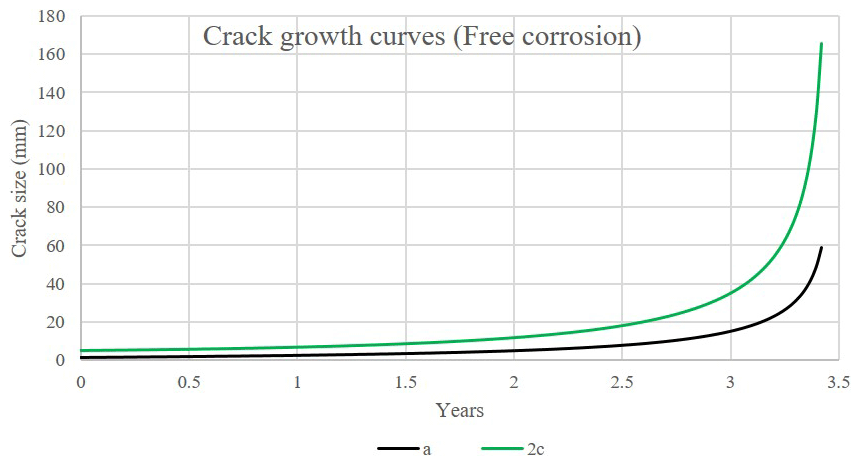
5.2 Effect of environment
In the event of insufficient corrosion protection, the fatigue crack growth will be accelerated. The accelerated crack growth rate is reflected in fracture mechanics by changing the Paris law constants to those observed in the corrosive environment. This is shown in Figs. 24 and 25, where the previously studied defect is assessed under a free-corrosion environment instead of the air environment. It is observed that failure is predicted to occur as early as 3.4 years after commissioning. One strategy could be increased attention to the execution of corrosion protection measures before commissioning. Additionally, the joint should be inspected for signs of corrosion at least every 3 years.
Many structural members of offshore structures can tolerate cracks even after they penetrate through the wall. These structures may be idealised by plates containing through-thickness cracks (Fig. 26). This can be for example for a less critical location of the structure in Case Study 1 with lower stress levels.
Here, the application of probabilistic fracture mechanics to such a structure is demonstrated. The assumed inputs are listed in Table 7.
Table 7Inputs for probabilistic fatigue and fracture mechanics assessment.
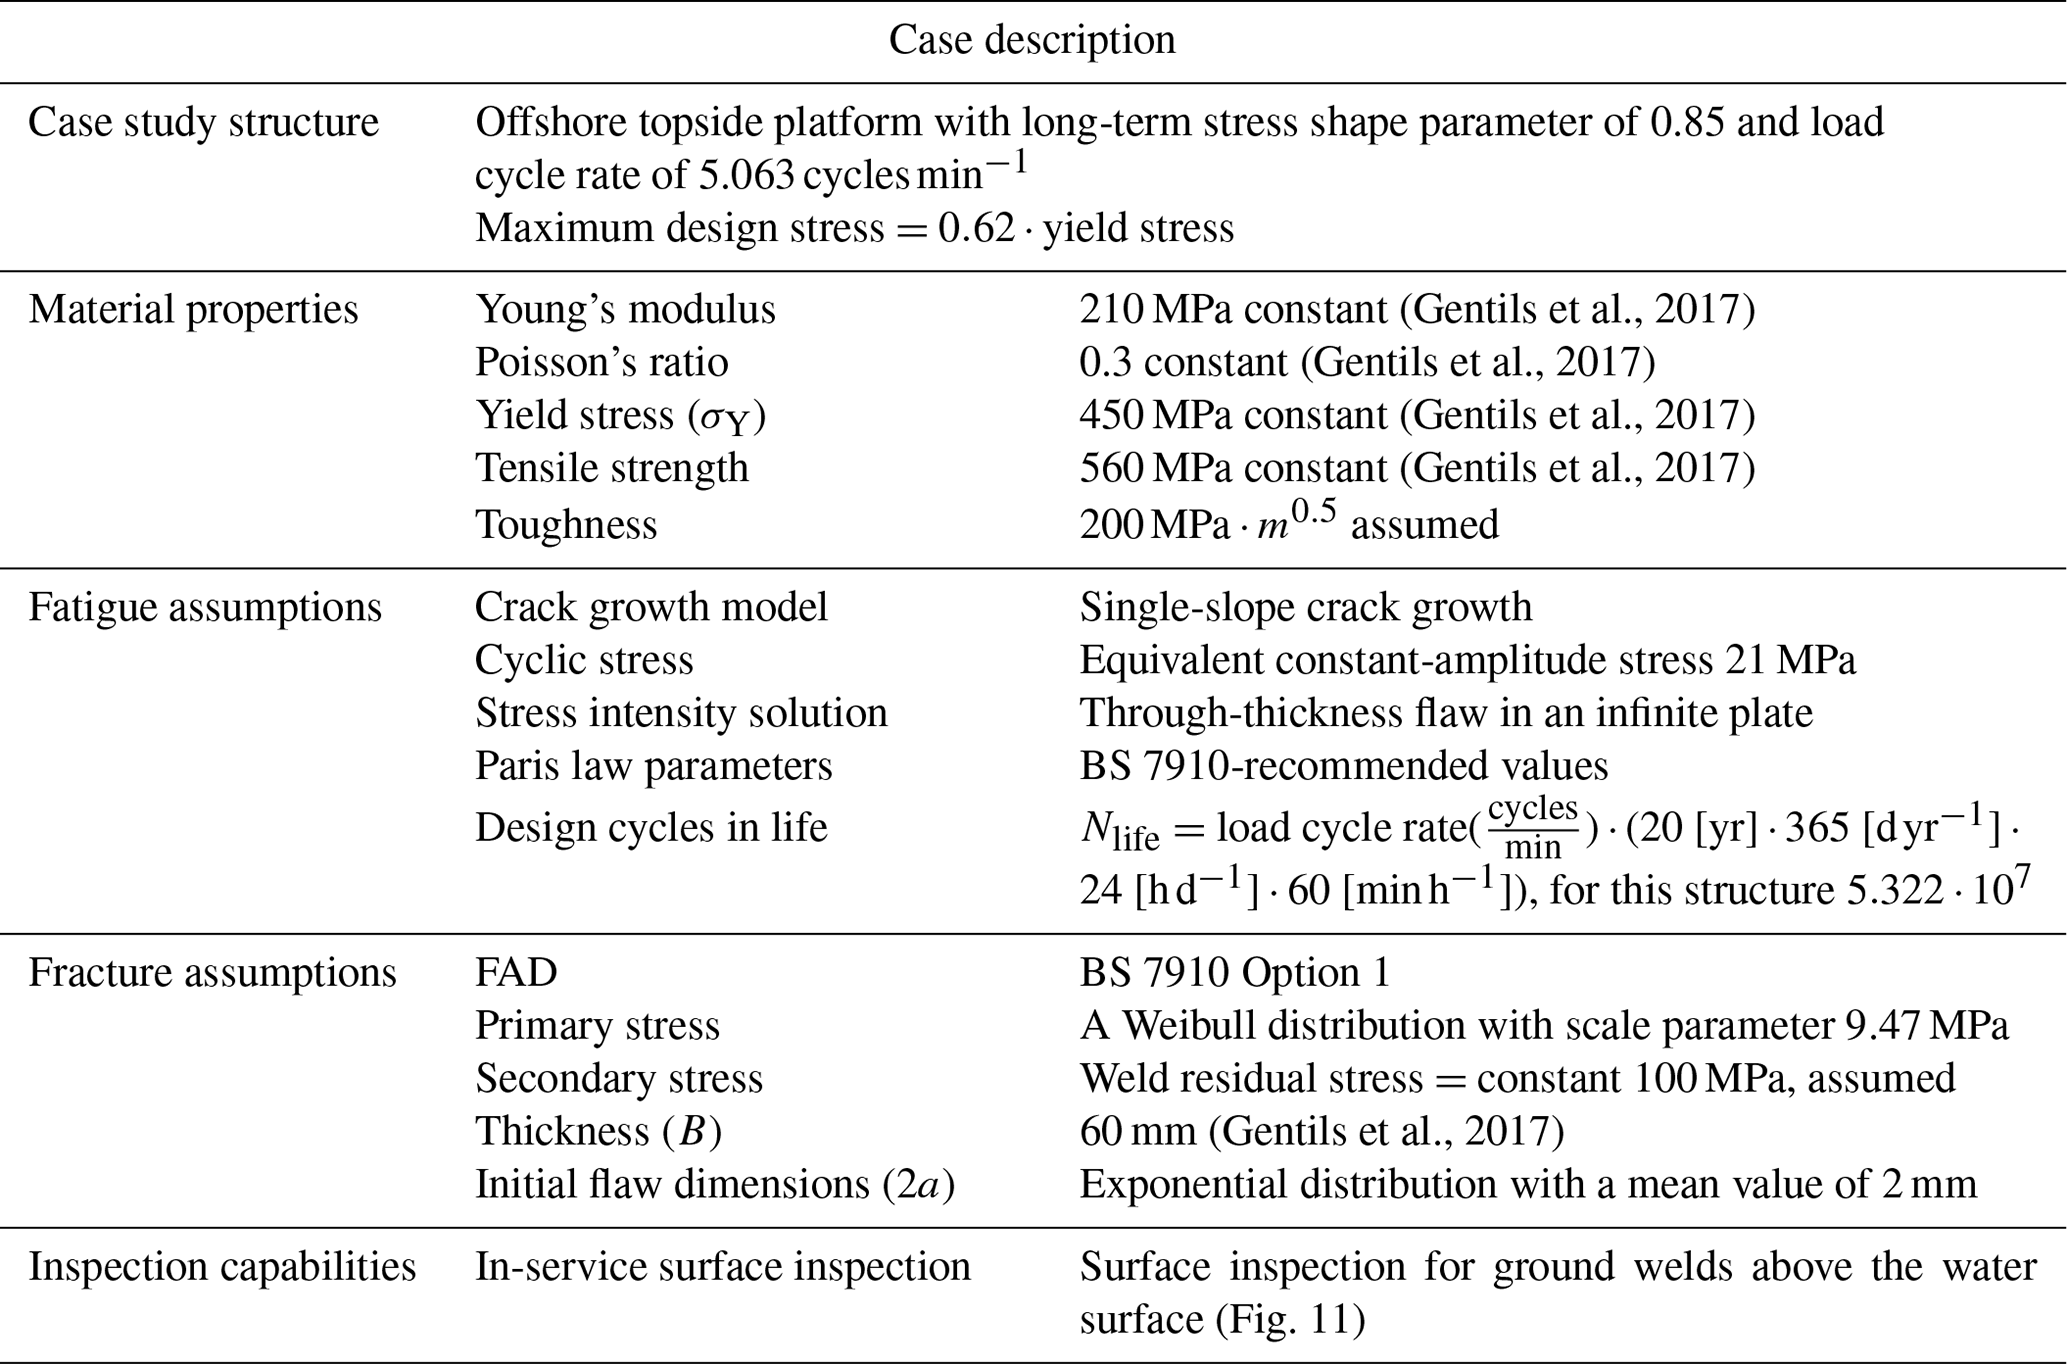
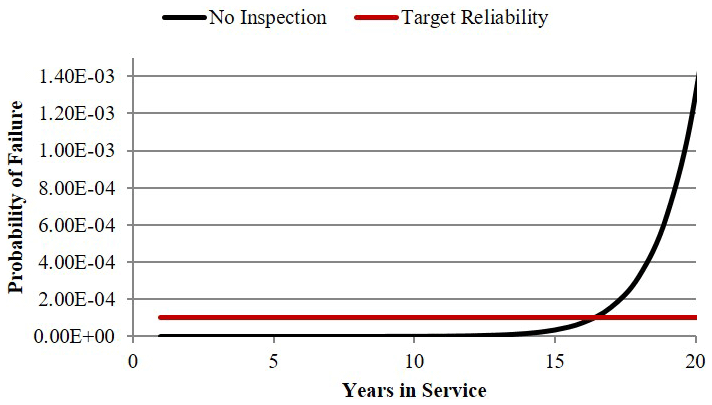
Figure 27 shows fatigue and fracture reliability of the structure under three levels of equivalent constant-amplitude cyclic stress. As a starting point, 21 MPa cyclic stress which corresponds to the extreme stress of 0.62σY is selected. A target reliability level of from Table 4 for offshore wind turbines (unmanned structures) is selected. The structure will reach the target tolerable probability of failure just before year 17, suggesting that the structure should be inspected prior to this time. As it is shown in Fig. 28, such an inspection will reduce the failure probability below the target level for the rest of the intended service life.
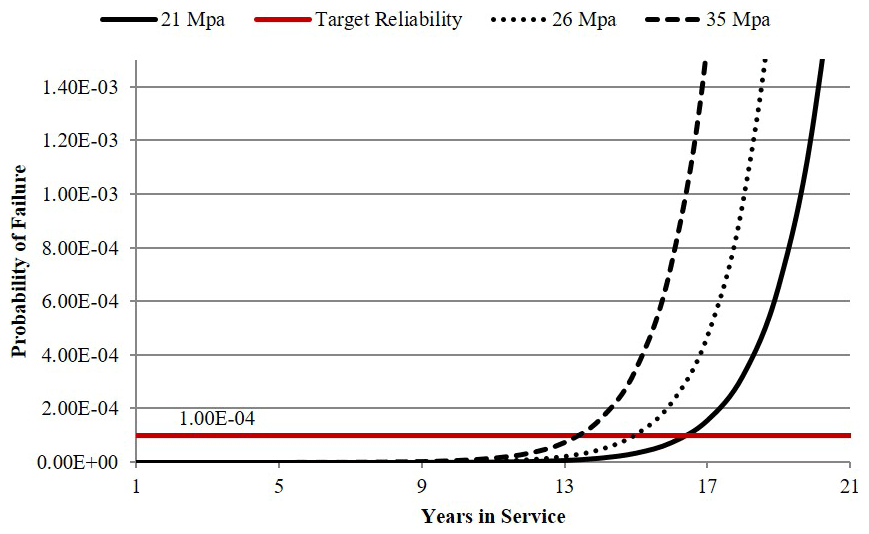
Figure 27Fatigue reliability (FM) of a welded joint in an offshore structure for three different constant-amplitude stresses.

Figure 28Crack growth curves of case study through thickness in a plate considering different first inspection times.
If the aim had been to design the structure according to the safe-life design philosophy, the stress would have needed to be reduced below the current level. This, however, may not be an economical option since the current extreme stress level already possesses a significant safety factor (0.62⋅σY) and reducing the stress will require bigger cross-sectional dimensions and, hence, a heavier and more expensive structure. Integrating in-service inspection options into design can potentially result in a more efficient design.
Furthermore, the design cyclic stress may be increased considering the availability of in-service inspection. Two stress levels are considered here: an upper-bound limit value of 35 MPa corresponding to extreme stress equal to the yield stress and a moderate value of 26 MPa. As depicted in Fig. 27, the probability-of-failure curve will be shifted to the left by 2 and 3 years, respectively. It is evident that the structure can sustain higher levels of stresses provided that the appropriate time window for inspection is determined and also other required limit states are not violated.
The effect of an inspection schedule is considered for the case of a through-thickness crack under 21 MPa cyclic stress. It was shown previously in Fig. 27 that the structure is predicted to reach the target tolerable probability of failure just before year 17; thus, the inspection should be scheduled prior to this time. Here, a number of inspection options are considered.
Any inspection earlier than year 6 appears to have little benefit as the failure probabilities are below , a very low probability of failure. The reduction in the probability of failure is on the order of 1, and the structure is likely to exceed the target level of reliability again close to the final year of service. Inspection between years 10 and 15 shows the most effective results by keeping the structure far below the target level throughout and up to the end of service life, ensuring a considerable level of safety as well as providing further life extension possibilities in the final years of designed service life.
This paper presented a new approach to the fatigue design of offshore wind turbine support structures. Traditionally, the design of offshore renewable structures against fatigue failure has been performed using the so-called S–N curve method. This approach, however, suffers from several limitations, such as limited ability to integrate the inspection capabilities. The structural design can significantly benefit from the inspectability of the structure by considering the damage-tolerant nature of many offshore structures. Fracture mechanics is a powerful tool capable of addressing a wide range of limitations associated with the S–N approach.
In this work, a framework for the design of offshore structures based on fracture mechanics was developed and its applications to a monopile wind turbine support structure were demonstrated. Additionally, the probabilistic fracture mechanics approach and its application in optimising in-service NDT inspection for a plated structure under sea wave loading was presented.
It was found that the design of the structure can be enhanced by specifying weld crown improvements which leads to better fatigue performance and reduced in-service inspection. The MPI will allow for thrice the inspection interval window than UT.
The probabilistic model was shown to have the capability to account for uncertainty in design and inspection variables including NDT reliability. It also provides a likelihood of failure which can be used to calculate the risk associated with the chosen inspection time and in turn for optimising inspection using, for example, a cost–benefit analysis.
Additionally, the proposed optimisation model can be used for any application of structural optimisation of OWT support structures.
| Symbol | Explanation |
| a | Flaw size |
| a0 | Initial flaw size |
| af | Failure flaw size |
| acr | Critical flaw size |
| at | Tolerable flaw size |
| C | Material constant in the Paris–Erdogan equation |
| 2C | Crack length |
| I1 | First inspection |
| J | J integral |
| Je | Elastic component of J integral |
| ΔK | Stress intensity factor |
| ΔKth | Threshold stress intensity factor |
| Kr | The ratio of applied stress intensity factor to the fracture toughness of the component material in the failure assessment diagram |
| Kelastic plastic | Elastic plastic stress intensity factor |
| Kelastic | Elastic stress intensity factor |
| Kmax | Maximum stress intensity factor |
| Kmin | Minimum stress intensity factor |
| Kmat | Fracture toughness |
| Kcritical | Critical fracture toughness value |
| Lr | The ratio of the applied load to the load required to cause plastic collapse of the flawed section |
| m | Paris equation slope |
| Ni | Cycle increment |
| PF | Probability of a fatigue crack failure |
| PSYS | Probability of a collapse given that there is a fatigue failure in the structure |
| Pt | Target probability of failure |
| pΔσ(Δσ) | Probability density function of stress range Δσ |
| Y | Geometry function |
| Rate of crack growth to load cycles | |
| σ | Stress at flaw |
| Δσeq | Equivalent constant-amplitude stress range |
| β | Stress contribution factor |
| σflow | Flow stress |
| σY | Yield stress |
| σU | Ultimate tensile stress |
| εref | The true strain obtained from the uniaxial tensile stress–strain curve |
| Abbreviation | Explanation |
| DLC | Design load case |
| ECM | Extreme current model |
| EU | European Union |
| EWM | Extreme wind model |
| FAD | Failure assessment diagram |
| FAL | Failure assessment line |
| FLS | Fatigue limit state |
| FM | Fracture mechanics |
| HAZ | Heat-affected zone |
| LCOE | Levelised cost of electricity |
| LEFM | Linear elastic fracture mechanics |
| MPI | Magnetic particle inspection |
| NDT | Non-destructive testing |
| NECPs | National energy and climate plans |
| NSS | Normal sea state |
| NTM | Normal turbulence model |
| OWT | Offshore wind turbine |
| PoD | Probability of detection |
| PoND | Probability of non-detection |
| QC | Quality control |
| RWH | Reduced wave height |
| SLS | Serviceability limit state |
| S–N | Stress–number of cycles to failure |
| ULS | Ultimate limit state |
| UT | Ultrasonic testing |
Deterministic fracture mechanics analyses are performed using a demo version of CrackWISE® software (TWI.Ltd, 2019). The probabilistic fatigue analyses are performed using a code written by the lead author in MathCad Prime 5.0 (PTC, 2019). Computer code files used throughout this paper will be made available on request. Please contact the lead author for more information.
The sources of data used are cited within the paper.
PA conducted the research, created the proposed framework, performed all case study analysis, made the figures, and planned and wrote the paper. BF and AK contributed to the research with intensive discussions and added to the paper with conceptual discussions and internal review. AK secured the funding for this paper.
The authors declare that they have no conflict of interest.
This work was supported by a grant from the Supergen Wind Hub, EP/L014106/1, from the UK Engineering and Physical Sciences Research Council (EPSRC), under the Flexible Funding Scheme for the University Strathclyde.
This research has been supported by the Engineering and Physical Sciences Research Council (EPSRC) (Supergen Wind Hub (grant no. EP/L014106/1)).
This paper was edited by Lars Pilgaard Mikkelsen and reviewed by Arno van Wingerde and one anonymous referee.
Amirafshari, P.: Optimising Non-destructive Examination of newbuilding ship hull structures by developing a data-centric risk and reliability framework based on fracture mechanics, University of Strathclyde, Glasgow, United Kingdom, 2019.
Amirafshari, P. and Stacey, A.: Review of Available Probabilistic Models of the Crack Growth Parameters in the Paris Equation, International Conference on Ocean, Offshore and Arctic Engineering, 9–14 June 2019, Glasgow, United Kingdom, OMAE2019-961, 2019.
Amirafshari, P., Barltrop, N., Bharadwaj, U., Wright, M., and Oterkus, S.: A Review of Nondestructive Examination Methods for New-building Ships Undergoing Classification Society Survey, J. Ship Prod. Des., 33, 1–11, 2018.
Anderson, T. L.: Fracture Mechanics: Fundamentals and Applications, Chapman and Hall/CRC, Boca Raton, USA, 2005.
Arany, L., Bhattacharya, S., Macdonald, J., and Hogan, S. J.: Design of monopiles for offshore wind turbines in 10 steps, Soil Dyn. Earthq. Eng., 92, 126–152, https://doi.org/10.1016/j.soildyn.2016.09.024, 2017.
Ayyub, B. M., Akpan, U. O., Rushton, P. A., Koko, T. S., Ross, J., and Lua, J.: Risk-informed inspection of marine vessels, Ship Structures Committee, Washington DC, 2002.
Barltrop, N. D. P. and Adams, A. J.: Dynamics of fixed marine structures, Butterworth-Heinemann, London, 1991.
Baum, S., Von Kalben, C., Maas, A., and Stadler, I.: Analysis and Modelling of the Future Electricity Price Development by taking the Levelized Cost of Electricity and large Battery Storages into Account, 2018 7th Int. Energy Sustain. Conf., New York, IESC 17–18 May 2018, 1–8, https://doi.org/10.1109/IESC.2018.8440005, 2018.
Bertsche, B.: Reliability in automotive and mechanical engineering: determination of component and system reliability, Springer Science & Business Media, Berlin, 2008.
Bhattacharya, B., Basu, R., and Ma, K.: Developing target reliability for novel structures: the case of the Mobile Offshore Base, Mar. Struct., 14, 37–58, 2001.
British Standard: BS 7910:2019, Br. Stand. Institutions, London, 2019.
BS7910, B. S.: BS 7910:2013+A1:2015, Annex J, The British Standard Institutions, London, 2015.
BSI: BS EN 1990: 2002+ A1: Basis of Structural Design, The British Standard Institutions, London, 2005.
BSI7608: Guide to fatigue design and assessment of steel products, BSI Stand. Publ., London, 2015.
Da Costa, L. M., Danziger, B. R., and Lopes, F. D. R.: Prediction of residual driving stresses in piles, Can. Geotech. J., 38, 410–421, https://doi.org/10.1139/cgj-38-2-410, 2001.
DNV: Structural reliability analysis of marine structures, Det Norske Veritas, Høvik, Norway, 1992.
DNV: Fatigue design of offshore steel structures, no. DNV-RP-C203, available at: https://www.dnv.com/oilgas/download/dnvgl-rp-c203-fatigue-design-of-offshore-steel-structures.html (last access: 28 April 2021), 2010.
DNV: Design of offshore wind turbine structures, Det Norske Veritas, Norway, 2013.
DNV: DNVGL-RP-C210-Probabilistic methods for planning of inspection for fatigue cracks in offshore structures, DNV, Norway, 2015.
DNVGL: DNVGL-ST-0126: Support Structures for Wind Turbines, DNV, Oslo, Norw., 2016a.
DNVGL: DNVGL-ST-0437 Loads and site conditions for wind turbines, DNV, Norway, 2016b.
European Environment Agency: Share of EU energy consumption from renewable sources, 2005–2050, available at: https://www.eea.europa.eu/data-and-maps/figures/share-of-eu-energy-consumption (last access: 28 April 2021), 2019.
Førli, O.: Guidelines for Development of NDE Acceptance Criteria, Nordtestest, available at: https://www.nordtest.info/wp/1999/03/06/guidelines-for-development-of-nde-acceptance-criteria-nt-tr-427/ (last access: 28 April 2021), 1999.
Fraile, D., Komusanac, I., and Walsh, C.: Wind energy in Europe: Outlook to 2023, WindEurope Business Intelligence, Brussels, available at: https://www.anev.org/wp-content/uploads/2019/10/Market-outlook-2019.pdf (last access: 28 April 2021) , 2019.
Gentils, T., Wang, L., and Kolios, A.: Integrated structural optimisation of offshore wind turbine support structures based on finite element analysis and genetic algorithm, Appl. Energ., 199, 187–204, 2017.
Georgiou, G. A.: Probability of Detection (POD) curves: derivation, applications and limitations, Jacobi Consult. Ltd., Health and Safety Executive Research Report, London, 454, 2006.
Hobbacher, A. F.: Recommendations for Fatigue Design of Welded Joints and Components, Springer International Publishing, Cham, 2016.
HSE: HSE's decision-making process, edited by: HSE, HSE, Norwich, 2001.
IEC: 61400-3 (2009) Wind Turbines – Part 3: Design Requirements for Offshore Wind Turbines, The British Standard Institutions, London, 2009.
IEC: BS EN IEC 61400-1: Wind turbines part 1: Design requirements, International Electrotechnical Commission, The British Standard Institutions, London, 2019.
ISO-14971: BS EN ISO 14971: 2012 – Application of risk management to medical devices, The British Standard Institutions, London, 2012.
ISO-31000: BS 31000: Risk management – Principles and guidelines, International Organization for Standardization, Geneva, Switzerland, 2018.
Jonsson, B., Dobmann, G., Hobbacher, A. F., Kassner, M., and Marquis, G.: IIW Guidelines on Weld Quality in Relationship to Fatigue Strength, Springer International Publishing, Cham, 2016.
Lassen, T. and Recho, N.: Fatigue life analyses of welded structures: flaws, John Wiley & Sons, Newport Beach, USA, 2013.
Li, L., Moan, T., and Zhang, B.: Residual stress shakedown in typical weld joints and its effect on fatigue of FPSOs, in ASME 2007 26th International Conference on Offshore Mechanics and Arctic Engineering, 10–15 June 2007, San Diego, https://doi.org/10.1115/OMAE2007-29285, pp. 193–201., 2007.
Lotsberg, I., Sigurdsson, G., Fjeldstad, A., and Moan, T.: Probabilistic methods for planning of inspection for fatigue cracks in offshore structures, Mar. Struct., 46, 167–192, 2016.
Luengo, M. M. and Kolios, A.: Failure mode identification and end of life scenarios of offshore wind turbines: A review, Energies, 8, 8339–8354, https://doi.org/10.3390/en8088339, 2015.
Mehmanparast, A., Brennan, F., and Tavares, I.: Fatigue crack growth rates for offshore wind monopile weldments in air and seawater: SLIC inter-laboratory test results, Mater. Design, 114, 494–504, 2017.
Naess, A.: Fatigue handbook: offshore steel structures, Tapir Publishers, Flatasen, Norway, 1985.
Okumoto, Y., Takeda, Y., Mano, M., and Okada, T.: Design of ship hull structures: a practical guide for engineers, Springer Science & Business Media, Berlin, 2009.
PTC: MathCAD Prime 5.0, available at: https://www.mathcad.com/en/ (last access: 28 April 2021), 2019.
Tavner, P.: Offshore wind turbines: Reliability, availability and maintenance, The Institution of Engineering and Technology, London, 2012.
twd: Monopile Fabrication, online, available at: https://twd.nl/suction-bucket-jacket-seafastening-structures/suctionbucketjacket_seafastening_clamps_overview/ (last access: 28 April 2021), 2019.
TWI: Structural Integrity Assessment and Practical Application of BS 7910 Procedures for the Assessment of Flaws in Metallic Structures, TWI.Ltd, Abington, Cambridge, UK, 2015.
TWI.Ltd: CrackWISE®, available at: https://www.twisoftware.com/software/integrity-management-software/crackwise/ (last access: 28 April 2021), 2019.
Van Wingerde, A. M., Van Delft, D. R. V., Packer, J. A., and Janssen, L. G. J.: Survey of support structures for offshore wind turbines, CRC Press, London, 2006.
Zerbst, U., Klinger, C., and Clegg, R.: Fracture mechanics as a tool in failure analysis – Prospects and limitations, Eng. Fail. Anal., 55, 376–410, 2015.
- Abstract
- Introduction
- Fracture mechanics approach
- Fracture mechanics framework for structural design
- Probabilistic fracture mechanics
- Case Study 1 – monopile OWT support structure
- Case Study 2 – probabilistic fracture mechanics application to a plate failure
- Conclusions
- Appendix A: Nomenclature
- Code availability
- Data availability
- Author contributions
- Competing interests
- Acknowledgements
- Financial support
- Review statement
- References