the Creative Commons Attribution 4.0 License.
the Creative Commons Attribution 4.0 License.
 | 08 Jul 2022
Development of a wireless, non-intrusive, MEMS-based pressure and acoustic measurement system for large-scale operating wind turbine blades
Julien Deparday
Yuriy Marykovskiy
Eleni Chatzi
Gregory Duthé
Michele Magno
Tommaso Polonelli
Raphael Fischer
Hanna Müller
As the wind energy industry is maturing and wind turbines are becoming larger, there is an increasing need for cost-effective monitoring and data analysis solutions to understand the complex aerodynamic and acoustic behaviour of the flexible blades. Published measurements on operating rotor blades in real conditions are very scarce due to the complexity of the installation and use of measurement systems. However, recent developments in electronics, wireless communication and MEMS (micro-electromechanical systems) sensors are making it possible to acquire data in a cost-effective and energy-efficient way. In this work, therefore, a cost-effective MEMS-based aerodynamic and acoustic wireless measurement system that is thin, non-intrusive, easy to install, low power and self-sustaining is designed and tested in a wind tunnel. The measurement system does not require an electrical connection to the wind turbine and can be mounted and removed without damaging the blade.The results show that the system is capable of delivering relevant results continuously, although work needs to be done on calibrating and correcting the pressure signals as well as on refining the concept for the attachment sleeve for weather protection in the field. Finally, two methods for using the measurements to provide added value to the wind energy industry are developed and demonstrated: (1) inferring the local angle of attack via stagnation point detection using differential pressure sensors near the leading edge and (2) detecting and classifying leading edge erosion using instantaneous snapshots of the measured pressure fields. Ongoing work involves field tests on a 6 kW operating wind turbine in Switzerland.
- Article
(6941 KB) - Full-text XML
- BibTeX
- EndNote


1.1 Full-scale aerodynamic measurements
As the wind energy industry is maturing and wind turbines are becoming larger, there is an increasing need for cost-effective monitoring and data analysis solutions to understand the complex aerodynamic and acoustic behaviour of the flexible blades (Schepers and Schreck, 2019). The incoming flow transports turbulent structures of different scales spatially and temporally, yielding aerodynamic load fluctuations that are complex to simulate. A high shear flow due to the atmospheric boundary layer could create some additional instabilities. It can also change the relative wind speed and angle of attack at different heights of the rotor blades. These changes in the local inflow conditions on the rotor blades contribute to non-linear aerodynamic loading. Even in steady conditions with well-known free-stream conditions, it is not easy to assess the local inflow conditions on a wind turbine as the wind velocity decreases between the free stream and the turbine rotor in a manner that varies with wind speed and rotational speed of the rotor. Adding to that, a spanwise component of the flow – creating a three-dimensional flow – makes it hard to correctly evaluate the local wind speed and angle of attack on the rotor blade and hence to compare it with simulations or measurements with a fixed blade.
Published aerodynamic and acoustic measurements on operating rotor blades in real conditions are very scarce due to the complexity of installation and use of measurement systems. A review of the measurements done as part of International Energy Agency (IEA) Wind Task 14 and Wind Task 18 can be found in Appendix A of the PhD thesis by Gerard Schepers (Schepers, 2012). As well as this, the National Renewable Energy Laboratory (NREL) in the USA has been carrying out extensive measurements on rotating wind turbine blades since 1988 (Hansen and Butterfield, 1993). More recently, a well-known field experiment called DANAERO involved on-field experiments on a 2 MW wind turbine with an instrumented blade (Madsen et al., 2016; Troldborg et al., 2013). In this project, the aerodynamic and acoustic properties of the wind turbine were thoroughly investigated, both in wind tunnel tests and in field tests. Far-field microphones were placed around the wind turbine, and a blade was instrumented with 50 flush-mounted microphones to evaluate the noise emission of the blade and detect local flow separation. It was shown that such aeroacoustic field measurements have the potential to provide a high added value to the wind industry through further understanding of three-dimensional effects. However, the project required a very large effort and high costs.
Before this, a set of wind turbine field experiments tackling the aerodynamics, performance and noise emissions were carried out on a 2.3 MW operating wind turbine (Medina et al., 2011). In this work, a thorough characterisation of the inflow properties and of the structure of the wind turbine was presented. For this, four five-hole pitot tubes were installed on the blade as well as 60–64 pressure taps at nine different locations along the span. An extended study was carried out to correct the pressure tap measurements in order to extract the most accurate local pressure measurements. Similarly to the DANAERO project, this study provided valuable information to the research community as well as to the industry, but a large amount of effort was required in order to instrument the wind turbine.
Even more recently, an on-field measurement system was developed for a 100 kW wind turbine (Wu et al., 2019). Similarly to previous experimental campaigns, pitot tubes were installed at different spanwise locations in order to evaluate the inflow conditions, and flush-mounted pressure taps were installed at five different locations along the span and linked to pressure scanners thanks to tubes.
As well as demonstrating the potential value of aerodynamic and acoustic field measurements, all these measurement campaigns demonstrate the complexity and the cost of embedding sensors inside a blade and retrieving the data via cables from a rotary machine. The present work therefore focuses on less intrusive, easier-to-install systems that can provide added value to the wind energy industry at a reasonable price. It should be noted that there are some similar efforts known to the authors that are not yet published, such as the pressure belt from DTU Wind (https://www.youtube.com/watch?v=y5OXKajTmfs, last access: 30 June 2022). An exchange of experiences during these efforts is ongoing as part of IEA Wind Task 43.
1.2 Recent developments in microelectronics
Due to the complexity and costs related to embedding conventional aerodynamic and acoustic measurement technology into rotor blades, this present paper focuses on the application of a cost-effective MEMS (micro-electromechanical systems)-based aerodynamic and acoustic measurement system for rotor blades that is thin, non-intrusive, easy to install, low power, self-sustaining and wirelessly transmitting.
In general, recent developments in electronics, wireless communication and MEMS sensors are making it possible to acquire data in a cost-effective and energy-efficient way. Novel IoT (Internet of things) sensors are enabling the establishment of some new and important research areas for many applications, including structural health monitoring (SHM) and predictive maintenance (Di Nuzzo et al., 2021; Chen et al., 2021), which are often based on MEMS technologies for ease of installation and system integration. SHM aims to detect anomalies and prevent apparatus faults (Chen et al., 2021; Qu et al., 2019) at low cost and is connected to a long-term vision of improving performance and/or reducing costs of a particular asset. Previous analyses have demonstrated the potential of using inexpensive and low-power MEMS sensors for aerodynamic purposes (Fathima et al., 2021; Di Nuzzo et al., 2021). For example, arrays of MEMS barometers have already been deployed in other application scenarios, namely on aeroplane wings (Raab and Rohde-Brandenburger, 2020) and on cars (Filipský et al., 2017). In general, the cited works show that MEMS sensors are a valid option to acquire aerodynamic measurements. However, none of them address the wireless communication and power consumption challenges required for the continuous monitoring of wind turbines using an IoT device (Karad and Thakur, 2021).
In previous publications, a few examples of wireless devices have been proposed in the wind turbine context (Wondra et al., 2019; Di Nuzzo et al., 2021; Lu et al., 2019). However, they mostly support vibration measurements (Di Nuzzo et al., 2021; Esu et al., 2016) for SHM modal analysis, where the electronics have to process and transmit a data stream in the range of 5 kbps. However, for aerodynamic and acoustic measurements on wind turbine blades, a minimum throughput larger than 1 Mbps is required (Fischer et al., 2021). The data collected by arrays of barometers and microphones are crucial for understanding the aerodynamic and aeroacoustic behaviour, but on the other hand, they pose major challenges in the design of an energy-efficient and long-lasting IoT sensor node. These challenges will be addressed in the present work.
1.3 Providing added value to research and industry
As well as helping to further the understanding of three-dimensional turbulent flow over rotor blades operating in the field under real conditions, pressure and acoustic rotor blade measurements can provide added value to the wind energy community in several ways, which are discussed below.
Firstly, using measurements to infer the local angle of attack and rotor inflow conditions can help wind turbine manufacturers relate rotor blade performance to inflow conditions and enable them to improve their design tools. In previous work, the local inflow conditions have been measured using probes positioned at the leading edge of the blades and a reference pressure measured in the hub or far upstream, using long tubes (Medina et al., 2011; Troldborg et al., 2013; Wu et al., 2019). However, a reference pressure is not simple to define and to acquire as the free-steam velocity decreases when approaching the wind turbine. Moreover, measurements from pitot tubes must still be corrected to estimate the local inflow conditions. This method is very time-consuming and expensive to apply. Therefore the present work avoids measuring a reference pressure and will not rely on pitot tubes. Instead, the local inflow conditions will be inferred from the pressure gradient at the leading edge (see Sect. 4.1).
As well as this, the improved understanding gained from the measurements can help original equipment manufacturers (OEMs) to improve their aerodynamic and acoustic design tools, reducing investment costs of wind energy. The improved design tools can then lead to more efficient and less noisy rotor blade designs, reducing investment costs of wind energy.
Furthermore, the measurements can enable early detection and classification of local blade surface damage or deterioration, which can reduce operating costs and increase wind project revenues by improving operators' decision-making regarding blade cleaning and repair. One of the key topics related to this point is leading edge erosion (LEE), which can result from abrasive airborne particles or weather conditions and can impact the annual energy production (AEP) of a megawatt-scale wind turbine on the order of 5 % (Langel et al., 2015). Current methods for identifying LEE involve manual (Nielsen, 2020) or drone-based visual inspection (Shihavuddin et al., 2019), electrical signal analysis (He et al., 2020), or vibration monitoring (Skrimpas et al., 2016), methods which either require the turbine to be shut down or are limited for continuous monitoring (Du et al., 2020). Therefore in the present work, a data-driven model is used to predict the state of degradation of the leading edge of a two-dimensional airfoil via aerodynamic pressure coefficient learning, under the influence of various uncertain inputs and parameters (see Sect. 4.2).
The measurements can also enable increased revenues by improving operators' decision-making and asset management of sub-optimal control settings, blade mass or aerodynamic imbalance. Existing methods investigated in the literature include detecting imbalances on wind turbine rotors using a harmonic analysis of the rotor response in the fixed frame (Cacciola et al., 2016); a combination of blade and nacelle measurements, most of which can be obtained from standard instrumentation already found on utility-scale wind turbines (Kusnick et al., 2015); and a combined optimisation of the power and loads using wake redirection by assessing the influence of load variations of the rotor due to partial wake overlap (van Dijk et al., 2016). These methods are all theoretical and have not been proven in the field in a robust manner.
The acoustic measurements can enable the detection of amplitude modulation, an acoustic effect known to cause annoyance and reduce wind energy project acceptance, which can increase the wind farm operating envelope and thus increase wind project revenues (e.g. Tian and Cotté, 2016; Oerlemans and Schepers, 2009; Larsson and Öhlund, 2014).
Measurements on single wind turbines with retrofit devices installed (e.g. vortex generators and trailing edge serrations) can allow operators to quantify their effect on performance and thus decide whether to invest in their application to other wind turbines at a site (e.g. De Tavernier et al., 2021; Zhu et al., 2022).
Finally, the measurements may even allow early detection of local blade structural damage, which can reduce operating costs by enabling early repair or decisions to be made (note that this application is still under investigation). For the detection of damage in wind turbines structures, classical vibration- or strain-based monitoring methods rooted in the derivation and the tracking of modal properties have been the prime focus of research (Weijtjens et al., 2016). Clustering approaches are further applied on the operational modal analysis results to reduce the effect of environmental and operational conditions (Oliveira et al., 2018). The identification results could be improved via a modified stochastic subspace system identification, for instance, as proposed by Dong et al. (2018), or via direct measurements on the blades (instead of on the tower and nacelle only) (Tcherniak and Larsen, 2013), especially to improve the observability of aerodynamically damped modes for damage detection.
1.4 Goal of this work
The goal of this work is to design, test and demonstrate the added value of a prototype cost-effective MEMS-based aerodynamic and acoustic measurement system for rotor blades that is thin, non-intrusive, easy to install, low power, self-sustaining and wirelessly transmitting. This is part of the Aerosense project, which has the ultimate goal of developing pilot measurement systems proven on megawatt-scale wind turbines.
In this paper, the design of the measurement system is discussed in Sect. 2, firstly related to the overall system and then to the key sub-systems. In Sect. 3, the system test and demonstration are described. Finally, two applications of the measurement system that provide added value to the wind energy industry are demonstrated in Sect. 4: (1) inferring the local angle of attack and (2) detecting and classifying leading edge erosion (LEE). The conclusions can be found in Sect. 5.
In this section, the design considerations of the measurement system are first introduced, followed by a description of the design of the overall system and the key sub-systems.
2.1 Design requirements
In order to establish the design requirements, the following three priority use cases were first defined based on the expected added value introduced in Sect. 1 alongside the results of personal interviews with potential customers:
-
Use case 0 – operational measurement system. This use case represents a fully functioning measurement chain including collecting the measurement data; pushing them to a digital twin in the cloud; calibrating, correcting, filtering and storing them; and finally checking their plausibility. The use case provides value to customers by providing them with the raw data for evaluating and analysing the behaviour of the operating wind turbine.
-
Use case 1 – improved aeroacoustic models. This use case involves expanding use case 0 to include evaluation modules in the digital twin that directly allow the user to compare the results to two-dimensional measurements or simulations and understand the three-dimensional flow effects in field operation, thus improving their aerodynamic and acoustic designs and their design tools. This includes machine learning (ML) modules that infer the angle of attack and classify the data according to external and operating conditions.
-
Use case 2 – surface damage detection. This use case involves expanding use case 1 with further ML modules that allow detection and classification of surface damage in order to help operators optimise performance and make decisions related to maintenance planning.
Based on these use cases, the main requirements used for the initial design included, although were not limited to, the following considerations:
-
The system should be easy to install and remove without damaging the blade and be protected from the weather and not affect the airflow too much (meaning that the thickness of the node should not exceed a maximum height of ≤0.3 % of the chord or of ΔCP≤0.3 %, where CP refers to the pressure coefficient; this requirement was introduced by potential customers and users of the measurement system and means that, practically, the thickness should not exceed 4 mm). During the project, the effect of the measurement system will be assessed via comparisons with flush-mounted systems, and corrections will be developed if necessary.
-
There should be enough pressure sensors around the blade at one radial location to allow the pressure distribution to be obtained with a spatial resolution high enough to capture effects such as boundary layer transition and separation. Based on previous work and on the expected pressure gradients, the requirement was estimated to be approximately 40 sensors distributed around the pressure and suction sides with a higher resolution near the leading edge.
-
There should be enough acoustic sensors at the trailing edge to be able to estimate parameters used in low-order aeroacoustic models, such as the chordwise and spanwise correlation lengths as well as the convection velocity and the pressure fluctuation spectrum, with the constraints of being able to transfer the data in the limited bandwidth provided by the IoT: the best trade-off has been found with 10 sensors in an L shape with varying distances between each microphone, as shown in Fig. 1. To estimate the turbulence scale with this set-up, the coherence lengths in the chordwise and spanwise directions are calculated using the cross-correlation between the microphones.
-
An inertial measurement unit (IMU) should be present in order to establish the blade position, angle, speed and acceleration.
-
The sampling frequencies of the sensors should be high enough to capture the key dynamics in the system. A summary of relevant dynamic effects on a wind turbine and the sampling frequencies of the different sensors chosen for the Aerosense system is presented in Fig. 2. The range given by the sensors refers to the range of available sensors. Due to the Shannon–Nyquist sampling theorem, the sampling frequency of the sensors should be at least 2 times higher than the highest frequency which has to be acquired. The label “Dynamic stall/LE vortex” refers to dynamic stall effects occurring due to the leading edge vortex, whereas the label “Dynamic stall/pitching” refers to lower-frequency dynamics that occur as the blade is actively pitched when travelling through the atmospheric boundary layer.
-
The system price should be on the order of USD 5000 for the measurement system and USD 50 000 per year for a measurement service.
-
The lifetime should be on the order of 4 years to allow multiple measurement campaigns of several months with one system.
-
Long-term drift and malfunctioning sensors need to be accounted for.
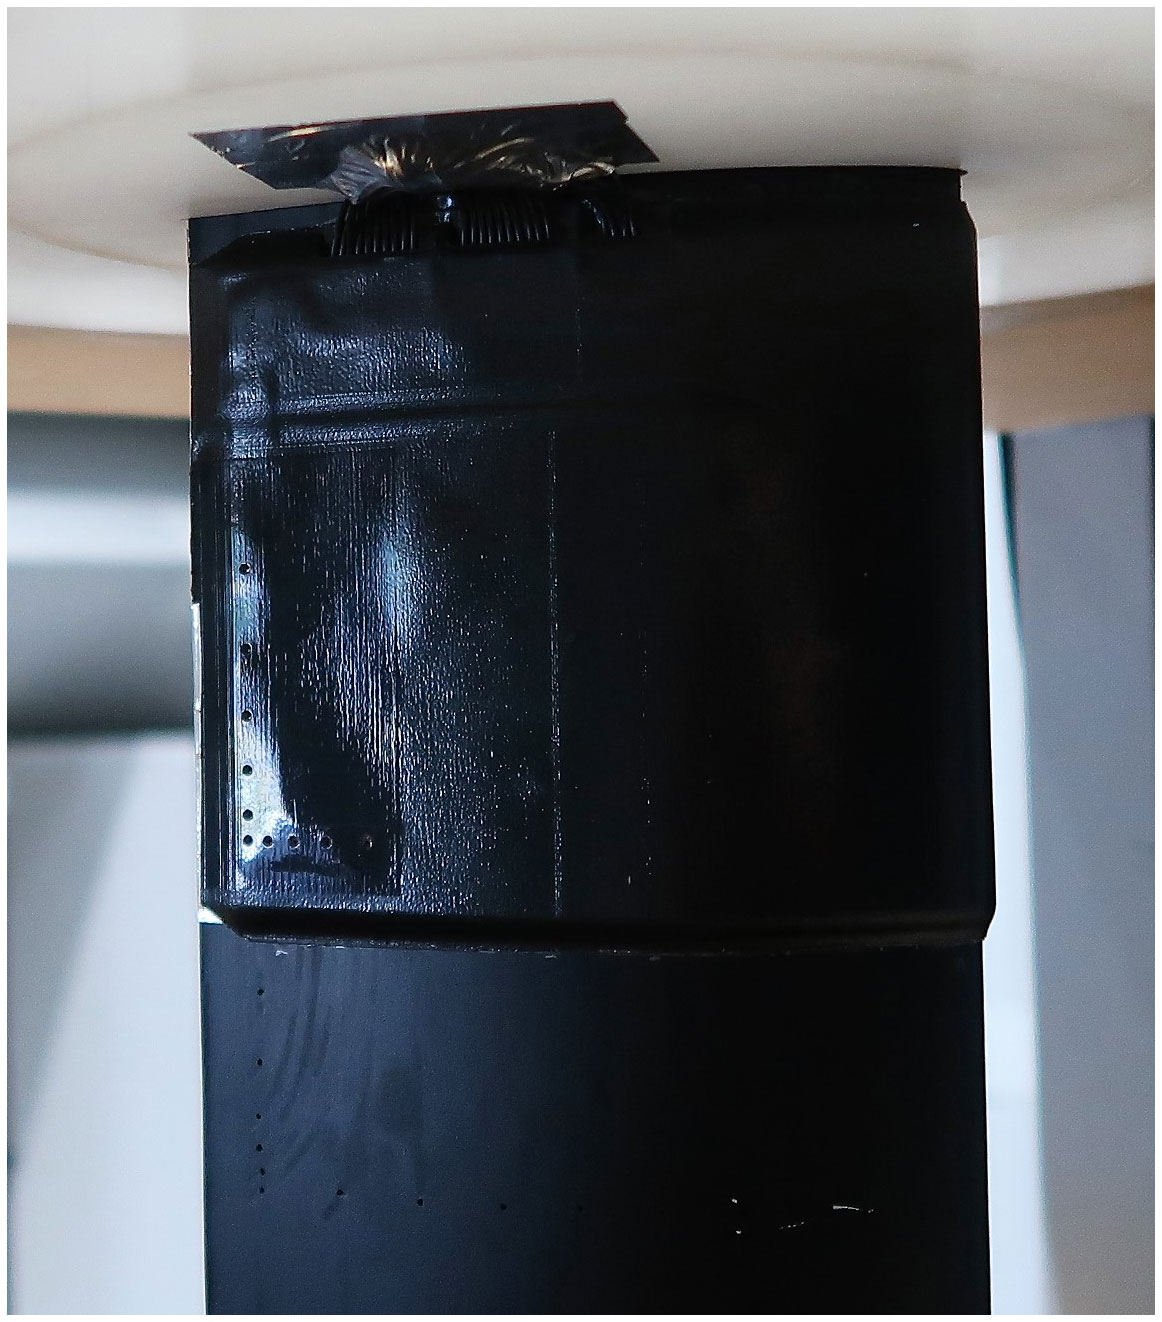
Figure 1Photo of the 10 microphones installed on a NACA63418 profile in the anechoic wind tunnel at Ecole Centrale de Lyon. The chord of the airfoil is 125 mm.
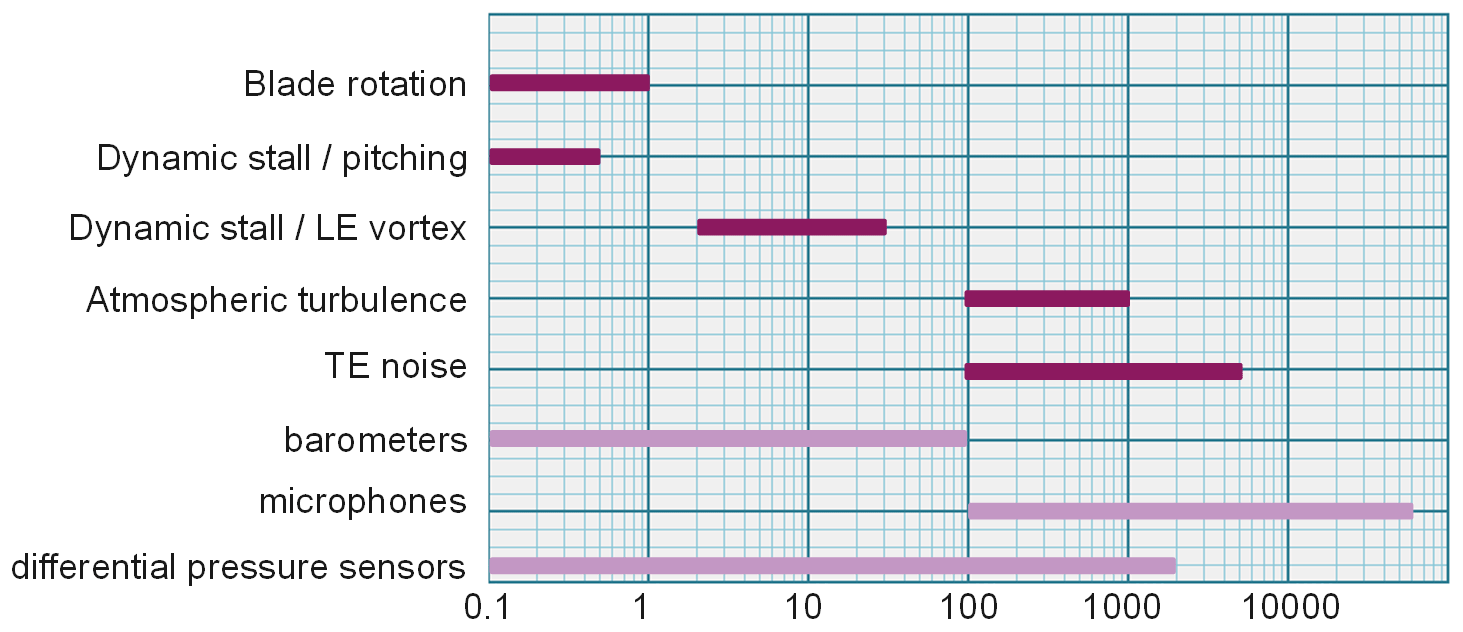
Figure 2Dynamics of the physical features that should be measured by the Aerosense system and the range of frequencies that the sensors can acquire. The horizontal axis is in Hertz (Hz) and on a log scale. LE and TE denote leading edge and trailing edge, respectively.
2.2 Overall system design
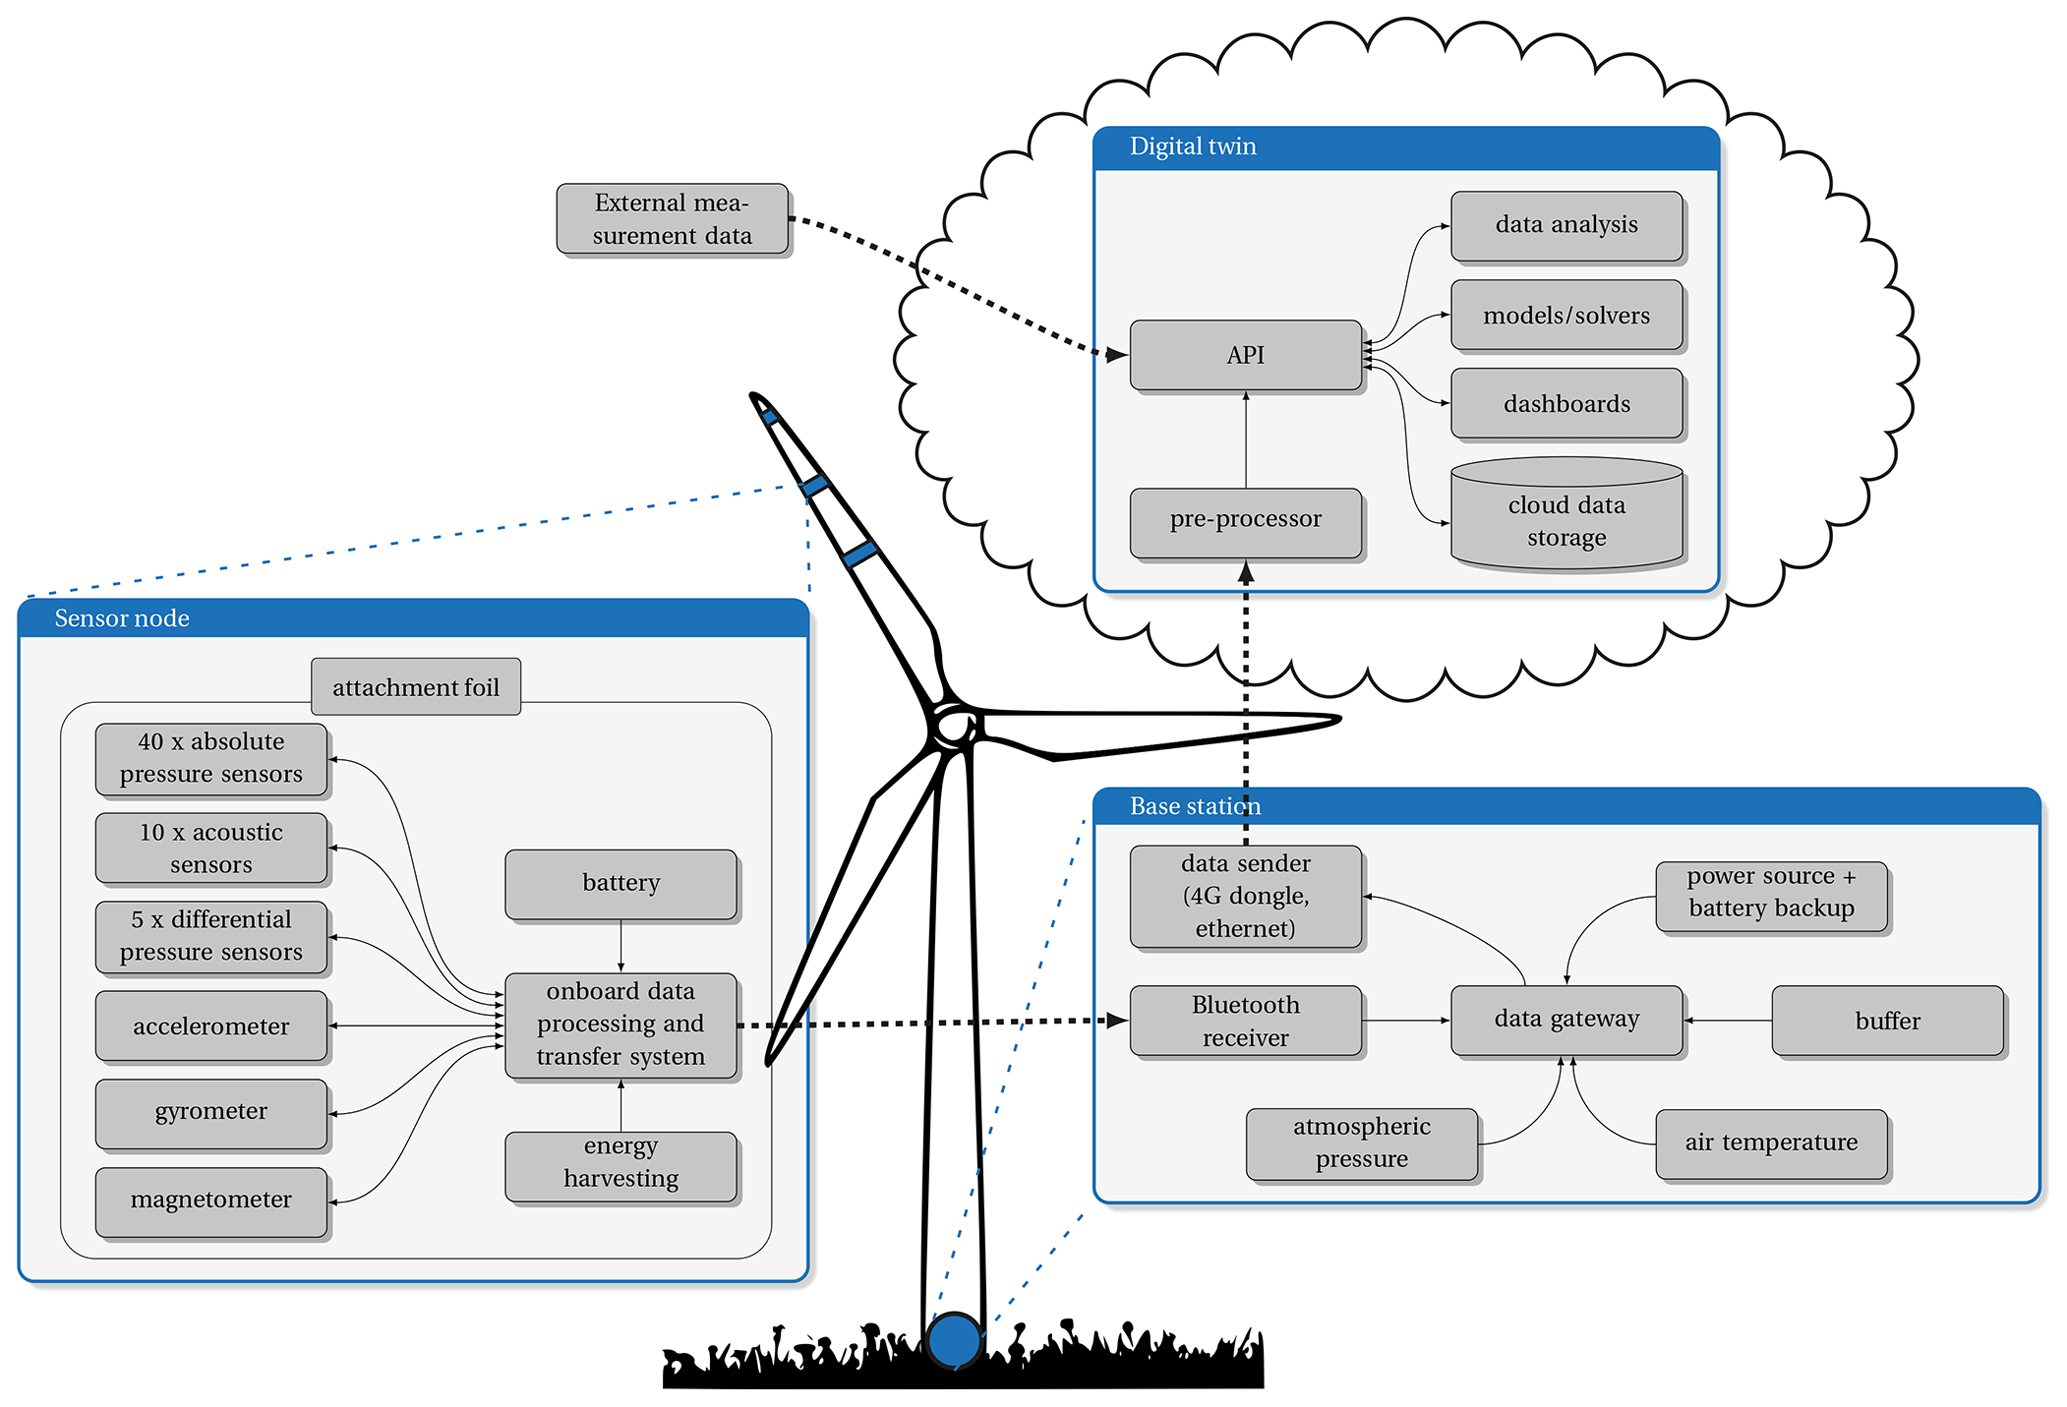
An overview of the system is shown in Fig. 3. The system consists of three sub-systems: (1) the sensor node, (2) the base station and (3) the digital twin on the cloud. In this paper, the design of the sensor node and the digital twin will be described below. The base station design is ongoing and is not required for the functional tests shown in this paper.
2.3 Hardware design of the sensor node
The sensor node consists of a thin sleeve (4 mm height) wrapped around the entire blade with embedded MEMS sensors (pressure, acoustic, inertial, temperature), electronics, a power supply and a data transmission system. Following the definition of the initial requirements described above, an ultra-low-power wireless sensor node was designed, tested and verified. In particular, to measure the pressure distribution and the acoustic behaviour on a wind turbine blade, a large number of sensors is needed, which generate a large volume of data (typically megabytes).
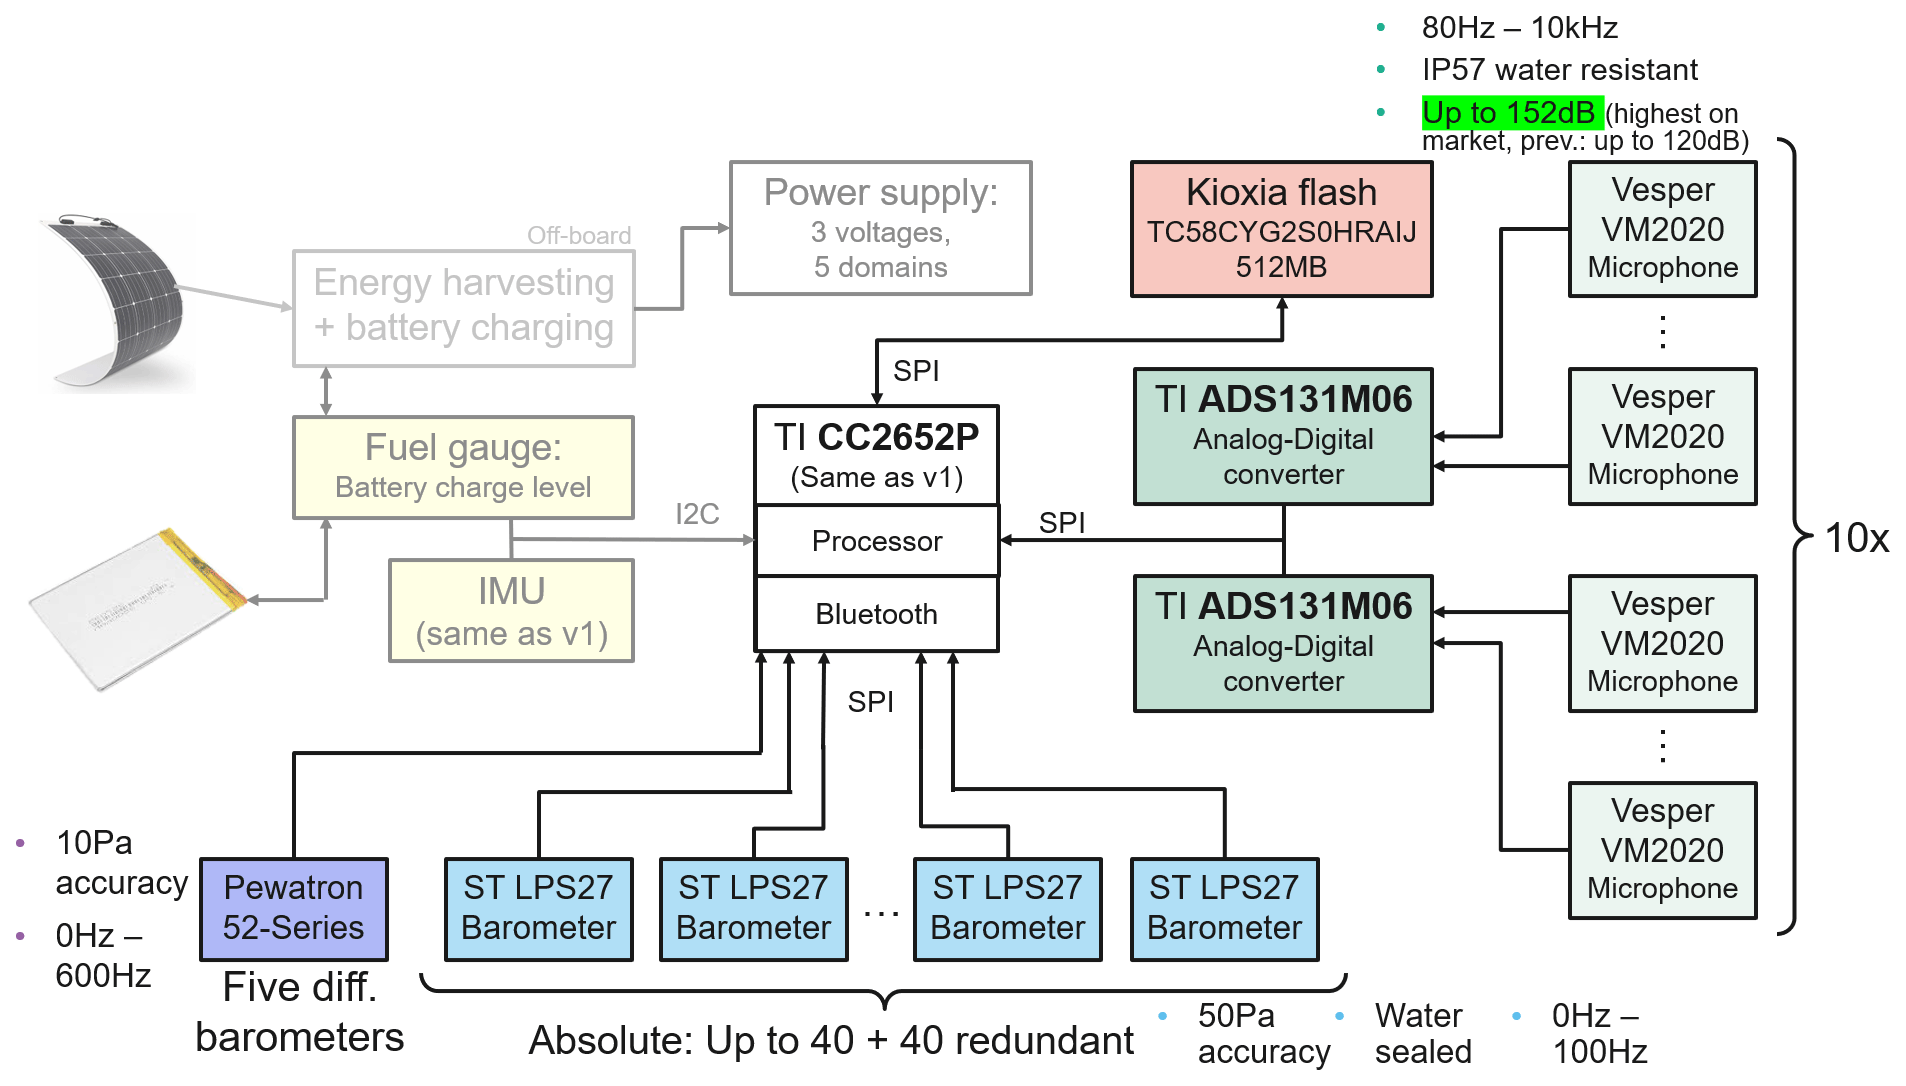
In electronics design, this need is in contrast with standard low-power requirements. Hence specific design considerations were made in order to tackle the hardware and software design challenges. Other than a multi-core system on a chip (SoC), the sensor node includes a 512 MB non-volatile memory, two external analog-to-digital converters to support up to 10 channels in parallel and a smart power management system. It includes a cluster-parted power domain distribution and a solar energy harvester. Moreover, to exploit as much as possible the 1 Mbps bandwidth of the Bluetooth Low Energy (BLE) 5.0, an on-board data-compression algorithm decreases the number of data forwarded to the cloud. In any case, since the BLE imposes a data throughput bottleneck, the raw data are internally stored on the 512 MB memory, and after that they are forwarded to the gateway in raw or compressed format, depending on the system settings. The description of the compression algorithm goes beyond the scope of this paper, which focuses on the description of the Aerosense project and its capability to collect aerodynamic and aeroacoustic data.
The system is designed to be able to operate with three nodes connected to one base station. The sensor node supports the following features:
-
long-range and low-power Bluetooth communication at 1 Mbps with a maximum coverage above 200 m;
-
support for up to 40 MEMS absolute pressure sensors (barometers) sampled at 100 Hz, model LPS27HHWTR;
-
support for up to 10 wide-range MEMS microphones sampled at 16 kHz, model VM2020;
-
support for up to five differential pressure sensors sampled at 100 Hz, model Pewatron 52-Series;
-
512 MB on-board flash memory, model TC58CYG2S0HRAIJ;
-
a MEMS inertial measurement unit (IMU) sampled at 1 kHz, model BMX160 from Bosch;
-
on-board lossless and lossy compression algorithms;
-
solar energy harvester.
All these properties have been implemented according to the use case requirements presented above. The final block diagram of the sensor node is shown in Fig. 4.
As well as the electronics, the integration of the system in a sleeve had to be considered. This sleeve has to enable the system to be easily installed on and removed from a wind turbine blade, protect the electronics from the weather conditions, and minimise the aerodynamic impact of the sensors on the flow over the blade. The solution chosen is a custom-made PolyJet 3D-printed sleeve, which is flexible enough to bend around any airfoil as shown in Fig. 5, in which the housings were tested for robustness on a 6 kW operating wind turbine. The sleeve is fixed onto the blade with the same type of adhesion tape that is used for leading edge protection of wind turbine blades. It is then easy to install by a technician even on mounted blades, sticks well and can be removed without damaging the blade.
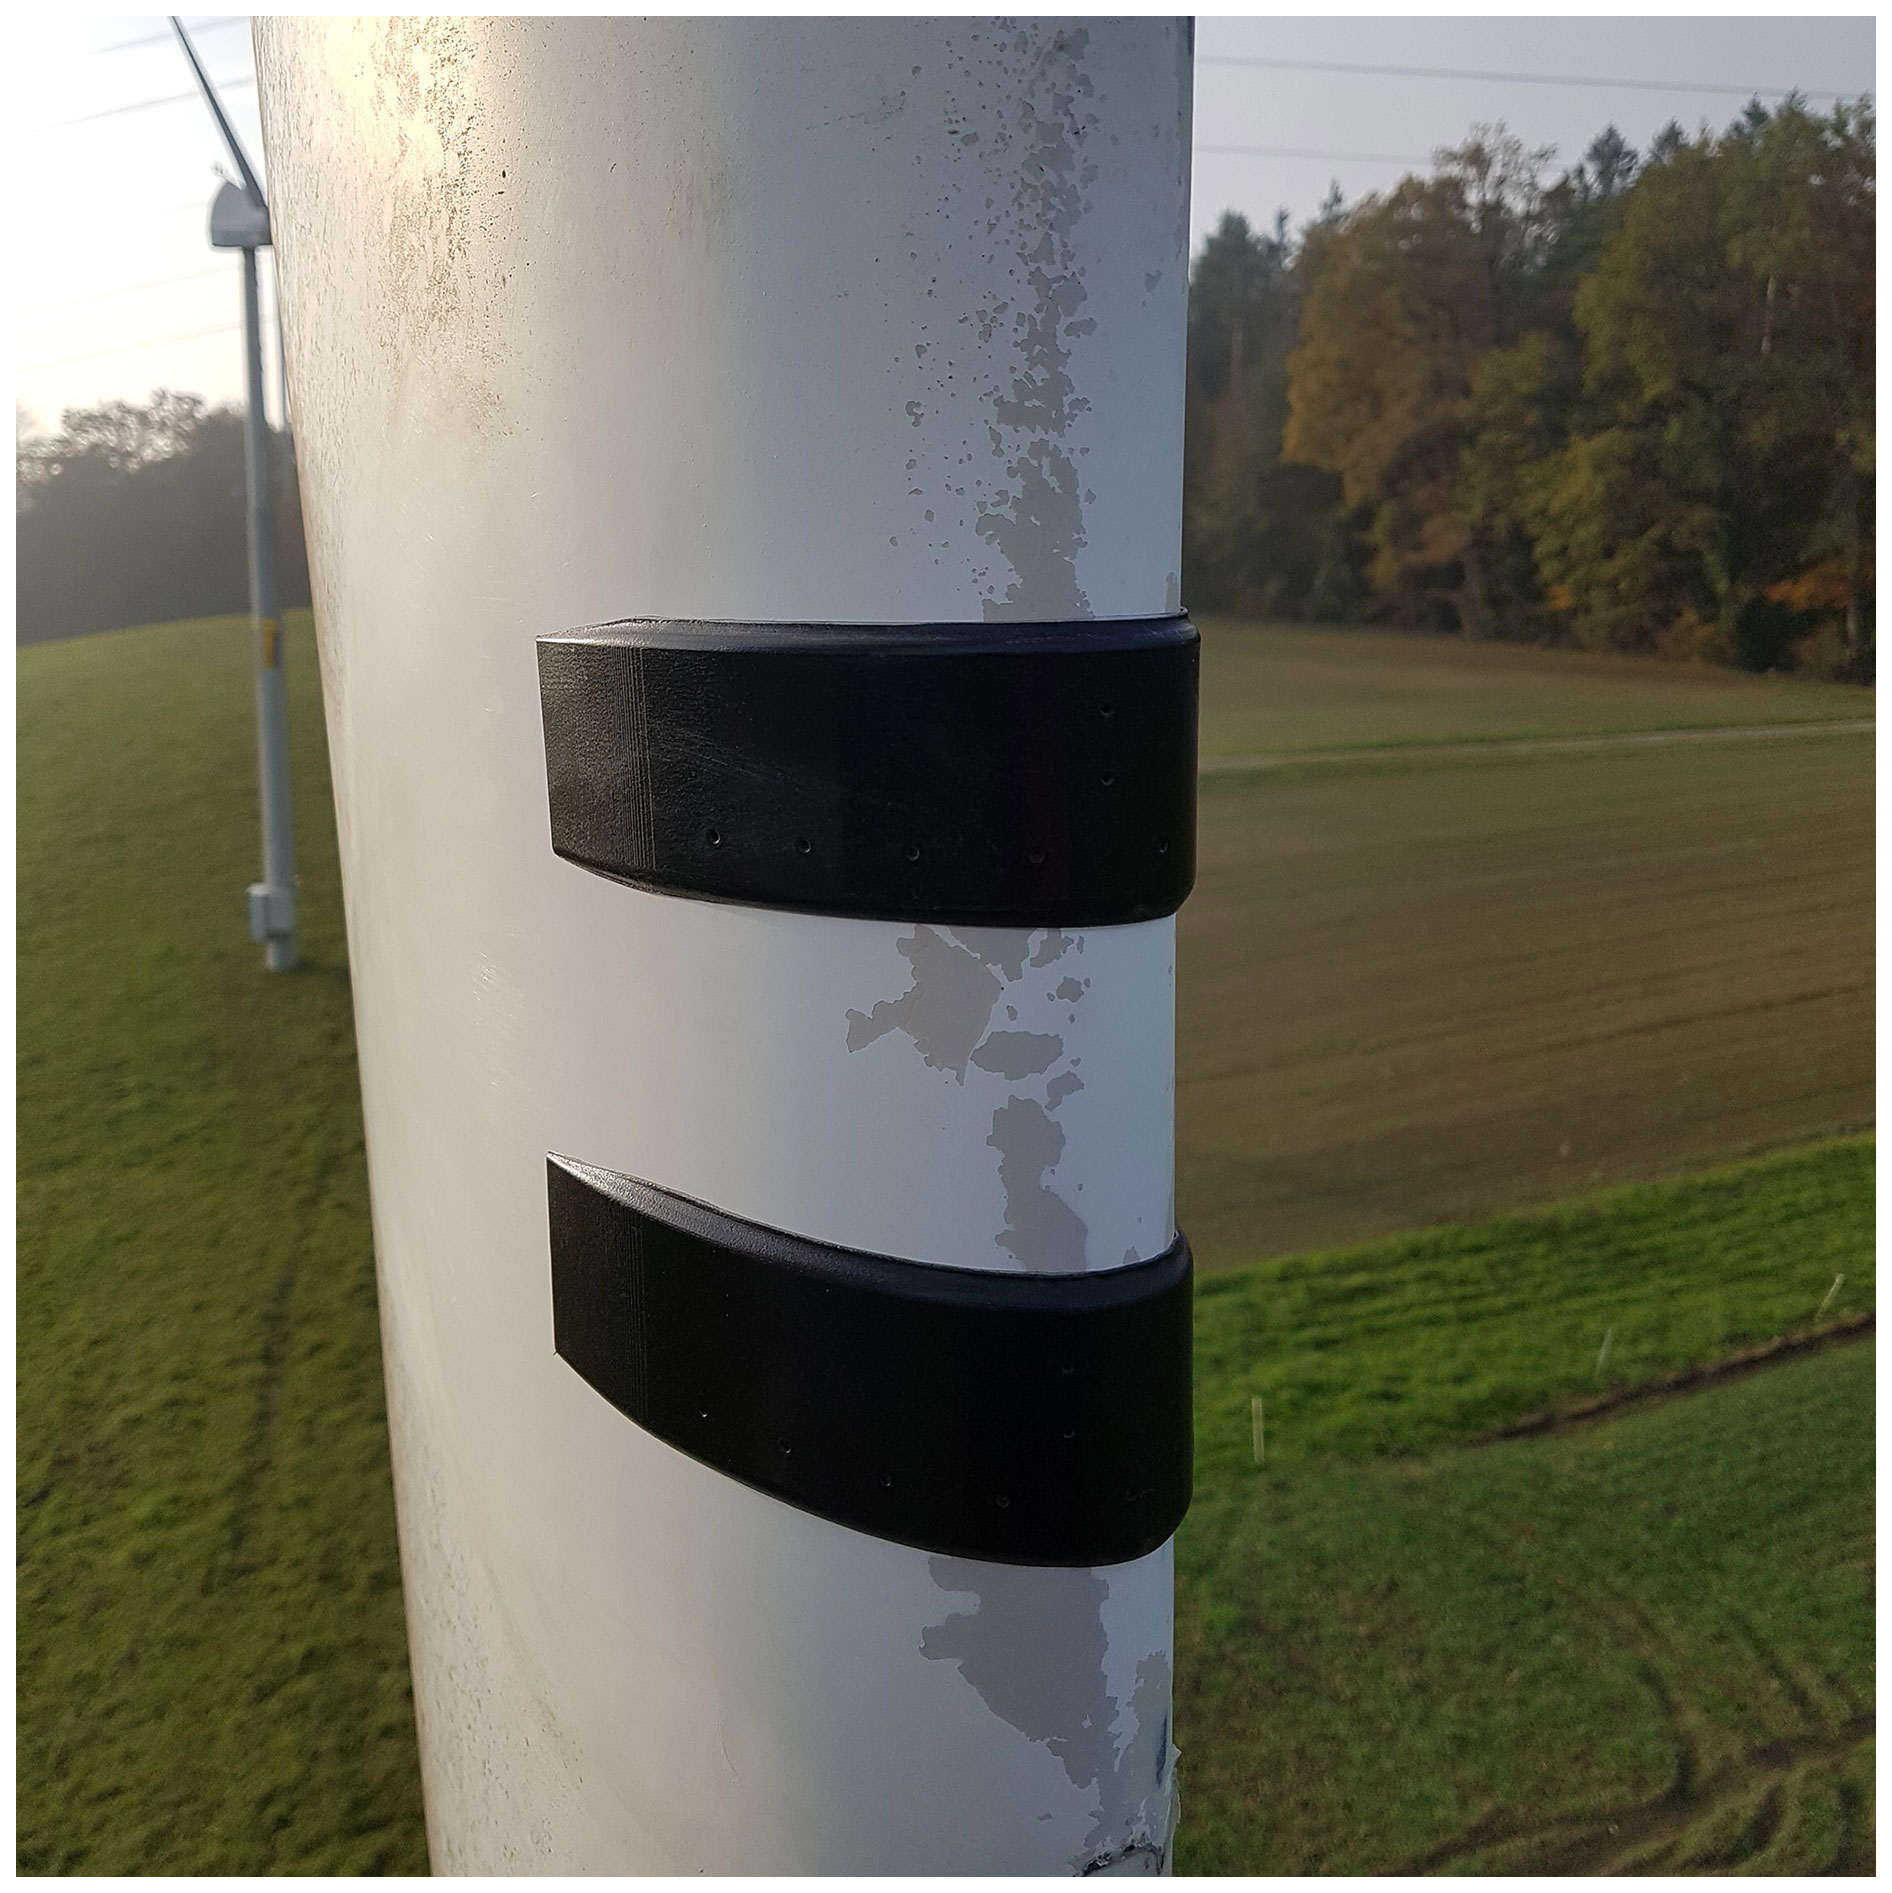
Figure 5PolyJet 3D-printed housings glued on a 6 kW operating wind turbine to test its robustness.
2.4 Digital twin design
The digital twin system is an essential part of this project, required in order to use the measurement data to provide added value to the customers. As shown in Fig. 3, the software layer of the system includes (a) a data pre-processor to collect, timestamp, clean, correct, calibrate and store (in a BigQuery database) the measurement data as well as the external data collected (such as supervisory control and data acquisition – SCADA – and met mast data); (b) inverse problem solvers to infer quantities such as the angle of attack and the leading edge erosion class (using e.g. trained ML models) and forward problem solvers to predict non-measured quantities such as the structural deformation of the blade (e.g. using fluid–structure-interaction simulations); (c) data analysis algorithms such as a post-processor that computes derived quantities such as the lift and drag coefficients; and (d) dashboards to display and download the results.
In order to implement this, the digital twin architecture had to be defined and developed. The software development pipeline has been set up together with the UK company Octue (https://www.octue.com/, last access: 30 June 2022) according to the best industry practice, with Git branching/version tracking, testing, documentation and continuous integration/continuous deployment hosted on GitLab. Two examples of inverse problem solvers developed are discussed in Sect. 4. The existing software packages (forward solvers) inside the digital twin also had to be wrapped for cloud deployment. The wrapping process requires definition of input/output variables and files, as well as configuration variables/files for each software package via JSON schema (https://json-schema.org/, last access: 30 June 2022). The wrapped package is then deployed on the cloud as a service. For the use cases discussed in Sect. 4, the following software was wrapped:
-
OpenFOAM (https://openfoam.org/, last access: 30 June 2022). The software was wrapped via PyFoam (http://openfoamwiki.net/index.php/Contrib_PyFoam, last access: 30 June 2022) and Octue SDK (https://github.com/octue/octue-sdk-python, last access: 30 June 2022) to create a pipeline capable of automatically running 2D airfoil simulations with varying inputs. The inputs are sampled from their presumed probability distributions. The simulated data are used as a training dataset for machine learning algorithms and for the purposes of uncertainty quantification.
-
Construct 2D meshing utility. This software creates structured, high-quality 2D airfoil meshes. The modified version of the software developed by Fraunhofer IWES (https://gitlab.cc-asp.fraunhofer.de/iwes-cfsd-public/wtrb-aerodynamics/c2d-ext, last access: 30 June 2022) was wrapped with Octue SDK and implemented as a child process for the OpenFOAM service.
-
XFOIL. Python-wrapped version of XFOIL called xfoil-python (https://github.com/DARcorporation/xfoil-python, last access: 30 June 2022), developed by DARcorporation was further wrapped with Octue SDK and deployed on the cloud. During verification and validation, several bugs were discovered, and fixes were implemented in the xfoil-python GitHub main branch.
-
OpenFAST (https://www.nrel.gov/wind/nwtc/openfast.html, last access: 30 June 2022). The software was wrapped using NREL-developed Python tools. The basic Octue SDK wrapper was defined to take site wind conditions, generate inflow data via TurbSim and perform an aeroelastic simulation with the AVENTA wind turbine model.
Following the initial design of the system, the sensor node was built and tested for the first time on a rotating wind turbine model in the small-scale wind tunnel at OST in Rapperswil-Jona, Switzerland. The primary goals of these tests were to evaluate how hard it was to design and build flexible printed circuit boards (PCBs) and solder sensors, to evaluate the firmware and the Bluetooth communication in a windy and rotating environment, and to extract the first results and see what we could expect, as well as to gain experience with the system.
For these first tests, no measurement sleeve was used as the focus was on the electronics and the communication. A set of sensors (barometers, microphones, IMU) were preliminary chosen, and a microcontroller with a Bluetooth connection and its firmware was developed. The system consists of 40 ST LPS27 absolute pressure sensors and 10 InvenSense ICS-43434 acoustic sensors installed on a flexible PCB. The system was then installed on the blade of a small-scale vertical axis wind turbine inside the OST wind tunnel, with a blade chord length of 70 mm, a blade height of 0.5 m and rotor radius of 0.35 m, as shown in Fig. 6. Measurements were made at a range of wind speeds of 0 to 7.5 m s−1 and a rotation speed range of 0 to 345 rpm, to reach a range of tip speed ratios between 0 and 6.3 and a Reynolds number based on the incoming wind velocity and on the chord of the airfoil on the order of 10 000.
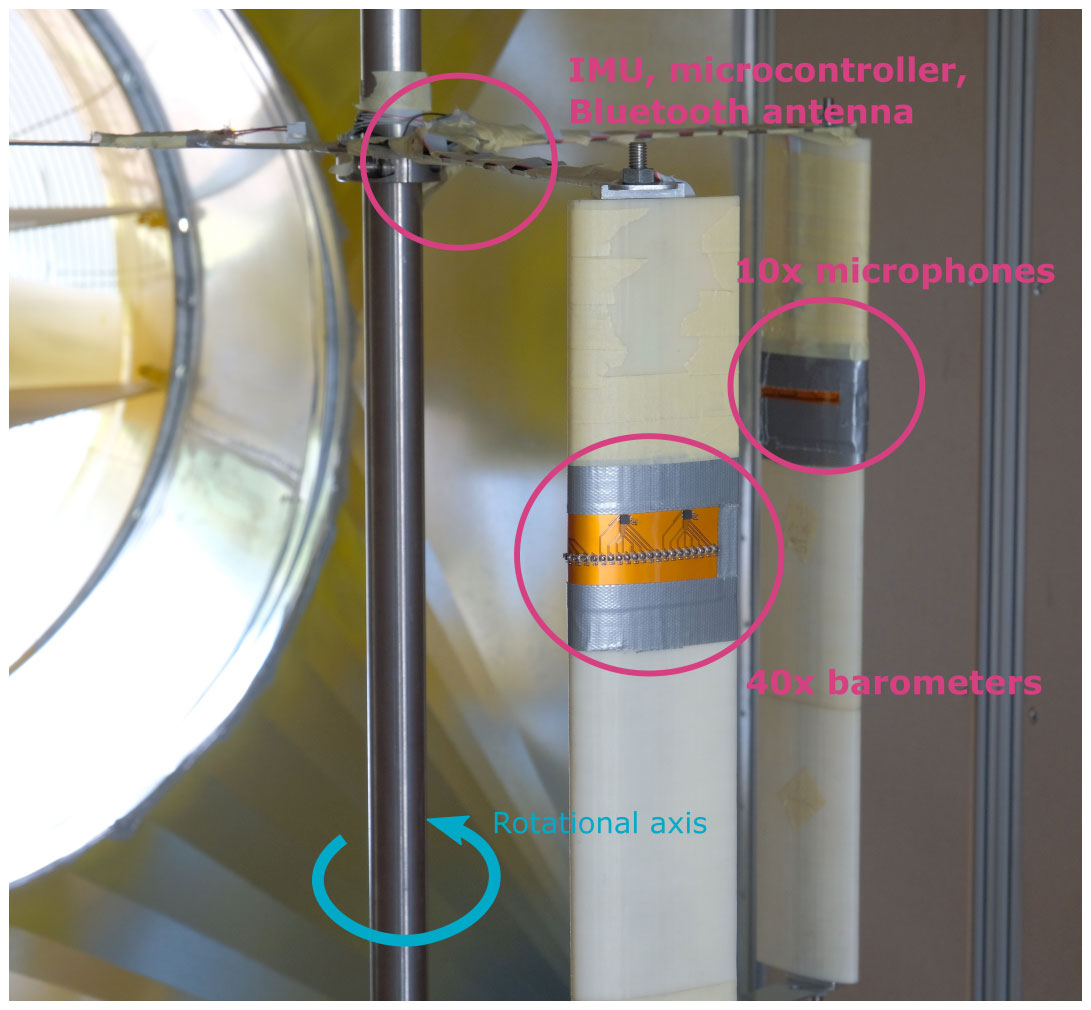
Figure 6Layout of the first version of the Aerosense system on a vertical axis wind turbine in the OST wind tunnel.
A phase-averaged pressure distribution during the complete rotation of one blade is presented in Fig. 7 for a tip speed ratio of 2. On the vertical axis, the zero line represents the leading edge of the airfoil. Negative values towards −1 show the pressure on the inner side of the airfoil, and those towards +1 show the pressure on the outer side of the airfoil. The horizontal axis represents the position of the blade during the rotation around the vertical axis. The blade starts with the leading edge of the blade facing upwind, and at , the blade is at its upstream position, while at , the blade is in the downwind situation. The position of the blade is known thanks to the IMU of the measurement system. The red colours indicate when and where most of the aerodynamic force is generated. As known in the literature (among others, Li et al., 2013; Rossander et al., 2015; Delafin et al., 2017; Barber and Nordborg, 2018), due to a large variation in the local angle of attack of the blade, the suction is mostly on the outer side of the airfoil but is present on the inner side when the blade is in the upstream part. It can be seen that these variations are well captured by the measurement system.
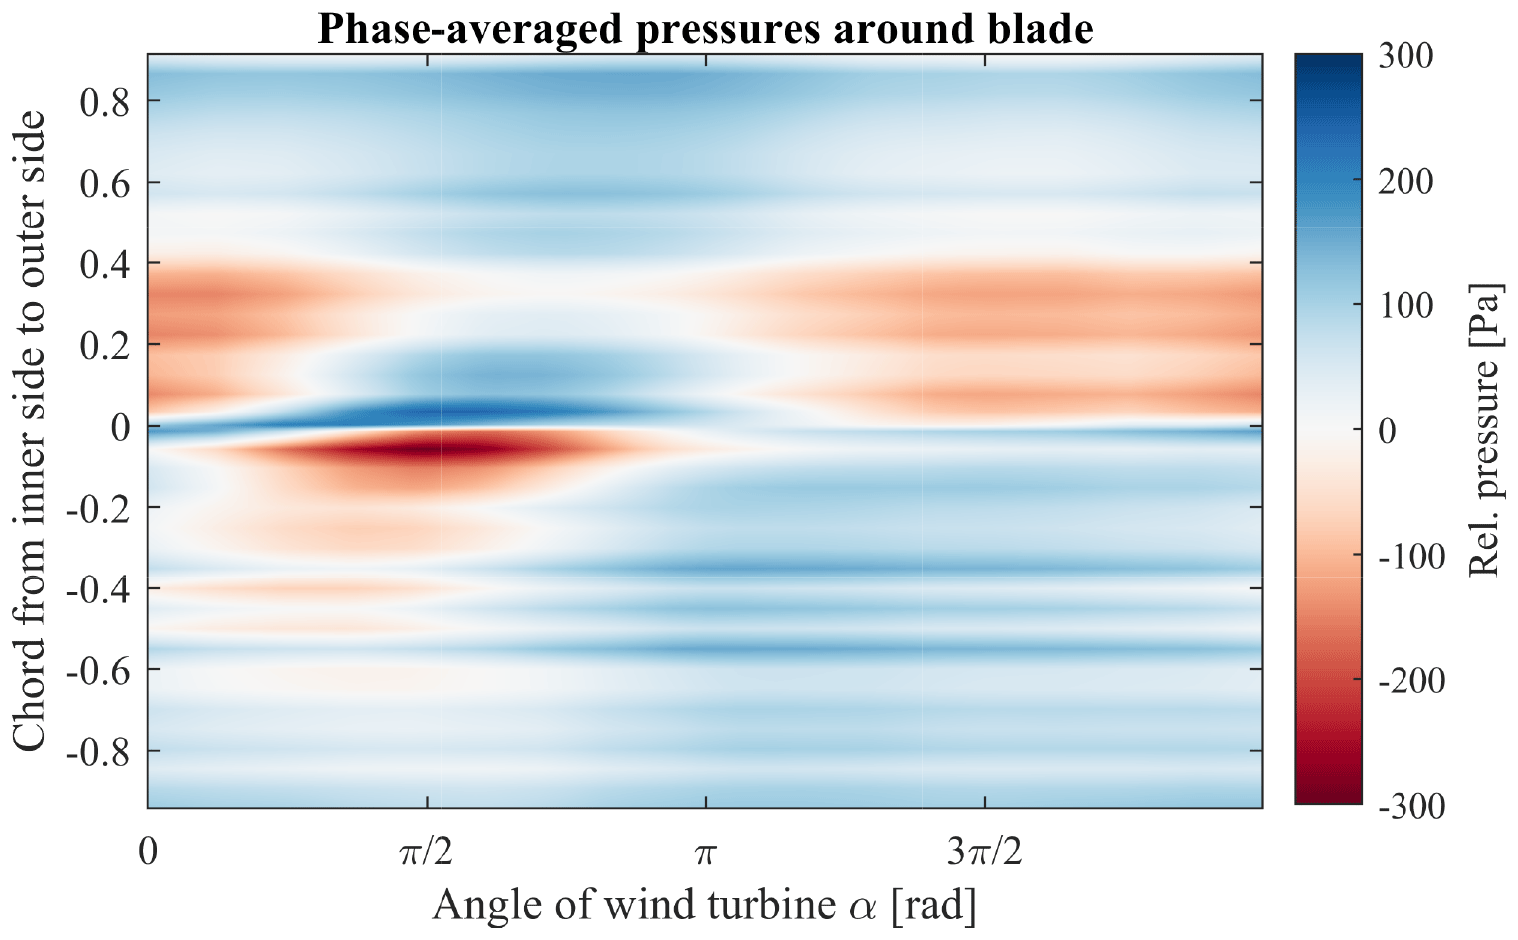
Figure 7Phase-averaged pressures around the blade for a complete turn of the blade of the vertical axis wind turbine at a tip speed ratio of 2. Negative chord is the inside of the blade, zero the leading edge and positive chord the outside of the blade.
As the measurement system has not been designed to measure such low-pressure variations and for such a small blade without smooth housings (here 70 mm, while blades where the system will be installed have a size on the order of 1 m or more), further investigations into the physical meaning of the measurements are not carried out here.
The main outcomes of these tests were as follows:
-
The measurement system can be installed on an airfoil and can record and transmit data even if it is in rotation with an incoming wind.
-
Retrieving the “zero” value (when there is no wind) from the measurement system is of primary importance to achieve accurate results.
-
The centrifugal acceleration should be taken into account. Preliminary tests showed there could be a bias of 5 Pa g−1. On multi-megawatt wind turbines, acceleration can reach 100 m s−2, which would affect the sensor measurement by 50 Pa.
The measurement results show that the system is capable of delivering relevant results continuously, although work needs to be done on calibrating and correcting the pressure signals as well as on refining the concept for the attachment sleeve for weather protection in the field. Ongoing work involves field tests on a 6 kW operating wind turbine in Switzerland.
In this section, two applications of the measurements that could provide added value to the wind energy industry are demonstrated: (1) inferring the local angle of attack and (2) detecting and classifying leading edge erosion (LEE).
4.1 Inferring the angle of attack
In this part, a method for deducing the local angle of attack using the measured pressure gradient near the leading edge is investigated and demonstrated using a set of wind tunnel measurements. The method involves utilising differential pressure sensors. Small variations in the angle of attack or/and wind speed will change the pressure gradient at the leading edge, which can be captured by differential pressure sensors. Differential pressure sensors do not require the use of a known reference pressure, commonly located far upstream or in an area with no wind. While it can easily be acquired in a controlled environment, such as in a wind tunnel, a known reference pressure is much more complicated to acquire on a wind turbine. Differential pressure sensors work on a smaller measuring range than absolute pressure sensors and are therefore more sensitive and able to detect smaller variations in pressures and therefore angles of attack. In the Aerosense system, the differential pressure sensors use the same reference pressure point, P0, which is an arbitrary point located in the leading edge region (Fig. 9). Discrete values of pressure difference at the leading edge with an arbitrary point (Pi−P0) are used to interpolate the pressure gradient due to a specific incoming flow (angle of attack and wind speed) passing around the leading edge (Fig. 10). The measured variations in pressure are fed into an algorithm based on a potential flow model passing a parabola (Saini and Gopalarathnam, 2018) to estimate the angle of attack and the incoming flow velocity without the need for external measurements and reference pressure.
The feasibility of the method has been demonstrated on a 3D-printed NACA0018 profile section in the sub-sonic wind tunnel at ETH Zurich, Switzerland, as shown in Fig. 8. The airfoil was designed and 3D-printed specifically for these tests with a chord of 25 cm and a span of 1 m. A set of 40 flush-mounted pressure taps were integrated at mid-span for reference, with corresponding digital pressure transducers. The blade was designed to be tilted 10∘ backwards to mimic a spanwise component of the flow that is similar to what could be found on a wind turbine blade and was fitted with three different barometer strips installed at 150 mm below mid-span and 150 and 250 mm above mid-span. The measurements were used for various other tests and comparisons within the Aerosense project. Loads exerted on the blade were acquired by a 6-degrees-of-freedom balance. In order to test the method of inferring the angle of attack, tests were made within a static angle-of-attack range of −30 to 30∘, at three different wind speeds (10, 30 and 50 m s−1, resulting in a range of Reynolds numbers based on the chord of the airfoils between 2×10⁵ and 8×10⁵). The results presented in the present paper are for a non-tilted blade.
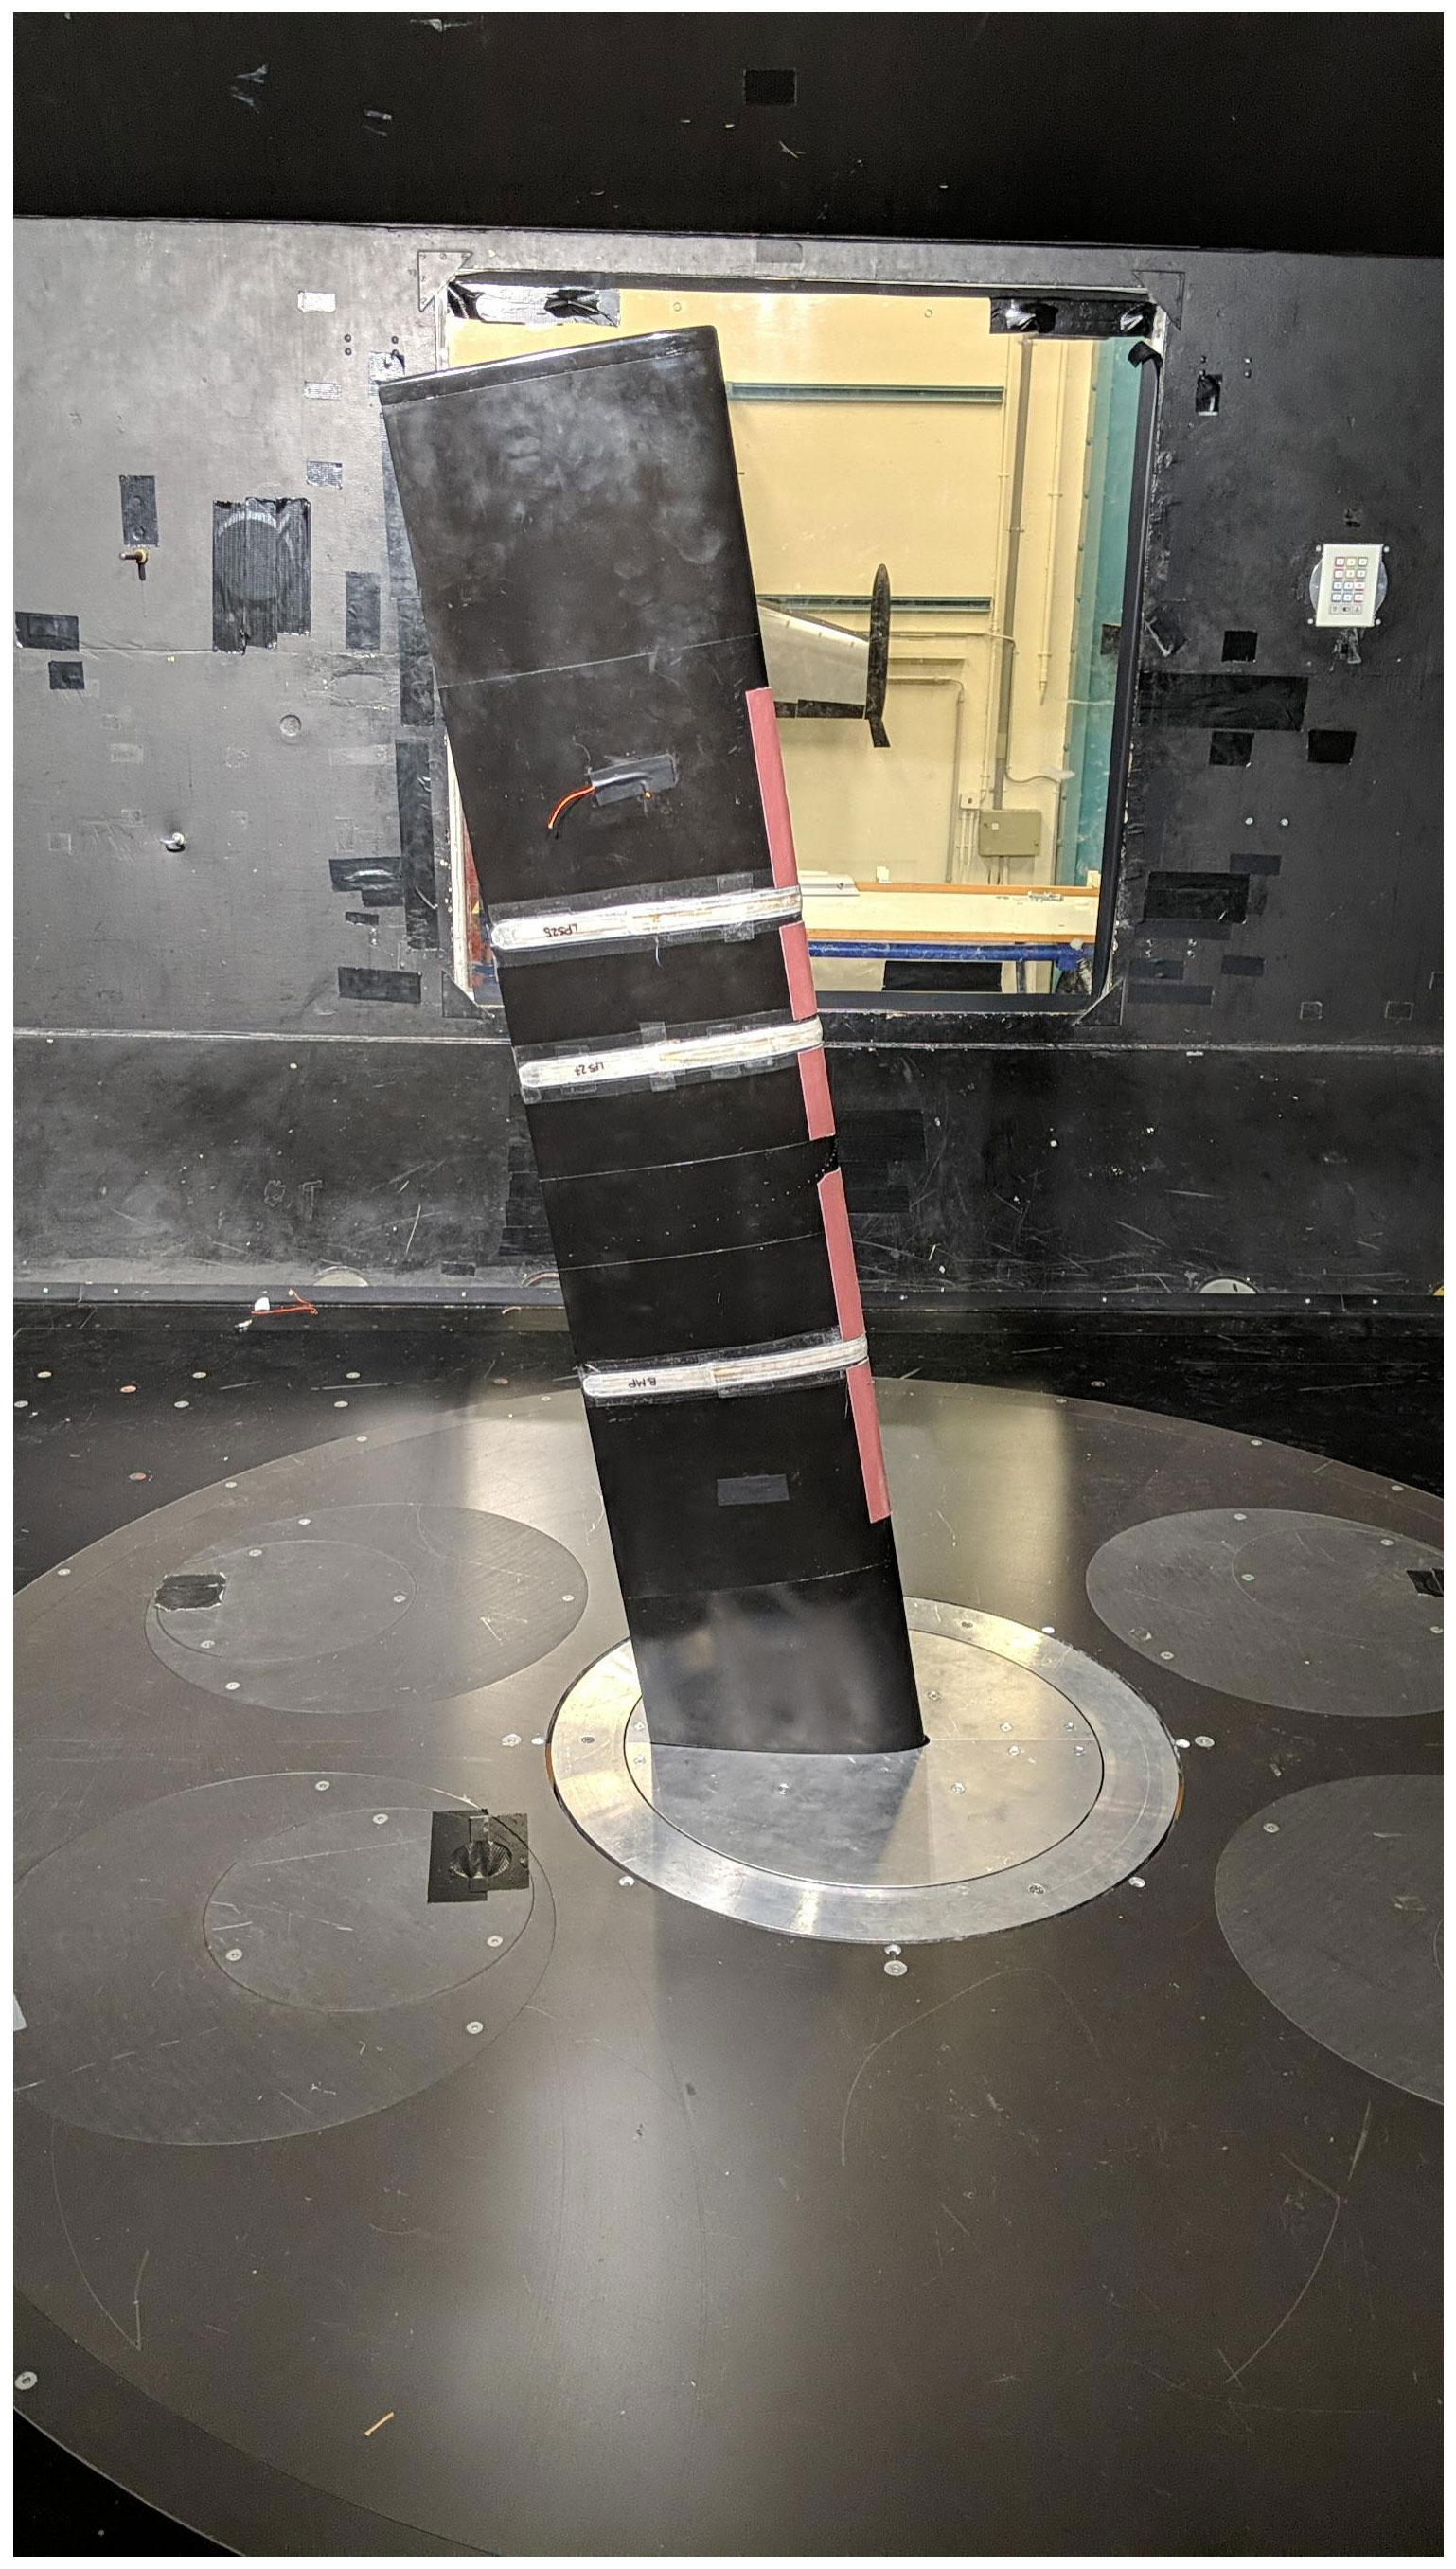
Figure 8A 3D-printed NACA0018 blade installed in the test section of the ETH Zurich wind tunnel. The blade is in the 10∘ tilted configuration, with three barometer strips installed and sandpaper at the leading edge.
Figure 10 presents the pressure values in the leading edge region in the first 10 % of the chord, from the 40 pressure taps with an arbitrary P0 reference point. The horizontal axis η corresponds to a non-linear curvilinear axis linked to the parabola fitting (Ramesh, 2020), which enhances the gradient of pressure at the leading edge. The coordinates η are linked with the chordwise coordinates of the airfoil x thanks to the leading edge radius rle: .
The thick black line is created thanks to the values of five chosen pressure points, shown in colour in Figs. 9 and 10, that are used to fit the analytical pressure distribution of a flow passing a parabola. The measured pressure distribution at the leading edge can be well represented by an inviscid flow passing a parabola.
This pressure distribution passing through a parabola depends on the stagnation point and the flow velocity. From the stagnation point, it is then possible to retrieve the angle of attack in a look-up table.
This stagnation point method has the advantage of being applicable to three-dimensional flow that can occur on operating wind turbines. Traditional methods of obtaining or inferring the angle of attack such as the inverse blade element momentum (BEM) method or three-point method (Vimalakanthan et al., 2018), are limited by the fact that the definition of the angle of attack involves assuming that the flow remains inside a two-dimensional plane, as is the case for wind tunnel tests. On a rotating wind turbine, however, the flow can be three-dimensional; hence a true angle of attack in this sense cannot be defined. Moreover, the incoming flow gradually decreases approaching the blade due to the induction; hence it is not possible to assess a “true” incoming wind velocity as is the case in a wind tunnel, and to build a correct vectorial combination to evaluate the relative wind speed on the rotor blade.

Figure 9Sketch of differential pressure sensors at the leading edge. The reference pressure P0 is taken at a point in the leading edge area on the pressure side. Four other sensors record the difference in pressure between their locations and the reference pressure.
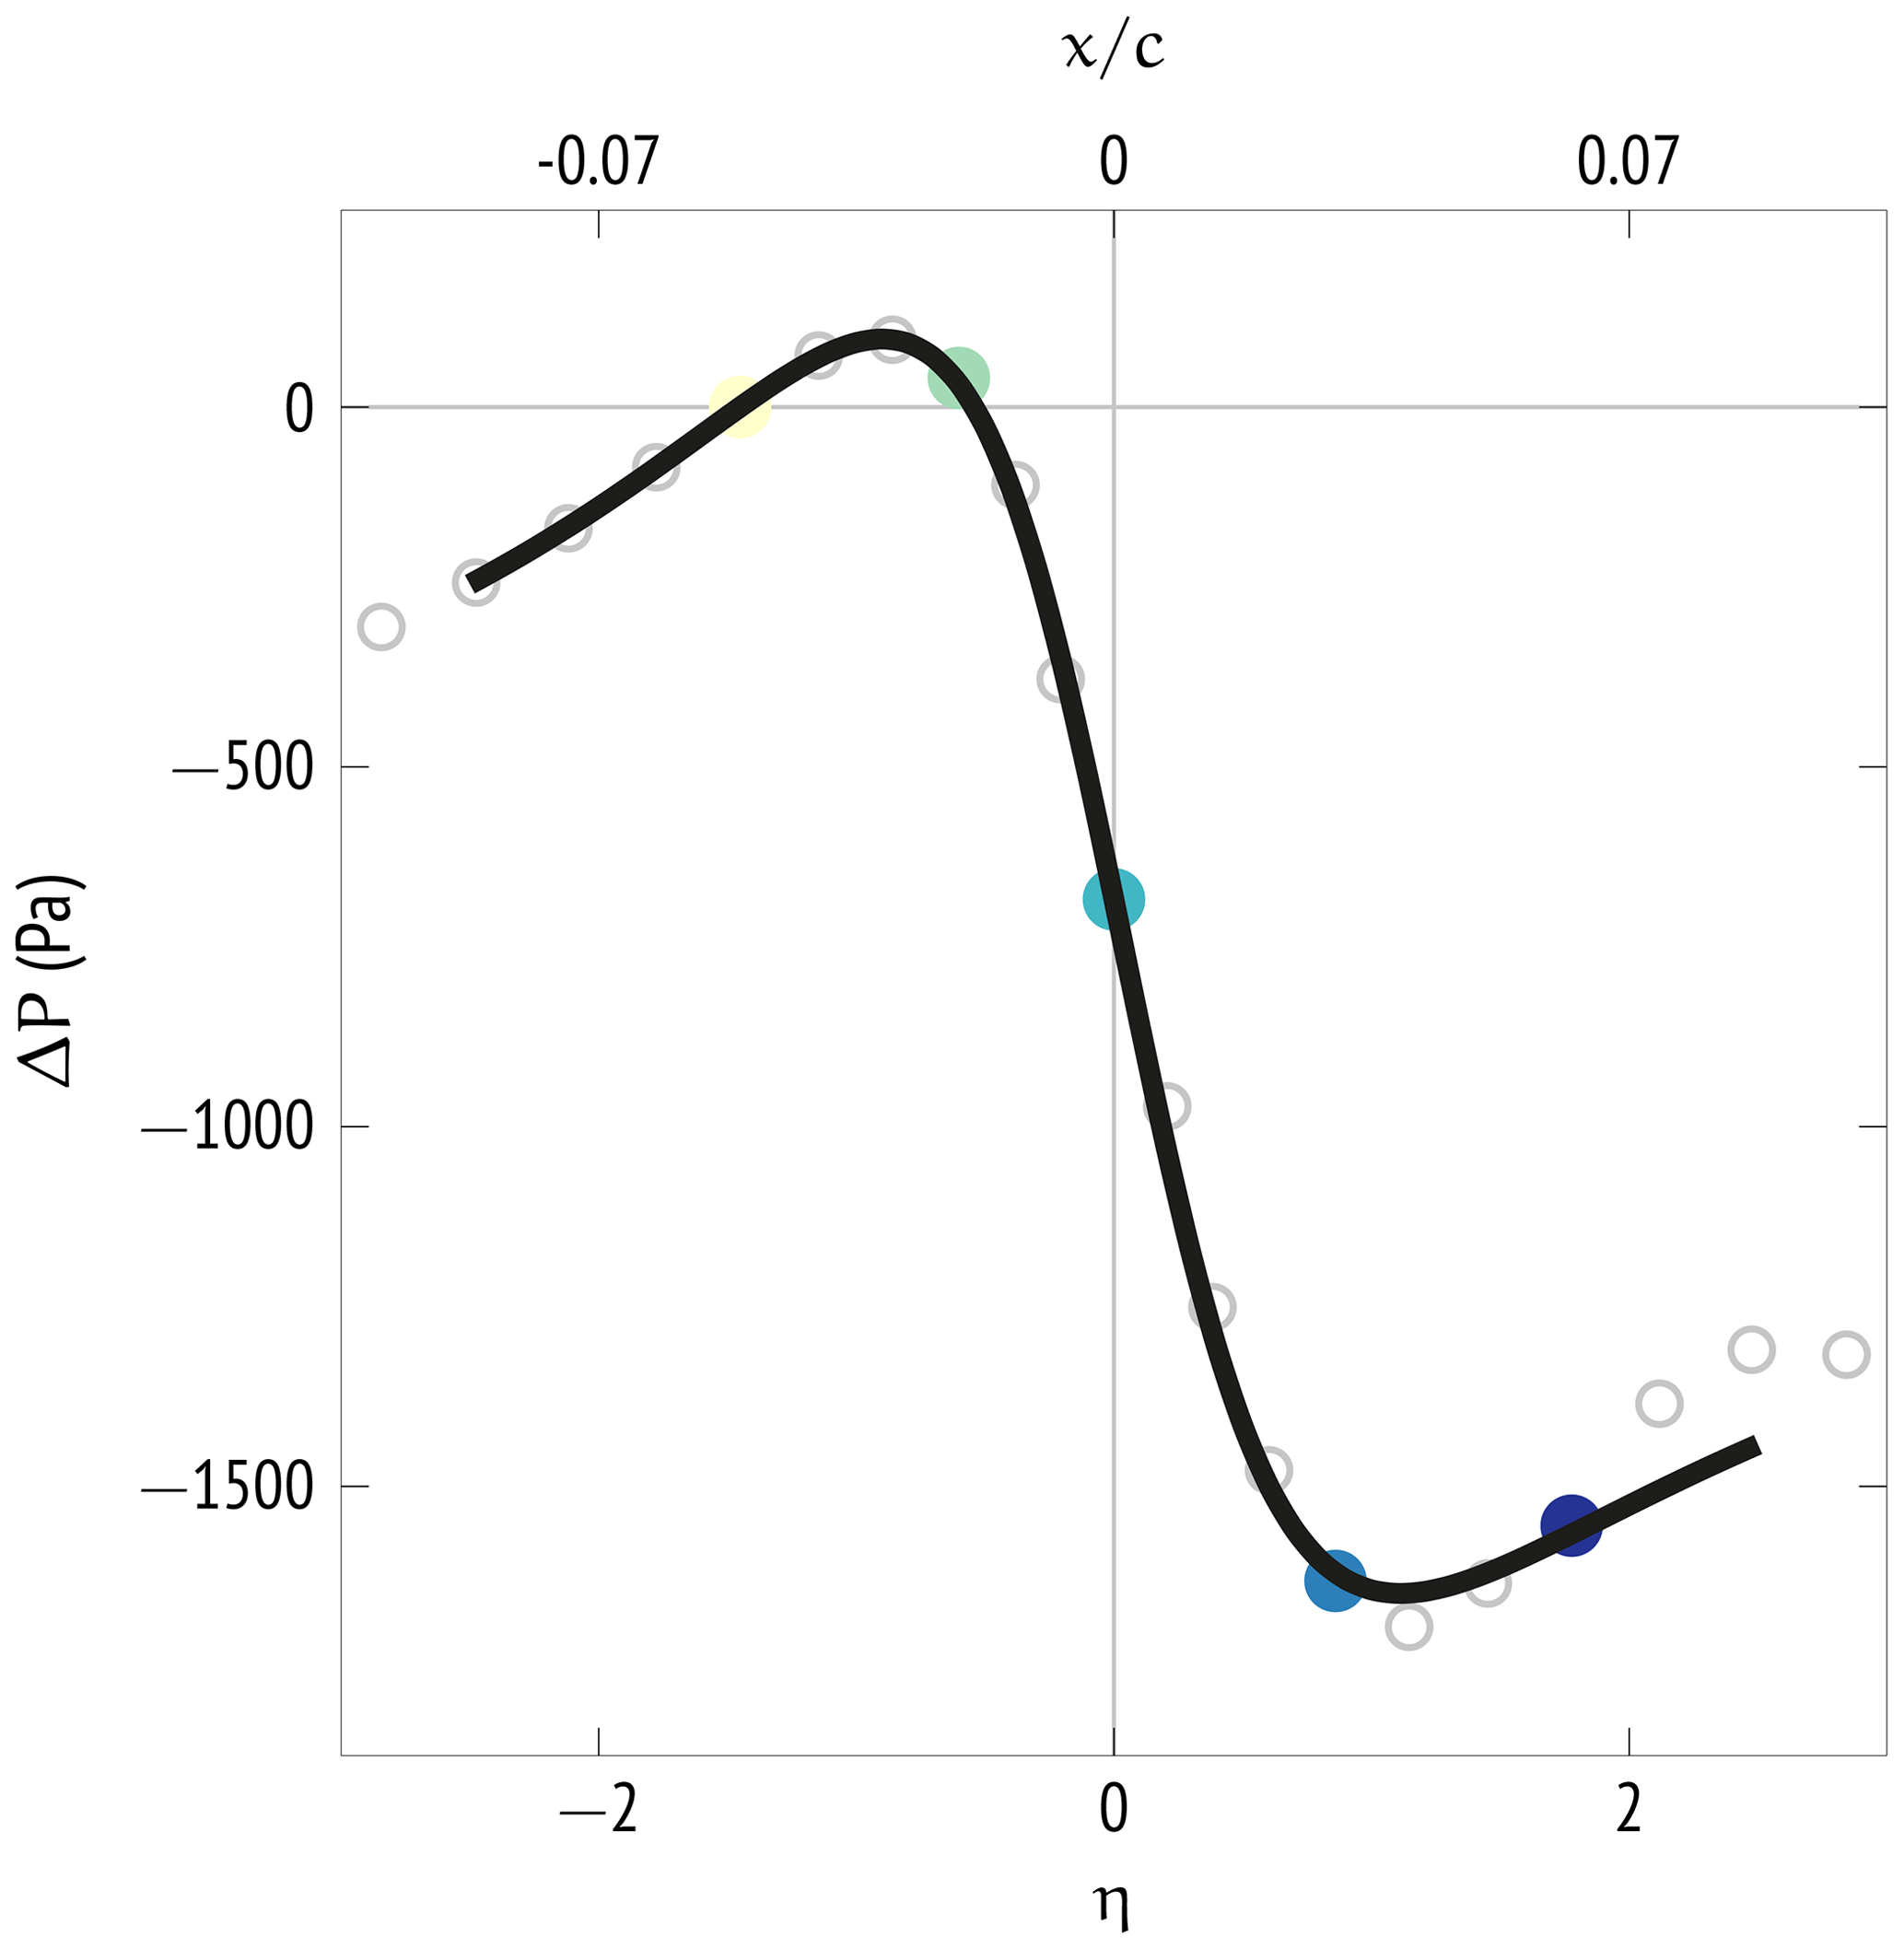
Figure 10Pressure distribution at the leading edge. Coloured points represent the values from the differential pressure sensors shown in Fig. 9. The other empty circles represent values from other pressure points. The thick black line is the result of an inviscid flow passing a parabola modelling the leading edge.
The results are shown in Fig. 11, in which the position of the stagnation point based on the inviscid flow model using only five differential pressure points in the first 5 % of the chord for different wind speeds can be seen. For comparison, the location of the maximum of pressure, which is the dynamic pressure at the stagnation point, has been found using the 40 flush-mounted pressure taps at the mid-span of the airfoil (see crosses in Fig. 11). Our method finds the same stagnation point position as the pressure taps, even when the flow starts to detach near the trailing edge (above 10∘). The method is not as accurate for angles of attack larger than the stall angle of the airfoil, as expected. For wind turbine applications, the optimal working range of the angle of attack is below the stall angle, where this method performs well.
From the stagnation point, it is possible to retrieve the angle of attack using a look-up table built with XFOIL in this case (Fig. 12). The estimated angle of attack is slightly lower than the actual angle of attack set in the wind tunnel if the stagnation point positions found in XFOIL and with pressure taps are compared. As long as the angle of attack is not greater than the stall angle, the error is not larger than ±2.5∘ with the look-up table using XFOIL. More precise measurements and corrections of the experimental data as well as more accurate simulations would probably help in reducing this gap. For example, the angle of attack inferred from the stagnation point using the dense flush-mounted pressure taps and the angle of attack from this method have a difference of less than half a degree and would be satisfactory for a non-intrusive method based on MEMS differential pressure sensors.
Further experiments were carried out with a roughened leading edge (using sandpaper) and a tilted wing in order to test the robustness with leading edge erosion and with three-dimensional flow. The estimation of the stagnation point position remained as precise as with a clean airfoil. This angle-of-attack estimation method seems therefore adequate for wind turbine purposes. Ongoing work involves testing the system in the field, as well as quantifying the effect of the measurement system itself on the flow and corrections developed if necessary.
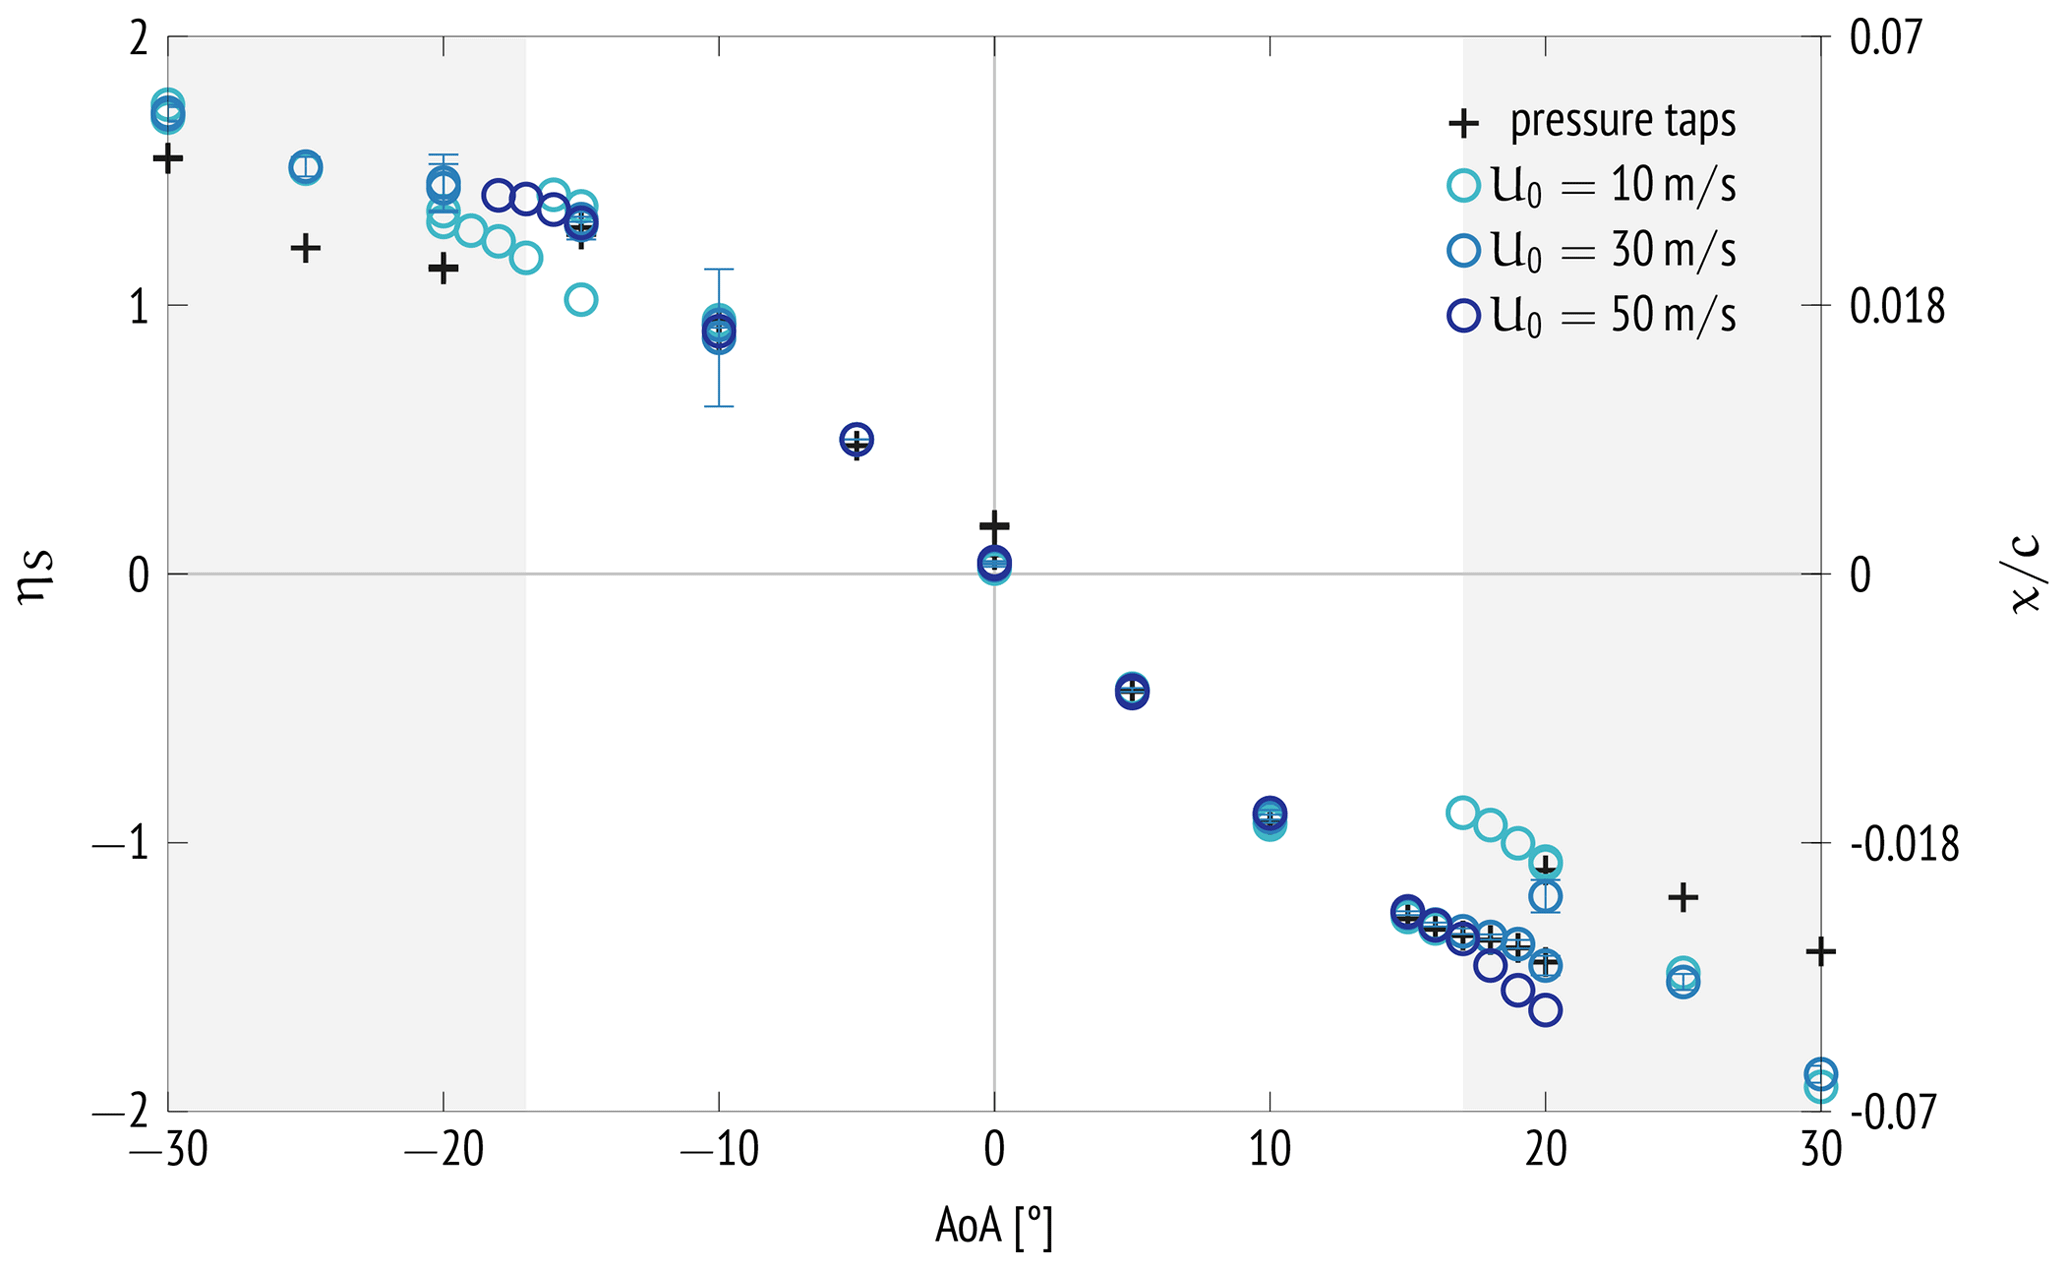
Figure 11Position of the stagnation point for different angles of attack (AoAs) at different wind speeds on a NACA0018 based on five differential pressure measurements at the leading edge (circles) and by finding the maximum of pressure using 40 flush-mounted pressure taps at 30 m s−1 (crosses). Shaded areas show the stall region of the airfoil.
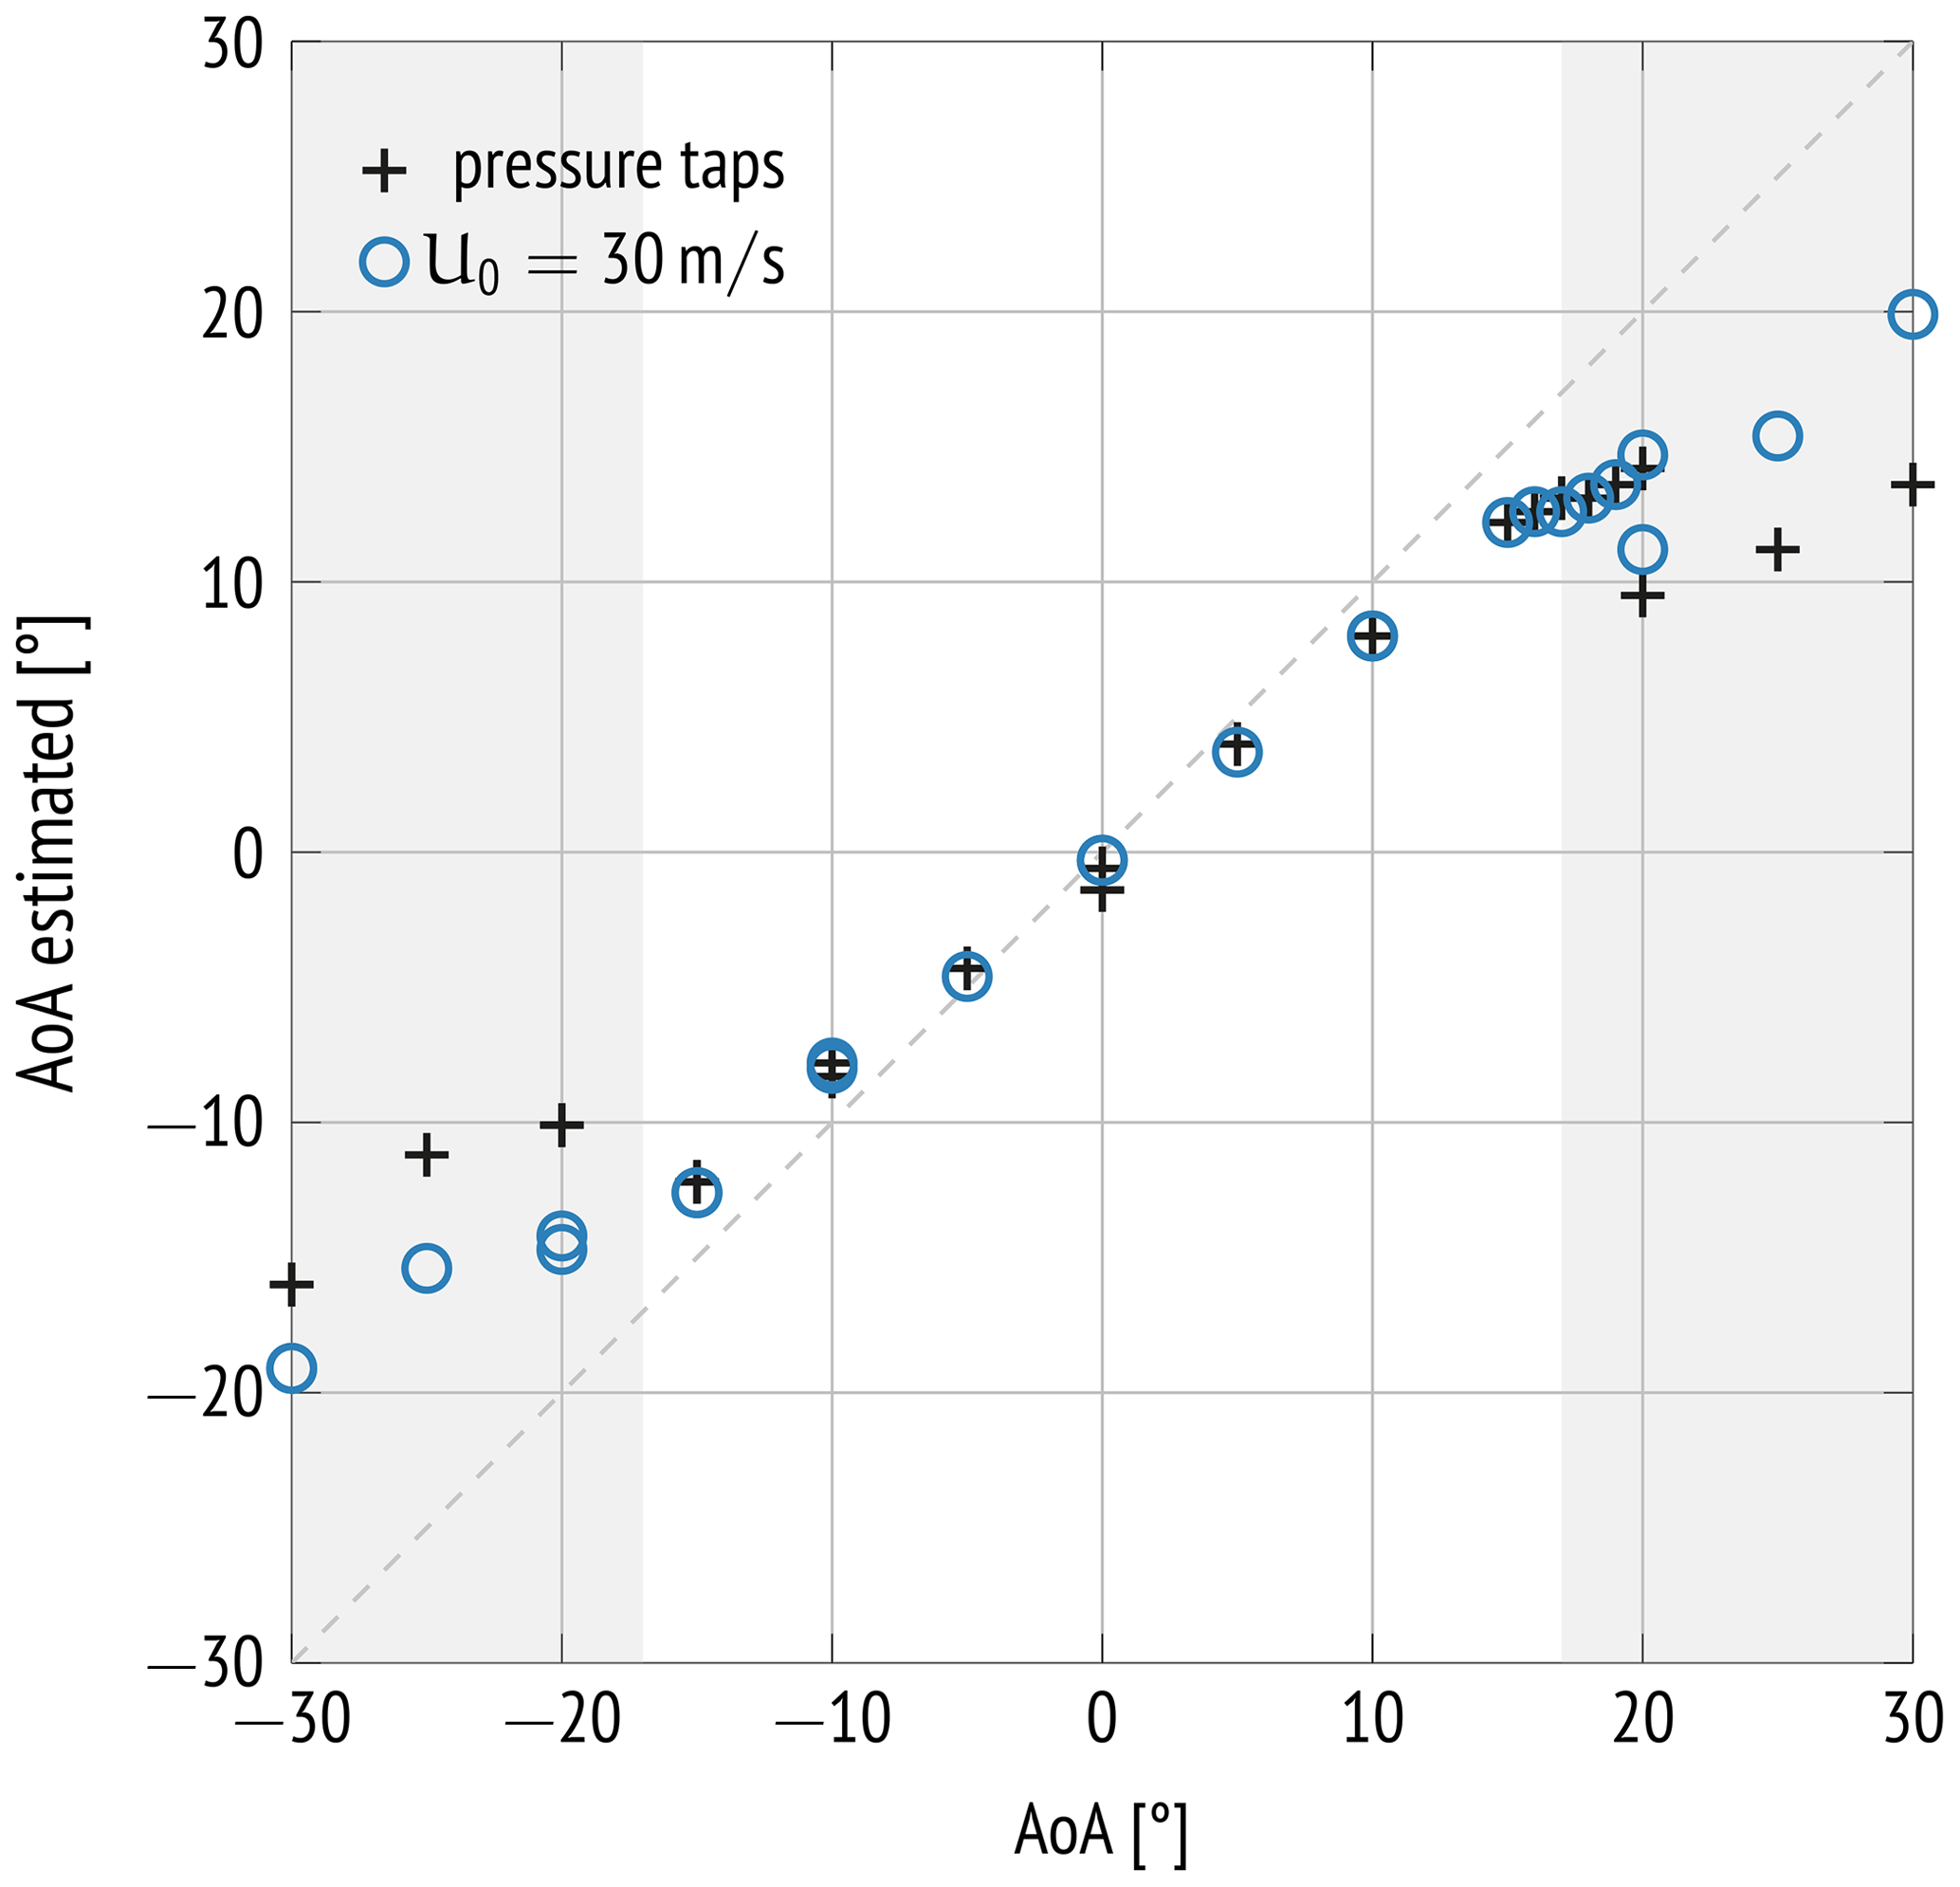
Figure 12Estimation of the angle of attack using our method and a look-up table. Comparisons with estimation of the angle of attack from pressure taps are shown with the crosses.
4.2 Detecting and classifying leading edge erosion (LEE)
In this part, data-driven methods for learning to diagnose LEE on an airfoil via aerodynamic pressure coefficients are investigated and demonstrated using aeroelastic simulations and computational fluid dynamics (CFD). The existing measurements could not be used for the demonstration because measurements are not available for different levels of LEE from this measurement campaign.
Two approaches can be taken to diagnose the severity of LEE using the aerodynamic output streaming from the Aerosense device. It should be noted that any LEE on the blade will be covered up at the exact location of the sensors during the measurement campaign and therefore can only be detected if the damage affects a region wider than the measurement node sleeve width in the spanwise direction. This is expected to be the case. Despite covering a portion of the blade, the overall aerodynamic performance will be degraded by LEE, which is potentially detectable. A first approach involves the use of time series of integrated pressure quantities (lift and drag), while the second utilises instantaneous snapshots of the pressure field. In essence, the first approach focuses on the temporal component, while the second concentrates on the spatial aspect.
For the first approach, a necessary prerequisite is the modelling and simulation of the aeroelastic response of a wind turbine undergoing blade LEE. In order to do this, a pipeline was developed as follows. The time-dependent degradation process affecting the aerodynamic properties of a blade is modelled with a non-homogeneous compound Poisson process (Duthé et al., 2021), a stochastic process which parametrises the cumulative damage on a blade section caused by the arrival of random degradation-inducing shocks. The aeroelastic response to this degradation is then simulated by coupling this process to OpenFAST (an aeroelastic wind turbine simulator), under uncertainty in the environmental conditions. This simulation pipeline is used to generate a dataset of aeroelastic time-series data (wind inflow velocity, angle of attack, lift and drag coefficients) corresponding to different categories of LEE severity. Then, a transformer neural network (Vaswani et al., 2017) is trained on this database in a supervised manner, such that when it is given a multivariate time-series input, it outputs a prediction for the severity of LEE. More information on this approach can be found in Duthé et al. (2021). The results showed that transformers are a promising method for diagnosis of such degradation processes. The attention-based mechanism allows a focus on different features at different time intervals for better prediction accuracy. This is especially important for long time-series sequences typical of a slow degradation process.
The second approach also involves computationally generating training data, albeit via CFD simulations in this case, as shown in Fig. 13. In order to create a robust training dataset which encompasses a reasonably wide variety of operational conditions, in the first step the 2D CFD input parameters (inflow velocity, turbulence intensity, angle of attack, roughness height, chordwise extension of LEE roughness) are modelled as probabilistic variables. A suitable distribution is formulated for each variable; for instance the inflow velocity follows a Weibull distribution and further accounts for wind turbine revolutions per minute (rpm), while the distribution for roughness parameters is devised based on the work of Sareen et al. (2014). A preliminary dataset is established with around 300 unique combinations. Additionally, a variational auto-encoder (Kingma and Welling, 2013) is trained on the UIUC airfoil database (Selig, 1996) to construct a distribution of airfoil shapes (step 2), which can then be sampled from in order to generate realistic, yet unique, airfoil shapes to be used as the basis for the simulation meshes (step 3). Samples are then drawn from the distributions both for the flow conditions and for the airfoil shapes, such that a database of unique CFD simulation inputs is created. In step 4, each simulation is then executed in OpenFOAM using a k–ω shear stress transport (SST) Reynolds-averaged Navier–Stokes (RANS) model with modified rough wall functions, as suggested in Knopp et al. (2009). Airfoil surface pressure coefficient data are extracted from the converged simulations and stored along with the corresponding roughness label, thus forming the dataset upon which an adapted point cloud neural network (Qi et al., 2017) is trained in a supervised manner in step 5. The resulting algorithm is able to output predictions for leading edge roughness, given an input of surface pressure coefficients.
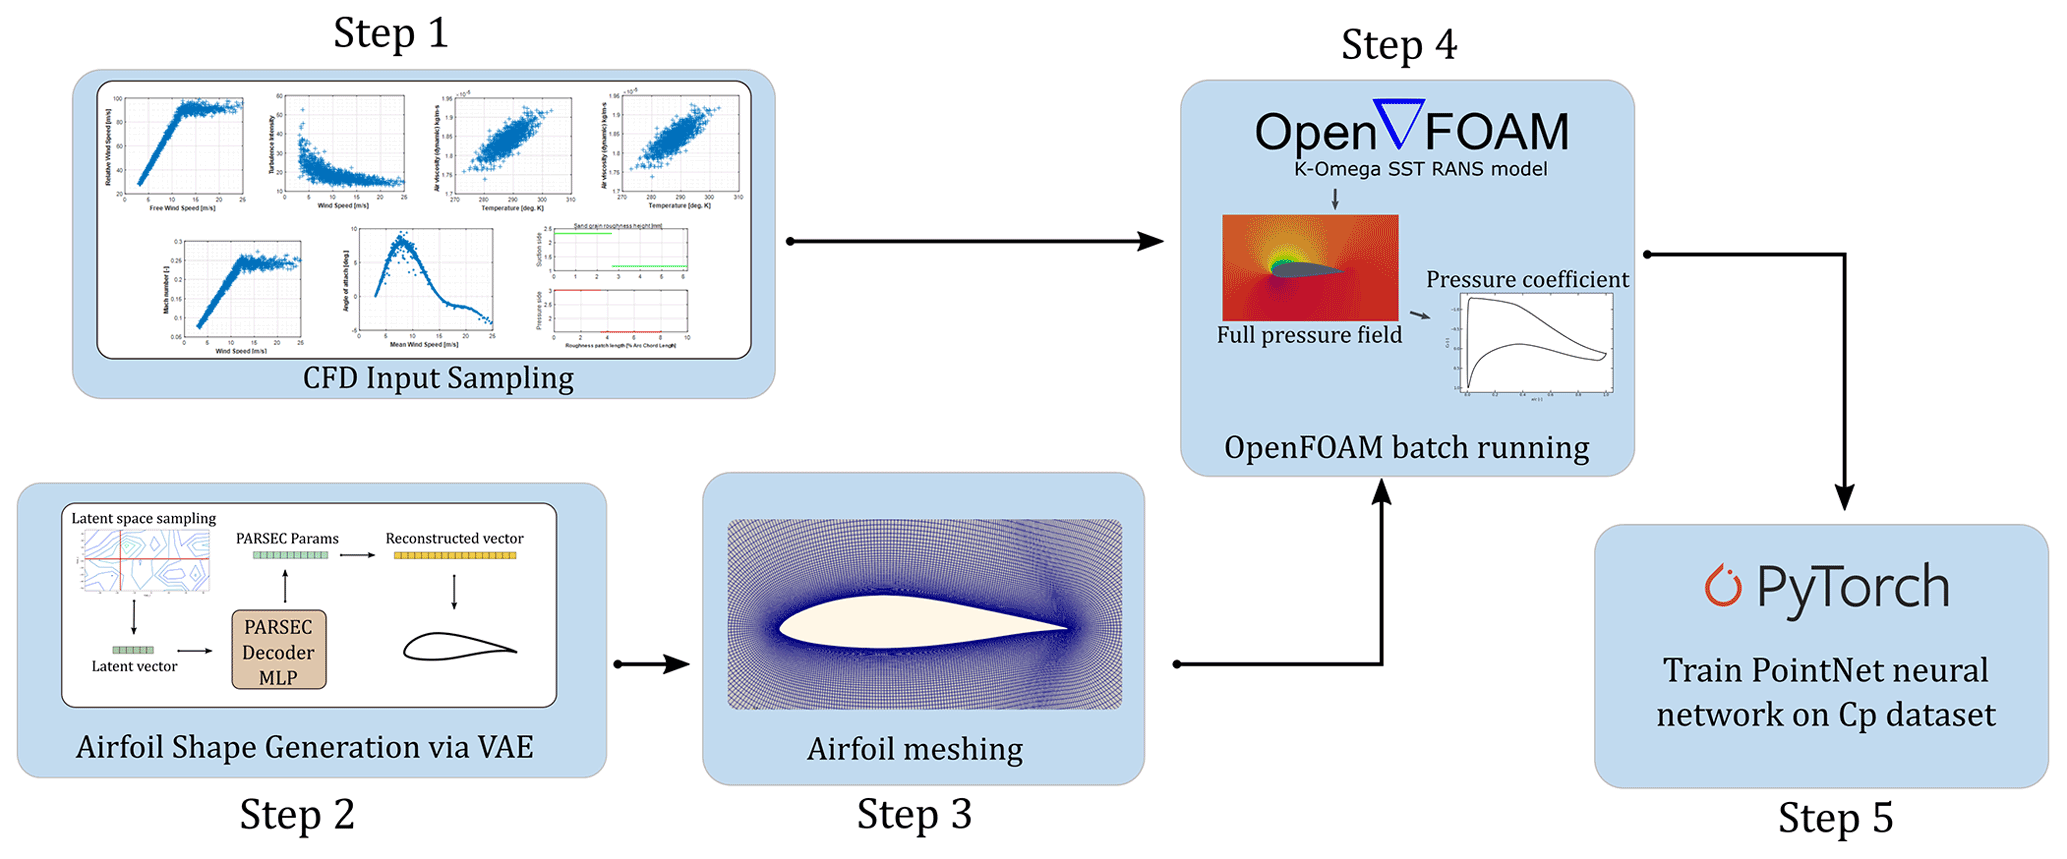
Figure 13Overview of the proposed approach to simulate aerodynamic pressure coefficient data under diverse conditions of LEE, which are then used to train a neural network for diagnostics purposes.
The results show that through this method, it is possible to estimate the leading edge roughness, given the pressure distribution on the airfoil surface. Preliminary findings indicate that prediction quality is dependent on the angle of attack, as highlighted in Fig. 14. This figure plots the distribution of roughness prediction errors against the angle of attack for the validation dataset. It can be seen that for higher angles of attack, the number of predictions with large errors increases. This aligns well with our expectations: at high angles of attack, minor perturbations in the pressure field caused by increased leading edge roughness may be secondary to fluctuations induced by a detached flow. Furthermore for situations with small amounts of leading edge erosion, we notice large relative prediction errors. This outcome is also in line with our presumptions as in these cases we expect that the flow will only be modestly affected by small increases in leading edge roughness.
Further work in this matter should focus on extending these methods to real experimental data measured by the Aerosense system, as they become available. To bridge the gap from simulated data to real aerodynamic measurements, it will be necessary to ensure that the training data are physically suitable. This can be achieved either by using more complex physical simulations, such as unsteady CFD simulations with a large variety of input turbulent inflow conditions (including airfoil heaving, pitching and stalling), or by developing a framework which accounts for CFD model inaccuracies and uncertainties. Methods from the field of transfer learning could also be of interest here. Furthermore, mitigation strategies and different architectures should be explored to overcome the challenges in predicting erosion for situations with low degradation severities or at high angles of attack. One class of architectures that could be well suited for this use case comprises graph neural networks (Scarselli et al., 2008; Pfaff et al., 2020) as these network structures not only enable the representation of positional information but also allow for temporal updating and therefore dynamics.
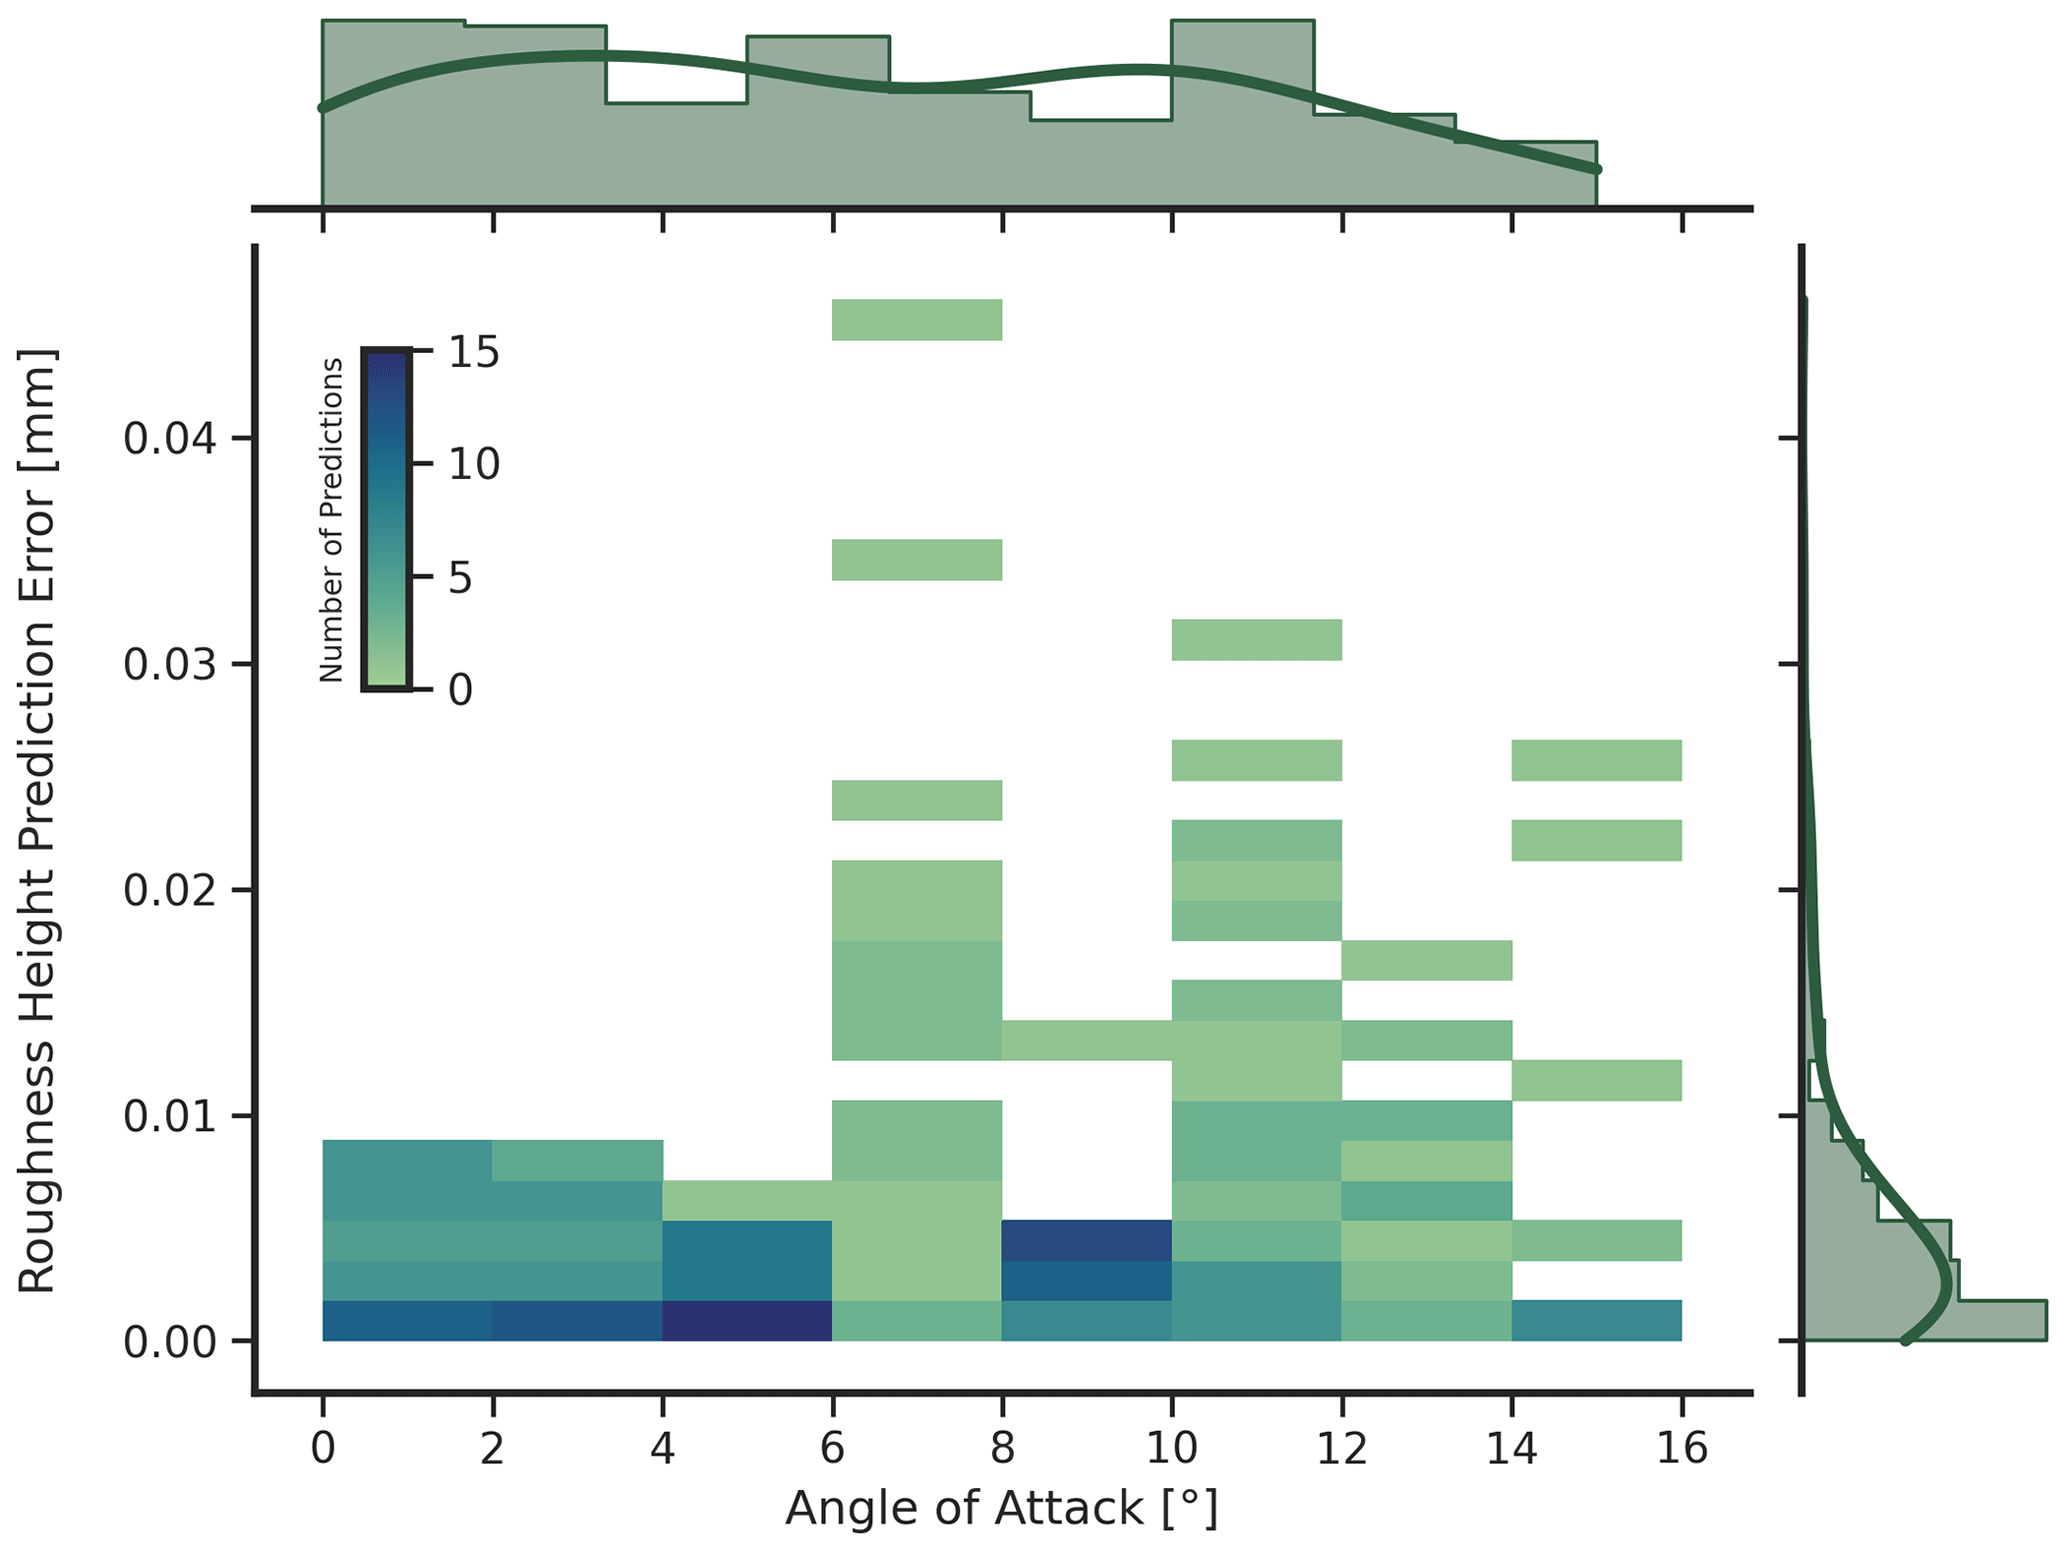
Figure 14Error in the prediction of equivalent sand grain roughness height as a function of the angle of attack gathered on the validation dataset. The x-axis histogram gives an indication of how the angle of attack is distributed over the validation set. Prediction quality appears to decrease for higher angles of attack; nevertheless most of the prediction errors are distributed below 0.01 mm, as highlighted by the y-axis histogram.
A cost-effective MEMS-based aerodynamic and acoustic wireless measurement system that is thin, non-intrusive, easy to install, low power and self-sustaining has been designed based on a set of requirements and use cases obtained from interviews with the wind energy industry. The system consists of three sub-systems: (1) the sensor node, (2) the base station and (3) the digital twin on the cloud.
The sensor node includes a long-range and low-power Bluetooth communication at 1 Mbps with a maximum coverage above 200 m, support for up to 40 MEMS absolute pressure sensors (barometers) sampled at 100 Hz, up to 10 wide-range MEMS microphones sampled at 16 kHz, and up to five differential pressure sensors sampled at 100 Hz, as well as 512 MB on-board flash memory, a MEMS IMU sampled at 1 kHz and a solar energy harvester. The electronics are embedded into a custom-made PolyJet 3D-printed sleeve, which is fixed onto the blade with the same type of adhesion tape that is used for leading edge protection of wind turbine blades.
The software layer of the digital twin system includes a data pre-processor to collect, timestamp, clean, correct, calibrate and store the measurement data as well as the external data collected; inverse problem solvers to infer quantities such as the angle of attack and the leading edge erosion class; forward problem solvers to predict non-measured quantities such as the structural deformation of the blade; data analysis algorithms that compute derived quantities such as the lift and drag coefficients; and dashboards to display and download the results.
The sensor node was built and tested for the first time on a rotating wind turbine model in the small-scale wind tunnel at OST in Rapperswil-Jona, Switzerland. The results show that the system is capable of delivering relevant results continuously, although work needs to be done on calibrating and correcting the pressure signals as well as on refining the concept for the attachment sleeve for weather protection in the field.
Finally, two methods for using the measurements to provide added value to the wind energy industry were developed and demonstrated. A method for inferring the local angle of attack via stagnation point detection using differential pressure sensors near the leading edge was shown to work well for this application via a measurement campaign on a 2D NACA0018 airfoil in a wind tunnel. A method for detecting and classifying leading edge erosion using instantaneous snapshots of the measured pressure fields was shown to be promising using a set of CFD data.
Ongoing work involves field tests on a 6 kW operating wind turbine in Switzerland, as well as the expansion of the entire system for additional use cases.
The code being developed within this project is available on GitHub (https://github.com/aerosense-ai, Clark et al., 2022).
The wind tunnel measurement data are being analysed and post-processed and will be disseminated in a separate publication.
SB leads the Aerosense projects and was responsible for writing and coordinating the overall paper. She is also the co-supervisor of the PhD student YM. JD is a postdoc at OST and was responsible for the wind tunnel tests and angle-of-attack method. YM is a PhD student at OST and ETHZ CSMM part of the project. EC is the co-supervisor of YM and supervisor of GD and was responsible for coordinating the activities as ETHZ CSMM. IA is a postdoc at ETHZ CSMM and led the leading edge erosion work. GD is a PhD student at ETHZ CSMM and carried out the pressure coefficient learning activities for the leading edge erosion detection task. MM is head of ETHZ PBL and was responsible for coordinating the hardware development activities. TP is a postdoc at ETHZ PBL and was responsible for designing the sensor node. RF was a Master's student at ETHZ PBL and prepared and carried out the wind tunnel tests together with JD. HM is a PhD student at ETHZ PBL and was responsible for the data-compression activities as well as the hardware design.
The contact author has declared that none of the authors has any competing interests.
Publisher’s note: Copernicus Publications remains neutral with regard to jurisdictional claims in published maps and institutional affiliations.
This work is funded by the BRIDGE Discovery programme of the Swiss National Science Foundation and Innosuisse, project number 40B2-0_187087. Thanks to Justin Lydement and Ueli Spalinger for their support with the field and wind tunnel tests.
This research has been supported by the Swiss National Science Foundation (grant no. 40B2-0_187087).
This paper was edited by Roland Schmehl and reviewed by Alejandro Gomez Gonzalez and two anonymous referees.
Barber, S. and Nordborg, H.: Comparison of simulations and wind tunnel measurements for the improvement of design tools for Vertical Axis Wind Turbines, J. Phys.-Conf. Ser., 1102, 012002, https://doi.org/10.1088/1742-6596/1102/1/012002, 2018. a
Cacciola, S., Agud, I. M., and Bottasso, C.: Detection of rotor imbalance, including root cause, severity and location, J. Phys.-Conf. Ser., 753, 072003, https://doi.org/10.1088/1742-6596/753/7/072003, 2016. a
Chen, X., Eder, M. A., Shihavuddin, A., and Zheng, D.: A human-cyber-physical system toward intelligent wind turbine operation and maintenance, Sustainability, 13, 561, https://doi.org/10.3390/su13020561, 2021. a, b
Clark, T., Barber, S., Deparday, J., Marykovskiy, Y., Chatzi, E., Abdallah, I., Duthé, G., Magno, M., Polonelli, T., Fischer, R., and Müller, H.: Aerosense Digital Twin tools, GitHub [code], https://github.com/aerosense-ai, last access: 30 June 2022.
Delafin, P.-L., Nishino, T., Kolios, A., and Wang, L.: Comparison of low-order aerodynamic models and RANS CFD for full scale 3D vertical axis wind turbines, Renew. Energ., 109, 564–575, https://doi.org/10.1016/j.renene.2017.03.065, 2017. a
De Tavernier, D., Ferreira, C., Viré, A., LeBlanc, B., and Bernardy, S.: Controlling dynamic stall using vortex generators on a wind turbine airfoil, Renew. Energ., 172, 1194–1211, https://doi.org/10.1016/j.renene.2021.03.019, 2021. a
Di Nuzzo, F., Brunelli, D., Polonelli, T., and Benini, L.: Structural Health Monitoring system With narrowband IoT and MEMS sensors, IEEE S. J., 21, 16371–16380, https://doi.org/10.1109/JSEN.2021.3075093, 2021. a, b, c, d
Dong, X., Lian, J., Wang, H., Yu, T., and Zhao, Y.: Structural vibration monitoring and operational modal analysis of offshore wind turbine structure, Ocean Eng., 150, 280–297, 2018. a
Du, Y., Zhou, S., Jing, X., Peng, Y., Wu, H., and Kwok, N.: Damage detection techniques for wind turbine blades: A review, Mech. Syst. Signal Pr., 141, 106445, https://doi.org/10.1016/j.ymssp.2019.106445, 2020. a
Duthé, G., Abdallah, I., Barber, S., and Chatzi, E.: Modeling and monitoring erosion of the leading edge of wind turbine blades, Energies, 14, 7262, https://doi.org/10.3390/en14217262, 2021. a, b
Esu, O. O., Lloyd, S. D., Flint, J. A., and Watson, S. J.: Feasibility of a fully autonomous wireless monitoring system for a wind turbine blade, Renew. Energ., 97, 89–96, 2016. a
Fathima, K. M., Raj, R. S., Prasad, K. R., and Balan, S. G.: MEMS multi sensor intelligent damage detection for wind turbines by Using IOT, J. Phys.-Conf. Ser., 1916, 012045, https://doi.org/10.1088/1742-6596/1916/1/012045, 2021. a
Filipský, J., Čížek, J., Wittmeier, F., Kuthada, T., and Meier, S.: Design and First Test of the New Synchronous 200 Hz System for Unsteady Pressure Field Measurement, in: Progress in Vehicle Aerodynamics and Thermal Management, edited by: Wiedemann, J., FKFS 2017, Springer, Cham, https://doi.org/10.1007/978-3-319-67822-1_17, 2018. a
Fischer, R., Mueller, H., Polonelli, T., Benini, L., and Magno, M.: WindNode: A Long-Lasting And Long-Range Bluetooth Wireless Sensor Node for Pressure and Acoustic Monitoring on Wind Turbines, 2021 4th IEEE International Conference on Industrial Cyber-Physical Systems (ICPS), 2021, 393–399, https://doi.org/10.1109/ICPS49255.2021.9468256, 2021. a
Hansen, A. and Butterfield, C.: Aerodynamics of horizontal-axis wind turbines, Annu. Rev. Fluid Mech., 25, 115–149, 1993. a
He, L., Attia, M., Hao, L., Fang, B., Younsi, K., and Wang, H.: Remote monitoring and diagnostics of blade health in commercial MW-scale wind turbines using electrical signature analysis (ESA), in: 2020 IEEE Energy Conversion Congress and Exposition (ECCE), 808–813, https://doi.org/10.1109/ECCE44975.2020.9235984, iSSN 2329-3748, 2020. a
Karad, S. and Thakur, R.: Efficient monitoring and control of wind energy conversion systems using Internet of things (IoT): a comprehensive review, Environ. Dev. Sustain., 23, 14197–14214, https://doi.org/10.1007/s10668-021-01267-6, 2021. a
Kingma, D. P. and Welling, M.: Auto-encoding variational bayes, arXiv [preprint], https://doi.org/10.48550/arXiv.1312.6114, 2013. a
Knopp, T., Eisfeld, B., and Calvo, J. B.: A new extension for k−ω turbulence models to account for wall roughness, Int. J. Heat Fluid Fl., 30, 54–65, 2009. a
Kusnick, J., Adams, D. E., and Griffith, D. T.: Wind turbine rotor imbalance detection using nacelle and blade measurements, Wind Energy, 18, 267–276, https://doi.org/10.1002/we.1696, 2015. a
Langel, C. M., Chow, R., Hurley, O. F., van Dam, C. P., Maniaci, D. C., Ehrmann, R. S., and White, E. B.: Analysis of the Impact of Leading Edge Surface Degradation on Wind Turbine Performance, Symposium, AIAA/ASME Wind Energy Symposium 2015, Kissimmee, FL, 5–9 January, 2015, https://www.osti.gov/biblio/1323041 (last access: 6 July 2022), 2015. a
Larsson, C. and Öhlund, O.: Amplitude modulation of sound from wind turbines under various meteorological conditions, J. Acoust. Soc. Am., 135, 67–73, 2014. a
Li, C., Zhu, S., Xu, Y.-l., and Xiao, Y.: 2.5 D large eddy simulation of vertical axis wind turbine in consideration of high angle of attack flow, Renew. Energ., 51, 317–330, 2013. a
Lu, L., He, Y., Wang, T., Shi, T., and Ruan, Y.: Wind turbine planetary gearbox fault diagnosis based on self-powered wireless sensor and deep learning approach, IEEE Access, 7, 119430–119442, 2019. a
Madsen, H. A., Bertagnolio, F., Fischer, A., Bak, C., and Schmidt Paulsen, U.: A novel full scale experimental characterization of wind turbine aero-acoustic noise sources – preliminary results, in: Proceedings of the International Symposium on Transport Phenomena and Dynamics of Rotating Machinery, 16th International Symposium on Transport Phenomena and Dynamics of Rotating Machinery, Honolulu, Hawaii, United States, 10–15 April 2016, https://orbit.dtu.dk/en/publications/a-novel-full-scale-experimental-characterization-of-wind-turbine- (last access: 6 July 2022), 2016. a
Medina, P., Singh, M., Johansen, J., Rivera Jove, A., Machefaux, E., Fingersh, L., and Shreck, S.: Aerodynamic and performance measurements on a SWT-2.3-101 wind turbine, WINDPOWER 2011, Anaheim, California, 22–25 May 2011, 1–11, https://www.osti.gov/biblio/1029020 (last access: 6 July 2022), 2011. a, b
Nielsen, M. S., Nikolov, I., Kruse, E. K., Garnæs, J., and Madsen, C. B.: High-Resolution Structure-from-Motion for Quantitative Measurement of Leading-Edge Roughness, Energies, 13, 3916, https://doi.org/10.3390/en13153916, 2020. a
Oerlemans, S. and Schepers, J. G.: Prediction of wind turbine noise and validation against experiment, Int. J. Aeroacoust., 8, 555–584, 2009. a
Oliveira, G., Magalhães, F., Cunha, A., and Caetano, E.: Vibration-based damage detection in a wind turbine using 1 year of data, Struct. Control Hlth., 25, e2238, https://doi.org/10.1002/stc.2238, 2018. a
Pfaff, T., Fortunato, M., Sanchez-Gonzalez, A., and Battaglia, P. W.: Learning mesh-based simulation with graph networks, arXiv [preprint], https://doi.org/10.48550/i.org/10.48550/arXiv.2010.03409, 2020. a
Qi, C. R., Su, H., Mo, K., and Guibas, L. J.: Pointnet: Deep learning on point sets for 3d classification and segmentation, arXiv [preprint], https://doi.org/10.48550/arXiv.1612.00593, 2017. a
Qu, F., Liu, J., Zhu, H., and Zang, D.: Wind turbine condition monitoring based on assembled multidimensional membership functions using fuzzy inference system, IEEE T. Ind. Inform., 16, 4028–4037, 2019. a
Raab, C. and Rohde-Brandenburger, K.: In-Flight Testing of MEMS Pressure Sensors for Flight Loads Determination, AIAA 2020-0512, AIAA Scitech 2020 Forum, https://doi.org/10.2514/6.2020-0512, 2020. a
Ramesh, K.: On the leading-edge suction and stagnation-point location in unsteady flows past thin aerofoils, J. Fluid Mech., 886, A13, https://doi.org/10.1017/jfm.2019.1070, 2020. a
Rossander, M., Dyachuk, E., Apelfröjd, S., Trolin, K., Goude, A., Bernhoff, H., and Eriksson, S.: Evaluation of a blade force measurement system for a vertical axis wind turbine using load cells, Energies, 8, 5973–5996, 2015. a
Saini, A. and Gopalarathnam, A.: Leading-Edge flow sensing for aerodynamic parameter estimation, AIAA J., 56, 4706–4718, https://doi.org/10.2514/1.J057327, 2018. a
Sareen, A., Sapre, C. A., and Selig, M. S.: Effects of leading edge erosion on wind turbine blade performance, Wind Energy, 17, 1531–1542, 2014. a
Scarselli, F., Gori, M., Tsoi, A. C., Hagenbuchner, M., and Monfardini, G.: The graph neural network model, IEEE T. Neural Networ., 20, 61–80, 2008. a
Schepers, G.: Engineering models in wind energy aerodynamics: Development, implementation and analysis using dedicated aerodynamic measurements, PhD thesis, TU Delft, https://doi.org/10.4233/uuid:92123c07-cc12-4945-973f-103bd744ec87, 2012. a
Schepers, J. G. and Schreck, S. J.: Aerodynamic measurements on wind turbines, Wires Energy Environ., 8, e320, https://doi.org/10.1002/wene.320, 2019. a
Selig, M. S.: UIUC airfoil data site, https://m-selig.ae.illinois.edu/ads.html (last access: 30 June 2022), 1996. a
Shihavuddin, A. S. M., Chen, X., Fedorov, V., Nymark Christensen, A., Andre Brogaard Riis, N., Branner, K., Bjorholm Dahl, A., and Reinhold Paulsen, R.: Wind turbine surface damage detection by deep learning aided drone inspection analysis, Energies, 12, 676, https://doi.org/10.3390/en12040676, 2019. a
Skrimpas, G. A., Kleani, K., Mijatovic, N., Sweeney, C. W., Jensen, B. B., and Holboell, J.: Detection of icing on wind turbine blades by means of vibration and power curve analysis, Wind Energy, 19, 1819–1832, https://doi.org/10.1002/we.1952, 2016. a
Tcherniak, D. and Larsen, G. C.: Application of OMA to an Operating Wind Turbine: now including Vibration Data from the Blades, in: Proceedings – 5th International Operational Modal Analysis Conference (IOMAC'13), https://orbit.dtu.dk/en/publications/application-of-oma-to-an-operating-wind-turbine-now-including-vib (last access: 6 July 2022), 2013. a
Tian, Y. and Cotté, B.: Wind turbine noise modeling based on Amiet's theory: Effects of wind shear and atmospheric turbulence, Acta Acust. United Ac., 102, 626–639, 2016. a
Troldborg, N., Bak, C., Aagaard Madsen, H., and Skrzypinski, W. R.: DANAERO MW, Final Report, DTU Wind Energy, DTU Wind Energy E No. 0027(EN), https://orbit.dtu.dk/en/publications/danaero-mw-final-report (last access: 6 July 2022), 2013. a, b
van Dijk, M. T., van Wingerden, J.-W., Ashuri, T., Li, Y., and Rotea, M. A.: Yaw-Misalignment and its impact on wind turbine loads and wind farm power output, J. Phy.-Conf. Ser., 753, 062013, https://doi.org/10.1088/1742-6596/753/6/062013, 2016. a
Vaswani, A., Shazeer, N., Parmar, N., Uszkoreit, J., Jones, L., Gomez, A. N., Kaiser, Ł., and Polosukhin, I.: Attention is all you need, in: Advances in neural information processing systems, edited by: Guyon, I., Von Luxburg, U., Bengio, S., Wallach, H., Fergus, R., Vishwanathan, S., and Garnett, R., Curran Associates, Inc., 30, 5998–6008, https://proceedings.neurips.cc/paper/2017/file/3f5ee243547dee91fbd053c1c4a845aa-Paper.pdf (last access: 6 July 2022), 2017. a
Vimalakanthan, K., Schepers, J., Shen, W., Rahimi, H., Micallef, D., Ferreira, C. S., Jost, E., and Klein, L.: Evaluation of different methods of determining the angle of attack on wind turbine blades under yawed inflow conditions, J. Phys.-Conf. Ser., 1037, 022028, https://doi.org/10.1088/1742-6596/1037/2/022028, 2018. a
Weijtjens, W., Verbelen, T., Sitter, G. D., and Devriendt, C.: Foundation structural health monitoring of an offshore wind turbine at full-scale case study, Struct. Health Monit., 15, 389–402, 2016. a
Wondra, B., Malek, S., Botz, M., Glaser, S. D., and Grosse, C. U.: Wireless high-resolution acceleration measurements for Structural Health Monitoring of wind turbine towers, Data-Enabled Discovery and Applications, 3, 4, https://doi.org/10.1007/s41688-018-0029-y, 2019. a
Wu, G., Zhang, L., and Yang, K.: Development and validation of aerodynamic measurement on a Horizontal Axis Wind Turbine in the field, Appl. Sci., 9, 482, https://doi.org/10.3390/app9030482, 2019. a, b
Zhu, C., Qiu, Y., Feng, Y., Wang, T., and Li, H.: Combined effect of passive vortex generators and leading-edge roughness on dynamic stall of the wind turbine airfoil, Energ. Convers. Manage., 251, 115015, https://doi.org/10.1016/j.enconman.2021.115015, 2022. a