the Creative Commons Attribution 4.0 License.
the Creative Commons Attribution 4.0 License.
 | 28 Oct 2022
Model tests of a 10 MW semi-submersible floating wind turbine under waves and wind using hybrid method to integrate the rotor thrust and moments
Felipe Vittori
José Azcona
Irene Eguinoa
Oscar Pires
Alberto Rodríguez
Álex Morató
Carlos Garrido
Cian Desmond
This paper describes the results of a wave tank test campaign of a scaled SATH 10 MW floating platform. The software-in-the-loop (SiL) hybrid method was used to include the wind turbine thrust and the in-plane rotor moments. Experimental results are compared with a numerical model developed in OpenFAST of the floating wind turbine. The tank test campaign was carried out in the scaled model tested at the deep ocean basin from the Lir National Ocean Test Facility at Cork, Ireland. This floating substructure design was adapted by Saitec to support the 10 MW wind turbine within the ARCWIND project (Adaptation and Implementation of Floating Wind Energy Conversion Technology for the Atlantic Region) with the aim of withstanding the environmental conditions of the European Atlantic Area region. CENER provided the wind turbine controller specially designed for the SATH 10 MW configuration.
A description of the experimental setup, force actuator configuration and the numeric aerodynamic parameters is provided in this work. The most relevant experimental results under wind and wave loading are shown in time series and frequency domain. The influence of the submerged geometry variations in the pitch natural frequency is discussed. The paper shows the simulation of a case with rated wind speed, where the tilted geometry for the computation of the hydrostatic and hydrodynamic properties of the submerged substructure is considered. This case provides a better agreement of the pitch natural frequency with the experiments than an equivalent simulation using the undisplaced geometry mesh for the computation of the hydrodynamic and hydrostatic properties.
- Article
(2367 KB) - Full-text XML
- BibTeX
- EndNote


Floating wind energy has experienced a great technological development with the installation of the first floating wind farms.
A relevant contribution to this technological development is the ARCWIND project (Adaptation and Implementation of Floating Wind Energy Conversion Technology for the Atlantic Region), which is a European Union-funded project that aims to foster renewable energies and energy efficiency. The general objective is to reduce the technical and economic uncertainties of floating wind technology to accelerate the upscaling of the power capacity, making the large-scale floating projects more commercially attractive.
With the intention to cover the most common floater topology (DNV-ST-0119, 2021) in the analysis, a tension leg platform (TLP), a spar and the SATH platform were studied under different environmental conditions of the European Atlantic region. The study presented in this document is about the SATH floating platform, a single-point mooring (SPM) floater developed by Saitec (SATH Technology, 2022). The main characteristic of this platform design is to take advantage of the weather-vaning effect to reduce the loads on its components. The floater design was upscaled to support the rotor–nacelle assembly (RNA) of the wind turbine 10 MW INNWIND (Bak et al., 2013). The INNWIND tower was replaced by a design from Saitec. To study the technical feasibility of this floating wind turbine concept, a scaled tank test campaign was performed in the Lir National Ocean Test Facility at the University College Cork in Ireland.
Tank testing has been an important tool for the design of offshore floating structures (Chakrabarti, 2005; Faltinsen, 1990; Journée and Massie, 2001). In the case of innovative floating wind turbines, it is a critical step of the design to validate the platform dynamic response subjected to the complex interactions between the wind and wave loading. Moreover, tank testing allows validation and calibration of the hydro-aero-servo-elastic numerical tools that are used for the simulation and for the load calculations used in the components' structural design and certification of the system.
To achieve a reliable reproduction of the dynamics of the full-scale floating offshore wind turbine (FOWT) in the basin, it is important to obtain an accurate scaling of the relevant forces acting on the system, the inertias and the frequencies of the time-variant loads. The integration of the rotor dynamics in scaled tests that combine wind and wave loading is challenging due to the scaling conflict between the Reynolds and Froude numbers that govern the aerodynamic and hydrodynamic forces (Bredmose et al., 2012; Azcona et al., 2014b).
A hybrid testing approach named software in the loop (SiL) was proposed and successfully applied in a test campaign by Azcona et al. (2014a). In this method, the aerodynamic rotor thrust of the wind turbine is applied to the scaled model by a ducted fan or a set of propellers. The turbine thrust force is based on real-time simulations at full scale of the rotor aerodynamics, coupled with the scaled floater response that is physically tested under wave loading. The method allows consideration of the correctly scaled rotor load in the wave tank tests. Moreover, as the rotor loading is coupled in real time with the floater motion, the aerodynamic damping introduced by the rotor is captured. This effect is a relevant source of damping and cannot be neglected in order to accurately capture the global motions of the floating turbine. Similar methods have been applied more recently, for example by Bachynski et al. (2015) and Belloli et al. (2020). Also, there are different approaches to introducing an aerodynamic thrust representing the full-scale rotor force, such as using a drag disk (Roddier et al., 2010) or building a Froude-scaled rotor (Koch et al., 2016).
The first version of the SiL method, where just the rotor thrust force is introduced, was successfully applied in several test campaigns for floating wind turbines. For example, in Vittori et al. (2018) the experimental measurements using this first version of SiL were compared with results from numerical computations showing good agreement, and in Azcona et al. (2019) the method showed its capability to capture the low-frequency dynamics of a semi-submersible. Afterwards, the SiL method was expanded to also include rotor aerodynamic and gyroscopic moments for the pitch (My) and the yaw (Mz) platform degrees of freedom (DOFs). This improved SiL method was used in Fontanella et al. (2020) and Vittori et al. (2020). The latter showed that the SiL method including Mz is able to induce the yaw motion in the platform response. This study was done under co-linear wind and wave conditions.
The objective of this study is to validate the improvement of the SiL method including the rotor thrust with My and Mz moments and compare the induced yaw response with numeric simulations. The measurements from experiments were used to improve the numerical model to obtain better representations of the natural frequencies. The numeric tool used was OpenFAST (NREL, 2019).
The first section of this works gives an overview about the SiL methodology applied in this test campaign, the scaled model of the SATH 10 MW and the campaign setup. The second section presents a description of the OpenFAST numerical model for the SATH 10 MW floating wind turbine. Finally, the analysis of the results is presented in the third section, ending with the conclusions of this work.
The SiL hybrid method consists of replacing the rotor by a force actuator (a fan or a multipropeller system) driven by an electric motor. The scaled thrust is controlled by an electronic controller (EC) that regulates the rotational speed of the propellers' motor of the actuator. This EC receives the thrust demand from a real-time, full-scale simulation of the wind turbine. The simulation takes into account the wind field, the wind turbine control and the real-time platform motions measured in the wave tank. Therefore, the method captures the coupling between the rotor loads and the platform motions, which is a relevant effect to accurately represent the dynamics of a floating wind turbine. The FAST code developed by the National Renewable Energy Laboratory (NREL) (Jonkman, 2007) is used for the simulation of the rotor thrust loads. The details on the SiL system architecture can be found in Azcona et al. (2014a).
In this test campaign, an actuator with four propellers was used to introduce the rotor loading. A photograph of this actuator in the calibration workbench is shown in Fig. 1.
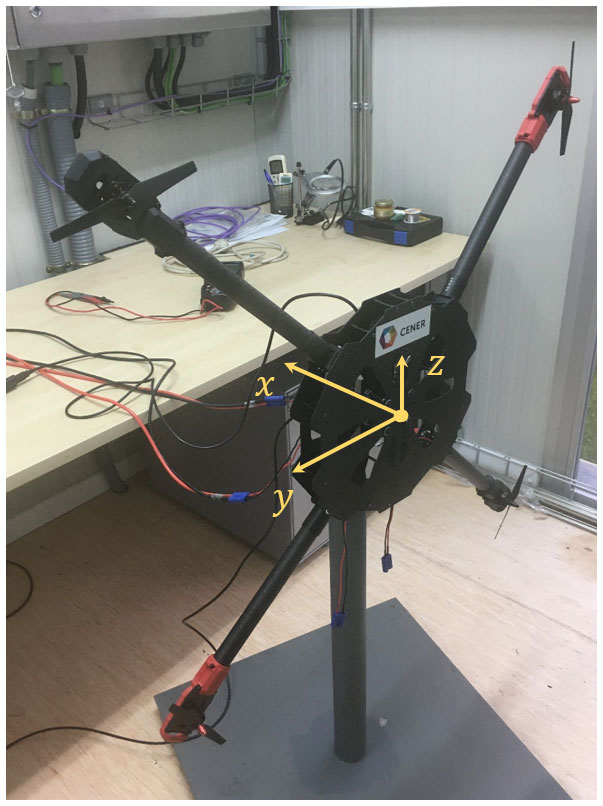
Figure 1Multi-propeller actuator at the National Renewable Energy Centre (CENER) calibration workbench. Wind turbine thrust is applied in the x direction, and rotor moments My and Mz are applied on the y and z axis, respectively.
Each of the propellers is powered by a drone commercial brushless motor that is controlled by an electronic speed controller (ESC) and fed with an industrial AC–DC power supply. This system configuration produces an approximate force range of 0–24 N. The rotational speed of each motor (and therefore the force produced by the propeller) is controlled by a pulse width modulation (PWM) signal that is generated with the LabVIEW control software, using servo libraries for Arduino. Figure 2 shows a diagram of the SiL system control scheme.

Figure 2SiL control diagram (Vittori et al., 2020).
The measured motions from the tracking system of the wave tank are acquired by the SiL control scripts in LabVIEW and then are integrated into the simulation software for the computation of the rotor loads. This demanded rotor loading is transformed into the different propeller signals through force and moment balance equations. The propellers can work by introducing only the thrust force of the rotor (each of the propellers introduces of the scaled thrust), or the system can decouple the force that each propeller introduces to generate the required pitch (My) and yaw (Mz) moments, together with the thrust. This enables the system to reproduce the scaled rotor moments from aerodynamic effects such as imbalance, wind shear, pitch failures, wind misalignment and gyroscopic effects. In this test campaign, the moments My and Mz were included in the test. The details about the development of this multi-propeller actuator can be found in Pires et al. (2020).
2.1 Rotor loading hybrid numerical model
A numerical model of the 10 MW INNWIND rotor was built at full scale using the FAST code coupled with AeroDyn 12.58 (Jonkman, 2007). For the execution of the experiments, a modified version of this software (Azcona et al., 2014a) able to run in real time and to integrate the measured platform motions in the computation of the rotor loads was used. The aerodynamic loads are based on blade element momentum (BEM); tip and hub losses were considered using the Prandtl correction. The tower for the experimental scaled model in Fig. 3 was designed to be rigid, with a larger diameter to avoid any elastic response. The numerical model used in the hybrid testing is fed by the motions measured at the intersection between the tower center line and the water plane. For consistency with the scaled model, this numerical model assumed a rigid tower. The blades of the numerical model are also assumed rigid to improve the CPU speed, ensuring real time, and because the loss of accuracy is low compared to other sources of uncertainty in the experimental setup. The turbulent wind was obtained through a Kaimal spectrum using the TurbSim wind generator from NREL (Jonkman, 2016).
The turbine controller used for the experiments was developed by CENER on the basis of state-of-the-art control strategies for pitch-controlled variable-speed turbines. Collective pitch-to-feather was applied through a gain-scheduled proportional integral derivative (PID) controller in the above-rated region, where a constant power strategy was implemented. The controller was implemented in an in-house code and compiled as a dynamic-link library (dll) for its integration into the simulations. As for any wind turbine controller design, the controller parameters were tuned to adapt to the specific turbine dynamics of the SATH 10 MW platform. For such a purpose, linear models were obtained from the non-linear FAST model for the whole operating wind speed range [4, 25] m s−1, and an iterative design process was applied. Verification of the design was performed through non-linear simulations.
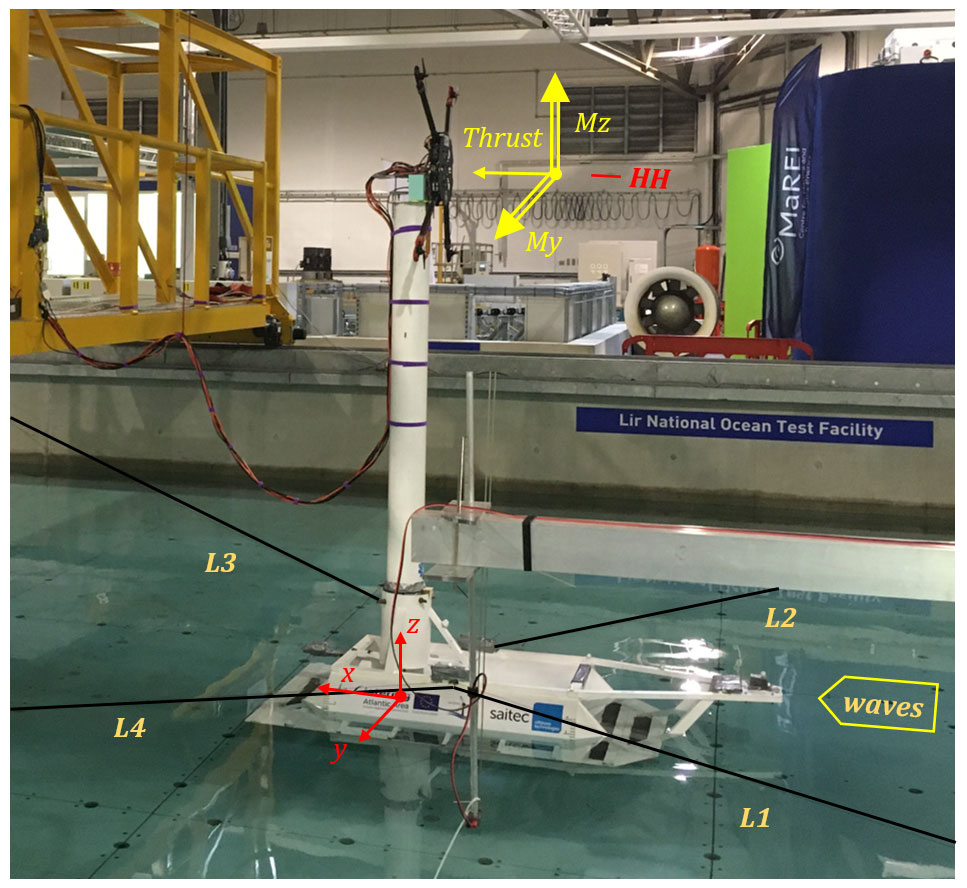
Figure 3SATH 10 MW scaled model.
2.2 SATH 10 MW scaled tank testing
The SATH 10 MW scaled floating platform is shown in Fig. 3. This floater concept has a low-draft catamaran-type design with a twin hull that provides stability in combination with the mooring system (SATH Technology, 2022). In this test campaign the SPM system was not implemented to ease the uncertainties in the initial validation of the numerical tools and floating design. The impact of a SPM on the platform dynamics is expected to be relevant due to the Mz generated by the wind turbine that will induce rotation on the platform. Therefore, further experimental campaigns to analyze this advanced component are recommended. A retention system based on four horizontal lines separated by 90∘ between them was used to moor the system as is shown in Fig. 3. This retention system introduces constraint in the platform yaw response, avoiding the free yaw response with respect to the original SPM design.
The drone frame with the four propellers that are used to introduce the scaled 10 MW INNWIND rotor loads was installed at the tower top of the scaled floating platform. The reference system for the loads is indicated at the tower top in Fig. 3. The water depth at full scale is 110 m, and the wave generator produces waves in the direction also indicated in Fig. 3.
The results presented in this work are based on a coordinate system located at the intersection of the MSL (mean sea level) and the tower axis indicated in Fig. 3 in red color. The geometrical center of the drone frame was located at the equivalent full-scale hub height of the wind turbine.
The resulting mass of the set of propellers together with the carbon fiber arms and the frame was relatively low, and thus ballast was added in order to match the target weight that represents the full-scale 10 MW INNWIND RNA mass. The center of gravity (COG) location and the moments of inertia were calculated based on numerical mass distribution calculations. Significant amounts of lead were added to the heave plate, the transition piece and the nacelle to achieve the correct distribution. The difference in the moments of inertia is estimated to be below 1 % and the COG position below 5 mm in any of the three directions.
A numerical model of the SATH 10 MW was built at full scale in OpenFAST v2.2 (NREL, 2019) with the objective of numerically reproducing the experimental cases and comparing the results with the experimental measurements. The platform added mass, damping and hydrostatic stiffness, and wave force coefficients were obtained from the potential theory WAMIT (Lee and Newman, 2006) code in the frequency domain and then given as an input to OpenFAST. For the simulation of the experimental cases, the measured wave elevation time series from the tests were used as an input to OpenFAST, which generates the wave kinematics with first-order wave theory.
The second-order hydrodynamic forces were implemented by means of the Newman approximation. Saitec provided input files to be used in OpenFAST. Additional linear and quadratic damping coefficients were incorporated in all platform DOFs after the model damping was calibrated based on the experimental decay tests, as is shown in Sect. 4.1.
The retention system of the scaled floater was modeled using a linear stiffness matrix, considering the couplings between the corresponding DOFs. This linear stiffness matrix was initially estimated analytically, based on the mooring line's tension, fairlead positions and the scaled model geometry. Afterwards, the coefficients of the matrix were tuned to match the experimental results from free decays.
The aerodynamic loads were calculated with AeroDyn v15, through the blade element momentum (BEM). The tip and hub losses were considered using the Prandtl correction. This model was defined with a rigid tower and blades to match the experiment conditions. The input wind field used in the simulations was the same as that used during the experiments to maintain consistency. Finally, the same wind turbine controller used during the tank testing was used in the numerical model.
This section presents some of the most relevant experimental measurements together with the numeric results obtained from the calibrated numerical model simulated by OpenFAST. The next load cases presented start with the more simple tests like free decay until the validation of more complex load scenarios like simultaneous turbulent wind and irregular waves. This allows isolation of the different effects to simplify the analysis, as was also recommended by Robertson et al. (2013).
First, the results from the free-decay tests that were used to calibrate the numerical model are shown. These results show that the platform natural frequencies and damping levels are similar to the full-scale numeric model in OpenFAST.
Second, the platform response under constant and uniform wind using the SiL method to introduce the rotor loads is presented. Through these tests it was verified that the rotor loads produced a similar displacement in the experiment than the full-scale numeric model.
Finally, the similarity obtained between numerical results and measurements when the platform is under turbulent wind only is presented. Additionally, the effect of the new SiL is shown when the floating platform is under wave and wind loading. All results presented in this document are at full scale.
4.1 Free-decay tests
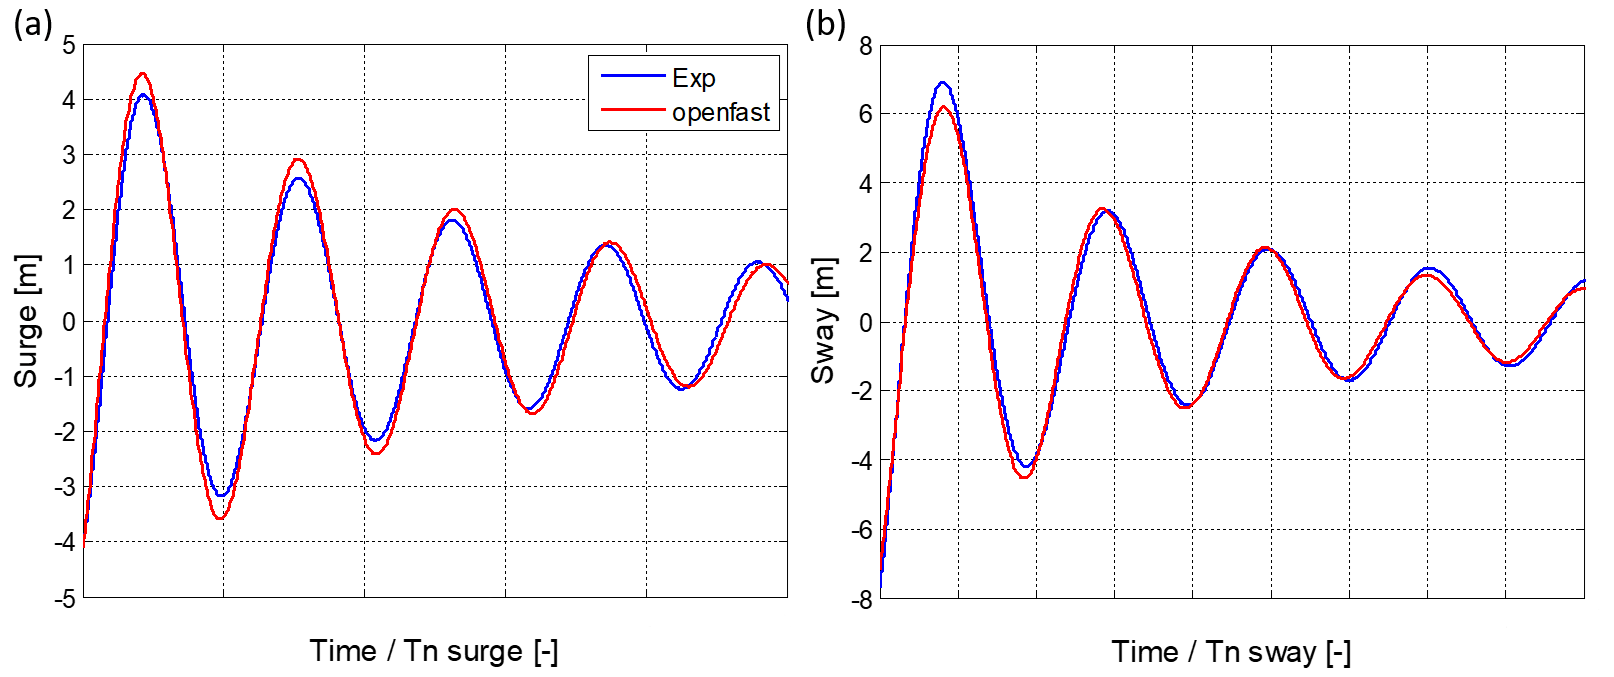
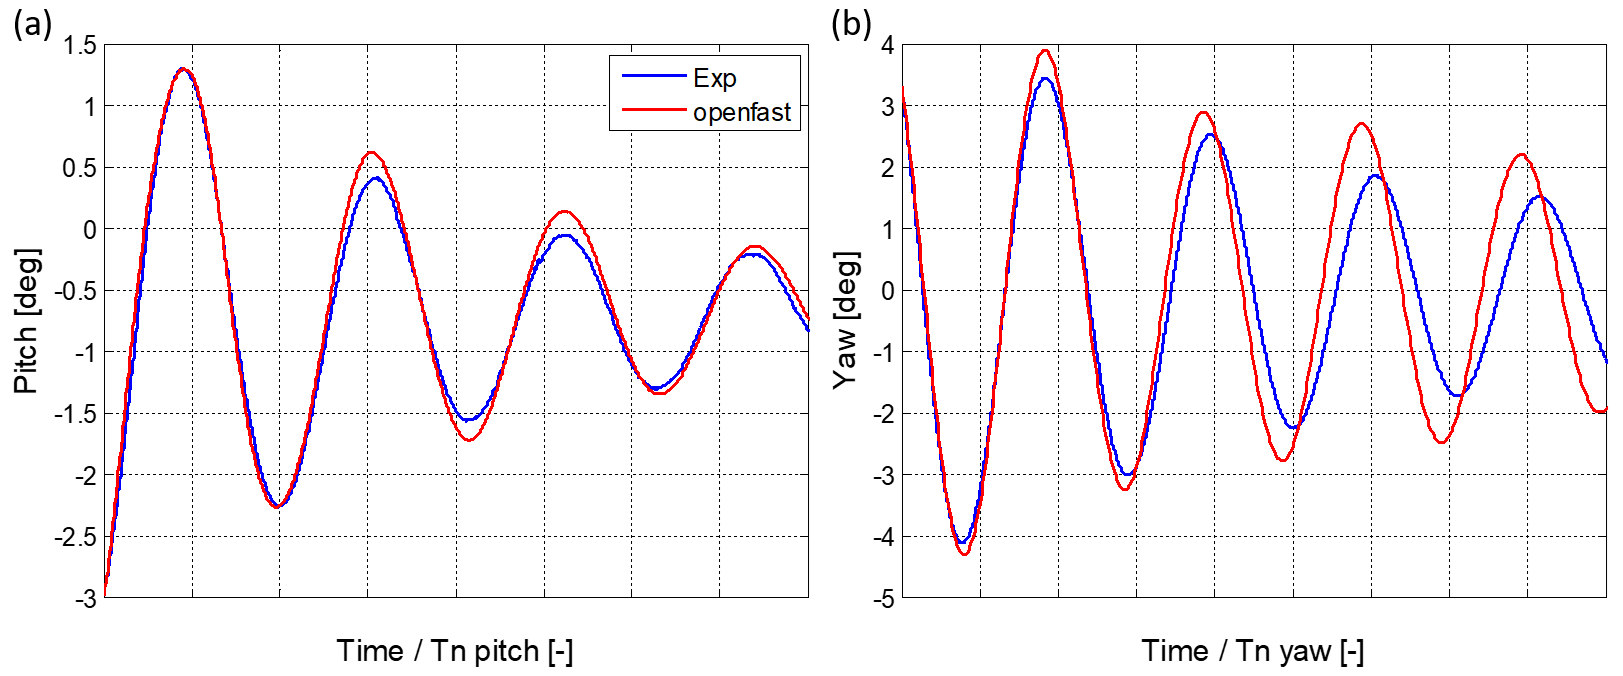
The free-decay experimental results allowed calibration of the hydrodynamic damping levels of the OpenFAST SATH 10 MW model by adjusting the linear and quadratic damping terms. Also, the natural periods of the platform DOF were obtained by adjusting the coefficients of the stiffness matrix for the mooring system. In these experimental tests the SiL actuator was turned off. Figure 4a and b show the good agreement found by the OpenFAST model for surge and sway, respectively. Figure 5a and b show the good approximation obtained for pitch and yaw, respectively.
The values of the natural periods are not shown due to confidential restrictions. The surge and sway results from Fig. 4a and b refer to the center of mass of the floating wind turbine to make the interpretation of the DOF response easier. There is strong coupling between certain DOFs, such as sway and yaw when using the coordinate system from Fig. 3.
From experimental pitch free decays with and without cable bundle a 3 % of difference in platform pitch stiffness was estimated. The numerical models take this effect into account by including an additional pitch stiffness coefficient. Additionally, a pre-load moment was required to match the FOWT pitch mean position.
A good agreement is also obtained between the numerical model and experiment in the yaw DOF for the first oscillations. Afterwards, yaw oscillations present changes in the natural period. This may be related to uncertainties in the estimation of yaw stiffness in the seakeeping system that cannot be modeled numerically by the linear stiffness matrix. Obviously, a SPM system would not produce any restriction in yaw, allowing the platform to freely rotate around the vertical axis.
For the following sections, the results refer to the coordinated system indicated in Fig. 3.
4.2 Constant and uniform winds only
Figure 6 presents the steady-state response comparison for the platform surge and pitch displacements between experimental measurements and numerical results. There are no waves, and the wind is constant and uniform. The OpenFAST results were very close to the experiments for the 7.5 m s−1 case; the differences between them were below 1 % for surge and pitch. In the case of 11.4 m s−1 of wind speed the numerical result for surge was 5 % larger than the experiment. The simulation solution for pitch was 2 % below the tank test at a turbine rated wind speed of 11.4 m s−1.
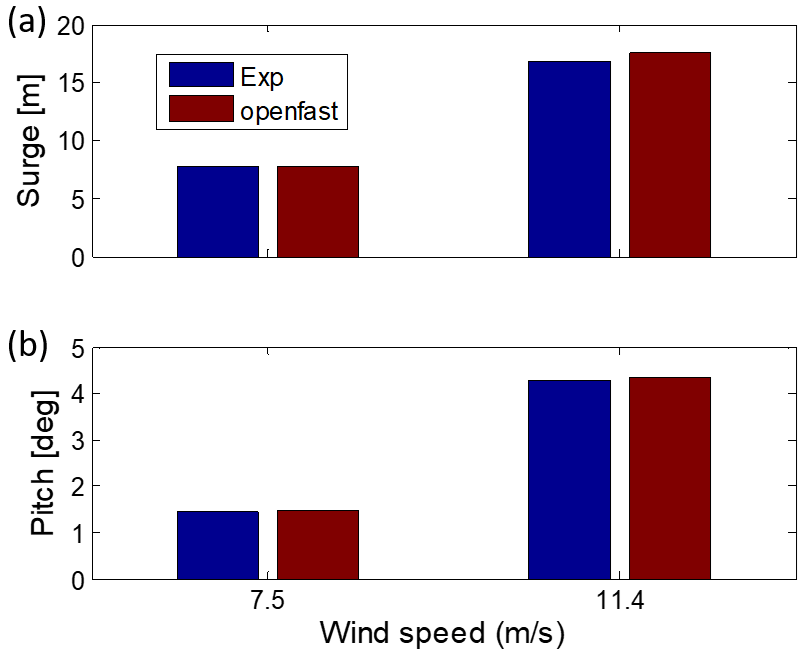
Figure 6Steady-state response comparison between experiments (improved SiL) and OpenFAST simulation for (a) surge and (b) pitch response.
The good agreement between numerical results and experimental measurements for the surge and pitch responses under both wind speeds indicates the equivalence between the scaled experimental model and the numerical model.
4.3 Turbulent winds only
In this section, the motions of the platform under a turbulent wind loading, with no waves, are discussed. Figure 7 shows the comparison between the measurements in the experiment and the computations from the equivalent simulations in OpenFAST for the platform surge and pitch motions, under a 7.5 m s−1 turbulent mean wind speed. Results are presented in time domain and in frequency domain, with a power spectral density (PSD).
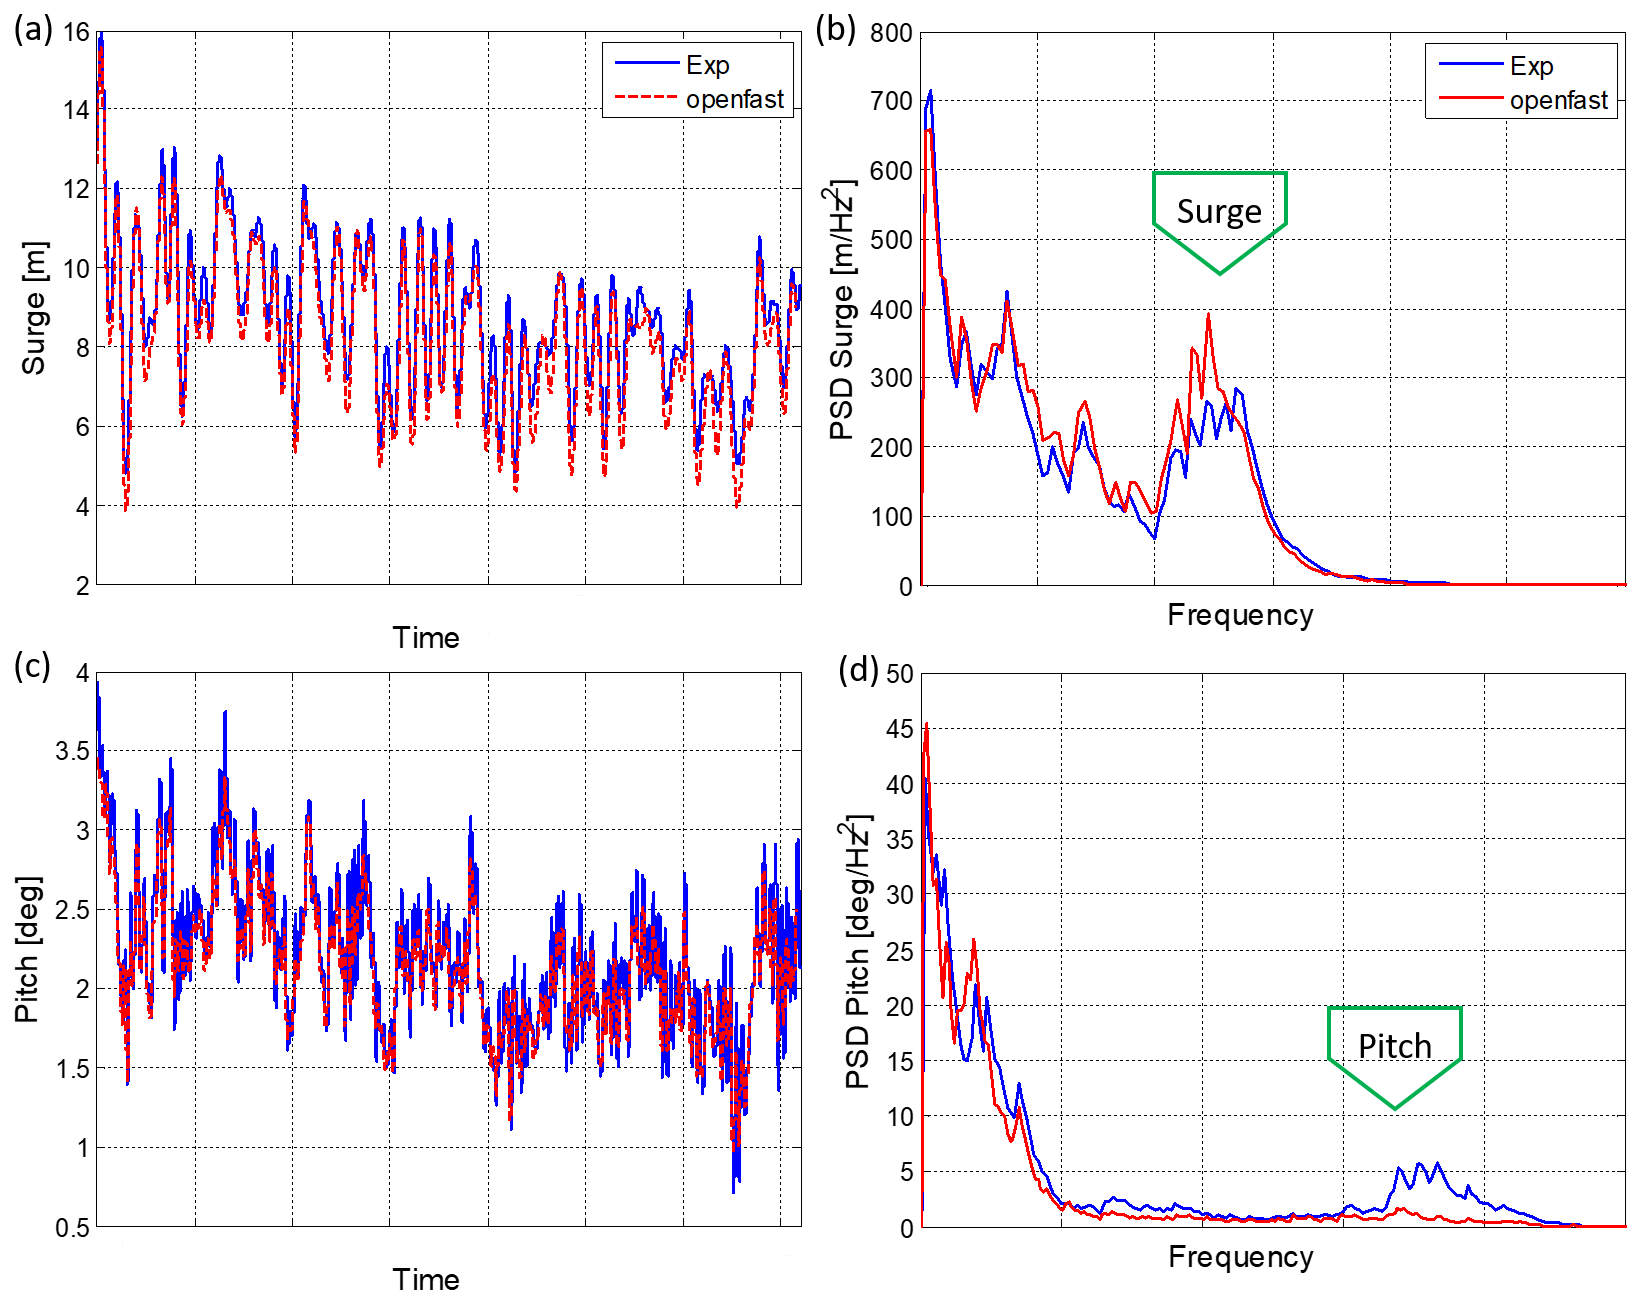
Figure 7Platform response comparison between experiments and OpenFAST simulation for surge and pitch under 7.5 m s−1 turbulent mean wind speed without waves. (a) Surge response in time domain, (b) surge response PSD, (c) pitch response in time domain and (d) pitch response PSD.
The time domain surge response from OpenFAST in Fig. 7a matches well with the response measured in the experiment. The surge power spectrum density (PSD; Fig. 7b) also shows the agreement between numerical and experiment results in the lower-frequency region and around the surge natural frequency, indicated in the plot.
In the case of the SATH 10 MW pitch response in Fig. 7c the simulation results and measurements agree well for the lower frequencies, where the wind energy is located, but for the higher frequencies, around platform pitch natural frequency, the motion is underestimated by the simulations.
Figure 8a and b show that there is a significant difference between the measured and calculated sway response. The sway response in the experiments has larger excursions than those calculated in the numeric simulations. Additionally, the sway natural period of the scaled model seems to be slightly shifted with respect to the numerical model.
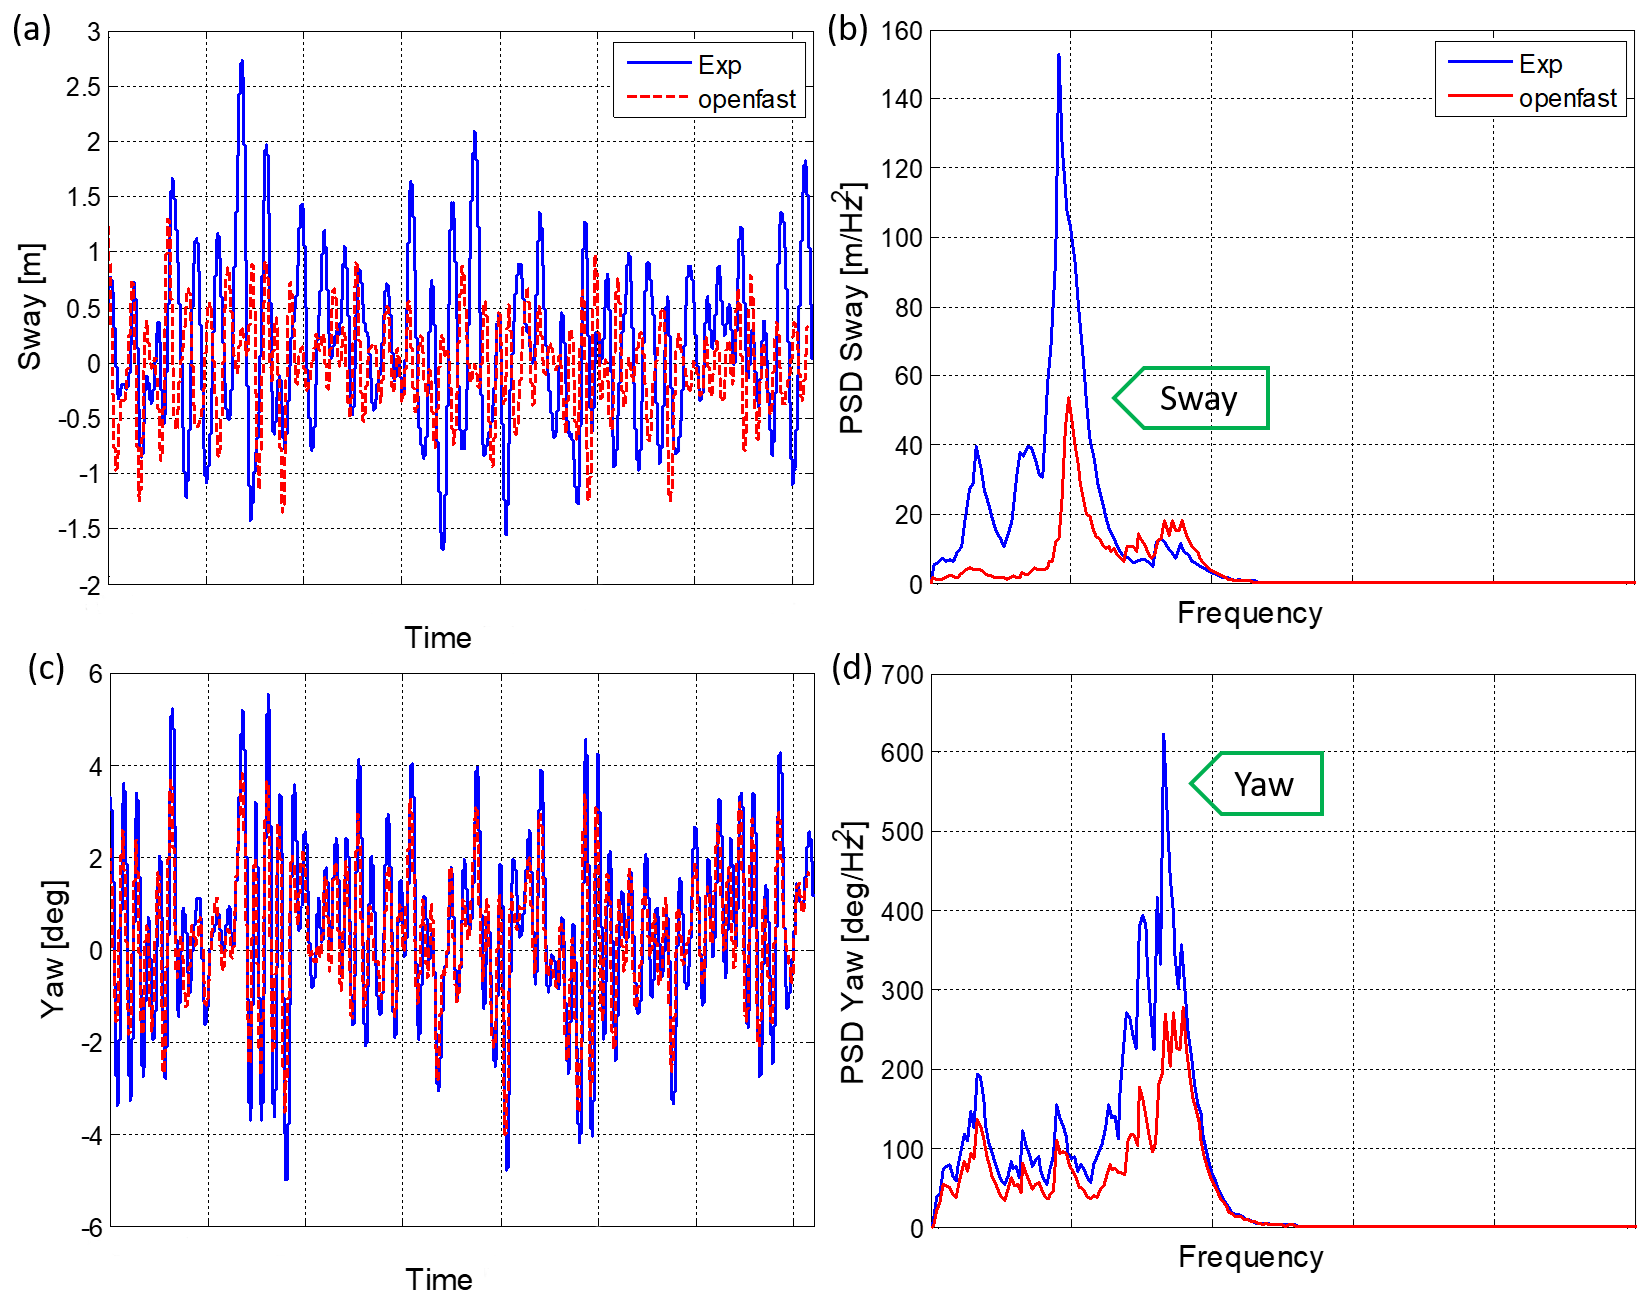
Figure 8Platform response comparison between experiments and computations of sway and yaw under 7.5 m s−1 turbulent mean wind speed without waves. (a) Sway response in time domain, (b) sway response PSD, (c) yaw response in time domain and (d) yaw response PSD.
The yaw response comparison in Fig. 8c shows a certain agreement between the measured scaled motion and the simulation results, although the OpenFAST solution presents lower peaks for the yaw rotations. This can also be observed in the yaw PSD (Fig. 8d), where the simulation curve presents lower values than the experimental.

Figure 9Time series for platform surge response under 7.5 m s−1 turbulent mean wind speed and irregular waves with Hs=2.0 m and Tp=8.5 s.

Figure 10Time series for platform surge response under 11.4 m s−1 turbulent mean wind speed and irregular waves with Hs=3.0 m and Tp=10.5 s.
4.4 Turbulent winds and irregular waves
This section compares the experimental measurements and the numerical simulations for two cases with combined turbulent wind and irregular waves. The first case has a mean wind speed of 7.5 m s−1 with co-linear irregular waves with Hs=2.0 m and Tp=8.5 s. The second case has a mean speed of 11.4 m s−1 with co-linear irregular waves with Hs=3.0 m and Tp=10.5 s.
Two different numerical simulations are plotted against the experiments in this section. One of the simulations applies linear potential hydrodynamics (OpenFAST hyd: first). The other one includes second-order effects using the Newman approximation (OpenFAST hyd: first and second). For both experiment and simulation results, the same turbulent wind field, wave elevation time series and wind turbine controller were used.
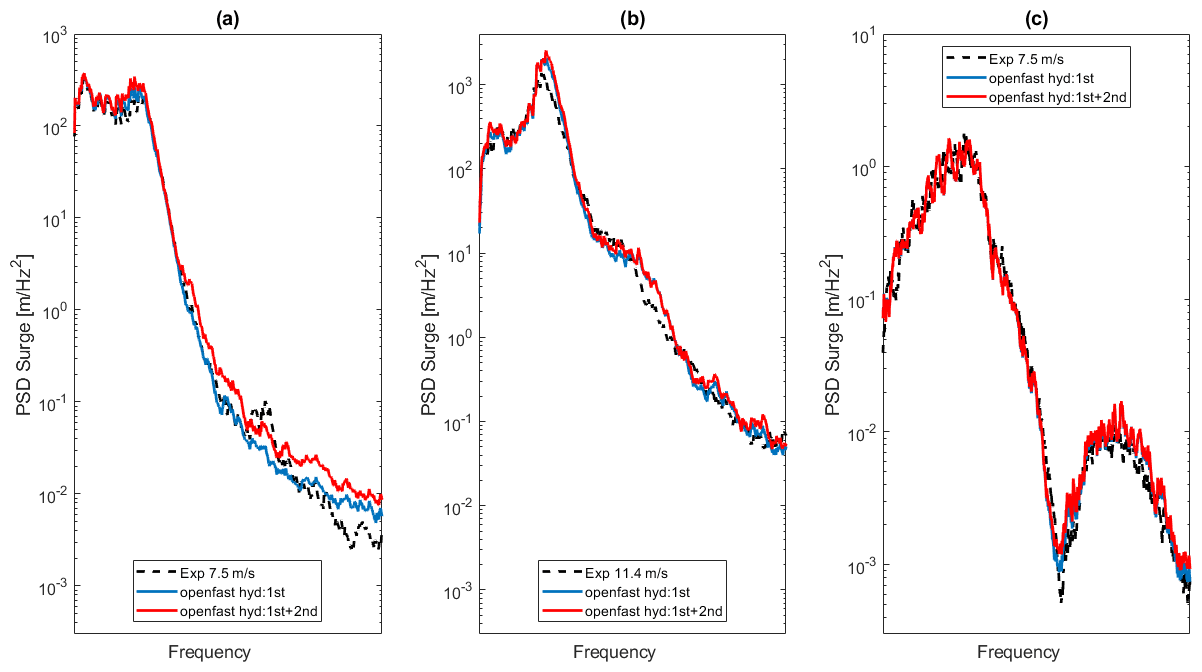
Figure 11Surge PSD response of SATH 10 MW under (a) turbulent wind with average of 7.5 m s−1 and irregular waves with Hs=2.0 m and Tp=8.5 s, (b) turbulent wind with average of 11.4 m s−1 and irregular waves with Hs=3.0 m and Tp=10.5 s, and (c) wave region for turbulent wind with average of 7.5 m s−1 and irregular waves with Hs=2.0 m and Tp=8.5 s.
Figures 9 and 10 show the measured and simulated platform surge for the turbulent wind speed of 7.5 and 11.4 m s−1 with their respective wave conditions. It can be seen that the numerical simulations are very close to the experimental response for both environmental conditions. Also, it can be noticed that the simulation including non-linear hydrodynamics provides very similar results to the results of the linear model. This could be due to the relatively small height of the waves related to the significant wave height used. In the case of 11.4 m s−1 (Fig. 10) both numerical solutions are also very similar. In this case at rated wind speed, the platform motions are dominated by the wind load. The effect of second-order hydrodynamics in the response of the platform under higher wave heights has been discussed by Azcona et al. (2019) and Roald et al. (2013).
The PSD of the surge responses for the experiments at 7.5 and 11.4 m s−1 is presented in Fig. 11a and b, respectively. In both Figs. 9a and b and 10a and b the maximum energy is located at the platform surge natural frequency. This natural frequency is excited by low-frequency loads such as the wind loading and the wave second-order difference-frequency effects.
Figure 11a and b show that the numerical platform surge motion with first-order hydrodynamics is very similar to the experimental curve in the low-frequency region. This indicates that with the wind and wave conditions tested, the second-order hydrodynamics does not contribute significantly to the platform response. This also means that the wind turbine loading dominates the response for both wind speeds. This was also reported in Azcona et al. (2019) for the OC4 platform with the 5 MW NREL wind turbine, where the wind loading dominates the platform response compared to hydrodynamics near rated wind speed.
Figure 11c presents a sudden decrease in the surge response inside the wave frequency region for the case of 7.5 m s−1. This is a cancellation effect and is the result of the interaction of the length of the floater with the incident wavelength that produces no force and moment on the SATH platform at a particular cancellation frequency. This effect is also detected in the surge response at 11.4 m s−1. This shows that the first-order hydrodynamics numeric modeling used can properly reproduce the dynamic behavior of the floater at the wave region.
The platform PSD pitch response for 7.5 m s−1 is presented in Fig. 12a. Both numerical models approach the experimental response well, but at the pitch natural frequency the numerical models underestimate the experimental peak. This might be caused by uncertainties in the coupling elements of the stiffness matrix that represents the retention system. The underprediction of low-frequency response has also been described in several publications such as Azcona et al. (2019) and Robertson et al. (2020). According to Robertson et al. (2020), the numerical model low-frequency response could be improved by including second-order terms to the wave kinematics or tuning the drag coefficients.
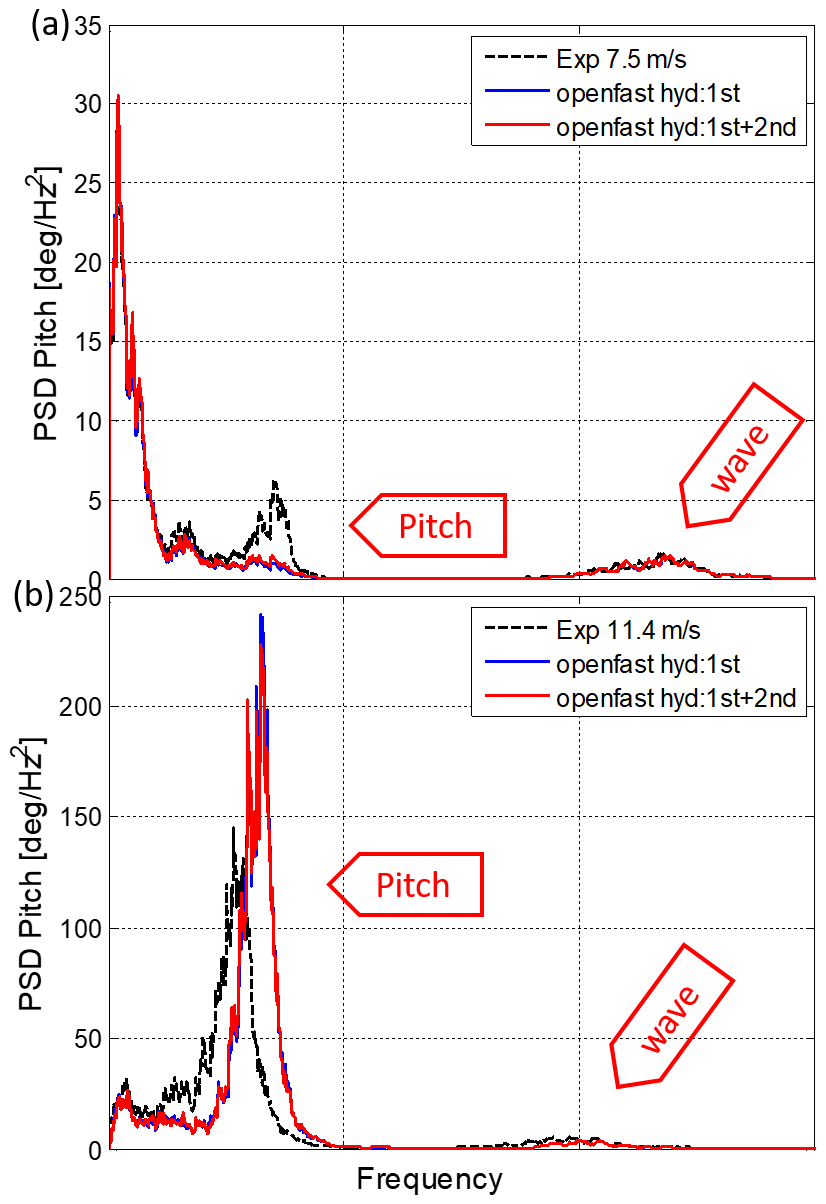
Figure 12Pitch PSD response of SATH 10 MW under turbulent wind with average of (a) 7.5 m s−1 and irregular waves with Hs=2.0 m and Tp=8.5 s and (b) 11.4 m s−1 and irregular waves with Hs=3.0 m and Tp=10.5 s.
The pitch response for the mean wind speed of 11.4 m s−1 is shown in Fig.12b. This PSD shows that the experimental pitch natural frequency is shifted to a lower frequency with respect to the value obtained from the free-decay test and also with respect to the experiment for 7.5 m s−1 in Fig. 12a. The numerical results do not present this displacement of the natural frequency to a lower frequency, and the result is coherent with the natural frequency at the experiment for 7.5 m s−1 in Fig. 12a. The reason for this decrease in the experimental pitch natural frequency is discussed in detail in the next section.
Figures 13 and 14 show that the platform yaw response predicted by the numerical simulation for the two turbulent wind speeds matches the experimental yaw response in the time domain with very good agreement. This also indicates that the rotor moment around the vertical axis, Mz, introduced by the actuator in the experiment is correctly captured. The non-linear hydrodynamics does not produce a significant difference between in yaw numeric response, as was seen for the surge and pitch responses. The platform yaw response is dominated by wind turbine loading introduced by means of the Mz moment.
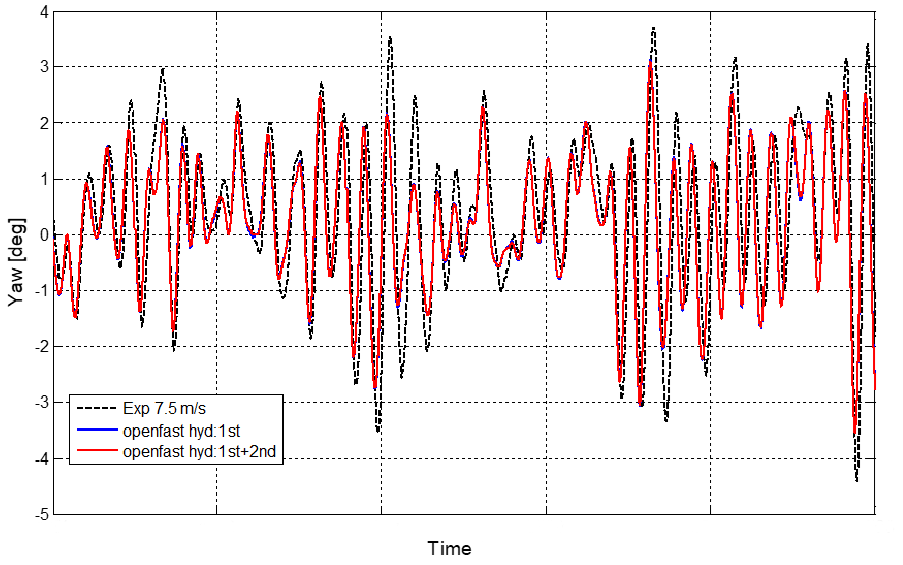
Figure 13Yaw response of SATH 10 MW under turbulent wind with average of 7.5 m s−1 and irregular waves with Hs=2.0 m and Tp=8.5 s.
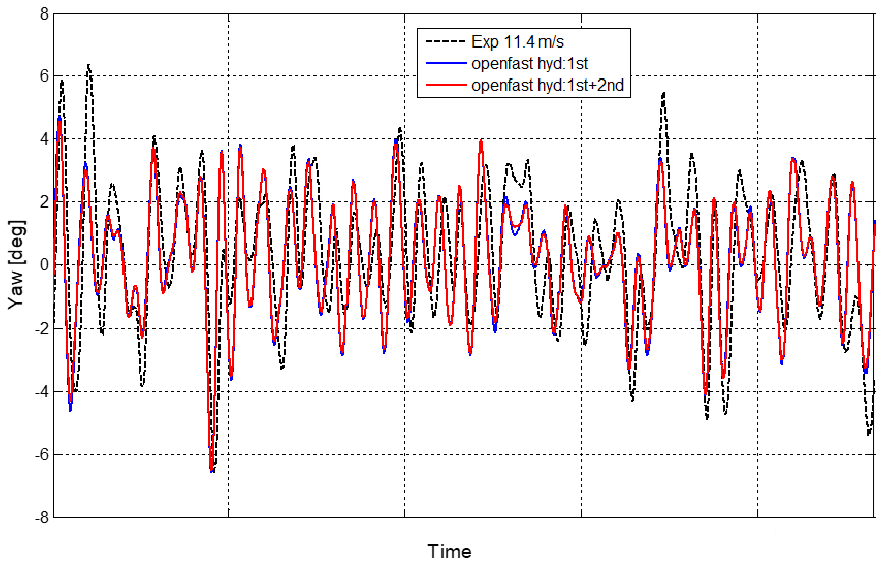
Figure 14Yaw response of SATH 10 MW under turbulent wind with average of 11.4 m s−1 and irregular waves with Hs=3.0 m and Tp=10.5 s.
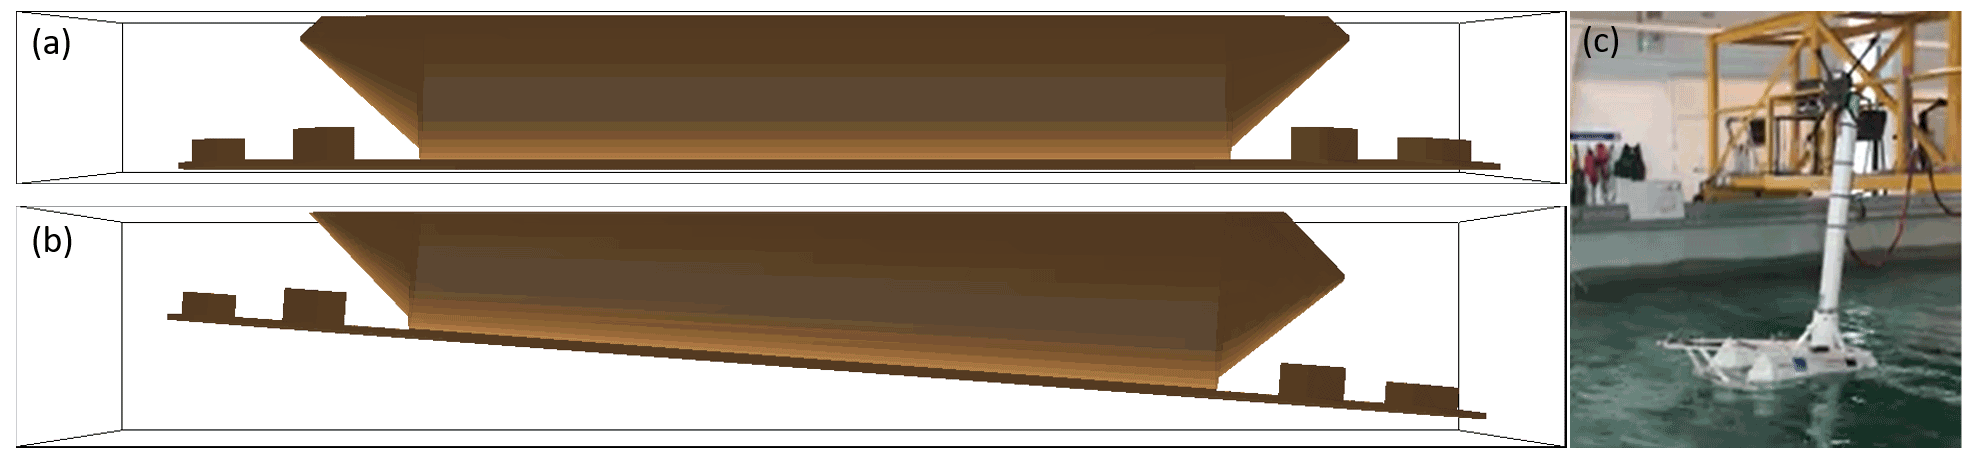
Figure 15(a) Geometry of the wet surface of the platform at its equilibrium position. (b) Geometry of the wet surface of the platform considering the platform mean pitch and heave displacements under a turbulent wind of 11.4 m s−1 of mean wind speed and irregular waves. (c) Photograph of the platform during tank testing under wind and wave loading.
4.5 Hydrodynamic modeling of a floating platform in OpenFAST
As is discussed in the previous section, in relation to Fig. 12b, the platform pitch natural frequency in the experiment is shifted to a lower frequency, in comparison with the natural frequency observed in the free decays and in the PSDs for the cases with 7.5 m s−1 of turbulent mean wind speed.
This shift in the natural frequency could be caused by the change in the hydrostatic and hydrodynamic properties of the submerged substructure due to the pitch rotation of the platform at rated wind speed. In this case, the platform presents a mean pitch inclination of 4.3∘ and mean heave of −1.2 m.
To confirm this hypothesis, we built a new mesh of the submerged substructure for the geometry corresponding to the pitched platform at rated wind speed. Figure 15a presents the mesh for the original geometry of the submerged platform, used in WAMIT to calculate the added mass, potential damping, hydrostatic stiffness and wave excitation coefficients.
Figure 15b presents the mesh for the submerged substructure geometry corresponding to the mean pitch and heave at 11.4 m s−1 turbulent mean wind speed. It is equivalent to the platform position observed during the experiments as in Fig. 15c.
The new tilted geometry from Fig. 15b produced a reduction in the hydrostatic stiffness for the pitch DOF of around 2 %. The case with turbulent wind at a rated wind speed of 11.4 m s−1 and irregular waves was simulated again with the new hydrostatic and hydrodynamic properties computed for the tilted geometry. The results are compared with the original simulation and with the experiments in the pitch PSD in Fig. 16. This plot shows that the natural frequency of numerical results with the tilted geometry also decreases with respect to the original simulation where the mesh is not pitched. The new frequency now matches the shifted pitch frequency from the experiments. This indicates that the advanced shape of this platform requires careful consideration of the geometrical non-linearities to obtain accurate numerical results.
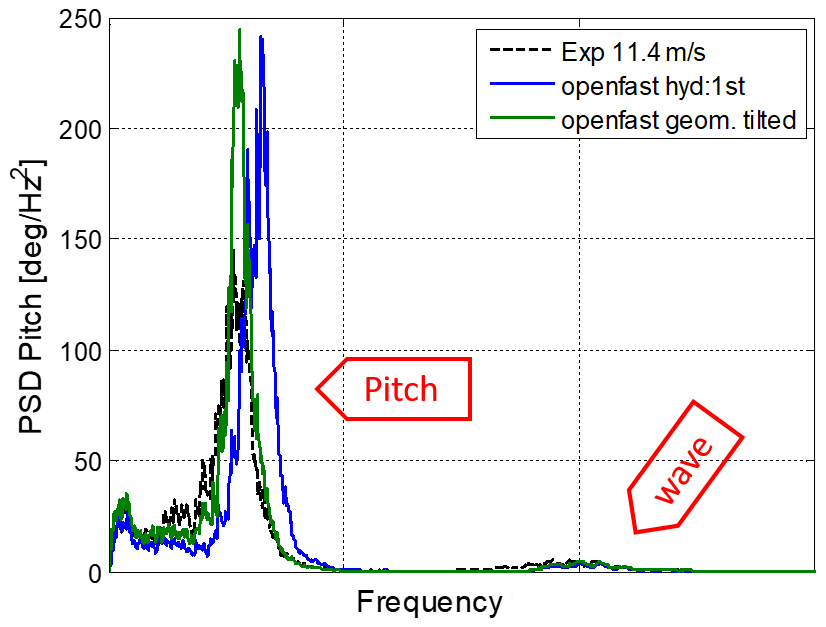
Figure 16Pitch PSD response comparison between experiment curve, numeric model with platform without tilt and tilted under turbulent wind of 11.4 m s−1, and irregular waves with Hs=3.0 m Tp=10.5 s.
The pitch response at the wave frequency remained similar when the platform is tilted. Also, the surge response with the tilted geometry result was not different compared to the non-tilted geometry in the wave frequency region. The added mass in yaw increased by 14 % with the tilted geometry, but it did not impact the platform yaw response.
The hybrid SiL methodology was applied to a tank test campaign of the floating offshore substructure SATH supporting the INNWIND 10 MW wind turbine, which was performed at the Lir National Ocean Test Facility of University College Cork (UCC).
During the experimental campaign we used the most recent version of the SiL method developed at CENER that is able to introduce the rotor thrust and also the moments in the yaw and pitch axes. Therefore this enhanced SiL method including the out-of-plane rotor moment is able to reproduce the system’s yaw motion. Good agreement between measurements and simulations was found for the platform motion in cases with steady wind only, turbulent wind only and simultaneous turbulent wind and irregular waves. In particular, the measured yaw response compares well with the simulations in OpenFAST for all the test cases considered, showing the successful performance of the new feature.
The wind turbine aerodynamic loading dominates the platform response under the wind and wave condition tested for the low frequencies. The second-order hydrodynamics introduced in the simulations did not produce significant improvement of the numerical prediction for the conditions tested.
It was observed that for the case at rated wind speed there was an important shift in the pitch natural frequency of the experiment compared with the experiment with lower wind loading. The simulation results do not capture this shift because the hydrostatic properties are not updated as the platform tilts. The simulation with the updated hydrostatic properties of the tilted geometry also resulted in a shift in the natural frequency that better matched the experimental results. This indicates that for a platform like SATH 10 MW with a complex platform geometry piercing the water plane area, the hydrostatic stiffness is highly non-linear. The accurate numerical representation of the system dynamics might require consideration of the variation in the hydrostatic stiffness matrix with the platform tilt.
The OpenFAST code is freely available at https://github.com/OpenFAST/OpenFAST/tree/v2.2.0 (NREL, 2019). For the SiL testing a modified version of FAST v6 has been used. This version is not public for confidential reasons.
Experimental data sets are not public for confidential reasons.
FV reviewed the experimental data contributing to the results analysis and validation and calibrated the numerical model in OpenFAST. JA contributed to the conceptualization of the work, the experimental and validation results analysis, the preparation of the SiL hybrid numerical model, and revision of the paper. OP supervised the SiL operation during tests at the tank, defined the actuator control system, and improved the interface of the SiL control program in LabVIEW. IE developed the wind turbine controller for the SATH 10 MW INNWIND floating wind turbine. AR was responsible for the experiment tests and helped to define each test of the experimental campaign. AM contributed to the definition of the experiment tests and model scales. CG supervised the preparation activities before the test campaign. CD was responsible for the tank instrument and operation of the wave generator and also helped to define the test methodology. FV prepared the manuscript of this article with contributions from all co-authors.
The contact author has declared that none of the authors has any competing interests.
Publisher's note: Copernicus Publications remains neutral with regard to jurisdictional claims in published maps and institutional affiliations.
Authors want to give thanks to Christian van den Bosch and Otter Aldert from University College Cork for their assistance during the experiment setup. The authors also want to thank Juan Martínez Belio and Jon Olagüe from the Structural Area of the Department of Wind Turbine Analysis and Design (CENER) for their support with the mesh generation from the CAD floating platform.
This research has been developed within the project ARCWIND – Adaptation and Implementation of Floating Wind Energy Conversion Technology for the Atlantic Region, funded by the Interreg Atlantic Area program through the European Regional Development Fund under contract EAPA 344/2016.
This paper was edited by Alessandro Bianchini and reviewed by two anonymous referees.
Azcona, J., Bouchotrouch, F., González, M., Garciandía, J., Munduate, X., Kelberlau, F., and Nygaard, T. A.: Aerodynamic Thrust Modelling in Wave Tank Tests of Offshore Floating Wind Turbines Using a Ducted Fan, J. Phys.: Conf. Ser., 524, 012089, https://doi.org/10.1088/1742-6596/524/1/012089, 2014a. a, b, c
Azcona, J., Bredmose, H., Campagnolo, F., Manjock, A., Pereira, R., and Sander, F.: INNWIND D4.22: Verification and Validation of design methods for floating structures, http://www.innwind.eu/publications/deliverable-reports (last access: 26 October 2022), 2014b. a
Azcona, J., Bouchotrouch, F., and Vittori, F.: Low-frequency dynamics of a floating wind turbine in wave tank-scaled experiments with SiL hybrid method, Wind Energy, 22, 1402–1413, https://doi.org/10.1002/we.2377, 2019. a, b, c, d
Bachynski, E., Chavaud, V., and Sauder, T.: Real Time Hybrid Model Testing of Floating Wind Turbines: Sensitivity to Limited Actuation, Energy Procedia, 80, 2–12, https://doi.org/10.1016/j.egypro.2015.11.400, 2015. a
Bak, C., Zahle, F., Bitsche, R., Taeseong, K., Yde, A., Henrik-sen, L. C., Natarajan, A., and Hansen, M. H.: Descrip-tion of the DTU 10 MW Reference Wind Turbine, Technical Report Report-I-0092, DTU Wind Energy, https://orbit.dtu.dk/files/55645274/The_DTU_10MW_Reference_Turbine_Christian_Bak..pdf (last access: 26 October 2022), 2013. a
Belloli, M., Bayati, I., Facchinetti, A., Fontanella, A., Giberti, H., La Mura, F., Taruffi, F., and Zasso, A.: A hybrid methodology for wind tunnel testing of floating offshore wind turbines, Ocean Eng., 210, 107592, https://doi.org/10.1016/j.oceaneng.2020.107592, 2020. a
Bredmose, H., Larsen, S. E., Matha, D., Rettenmeier, A., Marino, E., and Saettran, L.: MARINET D2.4: Collation of offshore wind wave dynamics, https://www.marinet2.eu/wp-content/uploads/2017/04/D2.04-Collation-of-Offshore-Wind-Wave-Dynamics.pdf (last access: 26 October 2022), 2012. a
Chakrabarti, S. K.: Handbook of Offshore Engineering, in: Vol. 2, Elsevier, p. 1004, ISBN 9780080523811, 2005. a
DNV-ST-0119: Floating wind turbine structures, Standard, DNV AS, DNV GL, https://rules.dnv.com (last access: 26 October 2022), 2021. a
Faltinsen, O. M.: Sea Loads on Ships and Offshore Structures, Cambridge University Press, p. 12, ISBN 0521458706, 1990. a
Fontanella, A., Liu, Y., Azcona, J., Pires, O., Bayati, I., Gueydon, S., de Ridder, E. J., van Wingerden, J. W., and Belloli, M.: A hardware-in-the-loop wave-basin scale-model experiment for the validation of control strategies for floating offshore wind turbines, J. Phys.: Conf. Ser., 1618, 032038, https://doi.org/10.1088/1742-6596/1618/3/032038, 2020. a
Jonkman, B.: TurbSim user's guide: version 2.0, Draft Report, NREL, Boulder, CO, USA, https://www.nrel.gov/docs/fy06osti/39797.pdf (last acces: 26 October 2022), 2016. a
Jonkman, J. M.: Dynamics Modeling and Loads Analysis of an Offshore Floating Wind Turbine, Technical Report NREL/TP-500-41958, NREL, https://nrel.gov/docs/fy08osti/41958.pdf (last access: 26 October 2022), 2007. a, b
Journée, J. M. J. and Massie, W. W.: Offshore Hydromechanics, 1st Edn., Delft University of Technology, Delft, 10–28, 2001. a
Koch, C., Lemmer, F., Borisade, F., Matha, D., and Cheng, P. W.: Validation of INNWIND.EU Scaled Model Tests of a semisubmersible Floating Wind Turbine, in: Proceedings of the Twenty sixth International Conference on Offshore and Polar Engineering, 17–22 June 2016, Rhodes, Greece, https://doi.org/10.18419/opus-8967, 2016. a
Lee C. H. and Newman J. N.: WAMIT® User Manual, Versions 6.3, 6.3PC, 6.3S, 6.3S-PC, WAMIT, Inc., Chestnut Hill, MA, https://www.wamit.com/manual.pdf (last access: 26 October 2022), 2006. a
NREL: OpenFAST v2.2, GitHub [code], https://github.com/OpenFAST/OpenFAST/tree/v2.2.0 (last access: 26 October 2022), 2019. a, b, c
Pires, O., Azcona, J., Vittori, F., Bayati, I., Gueydon, S., Fontanella, A., Liu, Y., de Ridder, E. J., Belloli, M., and van Wingerden, J. W.: Inclusion of rotor moments in scaled wave tank test of a floating wind turbine using SiL hybrid method, J. Phys.: Conf. Ser., 1618, 032048, https://doi.org/10.1088/1742-6596/1618/3/032048, 2020. a
Roald, L., Jonkman, J., Robertson, A., and Chokani, N.: The effect of second-order hydrodynamics on floating offshore wind turbines, Energy Procedia, 35, 253–264, 2010. a
Robertson, A., Jonkman, J., Masciola, M., Molta, P., Goupee, A., Coulling, J., Prowell, I., and Browning, J.: Summary of Conclusions and Recommendations Drawn from the DeepCWind Scaled Floating Offshore Wind System Test Campaign, in: 32nd International Conference on Ocean, Offshore and Arctic Engineering OMAE, 8–13 June 2013, Nantes, France, https://doi.org/10.1115/OMAE2013-10817, 2013. a
Robertson, A., Gueydon, S., Bachynski, E., Wang, L., Jonkman, J., Alarcón, D., Amet, E., Beardsell, A., Bonnet, P., Boudet, B., Brun, C., Chen, Z., Féron, M., Forbush, D., Galinos, C., Galvan, J., Gilbert, P., Gómez, J., Harnois, V., Haudin, F., Hu, Z., Dreff, J., Leimeister, M., Lemmer, F., Li, H., Mckinnon, G., Mendikoa, I., Moghtadaei, A., Netzband, S., Oh, S., Pegalajar-Jurado, A., Nguyen, M., Ruehl, K., Schünemann, P., Shi, W., Shin, H., Si, Y., Surmont, F., Trubat, P., Qwist, J., and Wohlfahrt-Laymann, S.: OC6 Phase I: Investigating the Underprediction of Low-Frequency Hydrodynamic Loads and Responses of a Floating Wind Turbine, J. Phys.: Conf. Ser., 1618, 032033, https://doi.org/10.1088/1742-6596/1618/3/032033, 2020. a, b
Roddier, D., Cermelli, C., Aubault, C., and Weinstein, A.: WindFloat: A Floating foundation for Offshore Wind Turbines, J. Renew. Sustain. Energ., 2 033104, https://doi.org/10.1063/1.3435339, 2010. a
SATH Technology: Online Sath Description, https://saitec-offshore.com/sath/, last access: 4 February 2022. a, b
Vittori, F., Bouchotrouch, F., Lemmer, F., and Azcona, J.: Hybrid scaled testing of a 5 MW floating wind turbine using the SiL method compared with numerical models, in: 37th International Conference on Ocean, Offshore and Arctic Engineering OMAE, 17–22 June 2018, Madrid, Spain, https://doi.org/10.1115/OMAE2018-77853, 2018. a
Vittori, F., Pires, O., Azcona, J., Uzunolgu, E., Guedes-Soares, C., Zamora-Rodríguez, R., and Souto-Iglesias, A.: Hybrid scaled testing of a 10 MW TLP floating wind turbine using the SiL method to integrate the rotor thrust and moments, Developments in Renewable Energies Offshore, 1st Edn., Taylor & Francis Group, https://doi.org/10.1201/9781003134572-48, 2020. a, b
- Abstract
- Introduction
- Description of the software-in-the-loop (SiL) methodology
- SATH 10 MW OpenFAST numerical model for comparison
- Results discussions
- Conclusions
- Code availability
- Data availability
- Author contributions
- Competing interests
- Disclaimer
- Acknowledgements
- Financial support
- Review statement
- References