the Creative Commons Attribution 4.0 License.
the Creative Commons Attribution 4.0 License.
 | 24 Mar 2022
Validation of wind resource and energy production simulations for small wind turbines in the United States
Lindsay M. Sheridan
Caleb Phillips
Alice C. Orrell
Larry K. Berg
Heidi Tinnesand
Raj K. Rai
Sagi Zisman
Dmitry Duplyakin
Julia E. Flaherty
Due to financial and temporal limitations, the small wind community relies upon simplified wind speed models and energy production simulation tools to assess site suitability and produce energy generation expectations. While efficient and user-friendly, these models and tools are subject to errors that have been insufficiently quantified at small wind turbine heights. This study leverages observations from meteorological towers and sodars across the United States to validate wind speed estimates from the Wind Integration National Dataset (WIND) Toolkit, the European Centre for Medium-Range Weather Forecasts (ECMWF) Reanalysis v5 (ERA5), and the Modern-Era Retrospective Analysis for Research and Applications, version 2 (MERRA-2), revealing average biases within ±0.5 m s−1 at small wind hub heights. Observations from small wind turbines across the United States provide references for validating energy production estimates from the System Advisor Model (SAM), Wind Report, MyWindTurbine.com, and Global Wind Atlas 3 (GWA3), which are seen to overestimate actual annual capacity factors by 2.5, 4.2, 11.5, and 7.3 percentage points, respectively. In addition to quantifying the error metrics, this paper identifies sources of model and tool discrepancies, noting that interannual fluctuation in the wind resource, wind speed class, and loss assumptions produces more variability in estimates than different horizontal and vertical interpolation techniques. The results of this study provide small wind installers and owners with information about these challenges to consider when making performance estimates and thus possible adjustments accordingly. Looking to the future, recognizing these error metrics and sources of discrepancies provides model and tool researchers and developers with opportunities for product improvement that could positively impact small wind customer confidence and the ability to finance small wind projects.
- Article
(893 KB) - Full-text XML
- BibTeX
- EndNote


This work was authored by Pacific Northwest National Laboratory, operated for the US Department of Energy (DOE) by Battelle under contract DE-AC05-76RL01830, and by the National Renewable Energy Laboratory, operated by Alliance for Sustainable Energy, LLC, for the DOE under contract DE-AC36-08GO28308. The views expressed in the article do not necessarily represent the views of the DOE or the US Government. The US Government retains and the publisher, by accepting the article for publication, acknowledges that the US Government retains a nonexclusive, paid-up, irrevocable, worldwide license to publish or reproduce the published form of this work, or allow others to do so, for US Government purposes.
The total global installed capacity of small wind turbines is estimated at approximately 1.8 GW (Orrell et al., 2021). In the United States, small wind turbines (i.e., wind turbines with rated capacities of 100 kW or less) comprise a national installed capacity of more than 150 MW and are poised for continuing contribution to the role distributed energy resources play in the decarbonization of the US economy (Orrell et al., 2021). In addition to helping to reach decarbonization goals, small wind turbines, standalone or as components of hybrid power systems, have the potential to improve energy accessibility, equity, and security for rural and underrepresented communities. Bednar and Reames (2020) report stark disparities in the percentage of household income spent on energy bills across the US, with disproportionately high energy burdens falling on low-income, African American, Latinx, and multifamily households. Fathollahzadeh et al. (2021) note that Native American nations are approximately 10 times more likely to lack access to primary services, such as electricity, than the average US household. To address this disparity, Fathollahzadeh et al. (2021) propose a methodology to establish electricity demand, simulate wind and solar contributions in a hybrid system, and select an ideal hybrid system installation location.
Consumer adoption of small wind is influenced by multiple factors, including project costs, availability of incentives, and confidence in the turbine's ability to generate energy. The last of these factors is strongly affected by the level of accuracy in the prediction of energy production at a site of development interest (Fields et al., 2016; Acker et al., 2019). Accurate energy production estimates begin with an understanding of the available wind resource. While large-scale wind plants have the means to perform detailed observation-driven wind resource and site assessments, small-scale wind projects typically rely on models and assessment tools to survey the energy production potential at a location of interest (Drew et al., 2015). In this study, we evaluate the performance of wind resource assessments at small wind hub heights (10 to 50 m) based on three models and reanalyses available to the small wind industry: the Wind Integration National Dataset (WIND) Toolkit developed by the National Renewable Energy Laboratory (Draxl et al., 2015a), the European Centre for Medium-Range Weather Forecasts (ECMWF) Reanalysis v5 (ERA5) (Hersbach et al., 2020), and the National Aeronautics and Space Administration (NASA) Global Modelling and Assimilation Office (GMAO) Modern-Era Retrospective Analysis for Research and Applications, version 2 (MERRA-2) (Gelaro et al., 2017).
Validations of models that provide wind resource simulations are plentiful but tend to focus on heights near the surface (10 m or less) (Carvalho, 2019; Wang et al., 2019; Gruber et al., 2019; Molina et al., 2021) or are relevant to utility-scale and offshore wind hub heights, typically 50 m and higher (Draxl et al., 2015b; Olauson, 2018; Gruber et al., 2019; Jourdier, 2020; Brune et al., 2021). Typical small wind turbine hub heights range between 10 and 50 m (Orrell et al., 2018, 2021), and model wind speed validations at these heights exist in more limited quantities. Ramon et al. (2019) validated reanalysis-based wind speeds using 77 global meteorological towers with measurement heights ranging from 18 to 122 m. They found median seasonal biases between 0 and −1 m s−1 and correlation coefficients around 0.8 for ERA5 and MERRA-2, however error metrics according to height above ground were not specified. Kalverla et al. (2020) analyzed measurements ranging from 27 to 315 m over the North Sea and determined that ERA5 underestimates the observed wind speed by ∼0.5 m s−1 across the vertical wind speed profile. For three sites in California with wind speed measurements at 30 m, Hodge (2016) determined seasonal and diurnal correlation coefficients for the WIND Toolkit ranging from 0.40 to 0.96. At locations in Colorado and Washington, Poudel et al. (2019) found WIND Toolkit wind speed biases at small wind hub heights of −1.1 and −0.63 m s−1, respectively. In Arizona, Acker et al. (2019) found the WIND Toolkit to be a satisfactory wind speed data product for simulating annual energy production within a computational flow modeling framework. This work aims to provide a more complete understanding of simulated wind speed performance at small wind hub heights in order to highlight areas of improvement for model developers and to educate small wind adopters on the limitations of the modeled data.
Our analysis continues with an evaluation of four energy production simulation tools: the System Advisor Model (SAM) from the National Renewable Energy Laboratory (NREL) (2021a), Wind Report from Bergey WindPower Co. (2021), MyWindTurbine.com from the Technical University of Denmark (DTU) Wind Energy research organization and Energi- og MiljøData (EMD) International A/S (2021), and the energy yield calculations from Global Wind Atlas 3 (GWA3) from DTU Wind Energy and World Bank Group (2021). These user-friendly and budget-friendly tools combine wind resource models, such as the WIND Toolkit, with included or user-added power curves and loss assumptions to produce site-specific annual energy production estimates. While validations of SAM exist for solar technology using actual plant performance data (Freeman et al., 2013, 2019; Rudié et al., 2014; Ezeanya et al., 2018), we were unable to determine similar validations of SAM for small wind systems. Similarly, no validations of Wind Report or GWA3 using small wind turbine production observations were able to be identified. Bechmann et al. (2016) provide a performance evaluation of MyWindTurbine.com using 20 small wind turbines in Denmark, but we note that the wind resource datasets specific to Denmark employed by MyWindTurbine.com are different and presumably better than the datasets used for the rest of the world and recommend more expansive validation efforts. This study will provide validations for all four tools across the United States using actual small wind turbine performance data so that small wind adopters are made aware of the uncertainties associated with each tool and can make adjustments to output expectations accordingly.
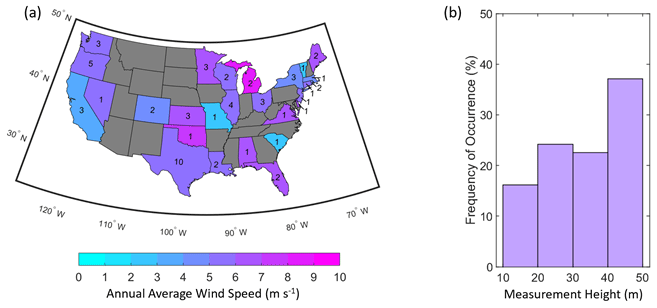
Figure 1(a) Number of locations and annual average observed wind speeds determined from the measurements made in each state (states with insufficient observations at small wind heights are indicated in grey) and (b) histogram of wind speed observations according to measurement height.
The remainder of this paper is organized as follows: in Sect. 2, the wind speed and energy production observations, models, and tools considered in the study are described. Section 2 concludes with a discussion on the error metrics employed to validate each model and tool. Section 3 presents the findings of the validation, beginning with the overall model wind speed performance metrics and continuing into a discussion of these results according to the diurnal cycle and observed wind speed class. Section 3 proceeds with the energy production validation and explores these results according to geographic region, turbine type, and hub height. Section 3 concludes with an investigation into the sources of discrepancy between actual and simulated small wind turbine production, quantifying the potential impact of each identified source on the accuracy of the simulations. Finally, Sect. 4 summarizes the results of Sect. 3 into a comprehensive guide to understanding the uncertainty in wind resource and energy production estimates for small wind turbines, provides recommendations for application of the findings to real world small wind turbine resource assessments, and concludes with an outlook into new and upcoming advancements in simulation technology that will benefit the small wind community.
2.1 Wind speed observations
The observational wind speed datasets for this study are drawn from US Department of Energy National Laboratories (Argonne National Laboratory, Brookhaven National Laboratory, NREL, Oak Ridge National Laboratory, Pacific Northwest National Laboratory, Savannah River National Laboratory), the National Oceanic and Atmospheric Administration (National Centers for Environmental Information, National Data Buoy Center), the Bonneville Power Administration, the University of Massachusetts, and the first Wind Forecast Improvement Project (Wilczak et al., 2015). These in situ measurements were gathered from anemometers on meteorological towers or collected using sodars. Taken together, this data collection combines publicly available data (46 sites), data available upon request (1 site), and data subject to non-disclosure agreements (15 sites) as outlined in the data availability statement.
The 62 resulting observations are diverse in geography and terrain complexity, spanning 27 states (Fig. 1a), and height above ground (Fig. 1b). Several observations on islands are included because small wind turbines play a role in mitigating electrical power generation costs in remote and isolated communities (Devine et al., 2004; Dilley and Hulse, 2007; Kolbert, 2008). To ensure a high-fidelity reference dataset for validation, the wind speed observations are quality-controlled via the removal of instances or periods of atypical or unphysical reported wind speeds (less than 0 m s−1, greater than 50 m s−1, or nonvarying values over periods of time greater than 3 h). In order to maintain representation of the seasonal cycle and consistent standards for comparison of error metrics on a site-by-site basis, wind speed observations with 80 % or greater data recovery for each complete year of the data record are included. The temporal coverage of the wind speed observations ranges from 1–7 years, with an average of 4 years. For the 48 observations that cover 2 years or more, the interannual standard deviations of annual average wind speeds range from 0.01 to 1.25 m s−1 with an average standard deviation of 0.24 m s−1. The maximum interannual differences between annual average wind speeds range from 0.02 to 3.33 m s−1 with an average maximum difference of 0.58 m s−1.
Table 1Characteristics of the models and reanalyses that produce wind speed estimates.
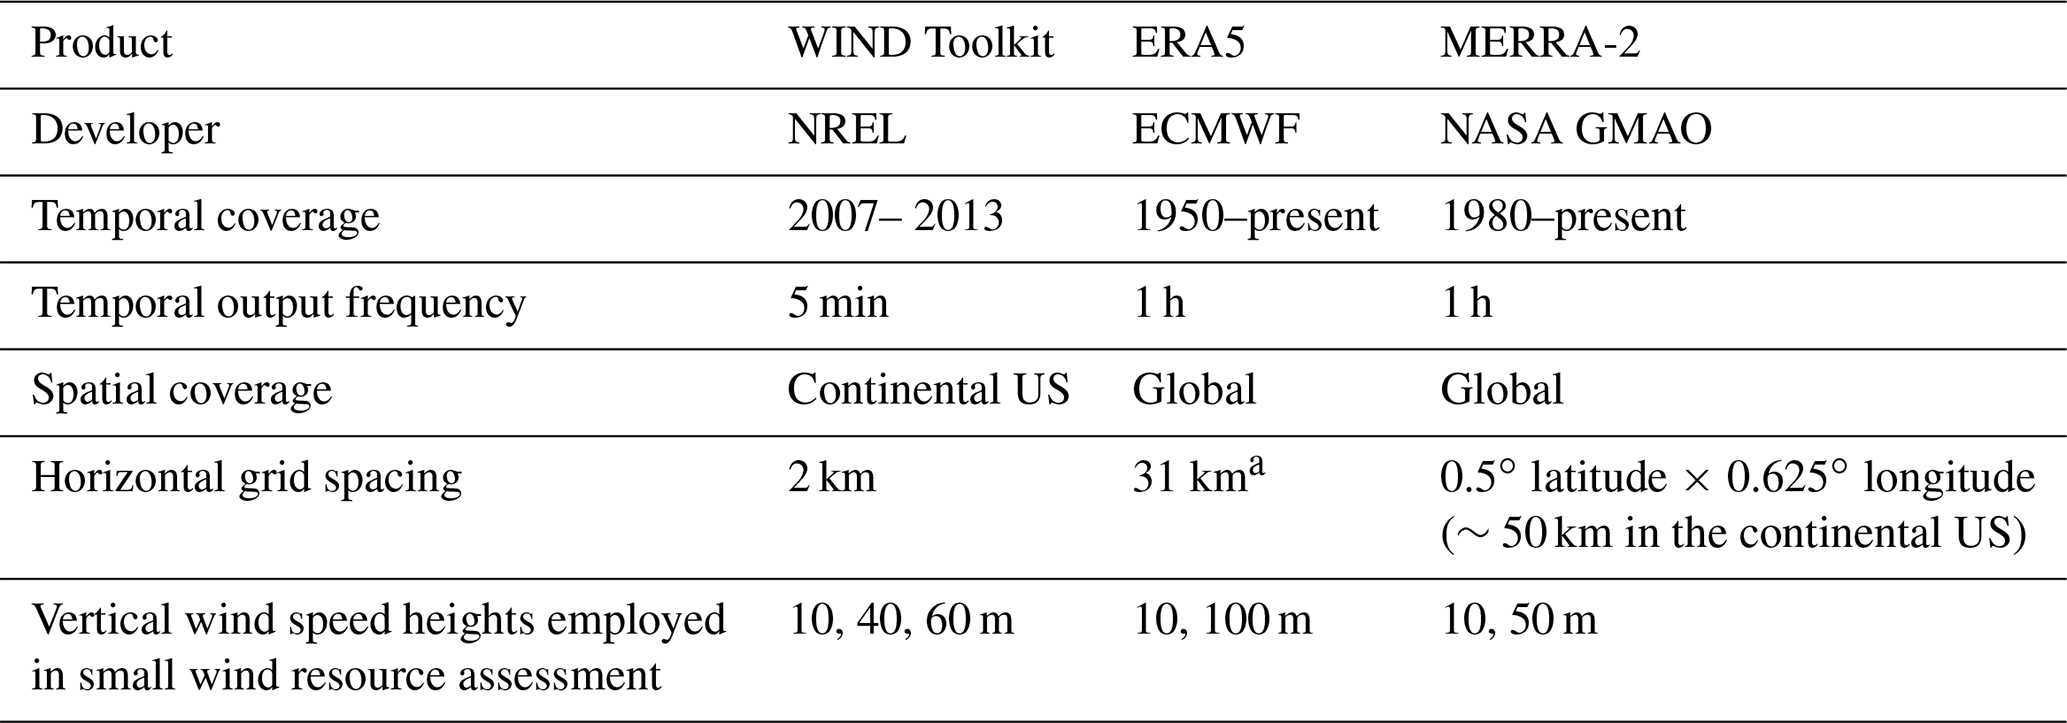
a The data have been converted from the native reduced Gaussian grid to a regular latitude–longitude grid at 0.25∘ (Hersbach et al., 2020).
2.2 Wind resource models
Wind resource estimates from three commonly used models or reanalysis products are evaluated in this study and described in Table 1. The WIND Toolkit is specifically designed to support wind integration studies (Draxl et al., 2015a), while ERA5 (Hersbach et al., 2020) and MERRA-2 (Gelaro et al., 2017) are reanalysis products that provide a broad spectrum of atmospheric variables, including wind information, and are commonly employed in wind energy studies (Olauson, 2018; Rabbani and Zeeshan, 2020; Pryor and Barthelmie, 2021; Samal, 2021). While the WIND Toolkit covers a shorter period of time than the reanalyses and does not include data assimilation, it provides better spatial and temporal resolution (Table 1).
For each of the gridded model datasets in Table 1, two horizontal interpolation techniques are considered in the validation analysis: nearest neighbor (selecting the closest geographical grid point to the observational location) and distance-weighted (triangulation-based linear interpolation to the observational location using the four surrounding grid points). Vertically, if an observational height is identical to a model output height, the wind speed at that model output height is employed in the validation with no adjustment. Because each model in Table 1 outputs wind speed information at or above and below each height z in the observational wind speed collection, the power law shown in Eq. (1), in conjunction with a dynamic shear exponent (α), as shown in Eq. (2), calculated using the simulated wind speeds vlo and vhi from the two surrounding model heights zlo and zhi, is employed for locations requiring model adjustment to measurement height. This vertical interpolation scheme for simulation of the wind speed at the measurement height is selected because it considers multiple levels in the wind speed profile and does not rely on static stability assumptions (Olauson and Bergkvist, 2015).
The horizontal and vertical interpolation schemes employed in this validation were evaluated for the WIND Toolkit by Duplyakin et al. (2021), and their resultant error metrics were found to vary minimally according to these and other interpolation schemes. This work builds upon their findings and extends the horizontal interpolation comparison to coarser models, namely ERA5 and MERRA-2, for which the choice of interpolation scheme may yield more significant differences in the resultant simulated wind speeds.
2.3 Energy production observations
The energy production observations utilized in this validation are from individual small wind turbines courtesy of APRS World; Argonne National Laboratory; Bergey WindPower Co.; Claverack Rural Electric Cooperative, Inc.; and the New York State Energy Research and Development Authority. Similar to the observational wind speed collection, the energy production observations from 55 turbines are diverse in geography and terrain complexity, spanning 24 states (Fig. 2a), and in turbine hub height (Fig. 2b). Four different turbine models with rated capacities ranging from 2.1 to 56 kW are included in the observational collection, as shown in Table 2 with their associated power curves displayed in Fig. 2c.
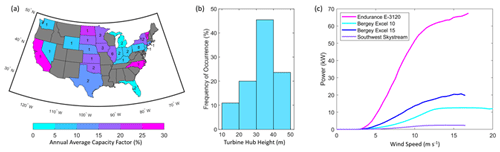
Figure 2(a) Number of locations and annual average capacity factors per state (states with insufficient small wind turbine production observations are indicated in grey), (b) histogram of turbine hub heights, and (c) turbine power curves employed in this study.
Table 2Small wind turbine models employed in the validation.

a Southwest Windpower closed in 2013, and the remaining Skystream assets were acquired by the now-defunct XZERES Corporation. The Skystream turbine models included in this analysis were installed in 2008 through 2012.
To allow for comparisons with simulated annual energy production estimates, years of energy production observations with significant data outages (i.e., more than 1 month duration) are excluded from this validation. The temporal coverage of the energy production observations ranges from 1–10 years, with an average of 5 years. The resolution of turbine availability data ranges from no availability data provided to highly detailed availability data, as in the APRS World and Bergey WindPower Co. collection, which provides the percent of time each turbine is running, waiting for wind, and stopped for a variety of reasons. In order to facilitate the comparison of energy production across turbines with different rated capacities, the average annual energy production from each turbine is divided by the product of the unique turbine rated capacity and the number of hours in 1 year, resulting in a capacity factor percentage. The 55 turbines employed in this validation produced capacity factors ranging from 1.7 % at a location in the Southeast, a region characterized by lower wind resource relative to the rest of the United States (NREL, 2021b), to 28.2 % at a local elevation maximum in the Northeast.
2.4 Energy production tools
Four simple, user-friendly tools for energy production simulation are evaluated to establish a baseline of accuracy of the estimates and to assess the trade-off between tool efficiency and accuracy. SAM, Wind Report, MyWindTurbine.com, and GWA3 provide localized annual energy production estimates in kilowatt-hours in a matter of seconds to minutes on a standard laptop computer. Each tool is driven by model wind resource information that is either provided by the user or more conveniently included in the tools, as reported in Table 3. GWA3 provides the highest-resolution wind resource data at 250 m. By default, SAM employs the WIND Toolkit for wind resource data, and Wind Report sources wind resource data from a model with similar spatial resolution. MyWindTurbine.com uses model wind resource data from the Global Wind Atlas 1 (GWA1) with a spatial resolution similar to MERRA-2 for countries outside of Denmark. Within Denmark, MyWindTurbine.com utilizes wind climate estimates from Weather Research and Forecasting (WRF) model output (Hahmann et al., 2014). SAM allows a user to select a single year of WIND Toolkit wind resource data from 2007 to 2013 for annual energy production estimation, the default of which is 2013.
Table 3Characteristics of the tools that provide annual energy estimates evaluated in this study.
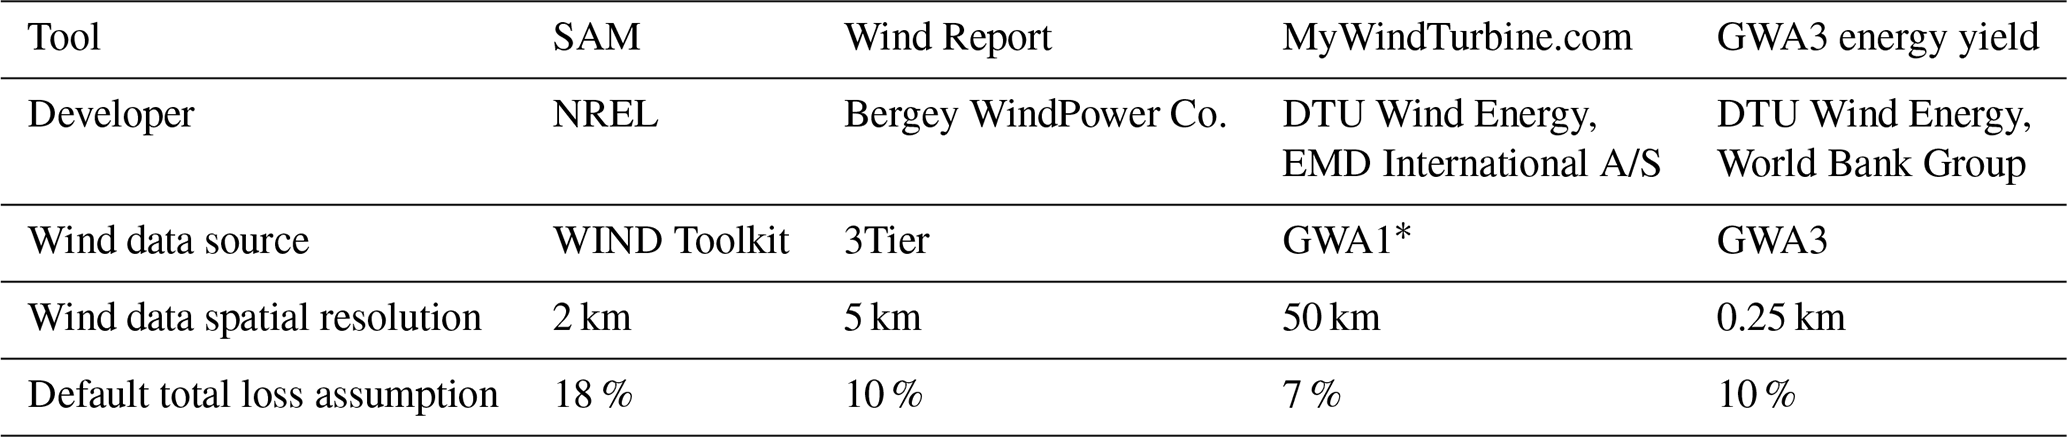
* MyWindTurbine.com utilizes GWA1 for countries outside of Denmark. For Denmark, MyWindTurbine.com utilizes the WRF model (Bechmann et al., 2016).
The four tools allow a user to select a turbine model (power curves provided or added by the user), hub height, and geographic location to simulate annual energy production. Two of the tools, SAM and Wind Report, allow users to provide custom wind shear exponents that differ from the default values of 0.14 and 0.18, respectively. To account for the losses that inevitably occur during the production life cycle of an actual turbine, each tool is equipped with customizable loss factors, with the default values shown in Table 3. The Wind Report loss factor is attributed to turbulence, while MyWindTurbine.com separates the loss assumptions into the categories of availability and electrical losses. GWA3 provides a single factor to encompass losses due to array effects and availability. SAM provides 20 categories of loss assumptions for wind turbines, including wake, availability, electrical, turbine performance, environmental, and curtailment/operational strategy losses. In addition to the static loss assumptions, MyWindTurbine.com provides high-resolution obstacle flow modeling to simulate wake loss. As this feature requires the knowledge of the precise dimensions of obstacles, it is not considered in this performance analysis but should be utilized in practice in order to take full advantage of the MyWindTurbine.com modeling capabilities.
2.5 Error metrics and statistical significance
The wind speed validation employs three error metrics to assess the accuracy of model representation of observed wind speeds: wind speed bias, mean absolute error, and correlation coefficient. The wind speed bias, i.e., the average difference over a time series of length N between the modeled (vmod) and observed (vobs) wind speeds, informs a model user whether their model of choice tends to overestimate (positive bias), underestimate (negative bias), or accurately represent (zero bias) the observed wind resource:
The mean absolute error (MAE) is the absolute difference between the modeled and observed wind speeds, informing a user of the magnitude of error:
Finally, the Pearson correlation coefficient informs a model user of the degree to which the modeled and observed wind speeds are linearly related, with values close to 1 indicating a high degree of correlation:
For the energy production validation, we examine the results in terms of capacity factor error, the difference between the simulated and observed capacity factors.
Standard statistical methods are used to determine whether observed differences between the error metrics produced by the wind speed and energy production simulations are statistically significant. Paired-sample t test and Wilcoxon rank sum tests (Fay and Proschan, 2010) are used for pairwise analysis between models and methods. These tests assess the null hypothesis that the true mean (or median for the Wilcoxon test) of the differences between observations is zero. Significance is determined with an alpha threshold for type 1 error set to 0.05. Hence, we reject the null hypothesis and accept the alternative hypothesis that the differences are significant when the observed p value is less than 5 %, indicating a less than 5 % chance the observed differences could be due to random chance. The Bonferroni method is used to account for multiple comparisons while interpreting the results. All statistical analyses are performed with the R software environment for statistical computing version 4.0.
3.1 Wind speed validation
Across the 62 sites providing wind speed observations, the WIND Toolkit and MERRA-2 produce the smallest absolute biases on average (Fig. 3a). The WIND Toolkit slightly overestimates the observed wind speeds by an average of 0.2 m s−1, regardless of horizontal interpolation technique (nearest neighbor and distance-weighted). MERRA-2 slightly underestimates the observed wind speeds by a similar magnitude, and the choice of interpolation technique shows more impact on the results for this coarser product, with biases of −0.2 and −0.1 m s−1 for the nearest-neighbor and distance-weighted interpolation techniques, respectively. ERA5 also underestimates the observed wind speeds and produces the largest magnitude bias on average across the sites: −0.5 m s−1 regardless of horizontal interpolation technique, a result that aligns with the findings of Kalverla et al. (2020) for winds over the North Sea. Applying the t test to the bias results reveals that the mean bias is significantly different from zero for ERA5 and not for the WIND Toolkit or MERRA-2. The t and Wilcoxon tests reveal that for wind speed bias, each model performs significantly differently from one another, while the impact of horizontal interpolation choice within each model is insignificant.
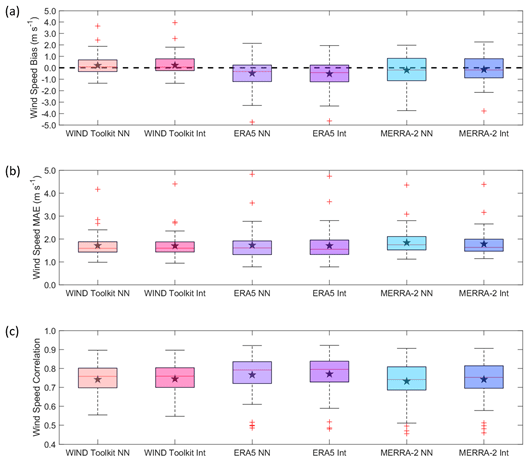
Figure 3Wind speed (a) bias, (b) MAE, and (c) correlation across 62 sites as produced by WIND Toolkit, ERA5, and MERRA-2 using the nearest-neighbor (NN) and distance-weighted interpolation (Int) techniques. The median error metrics are indicated with the red lines; the 25th and 75th percentiles form the blue boxed range; the minimum and maximum error metrics, excluding outliers, are in black; and outliers are indicated with red plus signs. The mean error metrics are represented with black stars.
As shown in Fig. 3a, the wind speed models produce bias magnitudes in excess of 3 m s−1 at several sites, each of which are located among complex terrain. For instance, the WIND Toolkit overestimates the observed wind speed by nearly 4 m s−1 at a site in the Colorado Rocky Mountains. ERA5 underestimates the observed wind speed at this location, with a bias of −1.8 m s−1, while MERRA-2 produces very little bias (−0.1 m s−1). Interestingly, all three models produce consistent and relatively high correlation coefficients between 0.7 and 0.8 at this site. At two sites along the Columbia River gorge in the Pacific Northwest, ERA5 strongly underestimates the wind resource, with wind speed biases of −4.6 and −3.3 m s−1. MERRA-2 also underestimates the wind resource at these sites, with biases of −3.7 and −1.9 m s−1. Conversely, the WIND Toolkit produces wind speed biases near zero at these locations.
The three wind resource models produce similar values on average for MAE, 1.7 m s−1 from the WIND Toolkit and ERA5 and 1.8 m s−1 from MERRA-2 (Fig. 3b). The t and Wilcoxon tests do not detect a significant difference between the models for this metric; however limited sample size may contribute to this result. Differences in MAE according to interpolation technique are only significant for MERRA-2, the coarsest product. The same sites in the Colorado Rocky Mountains and the Columbia River gorge that produced the largest-magnitude biases are also responsible for the MAE outliers greater than 3 m s−1.
Significant differences in correlation between the WIND Toolkit and MERRA-2 are not noted by the t and Wilcoxon tests, and each model produces an average correlation of 0.74 (Fig. 3c). The correlations produced by ERA5, with an average value of 0.77, are significantly different from the other two models. According to the t and Wilcoxon tests, choice of interpolation technique is significant for this metric across the models. The smallest correlations (less than 0.5) occur for the coarser resolution models (ERA5 and MERRA-2) in geographically diverse locations that feature complex terrain, namely the Colorado Front Range, the hilly California coast, the Columbia River gorge, and the Green Mountains in Vermont. The highest correlations (around 0.9) occur at locations on islands or along the coasts of the Atlantic Ocean, Pacific Ocean, Gulf of Mexico, and Great Lakes, where the wind resource tends to be faster than further inland, and in the upper Midwest.
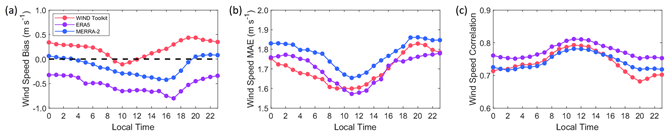
Figure 4Average diurnal wind speed (a) bias, (b) MAE, and (c) correlation across 62 sites at heights ranging from 10 to 50 m using distance-weighted horizontal interpolation.

Figure 5(a) Frequency of occurrences of observed wind speeds and (b) distance-weighted model wind speed bias according to observed wind speed class. The median biases are indicated with the red lines; the 25th and 75th percentiles form the blue boxed range; the minimum and maximum error metrics, excluding outliers, are in black; and outliers are indicated with red plus signs.
3.1.1 Diurnal trends in simulated wind speed performance
Model performance across the diurnal wind speed cycle provides important context for load balancing across standalone small wind systems and as a complement to solar technology. Comparisons between observed and modeled diurnal wind speed cycles exist for the WIND Toolkit (Takle et al., 2017), ERA5 (Jourdier, 2020), and MERRA-2 (Jourdier, 2020) at a variety of heights above the ground. Because the shape of the diurnal wind speed cycle varies according to height above ground (Crawford and Hudson, 1973), among other factors, it is of interest to examine model performance by hour at heights specific to small wind development, as in Fig. 4. The average diurnal patterns of MAE and correlation (Fig. 4b and c) are consistent across the three models, with the lowest MAEs and highest correlations achieved around local noon. The hourly WIND Toolkit bias, however, follows a different trend compared to ERA5 and MERRA-2 (Fig. 4a). The WIND Toolkit bias reaches the most negative values during the morning hours, while the ERA5 and MERRA-2 biases reach the most negative values during the late afternoon.
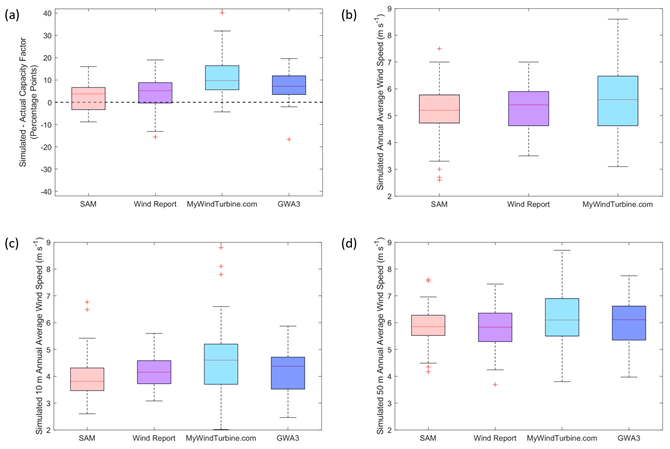
Figure 6(a) Capacity factor error (simulated minus observed capacity factor) according to SAM, Wind Report, MyWindTurbine.com, and GWA3 across 55 small wind turbines with hub heights ranging from X to Y m. (b) Simulated annual average wind speed according to SAM, Wind Report, and MyWindTurbine.com at the 55 small wind turbine hub heights. (c) Simulated 10 m annual average wind speed according to SAM, Wind Report, MyWindTurbine.com, and GWA3 at the 55 small wind turbine locations. (d) Simulated 50 m annual average wind speed according to SAM, Wind Report, MyWindTurbine.com, and GWA3 at the 55 small wind turbine locations. The median values are indicated with the red lines; the 25th and 75th percentiles form the blue boxed range; the minimum and maximum error metrics, excluding outliers, are in black; and outliers are indicated with red plus signs.
3.1.2 Simulated wind speed performance according to wind speed class
The simulated wind speed biases trend increasingly negative with increasing observed wind, as presented in Fig. 5b. At the slowest wind speeds, from 0 to 5 m s−1, the WIND Toolkit, ERA5, and MERRA-2 tend to overestimate the observed wind speed by 0.9, 0.4, and 0.8 m s−1, respectively. Given the lower-altitude characteristic of small wind turbines, 50 % of the observed wind speeds considered in the validation fall into the slowest wind speed class (Fig. 5a). This result informs a user that converting the model wind speeds to power may result in inflated energy production expectations, as there may be instances of the model wind speeds exceeding turbine cut-in while the observed wind speeds are actually below cut-in. As the observed wind speeds increase, the biases exhibited by each model become more negative, with the WIND Toolkit, ERA5, and MERRA-2 producing biases of −5.2, −7.2, and −6.7 m s−1, respectively, for observed wind speeds greater than 20 m s−1. Conversely to the slow wind speed assessment, this result warns a user that high-wind-speed turbine cut-out events may occur more frequently than the models indicate. With the exception of the slowest wind speed class, from 0 to 5 m s−1, the ERA5 and MERRA-2 biases are not significantly different.
The outliers in the fastest speed classes in Fig. 5 reveal extreme departures between the modeled and observed wind speeds. At a location in west Texas with measured wind speeds reaching 30 m s−1 at 40 m, the WIND Toolkit, ERA5, and MERRA-2 underestimate the observed wind speeds above 20 m s−1 by −20.7, −19.5, and −18.5 m s−1, respectively. The positive bias outliers at speeds 15 m s−1 or greater, i.e., cases where the models overestimate faster observed wind speeds, are associated with coastal and mountainous locations.
3.2 Energy production validation
Wind speed models are the essential foundations for wind energy production estimation, and identifying uncertainties and trends in the former provides a similar starting point for evaluating the accuracy and representativeness of the latter. With the baseline wind speed error metrics established, the validation continues with an examination into the performance of four tools that utilize wind resource models to provide energy production estimates for small wind turbines, namely SAM, Wind Report, MyWindTurbine.com, and GWA3. The annual energy production estimates (conveyed via capacity factors) are produced using the default wind resource data included with each tool and are net estimates that incorporate the default loss assumptions unique to each tool (Table 3). The default wind resource data for SAM is the WIND Toolkit, which was evaluated in Sect. 3.1. Wind Report employs wind resource data from 3Tier with a similar spatial resolution to SAM. MyWindTurbine.com utilizes wind information from GWA1, which has a similar spatial resolution to MERRA-2. GWA3 provides the highest-resolution wind resource data at 250 m.
The differences between the simulated and observed capacity factors across 55 turbines are displayed in Fig. 6a. SAM, Wind Report, MyWindTurbine.com, and GWA3 all tend to overestimate the observed energy production, a divergence from the near-zero average biases noted for the wind speed models, including the WIND Toolkit used by SAM. SAM and Wind Report perform similarly, with average capacity factor errors (simulated minus observed capacity factor) of +2.5 and +4.2 percentage points, respectively, and standard deviations of 6.0 and 7.1 percentage points, respectively. MyWindTurbine.com shows the greatest overprediction and more variability in the estimates, with an average capacity factor error of +11.5 percentage points and a standard deviation of 8.8 percentage points. GWA3 overestimates the observed capacity factors by an average of 7.3 percentage points and a standard deviation of 6.7 percentage points. A one-sample t test confirms that SAM is the best performing tool in terms of capacity factor error, with a 95 % confidence interval of 0.8–4.1 percentage points. Wind Report, GWA3, and MyWindTurbine.com have 95 % confidence intervals of 2.2–6.1 percentage points, 5.5–9.1 percentage points, and 9.1–13.8 percentage points, respectively.
One cause for discrepancies in energy production estimates across the tools and relative to observations is the underlying wind resource information. SAM, Wind Report, MyWindTurbine.com, and GWA3 are each driven by wind resource datasets with different resolutions (Table 3) and physical assumptions. Figure 6b shows the range of annual average wind speeds produced by each tool (excluding GWA3, which does not output annual average wind speed information at the specific hub height needed for energy production estimation) at the 55 small wind turbine hub heights that range between 10 and 50 m. On average, MyWindTurbine.com produces a faster wind speed estimate of 5.7 m s−1 than SAM and Wind Report, which produce annual average wind speed estimates of 5.1 and 5.2 m s−1, respectively. The standard deviations in annual average wind speed using SAM, Wind Report, and MyWindTurbine.com are 1.0, 0.9, and 1.2 m s−1, respectively. The maximum difference among the annual average wind speed estimates produced by the tools (0.6 m s−1) is similar to the maximum difference in mean model wind speed bias (between the WIND Toolkit and ERA5) noted in Sect. 3.1 (0.7 m s−1). The t and Wilcoxon tests reveal significant differences in both simulated annual average wind speed and capacity factor error among the tools. The simulated wind speed is likely a contributor to the greater energy production overestimation using MyWindTurbine.com noted in Fig. 6a.
In order to include GWA3, which provides energy production information, but not wind speed information, at each of the actual turbine hub heights in the wind speed comparison, Fig. 6c shows the range of annual average wind speeds produced by each tool at 10 m (i.e., the lower small wind speed output height from GWA3) for each of the 55 turbines in the validation study. On average, SAM, Wind Report, MyWindTurbine.com, and GWA3 produce annual average 10 m wind speed estimates of 3.9, 4.2, 4.6, and 4.1 m s−1, respectively. Similarly, Fig. 6d shows the range of annual average wind speeds at 50 m (the higher small wind speed output height from GWA3) produced by each tool for each of the 55 turbines. On average, SAM, Wind Report, MyWindTurbine.com, and GWA3 produce annual average 50 m wind speed estimates of 5.8, 5.8, 6.1, and 6.0 m s−1, respectively.
When exploring capacity factor error for the different small wind turbines, capacity factor error is found to become increasingly positive as the turbine rated capacity increases for SAM, Wind Report, and GWA3, as seen in Fig. 7a. No such trend is noted for MyWindTurbine.com. On average, the smallest performance error is produced by Wind Report for the Southwest Skystreams and by SAM for the Bergey Excel 10s and 15s and the Endurance E-3120s. Similarly, Fig. 7b shows that the SAM, Wind Report, and GWA3 capacity factor errors become increasingly positive as turbine hub height increases, again with no trend noted for MyWindTurbine.com. On average, the smallest performance error is produced by Wind Report for turbines with hub heights of 10–20 m and by SAM for turbines with hub heights greater than 20 m.
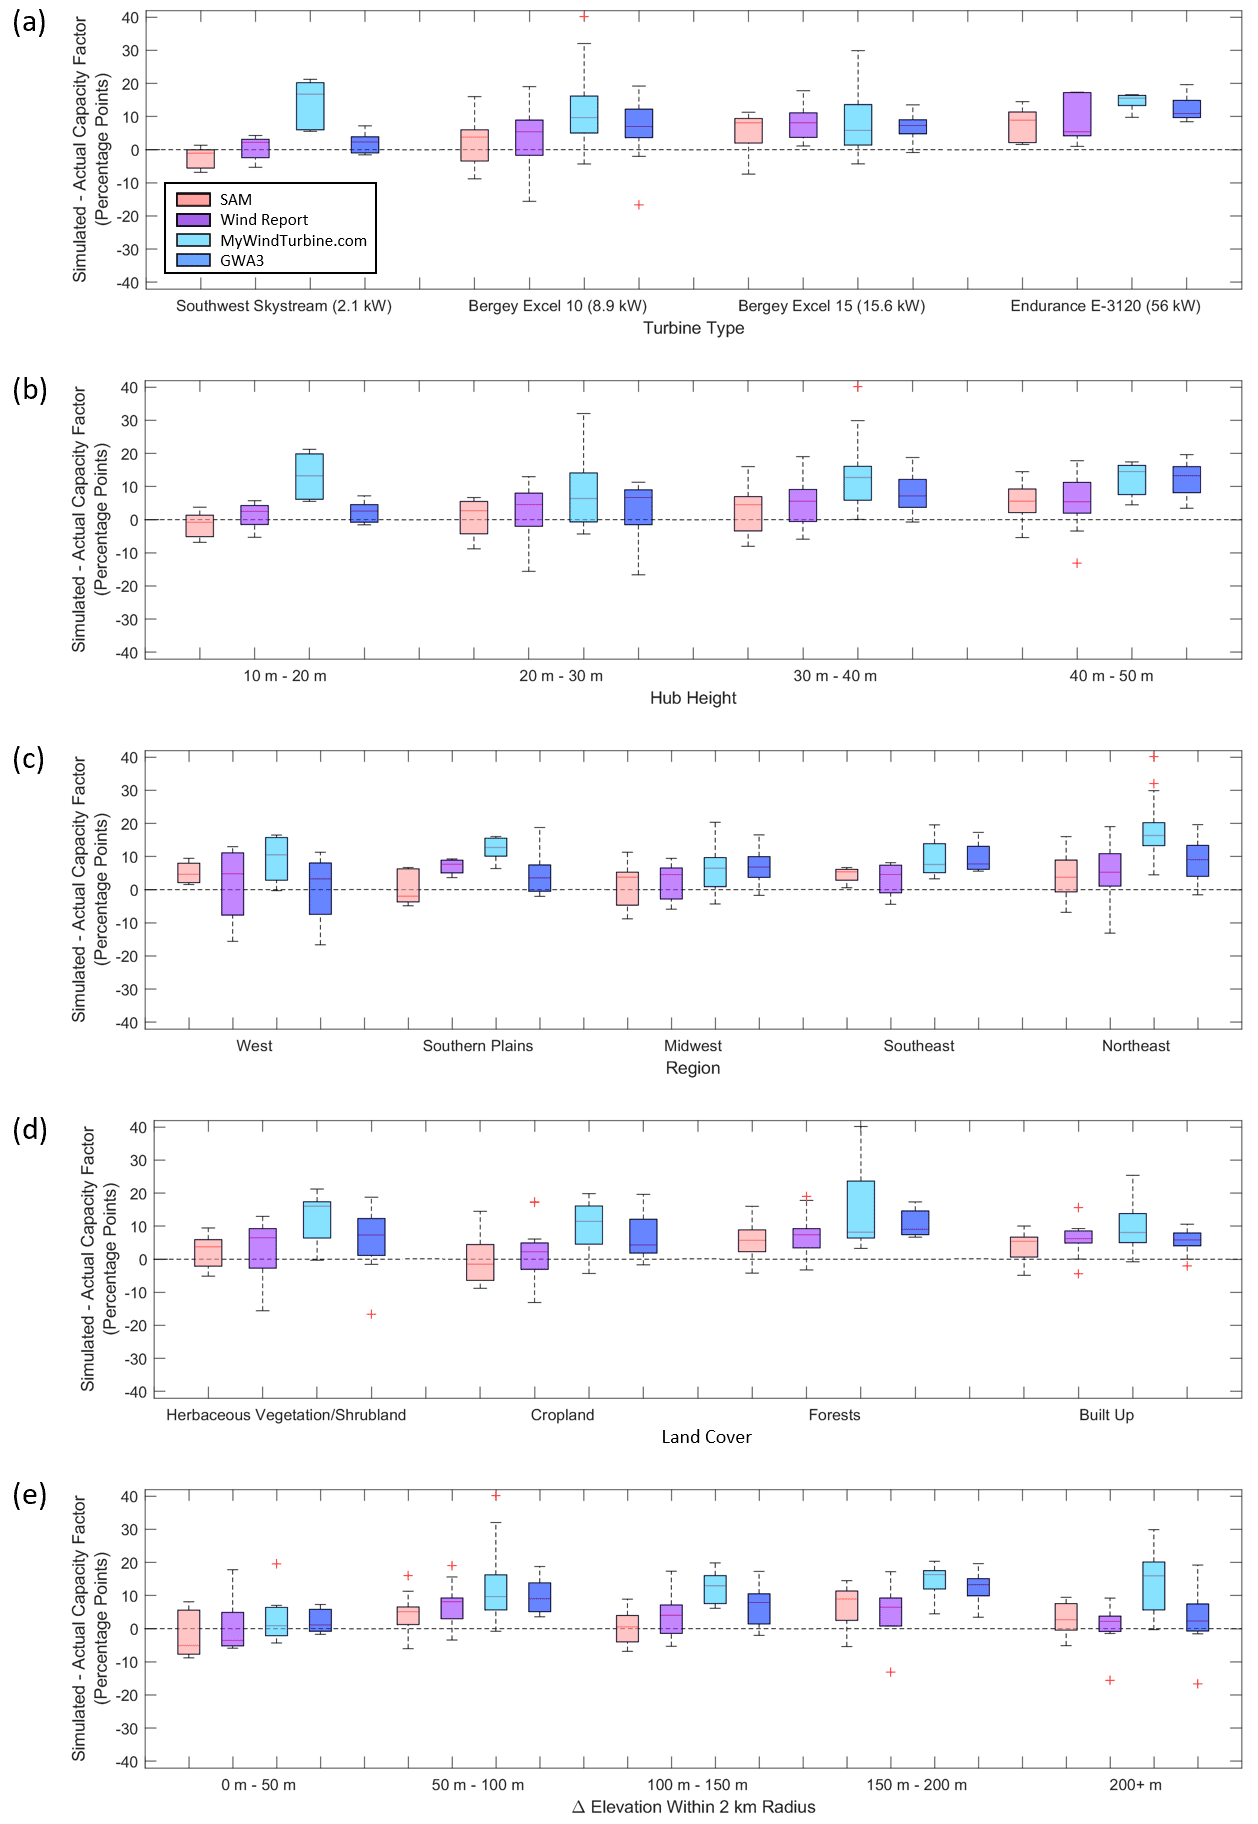
Figure 7Capacity factor error (simulated minus observed capacity factor) according to (a) turbine type, (b) hub height, (c) region, (d) land cover, and (e) elevation difference across 55 small wind turbines. The median error metrics are indicated with the red lines; the 25th and 75th percentiles form the blue boxed range; the minimum and maximum error metrics, excluding outliers, are in black; and outliers are indicated with red plus signs.
The tools perform differently relative to each other in different regions of the United States (Fig. 7c). The greatest capacity factor errors produced by SAM are concentrated in the Northeast, with capacity factor errors exceeding +10 percentage points at four turbines in New York (one along the Lake Ontario coast, one along the Atlantic coast, and two in hilly terrain). Wind Report similarly overestimates observed energy production by more than +10 percentage points at a variety of turbines in the Northeast and significantly underestimates observed energy production (capacity factor error percentage points) at a coastal California turbine and a turbine located in a hilly area of Vermont. Like Wind Report, GWA3 significantly overestimates the observed energy production at a variety of turbines in the Northeast and significantly underestimates observed energy production at a coastal California turbine. MyWindTurbine.com, noted for generating the greatest turbine energy production overestimates, performs more similarly to SAM and Wind Report in the Midwest and shows the greatest capacity factor error in the Northeast. SAM and GWA3 show the least variability in performance error in the Southeast, while Wind Report and MyWindTurbine.com show the least variability in performance error in the Southern Plains. On average, the smallest performance error is produced by GWA3 in the West, Wind Report in the Southeast, and SAM in the Southern Plains, the Midwest, and the Northeast.
Classifying performance error according to the Copernicus Global Land Cover 2019 categories (Buchhorn et al., 2020) reveals the highest energy production overestimation occurring in forested locations (Fig. 7d), with all four models producing the highest magnitude errors in this category relative to the remaining land cover categories. In forested locations, SAM, Wind Report, MyWindTurbine.com, and GWA3 tend to overestimate the observed capacity factors by 6, 8, 15, and 11 percentage points, respectively. In built-up locations where the wind resource, like forests, is most impacted by wake effects, the tools overestimate the observed capacity factors by 4 to 10 percentage points. SAM and Wind Report produce small errors for herbaceous vegetation/shrubland (2 and 3 percentage points, respectively) and cropland (0 and 2 percentage points, respectively). GWA3 produces errors around 6 percentage points for herbaceous vegetation/shrubland and cropland, while MyWindTurbine.com produces errors of 12 and 10 percentage points for these categories, respectively. On average, the smallest performance error is produced by SAM for all land cover categories.
By considering the difference between the maximum and minimum elevations within a 2 km radius of each turbine using the ASTER Global Digital Elevation Model V003 (NASA EOSDIS Land Processes DAAC, 2019), we examine the performance of energy production tools according to approximated terrain complexity (Fig. 7e). Of the four tools considered in this validation, only MyWindTurbine.com exhibits an average trend of increasing error with increasing terrain complexity, with a capacity factor error of 3 percentage points for turbines surrounded by elevation differences less than 50 m increasing to over 10 percentage points for all higher elevation differences. The extremely low outliers for Wind Report and GWA3 in the 200 m or more elevation difference category reflect the hilly, coastal California turbine. On average, SAM produces the smallest capacity factor errors for elevation differences between 50 and 150 m, while Wind Report produces the smallest capacity factor errors for elevation differences less than 50 m and greater than 150 m.
The large capacity factor errors noted in areas of complex land cover and terrain and coastal interaction are consistent with the large model wind speed errors noted for these terrain types in Sect. 3.1. Given that high relative elevation locations and coastal environments tend to exhibit enhanced wind resource (NREL 2021b), making them favorable choices for small wind deployment, these results urge model and tool users to be especially cautious in these locations and to utilize the error metrics presented here to adjust energy production expectations.
In addition to the challenge in energy production estimation in areas of complex terrain and/or coastal interaction, potential other sources of discrepancy in simulated energy production performance exist. Additional potential sources of discrepancy explored in the following sections include interannual variability in the wind resource (due to the wind datasets spanning different years), tool diversity in the handling of height adjustment between the model data and the desired hub height, and the representativeness of the different loss assumptions employed by each tool.
3.2.1 Impact of interannual wind speed variability on energy production estimates
One of the model wind resource aspects that contributes to discrepancies in energy production estimates is interannual variability. Simple tools build annual average wind resource datasets based on individual years of wind data, averaged multi-year wind data, or a typical meteorological year, the last of which aims to represent a range of weather phenomena while maintaining an annual average similar to a longer-term average. Since the wind resource at a given location varies from year to year, the representativeness of the wind data employed by a tool will similarly vary from year to year.
Interannual variability is found to significantly contribute to the uncertainty in tool-based energy production estimates, as explored in Fig. 8. For the 55 small wind turbines, SAM is run using each of the 7 years of available WIND Toolkit data (2007–2013), of which 2013 is the default selection within the tool. At each site, we calculate the difference between the maximum and minimum capacity factor achieved in the ensemble of the seven runs. Figure 8 shows that interannual variability in the wind resource is responsible for up to 6.5 percentage points of difference in simulated capacity factors, with an average of 3 percentage points. The observational discussion in Sect. 2 provides important context for the large impact interannual wind speed variability has on discrepancies in energy production estimates. The annual average wind speed observations in Fig. 1a range from 2 to 9 m s−1, which aligns with the steepest portions of the small wind turbine power curves in Fig. 2c. This information, combined with the observed interannual wind speed differences up to 3 m s−1 reported in Sect. 2.1, provides a clear picture of how sensitive small wind turbines are to variability in the wind resource.
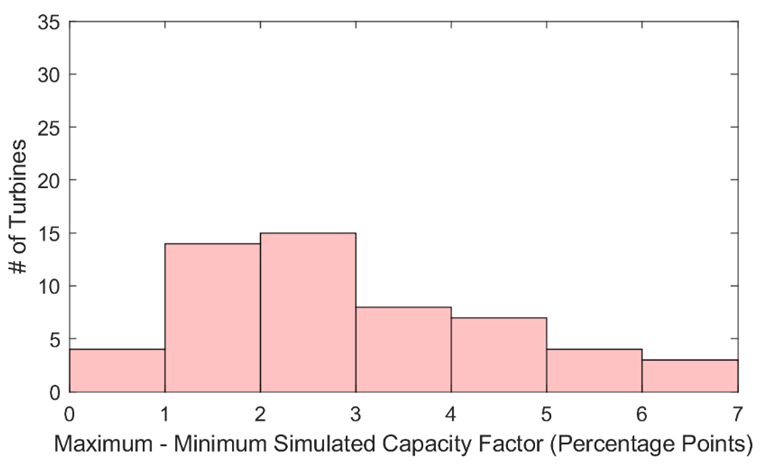
Figure 8Maximum minus minimum SAM simulated capacity factor based on wind resource data from seven individual WIND Toolkit years across 55 small wind turbines.
3.2.2 Impact of vertical interpolation on energy production estimates
A further aspect of the wind resource that contributes to discrepancies in energy production estimates is the vertical interpolation technique employed in tool calculations. Two of the tools considered in this study, SAM and Wind Report, employ the power law (Eq. 1) to adjust wind resource data to a user-defined hub height. The shear exponent α (Eq. 2) expresses the shape of the vertical wind speed profile and is used to interpolate or extrapolate wind speed output from one or more vertical levels to another. Observationally, the shear exponent varies diurnally, seasonally, geographically, and according to atmospheric stability. However, simple energy production estimation tools typically employ a single value to characterize the vertical wind speed profile and adjust wind speeds to a desired hub height. This practice can lead to mischaracterizations of the actual wind resource at a site of interest, warranting exploration into the degree of impact vertical interpolation has on energy production estimation.
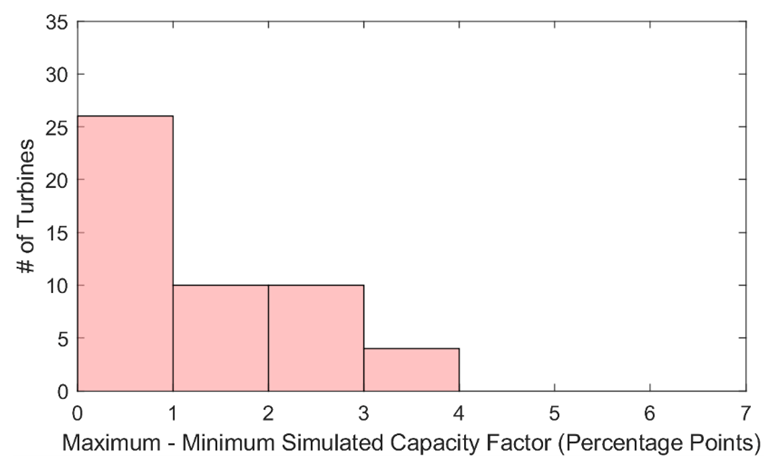
Figure 9Maximum minus minimum SAM simulated capacity factor based on wind resource data adjusted via four vertical interpolation techniques across 50 small wind turbines. Five small wind turbines are redacted from the analysis since their hub heights directly align with a WIND Toolkit output height, thus eliminating the need for vertical interpolation.
For energy production simulations incorporating wind speed data at a single height, SAM employs a default shear exponent of 0.14, reflecting the commonly used one-seventh law, which is an empirically estimated shear exponent that assumes smooth terrain and neutral atmospheric conditions. Others in the wind energy community, including members involved in resource assessment and wind turbine design, have migrated to using a larger shear exponent of 0.2 (Storm and Basu, 2010), which is close to the default value of 0.18 employed by Wind Report. For energy production simulations incorporating wind speed data at heights surrounding the user-defined hub height, SAM employs linear interpolation to vertically adjust wind speed data from the surrounding model heights to the height of interest.
The impact of interpolation techniques on the resultant energy production estimates produced by SAM is found to be minimal, as presented in Fig. 9. For each of the 50 small wind turbines that require model wind speed adjustment to hub height, SAM is run (1) using the power law in conjunction with the nearest-neighbor WIND Toolkit height and a shear exponent of 0.14, (2) using the power law in conjunction with the nearest-neighbor WIND Toolkit height and a shear exponent of 0.18, (3) using the dynamic power law of Eq. (1) with the two surrounding WIND Toolkit heights, and (4) using linear interpolation of the two surrounding WIND Toolkit heights. As in the interannual variability study, at each site we calculate the difference between the maximum and minimum capacity factor produced by the four approaches. Figure 9 shows that for the majority of the small wind turbines considered in this study, choice of vertical interpolation technique is responsible for less than 1 percentage point. The maximum difference in capacity factor according to vertical interpolation technique is 3.7 percentage points, with an average of 1.4 percentage points.
3.2.3 Turbine availability
Of the 55 small wind turbines employed in this validation, 36 Bergey Excel 10s and 15s include information on the amount of time each spent in the following states: (1) running, (2) waiting for wind, (3) stopped/fault, and (4) missing, the last of which is estimated by comparing the number of actual versus expected annual reports each turbine produces. In contrast to the energy production validation, which excluded years of significant turbine outage, the following analysis considers all years of each turbine's life cycle in order to provide the small wind community with a comprehensive sample of turbine availability. Figure 10 displays the annual percentages of each operational state that the 36 turbines experience, organized by turbine age. The turbines are diverse in geography and age, with representation in each major geographic region in the continental US and observations spanning 1–10 years.
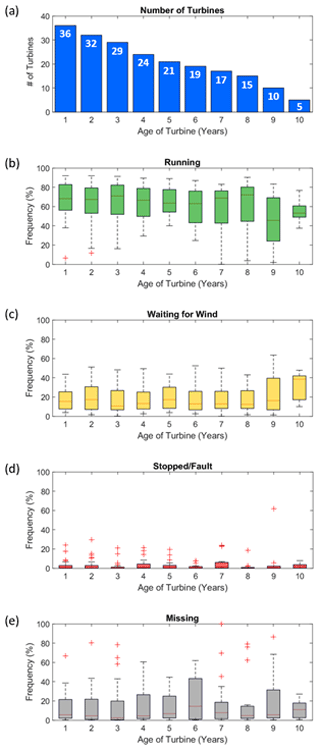
Figure 10(a) Number of turbines with availability data. Annual frequency of time that 36 small wind turbines are in states of (b) running, (c) waiting for wind, (d) stopped/fault, or (e) missing data.
The average (and median) time spent running ranges from 57 % to 68 % (63 % to 72 %) for turbines aged 8 years or younger, dropping off to 46 % and 55 % (46 % and 53 %) for turbines aged 9 and 10 years, respectively (Fig. 10b). This decline in average time spent running may be due to the reduced sample size of older turbines rather than to age-related degradation. Turbines aged 8 years or less spent on average (median) less than 20 % (18 %) of their annual cycles waiting for wind, increasing to 23 % and 31 % (16 % and 39 %), respectively, for turbines aged 9 and 10 years.
While the states of running and waiting for wind are related to the available wind resource, the remaining states of stopped/fault and missing can provide observational comparisons for the loss assumptions employed by the energy production estimation tools. The annual average (median) percent of time the turbines are in a stopped/fault state (Fig. 10d) ranges from 2 % to 7 % (0 % to 2 %), and the annual average (median) percent of missing data (Fig. 10e) ranges from 12 % to 23 % (2 % to 15 %). The annual average percent of time missing or spent in a stopped/fault state combined ranges from 14 % to 30 %, exceeding the default loss assumption percentages from three of the tools, namely Wind Report and GWA3 with 10 % loss and MyWindTurbine.com with 7 % loss. The loss assumption employed by SAM (18 %) is on average the most representative of actual small wind turbine losses. The median annual percent of time missing or spent in a stopped/fault state combined ranges from 4 % to 18 %, encompassing all of the default loss assumptions from the four tools. In other words, except for a small proportion of turbines that experience significant data outages, the loss assumptions employed by the tools are representative of actual small wind turbine losses.
An initial investigation of wind speed accuracy from three commonly used models or reanalysis products (WIND Toolkit, ERA5, and MERRA-2) at small wind turbine heights (10–50 m) yielded average biases within ±0.5 m s−1 and average MAEs less than 2 m s−1. However, a small wind adopter located in an area of complex terrain (hills, mountains, or coastal environments) should anticipate wind speed bias magnitudes and MAEs up to 5 m s−1. In agreement with trends noted by Gruber at al. (2019) and Duplyakin et al. (2021), most model wind speed error metrics tend to be consistent regardless of horizontal interpolation technique for each of the three models assessed. The results also show that the WIND Toolkit, ERA5, and MERRA-2 overestimate observed wind speeds slower than 5 m s−1, a range that encompasses most turbine cut-in wind speed ranges, which can lead to energy production overestimates. Conversely, the three models tend to underestimate larger observed wind speeds, which can impact energy production estimates by underpredicting the amount of time spent at peak power and by underestimating the number of turbine cut-out events.
Using actual turbine production data, four user-friendly energy production estimation tools (SAM, Wind Report, MyWindTurbine.com, and GWA3) were shown to overpredict actual turbine performance. Using the default settings, SAM and Wind Report overestimate observed turbine production within 5 percentage points, while MyWindTurbine.com and GWA3 overestimate observed turbine production by 11.5 and 7.3 percentage points, respectively. The underlying wind speed data utilized by MyWindTurbine.com, which has a spatial resolution similar to MERRA-2, was on average 0.5 m s−1 faster than the wind speed data utilized by SAM and Wind Report at turbine hub height, accounting for some of the discrepancy in energy production estimates among the models. SAM employs the WIND Toolkit for wind speed data, and Wind Report uses wind speed information at a similar spatial resolution to the WIND Toolkit. Similar to the simulated wind speed estimates from WIND Toolkit, ERA5, and MERRA-2, the energy production estimation tools exhibited challenges in complex land cover and terrain, overestimating or underestimating the observed turbine production by more than 10 percentage points in some forested, hilly, or coastal regions. The default loss assumptions within SAM, Wind Report, MyWindTurbine.com, and GWA3 (18 %, 10 %, 7 %, and 10 %, respectively) fell within the median observed combined stopped/fault and missing losses reported by actual turbines, which ranged from 4 % to 18 %, indicating realistic loss representation across the tools, despite their diverse loss percentages. Additional refinement of loss assumptions within tools has the potential to further improve net turbine production estimates, either by customizing losses according to land cover and terrain characteristics or by providing comprehensive wake flow modeling when obstacle dimensions are known, the latter of which is already provided by MyWindTurbine.com.
Choice of wind speed reference year(s) yielded significant influence on turbine production estimates (3 percentage points on average, with a maximum of 6.5 percentage points), corresponding with the discussion of Hamlington et al. (2015) that 1–2 years of wind measurements do not provide a sufficient data record for accurately predicting power production at a wind plant. Contrastingly, choice of vertical interpolation technique for wind speed adjustment yielded minimal influence on turbine production estimates (1.4 percentage points on average, with a maximum of 3.7 percentage points), consistent with the findings of Olauson (2018) and Duplyakin et al. (2021). Given the significance of interannual variability on turbine production estimates, the authors recommend that small wind turbine production estimators utilize a tool that provides a range of annual production possibilities in order to set expectations for average-, high-, and low-wind-resource years. For currently deployed small wind turbines, an owner can estimate whether the wind resource during the current or near-future time period will be above or below average by considering climate oscillations, such as the El Niño–Southern Oscillation. Hamlington et al. (2015) correlate La Niña events with faster wind speeds and El Niño events with suppressed wind speeds across the US Great Plains.
Given the significant time and costs associated with collecting pre-installation on-site wind resource measurements for small wind turbine deployment, the tools evaluated in this paper provide essential value to the small wind community by providing quick, low-cost energy production estimates that can be adjusted using the validation results of this study. In addition to the energy production estimates, each tool offers unique features that are beneficial to the small wind community. SAM and Wind Report provide customizable wind shear exponents in their calculations, allowing for energy production simulation under different atmospheric stability regimes. MyWindTurbine.com enables users to input actual building and vegetation dimensions into their flow model in order to account for obstacle losses. GWA3 provides especially high spatial resolution for wind resource and energy production mapping. Of significant importance given the findings of this work, SAM incorporates multiple individual years of wind resource modeling that provide guidance on setting interannual energy production expectations.
Continuing advances in wind speed models, such as the recent updates to the WIND Toolkit (Pronk et al., 2022) and the Global Wind Atlas (2021) are critical to reducing uncertainty in wind resource estimates and are anticipated to similarly reduce uncertainty in energy production estimates when they are incorporated into simulation tools. Reduced uncertainty can improve customer confidence in the ability of small wind turbines to generate energy and thus increase financing opportunities for small wind projects, ensuring that small wind turbines can continue to have a role in decarbonizing the US economy and in addressing the challenges of energy accessibility, equity, and security endured by rural and underrepresented communities. In addition to setting expectations for current users, the results of this study provide baselines of comparison for future versions of wind speed models, reanalyses, and energy production simulation tools.
Much of the wind speed measurement data that support this study are openly available. Sodar-based wind speed observations from the first Wind Forecast Improvement Project are available at https://a2e.energy.gov/projects/wfip1 (Djalalova, 2021). The near-surface wind speed measurements from the National Centers for Environmental Information are available at https://www.ncei.noaa.gov/access/search/data-search/global-hourly (NOAA National Centers for Environmental Prediction, 2021). Coastal wind speed observations from the National Data Buoy Center are found at https://www.ndbc.noaa.gov/ (NOAA National Data Buoy Center, 2021). Meteorological tower data from Argonne National Laboratory are available at https://www.atmos.anl.gov/ANLMET/ (Argonne National Laboratory, 2020). Brookhaven National Laboratory meteorological data are provided at https://wx1.bnl.gov/ (Brookhaven National Laboratory, 2020). Meteorological tower data from NREL are found at https://www.nrel.gov/wind/nwtc/data.html (NREL, 2020). Meteorological tower observations from Oak Ridge National Laboratory are available through the Lawrence Berkeley National Laboratory interface at https://ameriflux.lbl.gov/sites/site-search/#filter-type=all&has-data=All&site_id= (Lawrence Berkeley National Laboratory, 2020). Observations from Savannah River National Laboratory are available via the B2SHARE Tall Tower Dataset at https://b2share.eudat.eu/records/159158152f4d4be79559e2f3f6b1a410 (B2SHARE, 2020). Wind speed data from the Bonneville Power Administration network of meteorological towers are available at https://transmission.bpa.gov/Business/Operations/Wind/MetData/default.aspx (Bonneville Power Administration, 2020). Wind resource data from the University of Massachusetts can be found at https://www.umass.edu/windenergy/resourcedata (University of Massachusetts Wind Energy Center, 2020). Meteorological tower data from Pacific Northwest National Laboratory are in the process of being uploaded to https://a2e.energy.gov/ (last access: 21 March 2022) and for the present are available upon request from the lead author. The remaining wind speed observational collections are proprietary and were used under license for this study and therefore are not publicly available.
The turbine production data are available for collaboration opportunities upon a case-by-case basis. If interested, please contact the lead author.
The WIND Toolkit, ERA5, and MERRA-2 are publicly available at https://www.nrel.gov/grid/wind-toolkit.html (NREL, 2021c), https://www.ecmwf.int/en/forecasts/datasets/reanalysis-datasets/era5 (ECMWF, 2021), and https://gmao.gsfc.nasa.gov/reanalysis/MERRA-2/data_access/ (NASA Global Modeling and Assimilation Office, 2021), respectively. SAM is freely available for download at https://sam.nrel.gov/ (NREL, 2021a). Wind Report is freely available at http://www.newrootsenergy.com/page/wind_report (Bergey WindPower Co., 2021) to dealers, key accounts, and friends of Bergey WindPower Co. MyWindTurbine.com is available for purchase at https://www.mywindturbine.com/ (DTU Wind Energy and EMD International A/S, 2021). GWA3 is freely available at https://globalwindatlas.info/ (Wind Energy and World Bank Group, 2021).
Scripts for data quality control, statistical analysis, and plotting are available from the lead author upon request.
LMS wrote the manuscript and led the analysis with significant contributions from CP. CP was also instrumental in the acquisition of wind speed observations. ACO conceptualized the project, was instrumental in the acquisition of turbine performance data, and provided feedback on the methodology and draft. LKB and HT conceptualized the project and provided feedback on the methodology and draft. RR provided guidance on the methodology and feedback on the draft. SZ, DD, and JEF provided guidance on the methodology.
The contact author has declared that neither they nor their co-authors have any competing interests.
Publisher's note: Copernicus Publications remains neutral with regard to jurisdictional claims in published maps and institutional affiliations.
The authors would like to thank Patrick Gilman, Breton Barker, and Mike Derby at the US Department of Energy Wind Energy Technologies Office for funding this research. Additionally, the authors would like to thank Brian Zeidner of Claverack Rural Electric Cooperative, Inc., Michael Bergey of Bergey WindPower Co., Rao Kotamarthi of Argonne National Laboratory, Ken Burk of Pacific Northwest National Laboratory (PNNL), Mark Mayhew of the New York State Energy Research and Development Authority, APRS World, the Bonneville Power Administration, the University of Massachusetts, the National Data Buoy Center, the National Centers for Environmental Information, the first Wind Forecast Improvement Project, Brookhaven National Laboratory, the National Renewable Energy Laboratory, Oak Ridge National Laboratory, and Savannah River National Laboratory for their contributions of the observations that supported this validation. The authors are also grateful to Bergey WindPower Co., the National Renewable Energy Laboratory, the Technical University of Denmark (DTU) Wind Energy research organization, Energi- og MiljøData (EMD) International A/S, the National Aeronautics and Space Administration, and the European Centre for Medium-Range Weather Forecasts for facilitating data that support wind energy applications. The authors express appreciation to Danielle Preziuso of PNNL for foundational research that supported this work and Brian Gaudet of PNNL for peer reviewing the draft. Finally, the authors are profoundly grateful to Andreas Bechmann, Tom Acker, and Michael Bergey for their thoughtful reviews and insightful suggestions for improving this paper.
This research has been supported by the US Department of Energy, Office of Energy Efficiency and Renewable Energy (grant nos. DE-AC05-76RL01830 and DE-AC36-08GO28308).
This paper was edited by Raúl Bayoán Cal and reviewed by Tom Acker and Andreas Bechmann.
Acker, T. L., Bhattarai, B., and Shrestha, R.: Distributed Wind Resource Assessment for Small, Kilowatt-Sized Wind Turbines using Computational Flow Modeling Software, NAWEA WindTech 2019, J. Phys. Conf. Ser., 1452, 012013, https://doi.org/10.1088/1742-6596/1452/1/012013, 2019.
Argonne National Laboratory: Argonne 60 m Meteorological Tower, Argonne National Laboratory [data set], https://www.atmos.anl.gov/ANLMET/, last access: 6 November 2020.
Bechmann, A., Conti, D., Davis, N., Hansen, B. O., Kelly, M. C., Mortensen, N. G., Nielsen, M., Badger, J., and Pena Diaz, A.: MyWindTurbine – Energy Yield Calculations, DTU Wind Energy E No. 0132, DTU Wind Energy, https://scholar.google.com/scholar?cluster=2721908714243871265&hl=en&as_sdt=0,48 (last access: 21 March 2022), 2016.
Bednar, D. J. and Reames, T. G.: Recognition and response to energy poverty in the United States, Nature Energy, 5, 432–439, https://doi.org/10.1038/s41560-020-0582-0, 2020.
Bergey WindPower Co.: Wind Report, Bergey WindPower Co. [data set], http://www.newrootsenergy.com/page/wind_report, last access: 22 August 2021.
Bonneville Power Administration: BPA Meteorological Information, Bonneville Power Administration [data set], https://transmission.bpa.gov/Business/Operations/Wind/MetData/default.aspx, last access: 1 April 2020.
Brookhaven National Laboratory: Current Observations, Brookhaven National Laboratory [data set], https://wx1.bnl.gov/, last access: 14 April 2020.
Brune, S., Keller, J. D., and Wahl, S.: Evaluation of wind speed estimates in reanalyses for wind energy applications, Adv. Sci. Res., 18, 115–126, https://doi.org/10.5194/asr-18-115-2021, 2021.
B2SHARE: The Tall Tower Dataset, B2SHARE [data set], https://b2share.eudat.eu/records/159158152f4d4be79559e2f3f6b1a410, last access: 9 March 2020.
Buchhorn, M., Lesiv, M., Tsendbazar, N.-E., Herold, M., Bertels, L., and Spets, B., Copernicus Global Land Cover Layers – Collection 2, Remote Sens., 12, 1044, https://doi.org/10.3390/rs12061044, 2020.
Carvalho, D.: An Assessment of NASA's GMAO MERRA-2 Reanalysis Surface Winds, J. Climate, 32, 8261–8281, https://doi.org/10.1175/JCLI-D-19-0199.1, 2019.
Crawford, K. C. and Hudson, H. K.: The Diurnal Wind Variation in the Lowest 1500 ft in Central Oklahoma: June 1966–May 1967, J. Appl. Meteorol. Clim., 12, 127–132, https://doi.org/10.1175/1520-0450(1973)012%3C0127:TDWVIT%3E2.0.CO;2, 1973.
Devine, M. J., Manwell, J., Baring-Gould, I., and Petrie, B.: Wind-Diesel Hybrid Options for Remote Villages in Alaska, in: Proceedings of the AWEA Annual Conference, 28–31 March 2004, Chicago, IL, USA, 2004.
Dilley, L. M. and Hulse, L.: Foundation design of wind turbines in Southwestern Alaska, a case study, in: The Arctic Energy Summit, October 2007, Anchorage, AK, USA, 2007–2008.
Djalalova, I., Wind Forecast Improvement Project 1, US Department of Energy, [data set], https://a2e.energy.gov/projects/wfip1, last access: 30 July 2021.
Draxl, C., Clifton, A., Hodge, B.-M., and McCaa, J.: The Wind Integration National Dataset (WIND) Toolkit, Appl. Energ., 151, 355–366, https://doi.org/10.1016/j.apenergy.2015.03.121, 2015a.
Draxl, C., Hodge, B.-M., Clifton, A., and McCaa, J.: Overview and Meteorological Validation of the Wind Integration National Dataset Toolkit, NREL/TP-5000-61740, National Renewable Energy Laboratory (NREL), Golden, CO (United States), https://doi.org/10.2172/1214985, 2015b.
Drew, D. R., Barlow, J. F., Cockerill, T. T., and Vahdati, M. M.: The importance of accurate wind resource assessment for evaluating the economic viability of small wind turbines, Renew. Energ., 77, 493–500, https://doi.org/10.1016/j.renene.2014.12.032, 2015.
DTU Wind Energy and EMD International A/S: MyWindTurbine.com, DTU Wind Energy and EMD International A/S [data set], https://www.mywindturbine.com/, last access: 22 August 2021.
DTU Wind Energy and World Bank Group: Global Wind Atlas, DTU Wind Energy and World Bank Group [data set], https://globalwindatlas.info/, last access: 15 December 2021.
Duplyakin, D., Zisman, S., Phillips, C., and Tinnesand, H.: Bias Characterization, Vertical Interpolation, and Horizontal Interpolation for Distributed Wind Siting Using Mesoscale Wind Resource Estimates, NREL/TP-2C00-78412, National Renewable Energy Laboratory (NREL), Golden, CO (United States), https://doi.org/10.2172/1760659, 2021.
ECMWF: ERA5, ECMWF [data set], https://www.ecmwf.int/en/forecasts/datasets/reanalysis-datasets/era5, last access: 9 April 2021.
Ezeanya, E. K., Massiha, G. H., Simon, W. E., Rausch, J. R., and Chambers, T. L.: System advisor model (SAM) simulation modelling of a concentrating solar thermal power plant with comparison to actual performance data, Cogent Engineering, 5, 1524051, https://doi.org/10.1080/23311916.2018.1524051, 2018.
Fathollahzadeh, M. H., Speake, A., Tabares-Velasco, P. C., Khademian, Z., and Fight, L. L.: Renewable energy analysis in indigenous communities using bottom-up demand prediction, Sustain. Cities Soc., 71, 102932, https://doi.org/10.1016/j.scs.2021.102932, 2021.
Fay, M. P. and Proschan, M. A.: Wilcoxon-Mann-Whitney or t-test? On assumptions for hypothesis tests and multiple interpretations of decision rules, Statistics Survey, 4, 1–37, https://doi.org/10.1214%2F09-SS051, 2010.
Fields, J., Tinnesand, H., and Baring-Gould, I.: Distributed Wind Resource Assessment: State of the Industry, NREL/TP-5000-66419, National Renewable Energy Laboratory (NREL), Golden, CO (United States), https://doi.org/10.2172/1257326, 2016.
Freeman, J., Whitmore, J., Kaffine, L., Blair, N., and Dobos, A. P.: System Advisor Model: Flat Plate Photovoltaic Performance Modeling Validation Report, NREL/TP-6A20-60204, National Renewable Energy Laboratory, Golden, CO (United States), https://doi.org/10.2172/1115788, 2013.
Freeman, J. M., DiOrio, N., Blair, N., Guittet, D., Gilman, P., and Janzou, S.: Improvement and Validation of the System Advisor Model, DOE-NREL-30360, National Renewable Energy Laboratory (NREL), Golden, CO (United States), https://doi.org/10.2172/1495693, 2019.
Gelaro, R., McCarty, W., Suárez, M. J., Todling, R., Molod, A., Takacs, L., Randles, C. A., Darmenov, A., Bosilovich, M. G., Reichle, R., Wargan, K., Coy, L., Cullather, R., Draper, C., Akella, S., Buchard, V., Conaty, A., da Silva, A. M., Gu, W., Kim, G.-K., Koster, R., Lucchesi, R., Merkova, D., Nielsen, J. E., Partyka, G., Pawson, S., Putnam, W., Rienecker, M., Schubert, S. D., Sienkiewicz, M., and Zhao, B.: The Modern-Era Retrospective Analysis for Research and Applications, Version 2 (MERRA-2), J. Climate, 30, 5419–5454, https://doi.org/10.1175/JCLI-D-16-0758.1, 2017.
Global Wind Atlas: Global Wind Atlas, https://globalwindatlas.info/, last access: 22 August 2021.
Gruber, K., Klöckl, C., Regner, P., Baumgartner, J., and Schmidt, J.: Assessing the Global Wind Atlas and local measurements for bias correction of wind power generation simulated from MERRA-2 in Brazil, Energy, 189, 116212, https://doi.org/10.1016/j.energy.2019.116212, 2019.
Hahmann, A. N., Vincent, C. L., Peña, A., Lange, J., and Hasager, C. B.: Wind climate estimation using WRF model output: method and model sensitivities over the sea, Int. J. Climatol., 35, 3422–3439, https://doi.org/10.1002/joc.4217, 2014.
Hamlington, B. D., Hamlington, P. E., Collins, S. G., Alexander, S. R., and Kim, K-Y.: Effects of climate oscillations on wind resource variability in the United States, Geophys. Res. Lett., 42, 145–152, https://doi.org/10.1002/2014GL062370, 2015.
Hersbach, H., Bell, B., Berrisford, P., Hirahara, S., Horányi, A., Muñoz-Sabater, J., Nicolas, J., Peubey, C., Radu, R., Schepers, D., Simmons, A., Soci, C., Abdalla, S., Abellan, X., Balsamo, G., Bechtold, P., Biavati, G., Bidlot, J., Bonavita, M., De Chiara, G., Dahlgren, P., Dee, D., Diamantakis, M., Dragani, R., Flemming, J., Forbes, R., Fuentes, M., Geer, A., Haimberger, L., Healy, S., Hogan, R. J., Hólm, E., Janisková, M., Keeley, S., Laloyaux, P., Lopez, P., Lupu, C., Radnoti, G., de Rosnay, P., Rozum, I., Vamborg, F., Villaume, S., and Thépaut, J.-N.: The ERA5 Global Reanalysis, Q. J. Roy. Meteorol. Soc., 146, 1999–2049, https://doi.org/10.1002/qj.3803, 2020.
Hodge, B.-M.: Final Report on the Creation of the Wind Integration National Dataset (WIND) Toolkit and API: October 1, 2013–September 30, 2015, NREL/SR-5D00-66189, National Renewable Energy Laboratory (NREL), Golden, CO (United States), https://doi.org/10.2172/1247462, 2016.
Jourdier, B.: Evaluation of ERA5, MERRA-2, COSMO-REA6, NEWA and AROME to simulate wind power production over France, Adv. Sci. Res., 17, 63–77, https://doi.org/10.5194/asr-17-63-2020, 2020.
Kalverla, P. C., Holtslag, A. A. M., Ronda, R. J., and Steeneveld, G.-J.: Quality of wind characteristics in recent wind atlases over the North Sea, Q. J. Roy. Meteorol. Soc., 146, 1498–1515, https://doi.org/10.1002/qj.3748, 2020.
Kolbert, E.: The island in the wind, New Yorker, 7, 68–77, 2008.
Lawrence Berkeley National Laboratory: AmeriFlux, Lawrence Berkeley National Laboratory [data set], https://ameriflux.lbl.gov/sites/site-search/#filter-type=all&has-data=All&site_id=, last access: 9 March 2020.
Molina, M. O., Gutiérrez, C., and Sánchez, E.: Comparison of ERA5 surface wind speed climatologies over Europe with observations from the HadISD dataset, Int. J. Climatol., 41, 4864–4878, https://doi.org/10.1002/joc.7103, 2021.
NASA EOSDIS Land Processes DAAC: ASTER Global Digital Elevation Model NetCDF V003, https://doi.org/10.5067/ASTER/ASTGTM_NC.003, 2019.
NASA Global Modeling and Assimilation Office: Modern-Era Retrospective Analysis for Research and Applications, Version 2, NASA Global Modeling and Assimilation Office [data set], https://gmao.gsfc.nasa.gov/reanalysis/MERRA-2/data_access/, last access: 9 April 2021.
NOAA National Centers for Environmental Prediction: Integrated Surface Dataset, NOAA National Centers for Environmental Prediction [data set], https://www.ncei.noaa.gov/access/search/data-search/global-hourly, last access: 30 July 2021.
NOAA National Data Buoy Center: National Data Buoy Center [data set], https://www.ndbc.noaa.gov/, last access: 8 July 2021.
NREL: Flatirons Campus Data, NREL [data set], https://www.nrel.gov/wind/nwtc/data.html, last access: 9 March 2020.
NREL: System Advisor Model (SAM), NREL [data set], https://sam.nrel.gov/ (last access: 22 August 2021), 2021a.
NREL: Wind Resource Maps and Data, https://www.nrel.gov/gis/wind-resource-maps.html (last access: 22 August 2021), 2021b.
NREL: Wind Integration National Dataset Toolkit, NREL [data set], https://www.nrel.gov/grid/wind-toolkit.html (last access: 26 July 2021), 2021c.
Olauson, J.: ERA5: The new champion of wind power modelling?, Renew. Energ., 126, 322–331, https://doi.org/10.1016/j.renene.2018.03.056, 2018.
Olauson, J. and Bergkvist, M.: Modelling the Swedish wind power production using MERRA reanalysis data, Renew. Energ., 76717–76725, https://doi.org/10.1016/j.renene.2014.11.085, 2015.
Orrell, A. C., Foster, N. A., Morris, S. L., Homer, J. S., Preziuso, D. C., and Poehlman, E. A.: 2017 Distributed Wind Market Report, PNNL-27646, Pacific Northwest National Laboratory, Richland, WA (United States), https://doi.org/10.2172/1592336, 2018.
Orrell, A. C., Kazimierczuk, K., and Sheridan, L. M.: Distributed Wind Market Report: 2021 Edition, DOE/GO-102021-5620, Pacific Northwest National Laboratory (PNNL), Richland, WA (United States), https://doi.org/10.2172/1817750, 2021.
Poudel, R., Tinnesand, H., and Baring-Gould, I. E.: An Evaluation of Advanced Tools for Distributed Wind Turbine Performance Estimation, NAWEA WindTech 2019, 14–16 October 2019, Amherst, MA (United States), J. Phys. Conf. Ser., 1452, 012017, https://doi.org/10.1088/1742-6596/1452/1/012017, 2019.
Pronk, V., Bodini, N., Optis, M., Lundquist, J. K., Moriarty, P., Draxl, C., Purkayastha, A., and Young, E.: Can reanalysis products outperform mesoscale numerical weather prediction models in modeling the wind resource in simple terrain?, Wind Energ. Sci., 7, 487–504, https://doi.org/10.5194/wes-7-487-2022, 2022.
Pryor, S. C. and Barthelmie, R. J.: A global assessment of extreme wind speeds for wind energy applications, Nature Energy, 6, 268–276, https://doi.org/10.1038/s41560-020-00773-7, 2021.
Rabbani, R. and Zeeshan, M.: Exploring the suitability of MERRA-2 reanalysis data for wind energy estimation, analysis of wind characteristics and energy potential assessment for selected sites in Pakistan, Renew. Energ., 154, 1240–1251, https://doi.org/10.1016/j.renene.2020.03.100, 2020.
Ramon, J., Lledó, L., Torralba, V., Soret, A., and Doblas-Reyes, F. J.: Which global reanalysis best represents near-surface winds?, Q. J. Roy. Meteorol. Soc., 145, 3236–3251, https://doi.org/10.1002/qj.3616, 2019.
Rudié, E., Thornton, A., Rajendra, N., and Kerrigan, S.: System Advisor Model performance modeling validation report: Analysis of 100 sites, Locus Energy, LLC, Hoboken, NJ (United States) and National Renewable Energy Laboratory (NREL), Golden, CO, USA, 2014.
Samal, R. L.: Assessment of wind energy potential using reanalysis data: A comparison with mast measurements, J. Clean. Prod., 313, 127933, https://doi.org/10.1016/j.jclepro.2021.127933, 2021.
Storm, B. and Basu, S.: The WRF Model Forecast-Derived Low-Level Wind Shear Climatology over the United States Great Plains, Energies, 3, 258–276, https://doi.org/10.3390/en3020258, 2010.
Takle, E., Cai, B., and Sritharan, S.: Wind Energy Potential at Six Locations in the Midwest US at Higher Hub Heights, in: International Conference on Future Technologies for Wind Energy, 24–26 October 2017, Boulder, CO, USA, https://windtechconferences.org/2017-2/abstracts/ (last access: 21 March 2022), 2017.
University of Massachusetts Wind Energy Center: Resource Data, University of Massachusetts Wind Energy Center [data set], https://www.umass.edu/windenergy/resourcedata, last access: 12 March 2020.
Wang, Y.-H., Walter, R. K., White, C., Farr, H., and Ruttenberg, B. I.: Assessment of surface wind datasets for estimating offshore wind energy along the Central California Coast, Renew. Energ., 133, 343–353, https://doi.org/10.1016/j.renene.2018.10.008, 2019.
Wilczak, J., Finley, C., Freedman, J., Cline, J., Bianco, L., Olson, J., Djalalova, I., Sheridan, L., Ahlstrom, M., Manobianco, J., Zack, J., Carley, J.R., Benjamin, S., Coulter, R., Berg, L.K., Mirocha, J., Clawson, K., Natenberg, E., and Marquis, M.: The Wind Forecast Improvement Project (WFIP): A public–private partnership addressing wind energy forecast needs, B. Am. Meteorol. Soc., 96, 1699–1718, https://doi.org/10.1175/BAMS-D-14-00107.1, 2015.