the Creative Commons Attribution 4.0 License.
the Creative Commons Attribution 4.0 License.
 | 08 Nov 2023
Brief communication: On the definition of the low-level jet
Christoffer Hallgren
Jeanie A. Aird
Stefan Ivanell
Heiner Körnich
Rebecca J. Barthelmie
Sara C. Pryor
Erik Sahlée
Low-level jets (LLJs) are examples of non-logarithmic wind speed profiles affecting wind turbine power production, wake recovery, and structural/aerodynamic loading. However, there is no consensus regarding which definition should be applied for jet identification. In this study we argue that a shear definition is more relevant to wind energy than a falloff definition. The shear definition is demonstrated and validated through the development of a European Centre for Medium-Range Weather Forecasts (ECMWF) fifth-generation reanalysis (ERA5) LLJ climatology for six sites. Identification of LLJs and their morphology, frequency, and intensity is critically dependent on the (i) vertical window of data from which LLJs are extracted and (ii) the definition employed.
- Article
(2365 KB) - Full-text XML
-
Supplement
(14104 KB) - BibTeX
- EndNote


The shape of the wind speed profile across the rotor has a pronounced impact on wind power generation. It affects the actual power production from a single turbine (Nunalee and Basu, 2014; Weide Luiz and Fiedler, 2022) as well as the wake properties and thus also the total production from a wind farm (Doosttalab et al., 2020; Gadde and Stevens, 2021). Further, the wind profile also dictates structural shear loads and mechanical stress across the rotor plane (Gutierrez et al., 2017, 2019). Usually, within the surface layer of the atmosphere, the wind profile exhibits an approximately logarithmic form as predicted by Monin–Obukhov similarity theory (Motta et al., 2005). Even beyond the surface layer, there is an a priori expectation that winds will increase monotonically with increasing height. However, this is not always the case. In some areas, both offshore and onshore, non-ideal wind profiles (i.e., those that deviate from those inferred from similarity theory) are common due to meteorological conditions manifested from the mesoscale to synoptic scale, (i.e., day–night baroclinicity, complex topography and sloping terrain, coastal geography, and frontal passages). For an overview of these formation mechanisms, we refer to Stensrud (1996).
One specific type of non-ideal profile displays a local maximum in the wind speed profile (a core, or sometimes termed a nose) and is referred to as a low-level jet (LLJ; illustrated in Fig. 1a). Although LLJs have been studied in both climatological and wind energy contexts worldwide (Algarra et al., 2019; Lima et al., 2022), there is no general consensus within the field regarding how to distinguish an LLJ from a non-LLJ wind speed profile (i.e., the jet definition) at heights relevant to wind energy. Most commonly, an absolute threshold of the minimum falloff (the decrease in wind speed above and below the core) is applied. Typically, this threshold is either 1 or 2 m s−1 (e.g., Hallgren et al., 2020; Kalverla et al., 2020). Both Baas et al. (2009) and Aird et al. (2021) argued that this absolute threshold should be combined with a relative threshold such that the wind speed above and below the core also has to decrease by at least 10 % or 20 % of the core speed. Less commonly, the LLJ definition is dependent on thresholds for negative shear above the wind speed profile core (e.g., Weide Luiz and Fiedler, 2022). Debnath et al. (2021) applied a criterion for minimum positive shear below the core with both absolute and relative criteria for the change in wind speed above the core. Sometimes, an additional criterion of the duration of an event is added as part of the identification of the LLJ (Svensson et al., 2019). The vertical extent of the wind profile assessed for LLJs typically ranges up to 300 or 500 m and in some studies even higher. Inconsistencies in LLJ definitions result in numerical uncertainties for ensemble LLJ characteristics (mean ensemble jet core speeds differ approximately 2 m s−1 on average between definitions), rendering comparisons between studies difficult (Aird et al., 2021).
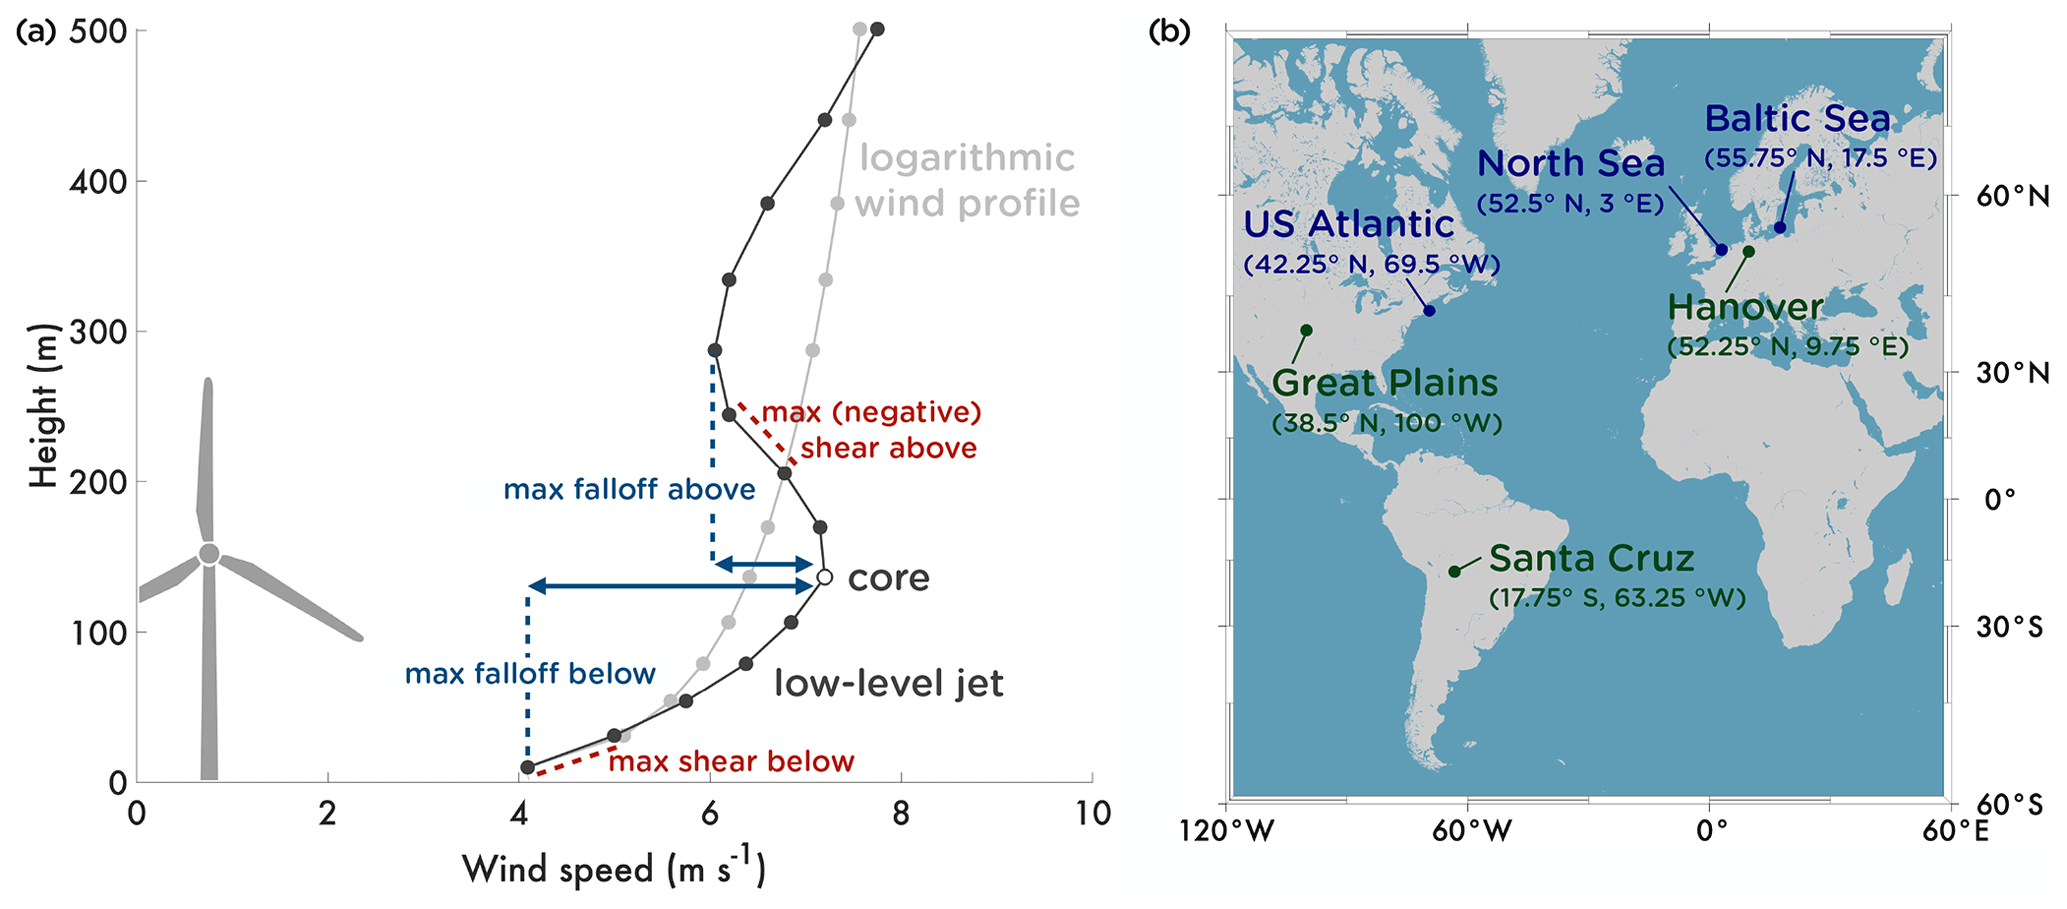
Figure 1In panel (a), an example of an LLJ wind profile is shown, plotted with the ERA5 reanalysis vertical resolution (see Sect. 2 for further details). For reference an ideal (logarithmic) wind speed profile is denoted in light grey. The maximum falloffs in wind speed above and below the core are indicated in blue, and the strongest shears below and above the core are indicated in red. The map in panel (b) shows the locations of the three offshore/coastal sites (blue) and the three onshore sites (green) analyzed in this study.
Compared to a falloff definition of LLJs, a shear definition considers the wind speed rate of change with height rather than only the change in wind speed independent of the height. Strong negative shear is often associated with a temperature inversion, which in turn leads to a low degree of turbulence, enhanced entrainment fluxes (Doosttalab et al., 2020), and possibly a separation of atmospheric layers with different turbulent properties (Banta et al., 2006; Hallgren et al., 2022). This affects both the loads on a wind turbine and the wake recovery rates (Doosttalab et al., 2020; Gadde and Stevens, 2021). For example, assume that the vertical wind speed profile is discretized with an interval of 30 m. If the wind speed decreases by 0.99 m s−1 between two levels (and then slowly increases to the next level), the profile will not be classified as an LLJ according to a 1 m s−1 falloff threshold, although it has a shear of −0.033 s−1 in this layer (compare to, e.g., Emeis, 2014). On the other hand, if the wind speed decreases evenly by 1 m s−1 between, e.g., 100 and 500 m, the shear is only −0.0025 s−1 in this layer, although the profile is classified as an LLJ according to the falloff threshold.
In this work, we compare how the selection of LLJ definition affects different aspects of the climatology, focusing on metrics relevant to wind power applications. The most common falloff definition is compared to a shear definition, and the definitions are applied over a height interval starting below the lowest height swept by the rotor and extending well beyond the top height of the rotor to allow for identification of jet cores below, close to and above hub height (Gadde and Stevens, 2021). The LLJs can then be filtered based on core height depending on the aim of the study.
To identify well-pronounced LLJs that are of particular relevance to wind energy, thresholds of falloff or shear should be applied both below and above the local maximum in the wind profile. In this study, the two LLJ definitions compared are as follows:
-
Falloff. This is defined as an increase in horizontal wind speed of at least 1 m s−1 and 10 % of the core speed below the core and simultaneously a decrease of 1 m s−1 and 10 % above the core.
-
Shear. This is defined as a local wind shear (i.e., between two vertical levels; see Fig. 1a) of at least 0.01 s−1 below the core and simultaneously at least −0.01 s−1 above the core.
The definitions are applied in the same way for three offshore/coastal sites (the Baltic Sea, the North Sea/Southern Bight, the US Atlantic coast east of Boston) and three onshore sites (the Great Plains/western Kansas, Hanover, Santa Cruz) using data from the European Centre for Medium-Range Weather Forecasts (ECMWF) fifth-generation reanalysis (ERA5) (Hersbach et al., 2020). Hourly output from the period 1979–2022 is analyzed. The vertical resolution for ERA5 in the lowest 500 m of the atmosphere is approximately 30 m between vertical levels. Although wind speed profiles from ERA5 generally exhibit pronounced smoothing when compared to lidar measurements (Hallgren et al., 2020), the study herein is method-focused and aims to compare the two methods of LLJ extraction and the subsequent effect on LLJ characterization rather than develop a robust LLJ climatology. As such, the same definitions for LLJ identification have been applied both onshore and offshore, although it could be argued that different criteria should be applied in different locations. However, the scope of this study is to investigate and compare the qualitative and quantitative LLJ characteristics both offshore and onshore when implementing the shear and falloff definitions. Subsequently, this study does not vary the quantitative criteria, but future studies could build upon this work by optimizing and refining the criteria offshore and onshore for different wind energy applications. The sites represent regions relevant to wind power development, where LLJs have previously been studied, and the locations of the selected grid points are presented in Fig. 1b.
As the rotor plane typically covers the 30–300 m height range (Barthelmie et al., 2020), we suggest to apply the definition over 10–500 m to stretch well beyond the rotor plane, when data are available. In our comparison, the ERA5 wind speed profile from model level numbers 137–124, corresponding to 10–500 m above the surface in the standard atmosphere, is assessed for LLJs. The approximate height of the levels are indicated in Fig. 1a. Absolute heights above the ground of the model levels are calculated relative to each time step and coordinate location as a function of thermal and humidity conditions within the ERA5 vertical profile. To estimate the power production during hours with LLJs extracted by each definition, the rotor-equivalent wind speed (see, e.g., Barthelmie et al., 2020) is calculated and applied to a power curve, assuming the 15 MW reference turbine (hub height: 150 m, radius: 120 m) described by Gaertner et al. (2020) for the three offshore sites and the Vestas 150–4.2 MW (hub height: 155 m, radius: 75 m) for the three onshore sites (Vestas, 2023).
The distributions of absolute and relative falloff as well as the strongest shear above and below the core for all wind profiles with a local maximum are presented for two of the sites (the Baltic Sea and the Great Plains) in Fig. 2 (larger plots for all six sites can be found in the Supplement). Qualitatively, the results are similar for all of the three offshore sites and for all of the three onshore sites. The distributions of all profiles with a local maximum in the wind profile (yellow in Fig. 2) indicate that, although the wind profiles are all non-ideal and have a local maximum, most of the time the core is not that pronounced (i.e., the shear around the core is relatively low). Due to frictional dissipation of momentum at the surface, both the increase in the wind speed and the shear below the core are generally stronger than the corresponding values above the core. Comparing the lines indicating the thresholds for the falloff and the shear definition of LLJs with the distributions, it is clear that the definitions overlap to a large extent but not fully. More LLJs are identified with the falloff definition, within the range of approximately 50 %–150 % more for all sites. For the Baltic Sea, 25 % of the time steps identified as exhibiting LLJs found by the shear definition are unique to that definition, but there is an overlap of 75 %. For the falloff definition, 33 %–51 % of the LLJs identified by that definition are also found by the shear definition.
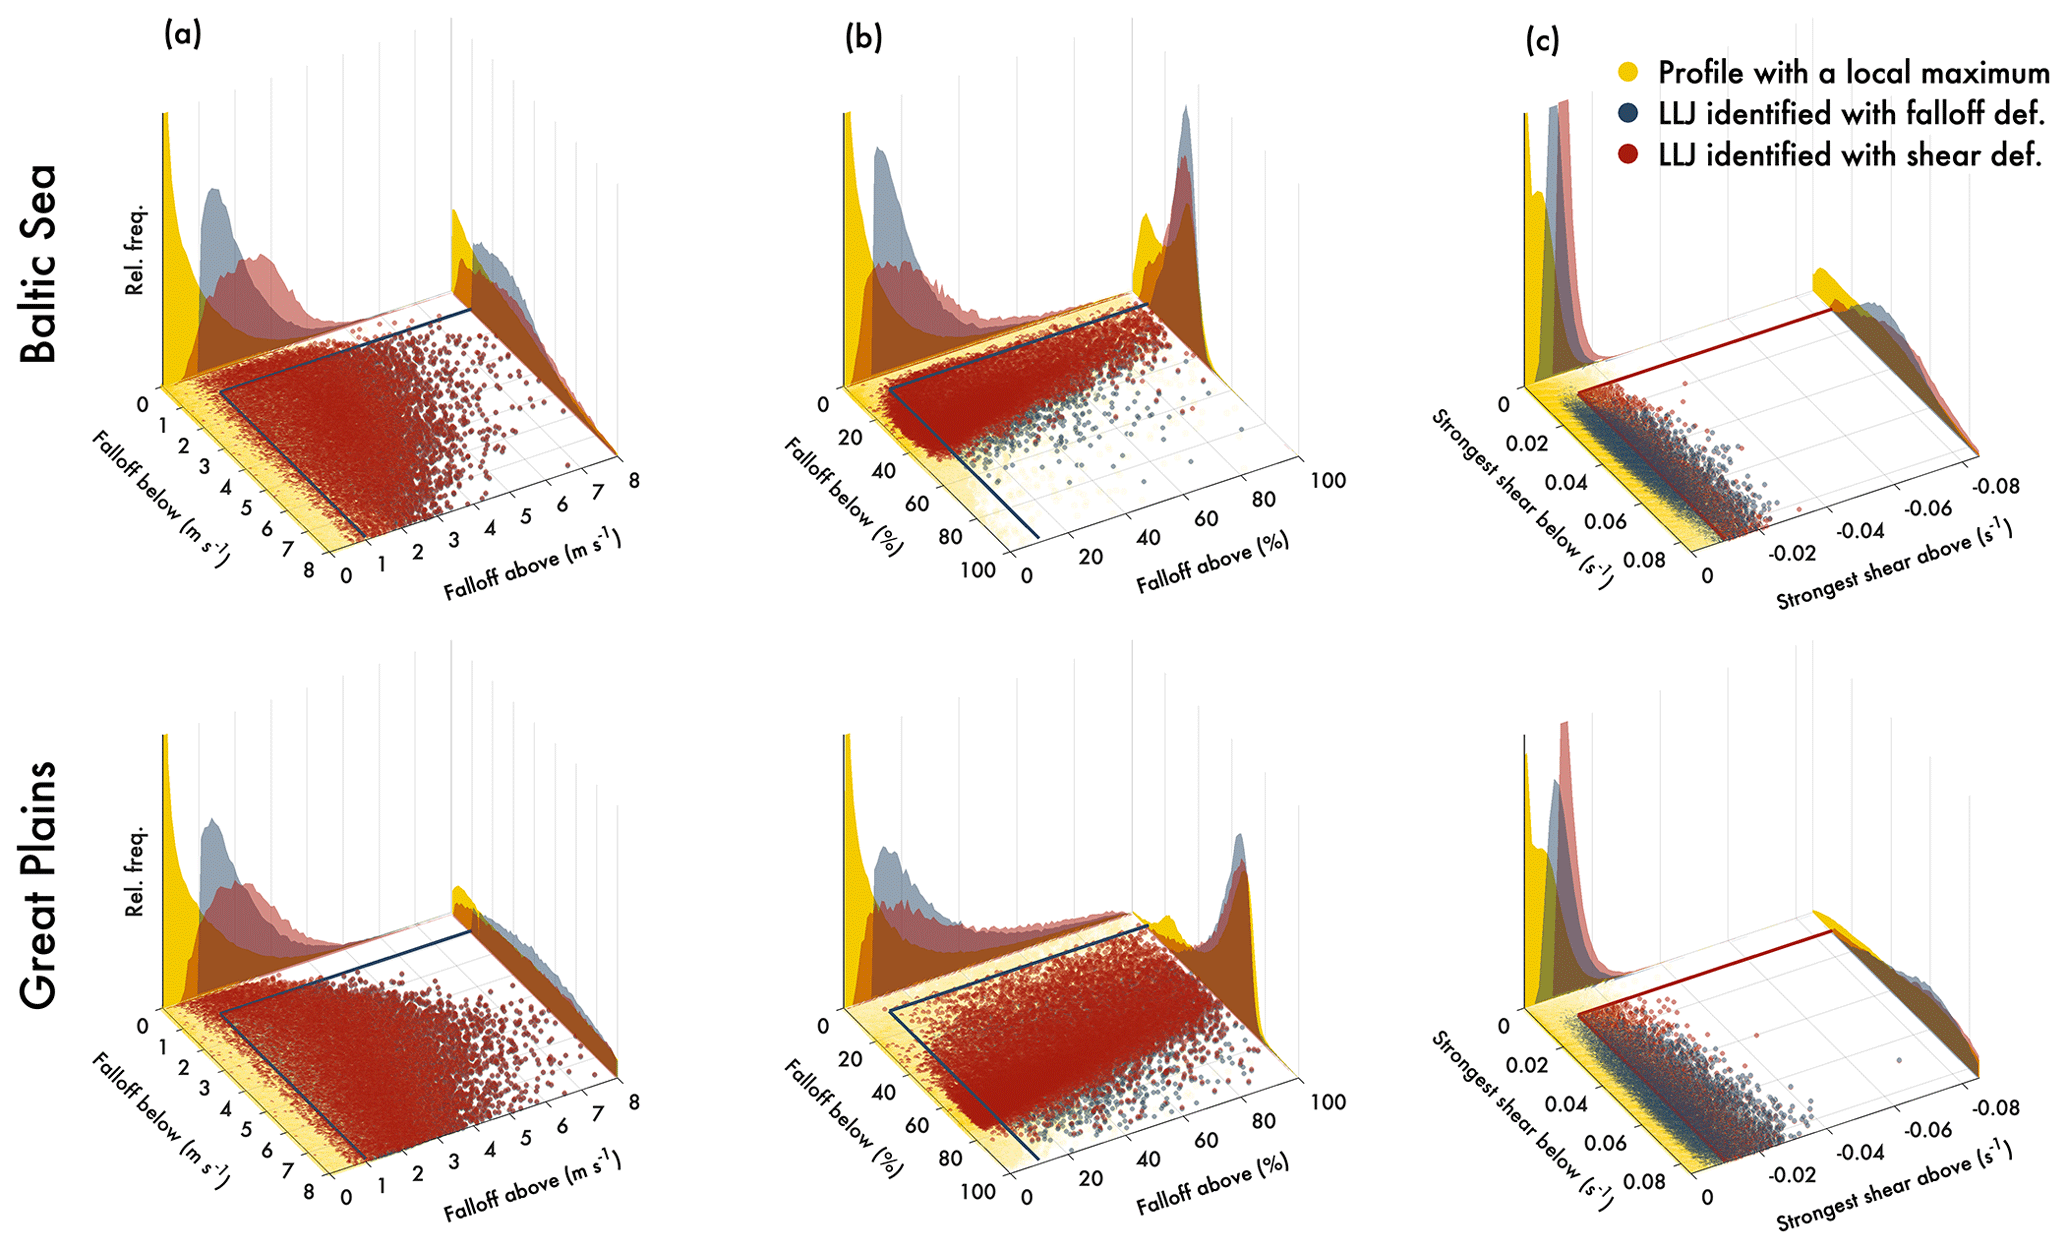
Figure 2Distributions of all profiles with a local maximum in the wind profile (yellow) in terms of absolute (a, d) and relative (b, e) changes in wind speed above and below the core and the strongest shear above and below the core (c, f) for the Baltic Sea (a, b, c) and the Great Plains (d, e, f). The combined ±1 m s−1 and 10 % falloff criterion is marked with the dark blue line (a, d and b, e) and the identified LLJs with pale blue dots. Similarly, the ±0.01 s−1 shear criterion is marked with the red line (c, f) and the identified LLJs with red dots. Distributions of the relative frequency for all profiles with a local maximum (yellow) and LLJs identified by the falloff definition (blue) and by the shear definition (red) are projected onto the vertical planes.
To compare the effect of the selection of the definition, statistics for commonly studied LLJ attributes are presented for all sites in Fig. 3. Despite the fact that both definitions partly identify unique LLJs, their mean profiles are qualitatively similar in shape (Fig. 3a). However, for all sites, the wind speed in the mean profile is somewhat lower for LLJs identified by the falloff definition. With respect to the full climatology (i.e., the average of all wind speed profiles, plotted in grey in Fig. 3a), the average LLJ wind speed is comparable in the lower part of the profile but then deviates towards lower wind speeds higher up. Core height (Fig. 3b) and speed (Fig. 3c) statistics extracted by each definition are similar, but the dispersion in core height is higher and skewed towards higher altitudes for the shear definition (6 %–10 % higher on average, except for US Atlantic with 1 % lower average core height). The height of the core is related to the wake recovery rate, with higher cores resulting in shorter wakes, as discussed by Gadde and Stevens (2021). Related to the height of the core and the positive shift in the average wind profile, the average core speed is 7 %–22 % larger for LLJs extracted by the shear definition (lowest values for US Atlantic).
Offshore, the distributions of power production under LLJs extracted with the shear definition are more similar to the climatology than those identified with the falloff definition, while onshore the power production is generally lower for both types of LLJs compared to the climatology (Fig. 3d). Generally for both definitions, 97 %–99 % of the offshore LLJs occur when the turbine is generating power (rotor-equivalent wind speed between cut-in and cut-out); onshore the numbers are only 4.2 %–20 % for Hanover and Santa Cruz but for the Great Plains approximately 50 %–60 %. Compared with the climatology, the turbine generates power offshore 90 %–92 % of the time and onshore 41 %–69 % of the time (highest values for the Great Plains). Onshore, LLJs identified by the falloff definition are more likely to appear at times when the turbine is not generating power compared to the LLJs found by the shear definition. Offshore, differences between definitions in that regard are small, as indicated by the percentage range.
The seasonality of LLJs extracted with both definitions is qualitatively similar (Fig. 3e) for most sites, although a higher frequency of LLJs is found with the falloff definition (see also Fig. 2d). There is a clear peak in LLJ frequency during the summer for offshore sites and a less pronounced peak in (hemispheric) winter for onshore sites. However, for Santa Cruz, LLJs extracted with the falloff definition do not exhibit seasonal variability. For the onshore sites, there is evidence of a diurnal cycle (Fig. 3f), which is most pronounced for the Great Plains, with a peak in LLJ frequency during the night.
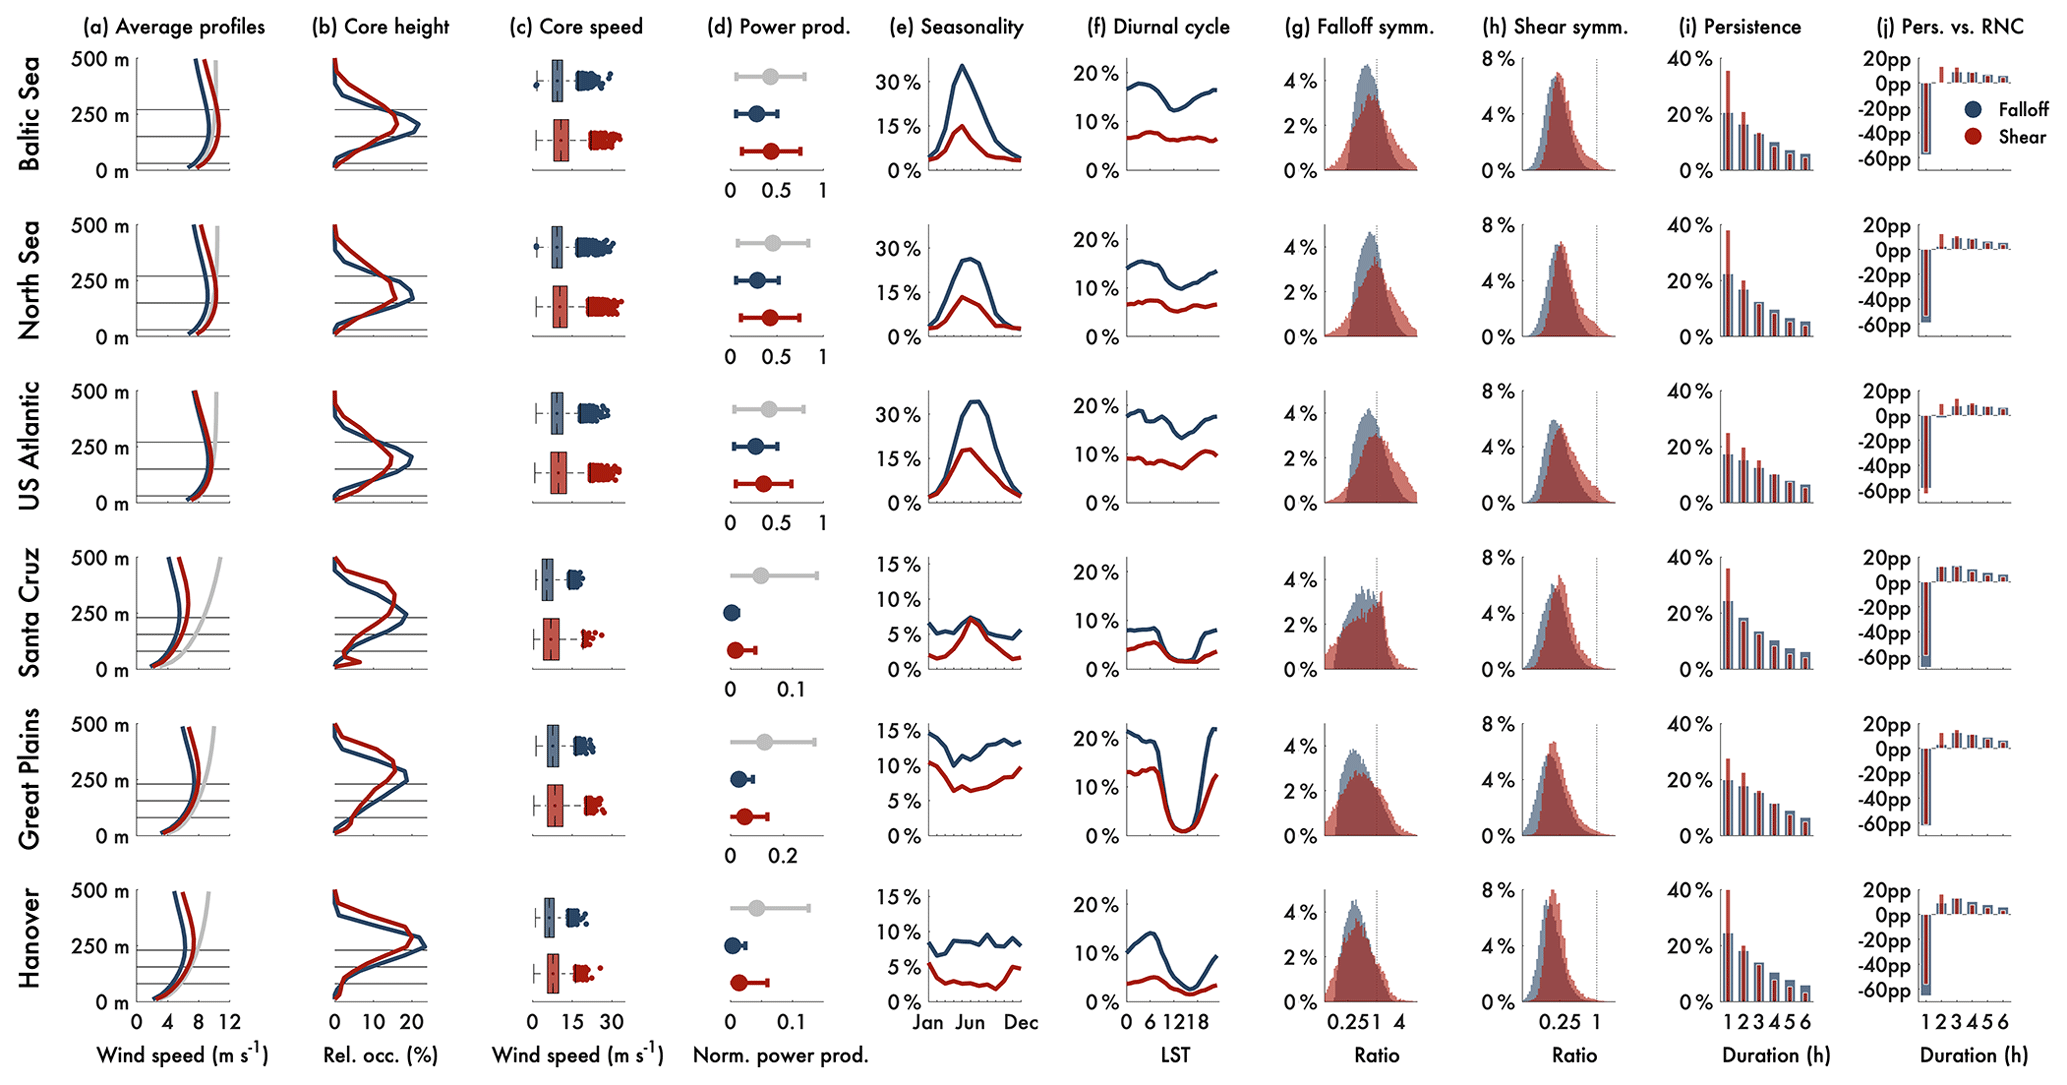
Figure 3Statistics of LLJ characteristics for the six sites using 44 years of hourly ERA5 data (1979–2022). In column (a) the average wind speed profiles are plotted for the two LLJ definitions, together with the climatological wind speed profile in grey (i.e., the average of the full time series at the site). Distributions of LLJ core height and core speed are shown in columns (b) and (c). In columns (a) and (b) the hub height and the top and bottom heights swept by the turbine blades are marked with solid lines (see Sect. 2 for turbine types). The mean power production (normalized with the rated power) and the standard deviation of the mean for LLJs found by the two definitions and the climatology (in grey) are plotted in column (d). In column (e) the relative occurrence of LLJs throughout the year is plotted, and in column (f) the diurnal cycle in local sidereal time (LST) is shown. Note the different scales on the ordinate for offshore (top three rows) and onshore (bottom three rows) locations. In column (g), the symmetry of the LLJs in terms of the ratio of the falloff above/below the core is shown and in column (h) the ratio of the absolute value of the strongest shear above the core to the strongest shear below the core. In column (i) the duration of LLJ events is plotted normalized against the total number of events. In column (j) the change in percentage points of the duration of LLJ events compared to a red noise climatology (RNC) is shown, following the same seasonal and diurnal relative occurrence as in columns (e) and (f). In columns (a), (e), and (f) the 99.9 % confidence interval of the mean hardly differs from the line thickness and is thus not shown. For the boxplots in columns (c) and (d), the dot in each box marks the median value, and notches in the box mark the 95 % confidence interval of the median. The edges of the box show the 25th and 75th percentiles, and whiskers extend from the box to the most extreme value within 1.5 times the interquartile range. The colored dots outside the whiskers mark the outliers.
Using the shear definition, more shear-symmetric LLJs are found for all sites (Fig. 3h), and there is a markedly higher dispersion of the ratio of the maximum falloff above/below the core (Fig. 3g). This finding is particularly relevant to wind energy. As such, the shear definition identifies LLJs with more variability in the ratio of the maximum falloff above/below the core, which has implications for aerodynamic and structural loading (Gutierrez et al., 2019) as well as wake recovery (Gadde and Stevens, 2021). This is a key differentiating factor when compared to LLJs extracted by the falloff definition and gives a strong indication that the shear definition is superior to the falloff definition; the shear definition identifies more LLJs with unique wind profiles that are relevant to wind turbine power production and lifespan.
The persistence plot (Fig. 3i) shows the duration of LLJ events. Most LLJs appear as single-hour events, with approximately 20 % of LLJs found by the falloff definition and 30 %–40 % of the LLJs found by the shear definition. There is a gradual decrease in the probability of events with longer duration. The red noise component of atmospheric behavior (i.e., the persistence) means that the probability of an LLJ with a given duration for lags of >1 h exceeds that derived using a random number generator that has the correct joint probability by hour of the day and month of the year. In Fig. 3j, the difference in the distributions of the persistence of LLJ events is plotted, comparing the duration of LLJ events with what could be expected from a randomized 100-year climatology, keeping the seasonal and diurnal relative frequencies as found by either the falloff or the shear definition for each site, respectively. Compared to the red noise, LLJs tend to cluster in events. Singular LLJs appear 50–60 percentage points less often than what would be expected from the random climatology. Events lasting 2 h are more common using the shear definition, but in general both definitions are similar in the persistence of LLJ events when taking the differences in relative occurrence between the two definitions into account (Fig. 3j).
In summary, the shear-based LLJ definition results in qualitatively similar LLJ characteristics in terms of average profiles, power production, and diurnal/seasonal pattern (Fig. 3) when compared to the falloff definition, although the definitions partially identify unique LLJs (Fig. 2d). This may be attributed to each definition identifying LLJs in different atmospheric regimes; i.e., it is possible that the shear definition identifies a higher fraction of LLJs in stable conditions due to the lower mean core speeds exhibited by shear-extracted LLJs. However, as the shear definition considers the change in wind speed over the change in height, it is better suited for wind power applications due to the relationship between the change in speed over height and bending moment calculations, a primary consideration of LLJ occurrence (Gutierrez et al., 2017; Gadde and Stevens, 2021; Weide Luiz and Fiedler, 2022).
The falloff definition is highly sensitive to the vertical window applied, identifying 300 %–1200 % more jets when increasing the vertical window from 10–300 to 10–500 m (results not shown). The shear definition is less sensitive, only identifying 80 %–300 % more jets in the larger vertical window. This may be attributed to frequent reductions in wind speed with height when the vertical window is extended, which allow for fulfillment of the falloff definition but do not exhibit strong enough intra-layer shear to meet the shear definition. To build on this study, the effect of using a combination of the falloff and shear definitions could be investigated (similar to what was used by Debnath et al., 2021). LLJ definitions based on, for example, convergence of momentum flux could also be suitable for wind power but suffer from measurement difficulty in practical application. However, the shear definition proposed in this study relies solely on the wind speed profile and could thus easily be applied to model or measurement data. Using multi-year or multi-decade data (as in this study), a statistical definition could be created to classify the most extreme profiles in terms of falloff or shear as LLJs. This would result in a more site-specific definition (which would make inter-study comparisons more difficult) but could, on the other hand, provide a more robust definition that is not based on an arbitrary threshold (such as 1 m s−1, 10 %, or 0.01 s−1).
Building on this study, similar analysis on the best definition of the LLJ should be performed on wind speed profiles measured by lidar instruments. As modeled wind speed profiles are often much smoother than observed profiles (e.g., Hallgren et al., 2020; Kalverla et al., 2020), reanalyses tend to underestimate the actual occurrence of LLJs. Although it is difficult to compare sites with different lidar instrumentations (implying different vertical and temporal resolutions, height ranges, and temporal coverages), this type of analysis would be of high importance to the wind energy industry, and results could be compared to those presented herein.
LLJ climatologies at three offshore and three onshore sites are developed using two different LLJ definitions – one falloff-based definition and one shear-based definition. The LLJ climatologies generated by each definition are compared. In general the two definitions give similar results for all sites studied, with differences mainly associated with the total frequency of occurrence (50 %–150 % more LLJs using the falloff definition), wind speed (a shift towards higher wind speeds in the average profiles and for the core speed for the shear definition), core height (somewhat greater variability and in general 6 %–10 % higher average core height for the shear definition), and symmetry (more shear-symmetric LLJs with a larger variability in the falloff ratio above/below the core found by the shear definition).
Based on the results, we recommend the shear definition as the optimal LLJ definition for wind energy applications. The shear definition captures sharp transitions in the wind profile better (as evidenced by the higher dispersion in falloff ratios exhibited by LLJs extracted with the shear definition; see Fig. 3g), which are decisive for structural and aerodynamic loading as well as wake recovery rates (Gutierrez et al., 2017, 2019; Doosttalab et al., 2020; Gadde and Stevens, 2021). These sharp transitions are possibly related to layers with different properties in the atmospheric boundary layer (Sect. 1). Further, the shear definition is less sensitive to the vertical window applied, which is one of the primary sensitivities of LLJ characterization. The shear threshold should be applied both below and above the local wind speed maximum in the vertical profile and preferably over a height range extending beyond the heights swept by average offshore/onshore wind turbines to allow for identification of jet cores below, close to, and above hub height.
The code used to generate the figures can be acquired by contacting the corresponding authors. For the ERA5 data (hourly values on model levels for wind components, temperature, and specific humidity; hourly data on a single level for surface pressure), we refer to Hersbach et al. (2017) (https://doi.org/10.24381/cds.143582cf). Data were downloaded from the Copernicus Climate Change Service (C3S) (2023) (https://cds.climate.copernicus.eu/cdsapp#!/dataset/reanalysis-era5-complete). The results contain modified Copernicus Climate Change Service information. Neither the European Commission nor ECMWF is responsible for any use that may be made of the Copernicus information or data it contains.
The supplement related to this article is available online at: https://doi.org/10.5194/wes-8-1651-2023-supplement.
The conceptualization, administration, methodology, programming, validation, formal analysis, visualization, and writing of the original draft were performed by CH and JAA. CH was supervised by ES, SI, and HK. JAA was supervised by RJB and SCP. Funding acquisition was carried out by ES, SI, HK, RJB, and SCP. All authors participated in reviewing and editing the paper.
At least one of the (co-)authors is a member of the editorial board of Wind Energy Science. The peer-review process was guided by an independent editor, and the authors also have no other competing interests to declare.
Publisher’s note: Copernicus Publications remains neutral with regard to jurisdictional claims made in the text, published maps, institutional affiliations, or any other geographical representation in this paper. While Copernicus Publications makes every effort to include appropriate place names, the final responsibility lies with the authors.
This research was funded by the Energimyndigheten (Swedish Energy Agency) VindEL program (grant no. 47054-1). The work forms part of the Swedish strategic research program STandUP for Wind.
This paper was edited by Julia Gottschall and reviewed by two anonymous referees.
Aird, J. A., Barthelmie, R. J., Shepherd, T. J., and Pryor, S. C.: WRF-simulated low-level jets over Iowa: characterization and sensitivity studies, Wind Energ. Sci., 6, 1015–1030, https://doi.org/10.5194/wes-6-1015-2021, 2021. a, b
Algarra, I., Eiras-Barca, J., Nieto, R., and Gimeno, L.: Global climatology of nocturnal low-level jets and associated moisture sources and sinks, Atmos. Res., 229, 39–59, https://doi.org/10.1016/j.atmosres.2019.06.016, 2019. a
Baas, P., Bosveld, F., Klein Baltink, H., and Holtslag, A.: A climatology of nocturnal low-level jets at Cabauw, J. Appl. Meteorol. Clim., 48, 1627–1642, https://doi.org/10.1175/2009JAMC1965.1, 2009. a
Banta, R. M., Pichugina, Y. L., and Brewer, W. A.: Turbulent velocity-variance profiles in the stable boundary layer generated by a nocturnal low-level jet, J. Atmos. Sci., 63, 2700–2719, https://doi.org/10.1175/JAS3776.1, 2006. a
Barthelmie, R. J., Shepherd, T. J., Aird, J. A., and Pryor, S. C.: Power and wind shear implications of large wind turbine scenarios in the US Central Plains, Energies, 13, 4269, https://doi.org/10.3390/en13164269, 2020. a, b
Copernicus Climate Change Service (C3S): Complete ERA5 global atmospheric reanalysis, https://cds.climate.copernicus.eu/cdsapp#!/dataset/reanalysis-era5-complete (last access: 31 March 2023), 2023. a
Debnath, M., Doubrawa, P., Optis, M., Hawbecker, P., and Bodini, N.: Extreme wind shear events in US offshore wind energy areas and the role of induced stratification, Wind Energ. Sci., 6, 1043–1059, https://doi.org/10.5194/wes-6-1043-2021, 2021. a, b
Doosttalab, A., Siguenza-Alvarado, D., Pulletikurthi, V., Jin, Y., Bocanegra Evans, H., Chamorro, L. P., and Castillo, L.: Interaction of low-level jets with wind turbines: On the basic mechanisms for enhanced performance, J. Renew. Sustain. Ener., 12, 053301, https://doi.org/10.1063/5.0017230, 2020. a, b, c, d
Emeis, S.: Wind speed and shear associated with low-level jets over Northern Germany, Meteorologische Z., 23, 295, https://doi.org/10.1127/0941-2948/2014/0551, 2014. a
Gadde, S. N. and Stevens, R. J.: Effect of low-level jet height on wind farm performance, J. Renew. Sustain. Ener., 13, 013305, https://doi.org/10.1063/5.0026232, 2021. a, b, c, d, e, f, g
Gaertner, E., Rinker, J., Sethuraman, L., Zahle, F., Anderson, B., Barter, G. E., Abbas, N. J., Meng, F., Bortolotti, P., Skrzypinski, W., Scott, G., Feil, R., Bredmose, H., Dykes, K., Shields, M., Allen, C., and Viselli, A.: IEA wind TCP task 37: definition of the IEA 15-megawatt offshore reference wind turbine, Tech. rep., National Renewable Energy Lab. (NREL), Golden, CO (United States), https://doi.org/10.2172/1603478, 2020. a
Gutierrez, W., Ruiz-Columbie, A., Tutkun, M., and Castillo, L.: Impacts of the low-level jet's negative wind shear on the wind turbine, Wind Energ. Sci., 2, 533–545, https://doi.org/10.5194/wes-2-533-2017, 2017. a, b, c
Gutierrez, W., Ruiz-Columbie, A., Tutkun, M., and Castillo, L.: The structural response of a wind turbine under operating conditions with a low-level jet, Renew. Sustain. Energy Rev., 108, 380–391, https://doi.org/10.1016/j.rser.2019.03.058, 2019. a, b, c
Hallgren, C., Arnqvist, J., Ivanell, S., Körnich, H., Vakkari, V., and Sahlée, E.: Looking for an Offshore Low-Level Jet Champion among Recent Reanalyses: A Tight Race over the Baltic Sea, Energies, 13, 3670, https://doi.org/10.3390/en13143670, 2020. a, b, c
Hallgren, C., Arnqvist, J., Nilsson, E., Ivanell, S., Shapkalijevski, M., Thomasson, A., Pettersson, H., and Sahlée, E.: Classification and properties of non-idealized coastal wind profiles – an observational study, Wind Energ. Sci., 7, 1183–1207, https://doi.org/10.5194/wes-7-1183-2022, 2022. a
Hersbach, H., Bell, B., Berrisford, P., Hirahara, S., Horányi, A., Muñoz‐Sabater, J., Nicolas, J., Peubey, C., Radu, R., Schepers, D., Simmons, A., Soci, C., Abdalla, S., Abellan, X., Balsamo, G., Bechtold, P., Biavati, G., Bidlot, J., Bonavita, M., De Chiara, G., Dahlgren, P., Dee, D., Diamantakis, M., Dragani, R., Flemming, J., Forbes, R., Fuentes, M., Geer, A., Haimberger, L., Healy, S., Hogan, R., Hólm, E., Janisková, M., Keeley, S., Laloyaux, P., Lopez, P., Lupu, C., Radnoti, G., de Rosnay, P., Rozum, I., Vamborg, F., Villaume, S., and Thépaut, J.-N.: Complete ERA5 from 1940: Fifth generation of ECMWF atmospheric reanalyses of the global climate, Copernicus Climate Change Service (C3S) Data Store (CDS) [data set], https://doi.org/10.24381/cds.143582cf, 2017. a
Hersbach, H., Bell, B., Berrisford, P., Hirahara, S., Horányi, A., Muñoz‐Sabater, J., Nicolas, J., Peubey, C., Radu, R., Schepers, D., Simmons, A., Soci, C., Abdalla, S., Abellan, X., Balsamo, G., Bechtold, P., Biavati, G., Bidlot, J., Bonavita, M., De Chiara, G., Dahlgren, P., Dee, D., Diamantakis, M., Dragani, R., Flemming, J., Forbes, R., Fuentes, M., Geer, A., Haimberger, L., Healy, S., Hogan, R., Hólm, E., Janisková, M., Keeley, S., Laloyaux, P., Lopez, P., Lupu, C., Radnoti, G., de Rosnay, P., Rozum, I., Vamborg, F., Villaume, S., and Thépaut, J.-N.: The ERA5 global reanalysis, Q. J. Roy. Meteor. Soc., 146, 1999–2049, https://doi.org/10.1002/qj.3803, 2020. a
Kalverla, P. C., Holtslag, A. A. M., Ronda, R. J., and Steeneveld, G.-J.: Quality of wind characteristics in recent wind atlases over the North Sea, Q. J. Roy. Meteor. Soc., 146, 1498–1515, https://doi.org/10.1002/qj.3748, 2020. a, b
Lima, D. C., Soares, P. M., Nogueira, M., and Semedo, A.: Global coastal low-level wind jets revisited through the new ERA5 reanalysis, Int. J. Climatol., 42, 4491–4507, https://doi.org/10.1002/joc.7482, 2022. a
Motta, M., Barthelmie, R. J., and Vølund, P.: The influence of non-logarithmic wind speed profiles on potential power output at Danish offshore sites, Wind Energy, 8, 219–236, https://doi.org/10.1002/we.146, 2005. a
Nunalee, C. G. and Basu, S.: Mesoscale modeling of coastal low-level jets: implications for offshore wind resource estimation, Wind Energy, 17, 1199–1216, https://doi.org/10.1002/we.1628, 2014. a
Stensrud, D. J.: Importance of low-level jets to climate: A review, J. Climate, 1698–1711, 1996. a
Svensson, N., Arnqvist, J., Bergström, H., Rutgersson, A., and Sahlée, E.: Measurements and modelling of offshore wind profiles in a semi-enclosed sea, Atmosphere, 10, 194, https://doi.org/10.3390/atmos10040194, 2019. a
Vestas: Vestas V150-4.2 MW, https://www.vestas.com/en/products/4-mw-platform/V150-4-2-MW (last access: 12 April 2023), 2023. a
Weide Luiz, E. and Fiedler, S.: Spatiotemporal observations of nocturnal low-level jets and impacts on wind power production, Wind Energ. Sci., 7, 1575–1591, https://doi.org/10.5194/wes-7-1575-2022, 2022. a, b, c