the Creative Commons Attribution 4.0 License.
the Creative Commons Attribution 4.0 License.
 | 06 Dec 2023
Wear test programs for roller-type pitch bearings of wind turbines
Matthias Stammler
Pitch bearings are critical for the safe and efficient operation of wind turbines. They connect the rotor blades to the rotor hub and allow for pitching movements that control loads and rotor speeds. While four-point-contact ball bearings have been dominant in the past, three-row roller bearings are increasingly used in current designs due to their higher load capacity at the same diameter. Wear of the raceways is one of the possible damage mechanisms in pitch bearings. As roller bearings differ significantly from previous designs and because the operational conditions of wind turbines differ from other industrial applications, it is a reasonable de-risking exercise to undergo wear tests prior to the commissioning of such bearings. This study outlines a process for developing a wear test program based on aero-elastic simulation data and wind speed measurements. The process is then applied to an example roller bearing. The final program covers both standstill conditions and pitch cycles. The first is the main addition to former approaches. With existing test rigs and a reasonable budget and timeline, the program can be executed.
- Article
(7092 KB) - Full-text XML
- BibTeX
- EndNote


The objective of this study is to develop a wear test program for roller-type pitch bearings. Pitch bearings of wind turbines are large slewing bearings that connect each rotor blade with the rotor hub (Burton, 2011). To minimize deformations of the bearing rings, additional stiffening elements such as plates or rings are often employed. There are various commercially available design types for these bearings, as listed in Stammler (2020). However, to the best of the author's knowledge, there have only been two publications on wear testing results for pitch bearings with a diameter greater than 2 m: Behnke and Schleich (2023) reported on tests with several four-point-contact ball bearings with a pitch diameter of 2.3 m, while Stammler (2020) presented results for two four-point-contact ball bearings with a pitch diameter of 4.69 m. Both publications report on short-term tests with static axial loads, and both include results for constant amplitudes and protection runs. Protection runs refer to longer pitch movements embedded within sequences of shorter movements, which protect the raceway from wear by redistributing the grease in the bearing, as explained in Stammler et al. (2019a) and Stammler (2020).
Stammler (2020) and later Song and Karikari-Boateng (2021) have outlined long-term wear test programs for pitch bearings. Stammler (2020) applies sequence recognition to find wear-critical series of pitch cycles in time series data. These series, along with any protection runs, are then combined based on seasonal profiles to generate time series that represent the full lifetime of the turbine. Meanwhile, Song and Karikari-Boateng (2021) use a similar approach to recognize wear-critical parameters in individual cycles but do not consider the sequence of these cycles or account for possible protection runs. While the approach outlined in Stammler (2020) yields useful results for pitch cycles, it does not take into account standstill conditions. Therefore, further research is necessary to incorporate standstill conditions into wear testing programs for pitch bearings.
Over the past few decades, results of several wear tests with constant amplitudes, either as angular amplitudes of the raceways or as load amplitudes, have been published. However, only a minority of these publications cover wear in line contacts. A review of oscillating bearing with both point and line contacts was conducted by de La Presilla et al. (2023).
One early study by Pittroff (1961) subjected cylindrical roller bearings to radial load oscillations. In these tests, an off-axis weight rotated on a shaft and caused the individual contact loads to vary between 0 MPa and <500 MPa. Among other parameters, Pittroff reported on the ability of pretension to reduce the wear damages of the raceways. In another study, Breward (1973) showed false brinelling damages of oil-lubricated roller bearings. The author suggested empirical calculations for the rolling contact fatigue lifetime that take account of the depth of false brinelling damages. Njoya (1982) used different cage configurations for needle bearings of gearboxes to prevent wear on the rings by forcing a cage movement for operating points where the inner and outer rings have the same speed. Föhl and Sommer (FVA, 1988, 1991) conducted wear tests on oil-lubricated axial roller bearings (type 81212) to understand the influence of tribolayers. The test load was 80 kN, and the calculated contact pressure was 1890 MPa. The test rig, an FE8 as defined in DIN (1999), rotated the bearing with 7.5 rpm. Föhl and Sommer showed the influence of different additives on wear creation and the beneficial influence of sulfur and phosphate. Wolf et al. (FVA, 2007) conducted tests on type 81212 bearings using an FE8 test rig and commercial oil for gearboxes and combustion engines. The bearings rotated with 7.5 rpm. Wolf et al. identified a lower load region that does not cause wear and a higher load region that results in wear. Schadow (FVA, 2010) tested type 32005 tapered roller bearings to identify the influence of different parameters on false brinelling damages. The author used various greases, and the test rig allowed testing at different levels of temperature. The application of dynamic axial, radial, and combined loads caused only slight damages on the bearing raceways. The maximum load amplitude was 25 % of the initial static load, which was at and of the load capacity of the bearings. Small oscillating angles under static and dynamic loads caused similar damages to the raceways. As all damages appeared to be similar, it was not possible to determine the influence of individual test parameters on the damages. The oscillation amplitudes were very small in comparison with wind turbine applications. In recent studies, Lin et al. (2022) found that zinc dialkyldithiophosphate (ZDDP) additives in grease can effectively prevent wear damage on raceways of cylindrical roller bearings subjected to radial loads and superimposed vibrations.
Stammler et al. described the oscillating behavior of pitch bearings in Stammler and Poll (2014) and Stammler et al. (2018, 2019b) and evaluated the influence of different controller types on the oscillating cycles of pitch bearings. They distinguished between collective pitch control (CPC) and individual pitch control (IPC), with the former controlling all three blades simultaneously to adjust the turbine's power output and the latter controlling the blades individually to limit bending-moment variations and reduce fatigue loads on the turbine structure. IPC increases the pitch activity significantly (Stammler et al., 2019b; Requate et al., 2020). This reduces the bearing's rolling contact fatigue life expectancy. As the loads are the highest close to rated wind speed (Burton, 2011), limiting IPC activity at speeds much below rated wind speed is a reasonable approach to reduce wear and prolong bearing life (Bottasso et al., 2014). This approach may lead to the pitch bearing remaining in rotatory standstill under most operating conditions below rated speed.
Most full-scale test rigs for pitch bearings are operated by commercial businesses. Publications on the rigs are limited to advertising videos, photos in company reports, and press releases. Examples include Shanghai Oujikete (2012), Vries (2013), Lüneburg et al. (2014), Rollix (2017), Fischer and Mönnig (2019), Fangyuan (2019), and Vries (2019). To the best of the author's knowledge, there are currently no publicly available test programs or results, even though several test rigs are in operation and roller-type pitch bearings play an increasingly important commercial role. Therefore, developing a test program for full-scale roller-type pitch bearings must address several uncertainties, which are highlighted in the following sections.
The remainder of this article begins with Sect. 2, which discusses definitions and damage mechanisms. Section 3 describes the process from the data input to the test program output. The data input includes aero-elastic simulation time series, wind speed measurements, and bearing data, while the output consists of test time series in 6 degrees of freedom. Section 4, which covers the application and results, uses the data of the IWES wind turbine (IWT)7.5-164 reference turbine to create a test program for the Bearing Endurance and Acceptance Test (BEAT6.1) rig of Fraunhofer IWES.
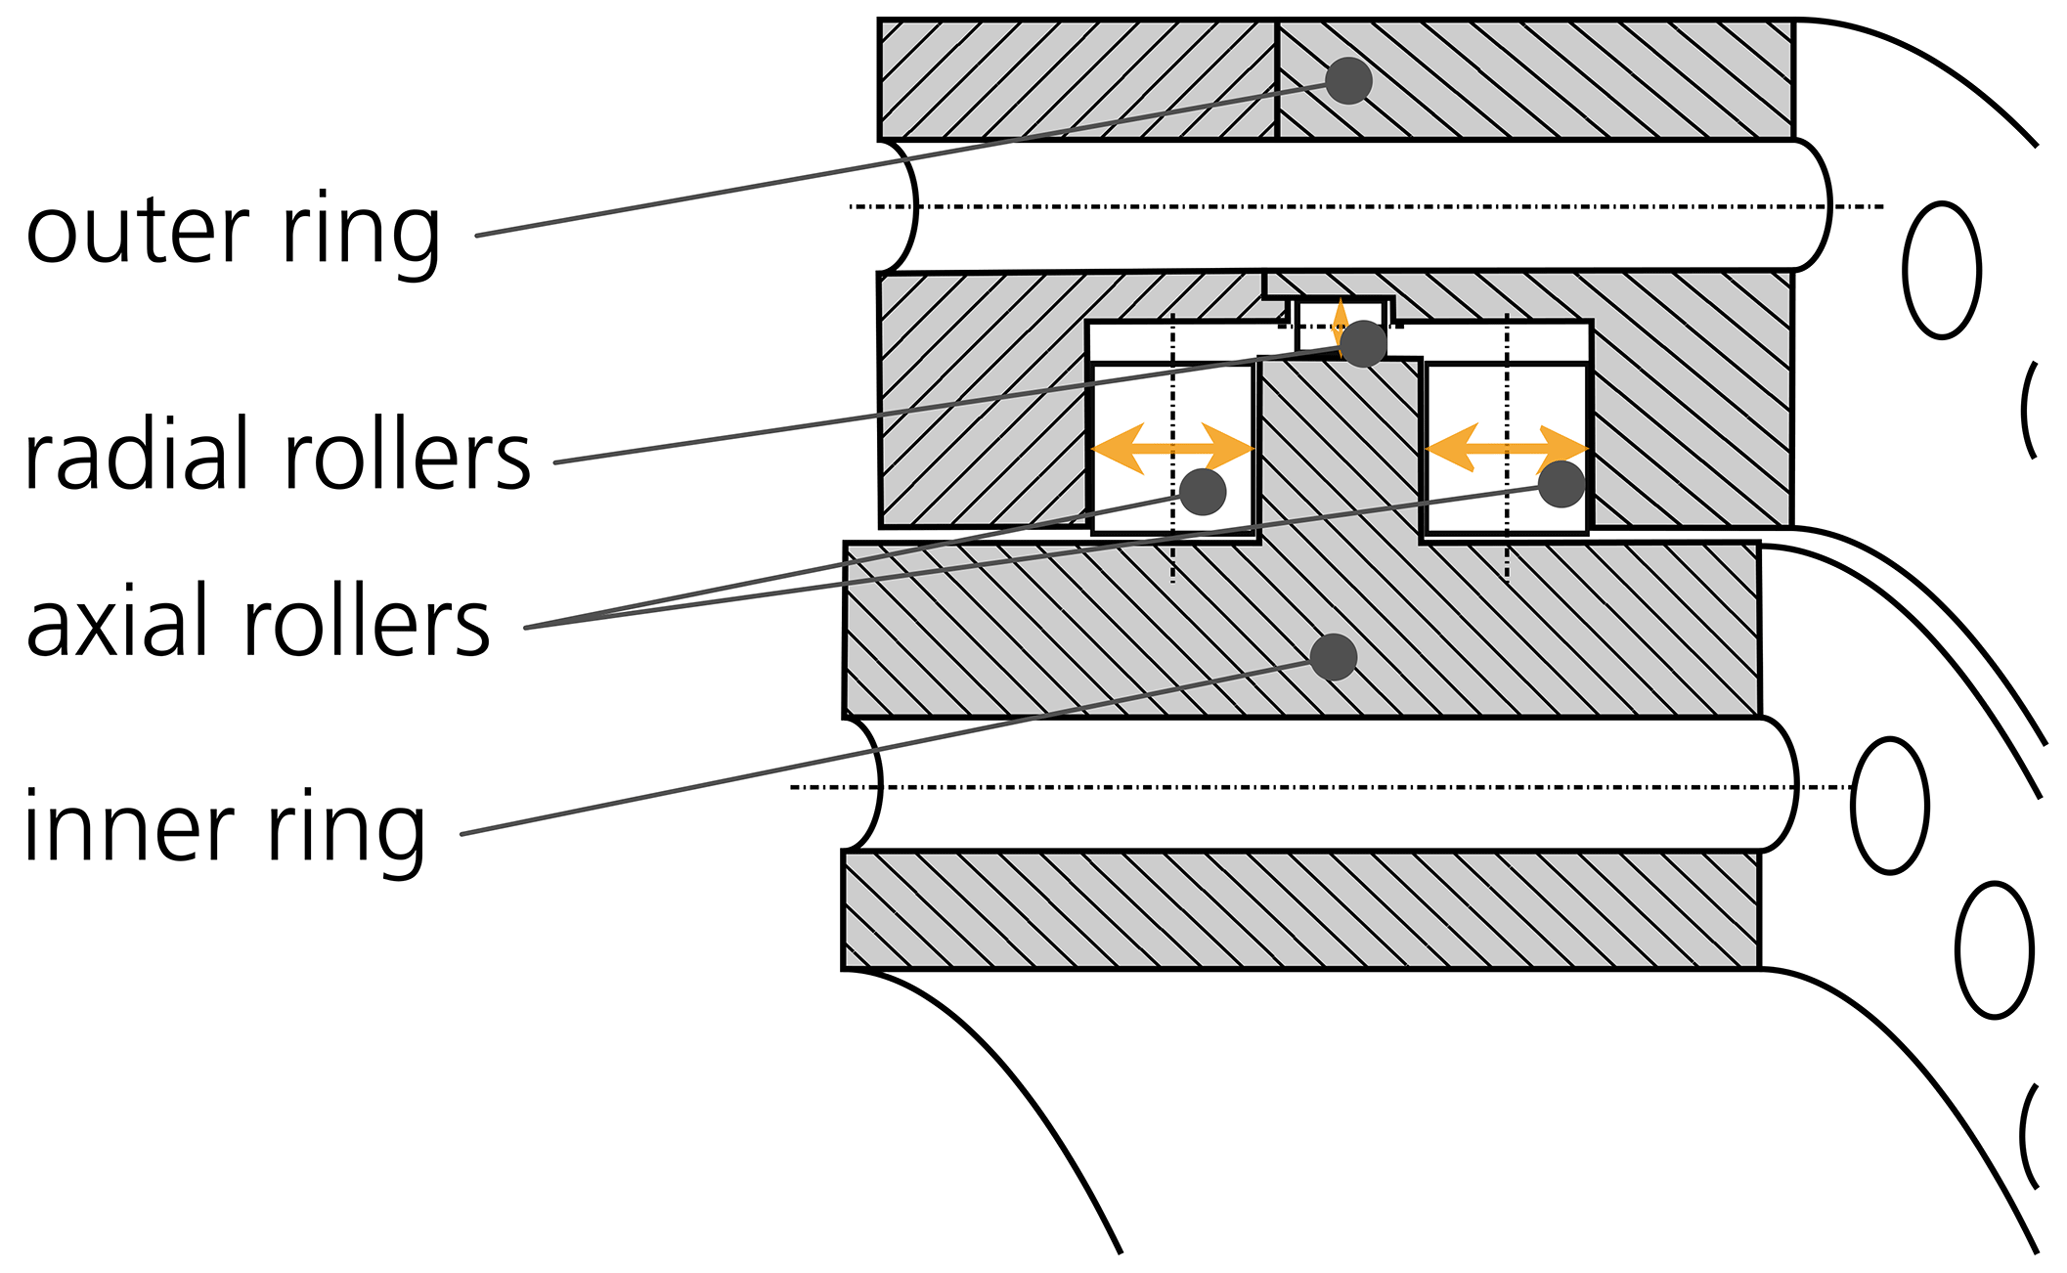
Three-row roller pitch bearings have two axial rows and one radial row. Figure 1 shows a partial view of such a bearing. As the axial loads dominate in pitch bearing operation, the axial rollers are significantly larger than the radial ones. In operation, only one of the axial rows at the same circumferential position bears the load. One of the rings is typically C-shaped and split into two halves, as shown in Fig. 1, where the outer ring is split. The bearings are manufactured with little or no preload of the rollers. When the blade, pitch bearing, and hub are assembled, the tensioning of the bolts of the C-shaped ring introduces the preload of the rollers. Therefore, the pretension of the bolts is crucial for the reliability of this bearing type.
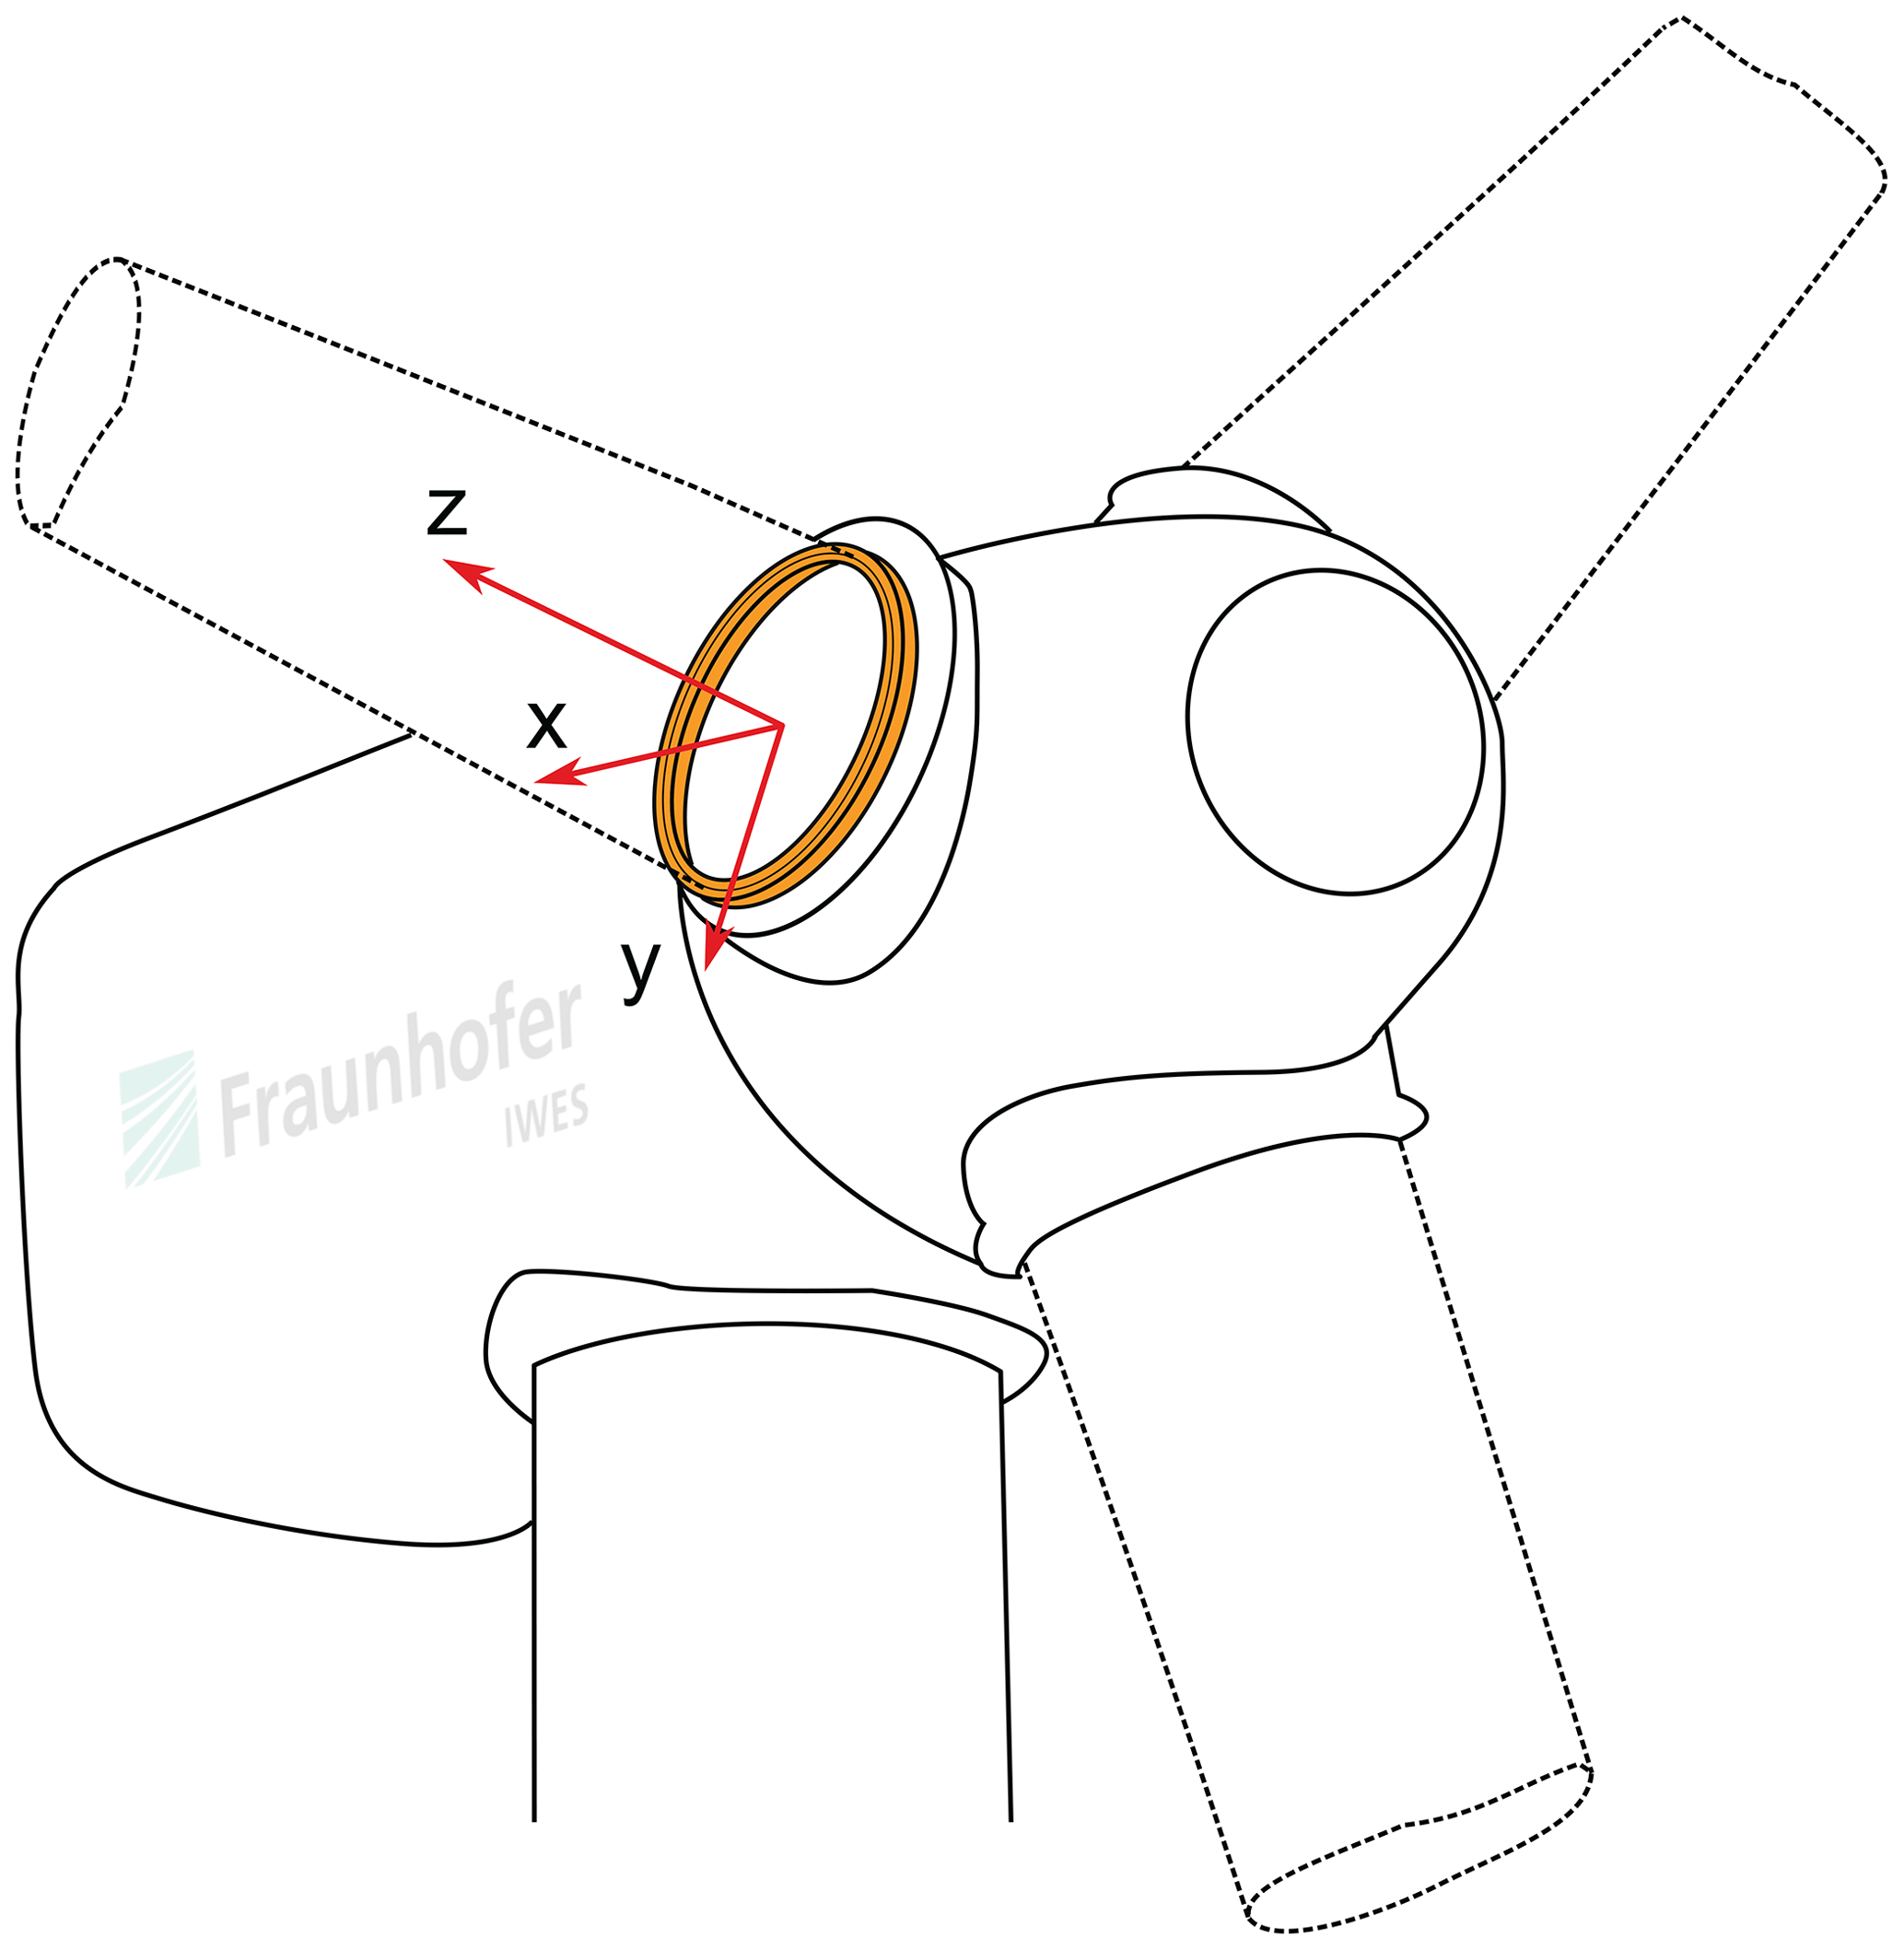
All loads and pitch movements in this study use the coordinate system shown in Fig. 2, with the exception of the pitch angle θ, which is positive in a mathematically negative sense. This convention is the industry standard, and most turbine simulation time series follow it.
The test program aims to evaluate wear of the raceways, which are the surfaces of the bearing rings that contact the rolling elements. Pitch bearings can also fail due to other causes. The author gives an overview of possible damages of pitch bearings in Stammler (2020). Within the context of this study, surface wear damages of raceways are categorized into standstill marks and false brinelling. The definitions of these terms are according to the work of Grebe (2012) and Grebe et al. (2018) as well as the abovementioned review by de La Presilla et al. (2023). Contact track refers to the area of the raceway covered by a rolling body during an oscillation. Figure 3 shows the characteristics of these damages, where x denotes the distance covered by the contact center on the raceway during an oscillation, 2b is the width of the contact area, and Q is the load of the contact element.
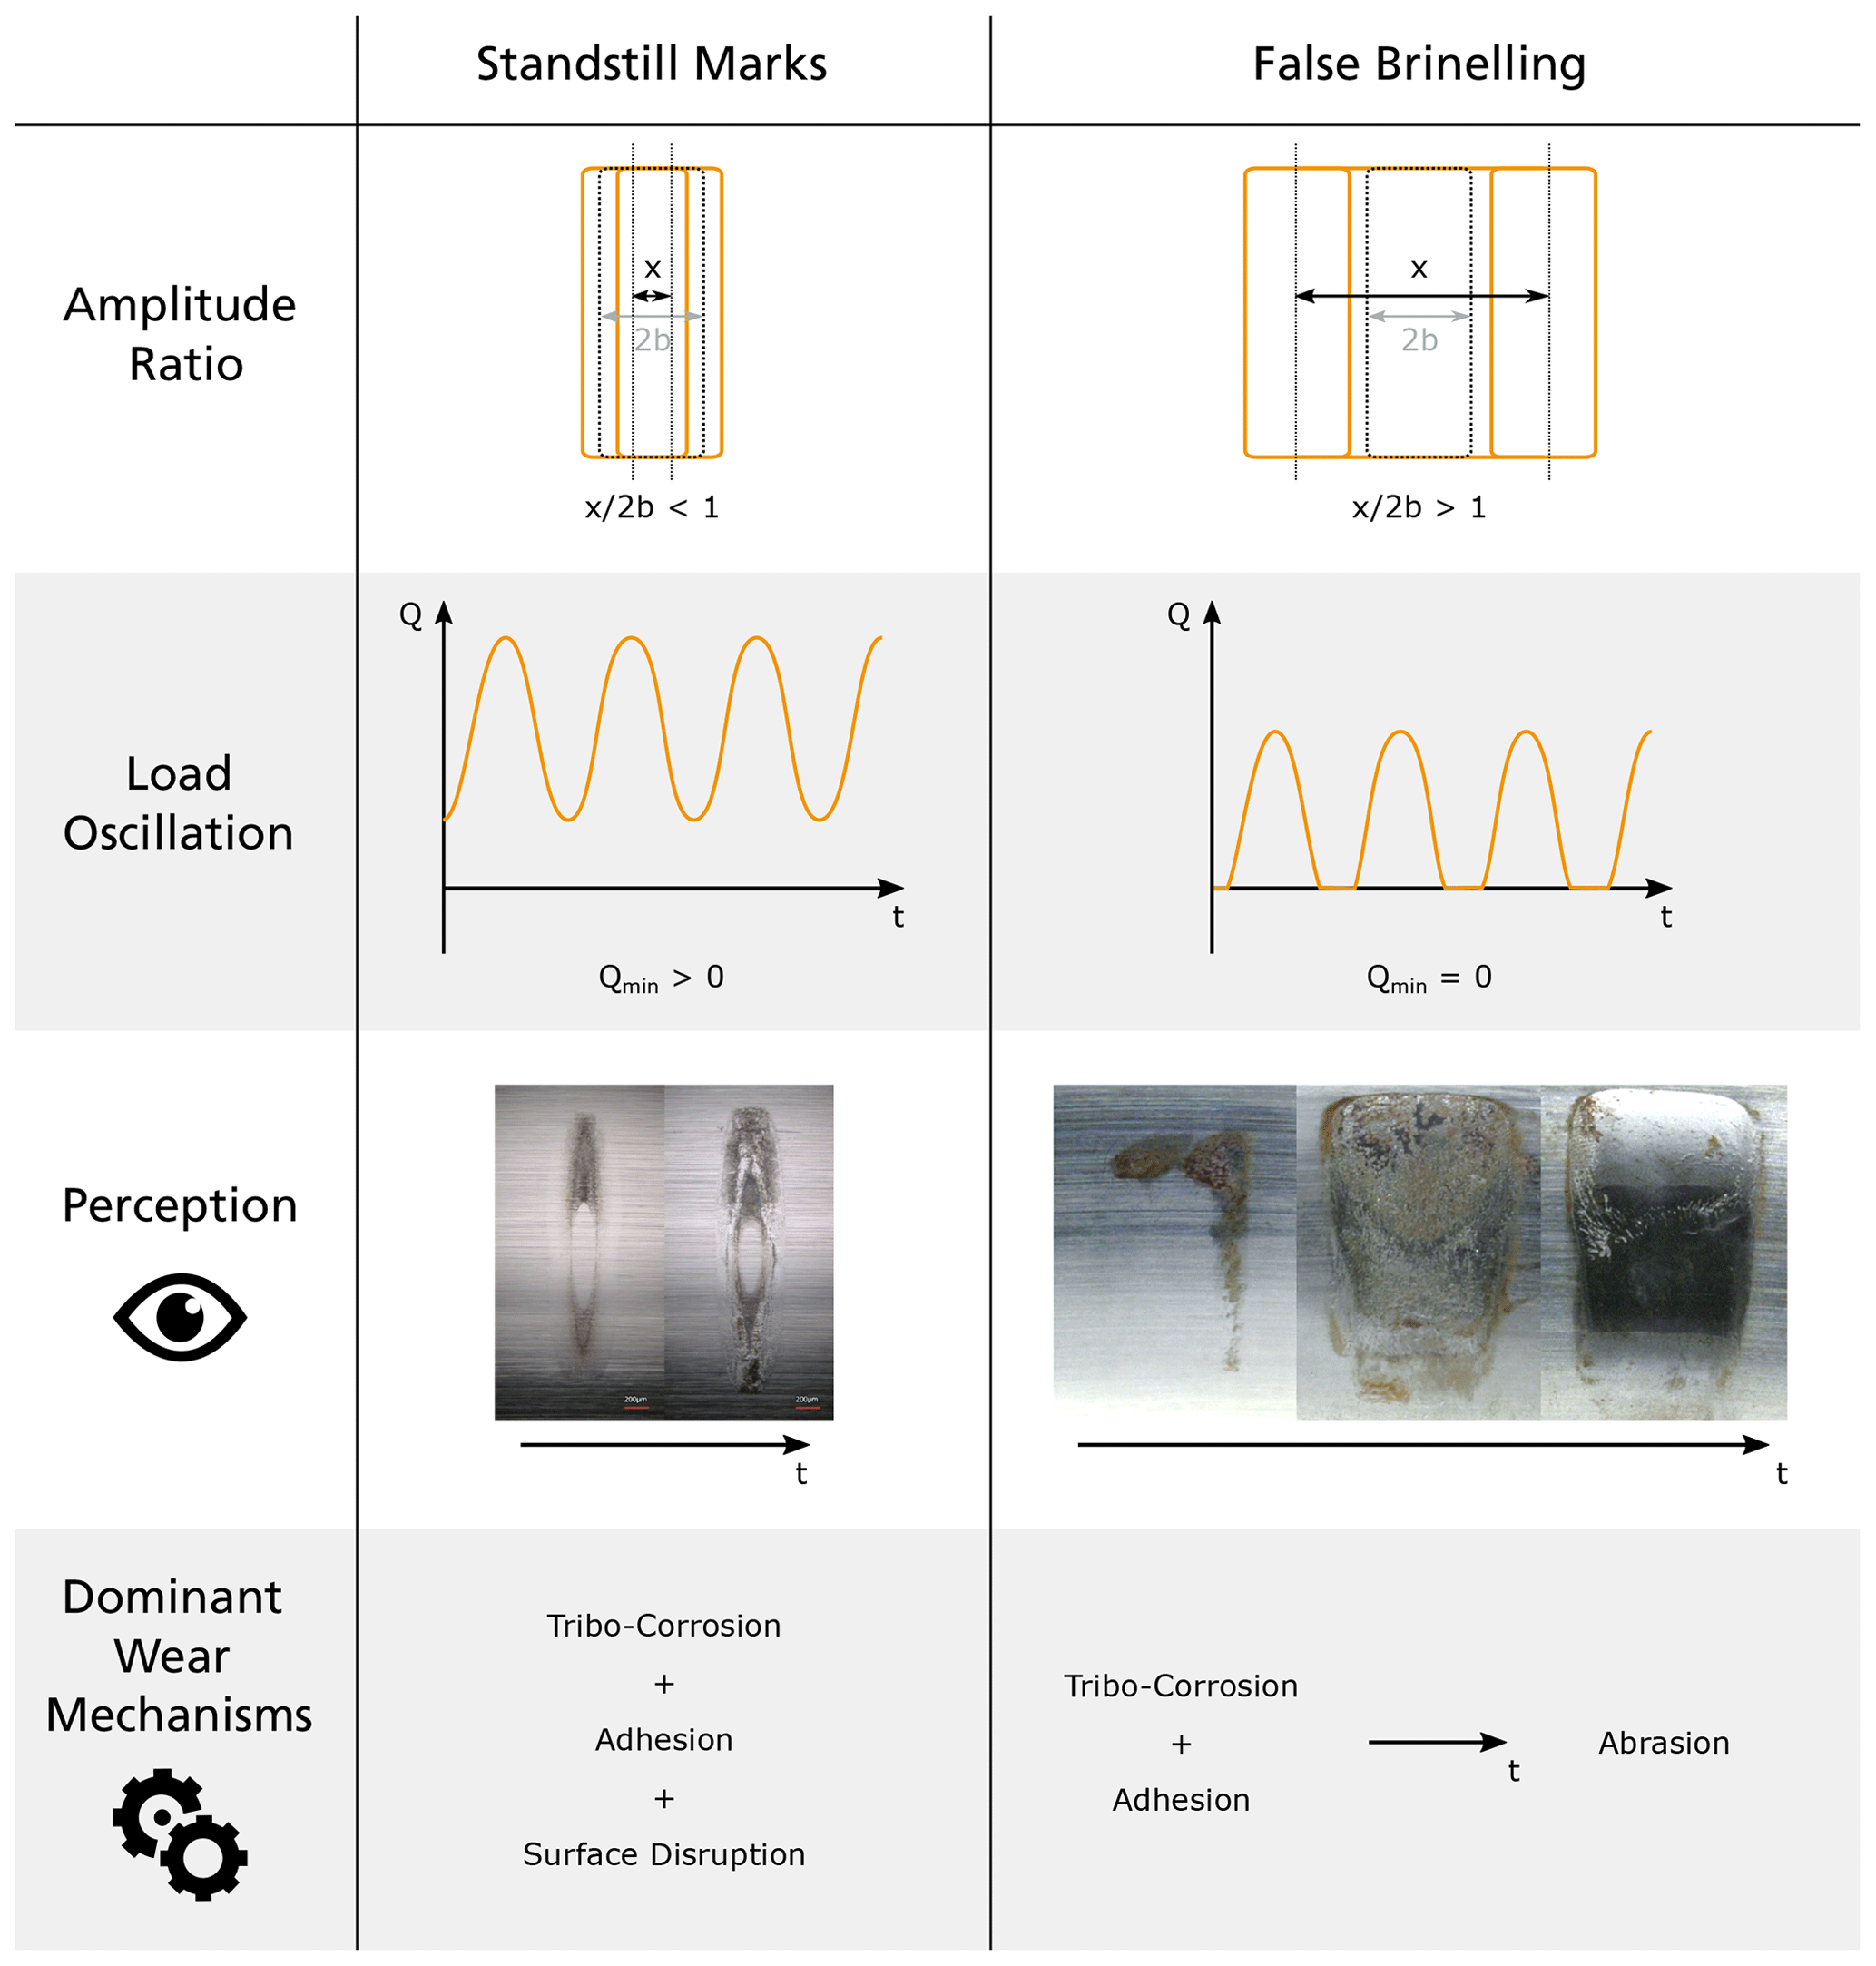
Figure 3Raceway wear damage modes of oscillating bearings. (© wear marks (left): Markus Grebe; © wear marks (right): Sebastian Wandel, both used with permission).
Standstill marks and false brinelling are both possible in pitch bearing operation. Standstill marks can occur when the bearing rings are in rotatory standstill and subject to oscillating loads with Qmin>0 or when they undergo oscillating movements with small amplitudes of . Load oscillations can be caused by rotor rotation and wind fluctuations. Turbine controllers can also cause oscillating movements with , but they have limited positive effects on load and power. To prevent these cycles, turbine controllers can be adjusted. Torsional moments at the blade root that are higher than the bearing friction torque can also cause these movements, resulting in the blade's center of gravity being off axis and oscillating around 0. Standstill marks appear at the outer boundaries of the contact area and leave a characteristic undamaged central area. False brinelling, on the other hand, can be caused by oscillating movements with an amplitude ratio , a load oscillation with Qmin=0, or a combination of both. False brinelling does not show an undamaged central area. At more progressed states and with abrasive mechanisms at work, false brinelling damages appear visually like the indents of Brinell tests. Another possible reason for wear of the raceways is movements of the rollers perpendicular to their rolling direction. Loads can cause deformations of the bearing rings, which affect the load distribution along the major axis of the contact and cause these movements. These damages will appear to be similar to false brinelling, but the dominant mechanism frets.
The author is not aware of any comprehensive calculation models that can predict wear on raceways. Such models would have to predict the initiation and progress of wear. Wandel et al. (2022) propose a starvation number that takes various parameters into account, such as oscillation, contact, and lubrication, to assess the risk of wear. This assessment, however, is only valid for constant parameters. The development of wear marks to final dents that render the pitch bearing inoperable includes various wear regimes with different adhesive and abrasive mechanisms and has not yet been fully explored. An overview of existing models is given by de La Presilla et al. (2023).
When wear conditions are met, surface alterations can appear after less than 1000 cycles, and brownish-red corrosion products are clearly visible after at least 5000 cycles (Schwack et al., 2017; Wandel et al., 2023). Effective protection runs are one means to prevent wear on raceways. They can be any longer rotatory movement, whether steady or interrupted. While the existence of protection runs is supported by experimental evidence (Stammler et al., 2019a; Behnke and Schleich, 2023), the parameters that determine an effective protection run are not yet fully understood. An effective protection run should be a longer movement, but the exact required amplitude (θp) is unknown, and it should occur after several smaller pitch cycles, although their maximum number is also unknown. Results from Stammler et al. (2019a) show effective protection runs for up to 100 cycles in between them. Furthermore, the effectiveness of protection runs depends on factors such as the lubricant used (Schwack et al., 2020, 2021) and cage design (Wandel et al., 2022). These factors will be taken into account in the later test program, and uncertainties will be addressed using a sensitivity analysis.
3.1 Input data
Stammler (2020) describes the design process of test parts that emulate the interfaces of the pitch bearing. They act as the replacement of the rotor blade and rotor hub in a more compact test environment and allow for dynamic tests with reasonable deformations and energy costs. For this study, these parts and the BEAT6.1 test environment are taken as a given. The test profile creation then needs the following inputs:
-
Bearing data.
This includes a bearing drawing, the rolling body properties as diameter drb and length lrb, and the number of rolling bodies.
-
Load simulation output.
This contains time series of all fatigue load cases defined in the IEC 61400-1 (IEC, 2019). The signals must contain pitch angle θsim; blade root bending moments Mx and My; forces Fx, Fy, and Fz; and information about the mean or current wind speed.
-
Wind speed measurement data.
The wind speed measurement data must contain values of at least 1 year, measured at or close to hub height. Mean values for 10 min intervals are sufficient.
3.2 Comparison of simulation and measurement
The accuracy of the test results depends on the quality of the input data. To ensure the reliability of the simulation data, it is recommended to compare the simulation results with measurement data collected under similar wind conditions. However, in cases where measurement data for the bearing under test are not available prior to testing, comparison with data from similar existing turbines can be used as an alternative approach. This in lieu comparison can be considered reasonable if the simulation methods are the same.
3.3 Calculation of additional time series signals
Pitch bearings are typically driven by either hydraulic cylinders or combinations of electrical motors and gearboxes. In the case of the latter, the gearbox has a geared interface to the bearing with a circumferential backlash denoted as jt. During the assembly of the bearing, it is not possible to directly measure the circumferential backlash. Instead, the normal backlash jn is measured using a feeler gauge. The value of jt can be calculated as , where αn is the normal pressure angle of the gear pair. If the pitch drive is in a standstill position and a torsional torque Mz is applied in the opposite direction to the last pitch movement, the pitch bearing can move within the limits of the circumferential backlash jt. In order for the bearing to move, Mz must exceed the starting torque Mt,min of the bearing.
It is important to note that aero-elastic simulations may not necessarily consider the backlash of the pitch–gear interface. The superimposed movement of the pitch bearing at standstill, denoted as , is estimated using Eq. (1). The rate of this movement is assumed to be a fixed value cθ, whereas in reality, it depends on factors such as the inertia of the deformed blade, the actual value of Mz, and the frictional torque of the pitch bearing. It should also be noted that is positive in a mathematically negative direction, as per the provided definitions.
θflag indicates the direction of the last pitch movement. This movement determines which tooth flank is in contact. Equation (2) is executed per each time step τ if the conditions for any cθ value are not met.
θj is limited to movements within the backlash jt. In the final test, however, the pitch drive has to overcome the backlash and move the bearing by jt, so its movement has to be 2⋅jt. θj is then calculated stepwise as the sum of all previous values, unless its absolute value exceeds 2⋅jt, in which case it is set to . θj and θsim form the final pitch angle θ:
The rolling body load Q and the amplitude ratio have a significant influence on wear damages. In the axial rows of three-row roller pitch bearings, x equals half the distance covered by the rotating ring. Equation (4) calculates the distance Δx with Δθ as the pitch angle change between two time steps in degrees, which is common for load simulation outputs. Dpitch is the pitch diameter of the bearing.
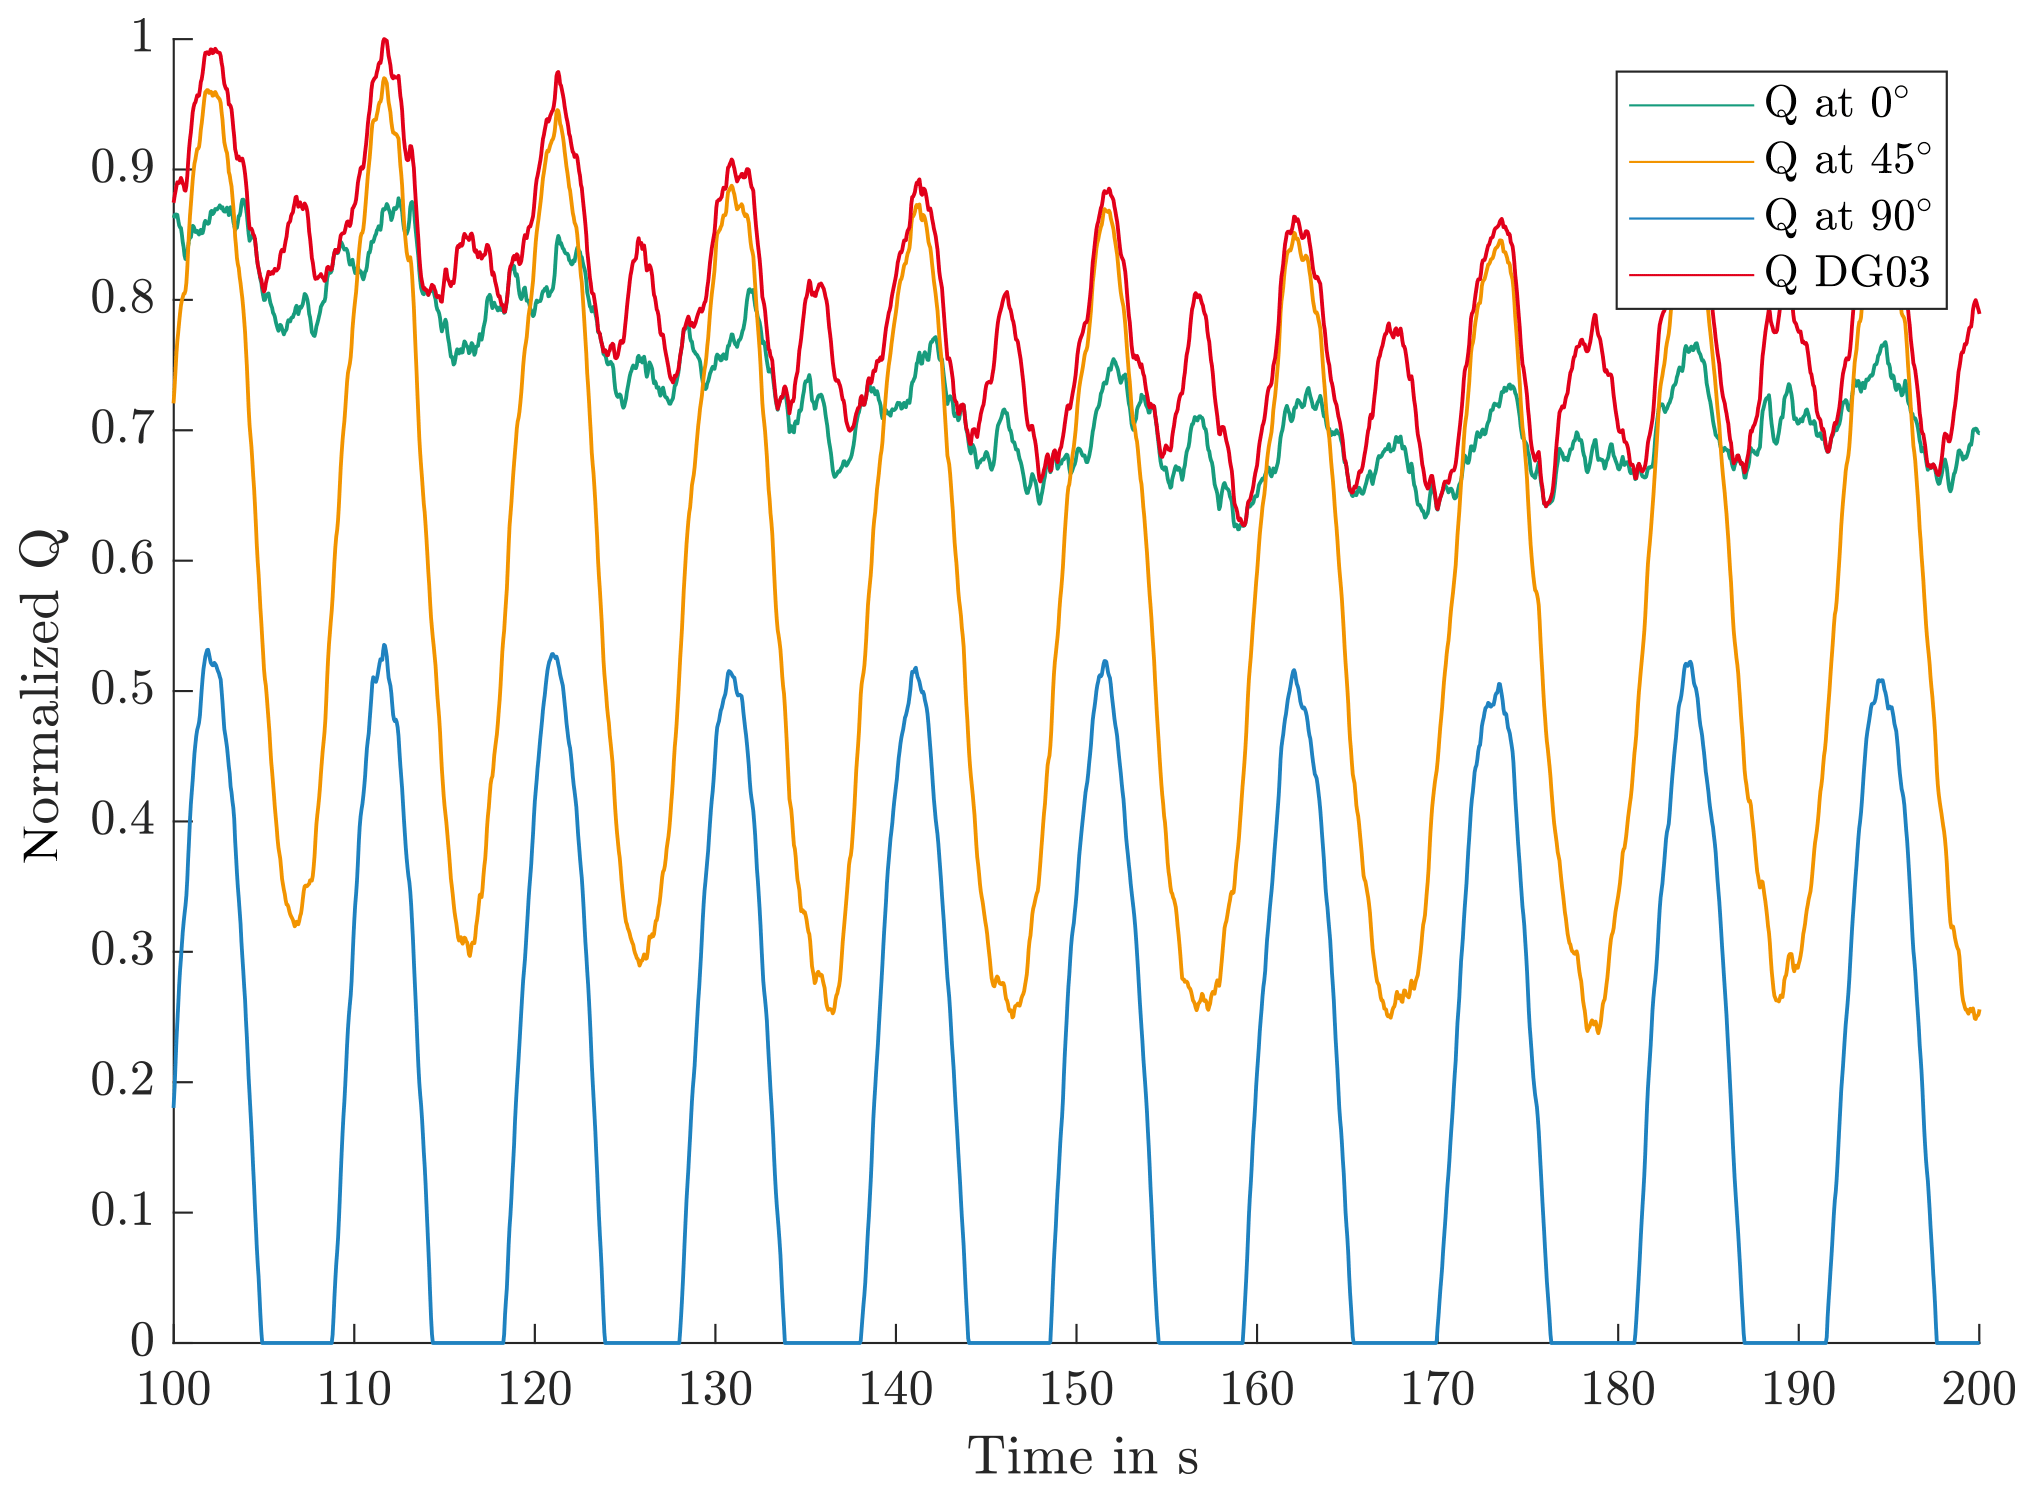
Figure 4Normalized rolling body loads at different circumferential positions for operation below rated speed.
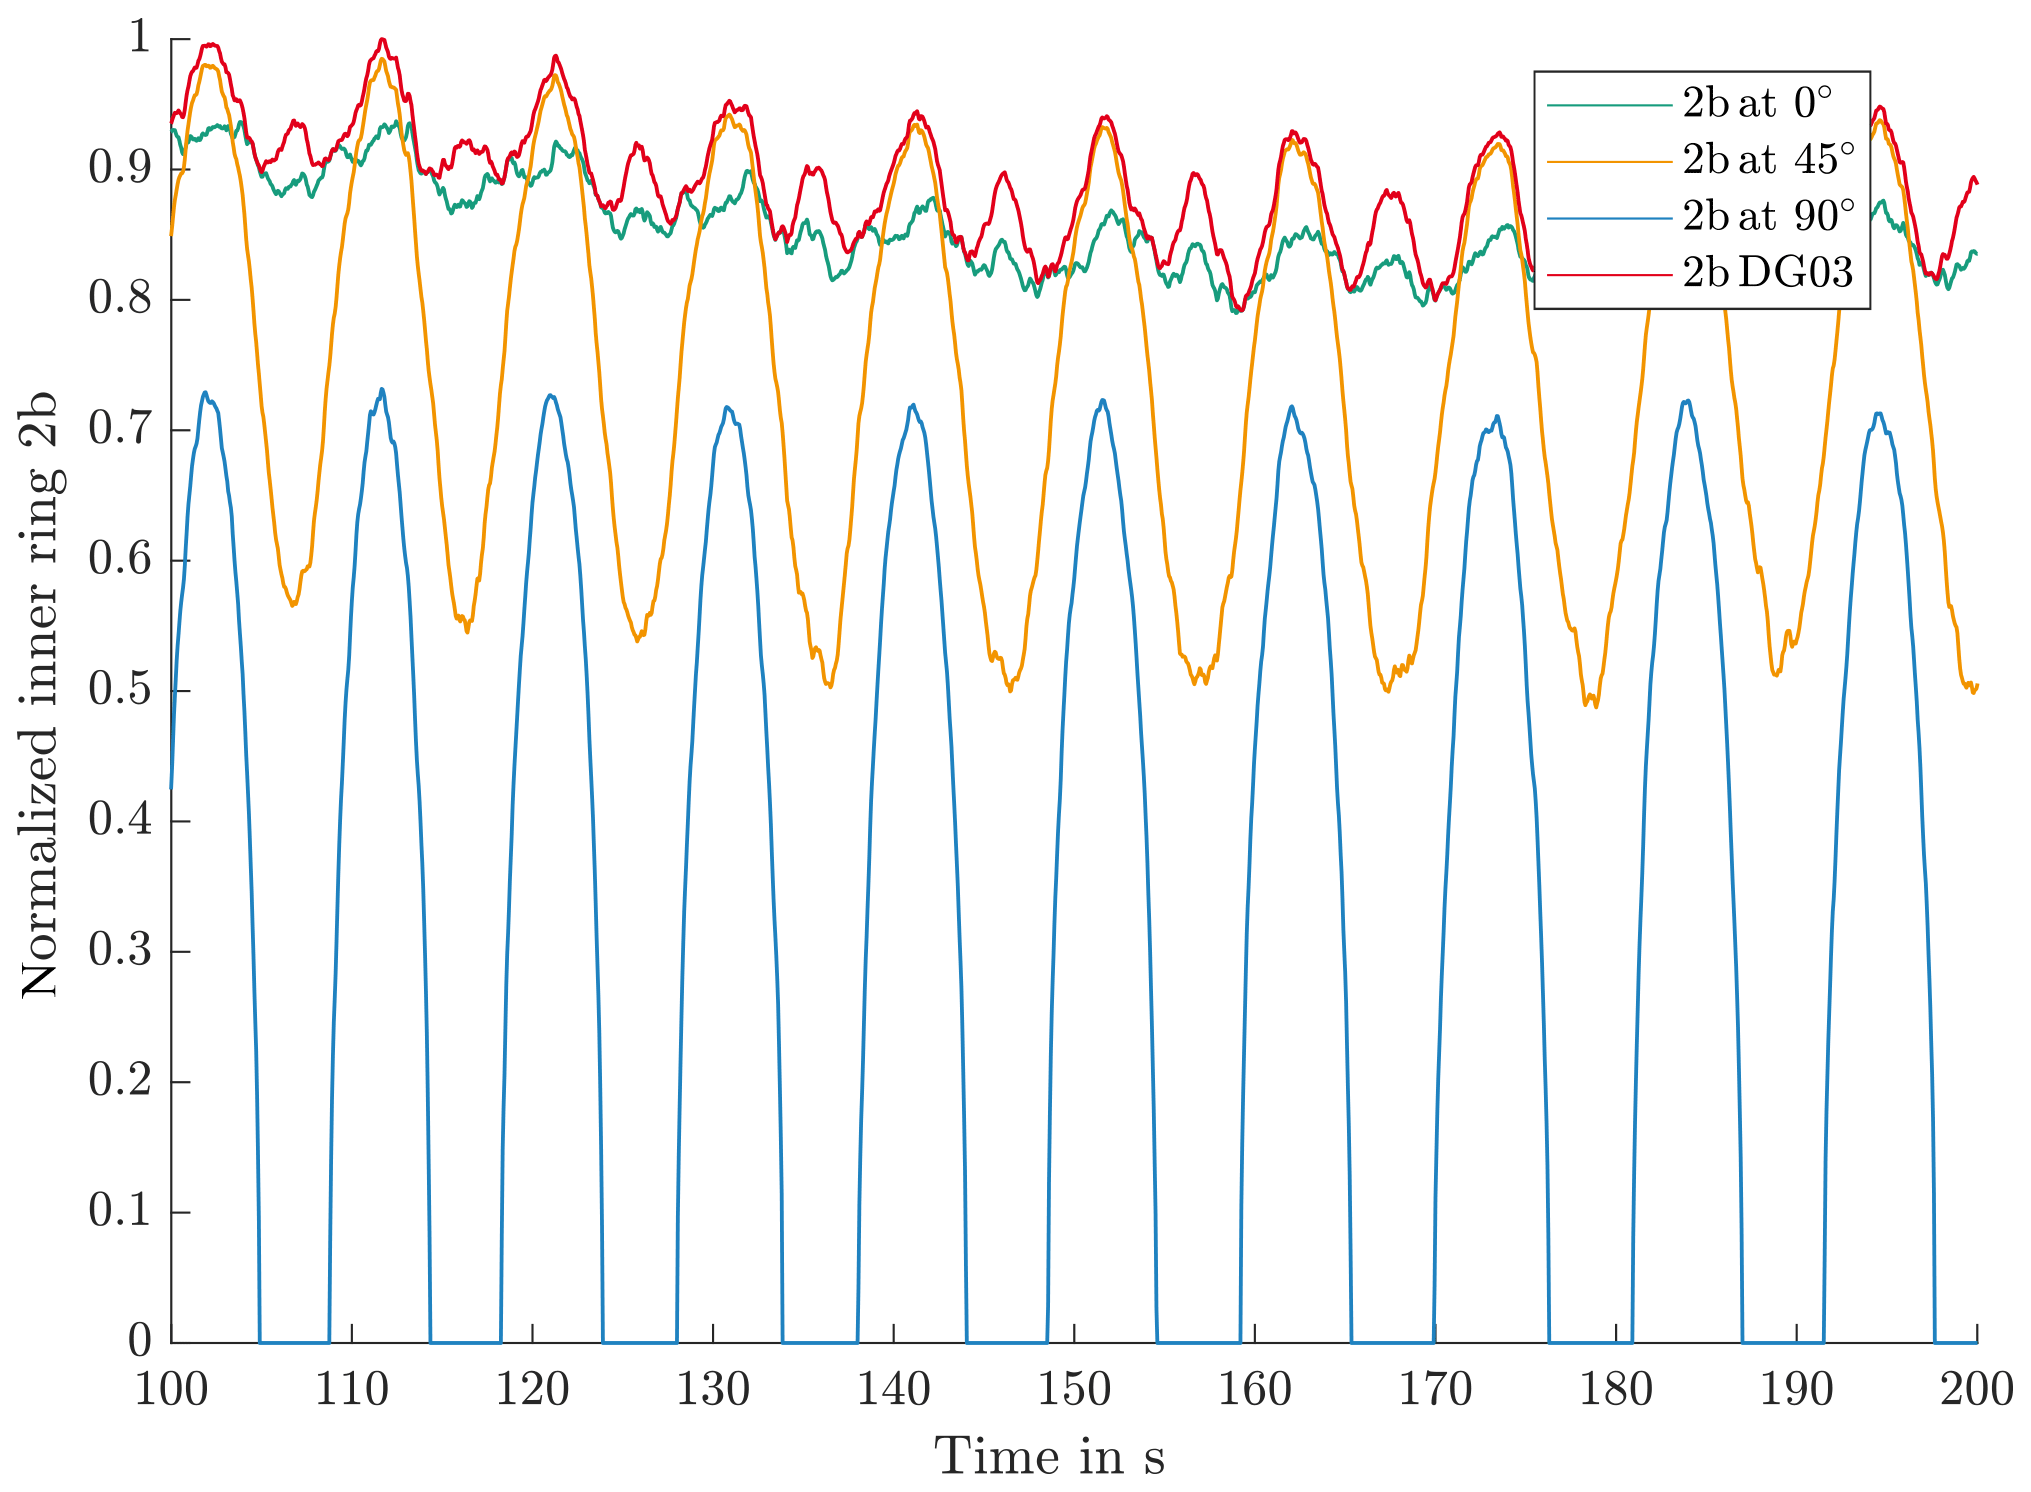
Figure 5Normalized contact widths at different circumferential positions for operation below rated speed.
The calculation of Q and 2b of each individual rolling element is less trivial and commonly relies upon finite-element analysis. However, the focus of this study is on identifying wear-critical operational conditions, which is less dependent on the exact load Q and more on the combination of operating conditions. Since Q is only used to select operating conditions which are later accurately reproduced by the test setup, empirical formulas can be used to approximate the load at this stage. For the calculation of Qmax, the pitch bearing design guideline (DG03) of the National Renewable Energy Laboratory (NREL; Harris et al., 2009) suggests Eq. (5). The radial loads used in Harris et al. (2009) are omitted here as the axial rollers cannot transfer radial loads. The contact angle α of the axial rows is assumed to be 90∘, and the bending moment M is calculated as the quadratic sum of the individual bending moments. Z represents the number of rolling bodies per row. Each of the axial rows of the bearing can only carry loads in one direction. The following explanations and equations are valid for one of the rows. For the other row, the results of the equations have to be multiplied by −1.
The axial rows of the pitch bearings are commonly preloaded by the bolts of the C-shaped ring. This initial load qini needs to be respected in the Q calculations. Under dynamic loads, different rolling bodies are subject to Qmax. For a test program creation, it is more desirable to know the load variations at fixed circumferential positions. A position on the positive x axis with y=0 is denoted as 0∘. Mx does not influence the load at this position; see Eq. (6):
Similarly, Q at 90 and 45∘ positions can be calculated; see Eqs. (7) and (8):
The results of Eqs. (6) to (8) can be negative numbers. It is physically impossible for a rolling body to have a negative load; hence any values below 0 must be set to 0 (see Eq. 9):
With Q signals added to the input data, it is possible to calculate the contact width 2b at the same positions, again for the axial rows of the bearing. This is done according to Harris and Kotzalas (2007); see Eq. (10). lrb is the length of the rolling body, and drb is its diameter. ν is Poisson's ratio, and E is Young's modulus. In this case it is assumed that both the rolling body and the raceway have the same ν and E.
Figure 4 shows exemplary output of Q at different positions for turbine operation below rated wind speed for one of the axial rows. The values are normalized by the maximum value in the simulation file. At 0∘, Q is mainly influenced by the thrust moment My on the blade, resulting in a high mean load level with minor fluctuations. At 45∘, both My and Mx influence the rolling body loads. The variations in loads are driven by Mx. At 90∘, Mx dominates, and since it has negative values, the rolling body loads become 0 with each oscillation. The frequency of Mx matches the rotational frequency of the rotor. It is worth noting that the DG03 calculation with the quadratic sum of the bending moment shows higher frequencies, reflecting the usage of absolute values of Mx.
Figure 5 depicts the contact width 2b for the same period, again as exemplary normalized plots. Equation (10) defines a concave relation between Q and 2b, which is reflected in Fig. 5. The 90∘ position shows the highest variations in 2b, and 0∘ shows almost-constant values.
With 2b and again following Harris and Kotzalas (2007), the contact pressure P is calculated as per Eq. (11):
This contact pressure allows the estimation of the potential of the later test program to impose damages on the raceways.
3.4 Standstill program
The underlying idea of a standstill test program is to use a combination of wind speed measurements and simulation data to find critical operating conditions. Note that this part of the test program does not necessarily result in standstill marks; its name refers to the rotational standstill of the bearing rings.
The program generates a test plan to replicate the identified operating conditions. The most severe operating condition is the longest continuous standstill with the same pitch angle under the highest 2b variations. Wear damages develop over oscillation cycles (Behnke and Schleich, 2023; Schwack, 2020; Schwack et al., 2021) and are prevented by protection runs (Stammler et al., 2019a). Only periods of continuous standstill that meet a minimum cycle number nmin are considered for the test plan. The 10 min simulation data files hold information on 2b variations and short-term standstill conditions. However, for large turbines, it may not be possible to reach the minimum cycle number within 10 min. In such cases, files with effective protection runs can be excluded from further analysis. Very short standstill periods are also excluded, as they should at minimum have a few load cycles to be relevant for wear progression. This short-term minimum is denoted nmin,s. Figure 5 shows that Mx, which has the same frequency νrotor as the rotor, dominates variations in 2b. Equation (12) gives the minimum short-term standstill time Tmin,standstill as
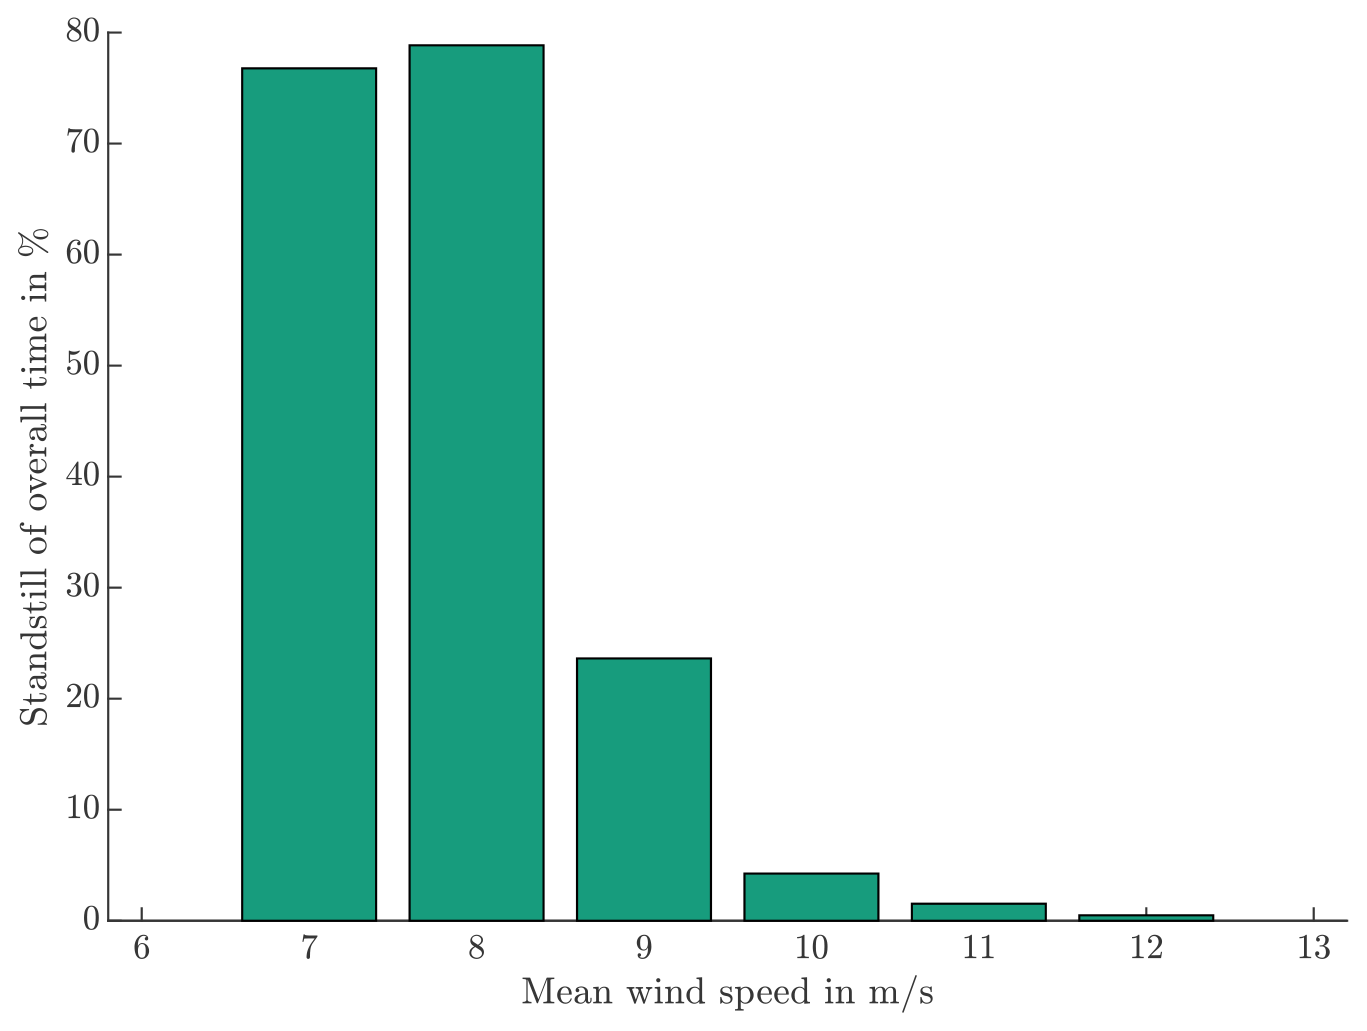
where nmin is the long-term minimum number of wear-critical cycles. The cycles stop counting when a protection run occurs. nmin,s is the short-term minimum number of cycles that can contribute to wear if they aggregate with more cycles. It is interrupted by pitch movements below the protection run threshold θp. The simulation data are filtered for protection runs and standstill times and are finally split into wind speed bins. This renders the highest wind speed which still has standstill times. This wind speed is called “focus speed” in the following. If protection runs occur below focus speed, the files containing them are excluded from the later test run to follow a worst-case scenario. Pitch bearings spend less time overall (see Fig. 6) and shorter periods in standstill with increasing wind speed.
Wind speed measurements allow one to put simulation files in mid- and long-term sequences. For a standstill test program, all speeds at or below focus speed are relevant. Wind speed bins below cut-in result in idling of the turbine and are taken as the end point for any sequence. The transition from power production to idling causes a long pitch movement which can be assumed to be a protection run. The load cycles can resume during idling due to the gravitational forces of the blade, but the frequency is magnitudes lower than at power production, resulting in a low number of overall load cycles. Long-term idling of several months can occur after assembly of the turbine and before it starts power production. Such load cases can be taken into account in a standstill program but require an acceleration to achieve realistic time frames. This study does not take idling times into account.
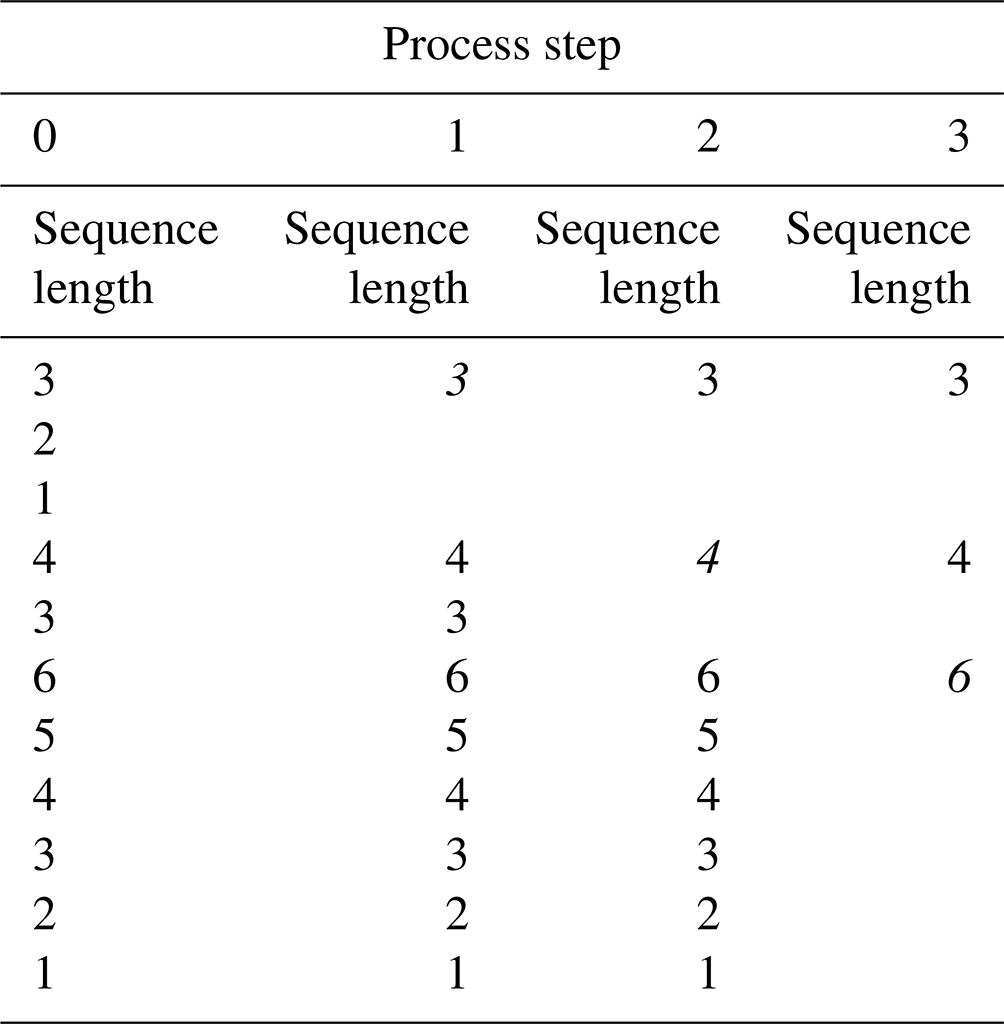
A sequence recognition algorithm, as reported in Stammler (2020), gets all continuous sequences of 10 min intervals of the desired speeds and the minimum length defined by nmin. It discards any shorter sequences contained in longer ones. Table 1, taken from Stammler (2020), shows the process of this algorithm. The rows are a set of sequence lengths. The cells in italic are the ones the algorithm keeps in the respective step. For a more detailed explanation, see Stammler (2020).
Table 1Sequence elimination process; italic numbers are pertained sequences.
For each element of the sequence, a simulation file with the corresponding mean wind speeds is randomly selected. The full simulation file is used, including any non-standstill times, to reflect realistic turbine conditions.
Between standstill sequences, random files with protection runs are added to the test program. These are full simulation files as well. At the beginning of every 24 h period of the test, a turbine start is added. Similarly, a turbine stop ends every 24 h period. Transitions prevent signal steps between elements of the test program. They are taken from the simulation data as described in Stammler (2020). Equation (13) renders the overall duration of the standstill part of the test program TTS.
Tseq,i is the duration of sequence i, and Tp is the duration of a file with a protection run. Ttrans denotes the transition times and Tstart,stop the duration of files with turbine start and stop times. As the determination of transition times before the composition of the test program is laborious and provides only limited benefits, the transition times are unknown at the time of the test composition. The algorithm thus iterates until all elements form test time series equal to or shorter than 24 h.
3.5 Pitch cycle program
In Stammler (2020), the author suggested a test method that involves taking all wear-critical sequences and protection runs and arranging them in a random or seasonal order to create a comprehensive test program. Both randomized and seasonal test programs have been developed for the IWT7.5-164 reference turbine, which was equipped with a controller setup from a wind turbine manufacturer. The time series data for the blade roots of this turbine are available in Popko (2019).
In order to generate a test program using this method, wear-critical sequences must first be identified in the simulation data. These sequences typically involve oscillations of θ with similar mean values and amplitudes below θp. In the controller setup utilized in Stammler (2020), significant activity of the IPC was observed under rated speed conditions, combined with a fixed lower pitch angle of 0∘, resulting in the emergence of multiple wear-critical sequences.
However, if the turbine activates its IPC close to or above rated speed, the CPC is simultaneously activated, causing the mean values of the oscillations to vary significantly. This, in turn, reduces the wear risk associated with ball bearings to a great extent, based on current knowledge.
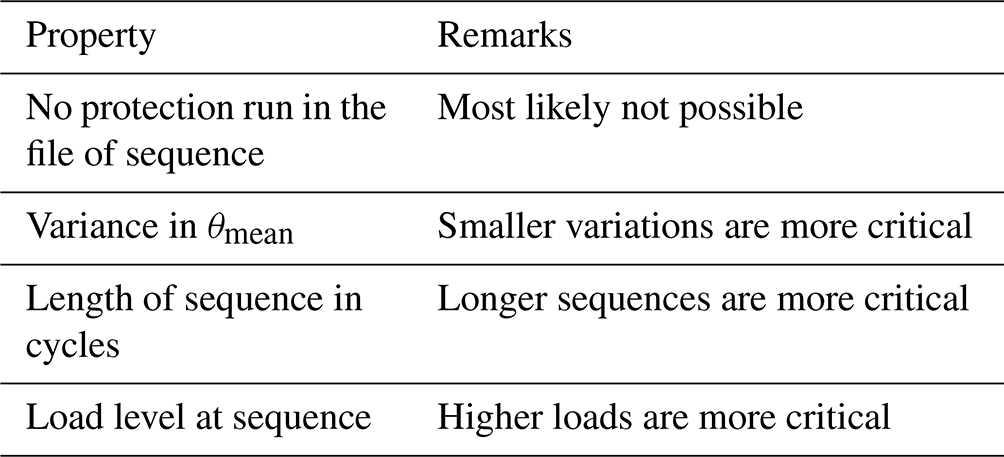
As there is no knowledge about wear in real-scale roller-type pitch bearings, the test approach for pitch cycles aims to rule out this last uncertainty. It identifies the sequences that are the most critical and takes the respective simulation files and combines them randomly until 5000 cycles with small amplitudes are reached. The sequences with their sequence lengths ni are part of the simulation files. These files have multipliers κi which determine their repetitions within the turbine lifetime. These multipliers are changed with a common factor F, so . The final test program is composed of the files with the sequences in a random order. The sequence recognition algorithm from Stammler (2020) is set to a mean-value tolerance θmean,tol and lower and upper boundaries of double amplitudes to Δθmin and Δθmax. Of the resultant sequences, the five most critical ones are selected according to the criteria listed in Table 2. Their order represents the importance.
This part of the test does not need a sensitivity analysis because a variation in parameters would only result in more or less initial sequences to be found. As it is always five sequences picked from the pool of initial sequences, a size variation in the pool does not change the final test program. Similar to the standstill part of the program, transitions as per Stammler (2020) prevent steps at changes of the simulation files. Turbine start and stop time series are used at the beginning and end of each 24 h interval.
3.6 Sensitivity analysis
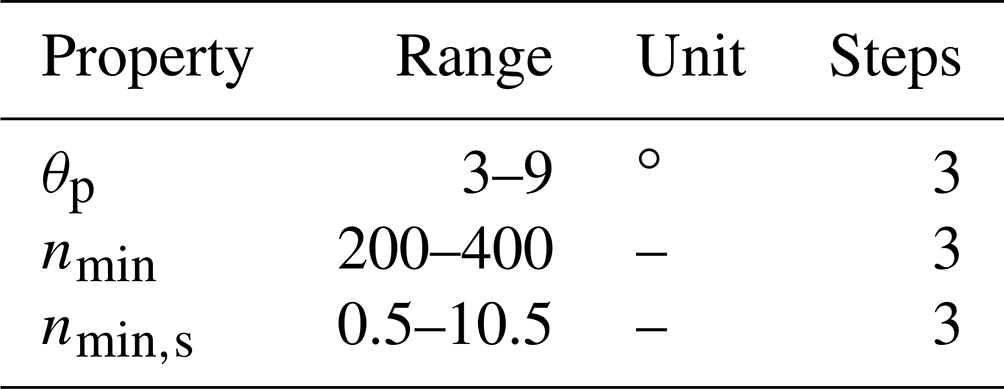
In the preceding sections, certain critical parameters of the test program are highlighted, for which no specific values can be ascertained based on the current state of scientific knowledge. Therefore, it is imperative to conduct a sensitivity analysis to gain an understanding of their influence on the final test program. These parameters are listed in Table 3.
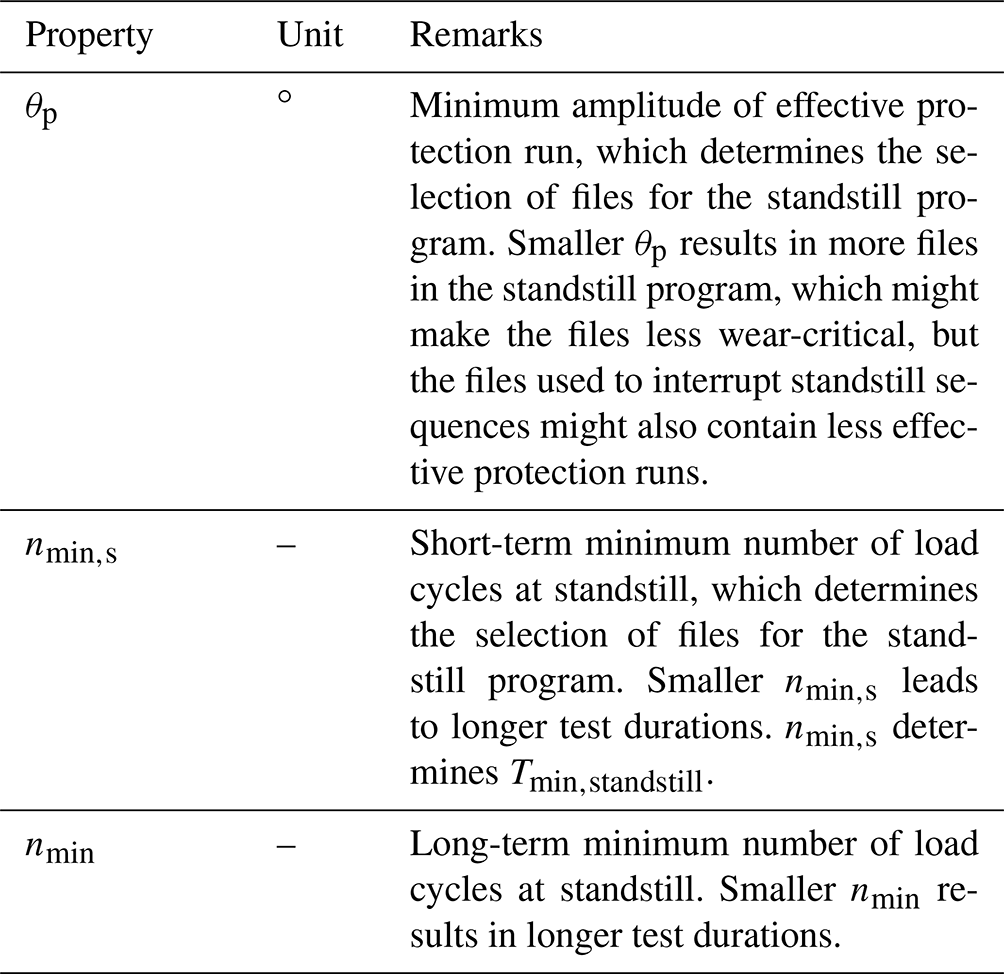
θp and nmin,s influence the selection of files from the simulation data and define the focus speed. nmin determines the selection of sequences from the wind speed measurement data.
4.1 Wind turbine, bearing, and test context
The IWT7.5-164 is a nearshore reference wind turbine. In previous work, the author developed a test program for four-point-contact pitch bearings of this turbine (Stammler, 2020). Table 4 lists the main properties of the turbine.
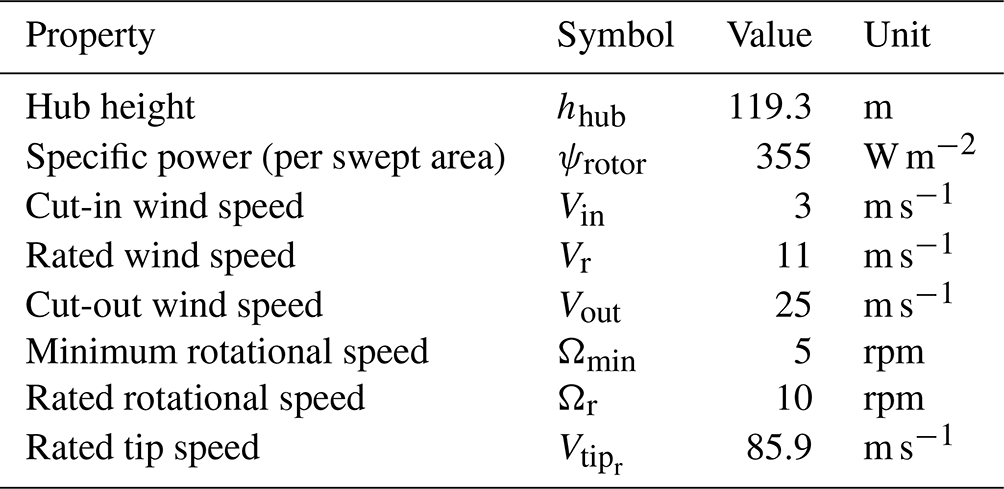
In Stammler (2020) the pitch controller activates IPC below rated speed, which renders only limited benefits but adds significant wear-critical cycles to the pitch bearing operation. It is reasonable to assume current commercial controllers do not use IPC under rated speed. Requate et al. (2020) compare the CPC and IPC versions of the IWT7.5-164. For the present work, the time series of Requate's comparison are split. Below rated speed, the CPC variant is used and at and above rated speed, the IPC variant. The controllers are built for research purposes and are not tuned on the same level of detail as commercial controllers. The data consist of power production load cases with mean wind speeds from 3 to 27 m s−1. The simulated time is approximately 165 700 h (18.9 years).
The wind speed measurement data are the same as in Schwack et al. (2021) and stem from a nearshore met mast with a measurement height of 119 m, which conveniently fits the hub height of the IWT7.5-164. The data span a time of 1 year. As the IWT is a reference wind turbine, it has never been built in reality. A comparison of measurement and simulation data is thus not possible for this case study.
Table 5 lists the properties of the three-row roller bearing that are relevant for the test program design.
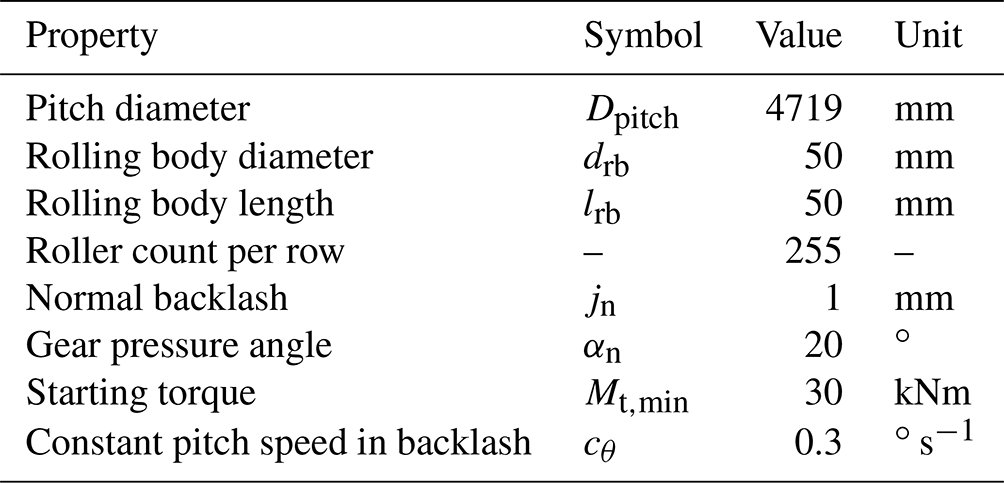
With these properties, the additional signals of the simulation data are calculated as described above. Table 6 lists exemplary maximum values, all of which occur at 17 m s−1 mean wind speed, except for Mz,max, which occurs at 3 m s−1. It is important to note that these are maximum values without safety factors. Upon closer examination, it is apparent that Mz,max is very close to the starting torque of the bearing. Moreover, in most operating conditions, Mz takes on negative values.
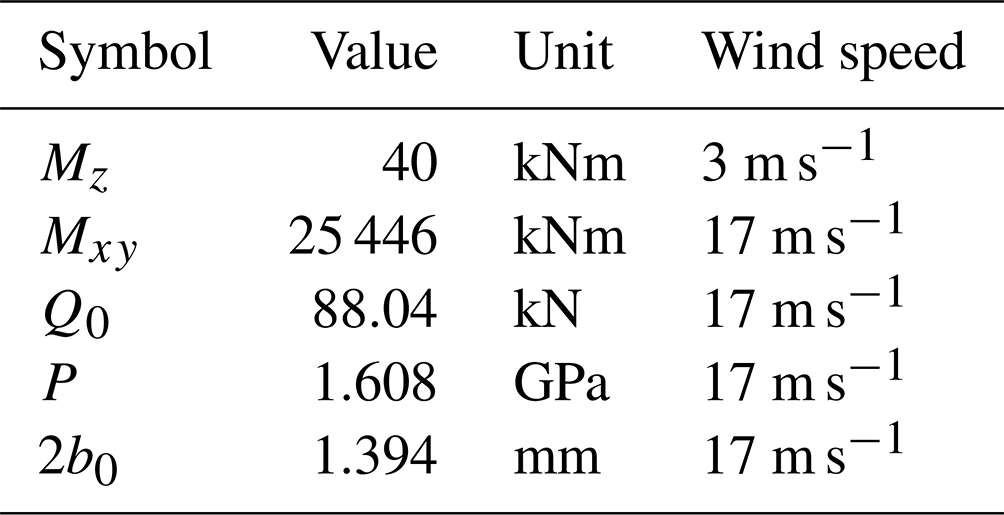
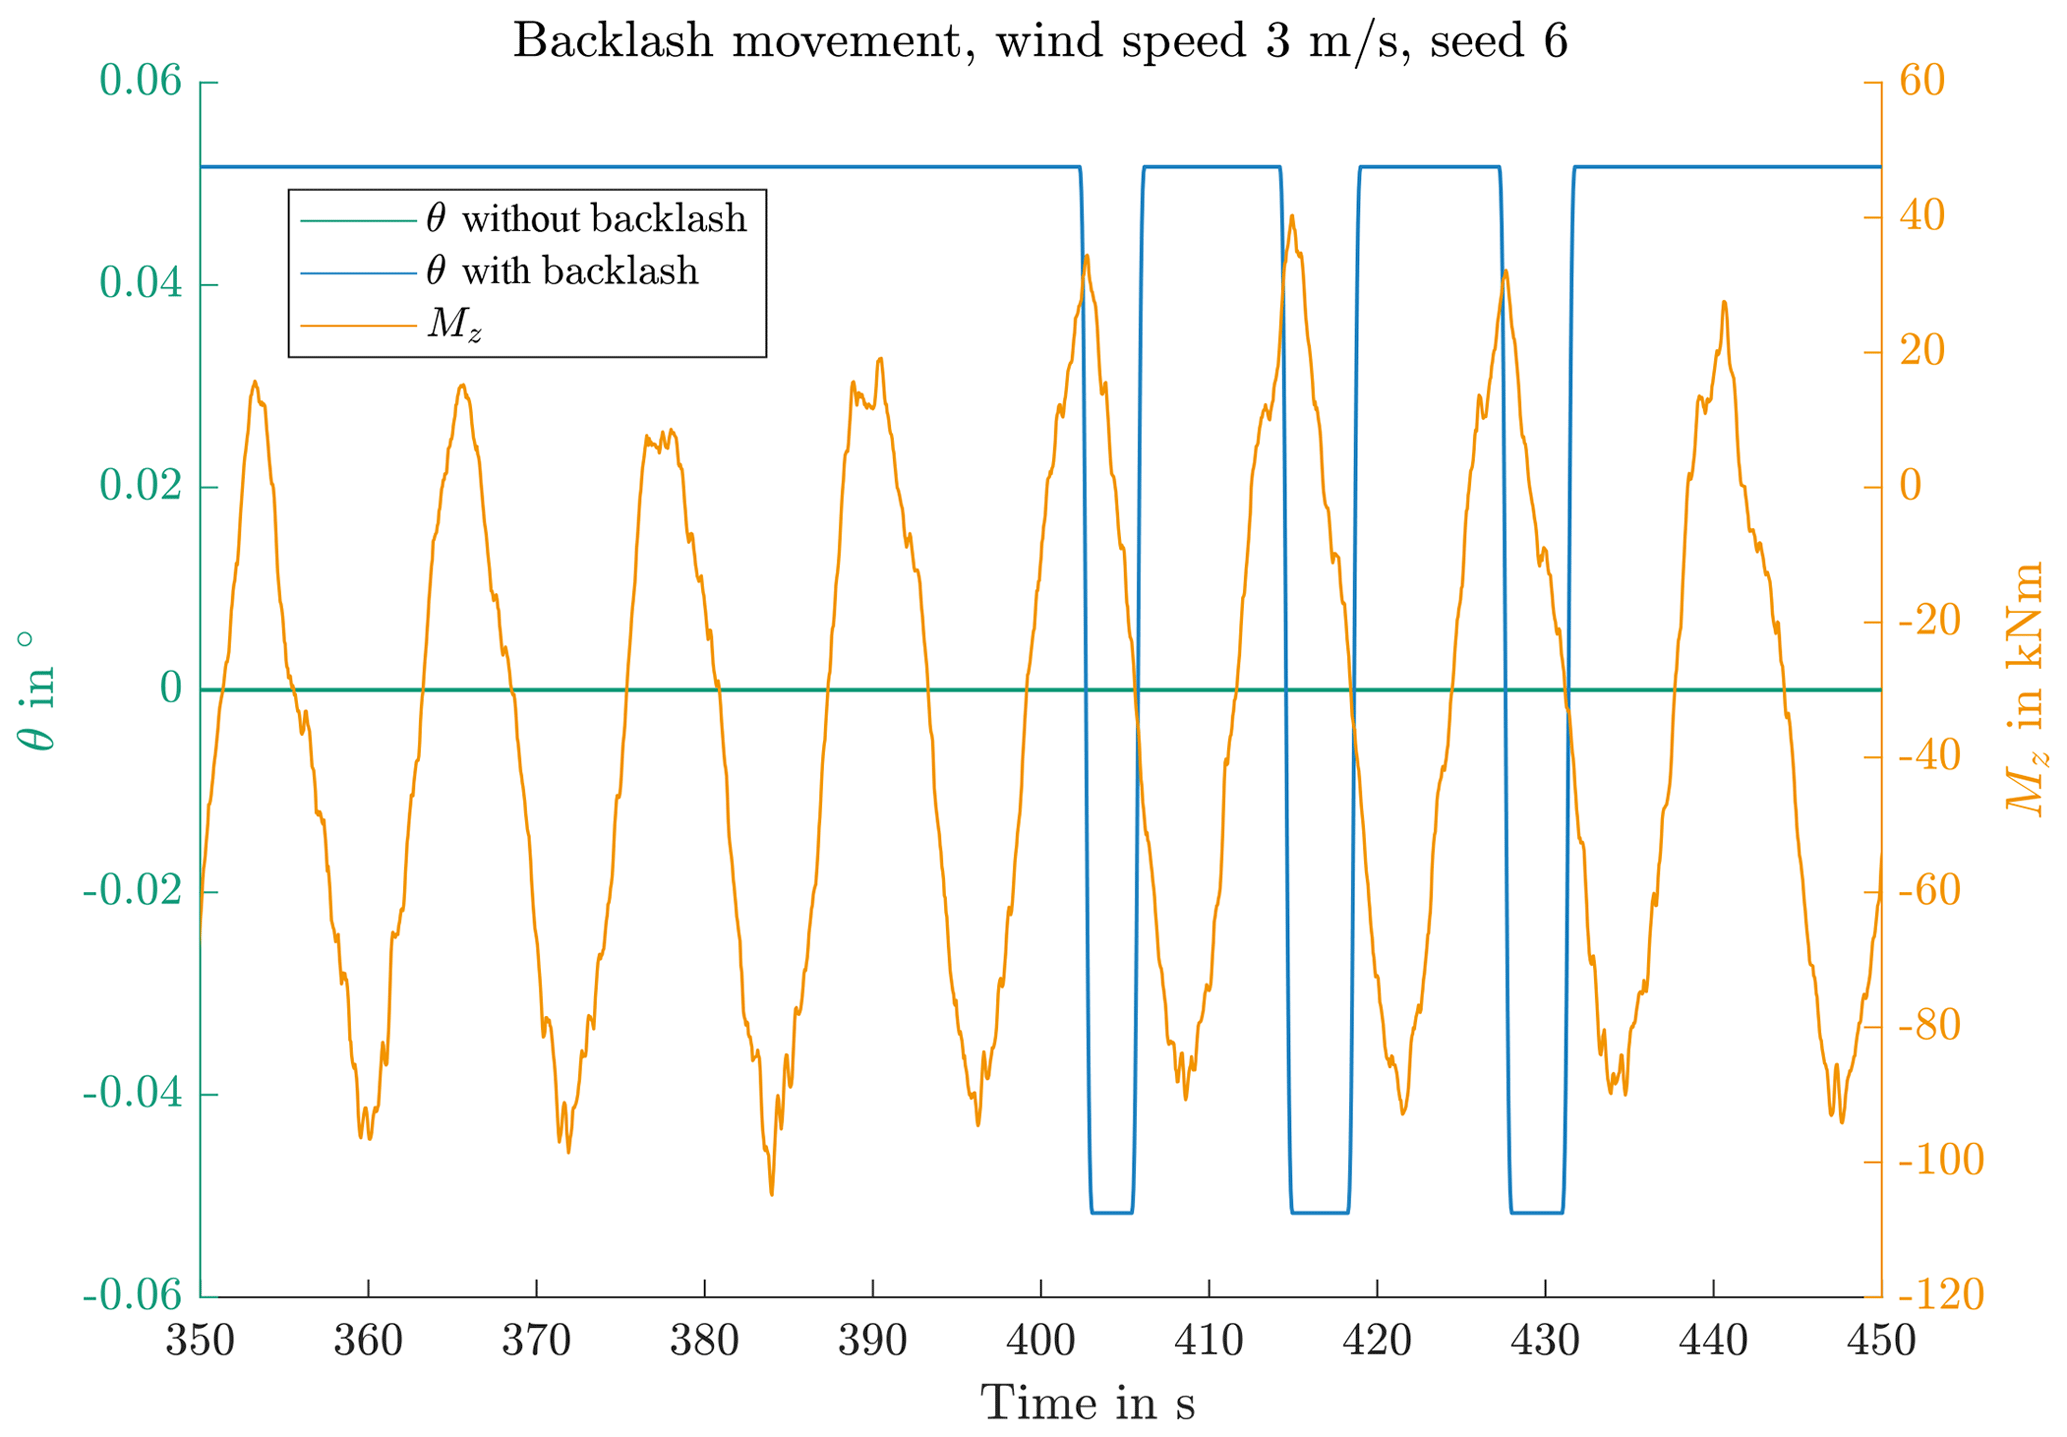
This characteristic of Mz is due to the turbine design and is not necessarily the same for other turbines. Figure 7 shows the movement of the pitch bearing within the backlash. This is at a wind speed of 3 m s−1. At higher wind speeds the movement does not occur. Movements within the backlash will thus be very limited in the standstill part of the final test program.
The test run is going to be conducted on the BEAT6.1 rig (Stammler, 2020). This rig is capable of applying dynamic loads in 6 degrees of freedom while providing realistic interface conditions for the bearing. The target time frame for both the standstill and the pitch cycle programs is 40 d. The aim of the test is to evaluate the risk of wear in standstill and pitch cycle situations. If it is possible within the time frame, the program should also reproduce the standstill situation of the turbine lifetime.
4.2 Ranges for sensitivity analysis
The minimum amplitude for an effective protection run is denoted by θp. Stammler (2020) reported a protection run of approximately 4∘ or to be partially effective for a 5 m ball bearing, as the majority of contact tracks on the raceway did not show any damage. This protection run was executed every 30 cycles. In a study by Behnke and Schleich (2023), protection runs were performed on a 2.3 m ball bearing traveling 4∘ or . They reported no wear if the protection run was executed after 10 or 50 cycles but observed the begin of wear if it was executed after 100 cycles. Based on these limited experiences with other bearing types, the range of θp for the sensitivity analysis is set between 3 and 9∘ for this study.
nmin,s is assumed at five load cycles at the rated speed of the turbine, which is approximately 10 rpm. Tmin,standstill is then 30 s. This is based on the assumption that wear cannot be started or progressed with less than 0.5 load cycles, which appears reasonable but is not backed by test data. However, a value for nmin,s is necessary to avoid identification over very short time intervals, i.e., <1 s with no pitch movements as standstill. Larger values for nmin,s make the subsequent filter stricter and allow less operational scenarios to be incorporated in the final test. To understand the influence of this parameter, it is varied between 0.5 and 10.5 cycles in three steps.
nmin is set to 250 cycles, which, at a rated rotor speed of 10 rpm, equals 25 min. Published data indicate 100 cycles between protection runs to result in no wear on the raceway (Stammler et al., 2019a), and ongoing research shows effective protection for up to 250 cycles. As the wind speed measurements and simulation data are in 10 min intervals, the minimum sequence length is set to 30 min or 300 cycles. The range of the sensitivity analysis is set from 200 to 400.
Table 7 lists the parameters and their ranges for the sensitivity analysis. The individual steps result in 27 possible combinations. The sensitivity analysis for θp and nmin,s is done with the simulation data and the sensitivity analysis for nmin with the wind speed data.
4.3 Standstill program results
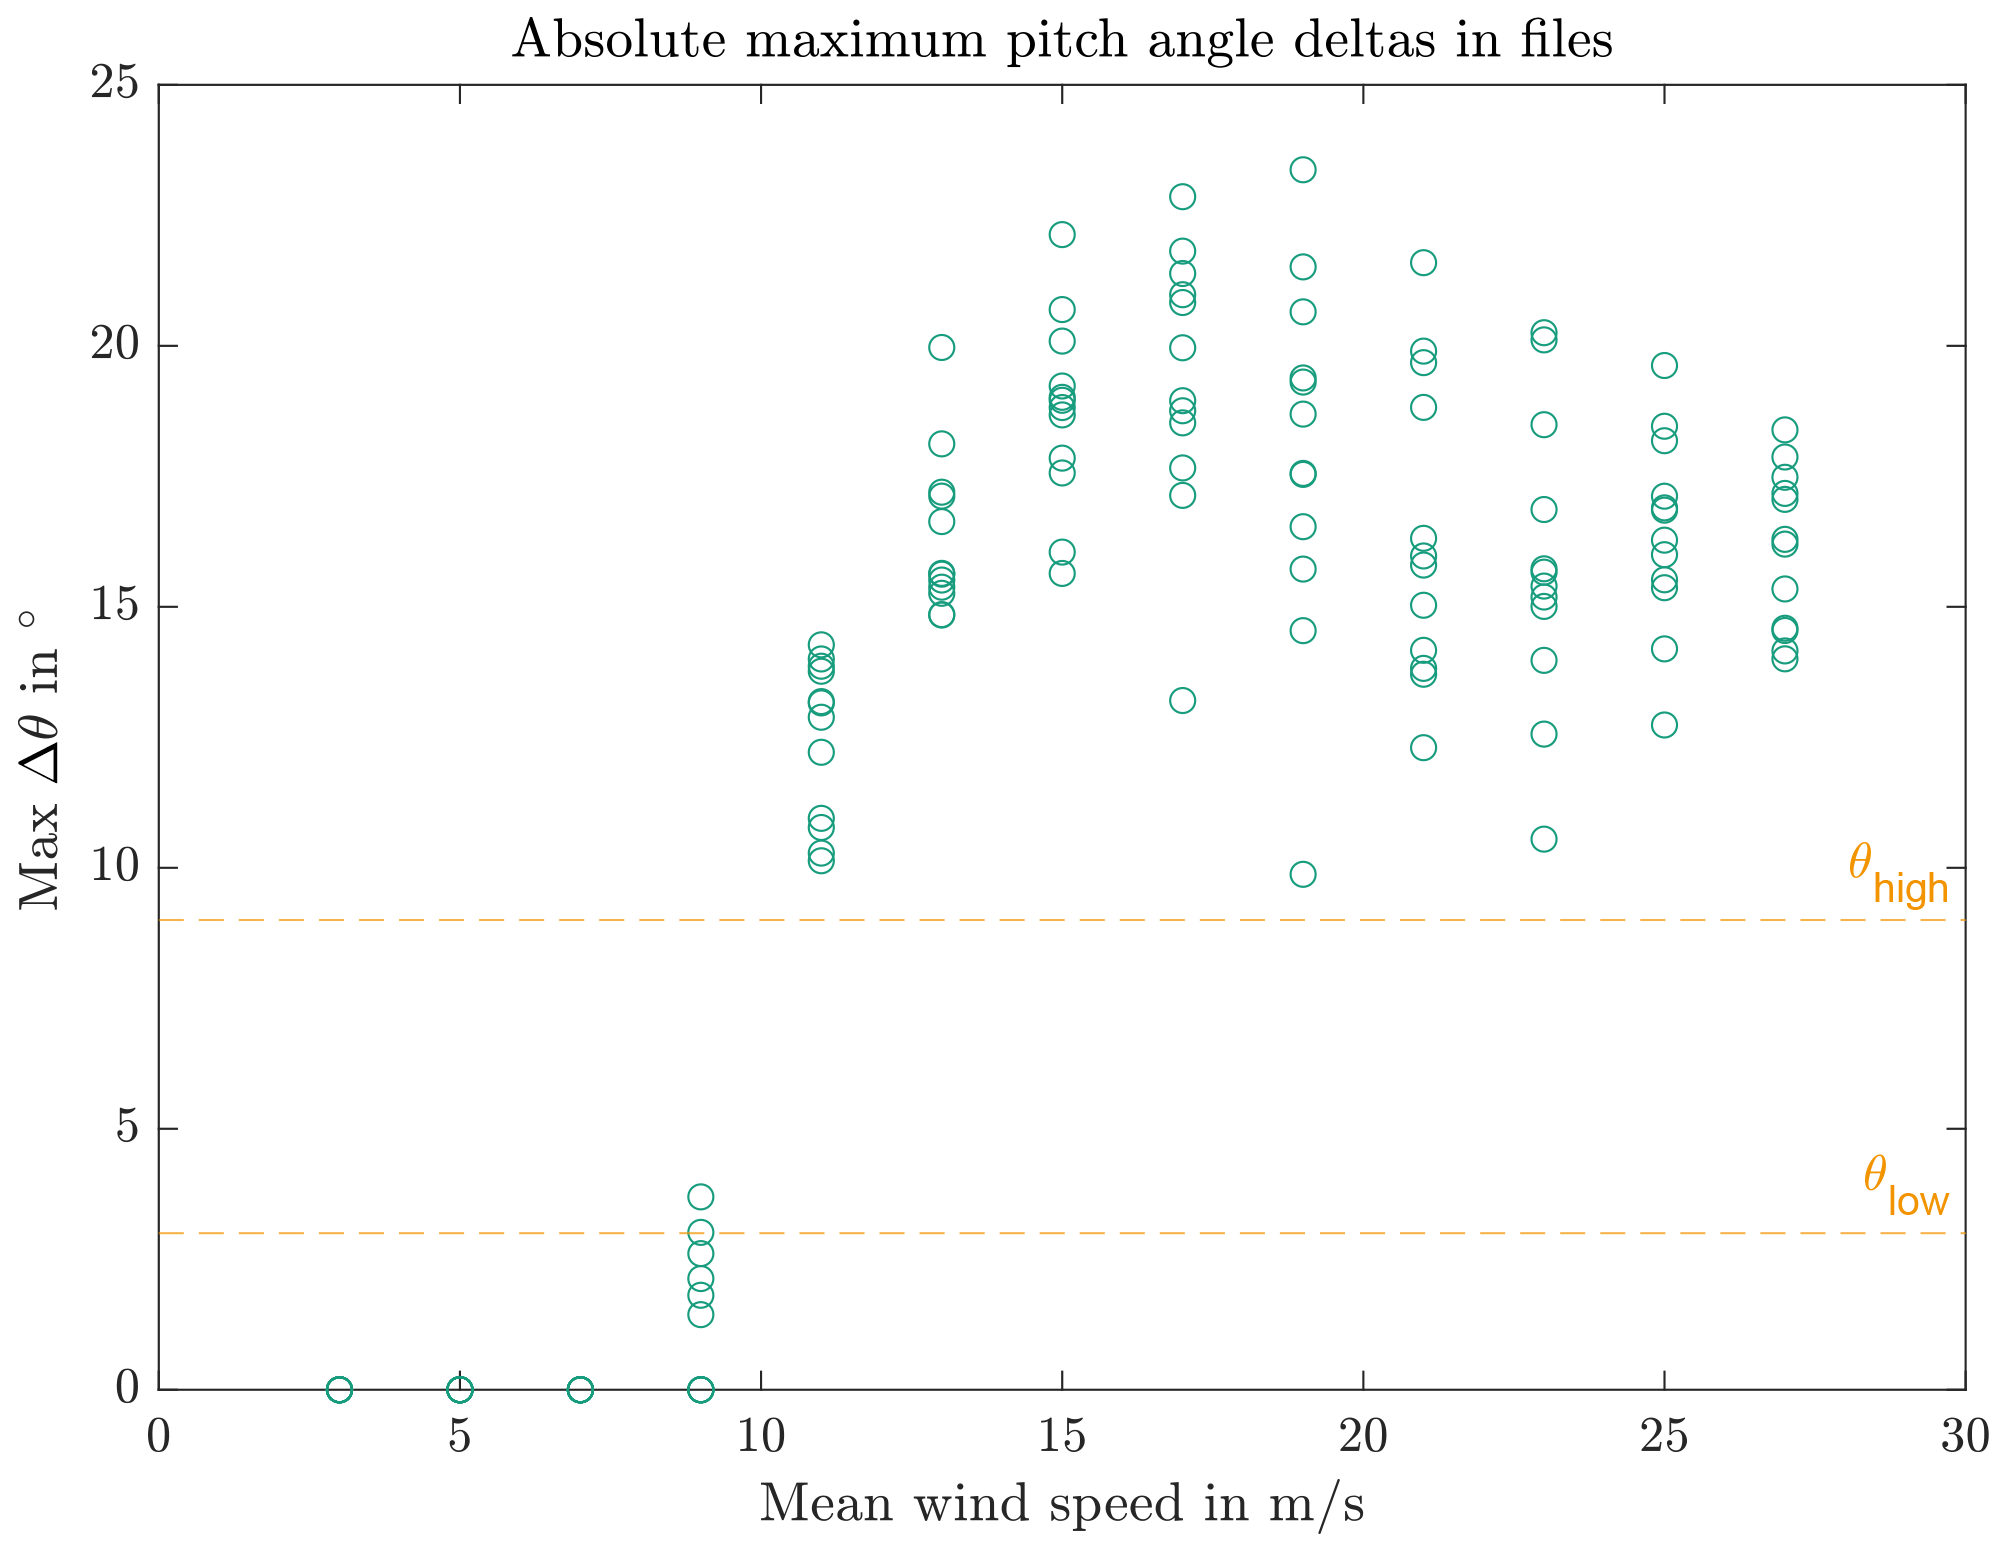
Figure 8 displays the maximum pitch angle deltas for each simulation file, providing insight into the applicability of the sensitivity range for θp. For wind speeds up to 7 m s−1, θ remains unchanged. At 9 m s−1, the CPC controller has to limit the power output of the turbine on some occasions. At 11 m s−1 and above, every file has maximum pitch angle deltas above the maximum value of the θp range.
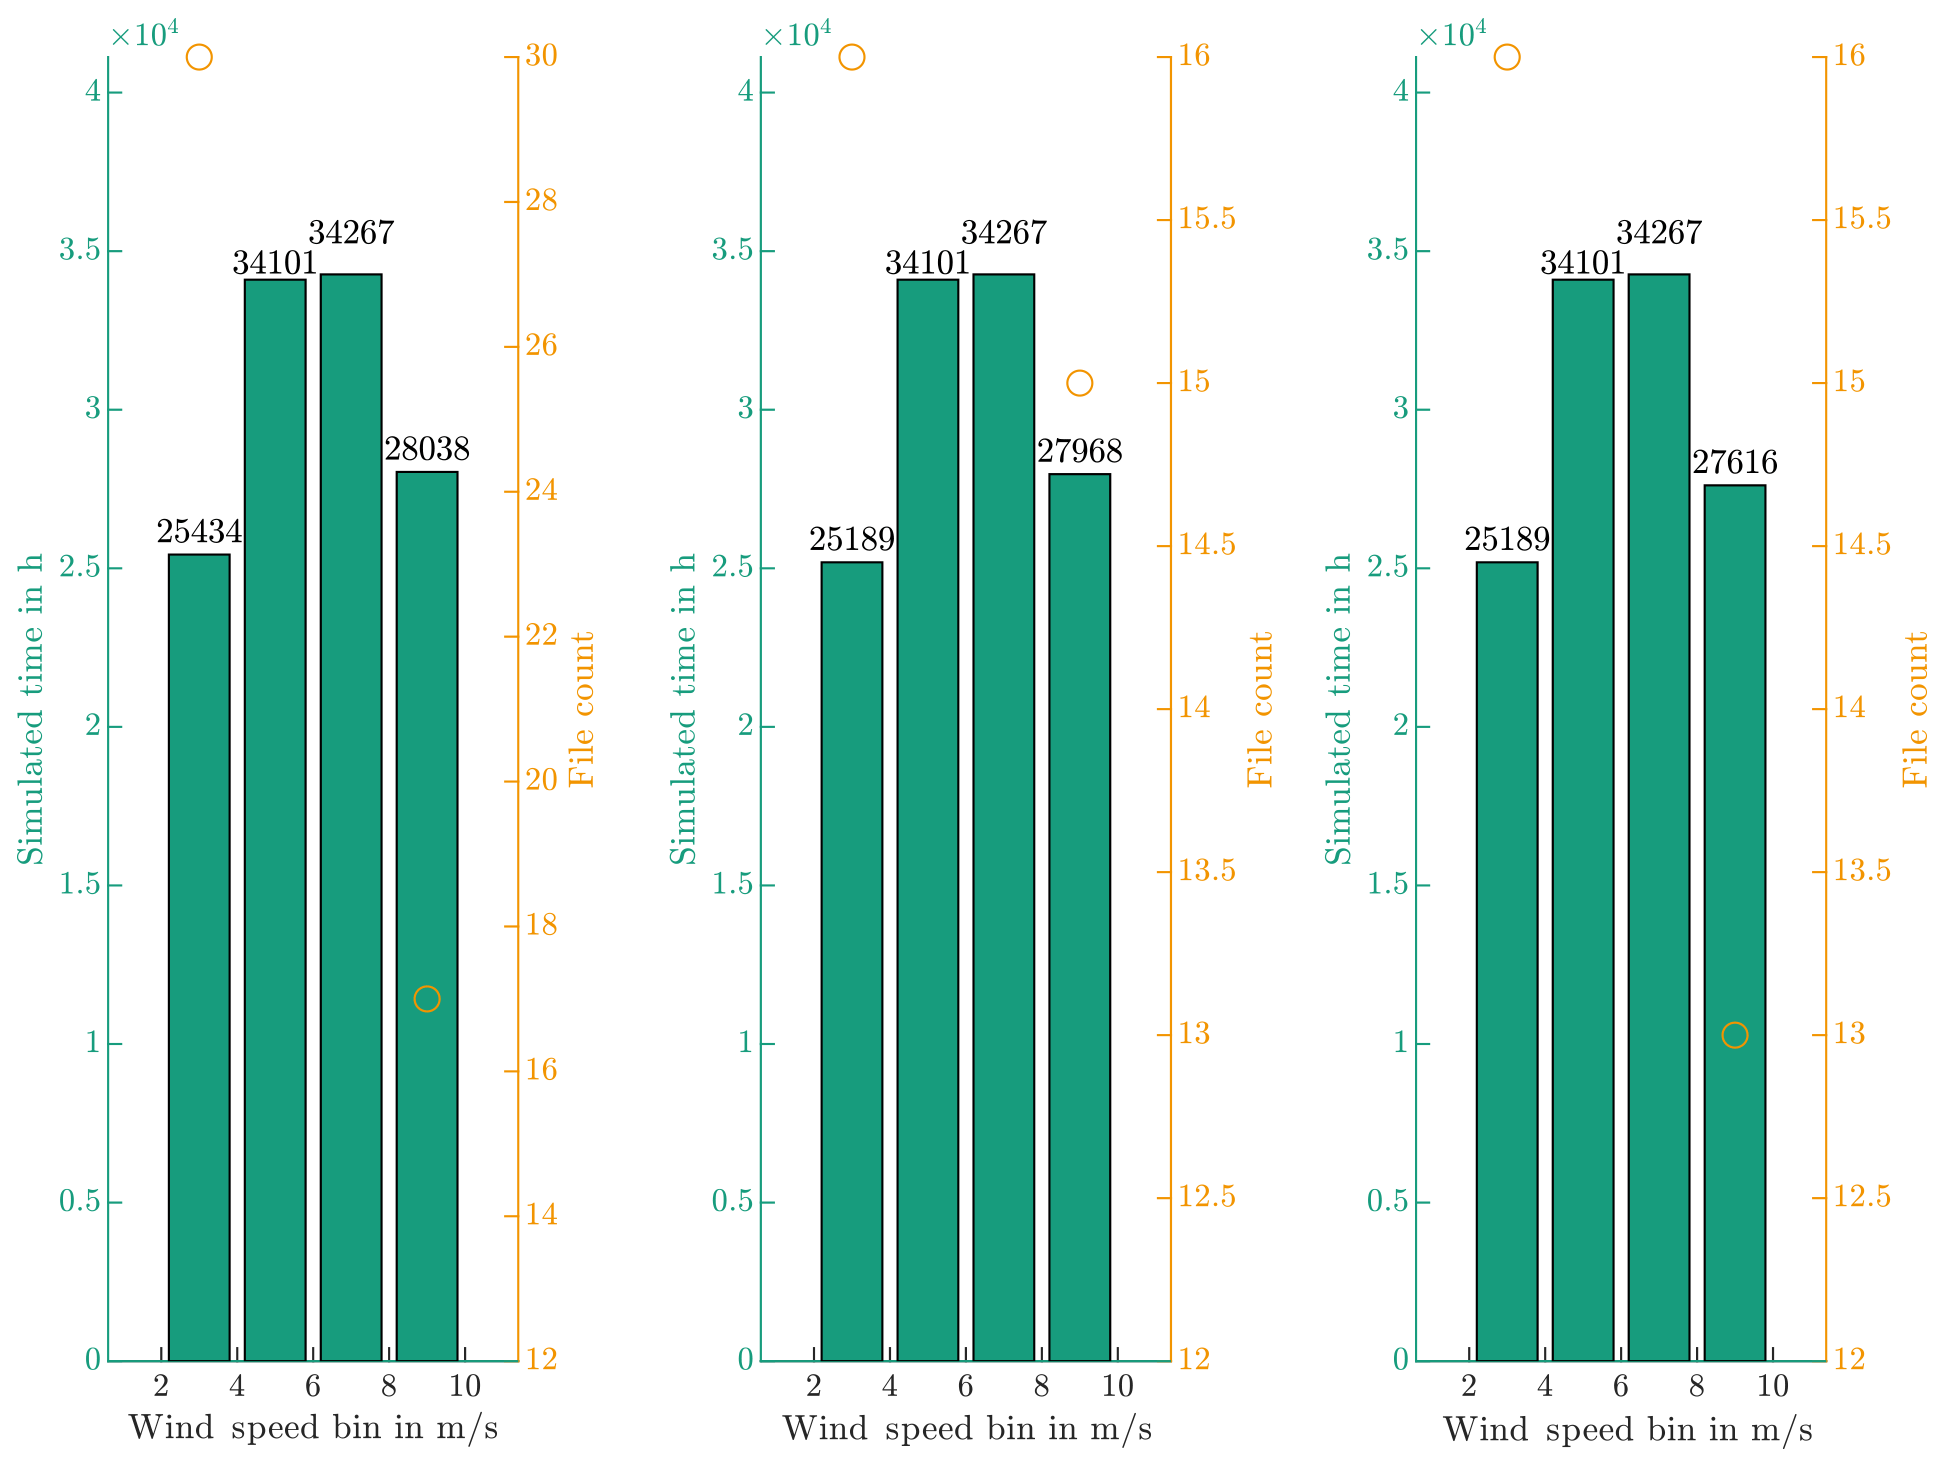
Since the different values for θp will not influence the focus speed, θp is set to 6∘. With θp fixed, nmin,s is varied, and the simulation data are filtered for standstill times. Figure 9 illustrates the remaining simulated times and simulation files over wind speed. The left side shows , the center , and the right side . This figure allows for the selection of focus speeds. The differences are negligible, and the assumed value of is maintained. The resulting focus wind speed is 9 m s−1.
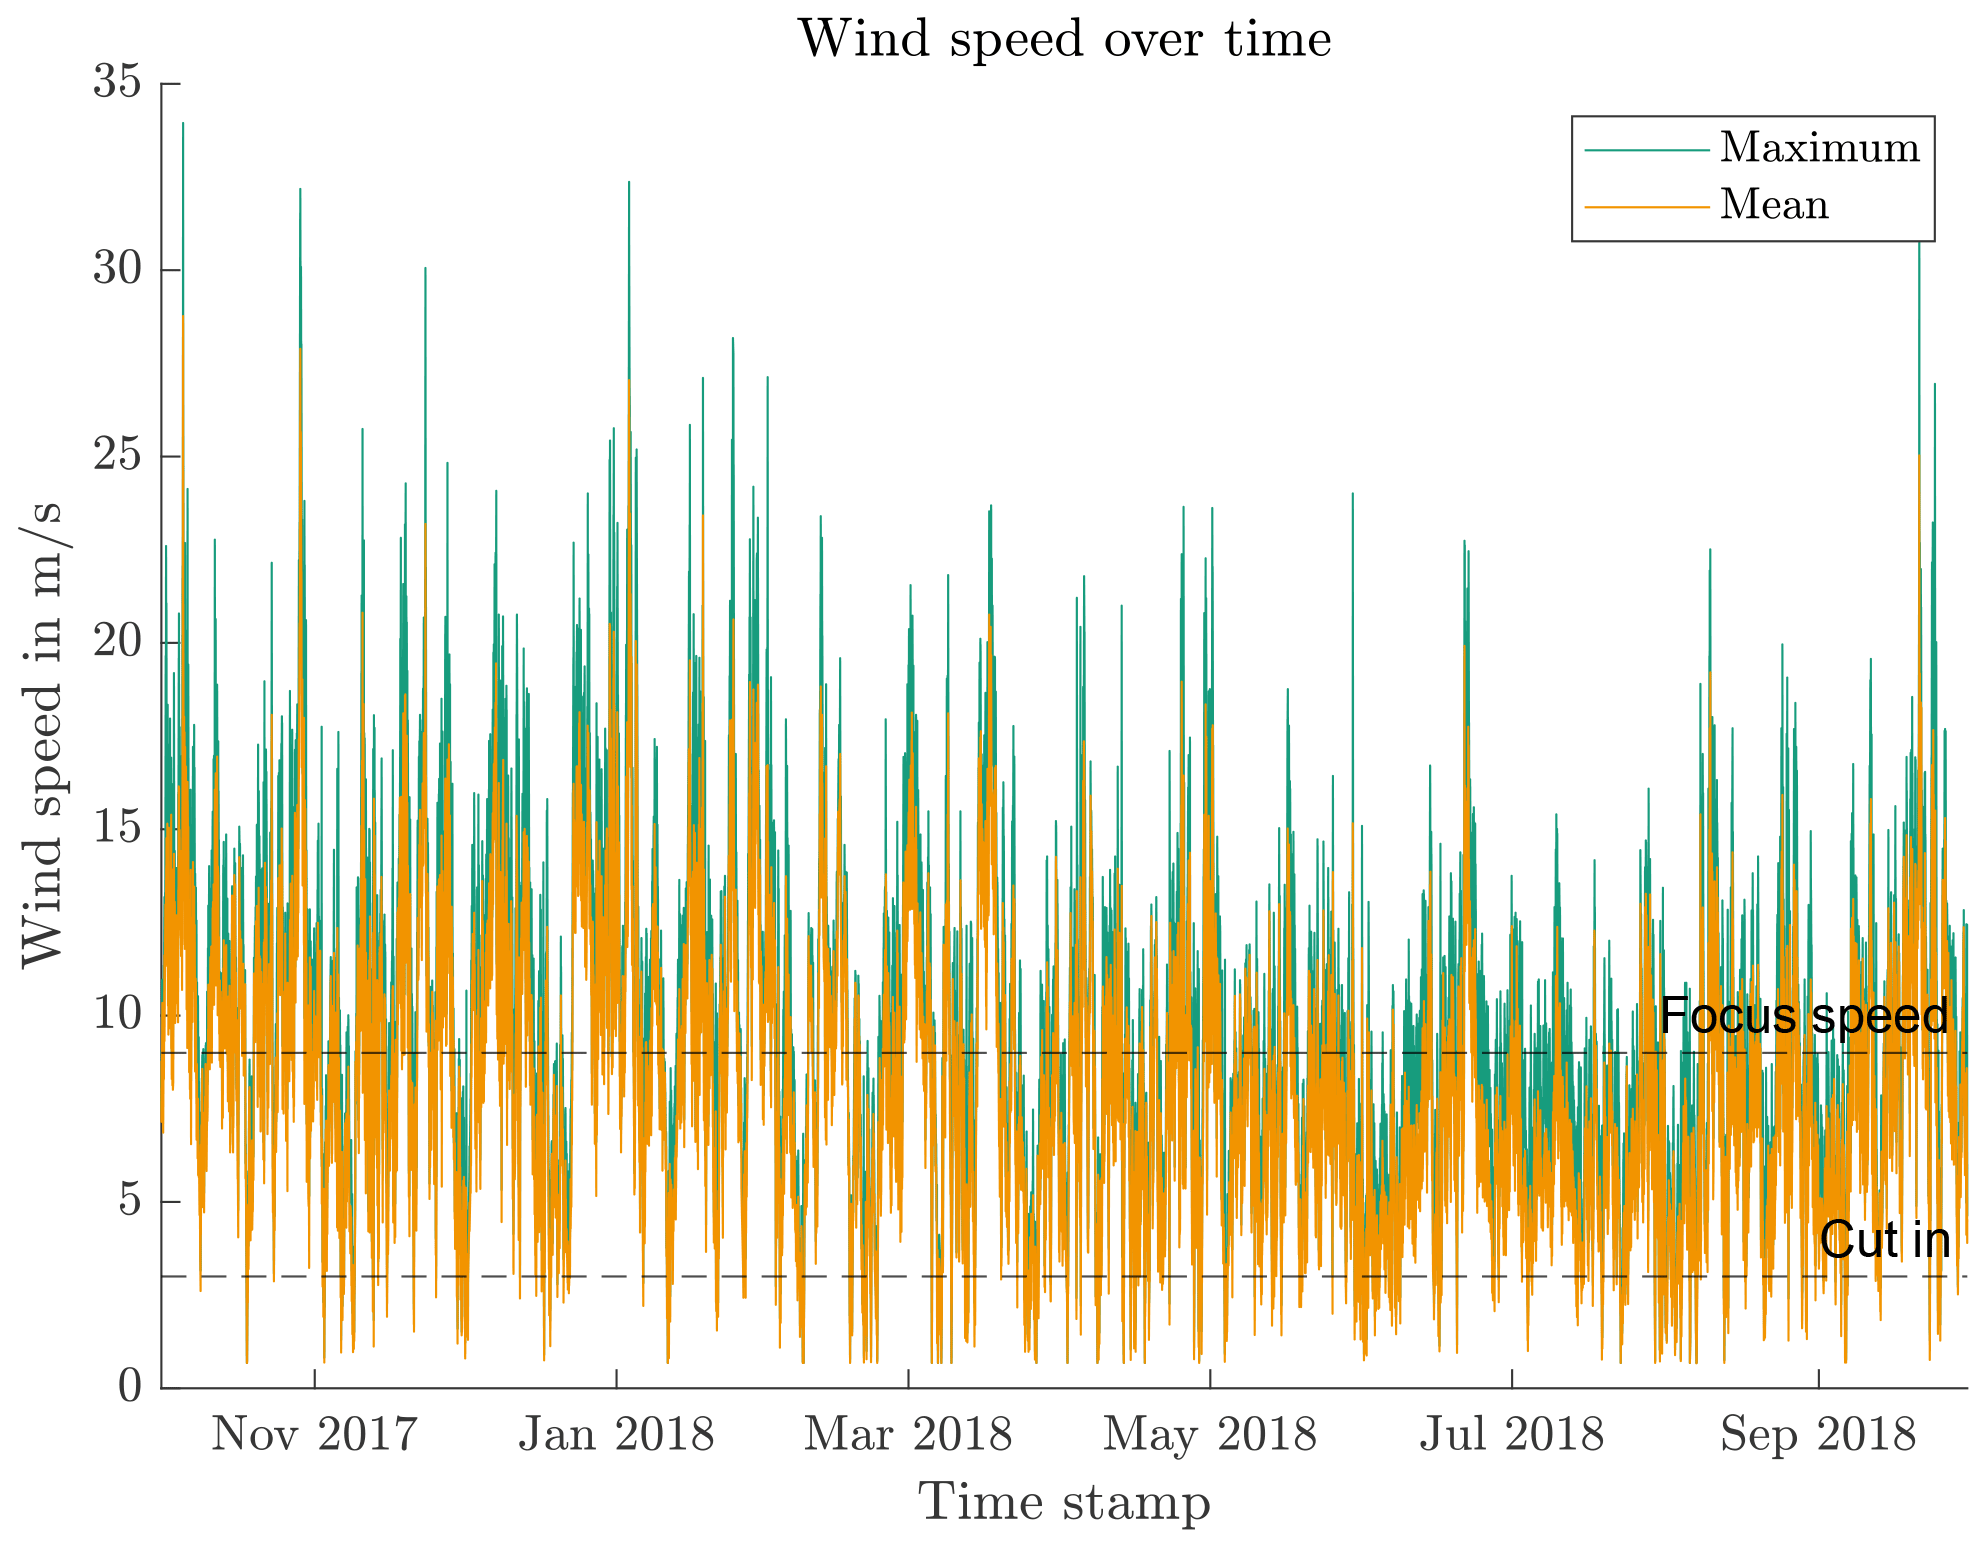
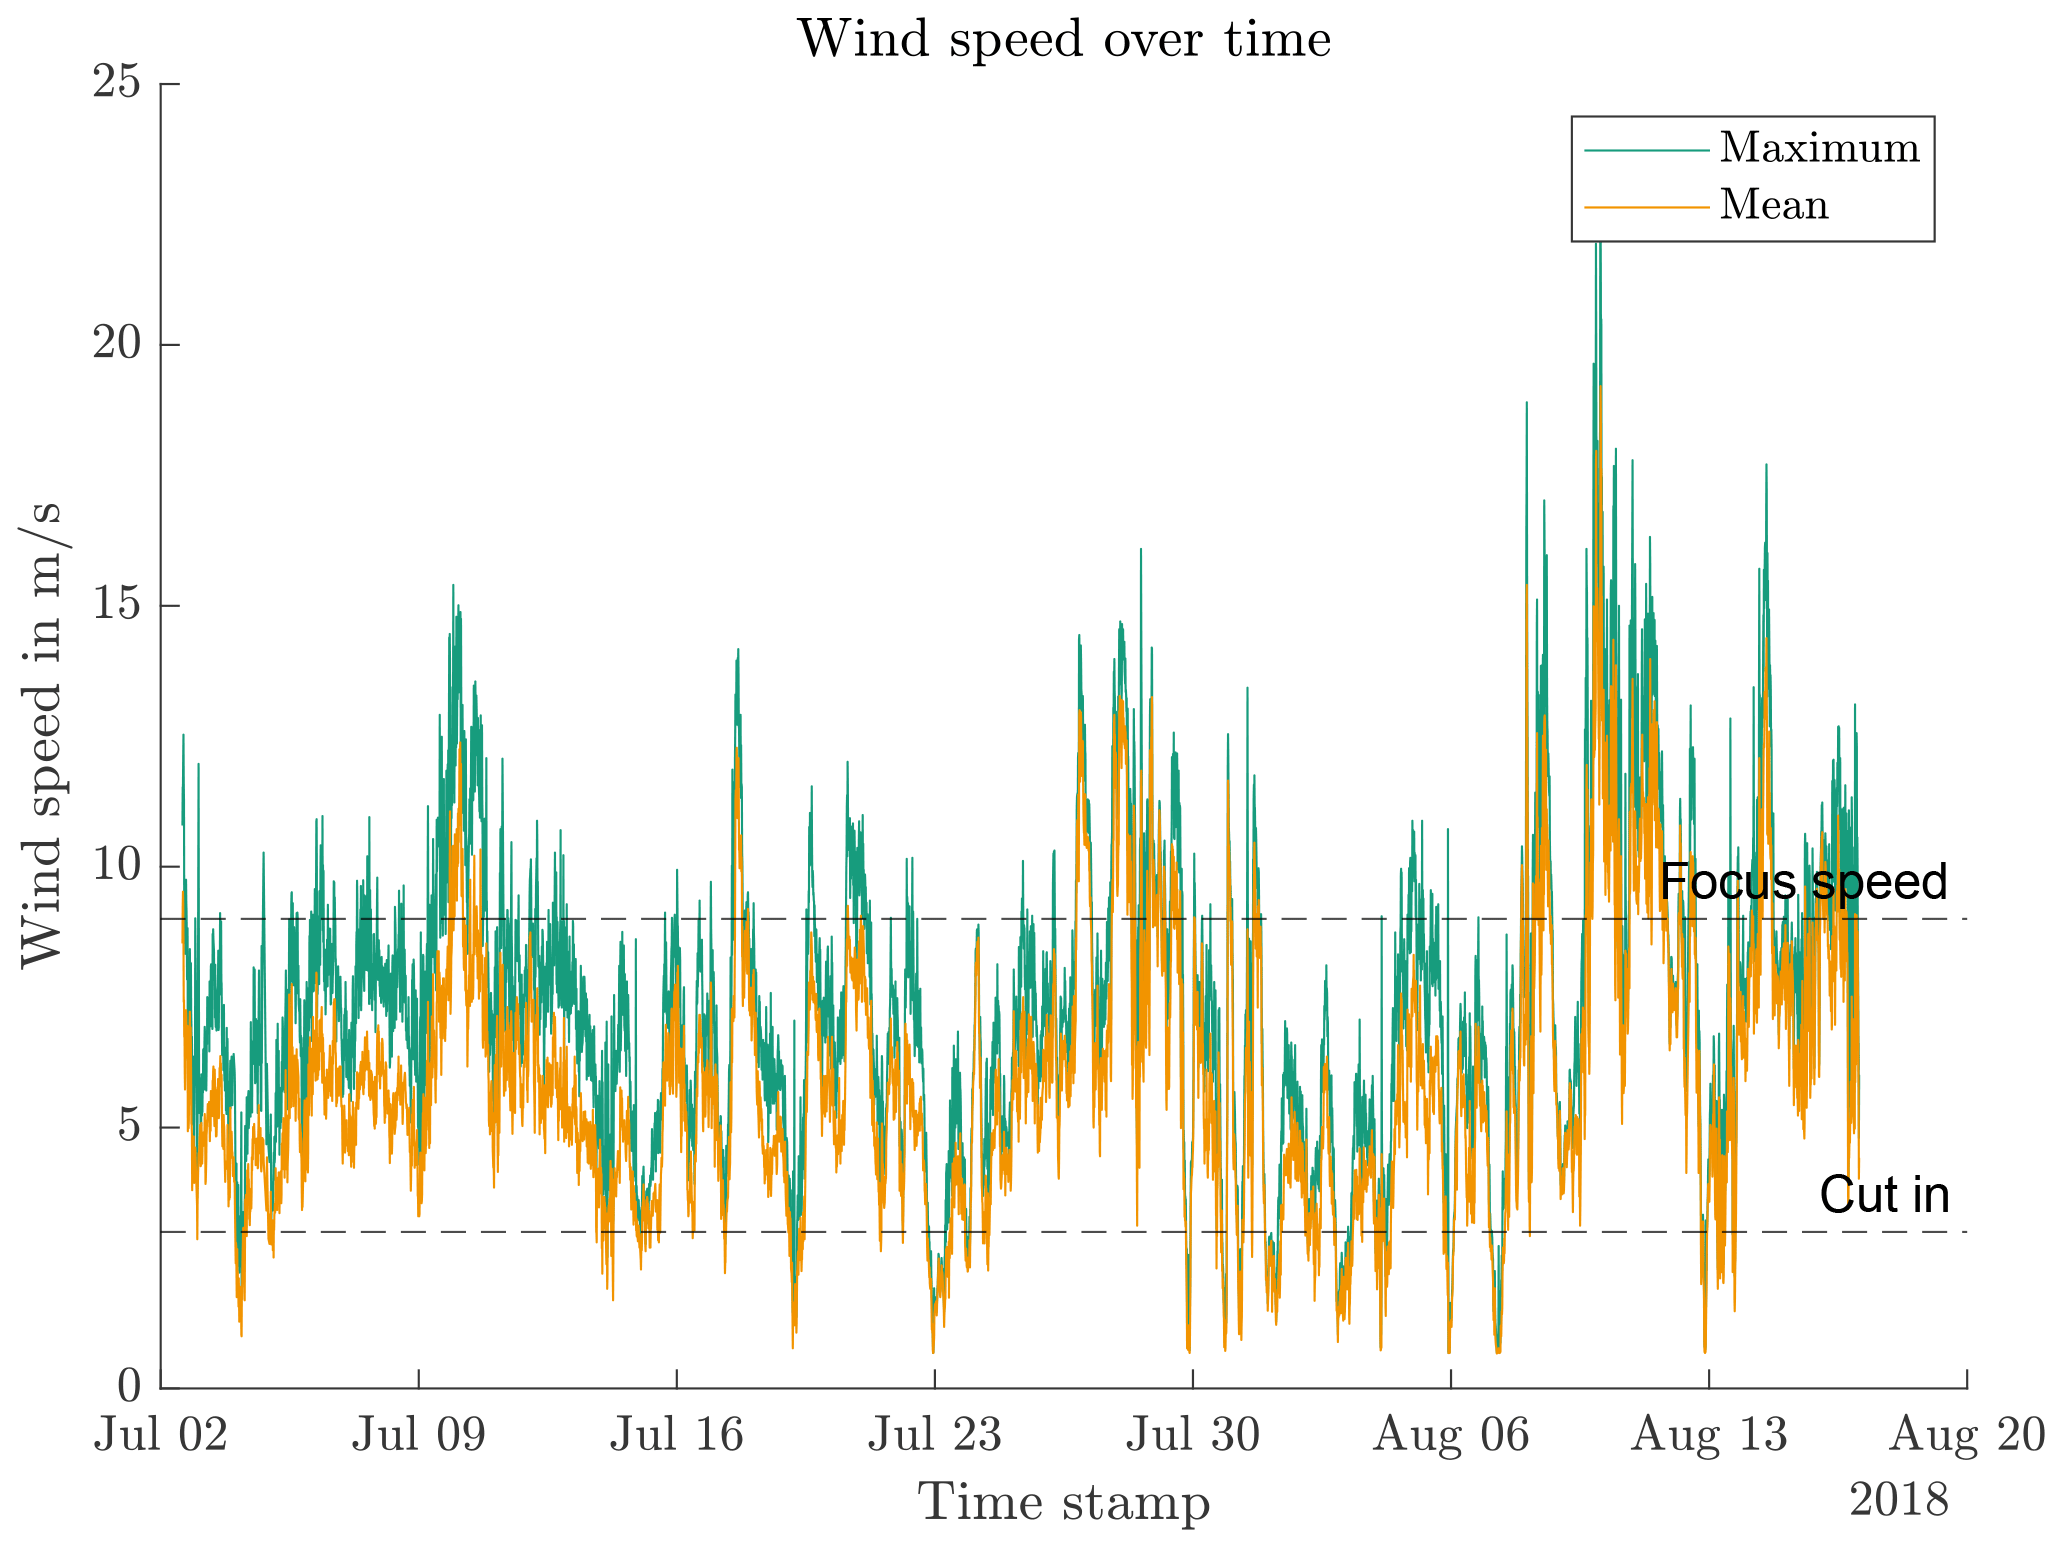
The sequence recognition uses the focus wind speed and the three possible values for nmin with the wind measurement data. The expected results are three different overall lengths of . Figure 10 shows an overview of the measurement data with maximum and mean values of 10 min periods. Minimum speeds are not available in this data set, which covers 1 year. As expected, the wind speeds are below cut-in and above the focus speed at several instances.
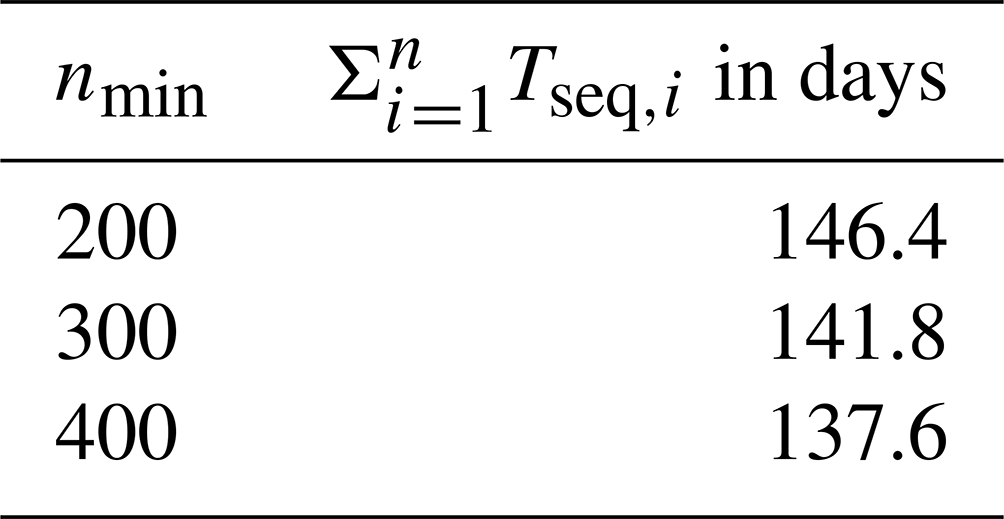
Table 8 lists the resulting of all sequences within the thresholds. nmin has a minor influence on the test duration. As the wind speed data cover 1 year, the duration would have to be multiplied by 20 to result in an endurance run. Neither 20 years nor 1 year as test input is possible within the target time frame.
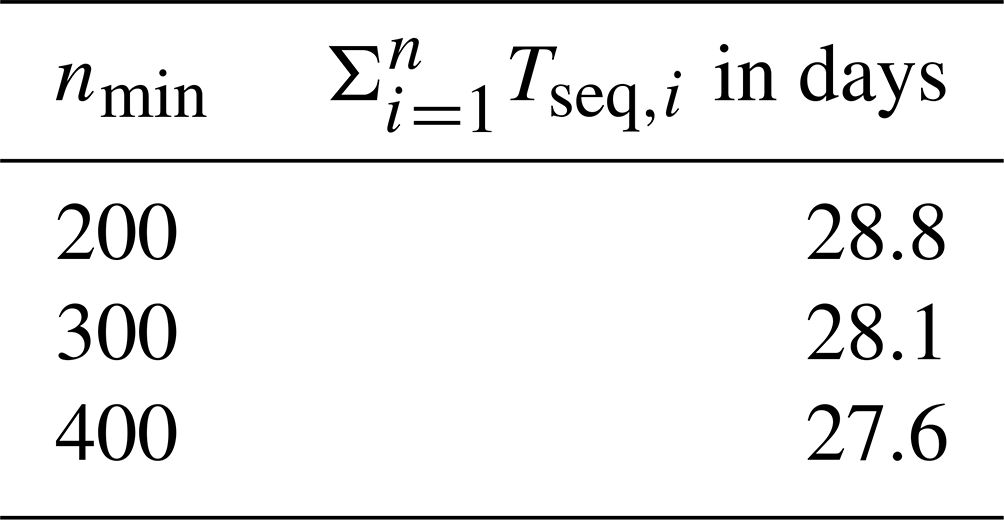
With an endurance run resulting in unrealistically long test times, the target of the test is a risk evaluation. This allows for the reduction of the input time span, as long as the resultant test has sufficient cycles to result in wear. The wind speed data are split into eight equal parts of which the one with the lowest average speed is selected. Figure 11 shows these 1.5 months of the wind speed, and Table 9 lists the overall duration of sequences. All of these fit into the desired time frame. Hence, nmin is set to the lowest value of 200 to integrate as many operational scenarios as possible into the test.
The algorithm described in Stammler (2020) generates test time series for the standstill program, resulting in a final duration of 30.7 d. In the test, the maximum values of the simulation data listed in Table 6 remain the same, as the high number of standstill sequences, coupled with a random selection of protection runs, caused all files from the input data set to be part of the test run. It is worth noting that this is a result of the case study and may not necessarily be applicable to other turbines.
Exemplary pitch angle θ curves of different test days for a selected duration of 2 h are shown in Fig. 12. The graph clearly displays the difference between standstill times and protection runs.
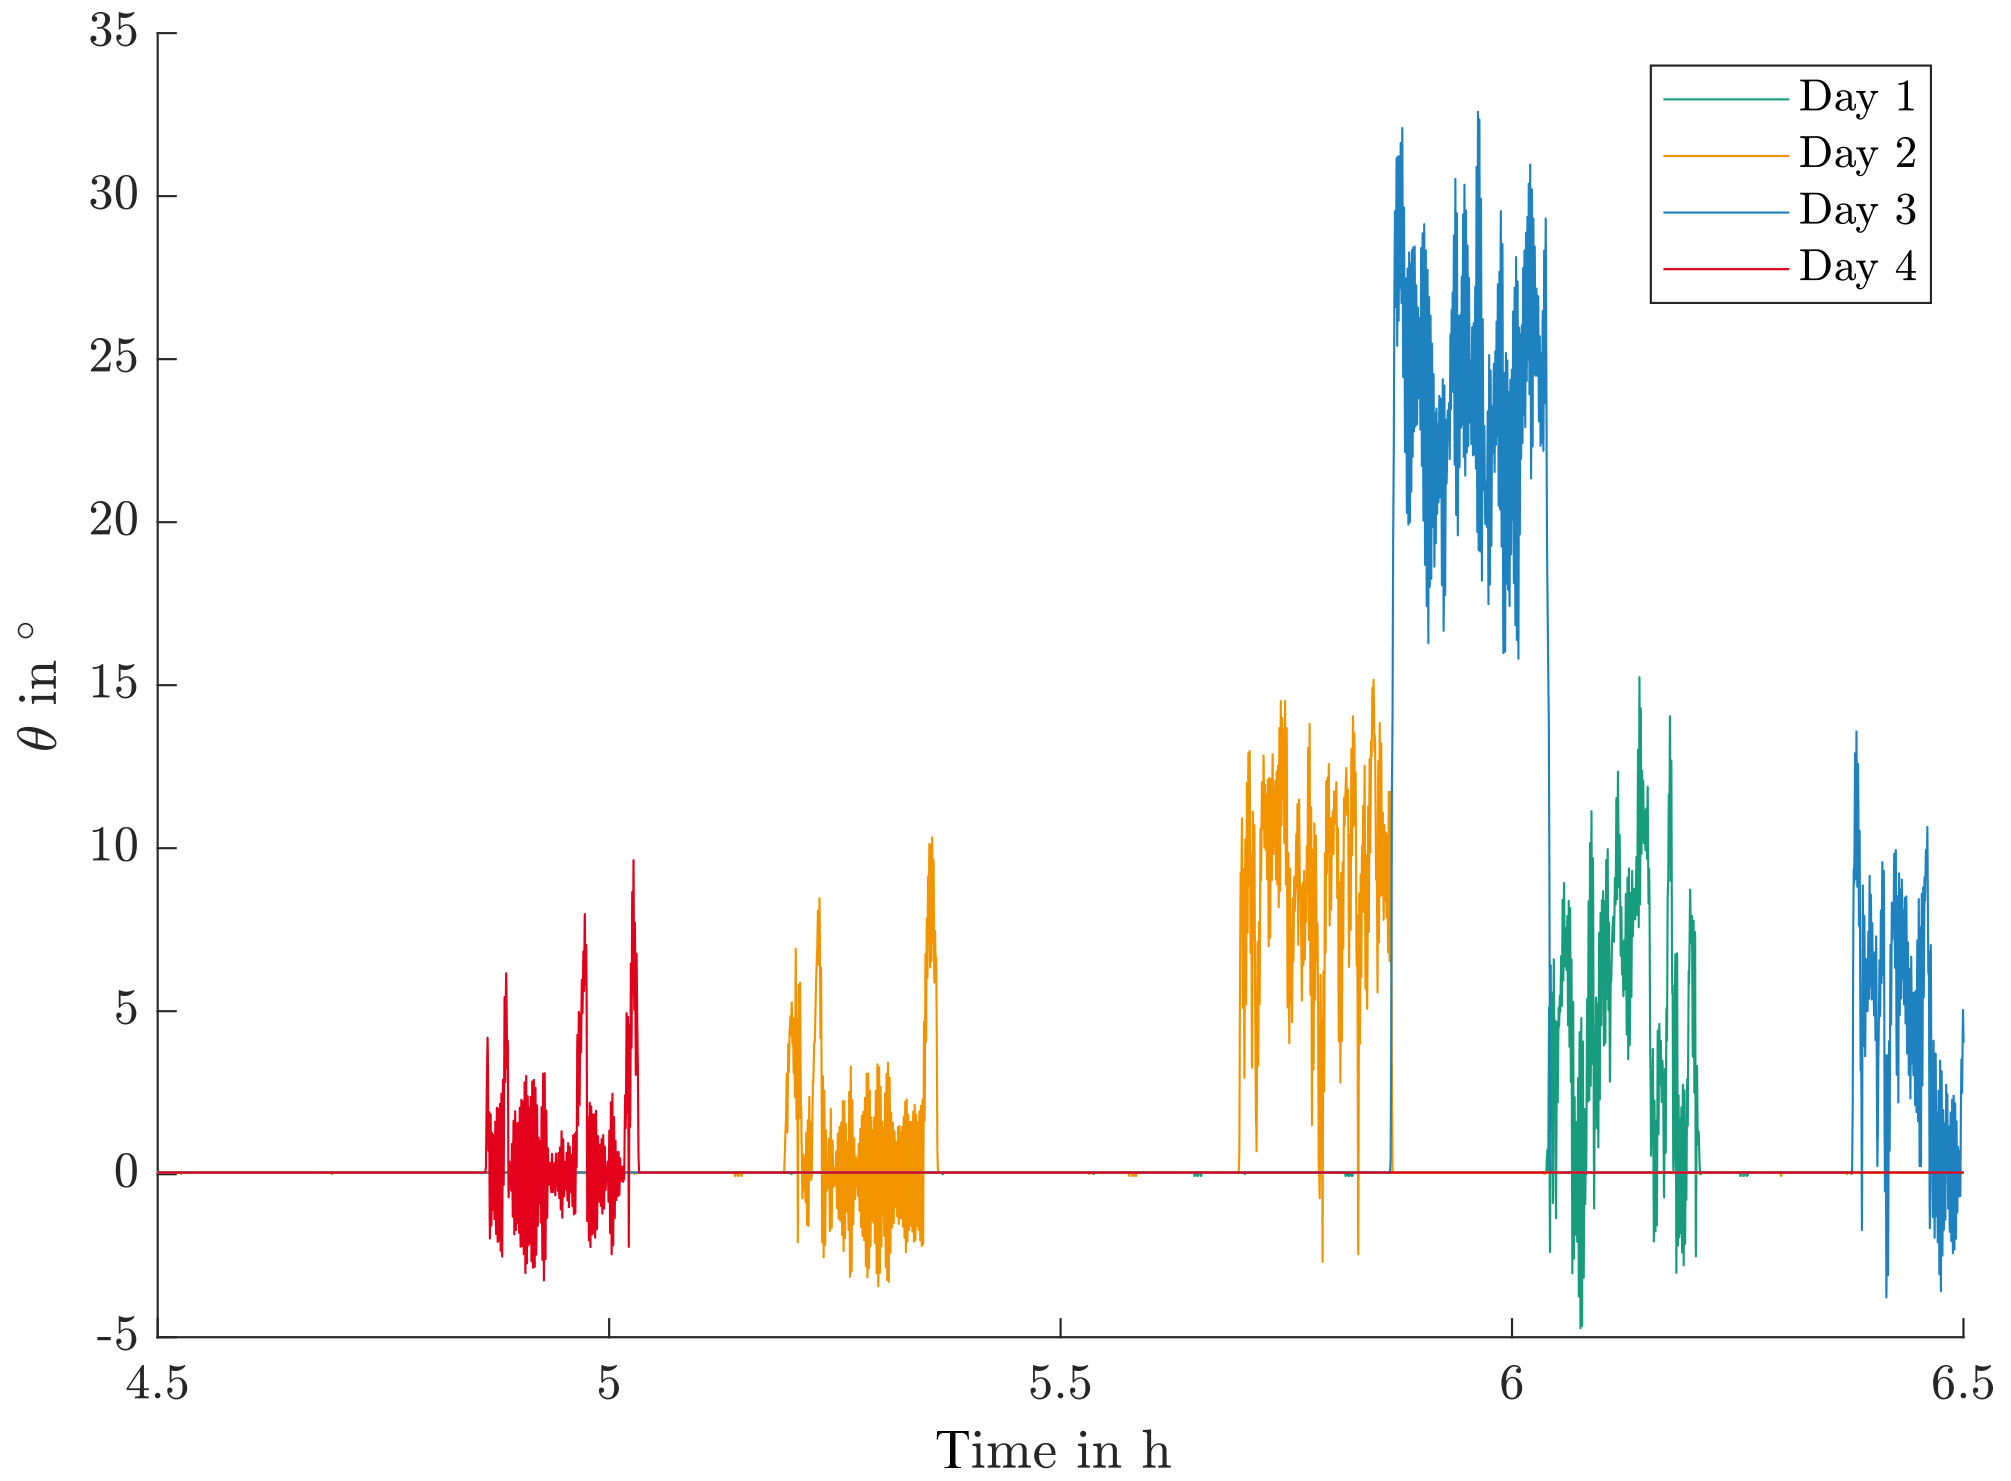
Figure 13 displays one exemplary transition from a protection run load case to a standstill period. It contains the contact pressure P at different positions and the pitch angle θ. The peak contact pressures at 90∘, in blue, are almost constant, whereas the mean pressure value at 0∘, in green, drops once the load case of the protection run ends at approximately 392.6 min. The protection run load case stems from a file with higher wind speed and thus higher thrust load My.
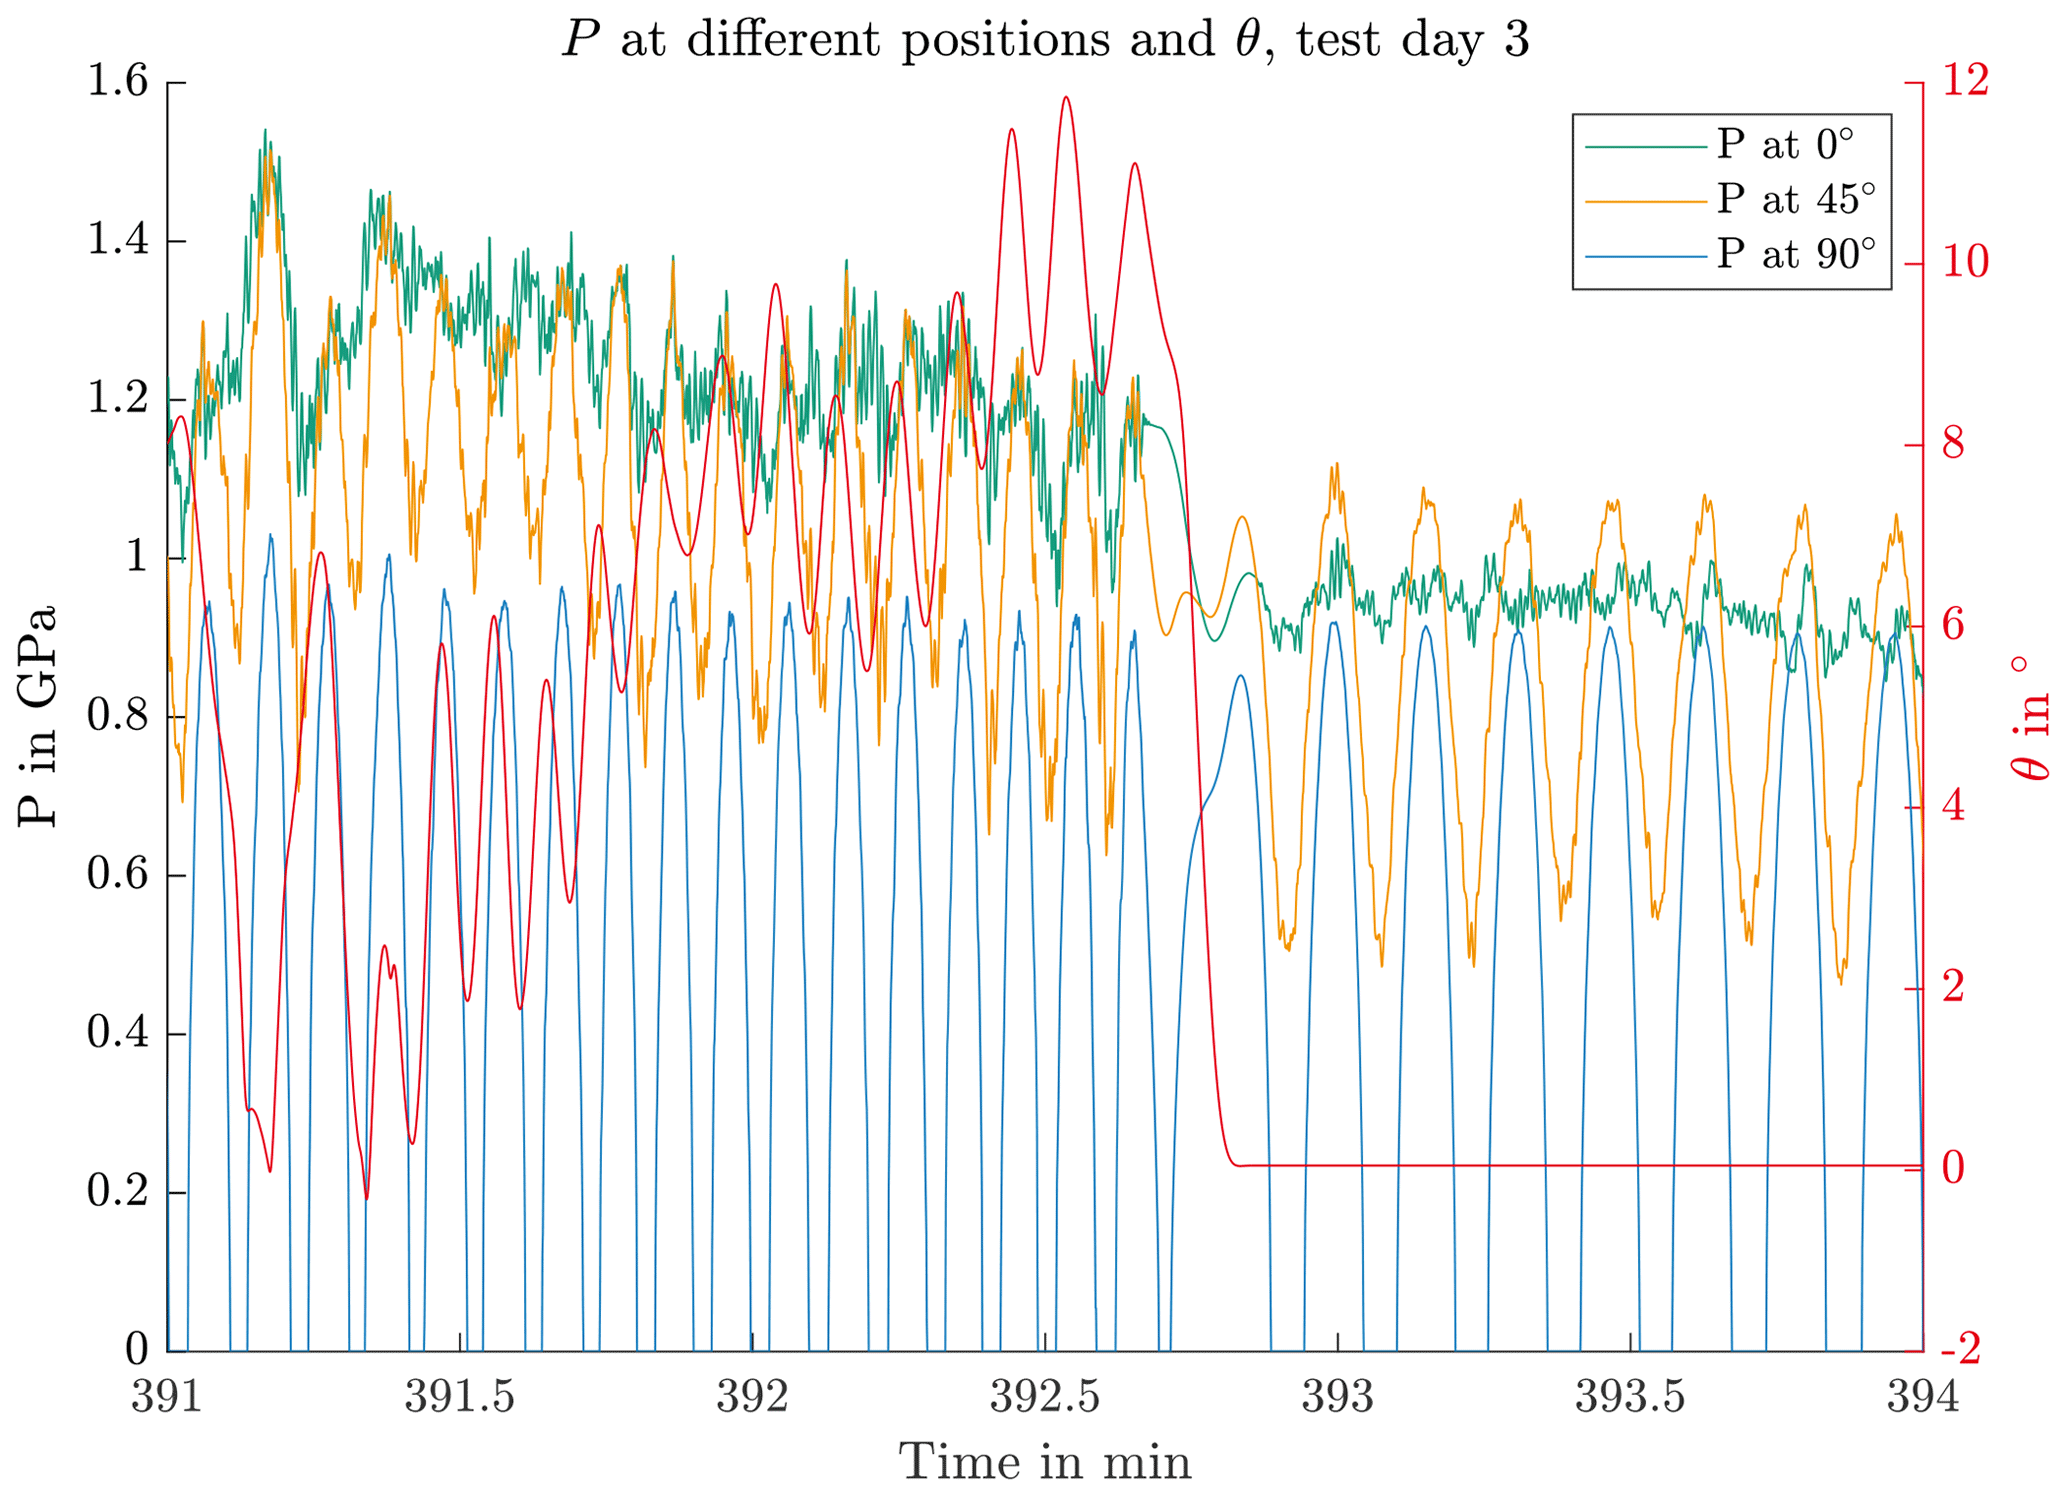
These two exemplary figures show that the final test program combines standstill periods and protection runs. A cycle count of P at 90∘ returns 275 219 cycles with an average frequency of 0.18 Hz.
4.4 Pitch cycle program results
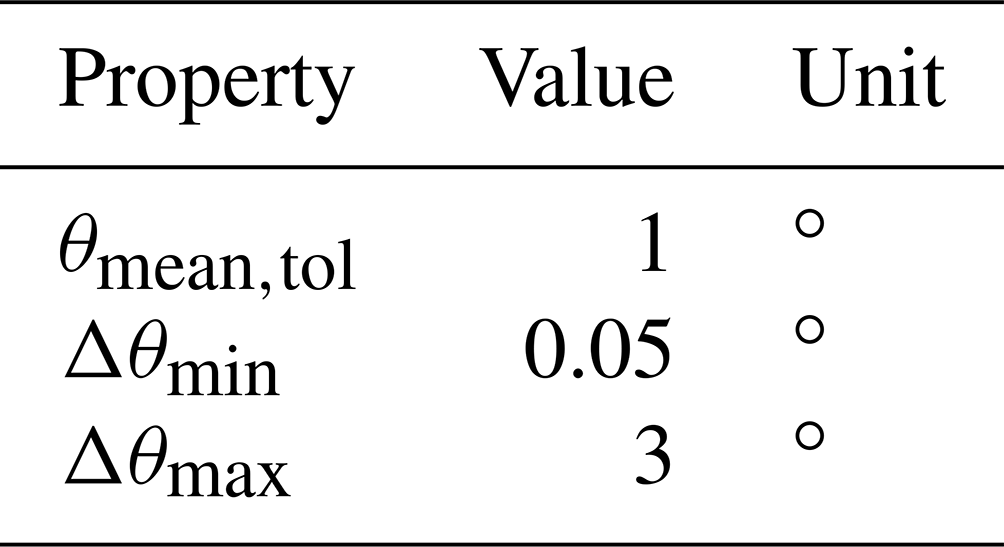
The algorithm described in Stammler (2020) identifies sequences in the pitch movements using the criteria listed in Sect. 3. Table 10 shows the values for this analysis. To avoid counting dithering moves, Δθmin is set to 0.05. Similarly, to avoid incorporating partially effective protection runs into the sequences, Δθmax is set to 3. θmean,tol is set to 1∘, which ensures the cycles affect the same area of the raceway. Since the final sequences are selected from all of those found using these criteria, there is no need for a sensitivity analysis for this part.
The analysis returns two sequences. As the five most critical should have been selected, it is not necessary to apply the criteria from Table 2, and the two sequences are maintained for the test. Figures 14 and 15 show θ of these sequences in green. The dotted black lines are θ of the entire file. It can be seen that in both cases assumed protection runs, i.e., pitch movements spanning more than 6∘, are in proximity to the sequence. The orange lines show the blade root bending moment. Both sequences occur at 11 m s−1 mean wind speed.
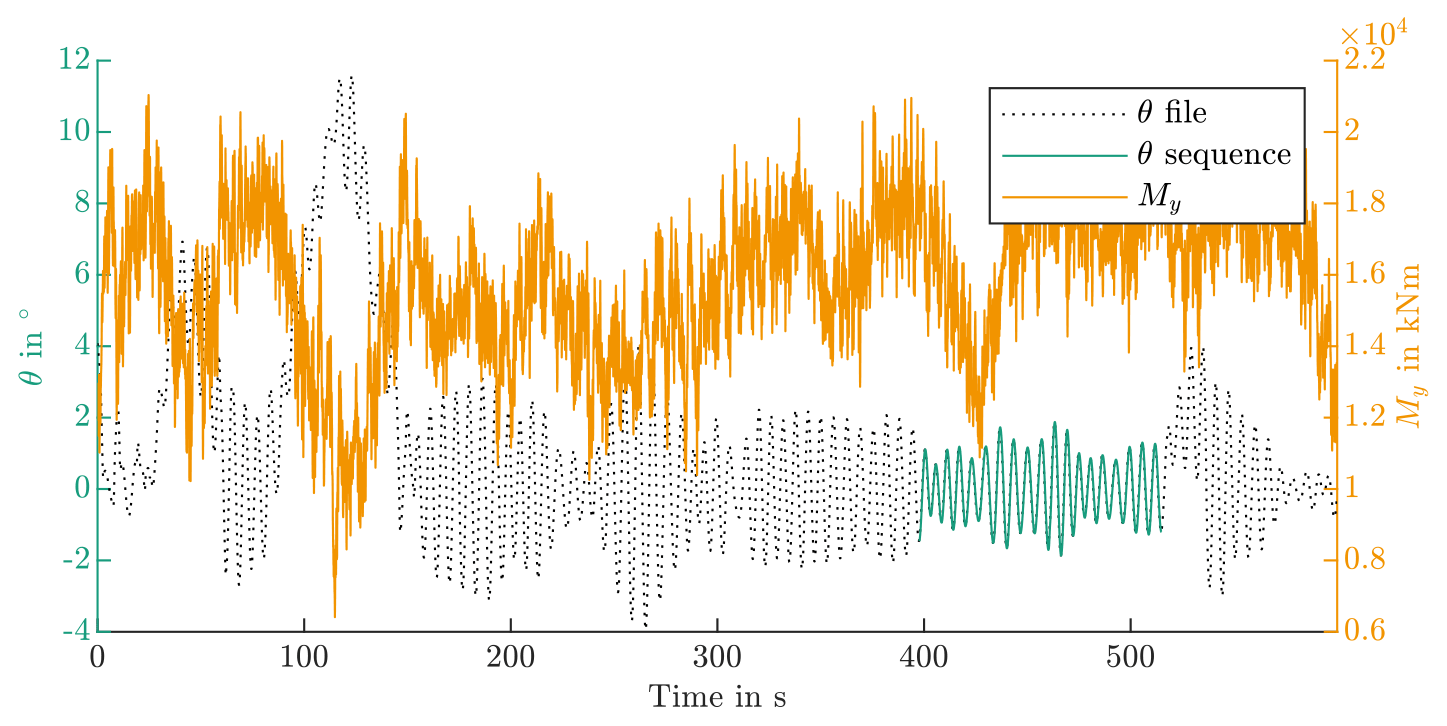
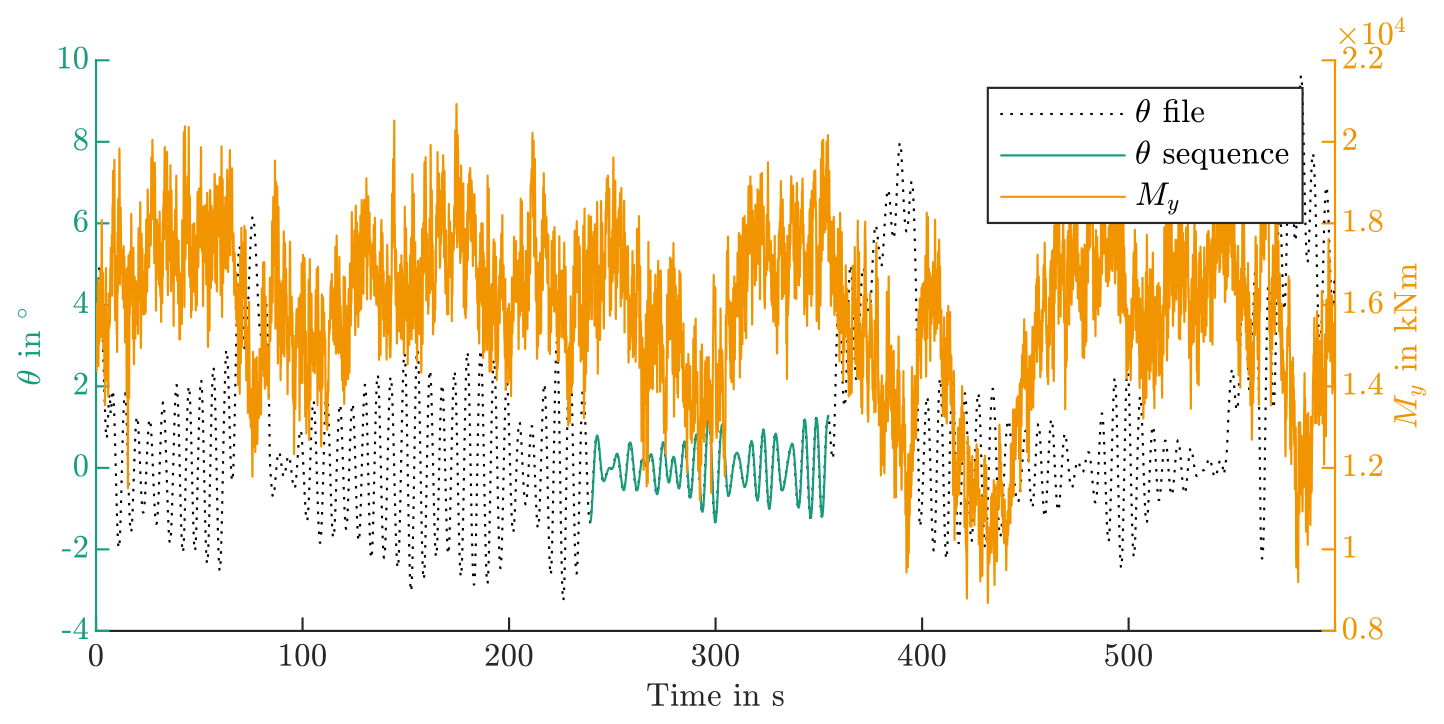
Table 11 lists the properties of the two sequences. Their few cycles and proximity to assumed protection runs result in a possibly low wear risk. However, this evaluation is based on experiences with ball bearings; hence it is reasonable to conduct a practical evaluation for roller bearings.
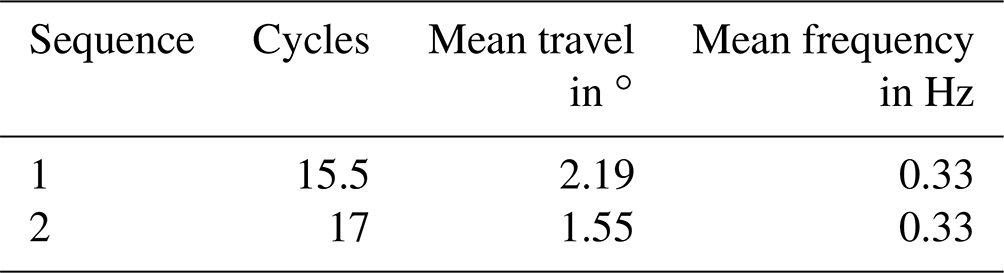
Similar to the standstill program, the algorithm from Stammler (2020) then builds test time series. Each sequence is repeated 154 times, which results in 5005 critical cycles in the test program. The final duration of the pitch cycle program is 2.1 d. The contact pressure P at 0∘ is in the range from 1 GPa to 1.5 GPa for the entire test. Figure 16 displays θ and My of the second test day at different zoom levels. The top graph shows the maximum pitch travels Δθ each 15 min. The red and green rectangles indicate the time window of the mid-resolution plots in the center of the figure. In each of these, the rectangles again indicate the time window of the lowermost plots, which show 1 min each.
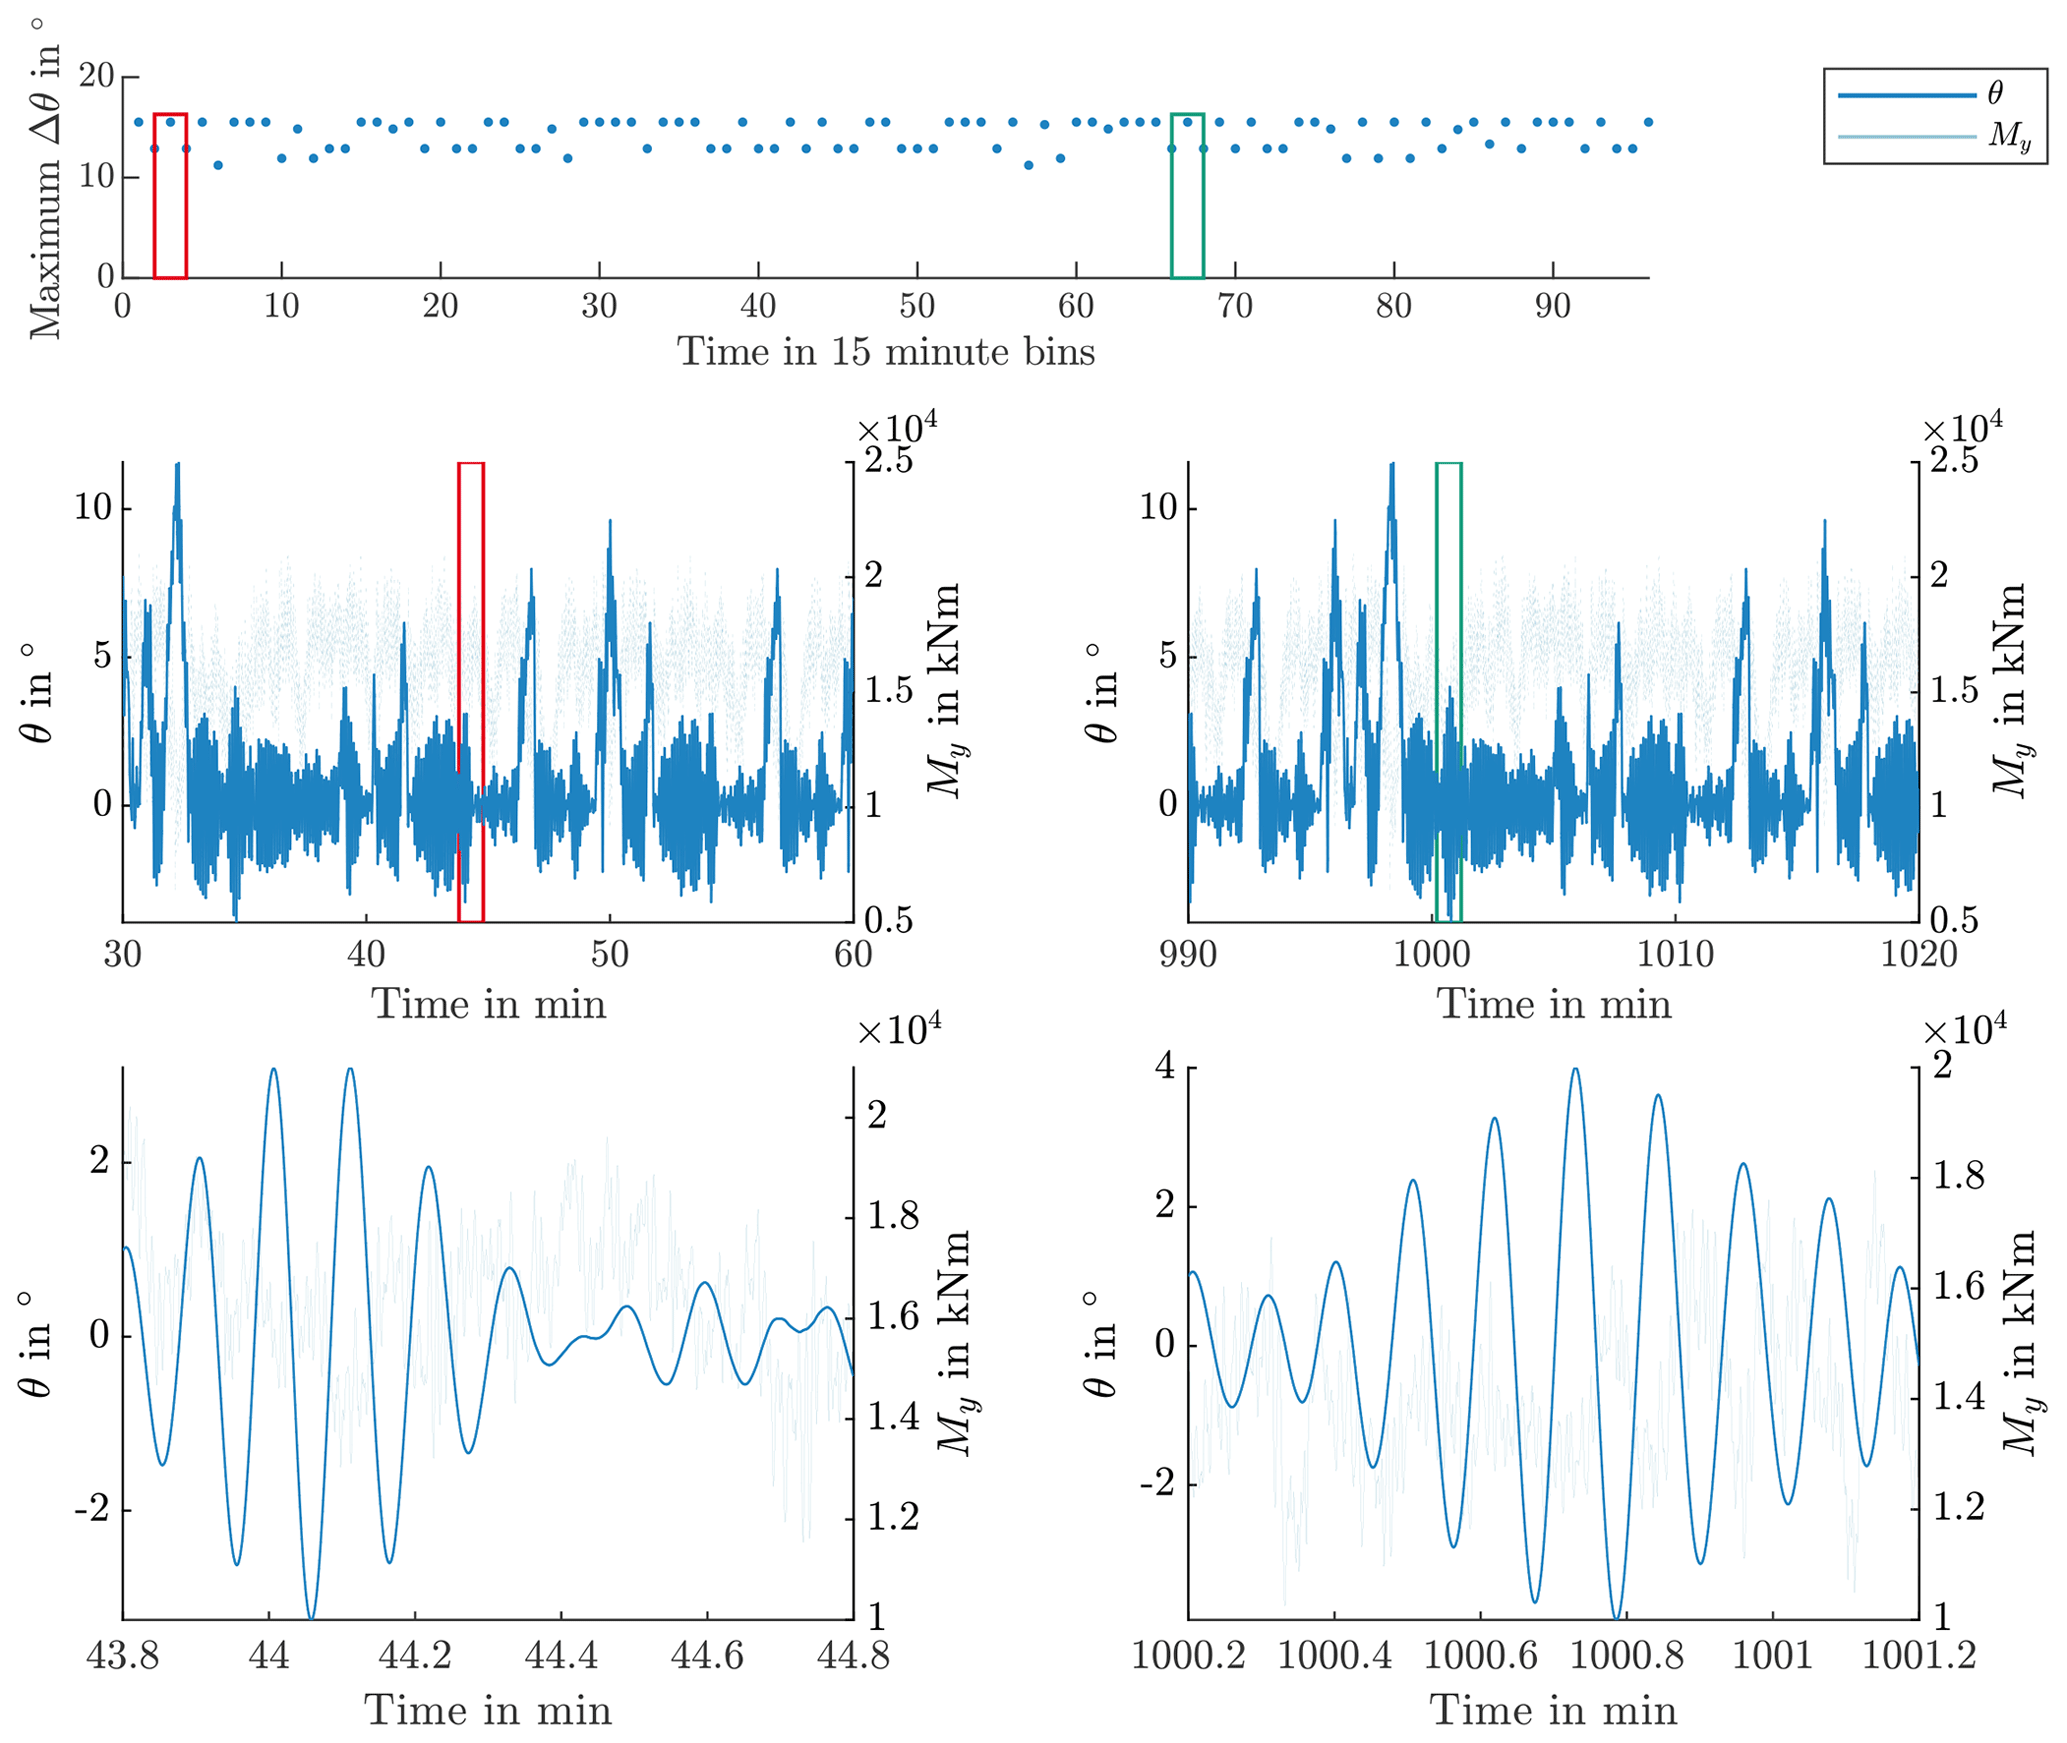
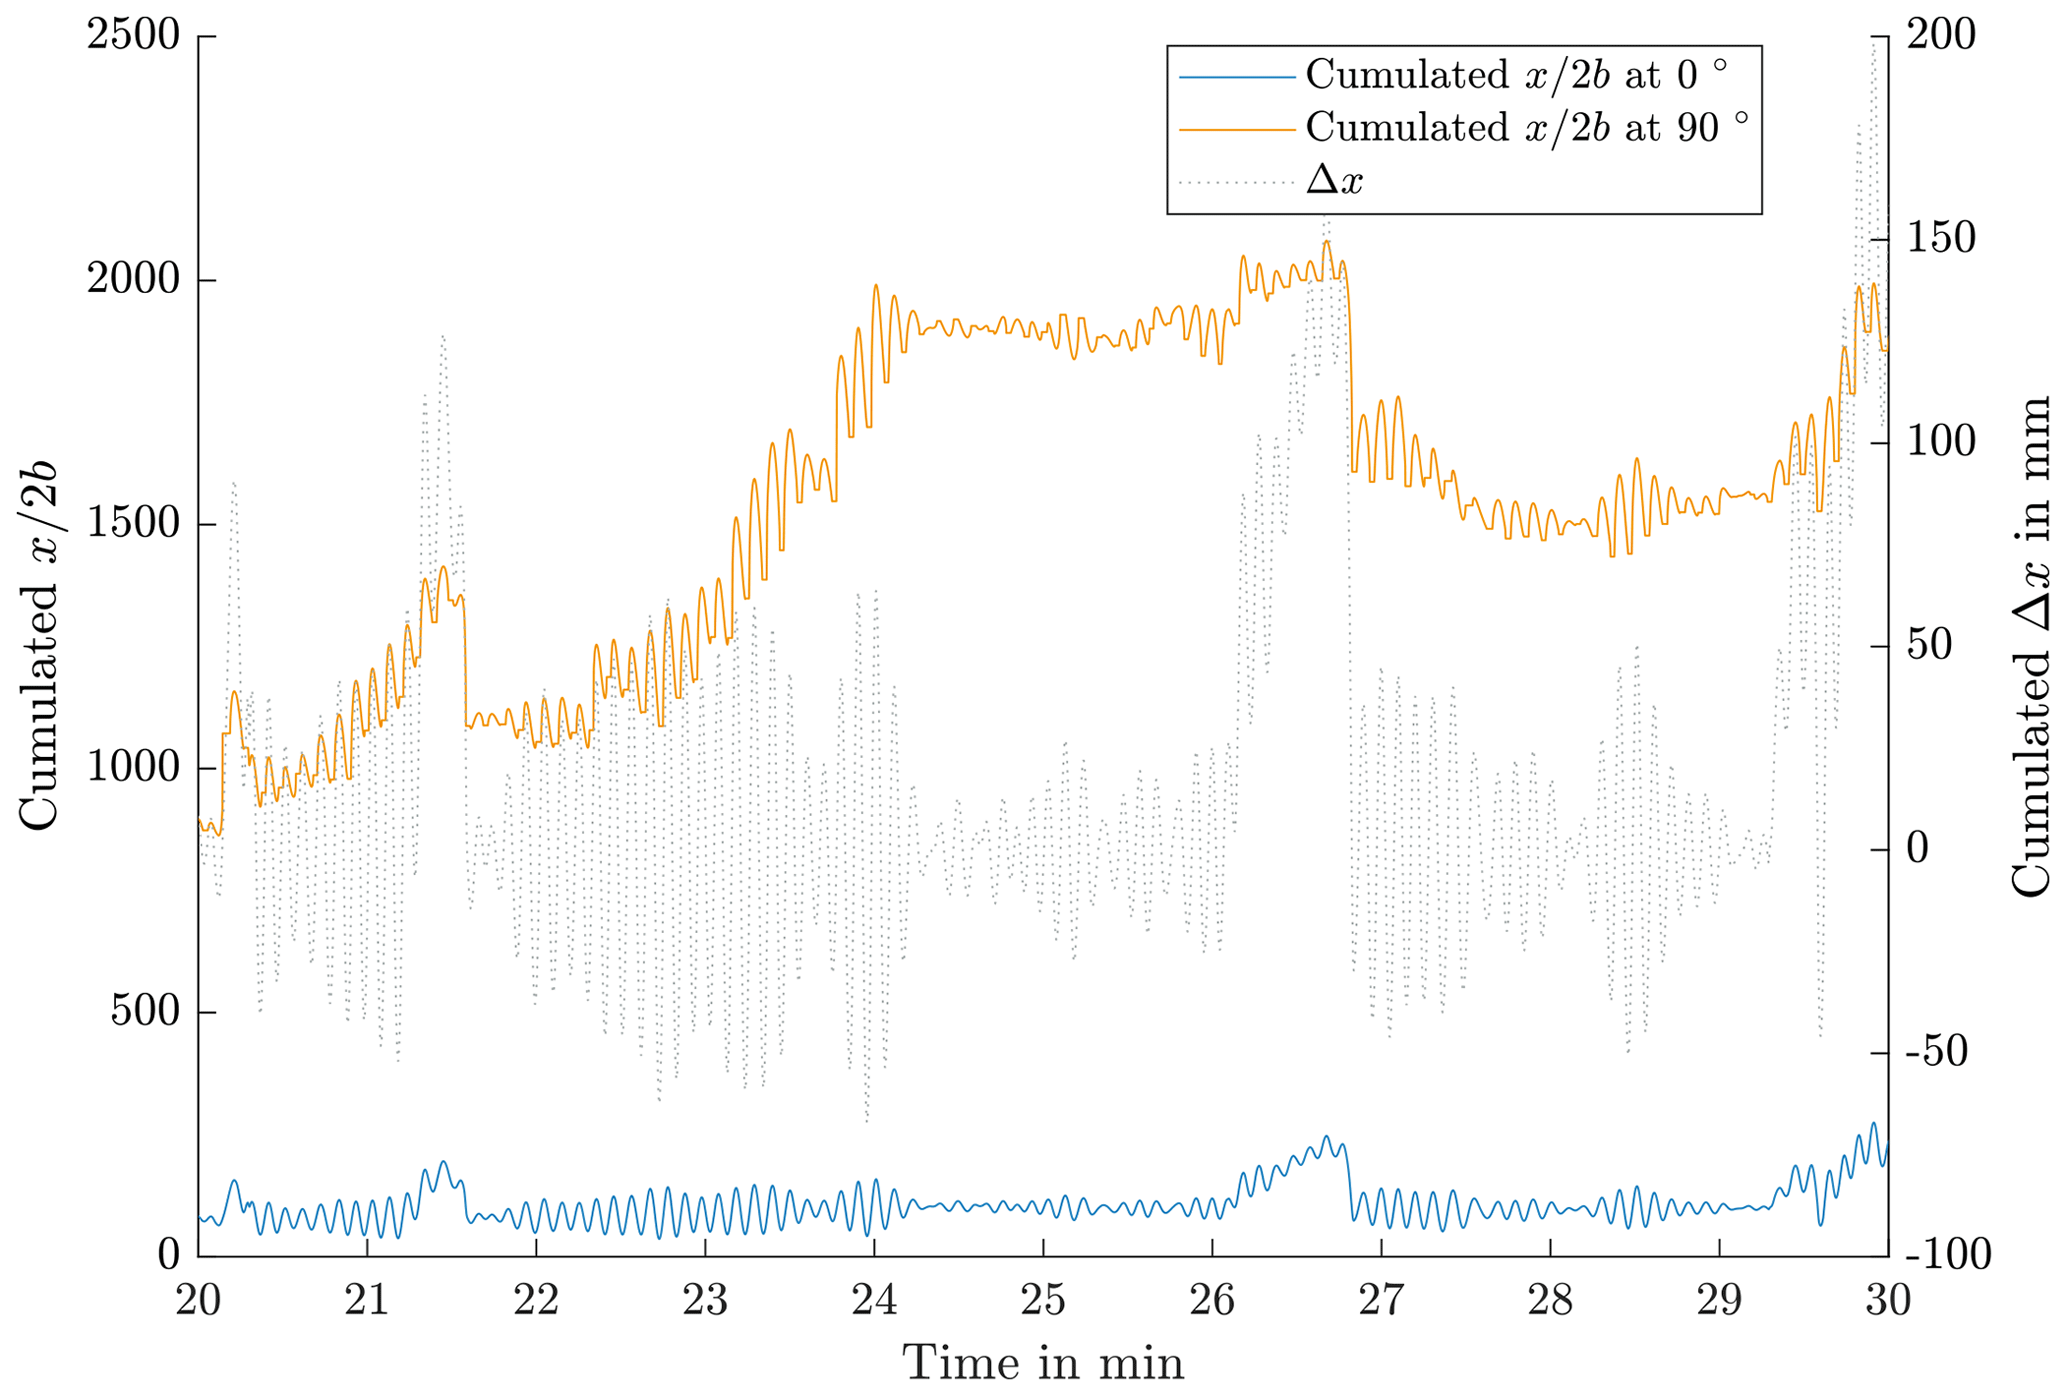
Ratios of are used in several publications to describe amplitudes of oscillations. In the case of time series with dynamic loads, these ratios have to be calculated per individual time step. Figure 17 shows the exemplary results for 30 min of the pitch cycle test run. The values are the cumulated sums of stepwise calculations of for the 0∘ and the 90∘ positions, calculated with Eqs. (4) and (10). The dotted grey line shows cumulated Δx. Δx obtains negative values when Δθ is negative. The increase in the values at 90∘ is to be noted; it is caused by continuously different load situations on the upward and downward slopes of the pitch movement. This changes the values of 2b and with it the values of . The values at 0∘ increase as well but at a significantly lower rate. In tests with steady load situations, such increases do not occur. The values of for individual cycles during the critical sequences are at approximately 20, which is below the threshold of the protection runs mentioned above.
This study presents a new approach for creating a wear test program specifically designed for roller-type blade bearings. The program covers two distinct operational scenarios: the standstill of the bearing under rated speed and the active pitch cycles caused by the IPC. This study builds on previous work by including the operation under bearing standstill, which has not been covered in previous wear test programs for pitch bearings. To achieve this, a combination of aero-elastic simulation data and wind speed measurement data is used to capture short-term and long-term operational characteristics of the bearing.
In pitch bearings with geared drives, torsional moments at the blade root can cause movement within the gear backlash. This phenomenon is commonly not accounted for in aero-elastic simulations. To address this issue, this study proposes a method to include such movements in the time series. It further suggests a doubling of the amplitude of these movements and uses the output as set points for the pitch drive. This approach can force the bearing into a movement that equals the one caused by the blade root moment Mz and overcomes the pitch drive's own backlash. By including these movements in the test program, the wear behavior of the pitch bearings under realistic operating conditions can be assessed more accurately.
To take account of the lack of operational experiences with roller-type blade bearings, the process includes sensitivity analysis of three key parameters: the travel of an effective protection run θp, the short-term minimum load cycles that contribute to wear progression nmin,s, and the long-term minimum cycles before interruption by a protection run nmin. The proposed method is demonstrated on the IWT7.5-164 reference turbine, using a mix of simulation results from CPC and IPC variants to mimic current commercial controller strategies. Results show that within the range of 3–9∘ and 5–10 cycles for θp and nmin,s, respectively, these parameters have no significant influence on the wear test program. The parameter nmin has a limited influence on the test duration. However, it should be noted that these results are specific to the chosen turbine and may not necessarily apply to other turbines.
The standstill part of the program follows the initial idea of combining standstill periods and protection runs to interrupt them. It has a duration of approximately 30 d. During this period, the contact pressures are maintained at 0.9–1.5 GPa for most of the test time at 0∘, while ranging from 0 GPa to approximately 1 GPa at 90∘. Although these pressures exceed those used in Pittroff's experiments (Pittroff, 1961), it is worth noting that Pittroff's experiments were performed with less-advanced lubricants, and it can be questioned whether the load levels at the 90∘ position are sufficient to cause noticeable wear damages. As Lin et al. (2022) have pointed out, ZDDP additives, commonly used in modern commercial lubricants, play a crucial role in preventing wear under standstill conditions. The load cycle count in this study is 275 000, which is comparable to that used in Pittroff and Lin's (Pittroff, 1961; Lin et al., 2022) experiments involving standstill and load oscillations.
The pitch cycle part of the program follows the procedure described in Stammler (2020) with some modifications. In the present study, the selection of sequences is done manually, and the number of cycles is limited to 5000, making it a risk assessment rather than an endurance test. Based on experience from ball bearings, the probability of wear is expected to be very low, as the program includes over 300 protection runs. Additionally, an analysis of ratios at different circumferential positions indicates the potential for different slip regimes, which could cause the rolling body set to move overall and further reduce the probability of wear.
The two program parts have a combined duration of approximately 32 d. The maximum loads and load dynamics can be realized with the planned test equipment.
Future work for this study includes several items. First, the roller bearings described in this study will undergo the entire test program, consisting of both the standstill and the pitch cycle tests, on the BEAT6.1 rig. The bearing will be equipped with inductive sensors to monitor the position of the rolling body set throughout the test. Secondly, turbine starts and stops will be included into the test time series, as they were not part of the input data used in this study. Thirdly, the overall load level is low, and there is a possibility of upscaling the loads as both the bearing and the test equipment can sustain higher loads. Increasing the load level may yield more informative results. Finally, the process of the test program creation will be applied to other turbines in the future.
The time series data of the aero-elastic simulations are available from the author upon request. The time series of the final test program are publicly available at Fraunhofer Fordatis repository https://doi.org/10.24406/fordatis/253 (Stammler, 2023).
The author has declared that there are no competing interests.
Publisher’s note: Copernicus Publications remains neutral with regard to jurisdictional claims made in the text, published maps, institutional affiliations, or any other geographical representation in this paper. While Copernicus Publications makes every effort to include appropriate place names, the final responsibility lies with the authors.
This work was carried out within the HAPT2 project. The wear mark photos in Fig. 3 are used with permission by Markus Grebe and Sebastian Wandel and are kindly acknowledged as well. The author would also like to thank Arne Bartschat and Eike Blechschmidt for gleeful in-depth conversations about the big and little kinks in the overall process. Niklas Requate's time series are the base of the case study in this paper, and the author is grateful for the permission to use them.
The real-scale blade bearing tests are a team effort. The author counts himself lucky to have superb colleagues at Fraunhofer IWES’ Large Bearing Laboratory and thanks the following people very much for their support in past and future test runs: Nils Thormählen, Heinrich Drath, Oliver Menck, Karsten Behnke, Matthis Graßmann, and Florian Schleich.
This research has been supported by the Bundesministerium für Wirtschaft und Klimaschutz (grant no. 03EE2033A).
This paper was edited by Weifei Hu and reviewed by Jonathan Keller and Markus Grebe.
FVA: Reaktionsschichtbildung: Verschleiß- und Reibungsminderung durch Reaktionsschichtbildung bei langsamlaufenden Wälzlagern und Zahnrädern, Forschungsvorhaben 126 I, Frankfurt, 1988. a
FVA: Reaktionsschichtbildung: Verschleiß – und Reibungsminderung durch Reaktionsschichtbildung bei langsamlaufenden Wälzlagern und Zahnrädern, Forschungsvorhaben 126/II, Frankfurt, 1991. a
FVA: Schmierstoffeinfluss Wälzlagerbauart: Einfluss des Schmierstoffes auf das Verschleißverhalten verschiedener Wälzlagerbauarten, Forschungsvorhaben 327/II, Frankfurt, 2007. a
FVA: False Brinelling: Stillstehende fettgeschmierte Wälzlager unter dynamischer Belastung, Forschungsvorhaben 540/I, Frankfurt, 2010. a
Behnke, K. and Schleich, F.: Exploring limiting factors of wear in pitch bearings of wind turbines with real-scale tests, Wind Energ. Sci., 8, 289–301, https://doi.org/10.5194/wes-8-289-2023, 2023. a, b, c, d
Bottasso, C. L., Croce, A., Riboldi, C. E. D., and Salvetti, M.: Cyclic pitch control for the reduction of ultimate loads on wind turbines, J. Phys. Conf. Ser., 524, 12063, https://doi.org/10.1088/1742-6596/524/1/012063, 2014. a
Breward, M. J.: Lagerlebensdauer bei Schwingungsbeanspruchung, SKF Kugellager-Zeitschrift, 1973. a
Burton, T.: Wind Energy Handbook, Wiley, Chichester and New York, 2nd edn., ISBN 978-0-470-69975-1, 2011. a, b
de La Presilla, R., Wandel, S., Stammler, M., Grebe, M., Poll, G., and Glavatskih, S.: Oscillating rolling element bearings: A review of tribotesting and analysis approaches, Tribol. Int., 188, 108805, https://doi.org/10.1016/j.triboint.2023.108805, 2023. a, b, c
DIN: Mechanisch-dynamische Prüfung auf dem Wälzlagerschmierstoff-Prüfgerät FE8 – Teil 1: Allgemeine Arbeitsgrundlagen, DIN 51819-1, 1999. a
Fangyuan: Fangyuan Blade Bearing Test Rig, http://www.cfmif.com/n8911c52.aspx (last access: 14 September 2019), 2019. a
Fischer, J. and Mönnig, P.: Challenges for the design process of pitch bearings and contribution of test benches, Conference for Wind Power Drives, Aachen, ISBN 978-3-7481-7867-5, 2019. a
Grebe, M.: False Brinelling – Standstill marks at roller bearings, Dissertation, Slovak University of Technology, Bratislava, 2012. a
Grebe, M., Molter, J., Schwack, F., and Poll, G.: Damage mechanisms in pivoting rolling bearings and their differentiation and simulation, Bearing World Journal, 3, 71–86, 2018. a
Harris, T., Rumbarger, J. H., and Butterfield, C. P.: Wind Turbine Design Guideline DG03: Yaw and Pitch Rolling Bearing Life, NREL/TP-500-42362, NREL, Golden, Colorado, https://doi.org/10.2172/969722, 2009. a, b
Harris, T. A. and Kotzalas, M. N.: Rolling bearing analysis, CRC, Taylor & Francis, Boca Raton, fifth edn., ISBN 0-8493-7183-x, 2007. a, b
IEC: Wind turbines – Part 1: Design requirements, IEC61400-1 (4th edition), 2019. a
Lin, C.-L., Fallahnezhad, K., Brinji, O., and Meehan, P. A.: Mitigation of False Brinelling in a Roller Bearing: A Case Study of Four Types of Greases, Tribol. Lett., 70, https://doi.org/10.1007/s11249-021-01557-0, 2022. a, b, c
Lüneburg, B., Becker, D., and Handreck, T.: Avoidance of bearing damages by determining and evaluating the influence of companion structures on the characteristics of large diameter bearings, in: VDI-Konferenz: Schadensmechanismen in Lagern, 9–10 July 2014, Aachen, Germany, 2014. a
Njoya, G.: Riffelbildung in Losradlagerungen – Theoretische und experimentelle Untersuchung, Antriebstechnik, 1982, 308–312, 1982. a
Pittroff, H.: Riffelbildung bei Wälzlagern infolge Stillstandserschütterungen, PhD thesis, Technische Hochschule München, Munich, 1961. a, b, c
Popko, W.: Aero-Elastic Simulation Time Series of IWT7.5 Reference Turbine, https://doi.org/10.24406/fordatis/113, 2019. a
Requate, N., Wiens, M., and Meyer, T.: A Structured Wind Turbine Controller Evaluation Process Embedded into the V-Model for System Development, J. Phys. Conf. Ser., 1618, 022045, https://doi.org/10.1088/1742-6596/1618/2/022045, 2020. a, b
Rollix: Solutions&co – Pays de la Loire, https://www.youtube.com/watch?v=TOKYZN-XZt8 (last access: 15 October 2017), 2017. a
Schwack, F.: Untersuchungen zum Betriebsverhalten oszillierender Wälzlager am Beispiel von Rotorblattlagern in Windenergieanlagen, PhD thesis, Leibniz University Hanover, Hannover, https://doi.org/10.15488/9756, 2020. a
Schwack, F., Byckov, A., Bader, N., and Poll, G.: Time-dependent analyses of wear in oscillating bearing applications, STLE Annual Meeting, 21–25 May 2017, Atlanta, USA, 2017. a
Schwack, F., Bader, N., Leckner, J., Demaille, C., and Poll, G.: A study of grease lubricants under wind turbine pitch bearing conditions, Wear, 454–455, 203335, https://doi.org/10.1016/j.wear.2020.203335, 2020. a
Schwack, F., Halmos, F., Stammler, M., Poll, G., and Glavatskih, S.: Wear in wind turbine pitch bearings – A comparative design study, Wind Energy, 700–718, https://doi.org/10.1002/we.2693, 2021. a, b, c
Shanghai Oujikete: Fatigue Test of Pitch Bearing (033.50.2410) for 2.5 MW 3 MW Wind Turbines under Full Loads Completed, http://en.oujichina.com/kete_news_detail/newsId=1b4e74a1-a64d-46a7-b54a-5ec28d9271bb&comp_stats=comp-FrontNews_list01-1311739208979.html (last access: 23 September 2013), 2012. a
Song, W. and Karikari-Boateng, K. A.: Enhanced test strategy of pitch bearing based on detailed motion profile, Forschung auf dem Gebiete des Ingenieurwesens, 85, 973–983, https://doi.org/10.1007/s10010-021-00487-6, 2021. a, b
Stammler, M.: Endurance Test Strategies for Pitch Bearings of Wind Turbines, Fraunhofer Verlag, Stuttgart, ISBN 978-3-8396-1642-0, 2020. a, b, c, d, e, f, g, h, i, j, k, l, m, n, o, p, q, r, s, t, u, v, w, x, y, z, aa
Stammler, M.: Time Series of Test Program, Fraunhofer [data set], https://doi.org/10.24406/fordatis/253, 2023. a
Stammler, M. and Poll, G.: Schadensmechanismen in Rotorblattlagern, GfT Fachtagung, 21–22 September 2014, Göttigen, Germany, 2014. a
Stammler, M., Reuter, A., and Poll, G.: Cycle counting of roller bearing oscillations – case study of wind turbine individual pitching system, Renewable Energy Focus, 25, 40–47, https://doi.org/10.1016/j.ref.2018.02.004, 2018. a
Stammler, M., Poll, G., and Reuter, A.: The influence of oscillation sequences on rolling bearing wear, Bearing World Journal, 4, 19–25, 2019a. a, b, c, d, e
Stammler, M., Thomas, P., Reuter, A., Schwack, F., and Poll, G.: Effect of load reduction mechanisms on loads and blade bearing movements of wind turbines, Wind Energy, 6, 119, https://doi.org/10.1002/we.2428, 2019b. a, b
Vries, E.: Close up – Testing the V164 80-metre blade, WindPower Monthly, 2013, http://www.windpowermonthly.com/news/indepth/1166174/Close---Testing-V164-80-metre-blade/ (last access: 24 January 2013), 2013. a
Vries, E.: Roller bearings for longer turbine lifespans, WindPower Monthly, 2019, https://www.windpowermonthly.com/article/1591970/roller-bearings-longer-turbine-lifespans (last access: 22 November 2022), 2019. a
Wandel, S., Bader, N., Schwack, F., Glodowski, J., Lehnhardt, B., and Poll, G.: Starvation and relubrication mechanisms in grease lubricated oscillating bearings, Tribol. Int., 165, 107276, https://doi.org/10.1016/j.triboint.2021.107276, 2022. a, b
Wandel, S., Bartschat, A., Glodowski, J., Bader, N., and Poll, G.: Wear Development in Oscillating Rolling Element Bearings, Lubricants, 11, 117, https://doi.org/10.3390/lubricants11030117, 2023. a