the Creative Commons Attribution 4.0 License.
the Creative Commons Attribution 4.0 License.
 | 08 May 2023
Comparison of optimal power production and operation of unmoored floating offshore wind turbines and energy ships
Curran Crawford
As the need to transition from global reliance on fossil fuels grows, solutions for producing green alternative fuels are necessary. These fuels will be especially important for hard-to-decarbonize sectors such as shipping. Mobile offshore wind energy systems (MOWESs) have been proposed as one such solution. These systems aim to harness the far-offshore wind resource, which is abundant and yet untapped because of installation and grid-connection limitations. Two classes of MOWES have been proposed in the literature: unmoored floating offshore wind turbines (UFOWTs) and energy ships (ESs). Both systems operate as autonomous power-to-X (PtX) plants, powered entirely by wind energy, and so can be used to produce synthetic green fuels such as hydrogen or ammonia, or for other energy-intensive applications such as direct air carbon capture. The two technologies differ in form; UFOWTs are based on a conventional FOWT but include propellers in place of mooring lines for course keeping, while ESs operate like a sailing ship and generate power via hydro-turbines mounted on the underside of the hull. Though much research and development is necessary for these systems to be feasible, the promise of harnessing strong winds far offshore, as well as the potential to avoid siting regulatory challenges, is enticing.
This paper develops models of each MOWES concept to compare their power production on a consistent basis. The performance of the technologies is examined at steady-state operating points across relative wind speeds and angles. An optimization scheme is used to determine the values of the control variables which define the operating point for each set of environmental conditions. Results for each model show good agreement with published results for both UFOWTs and ESs. Model results suggest that UFOWTs can generate more power than ESs under ideal environmental conditions but are very sensitive to off-design operating conditions. In above-rated wind speeds, the UFOWT is able to produce as much power as a conventional, moored FOWT, whereas the ES cannot, since some power is always consumed to spin the Flettner rotors. The models developed here and their results may both be useful in future works that focus on the routing of UFOWTs or holistically designing a mobile UFOWT. Although differences in the performance of the systems have been identified, more work is necessary to discern which is a more viable producer of green electrofuels (e-fuels).
- Article
(5864 KB) - Full-text XML
- BibTeX
- EndNote


Renewable fuels are an essential part of decarbonizing many sectors of the global economy. Although battery energy storage systems are proving to be a viable short-term storage solution, renewable electrofuels (e-fuels) are more suitable for mid- and long-term energy storage and transport applications. Some sectors, such as shipping, will need to rely heavily on the use of e-fuels to reduce their CO2 emissions to stay in line with current global emissions targets (IRENA, 2021). Far-offshore wind energy systems have been proposed as systems for producing long-duration, renewable, stored energy harnessing a resource that could not otherwise be tapped for grid-connected electric power generation (Babarit et al., 2018). Although they are less mature technologically than other renewable power-to-hydrogen systems, it has been shown that if implemented at a large enough scale, energy ships in particular can produce e-methanol at costs competitive with predicted markets (Babarit et al., 2021b).
In principle, mobile, far-offshore wind systems function similarly to other power-to-X (PtX) plants. That is, the energy in the wind is converted to electricity which is then used to power one of several processes, depending on what fuel is being produced. Many fuel-production pathways are possible, the most promising of which are the production of green hydrogen (H2), green e-methanol, and green e-ammonia (IRENA, 2021). The latter liquid hydrogen carriers can be more easily stored than neat H2 and are the frontrunners for long-distance marine transport markets. All e-fuel pathways imply electrolysis for the base green H2 production, aligning with global conventional wind electrolysis efforts and electrolyser production scale-up. Carbon based fuels (such as methanol) rely also on having available carbon dioxide (CO2) to synthesize the fuel. For produced methanol to be considered green, the CO2 must be extracted from the atmosphere, such as via direct air capture or direct ocean capture. In this case, the fuel is part of a net-zero emission cycle but with challenging system efficiencies when re-emission of the CO2 is considered at the point of fuel use (Sutter et al., 2019). Sourcing the CO2 from other processes such as point-source carbon capture will lead to lower overall emissions than fossil fuels but not net-zero emissions. Ammonia has the advantage of not being carbon based and therefore results in no direct CO2 emissions, but NOx combustion emissions and ammonia toxicity must be considered. Ammonia is already an established global commodity for fertilizer production, alongside its H2 carrier potentials. No matter the process, there is a significant electrical energy input required to synthesize e-fuels. Associated system efficiency challenges may be obviated to some extent by harnessing far-offshore wind not otherwise possible to utilize for global decarbonization efforts. Here, the focus is on the generation of renewable energy from far-offshore winds to power these processes; energy conversion and storage steps after conversion to electricity are ignored in the present work. Any significant or novel differences in fuel synthesis and storage in non-stationary conditions fall outside the scope of this work, which is instead focused on a direct comparison of wind capture modalities.
A mobile offshore wind energy system (MOWES) consists of several subsystems. In general, there are systems for energy conversion, energy storage, vessel stabilization, and auxiliary subsystems. In this work, we focus on two specific MOWES concepts: unmoored floating offshore wind turbines (UFOWTs) and energy ships (ESs). A simple depiction of each is shown in Fig. 1. Although there is dedicated research into each concept, they remain at very low levels of technological readiness (Alwan et al., 2021; Xu et al., 2021; Babarit et al., 2021b). The subsystems that are present in each technology that will be the focus of this work are the power generation system, the propulsion system, and the substructure. These subsystems require a controller to manage power production while maintaining the desired course and keeping the system within dynamical constraints. Many design aspects must also be considered for each subsystem, few of which have been explored in detail. More details of each concept are provided in the sections that follow.
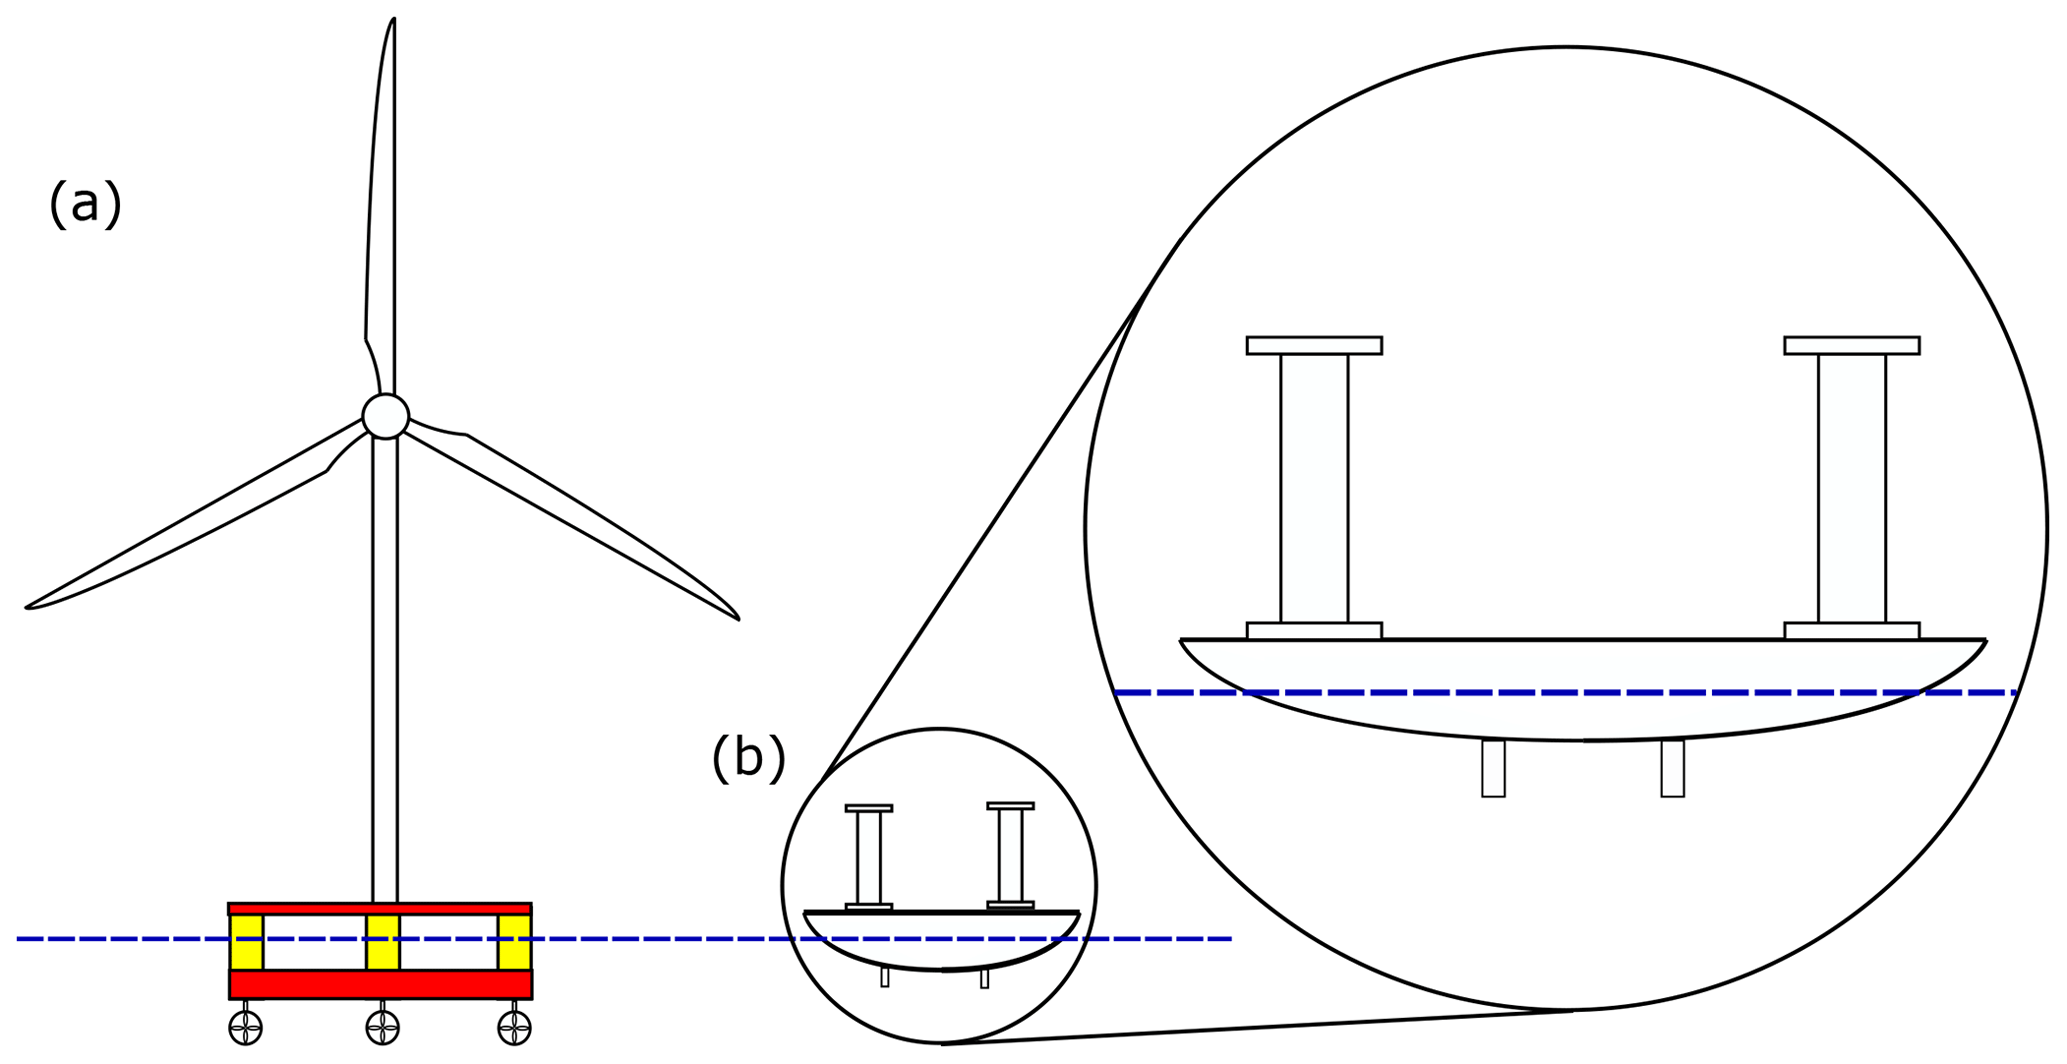
Figure 1The two types of far-offshore wind energy devices being considered: (a) an UFOWT and (b) an ES. The systems are shown to scale with one another, for the designs used herein, to show the large difference in height between the two.
MOWESs are a relatively novel concept and have some distinct differences compared to other renewables. One such difference is that existing far-offshore wind concepts are not moored, unlike conventional floating wind turbines. This eliminates the difficulty of installing the moorings in deep water sites and allows them to, in principle, operate anywhere in the open ocean. Since wind speeds are generally much higher farther from shore (e.g. Liu et al., 2008), this may drastically increase the expected capacity factor for MOWESs compared to conventional wind energy systems. The other major advantage of not being anchored to the seabed is that these systems can be mobile. This allows the system to navigate in real time to areas where wind speeds are locally highest, which may further increase expected capacity factors. Indeed, it has been shown that average capacity factors for ESs can exceed 80 % because of these two effects (Abd Jamil et al., 2019). They are also able to avoid many siting and regulatory challenges as they are classed as vessels and not permanently installed generating infrastructure. They may also periodically return to port for maintenance as opposed to being serviced at sea. Another distinct difference is that MOWESs are not designed to be grid connected. Instead, as previously mentioned, on-board PtX systems must be installed to store the generated power which must then be unloaded either in port or by vessels dedicated to retrieving the fuel. The major downside to MOWESs is that power must be consumed by the propulsion system for course keeping (Xu et al., 2021). This results in lower net power than for conventional wind turbines for given wind conditions.
1.1 Background
1.1.1 UFOWTs
The first MOWES technology considered is the UFOWT (see panel a in Fig. 1). The three main components of an UFOWT are the wind turbine, the substructure, and the thrusters. Conceptually, an UFOWT is similar to a conventional FOWT, except that the function of the mooring system is taken up by a set of thrusters mounted on the bottom of the substructure. Wind turbine and floating platform design for FOWTs is a mature area of research that can be leveraged for studying UFOWT design (e.g. Karimi et al., 2017; Grujicic et al., 2010), while existing manufacturing capabilities can be leveraged to develop scale models and prototypes. Existing FOWT designs will not be optimal for mobile operation; however, FOWT design processes may be modified to be applied to the UFOWT case. Although the wind turbine, thrusters, and platform designs should all be re-examined for a first-of-a-kind UFOWT design, this falls beyond the scope of this work. Indeed, to derive the objective functions necessary to optimize these subsystems, the power performance of a given UFOWT design must first be readily understood; this is a main goal of the present work.
Station keeping using multiple thrusters is commonly used in the form of dynamic positioning systems (DPSs) for ships. Xu et al. (2021) examined an UFOWT design that uses a DPS to maintain a constant position. They simulated the dynamics and power production of the system when subjected to constant uniform wind and stochastic waves. They showed that about 50 % of the power generated by the wind turbine is required to position the system when current loads are not considered. When also subjected to current loads, up to 80 % of the generated power is consumed for maintaining position and orientation. It was implicitly assumed in their work that the system should remain in a fixed position while operating. We will not make this assumption, working under the assumption that the UFOWT is allowed to move at constant velocity, as was assumed by Connolly and Crawford (2022). This is motivated by the work of Gaunaa et al. (2009), which shows that there are potential cases where a moving system of this type can generate more power than a stationary one. In fact, the optimal operation of such a system depends on design and could be either propelling the UFOWT upwind or allowing the UFOWT to drift downwind (Connolly and Crawford, 2022). Mobile operation introduces new problems that are not present for moored FOWTs, such as weather routing and logistics, both of which will require further study in the future.
Another difference in methodology is that previous works have assumed that the wind turbine operation should adhere to a conventional wind turbine power curve or simply scale based on constant thrust and power coefficients. Instead we will perform an optimization over possible operating points (ranges of tip-speed ratio λ and blade pitch β). This is motivated by the fact that in the case of an UFOWT, power must be consumed to prevent the turbine from drifting in the wind direction, introducing a direct trade-off between the net power produced by the UFOWT and the thrust force on the turbine. In principle an UFOWT-specific rotor design could be pursued to balance power production and thrust characteristics. However, here an established wind turbine design is used, but its operation is optimized for the case of a mobile UFOWT.
Other works have also looked at UFOWT systems. Martínez Beseler (2020) considered a similar system referred to as an autonomously driven offshore wind turbine (ADO-WT). For the ADO-WT, the wind turbine was mounted on a catamaran hull instead of a conventional floating platform (i.e. spar or semi-submersible), allowing it to move through the water with less resistance. This is similar to a design proposed by Annan et al. (2020) called Wind Trawler. The premise of Wind Trawler is to generate additional power from the motion of the UFOWT by way of hydro-turbines mounted under the hull; Wind Trawler combines some aspects of an UFOWT and an ES. It is shown that Wind Trawler can produce more power than a conventional, stationary wind turbine; however, the cost of installing hydro-turbines and propellers has not yet been considered. Willeke (2021) examined the dynamics of a spar-based UFOWT system and showed the necessity of using thrusters to stabilize the system. Without thrusters, they showed that the turbine yaws uncontrollably. They turn to redesigning the platform as a means to give the platform additional rotational stability. This is evidence that existing platform designs may not be ideal for mobile operation; however, the problem of platform design is not one we will focus on. In addition, a semi-submersible platform is used here which should provide more resistance to yaw motions than a spar. An effective stiffness in yaw may also be achieved through control of the propellers, as was done by Xu et al. (2021). Alwan et al. (2021) have also proposed methods for modelling an UFOWT in steady state. As was the case for Xu et al. (2021), they assume that the system should remain stationary during operation. They also consider the mean drift wave loading on the system and show that at high wind speeds it may dominate over other forces such as wind turbine thrust force. It is expected that the mean drift force experienced by a barge-type platform, as was used in their work, will be much higher than that on a semi-submersible platform. Since we have chosen to use a semi-submersible platform, mean drift loads will be ignored in our main analyses but are included in a separate section. The computation of mean drift loads is not straightforward for a mobile UFOWT, since the platform will encounter the waves at different frequencies depending on the direction and velocity of the UFOWT relative to incident waves.
1.1.2 Energy ships
An ES functions by using the energy in the wind to propel the vessel and converting the motive power of the vessel through the water to electrical power by way of hydro-turbines. This power is then used in a PtX process, and the produced fuel is stored on board. In principle, an ES could make use of several different technologies to propel the vessel including rigid sails, turbosails, Flettner rotors, or parafoils. These options were examined and compared in a study by Clodic et al. (2018) that determined that all of them may be feasible, but each have unique pros and cons. Wind propulsion technologies are maturing thanks to a growing interest in them as a method of decarbonizing the shipping sector, with a number of full-scale Flettner-rotor-equipped ships in operation (Pearson, 2014; Rojon and Dieperink, 2014). Studies by Babarit et al. (2021b, 2020b) have examined an ES design known as FARWIND which employs Flettner rotors. These studies demonstrate the expected power performance and economic case for the FARWIND ES concept. A key finding of these works is that ESs can produce green e-methanol at a competitive cost once fleets of hundreds of GW-scale operating capacity are reached. Experimental work has further shown that ESs can produce similar amounts of electricity to conventional wind turbines (Babarit et al., 2021a). Power performance models presented herein are adapted from the work of Babarit et al. (2021b). In general, ESs must move at significant speeds in order to create the relative flow past the hydro-turbines; wave and slamming loads in more extreme sea states may therefore limit the practical sailing conditions possible and require further investigation (Jacobi et al., 2014).
A key problem for MOWES, which has been studied for the case of ESs, is weather routing. Routing for ESs (and also UFOWTs) differs from that of conventional ship routing. Courses for ships are typically chosen to minimize travel time as well as the fuel consumption, thus minimizing operating costs and emissions (Wang et al., 2019). In the case of ESs, the objective is instead to maximize power production along the voyage, while ensuring that the vessel is able to offload the produced fuel. Abd Jamil et al. (2019) developed a method for optimizing the routes of ESs based on available wind speed data. This study showed that ESs can achieve very high capacity factors when optimal routes are followed. A subsequent study showed that ESs may also be used to supply power to small, coastal communities but that capacity factors may be significantly lower in near-shore operation (Abd Jamil et al., 2021). There is clearly a large scope for future work to optimize routing based on fuel production and offload, operation and maintenance (O&M), and wind and sea-state forecasts. This is an area of potential advantage for ESs over UFOWTs, since UFOWTs will tend to drift at slower speeds and so may need to expend more energy to return to port or otherwise be at the mercy of local weather systems.
1.2 Objective
Although some research exists on modelling, design, and operation of each individual kind of MOWES, there is so far little effort given to comparing these systems as each proponent only considers their preferred approach. There is also insufficient modelling directed towards UFOWTs in general, so far mostly ignoring the possibility of allowing them to be mobile rather than station-kept. Herein, we endeavour to provide a consistent basis to compare these different classes of MOWESs. This consists of steady-state, power performance models of each system in 2 degrees of freedom. By constructing these models and comparing their results we provide a foundation for the more specific and detailed research into these kinds of systems that is necessary to bring them to higher levels of technology readiness.
In Sect. 2 the general modelling methodology is presented, and the preliminary system designs are outlined. Results for the performance of the two systems are presented in Sect. 3 and are compared to one another as well as the steady-state performance of a reference conventional floating wind turbine (Gaertner et al., 2020). The implications of the differences between the two concepts and the limitations of the models are discussed in Sect. 4, and the findings of this work are summarized in Sect. 5.
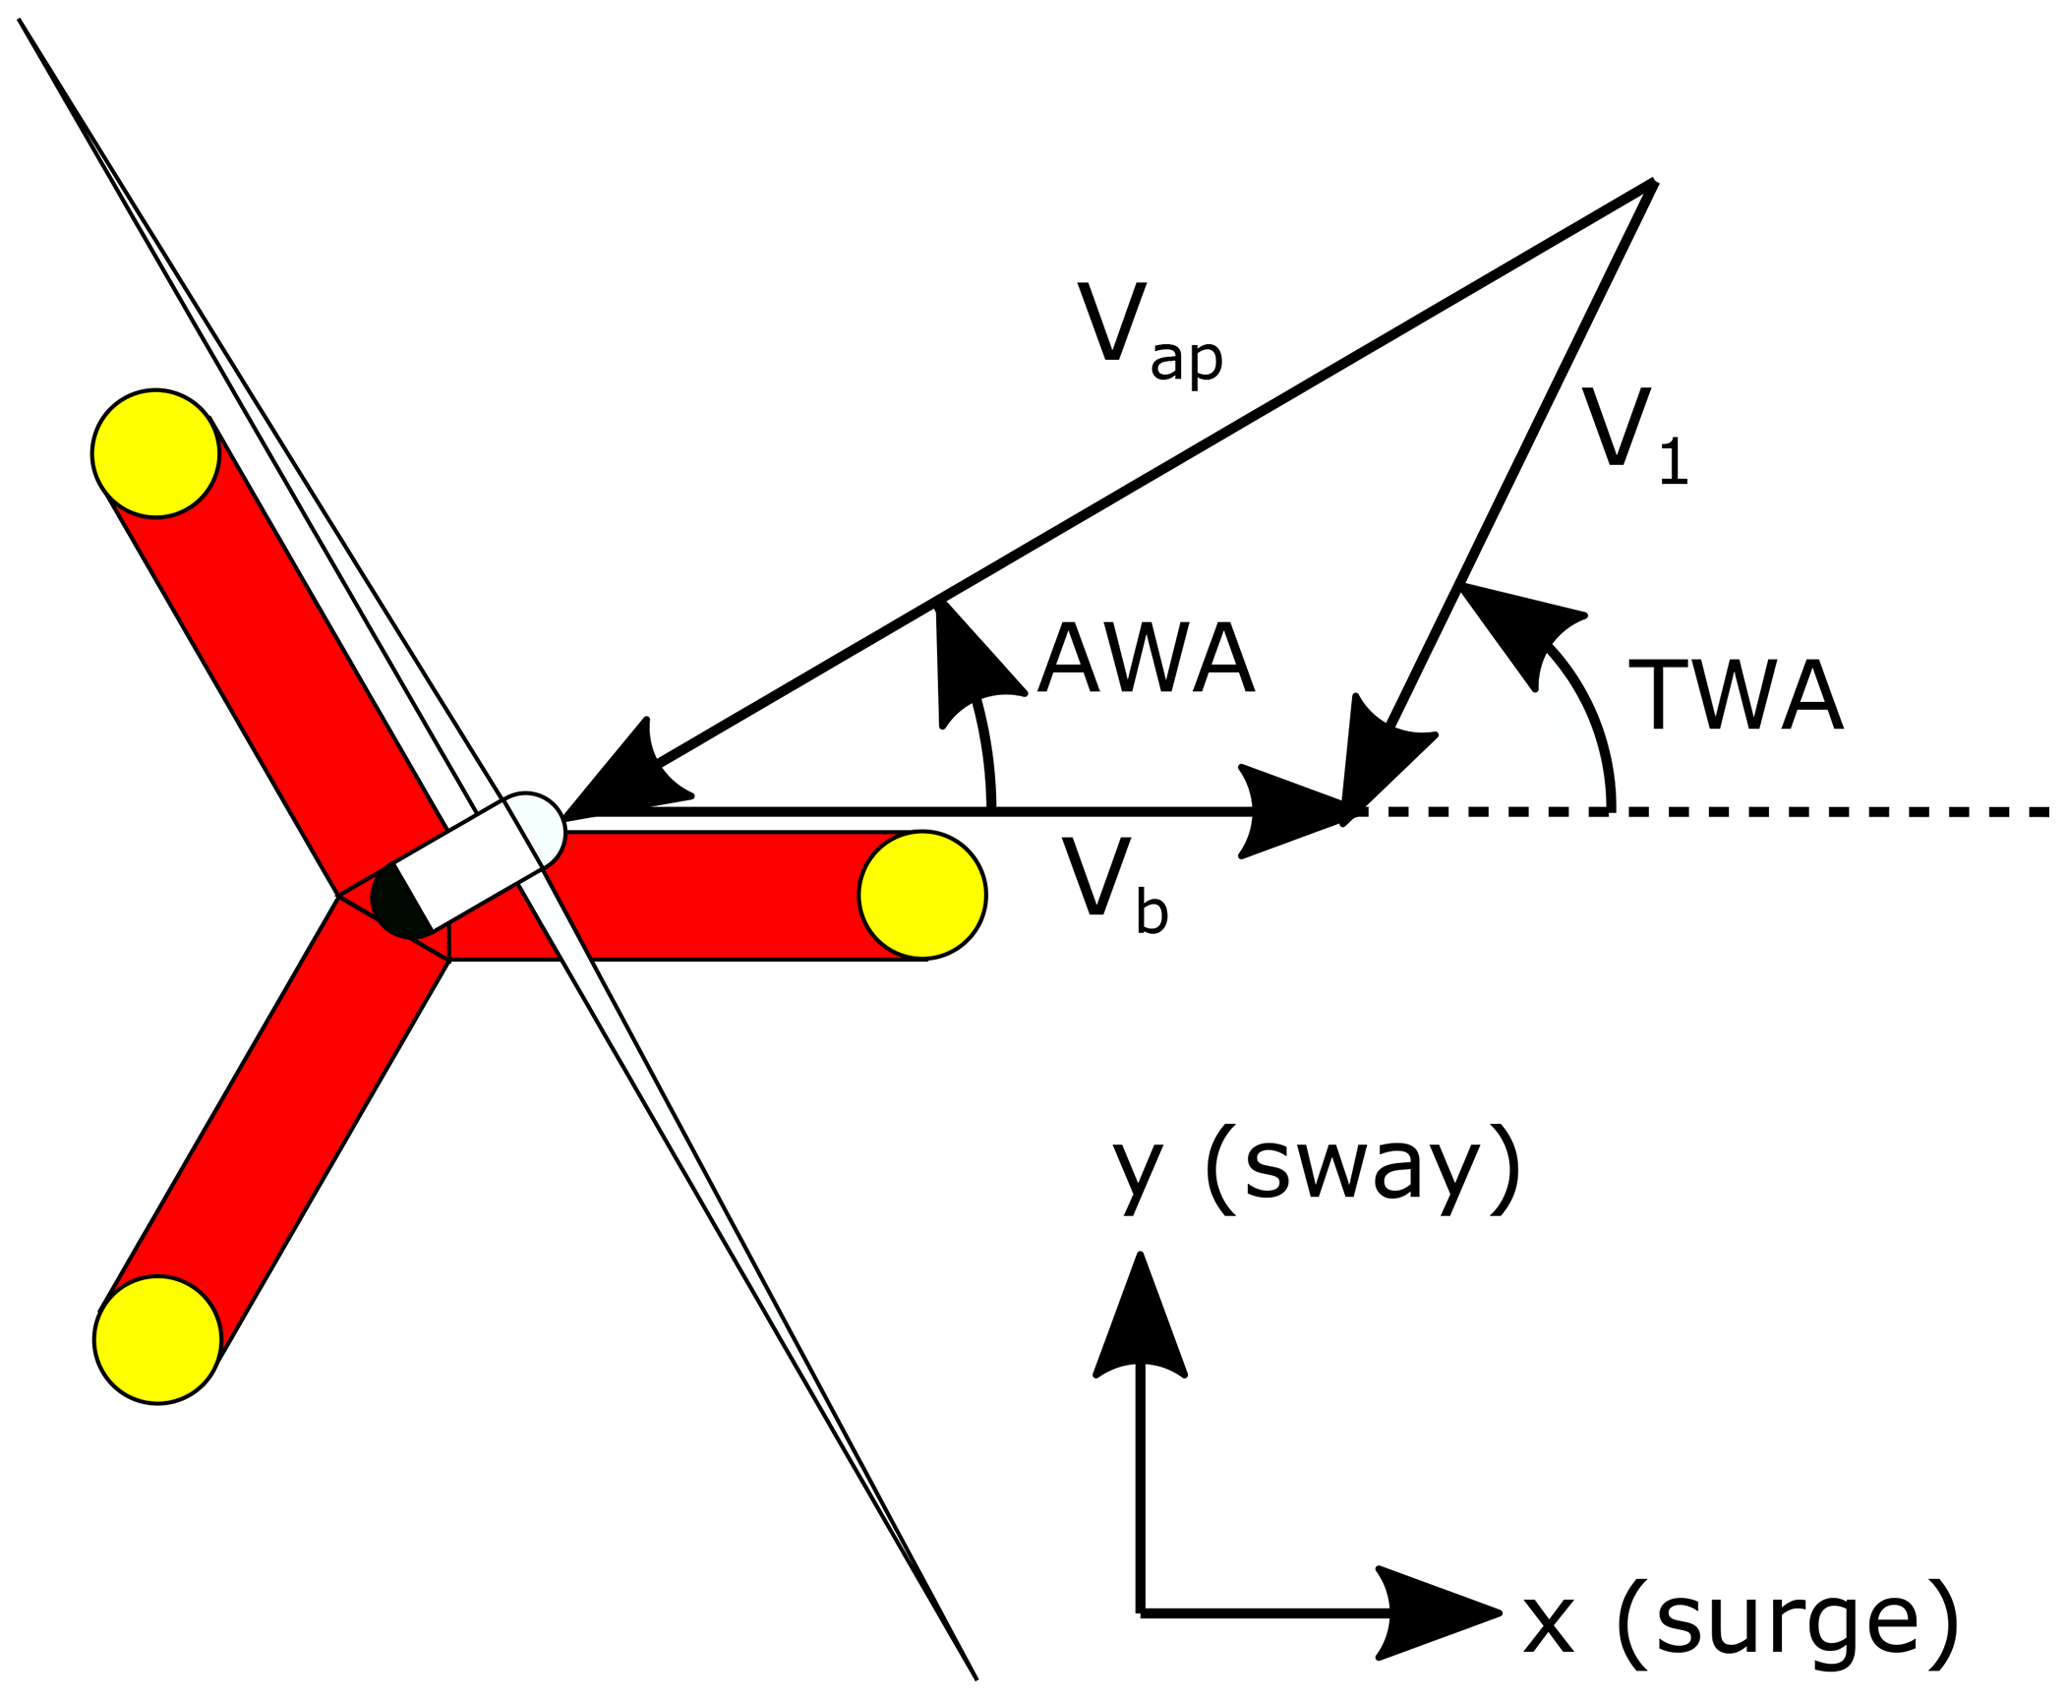
The goal of a far-offshore wind energy system is ultimately to harness the power from a velocity difference between two media and convert it to a usable form. Throughout we will refer to the air as medium 1 and the water as medium 2. Number subscripts are used to refer to each of these media. For example V1 refers to the velocity of the wind, as seen from a stationary reference frame, also commonly referred to as true wind speed (TWS or V1). The speed of the vessel is denoted as Vb and is always directed in the +x direction. The angle between the true wind and heading of the vessel is referred to as the true wind angle (TWA). Wind speed as experienced by the vessel is referred to as the apparent wind speed (Vap), and the angle between this and the vessel heading is known as the apparent wind angle (AWA). By convention, the vessel heading is always in the +x direction, and the true wind angle is measured positive anticlockwise, with 0∘ corresponding to a direct headwind (i.e. sailing directly upwind) as shown in Fig. 2.
In developing the models, each system (UFOWT and ES) is considered to be composed of several subsystems. Each component contributes a force on the system as a whole and may also contribute to the net power of the system. The subsystems considered here are a power generation technology (subscript g), a propulsion technology (subscript p), and a substructure (subscript d). Although in principle the water will be moving at a velocity (V2) due to currents, for this work it is assumed that there is no ocean current (i.e. V2=0). It has been shown that ocean surface currents will have an impact on the power production of UFOWTs; however, here it is neglected for simplicity (Xu et al., 2021; Connolly and Crawford, 2022). Both an UFOWT and an ES will be considered. The models of each system are presented in the sections that follow.
To assess the performance of each technology, the net power output of the system is calculated over a range of environmental conditions. The forces on the system are modelled in two dimensions (surge and sway), and it is assumed that the system is operating at steady state (Eq. 1).
Since the model presented is for steady-state solutions, time-varying components of environmental loads are ignored. Further analysis that includes these loads will be a necessary step to assess the dynamic stability of these systems. However, the high-fidelity simulations that would be required for this are time consuming and would necessitate the development of new models or modification of existing ones. We are first concerned with determining whether one or both of the concepts being studied can produce sufficient power to merit continued research.
Subject to the steady-state constraint, the power performance of each system (UFOWT and ES) is examined over a range of true wind speeds (V1) and true wind angles (TWA). In general, there are many possible sets of values for the control variables that lead to steady-state solutions, so an optimization method is employed to arrive at the operating point which maximizes the net power output of the system. Each system has several control variables; these form the domain that the optimization searches over. The net power is the objective which is to be maximized, subject to the steady-state force balances (Eq. 1) and other constraints. The control variables are also bounded to keep them within feasible ranges. These bounds are discussed more specifically for each system individually. The optimization problem can be expressed as
where C refers to the set of constraints, and Bu,i and Bl,i are members of the set of upper and lower bounds for each of the input variables (index i) to the optimization, respectively. Other constraints are also implemented, such as constraining the power output of the wind turbine to not exceed the generator rated power. These are referred to generally as O in the last part of Eq. (2). To compare across the two systems, each system's net power is normalized by its respective rated power. This quantity is referred to as Γp,net (Eq. 3).
We will also consider the ratio of power consumed by the propellers to power generated, referred to as power ratio (Rp), as was done by Xu et al. (2021):
The optimization problem is solved for each set of chosen environmental conditions. By sweeping through a range of possible wind speeds and angles, maps of optimal power performance are generated along with the values of the control variables that define the optimal operating points. Optimizations are performed using a particle swarm optimization code implemented in Python called PySwarm. PySwarm is open source and open access and allows for implementation of bounds and constraints. Although particle swarm optimization generally does not guarantee the global optimum solution is found, it was used here since the gradient of the objective function is not trivial to compute. As well, the control variable space searched by the algorithm is only two or three dimensional (for ES and UFOWT, respectively), meaning that optima are computed quickly using only a personal computer. To ensure global optima were computed, future work may include verifying solutions by way of other optimization processes.
The power performance models of each technology are described separately in the following sections, Sect. 2.1 for the UFOWT and Sect. 2.2 for ESs.
2.1 UFOWT
The thrust force on the wind turbine (Fg) is defined in Eq. (5) according to actuator disk theory (Burton et al., 2011a). It is assumed that the wind turbine rotor is always perfectly yawed in the wind direction so there is no yaw error to account for. Thus, the thrust force is always acting in the direction of the apparent wind (i.e. along the apparent wind angle, AWA). Future work may explore thrust vectoring by misaligning the rotor yaw to help steer the UFOWT. Wind turbine thrust and power coefficients (Ct1(β,λ) and Cp1(β,λ)) are functions of the blade pitch and tip-speed ratio (β and λ). These are two of the control variables used in the control optimization process for the UFOWT case and are conventional control variables for modern wind turbines.
Quadratic drag on the floating platform (Fd2) is accounted for in Eq. (8). We separate the drag into two parts, the viscous drag (Cd2,v) and wave-making drag (Cd2,wm), and the total resistance coefficient (Cd2) is the sum of the two as is conventional for calculating ship resistance (Babarit et al., 2020b). For the viscous drag coefficient, we use results from computational fluid dynamics (CFD) calculations (see Allen et al., 2020) for the dimensional drag coefficient (Bd2) to compute the non-dimensional viscous drag coefficient in Eq. (6).
The wave-making drag coefficient is estimated using an analytical formulation for a submerged cylinder (Baba, 1976); we triple the coefficient since the platform is composed of three cylindrical columns.
Here L is the length of the cylindrical pontoon and D is its diameter. As mentioned earlier, by convention the UFOWT is always moving in the positive surge (+x) direction, so the drag force will always act opposite to this direction of motion. This approximate wave-making coefficient will not account for wave interference between the waves created by each column; however, in practice the wave-making drag is much smaller than the viscous contribution and so small errors in the wave-making drag should not impact model results. As well, this estimate is only valid in the low-speed limit which is defined as Fr<0.25, where Fr is the Froude number. For the proposed UFOWT this puts an upper limit on vessel speed of Vb<2.75 (m s−1), which is used as a bound in the optimization. In the future, wave-making drag could be estimated using potential flow simulations, as was done for the FARWIND energy ship (Babarit et al., 2020b), to avoid the limitations of this.
Lastly, the thrust force exerted by the propellers (Fp) is defined according to standard propeller theory in Eq. (9) (Carlton, 2007). Conventional thrust and torque coefficients (Kt2(J) and Kq2(J)) for fixed-pitch propellers are used and depend in general on the number of blades and their shape, as well as the advance ratio (J). The yaw angle of the propellers (θ) is controlled to ensure steady-state motion in the surge and sway directions. It is determined analytically by Eq. (10) for a given set of environmental conditions and a specific vessel speed; i.e. the propellers are yawed to produce a sideways (sway) force to counteract the wind turbine rotor force in the sway direction. Propeller rotational frequency (f) must be solved for numerically according to the implicit relationship in Eq. (11), which was derived from the force balance. It is not varied directly by the optimizer but instead determined iteratively during each evaluation of the steady-state constraint and the objective function.
To determine the net power generated by the UFOWT system, the power generated from the wind turbine (Pg) and the power consumed by the propellers (Pp) are computed according to Eqs. (12) and (13), respectively. These equations follow from the same theories stated above for the forces, namely actuator disk theory and propeller theory for the wind turbine and propeller, respectively.
ΓP,net can be computed for the UFOWT according to Eq. (3) by way of Eqs. (12) and (13).
2.1.1 Control
Using the relationships described above, an optimization with the objective of maximizing net power is performed (according to Eq. 2) for each vessel operating condition (i.e. V1 and TWA). The control variables that the optimizer iterates on for the UFOWT case are wind turbine blade pitch (β), wind turbine tip-speed ratio (λ), and UFOWT vessel speed (Vb). That is, in the UFOWT case,
The full set of variables that describe a given operating point for the UFOWT model are the set of control variables {OP}, as well as the propeller frequency and yaw angle. Bounds on the tip-speed ratio and blade pitch are chosen to remain within the available performance data. A range of [0∘, 360∘] of true wind angles is examined, and the vessel speed was assigned a lower bound of 0 m s−1 to avoid any possible redundancy. No upper bound was set for the vessel speed, although in practice one may be necessary when the dynamics of the UFOWT are considered in dynamic sea states. In addition to the bounds on the control variables, a constraint on maximum rotor speed for the wind turbine is implemented. Minimum rotor speed is not used as a constraint. The power generated by the wind turbine is also constrained to not exceed the rated power of the generator.
2.1.2 Design
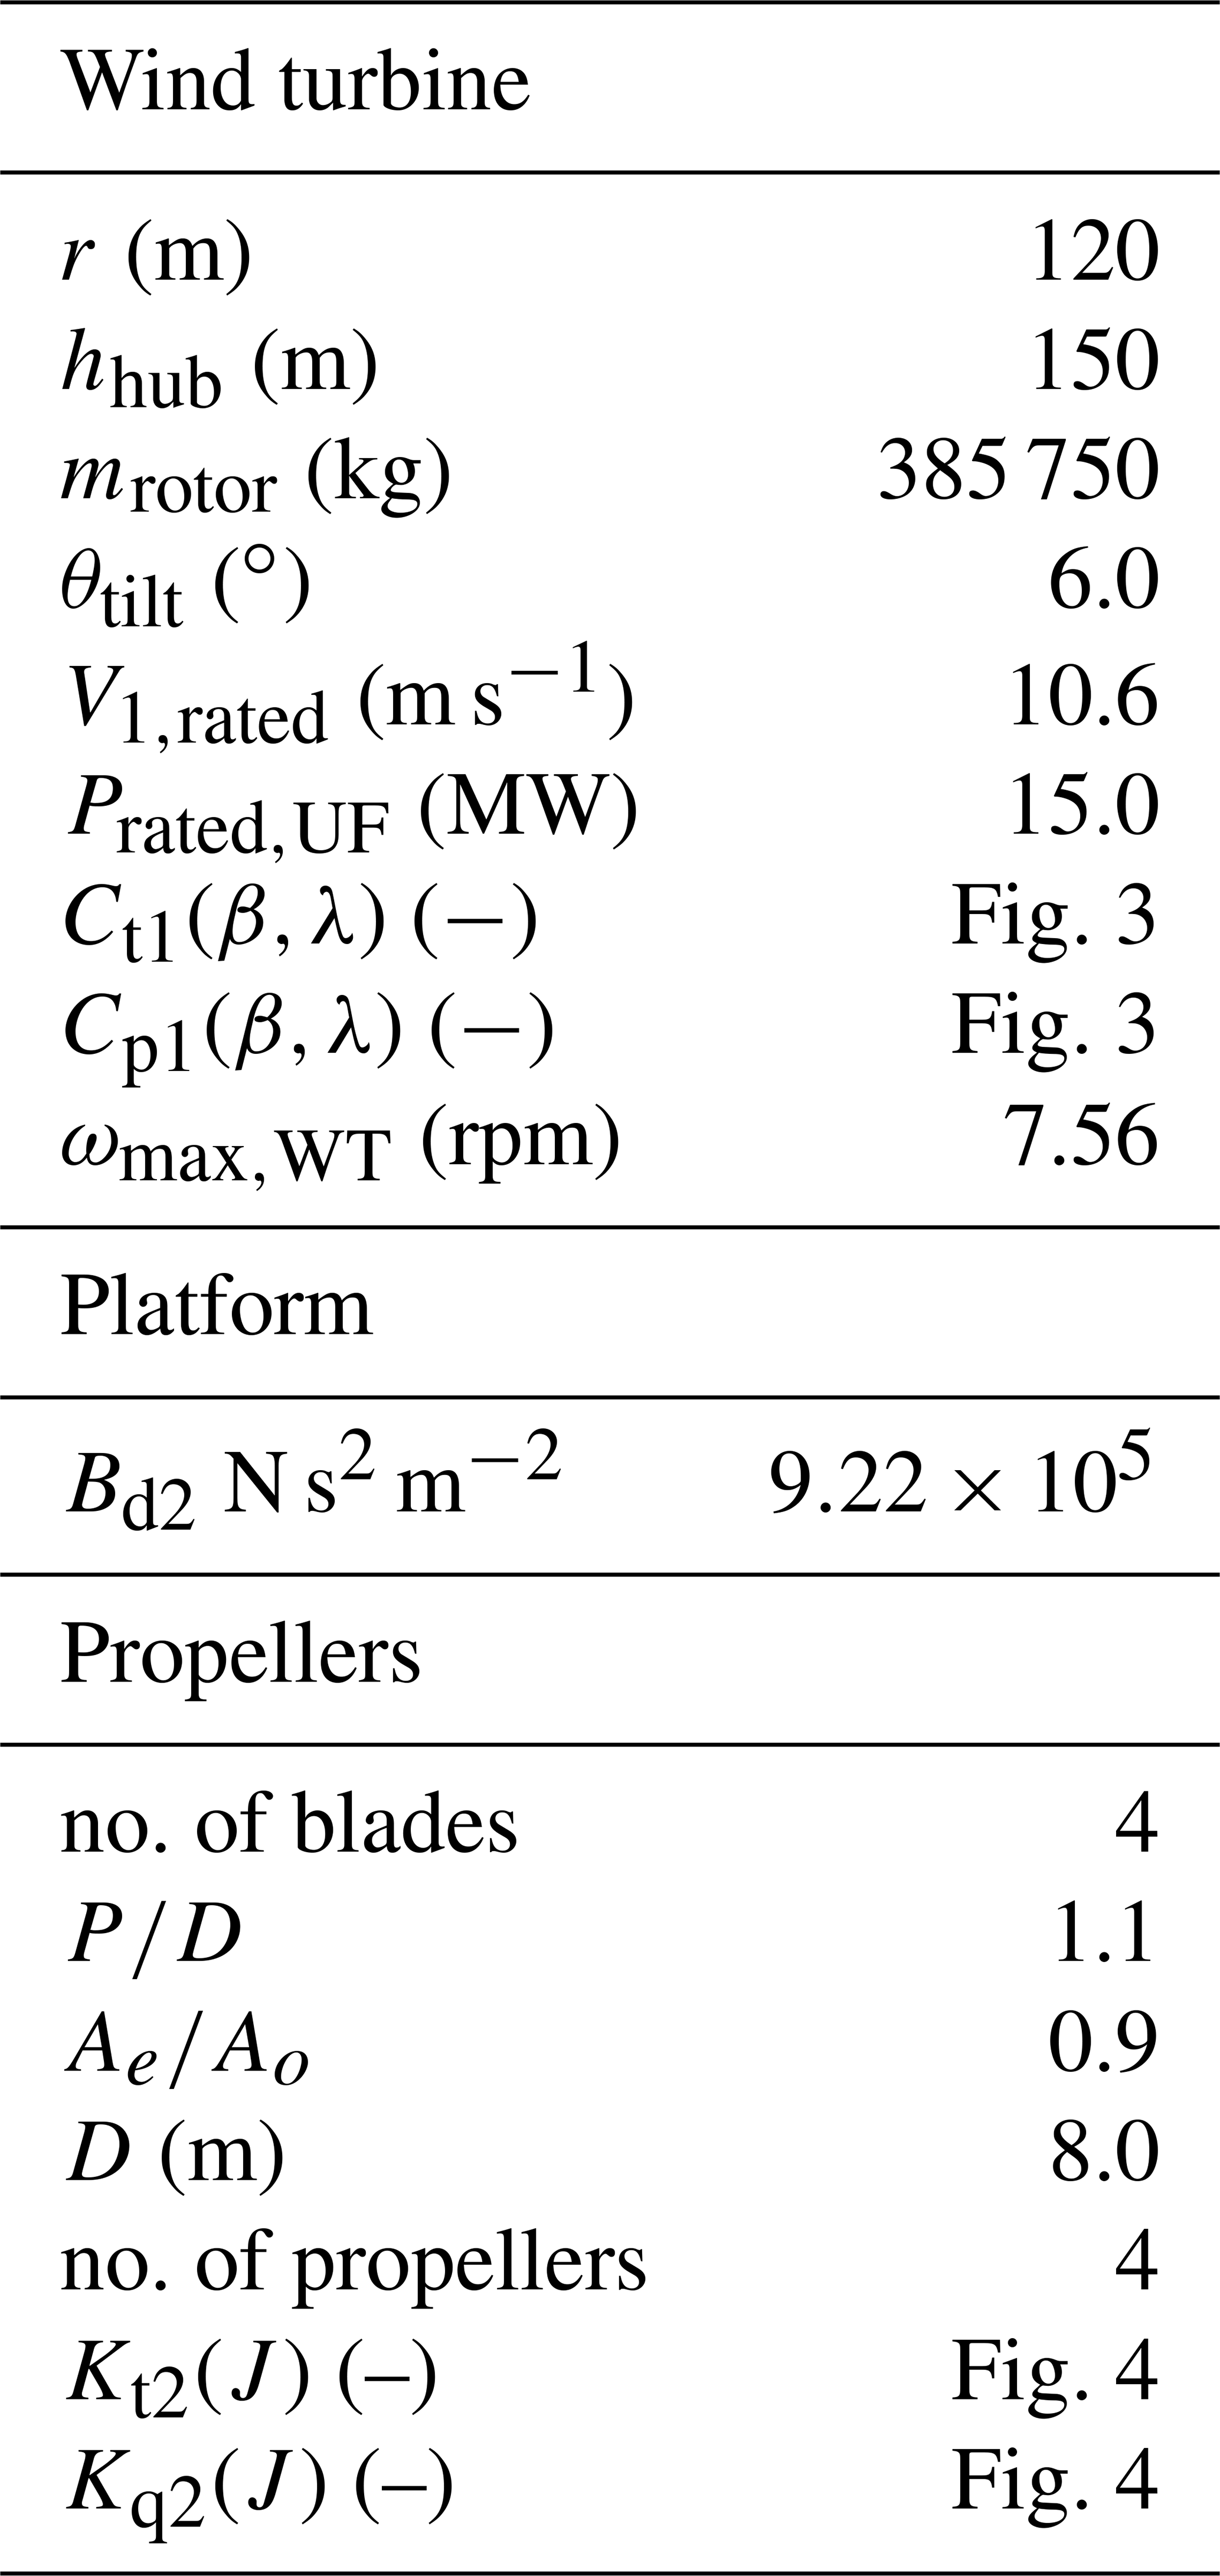
A preliminary UFOWT design is presented here for the purpose of demonstrating power performance. The objective of the design used here is to be easily reproducible by others in future studies. For this reason we use the International Energy Agency (IEA) 15 MW reference wind turbine and the University of Maine (UMaine) VolturnUS semi-submersible platform, the most recent standard reference floating wind turbine (Gaertner et al., 2020; Allen et al., 2020). In the spirit of reproducibility, the propeller performance coefficients are derived from the Wageningen B-series propellers (Bernitsas et al., 1981). Table 1 presents all relevant specifications of the UFOWT system.
Table 1Specifications of the UFOWT subsystems (from Gaertner et al., 2020; Allen et al., 2020; Bernitsas et al., 1981).
Wind turbine performance coefficients are presented in Fig. 3 for various blade pitch settings. Thrust and torque coefficients for the chosen propeller are shown in Fig. 4. Although conventionally propeller thrust and torque coefficients are only used over the range where the coefficients are positive, in the case of UFOWTs it may also be possible to operate the propellers under conditions where they are negative. This is further discussed in the following section (Sect. 2.1.3). The propellers may also operate at small, negative advance ratios (J<0). The performance coefficients are assumed to be constant under these conditions (Itoh and Satoh, 2019). Negative advance ratios correspond to situations where the propellers may operate as turbines; however, more detailed design and optimization may be required to fully exploit this.
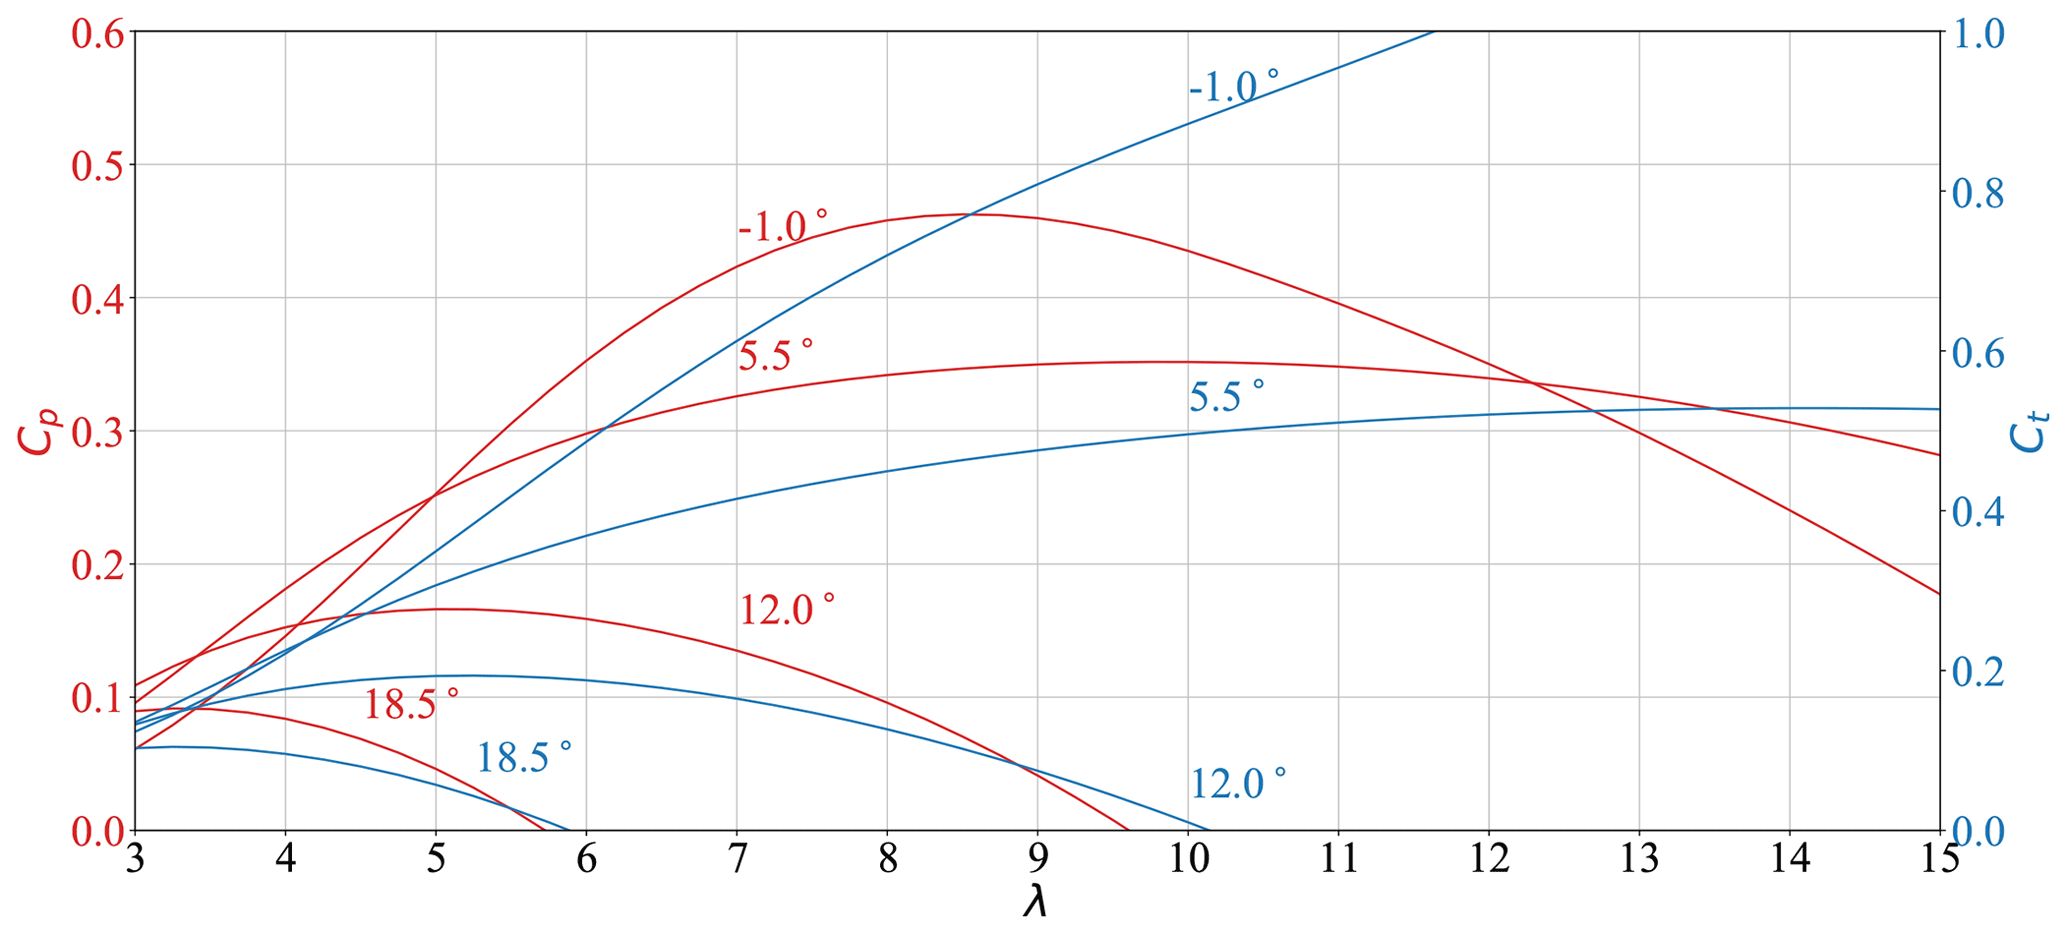
Figure 3Thrust and power coefficient traces for the IEA 15 MW reference wind turbine for various pitch angles (β); full data available in Gaertner et al. (2020) and the associated GitHub page.
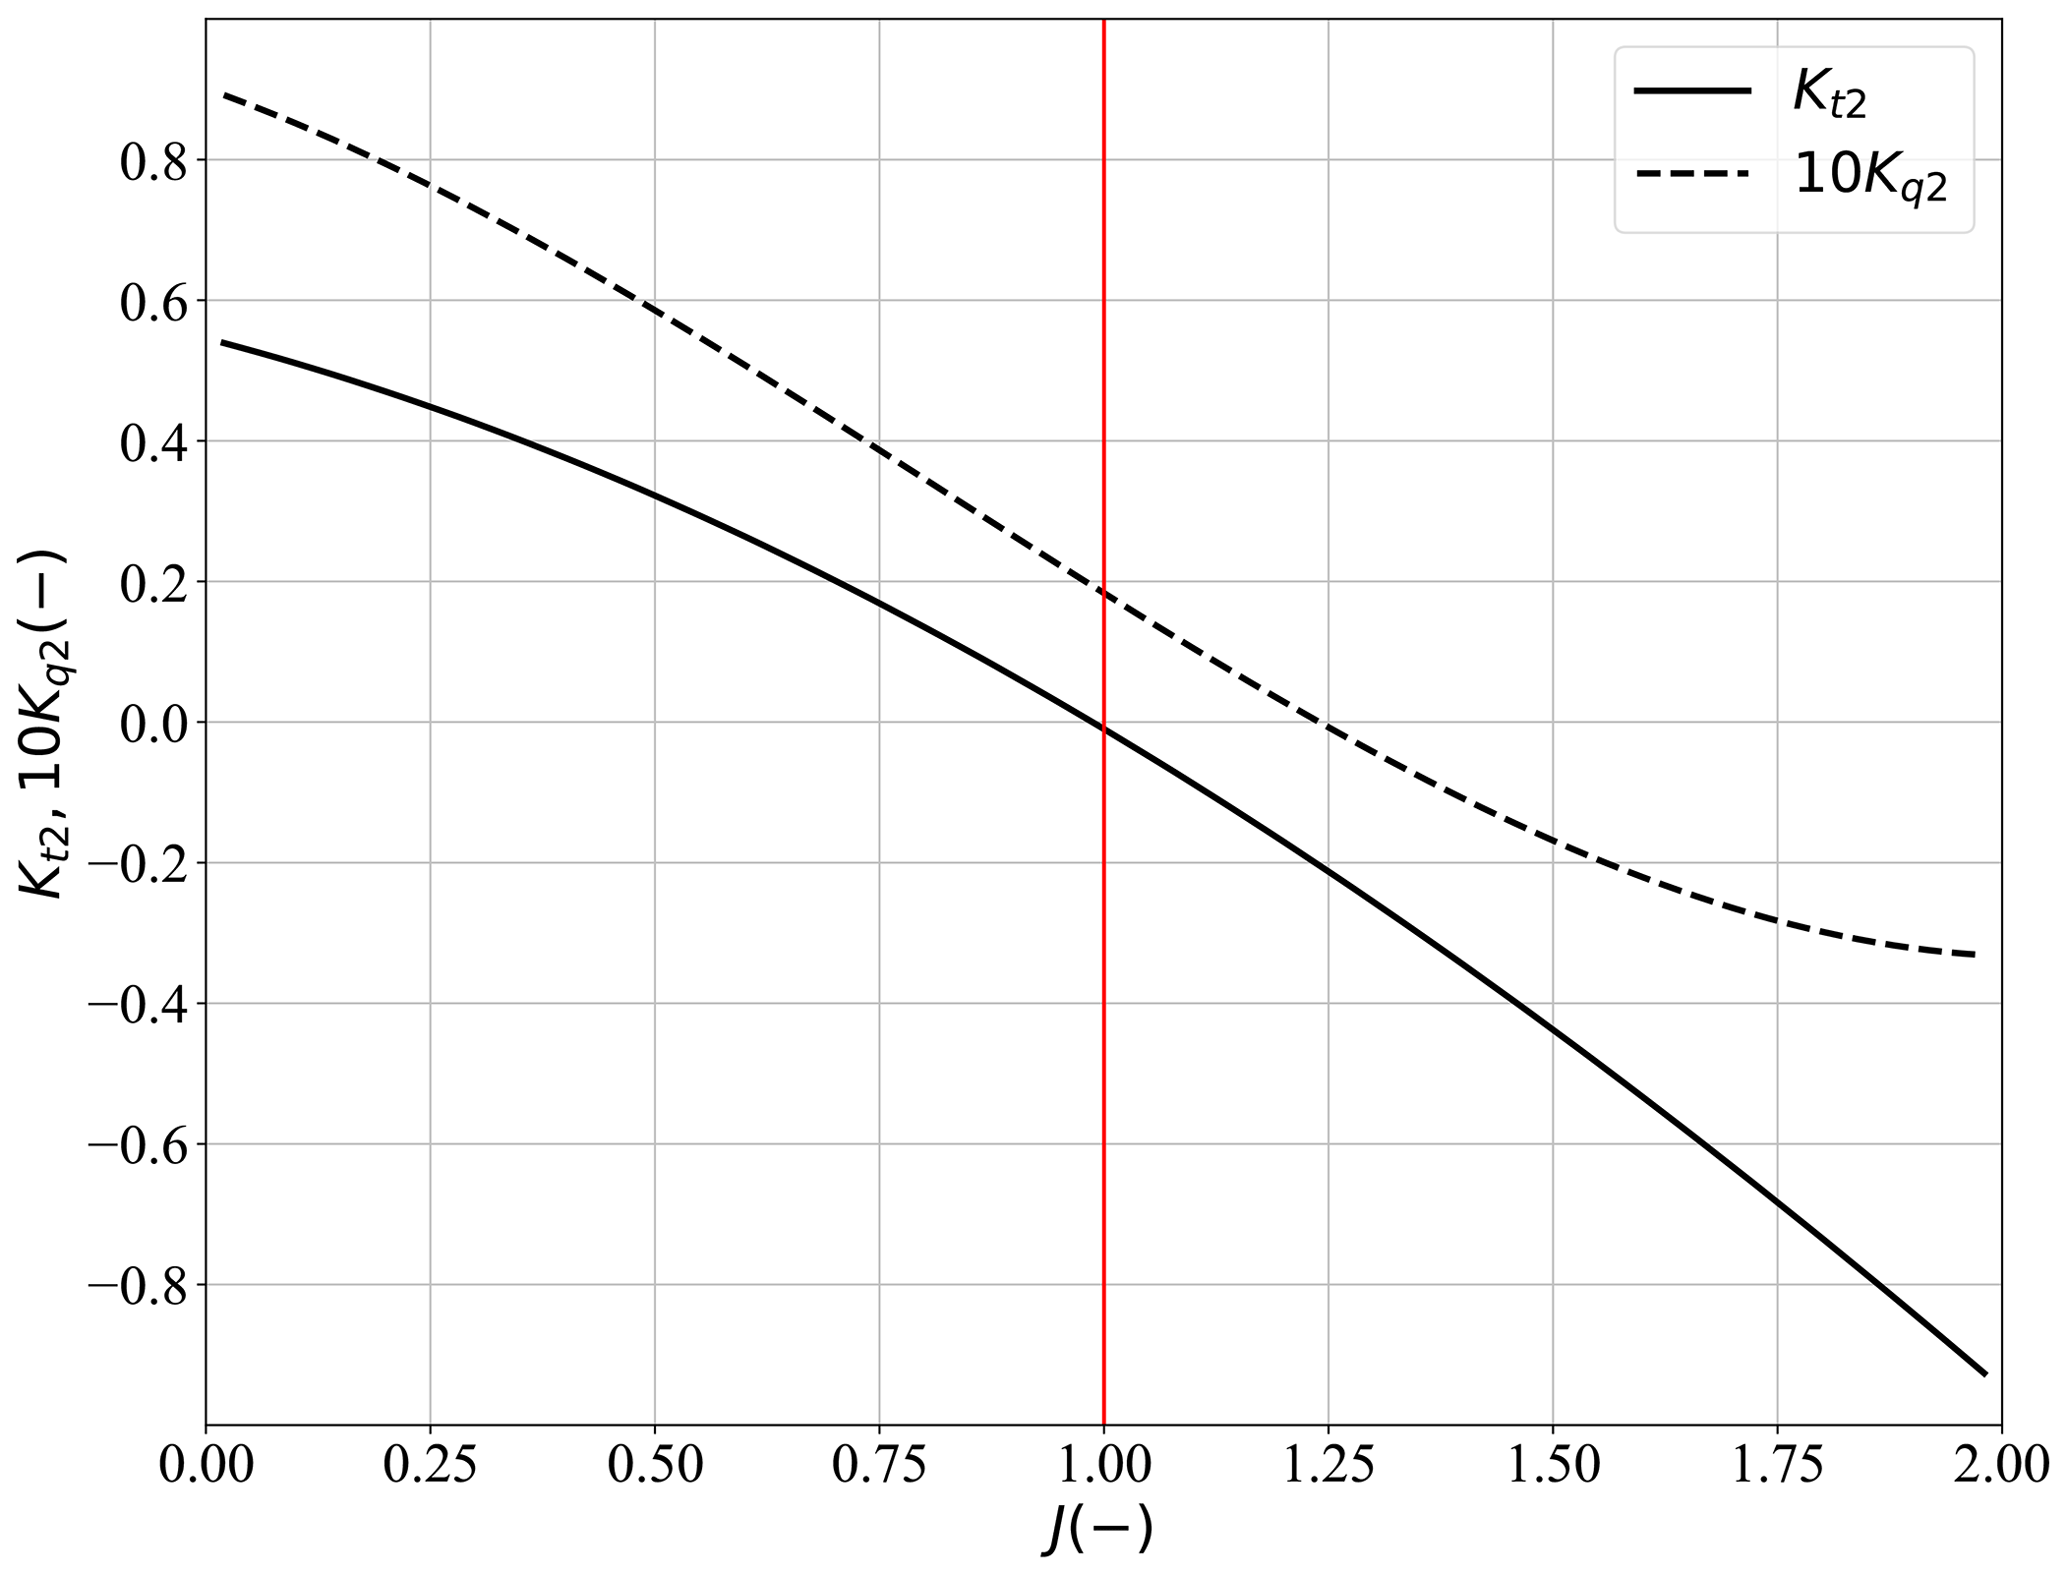
Figure 4Performance maps for the chosen Wageningen B-series propeller (Bernitsas et al., 1981).
2.1.3 Propeller power take-off (regeneration)
Although the primary purpose of the propellers is to consume power to counterbalance environmental forces on the system, there may be cases where it is possible to extract power through the propellers rather than consume it. One instance where this may be possible is when the UFOWT is travelling directly downwind. In this case the wind turbine thrust is pushing the vessel downwind, while the drag on the substructure resists this motion. It may be possible to use the propellers as if they were water turbines to provide added resistance to achieve steady state. This is similar to the principle of regenerative braking that is used in electric vehicles (Yoong et al., 2010). It can also be used with electric or hybrid-electric ships and planes by operating the propellers outside of their normal operating ranges. Though regeneration (as it is referred to when using a propeller) is currently being used in private and small commercial ships, little is published on the design or operation of the propeller (Enge et al., 2013; Gunnarsson et al., 2016). Some research has been conducted on the application of regeneration to electric aircraft; however, the data presented are not directly applicable to the UFOWT application since they are for small propellers used in air (Yokota et al., 2020; Scholtens, 2021).
To explore this possibility, the UFOWT model includes an option to consider solutions where the propellers generate power rather than consume it. This requires using advance ratios outside the range of what is presented in Bernitsas et al. (1981). Data for propellers operating in this mode are scarce and are mostly for the case of propellers operating in the air. For this reason, the regression polynomials in Bernitsas et al. (1981) are used to extrapolate the performance coefficients beyond the intended range. Some results for this case are presented separately in Sect. 3.2.1. Under this case, the complete range of performance coefficients in Fig. 4 is used, whereas in the baseline case only values where the thrust coefficient is positive are allowed.
2.1.4 Mean drift force
An additional steady force which has been excluded from the main models is the mean drift wave force (Fmd). We exclude this from the main comparisons between UFOWTs and ESs since it is not typically considered in ship models, and we value here having a fair comparison between the two classes of technologies. Mean drift is a part of the second-order potential flow hydrodynamics theory commonly used for modelling floating wind turbine platforms (see for example Duarte et al., 2014). It is the only steady part of the wave force and comes from difference frequency terms for two waves at identical frequency. The derivation of the mean drift force is outlined in Duarte et al. (2014) and can be expressed as
where χ is the quadratic transfer function (QTF), A is the wave amplitude, and the index i denotes the wave frequency. The QTF is obtained using a potential flow solver (WAMIT, for example), and the wave amplitude as a function of frequency is taken from a wave spectrum S(ω). Herein, we use QTF data for the UMaine VolturnUS platform from Allen et al. (2020). It is worth noting that the summation in Eq. (15) is over all wave frequencies. For a moving system the waves will be encountered at a different frequency than their natural propagating frequency. This can have an effect on the mean drift force, since both the QTF and wave amplitudes are a function of frequency. We account for this by shifting the wave spectrum and the set of frequencies according to Lewandowski (2004). We limit ourselves to the case of co-directed wind and waves with no wave spreading. Analyses are limited to direct upwind and downwind motion since these represent the limiting cases for UFOWT performance. Equations (10) and (11) are modified to correctly account for this additional force when mean drift is included in the results.
We elect to use the empirically derived JONSWAP wave spectrum here since it is widely used (Hasselmann et al., 1973). The JONSWAP spectrum relies on three parameter choices, the significant wave height (Hs), the peak wave period (Tp), and the peak factor (typically γ). Herein we choose Hs based on the wind speed according to
so that we may have a unique sea state for each wind speed (Stewart, 2008). The peak period is then chosen to be
so that the sea state adheres to DNV-GL standards (DNVGL, 2016). For all sea states a peak factor of 3 is used.
2.2 Energy ship
The ES model presented is based directly on that of Babarit et al. (2021b). Forces on the ES from the Flettner rotors, water turbines, and hull are considered. Flettner rotors are considered here over other propulsion options to remain in line with existing literature, especially the FARWIND design. Thrust force on the water turbines (Fg) is calculated according to actuator disk theory and is shown in Eq. (18). As was the case for the wind turbine in the UFOWT case, the water turbines are considered to be perfectly aligned with the flow. Since the vessel is assumed to only move in the positive surge direction, the thrust is always along this direction as well.
The hull resistance Fd2 is also directed opposite to the motion of the ship. Resistance coefficients (Cd2(Fr)) are shown in Fig. 5 and are taken to be the sum of the residuary (wave) resistance and frictional resistance coefficients from Babarit et al. (2021b).
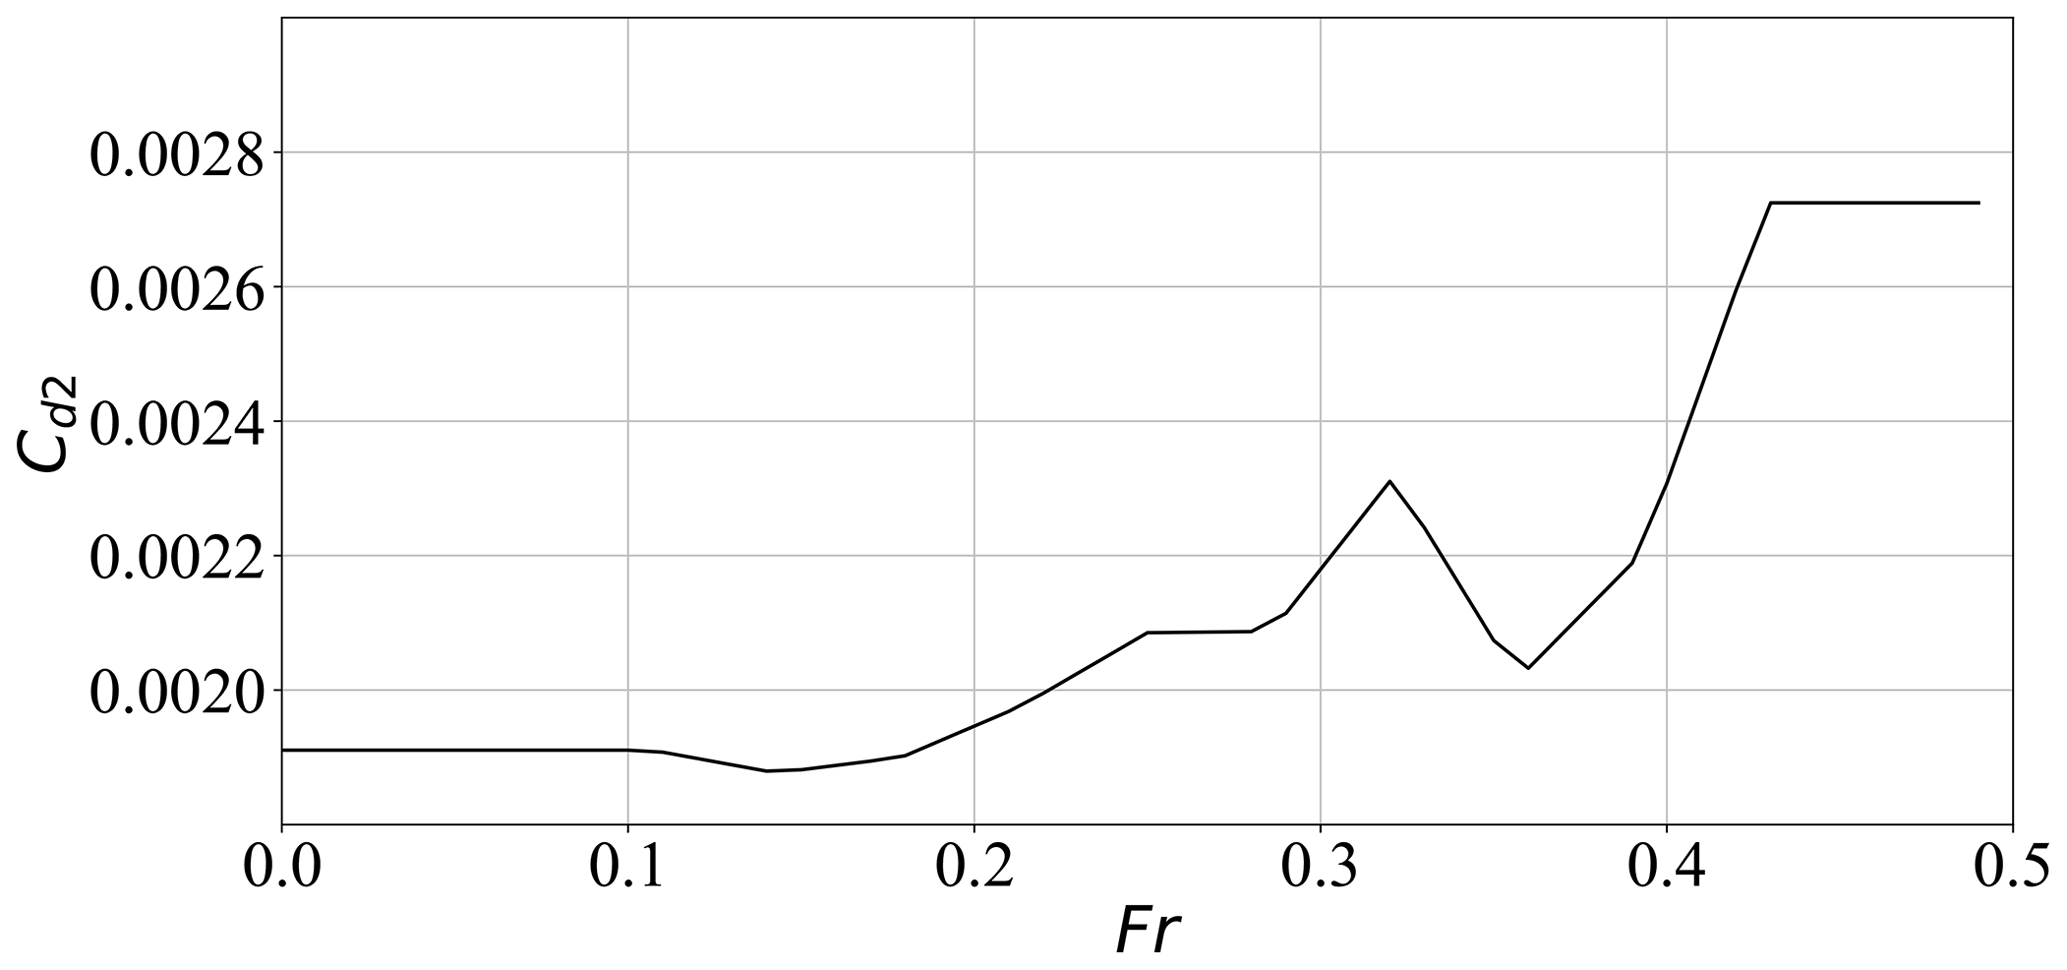
Figure 5Hull resistance coefficient as a function of Froude number (Fr), sum of the frictional and residuary coefficients used in Babarit et al. (2021b).
The thrust provided by the Flettner rotors (Fp) is the sum of the aerodynamic lift (L) and drag (D) as shown in Eqs. (20), (21), and (22). These equations assume the Flettner rotor is spinning anticlockwise, but since the rotors are symmetric they can perform equally as well spinning clockwise, which would reverse the direction of the lift. Flettner rotor lift and drag coefficients and the power coefficient for the motor are presented in Fig. 6. These coefficients are calculated from empirical relationships derived by Tillig and Ringsberg (2020). Since the Flettner rotors are spaced quite closely together, the wakes of upwind Flettner rotors may affect the inflow velocity at rotors downwind. As is recommended in Babarit et al. (2021b), a coefficient that reduces the total thrust is introduced to account for the interaction between the rotors and their wakes (Ct,int). Although Ct,int will generally depend on wind speed, wind angle, and spin ratio, it is assumed to be constant to remain consistent with existing models.
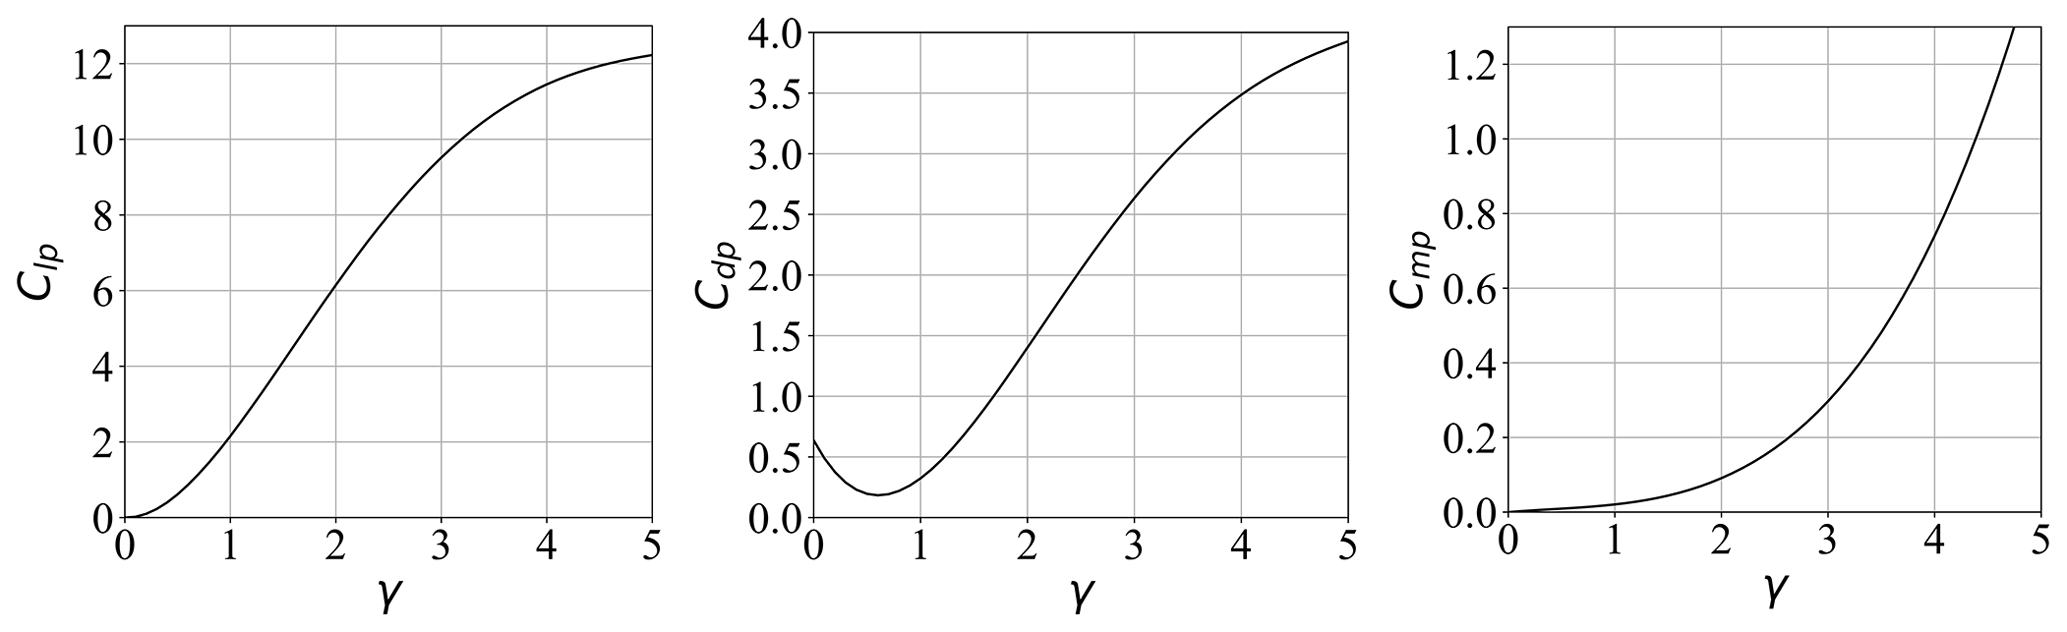
Figure 6Flettner rotor lift (Clp), drag (Cdp), and power (Cmp) coefficients as a function of spin ratio (γ), computed from Tillig and Ringsberg (2020).
Power generated by the water turbines is modelled consistently with the thrust force and is shown in Eq. (23). An efficiency (ηg) is added to remain consistent with (Babarit et al., 2021b) to account for losses in the conversion of mechanical (i.e. shaft) power to electrical power by the turbine and generator.
The power consumed to spin the Flettner rotors is computed according to Eq. (24). It is in line with existing research on Flettner rotors (Tillig and Ringsberg, 2020; Traut et al., 2014; Lele and Rao, 2017). Equations (23) and (24) give enough information to calculate Γp,net via Eq. 3.
2.2.1 Control
Although the UFOWT is constrained to steady-state solutions in both surge and sway, the ES must only satisfy steady-state conditions in surge. This is because it is assumed that any side force on the vessel will be counteracted by the force developed from the ship's keel, and the associated leeway angle is assumed small. Only two control variables are passed to the optimizer for the ES; they are the spin ratio of the Flettner rotor and the vessel speed. Thus for the ES case,
Rotational frequency of the Flettner rotors is also constrained to a maximum of 180 rpm according to Norsepower (2021). The axial induction factor (a) is calculated numerically according to Eq. (25) to ensure steady state in surge.
2.2.2 Design
Relevant specifications of the ES are presented in full in Table 2. The FARWIND ES design is used here, as it is the most developed and best documented design available (Babarit et al., 2020a, 2021b). FARWIND uses a catamaran ship hull with four Flettner rotors mounted on board and two water turbines mounted under the hull. They choose a catamaran specifically to achieve the high speeds required by an ES for power production.
Table 2Specifications of the ES subsystems from Babarit et al. (2021b), Norsepower (2021), and Tillig and Ringsberg (2020).

2.3 Design differences
To establish a fair comparison, UFOWT and ES designs were both chosen based on the largest, in terms of rated power, readily available designs in the literature. This decision was based on the established trend for conventional wind turbines that cost decreases for increasing rated power. However, the physical scales of the two system designs, UFOWT and ES, are quite different. The rated power of the ES design is only 1.6 MW compared to the UFOWT rated power of 15 MW; however, comparison results are non-dimensionalized to account for this discrepancy. This implicitly assumes that net power results scale linearly with rated power, which is further discussed in Sect. 4.2. In terms of physical scale, the heights and weights of the two proposed designs are very different. The discrepancy in height will create a difference in wind speeds experienced by the UFOWT and ES because of the wind shear. This effect is accounted for below in Sect. 2.4. By virtue of being larger, the UFOWT design uses a much larger amount of steel than the ES. The combined mass of steel used in the platform, wind turbine tower, and nacelle is on the order of 6200 t for the UFOWT, whereas the ES hull and Flettner rotors use about 880 t of steel (Allen et al., 2020; Babarit et al., 2021b). This amounts to the UFOWT using about 7 times more steel than the ES but producing about 9 times as much power. More rigorous accounting of the materials used in each design is necessary to draw any conclusions on whether one MOWES is more efficient than the other in this aspect, especially since the weight of the UFOWT thrusters has not been accounted for here. The only dimension in which the two MOWES designs proposed have similar scales is in the length of the substructures, with the ES hull being about 80 % as long as the distance between the pontoons of the semi-submersible platform. This will be relevant when accounting for the space on deck or on board required for the PtX, storage, and other subsystems.
2.4 Wind shear
An important differentiating factor between ESs and UFOWTs, which is not inherently captured in the power performance models, is the difference in local incident wind speeds that each would experience due to the difference in height between the two technologies. Current ES designs employ 35 m tall Flettner rotors, the largest commercially available from Norsepower (Norsepower, 2021). In contrast, there are commercially available offshore wind turbines with hub heights well over 100 m, and the IEA 15 MW reference turbine used throughout this work has a hub height of 150 m (Gaertner et al., 2020; Allen et al., 2020). This large difference in height means that under the same wind conditions, the two would experience very different average wind speeds depending on the wind shear. Accounting for this effect allows the two to be compared across identical environmental conditions, instead of at equal, but arbitrary, local wind speeds. Model results for wind speeds which account for the wind shear difference are presented separately in Sect. 3.4.1. Relative device sizing may change in the future as larger Flettner rotors become available or if smaller wind turbine rotors are preferred for UFOWTs.
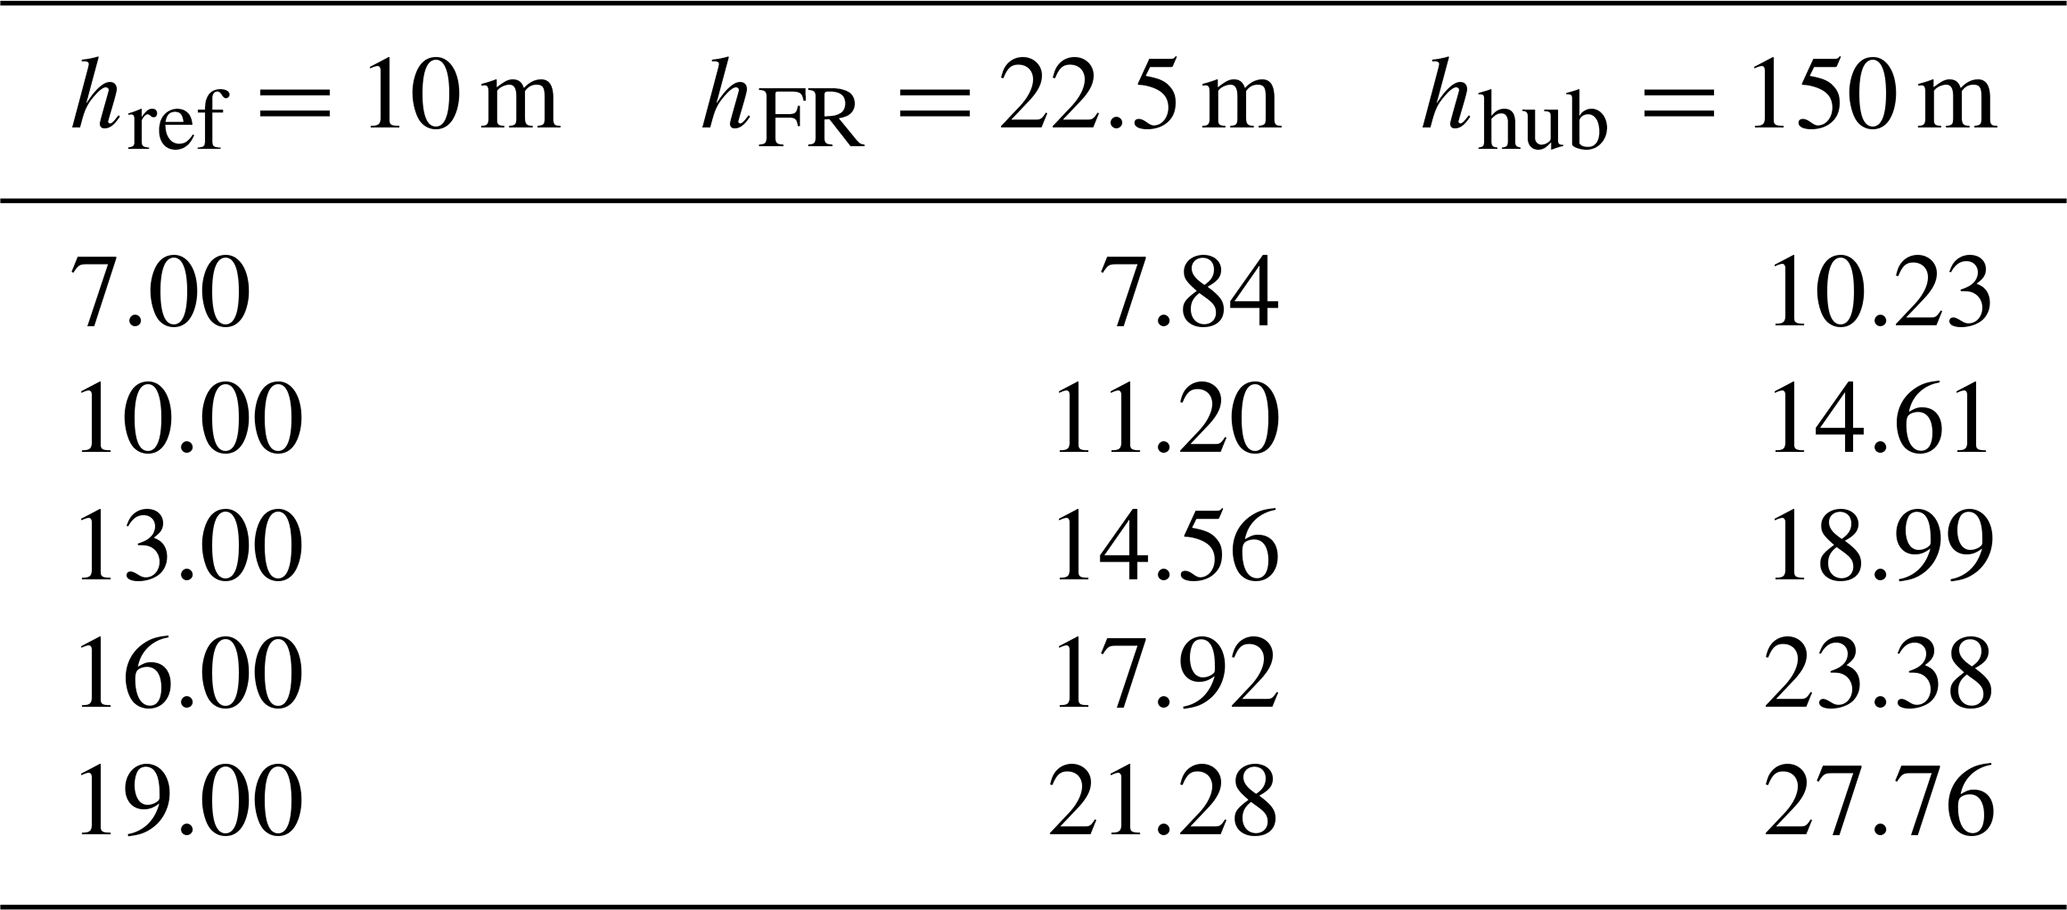
To account for this difference, power performance curves are generated for equal reference wind speeds (i.e. at a reference height of 10 m). True wind speeds are scaled using a power law relationship shown in Eq. (26). A wind shear exponent of α=0.14 is used in accordance with common practice for offshore winds (Burton et al., 2011b; Babarit et al., 2021b). The effect of applying the shear scaling to the wind speeds is shown in Fig. 7. Exact wind speeds used during the analysis are listed in Table 3.
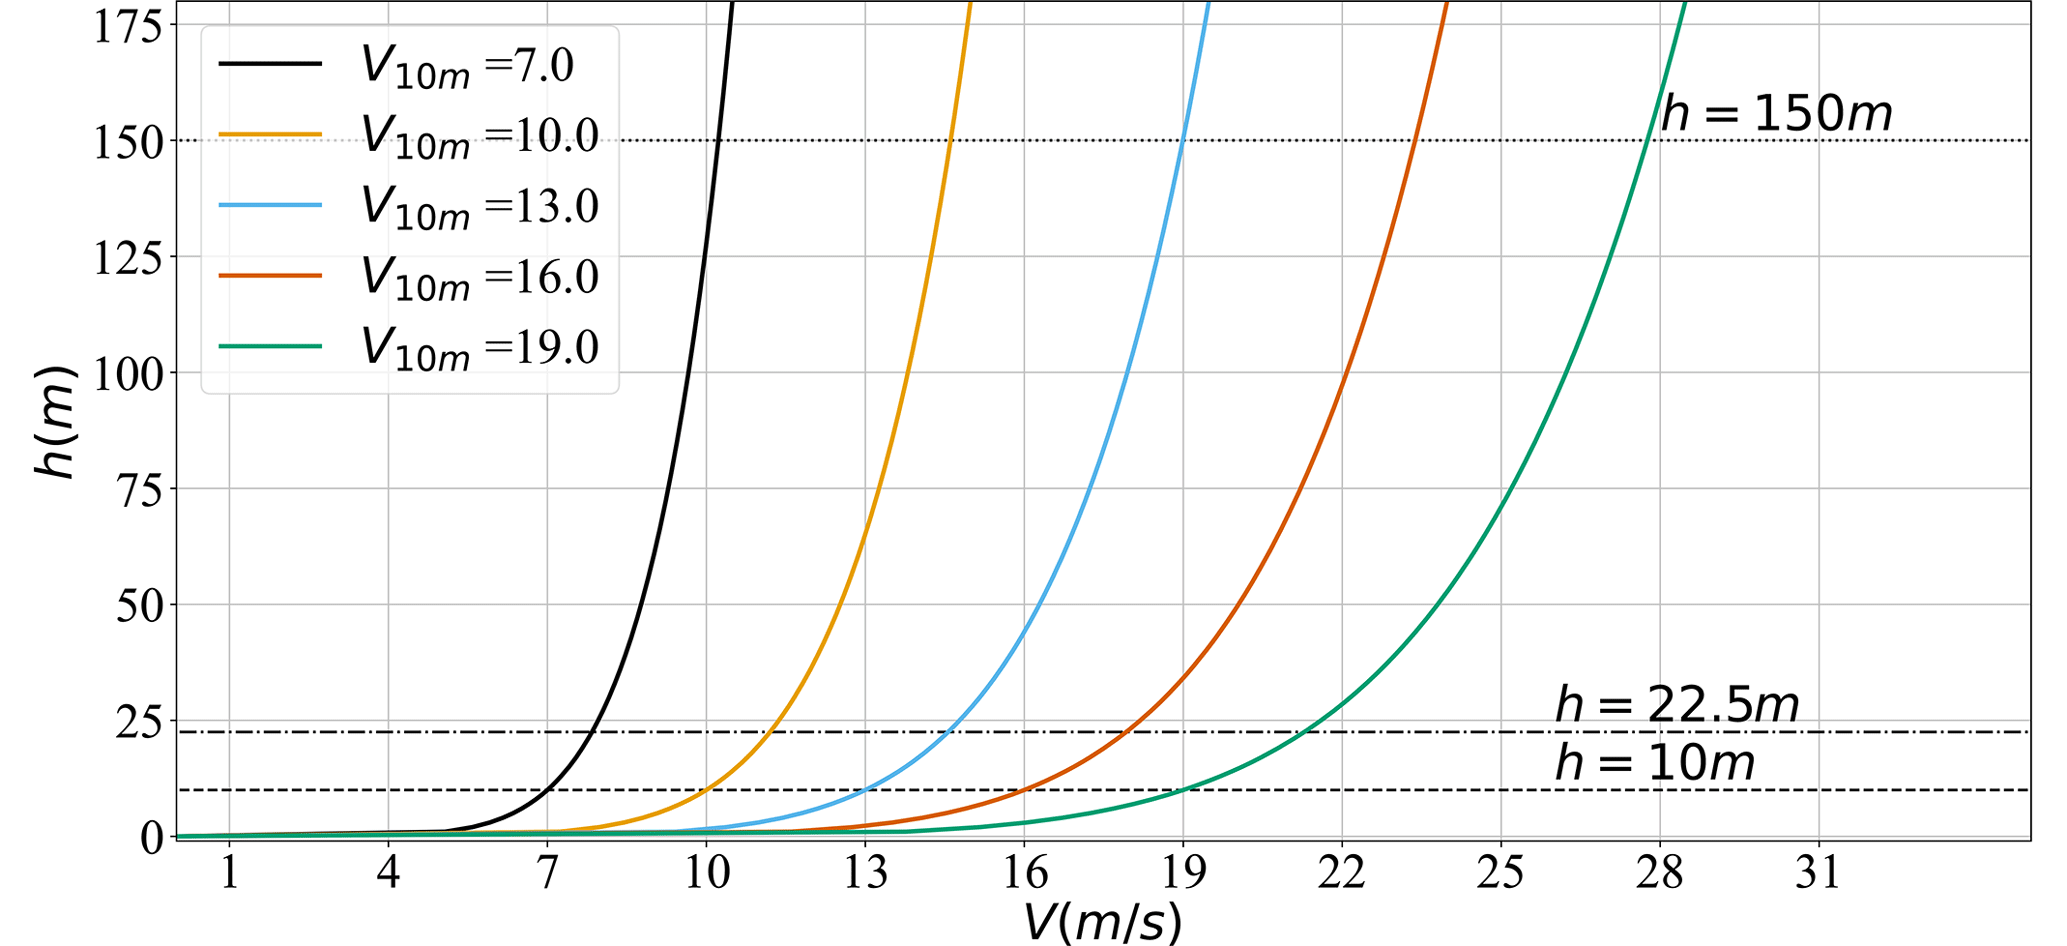
Table 3Wind speeds at reference height, Flettner rotor midpoint, and wind turbine hub height used in the analysis of the effect of vertical wind shear.
Optimized power performance results for each system are presented in the sections that follow. First, the model results were verified against existing literature in Sect. 3.1. Power performance maps for the UFOWT and ES are presented separately in Sect. 3.2 and 3.3, respectively, and are then compared to one another in Sect. 3.4.
3.1 Verification
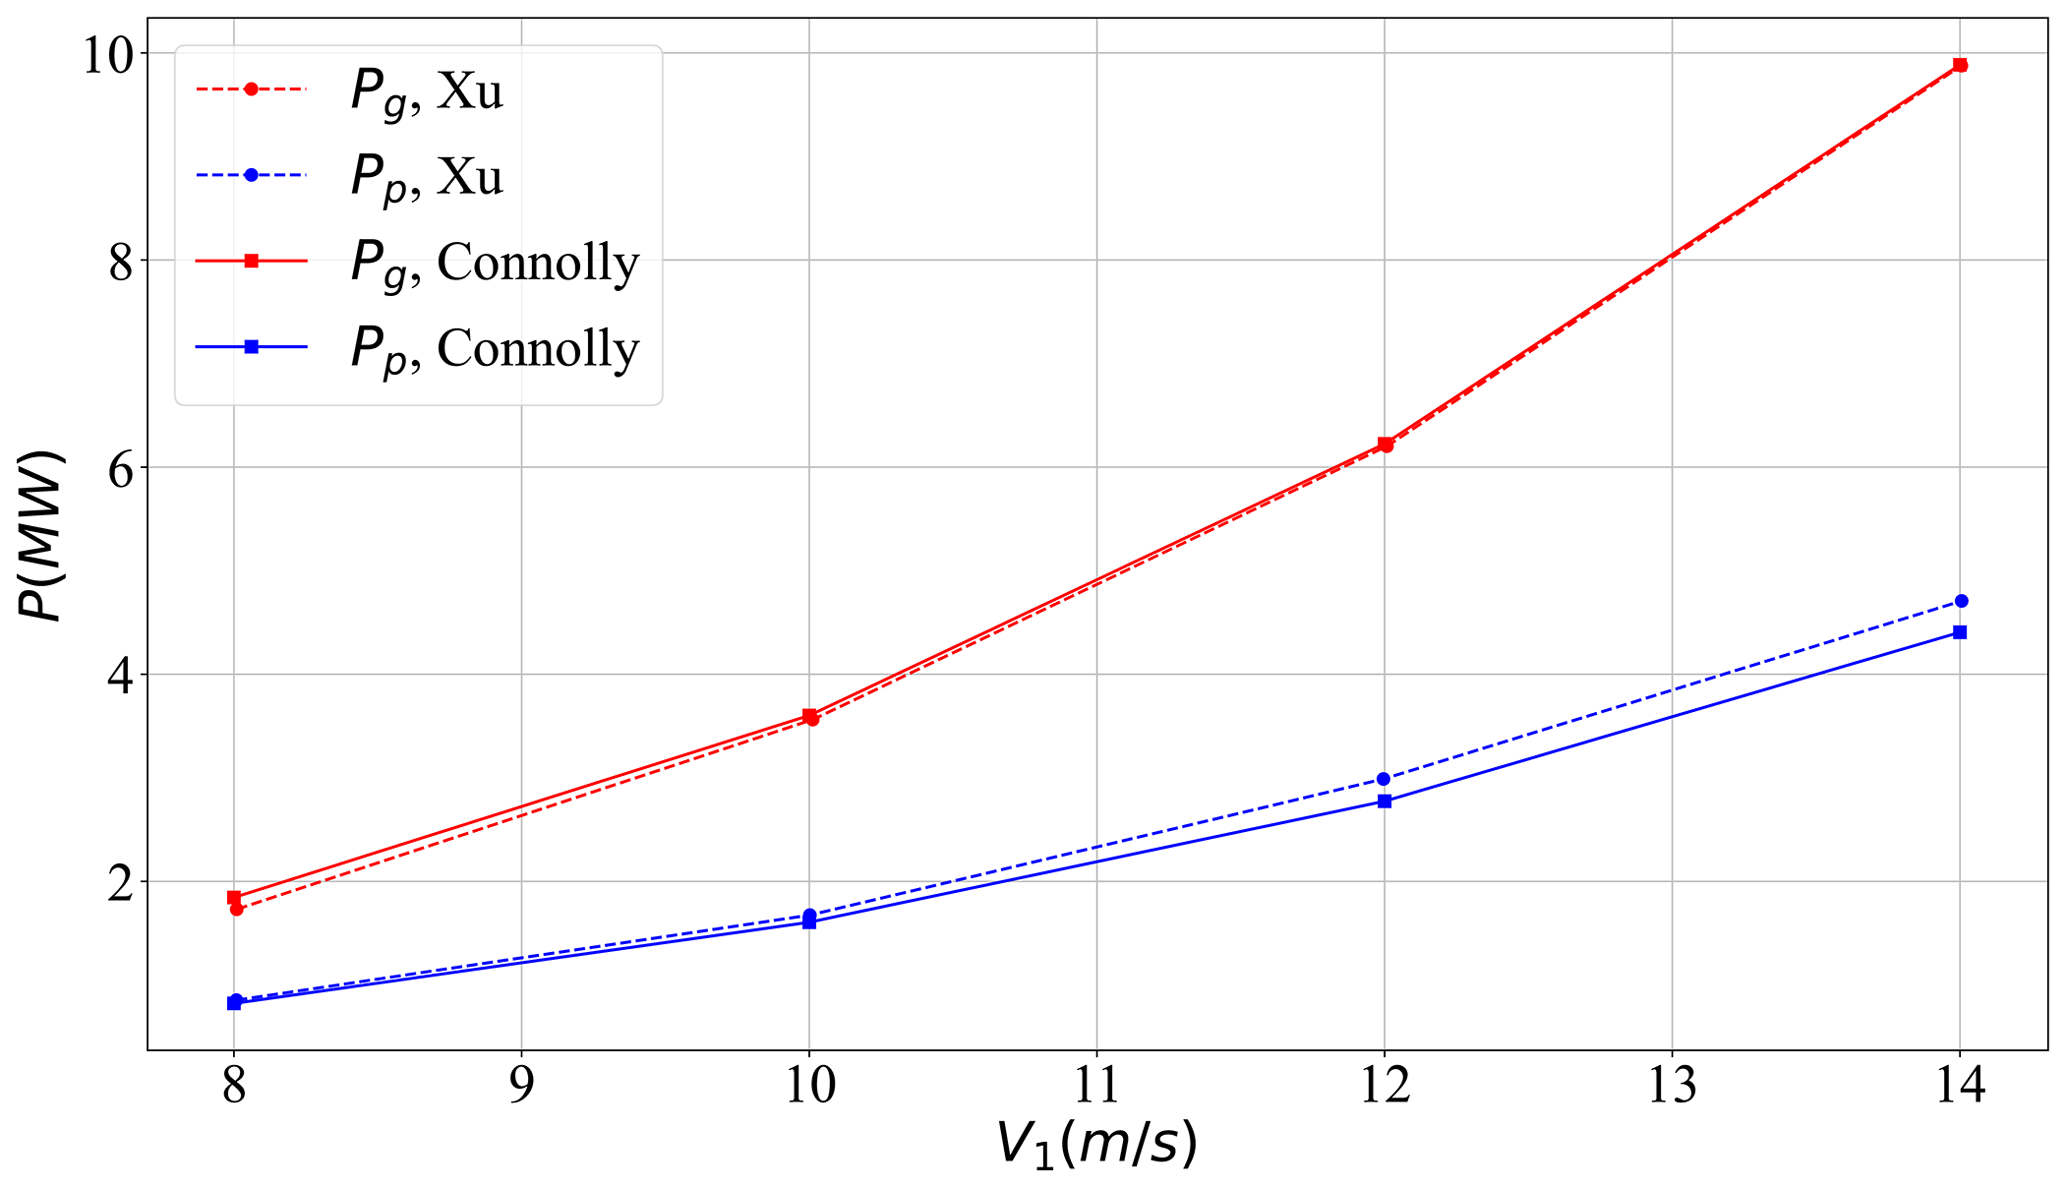
For the ES model, power performance results were verified against those of Babarit et al. (2021b); however, there is a distinct lack of published results for mobile UFOWTs, meaning that it is not possible to directly verify the results. For the case of a station-keeping UFOWT, model results were verified against those of Xu et al. (2021). Power generated and power consumed for several wind speeds are shown in Fig. 8 and show good agreement. This verification case is run using a different UFOWT design which uses a 5 MW turbine and smaller thrusters. The model results show good agreement, though slightly less power is consumed by the present model. This may be because wave forces are accounted for in the model of Xu et al. (2021), whereas they are not accounted for in the present model. Of note for the results presented in Fig. 8, no rated wind speed was considered byXu et al. (2021), and therefore the power simply scales with the cube of the wind speed indefinitely. This is not the case for the model results presented hereafter, but this exception was made for verification purposes.
3.2 UFOWT
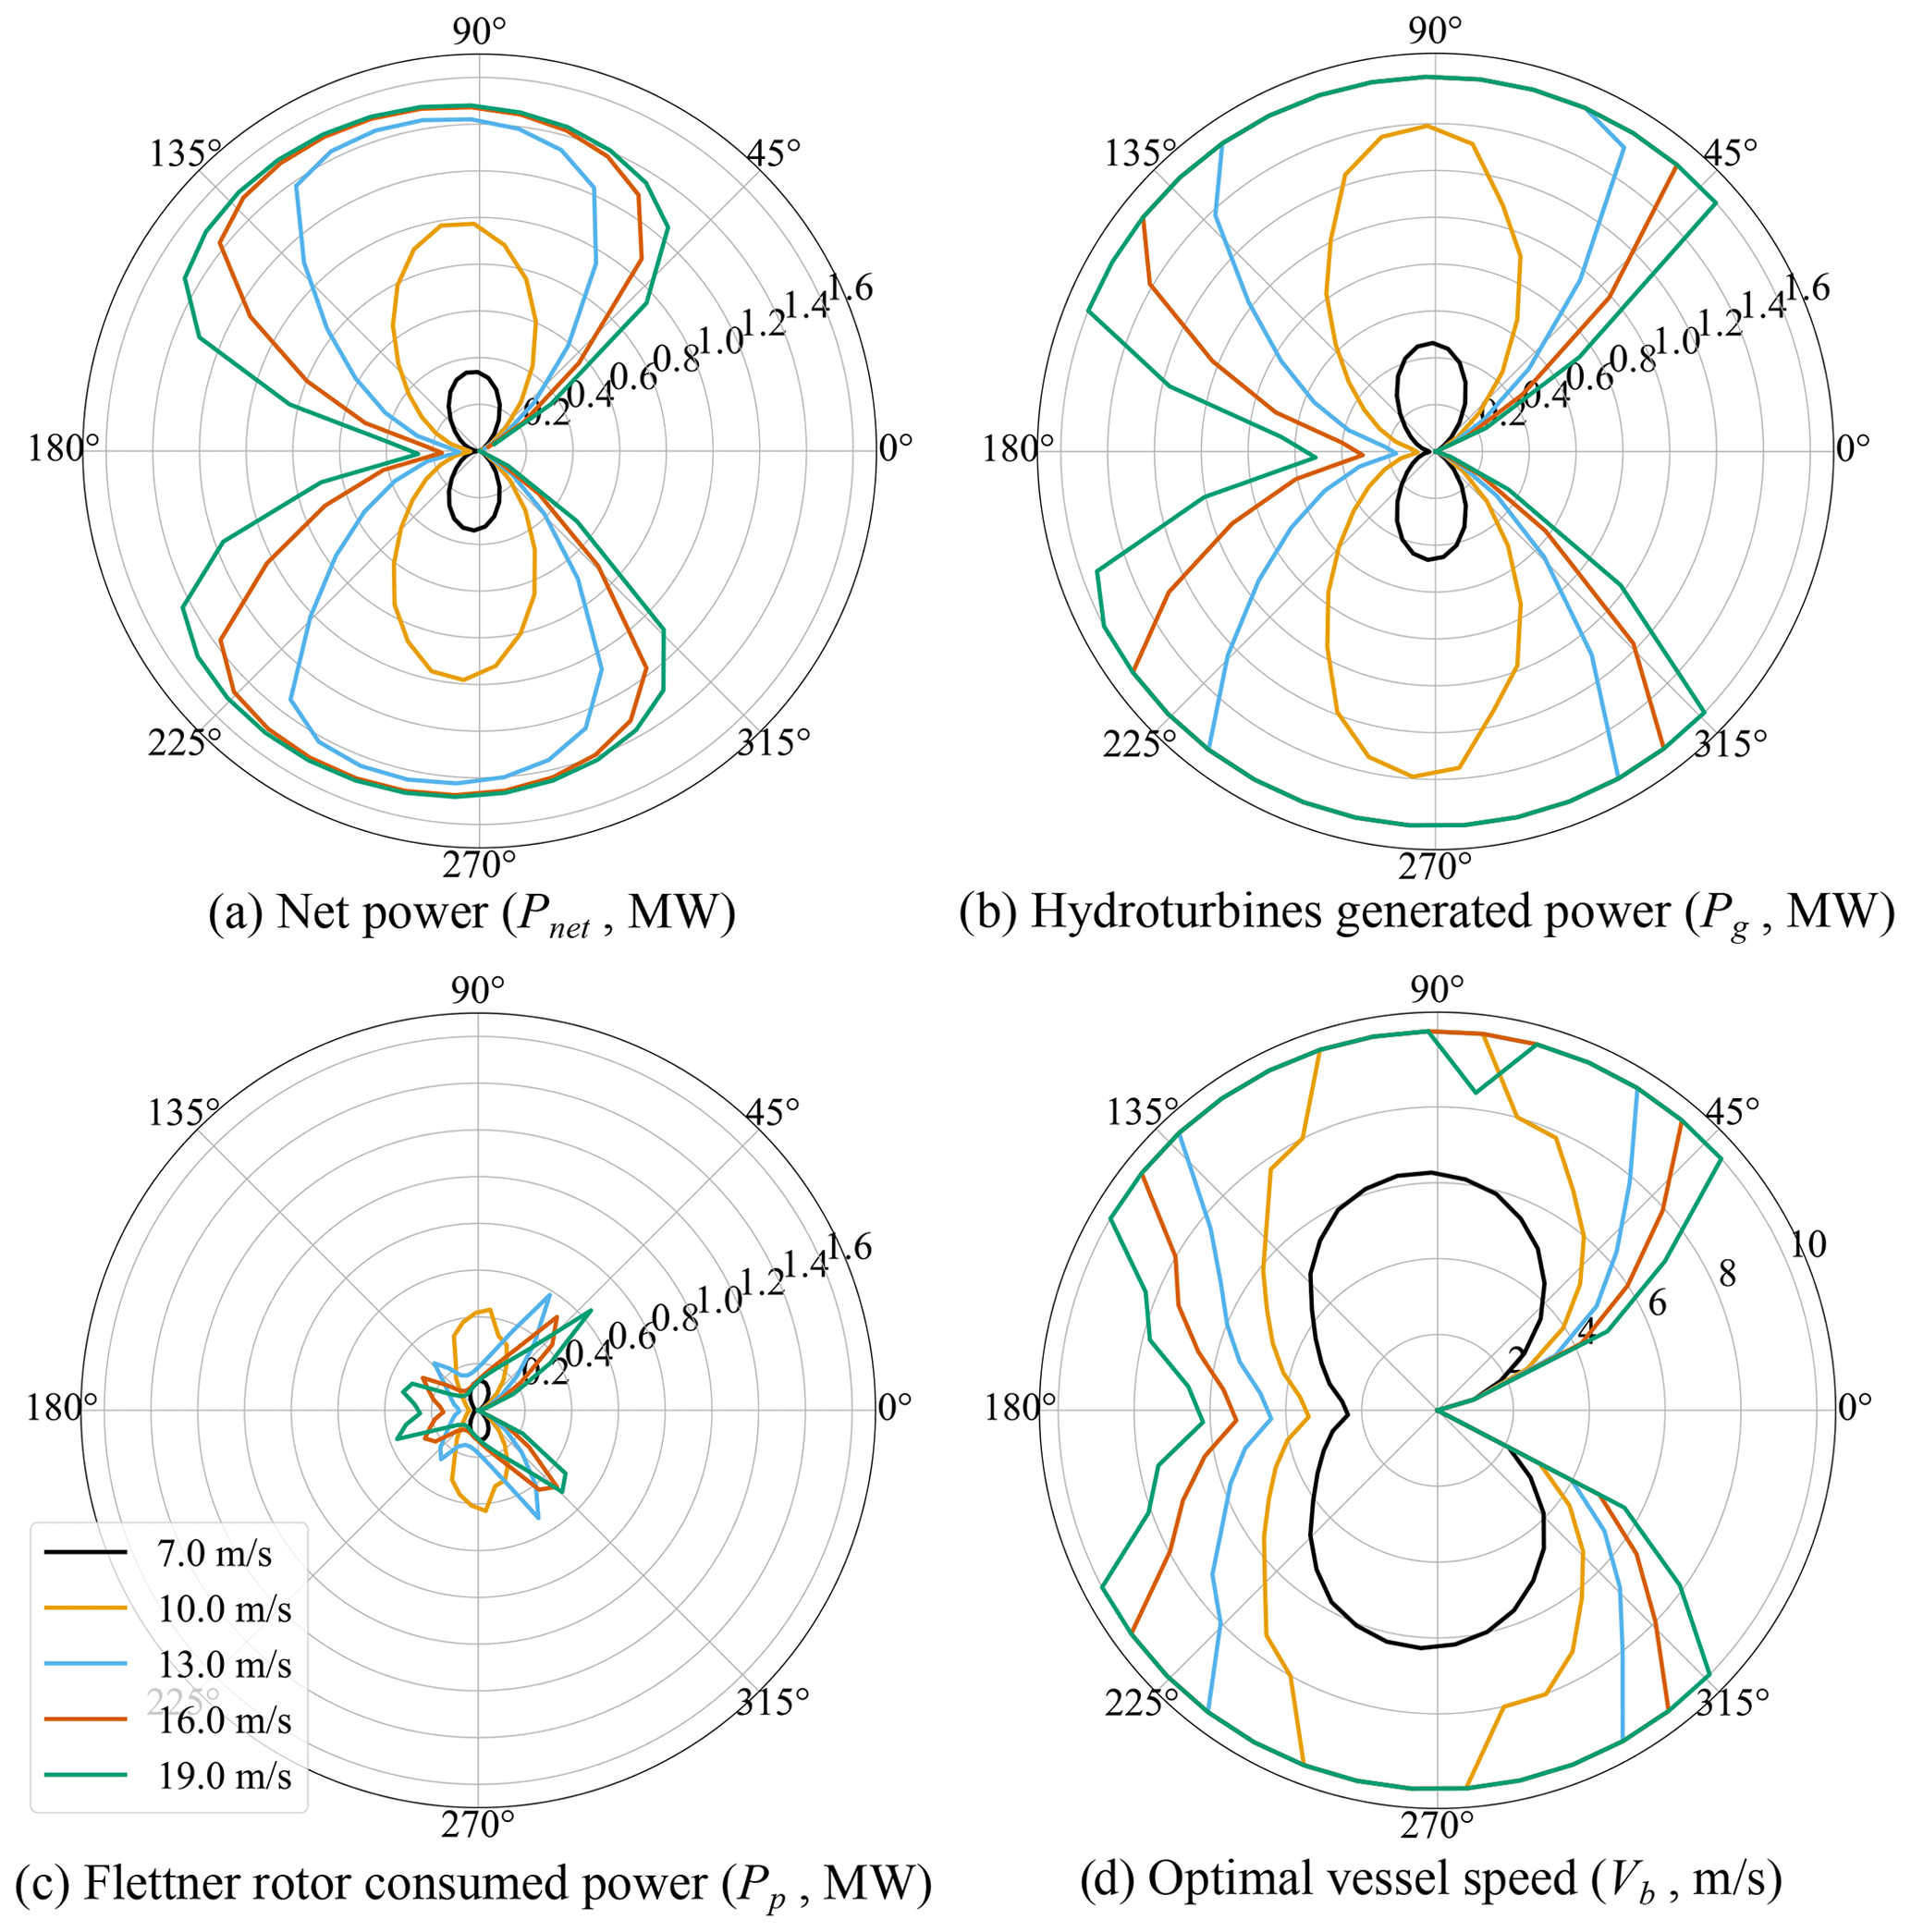
The net power performance for the proposed UFOWT design is shown in Fig. 9 for a range of wind speeds and for all possible true wind angles. Also shown are the power generated by the wind turbine (Pg), the power consumed by the thrusters (Pp), and the optimal speed of the UFOWT (Vb). Most net power is produced at TWA =180∘ or heading directly downwind. This is owing to the fact that in this case the viscous drag on the platform helps to counteract the thrust force from the wind turbine, and so the propellers need not produce as much (or in some cases any) thrust to maintain steady-state velocity. This results in potential operating points where UFOWTs are capable of producing as much power as a conventional wind turbine, albeit only for above-rated wind conditions. Drag on the platform is clearly a key design aspect, as was suggested in Connolly and Crawford (2022). A problem which may need to be considered should a high-drag platform be designed is that changing the platform size and/or shape to increase the viscous drag may also increase wave–platform interaction. Figure 9 shows that for many wind angles the UFOWT operates identically. For more windward (i.e. more upwind) headings the optimization converges to results where the best operating speed is around 0 m s−1 for the wind angle range 90∘ ∘. When there is no potential to benefit, in terms of net power, from platform drag, the default is therefore for the platform to remain stationary. This will have implications on the routing of the UFOWT, since sometimes it may be desirable to move upwind to reach an area with higher local wind speeds or to maintain distance from shore. The proposed UFOWT is capable of producing some net power under all environmental conditions considered.
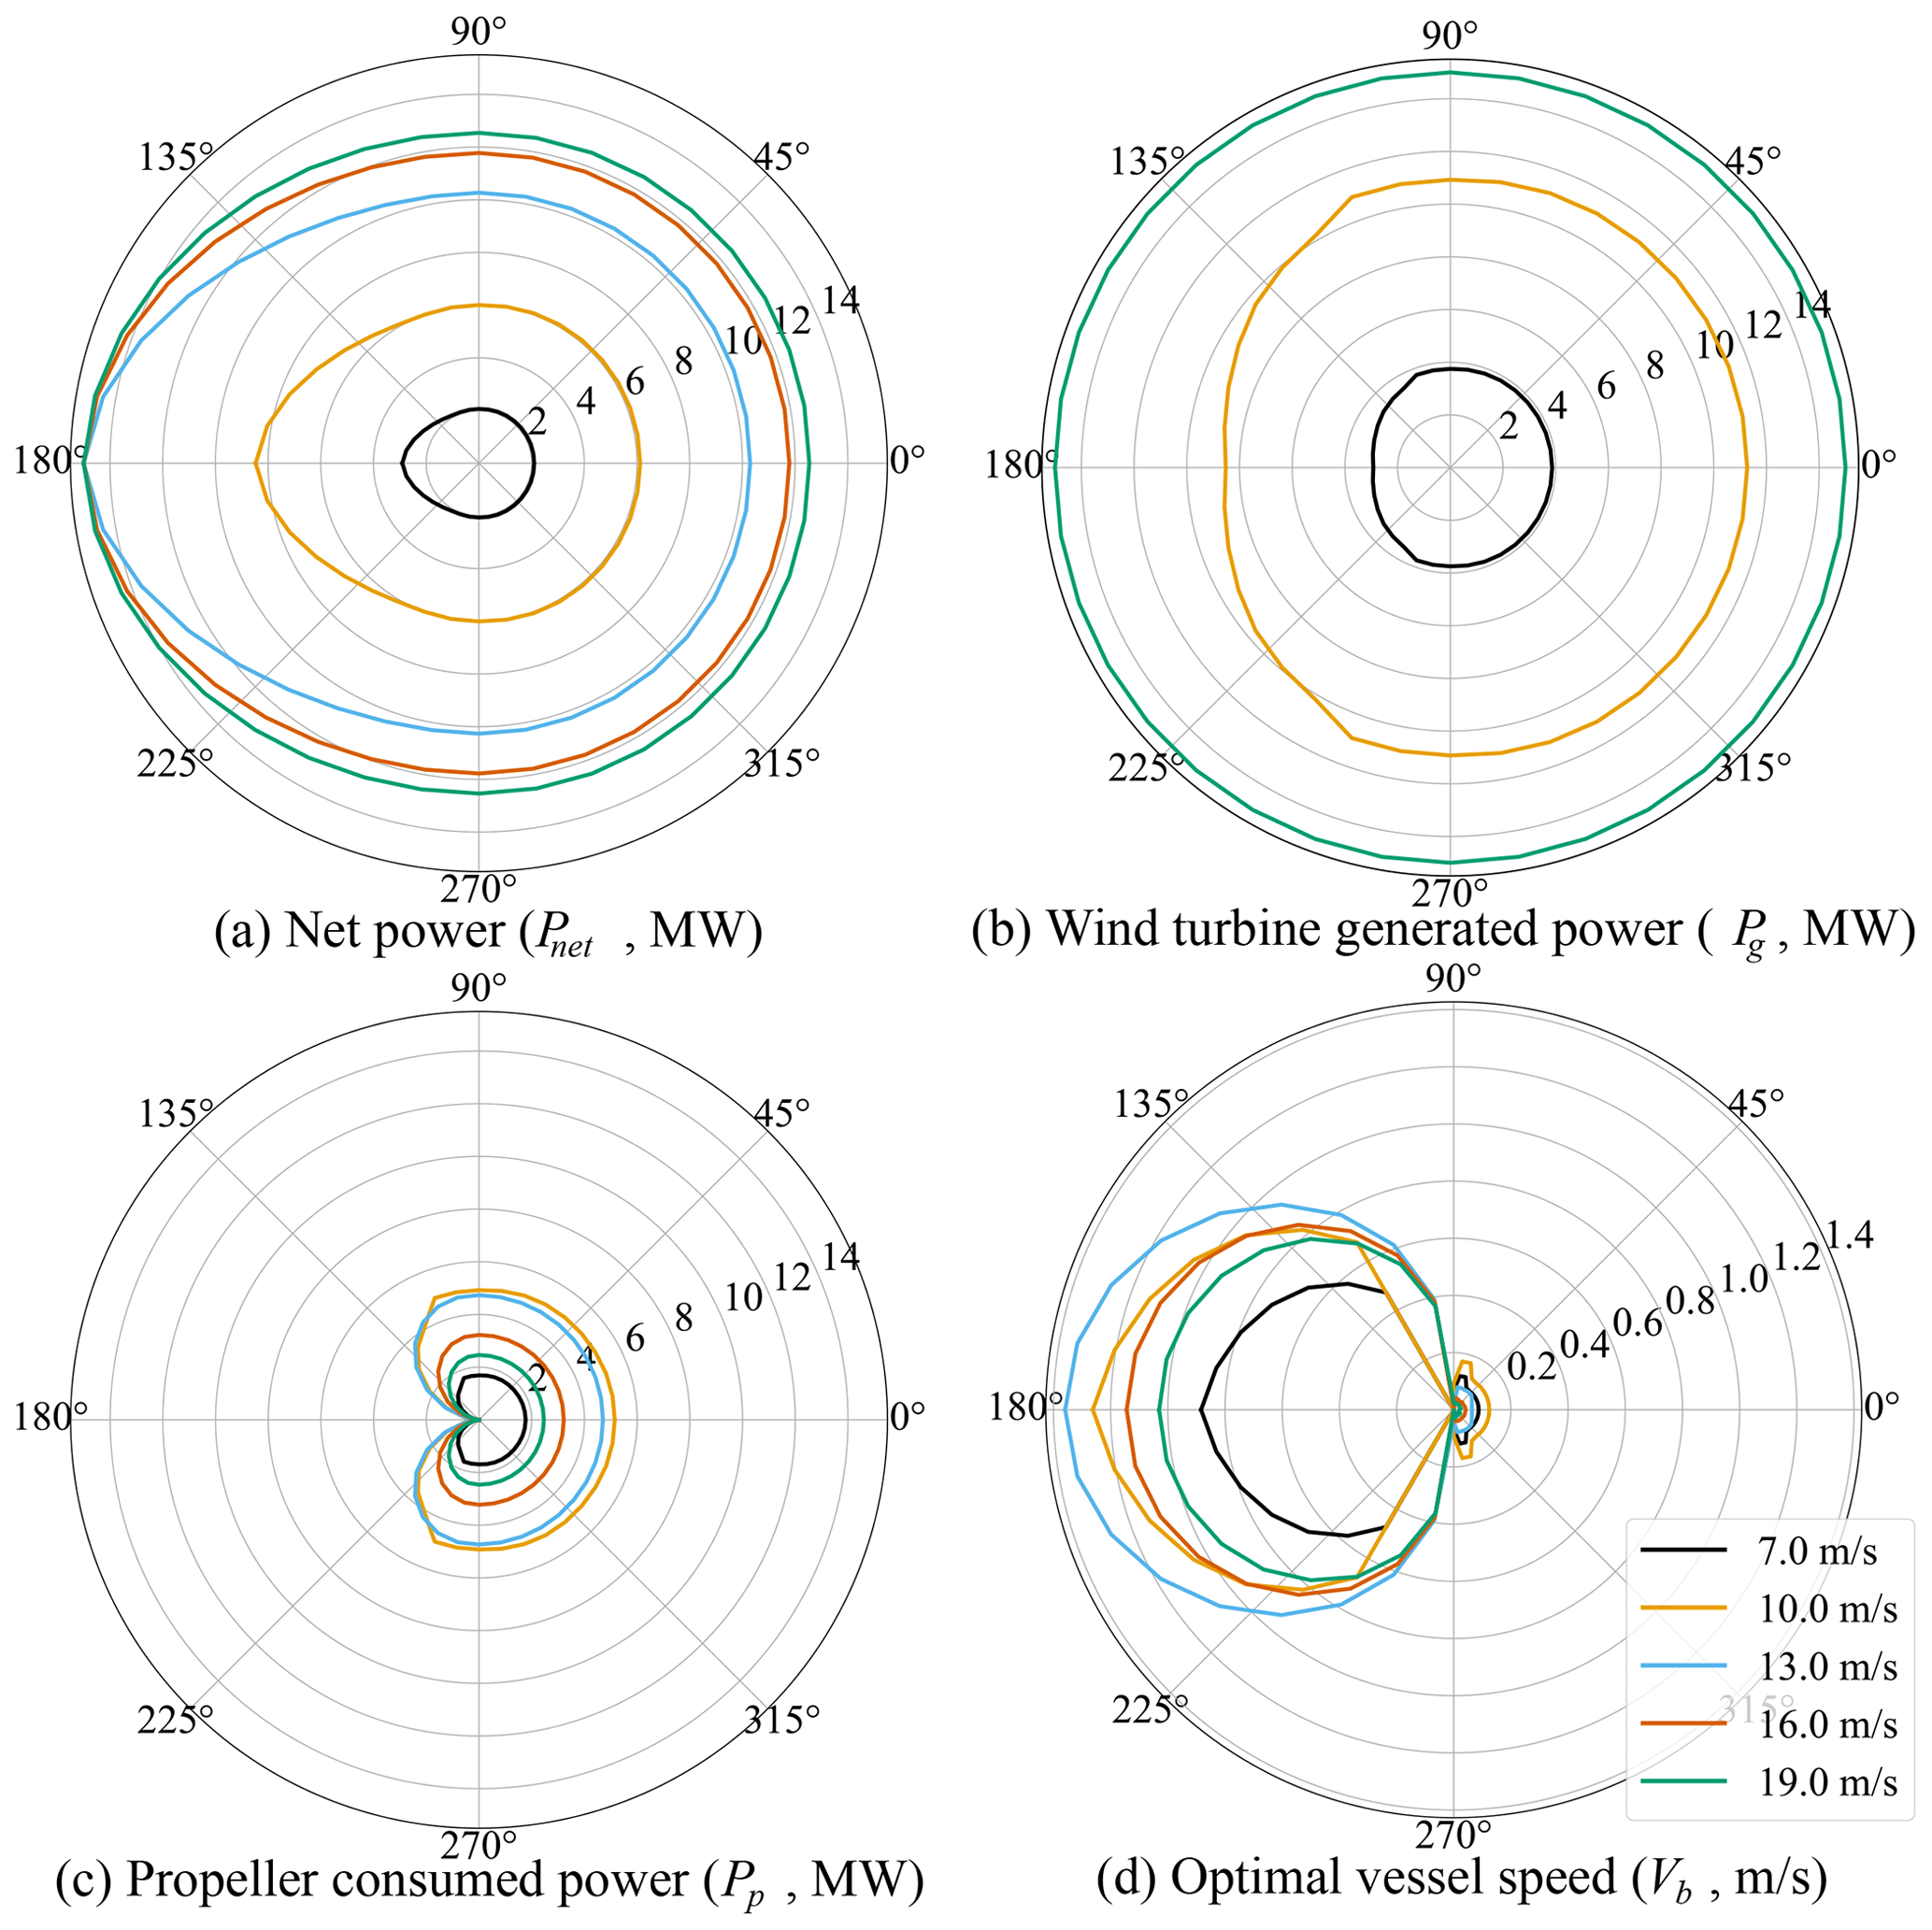
Figure 9Power polar results for UFOWT optimization as a function of V1 (m s−1) for all values of TWA.
The power ratio is also presented in Fig. 10. Previous studies have shown that power ratios of 50 % are to be expected for station-kept UFOWTs (Xu et al., 2021). However, model results here suggest that this represents the worst-case power ratio. The worst case is when the wind turbine is operating in region II, i.e. below rated wind speed, and the thrust is increasing with the square of the wind speed. In above-rated conditions, although the power stops increasing, the thrust begins to decrease. This results in the propellers consuming less power and therefore an overall increase in net power. This effect shows that to accurately predict power performance of an UFOWT, the variation in power and thrust coefficients over different power control regions must be considered.
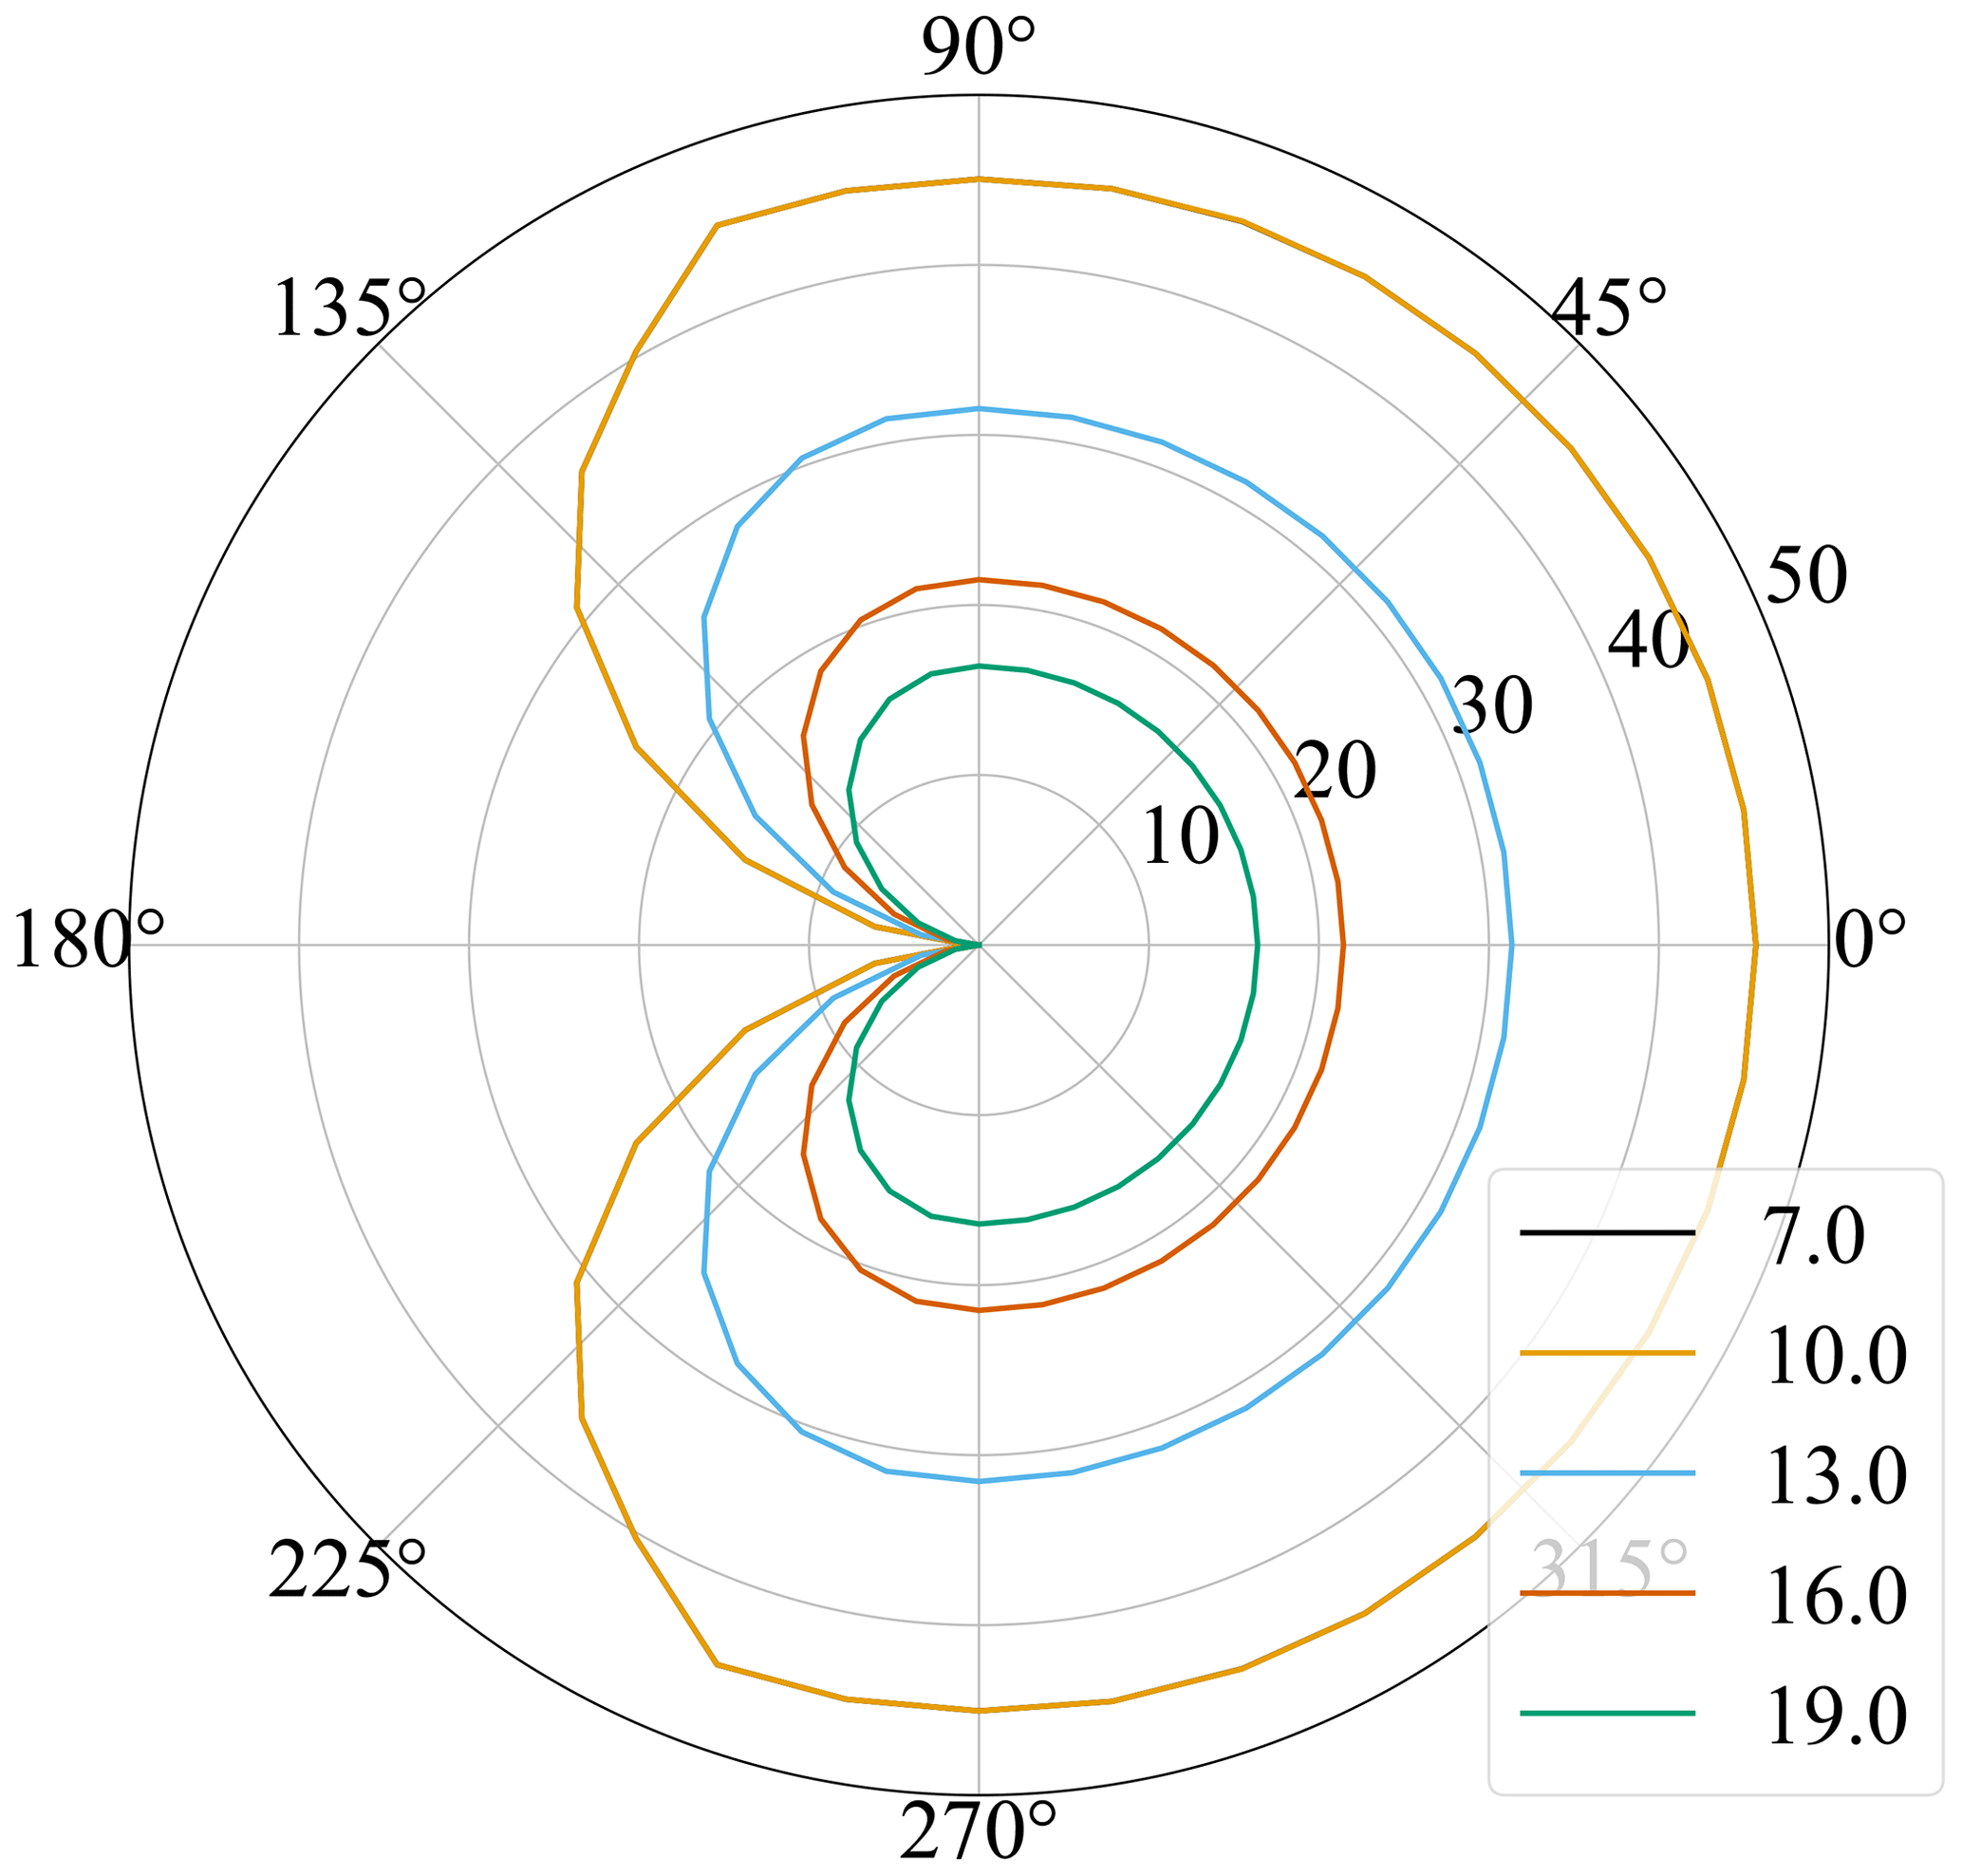
Figure 10UFOWT power ratio (Rp, %) at optimal operating points for various choices of V1 (m s−1) and for all values of TWA. Note that the 7 m s−1 result is hidden by the 10 m s−1 result since they match exactly.
Although not well illustrated by Fig. 9, UFOWTs may operate at very high true wind speeds, above the conventional cut-out speed of a conventional stationary wind turbine. This is owing to the fact that by moving downwind the wind turbine rotor will experience a lower apparent wind speed than the true wind speed. The effect of this is shown in Fig. 11, which shows the power curve of an UFOWT for the ideal wind direction (i.e. 180∘) compared to the IEA 15 MW reference turbine. Note that the regeneration and baseline UFOWT cases overlap perfectly, meaning regeneration is not exploitable for the proposed design. Only the final wind speed differs; at this point the optimizer failed to converge for the regeneration case. Of course, there will be an upper bound to the velocity of the UFOWT owing to constraints on the system dynamics; however, at this stage it is not evident what this limit should be. Figure 11 also illustrates how at low true wind speeds the UFOWT cannot produce as much power as the stationary turbine. For example, at V1= 11 m s−1 just above the rated wind speed of the IEA 15 MW turbine the UFOWT is only able to produce 9.1 MW or 61 % of the power of the stationary turbine. However, by V1= 13 m s−1 the UFOWT is able to generate rated power. Also shown is the power curve of an UFOWT constrained to operate in a stationary position (Vb=0 m s−1), as was assumed by most prior studies (Xu et al., 2021; Alwan et al., 2021). It is obvious that much more power may be produced by a mobile UFOWT than a stationary one. However, allowing the UFOWT to move introduces dynamics and logistical challenges which are not present for a stationary turbine.

Figure 11UFOWT power curve at TWA = 0∘ for the UFOWT baseline case (“base”), the regeneration case (“regen”), a case with mean drift force included, (“md”), the Vb=0 case, and the baseline IEA 15 MW power curve. Note that the UFOWT baseline case is hidden by the regeneration case since they match each other exactly until about 27 m s−1.
The control variable values for a scan of true wind speeds and TWA = 180∘ are shown in Fig. 12. These are the values which result in optimal net power production, for each of the cases examined. Obviously, for both the base IEA 15 MW case and the case where the vessel speed is restricted to be zero, the vessel speed is zero for all wind speeds. Trends for the tip speed ratio (TSR) and pitch are similar across all cases. TSR is constant in region II and decreasing in region III, while pitch is zero in region II (except for the UFOWT case where Vb=0) and then increasing through region III. Since the blades pitch to feather in above-rated speeds, thrust force decreases as V1 increases, and so less drag is required to counteract the thrust to achieve steady-state velocity. This means that the UFOWT's optimal Vb decreases in above-rated conditions. Above the conventional cut-out wind speed, the optimal vessel speed will again increase, because the blades reach their maximum allowable pitch (25∘) and can no longer reduce rotor thrust. In this region, call it region IV, the propellers must push the wind turbine downwind to reduce the apparent wind speed at the rotor to below the cut-out wind speed. There are two caveats to this type of operation; firstly the imposed limit on blade pitch is due to a limit in available data, not a limit on physically pitching the blades. In reality the turbine may be able to continue pitching the blades and operate at rated power for larger wind speeds. Secondly, wind speeds exceeding 25 m s−1 will be rare, even in open-ocean areas, so the impact of this mode of operation on overall energy production is likely minimal. Control and performance results both suggest that developing optimized UFOWT rotors would be beneficial, since the trade-off between wind turbine rotor thrust and power can be included in the design optimization process.

Figure 12Vessel speed, tip-speed ratio, and blade pitch of the UFOWT at optimal operating points for TWA =180∘. Cases shown are the UFOWT baseline case (“base”), the regeneration case (“regen”), a case with mean drift force included, (“md”), the Vb=0 case, and the baseline IEA 15 MW power curve.
3.2.1 Regeneration
Although it may be possible to generate more power by operating the propellers outside of their normal operating range, as is shown in Fig. 11, this is not exploitable for the proposed design. Indeed, optimal net power for the UFOWT in both the baseline case and the case where regeneration is possible is identical. This may be because the propellers perform very inefficiently as turbines. Future studies may consider a variable-pitch propeller that has been designed for this application. Alternatively, dedicated water turbines could be installed in addition to the propellers as was done for the Wind Trawler concept (Annan et al., 2020). In this case, the system was designed holistically around a specific operating speed to guarantee wind and water turbines operate at rated power at the same point.
3.2.2 Mean drift
Inclusion of the mean drift force in the model led to little change in optimal performance of the UFOWT, as is shown in Figs. 11 and 12. There are two reasons the effect is minimal. Firstly, the mean drift force at low wind speeds (i.e. region II) is very small because the associated significant wave height is small for our wind-speed-linked model (i.e. Eq. 16). In Fig. 11 one can see that the power curve is shifted slightly to the right, but the discrepancy is very small relative to the other cases examined. The mean drift force increases with increasing wind speed, and beyond region II it becomes more significant. In regions III and IV the wind turbine thrust force is decreasing faster than the mean drift force is increasing, and so the total force on the UFOWT is decreasing as wind speed increases. That being said, the optimal vessel speed Vb of the UFOWT is affected by the inclusion of mean drift force. Figure 12 shows that Vb in the mean drift case remains higher than the other cases, because the steady environmental forces are greater in this case than the baseline UFOWT case.

Figure 13UFOWT net power production with and without mean drift (labelled “md”) for direct upwind and downwind cases
Figure 13 shows how the inclusion of the mean drift force affects power production in the worst case, moving directly upwind. In upwind conditions, there is a decrease in the net power production because more power is consumed by the thrusters to oppose the mean drift force which is not present in the baseline case. The decrease in net power with the inclusion of mean drift is small overall but does increase with wind speed. We conclude that future analyses should include this force; however, for the sake of a fair comparison between two technologies investigated using similar modelling assumptions, mean drift was omitted from further results in this paper.
3.3 Energy ship
The net power generated by the FARWIND ES concept is shown in Fig. 14, along with power generated, power consumed, and optimal vessel speed. For many sets of conditions the optimal vessel speed is 10 m s−1; this is owing to the shape of the drag curve for the ship hull, which reaches a local minimum at this speed (see Fig. 5); it is not a ceiling effect from a constraint applied to the optimization. For direct headwinds (i.e. TWA = 0∘) and nearby angles, the optimization converged to results which suggested net negative power production. This means the model is physical, in that propeller thrust would be required to drive the ES at and around TWA =0. Like the results for the UFOWT, the power generation of the ES has reflectional symmetry across the x axis. This is because the Flettner rotors can operate equally as well spinning clockwise or anticlockwise. Unlike the UFOWT, ES power performance does not fall off symmetrically on either side of its optimum point. This is owing to the fact that the lift generated by the Flettner rotors to propel the ship is perpendicular to the apparent wind, while the drag is parallel. The most efficient true wind angles for ES operation are driven mostly by the most efficient wind angles for sailing.
3.4 Comparisons
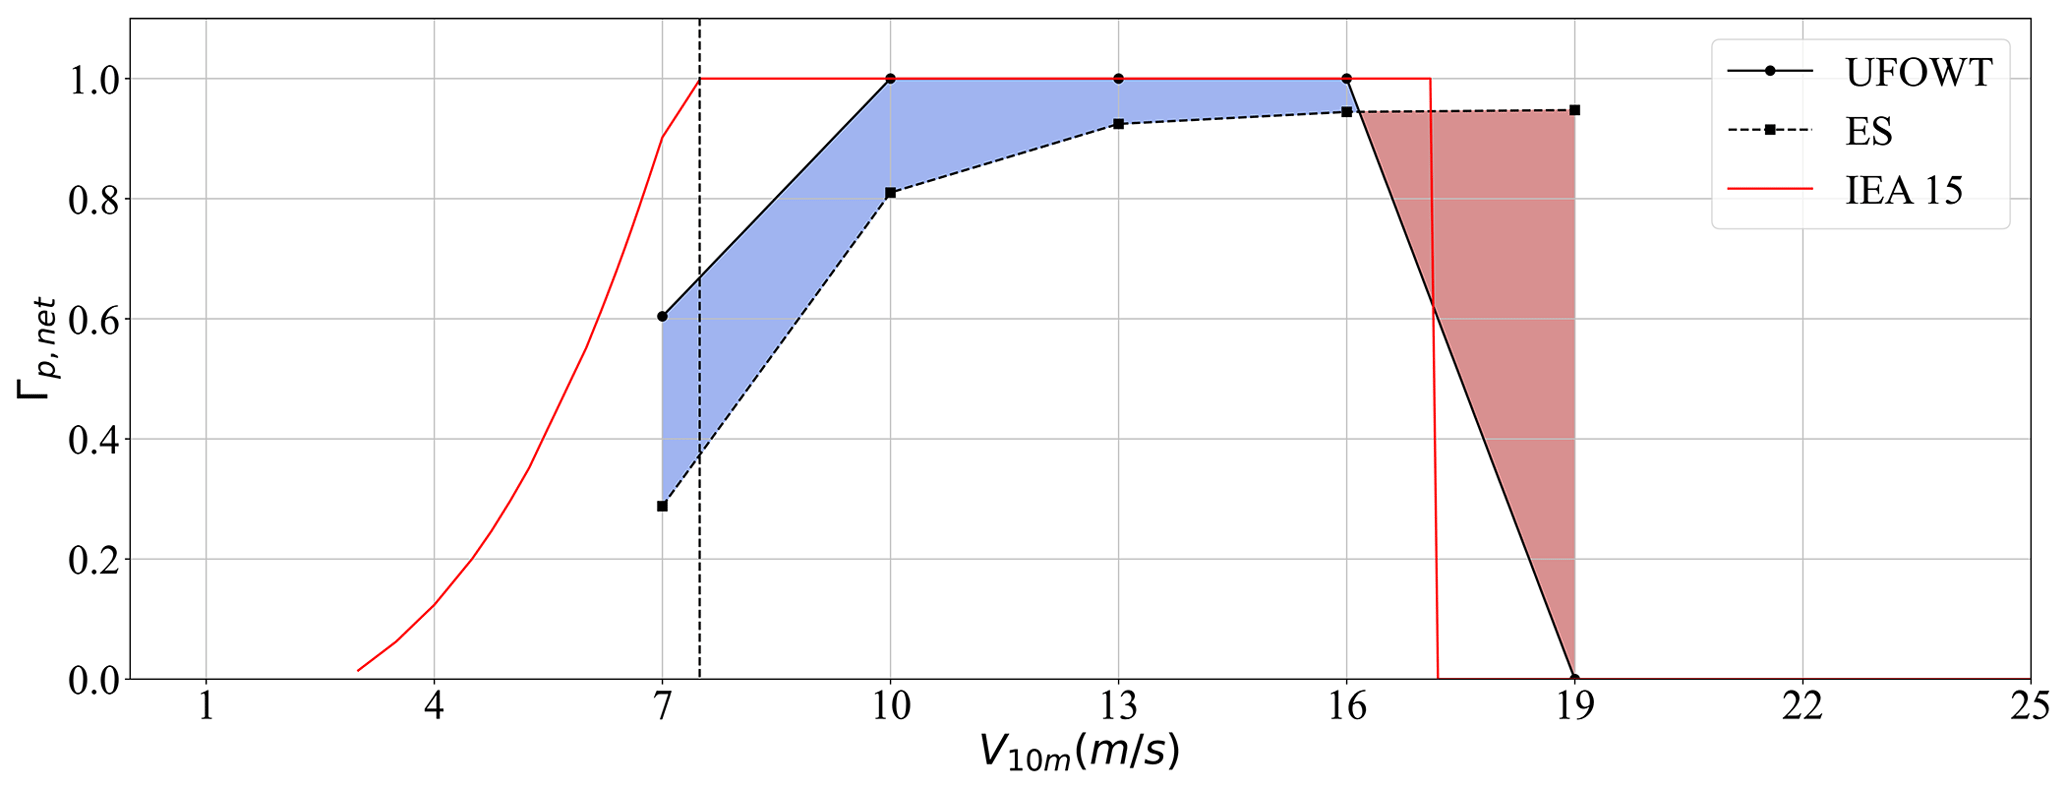
Here the performance of the two technologies predicted by the models is compared to one another. First, Fig. 15 shows the effective power curve of the two technologies compared to the standard power curve for the IEA 15 MW reference turbine. It is assumed that each technology is operating at its optimal wind angle for each wind speed, and the net power is presented as a fraction of each technology's respective rated power (i.e. Γp,net). As was expected, neither technology is able to perform as well as a stationary wind turbine over all wind speeds. However, at above-rated wind speeds the UFOWT is able to generate rated power, whereas the ES is not. No matter the conditions, the ES must always consume some power to spin the Flettner rotors, meaning that it is not possible for it to reach the rated power of the water turbines. Although this suggests that the UFOWT is performing better on a scale of Γp,net, it is also indicative that Γp,net as a metric is not sufficient for comparing the two technologies. This is further discussed in Sect. 4.
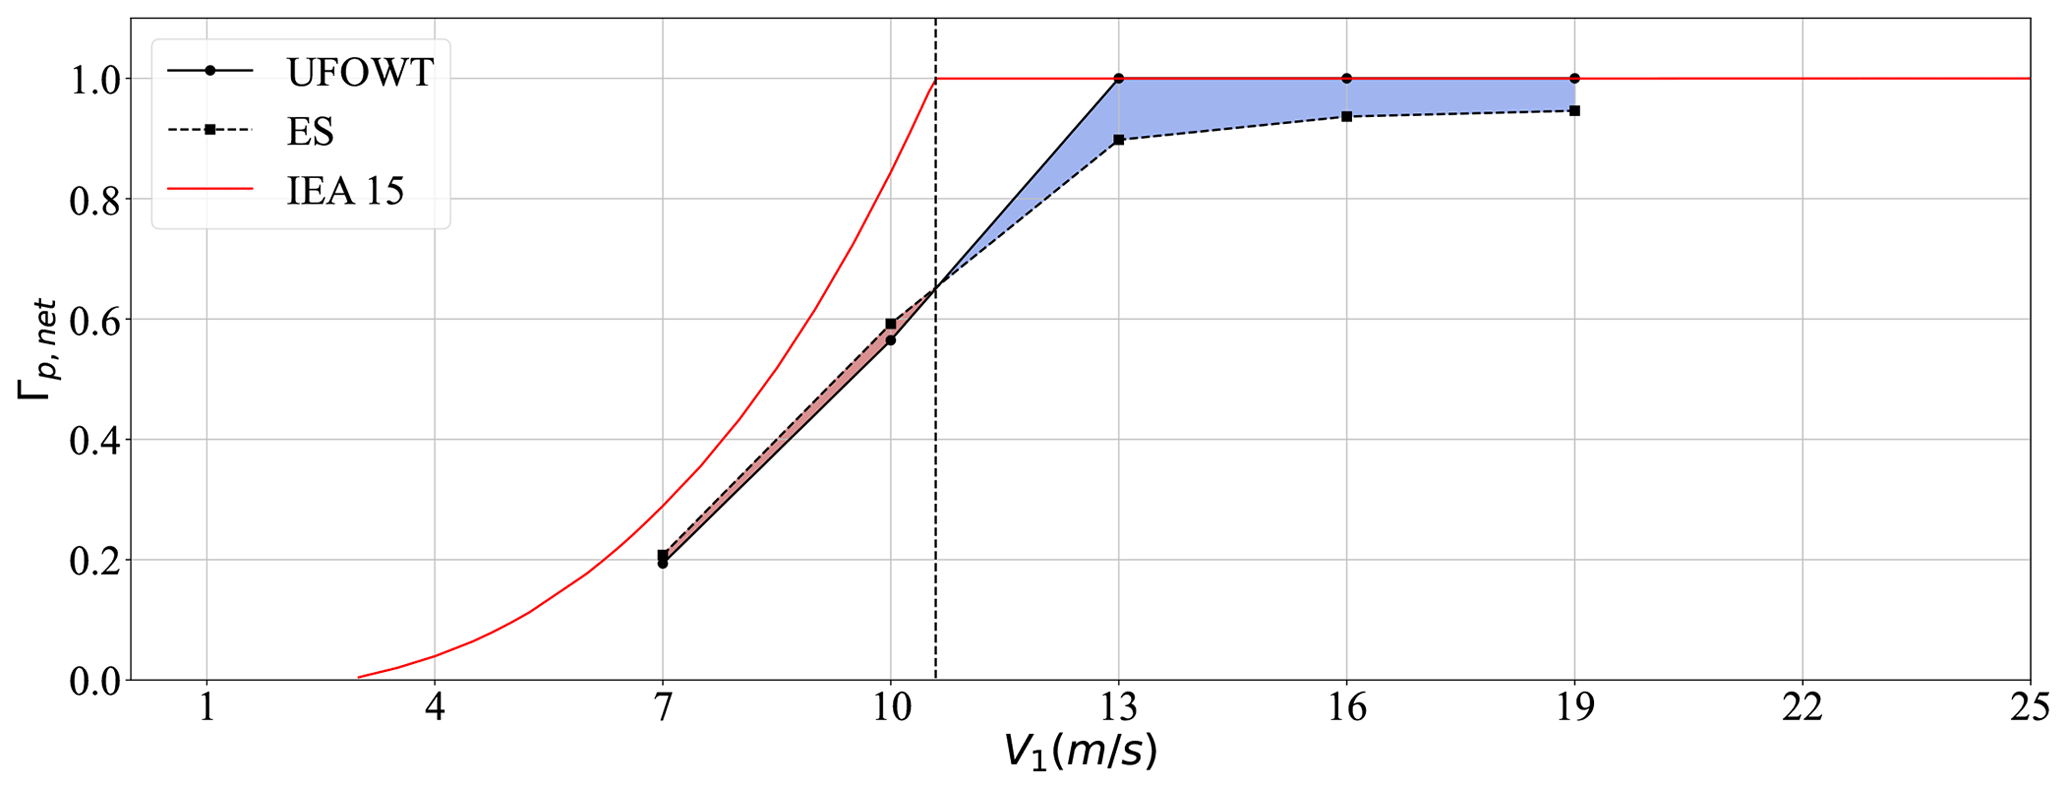
Figure 15Effective power curve of each technology for their ideal values of TWA. Wind speed is assumed equal at the reference height of each technology, as if there is no wind shear, so that both technologies have the same inflow speed. The shaded blue region indicates where the UFOWT outperforms the ES, whereas the shaded red region shows where the ES performs better.
Also of interest is the performance of the two technologies under non-ideal conditions. Since the wind and wave loads are stochastic, unpredictable, and harsh when far offshore, the system actual operating points will differ from their optimal ones frequently. In addition to errors in heading from stochastic wind and waves, performing well over a wide range of headings may also be advantageous for routing a course for the system. Although this is not reflected in the power curve, it may result in increases in the average capacity factor. The reduction in power performance of the technologies when at suboptimal operating points is examined here for deviations in true wind angle and vessel speed separately. In these analyses, the net power is presented as a fraction of the maximum obtainable net power at optimal vessel speed (instead of as a fraction of rated power) for each technology for each wind speed to isolate the effect of changing wind angle.
The sensitivity of the net power of the two technologies to varying TWA from the optima is shown in Fig. 16. For smaller deviations in wind angle (±20∘) the ES maintains better relative power performance in higher wind speeds than the UFOWT. Beyond deviations of 20∘, which technology performs better depends mostly on whether the wind angle is increasing or decreasing. This is because the ES's power performance is not symmetric about its optimal true wind angle, whereas the UFOWT's is symmetric.
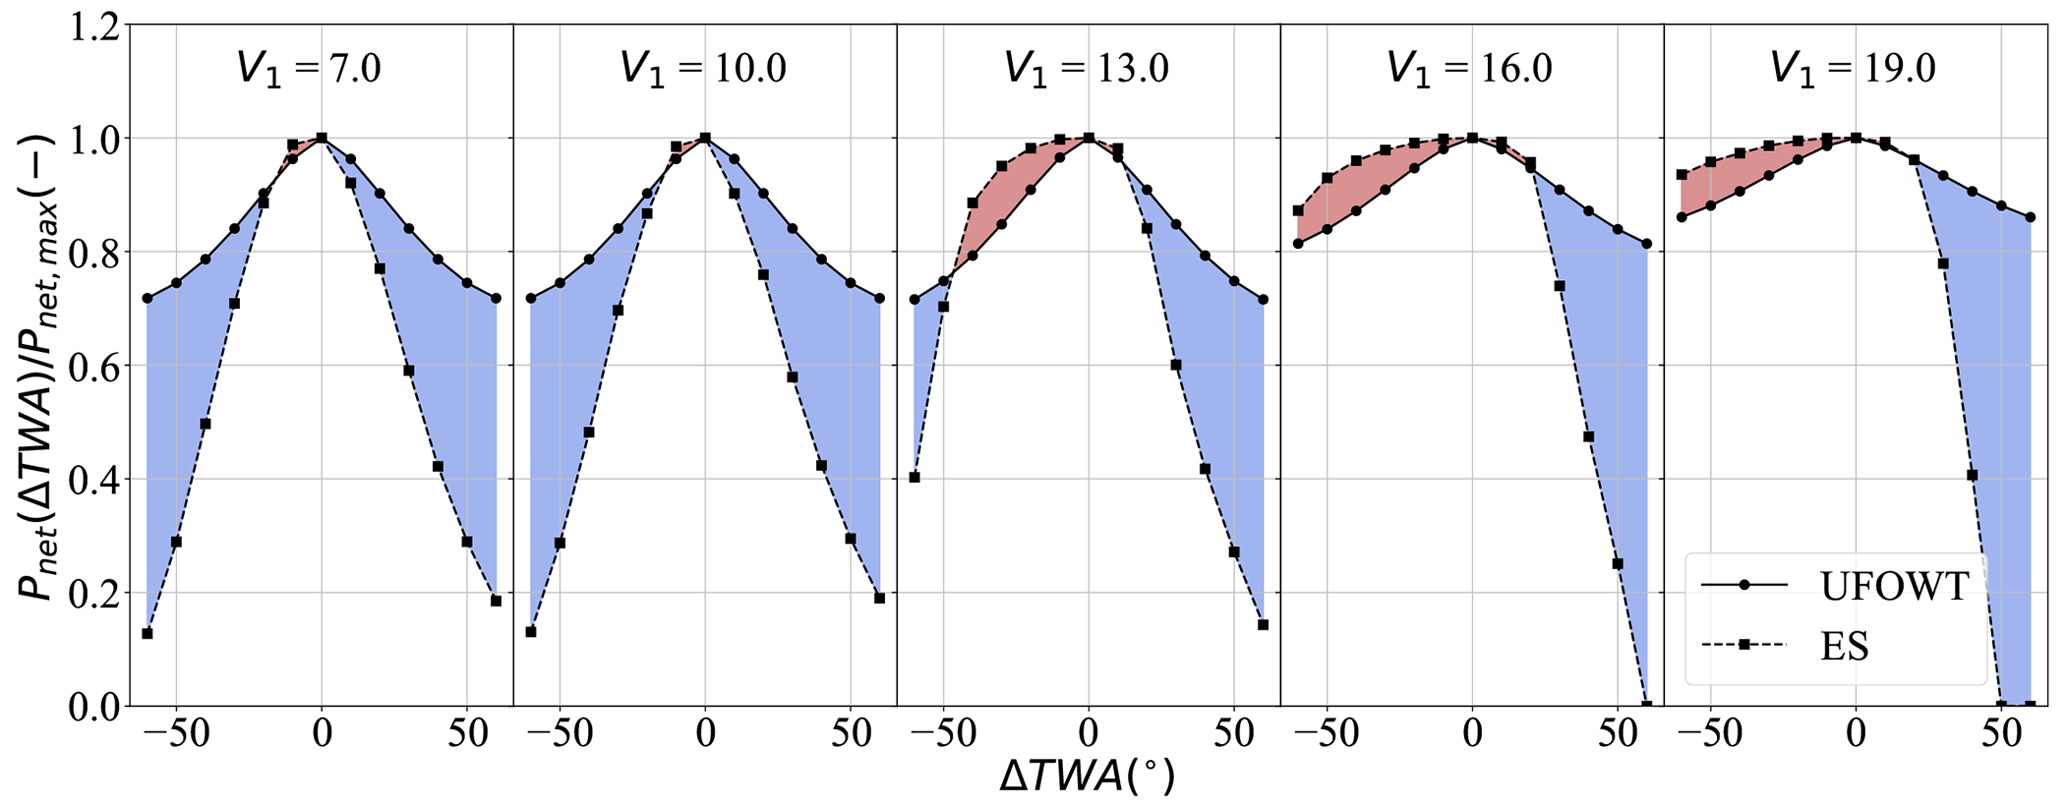
Figure 16Net power loss for operation at suboptimal wind angles. Panels show individual wind speeds (V1, m s−1), and ΔTWA is measured relative to the optimal wind angle for each technology for each wind speed. Power loss () is defined relative to the maximum net power for a given wind speed for a given technology to isolate the effect of changing wind angle.
The sensitivity of net power production to changes in vessel speed is examined in Fig. 17. Both MOWESs' sensitivity to relative changes in vessel speed is quite similar, with ESs outperforming UFOWTs at high wind speeds. UFOWTs' change in net power is noticeably asymmetric over all wind speeds. This is because the optimal case for the UFOWT is TWA = 0∘, meaning increasing vessel speed corresponds to sailing downwind faster. Both a decrease in apparent wind speed at the wind turbine (thus decreasing Pg) and an increase in propeller thrust to overcome drag (thus increasing Pp consumed) come as a result of this increase in speed. At V1=13 m s−1, there is a local optimum for UFOWT performance after increasing vessel speed by about 20 %. This comes about because the wind turbine rotor was initially designed around a rated wind speed of V1=10.6 m s−1, so at this point it sees a local increase in Cp. The caveat to Fig. 17 is that vessel speeds are plotted relative to the optimal vessel speed of each MOWES at each wind speed. This means that, for example, a 20 % increase in vessel speed for the ES will often correspond to a total increase of about 2 m s−1, whereas the same relative increase for an UFOWT will be between 0.2–0.4 m s−1. Absolute differences in vessel speed can be seen from Figs. 9 and 14; from these it is evident that energy ships travel much faster, which is likely an advantage in terms of operation and routing. Overall, similar to the result for sensitivity to TWA, Fig. 17 suggests that ESs will perform somewhat better from a capacity factor perspective than UFOWTs, since they are more flexible to plan routes.
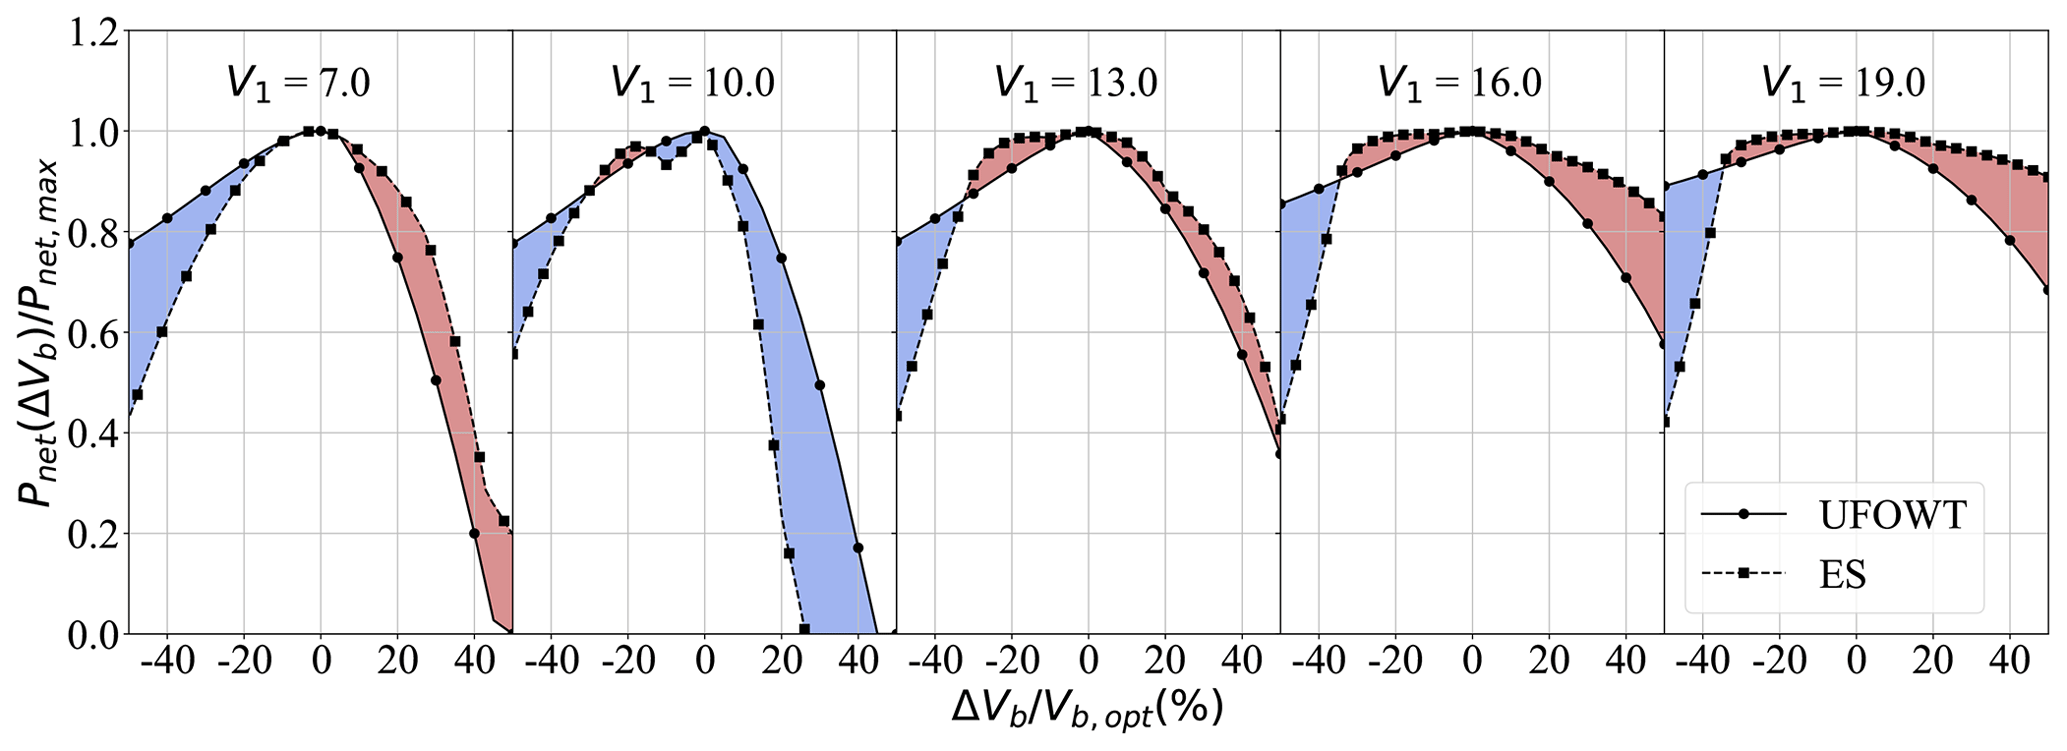
Figure 17Net power loss for suboptimal vessel speeds. Panels show individual wind speeds (V1, m s−1). Vessel speed is plotted as a percentage of the optimal vessel speed (, m s−1) over a range of ±50 % of the optimal vessel speed for the given V1 and the optimal TWA.
3.4.1 Wind shear effect
All figures presented thus far show power production at the reference height for each technology, respectively. However, the two technologies are very different heights. As discussed in Sect. 2.4, this means that the UFOWT will experience much higher average wind speeds than the ES owing to the wind shear effect. Correcting for this, the normalized net power performance of each technology is shown in Fig. 18 as a function of the true wind speed at a constant reference height of 10 m. When accounting for this difference, the UFOWT outperforms the ES for all wind speeds for ideal TWA values except for the last one, V10 m=19 m s−1. As seen in Table 3 at wind turbine hub height, this corresponds to V1=27.76 m s−1, well above the cut-out speed for the conventional wind turbine. Although UFOWTs tend to reduce the local wind speed by moving downwind, in this case the UFOWT is not able to move downwind fast enough to reduce the wind speed to below the cut-off speed. This is an aspect of UFOWT design which can be explored further in future studies. Because of wind shear, the performance comparison in Fig. 15 may be misleading; however, it was included since it is conventional to present power curves as a function of the wind speed at hub height, not at a reference height. The impact of wind shear is heavily design dependent, since it relates directly to the height of the technologies. However, the designs proposed use the largest available Flettner rotors and the largest published reference wind turbine to make the comparison as fair as possible. This point must be carefully considered in the overall comparison of MOWESs, as scale will impact both (i) dynamic feasibility and (ii) component and subsystem design and availability.
In the subsections that follow, the limitations of the models and analysis are discussed. By virtue of being a preliminary idealized analysis of the performance of these technologies, many facets of the design and operation of a MOWES were overlooked.
4.1 Model concessions and future improvements
Operating points that maximize the net power for each technology were computed in a 2-degrees-of-freedom steady-state model of the system. Two bulk assumptions are made for these models: the assumption of steady state and the modelling of only 2 degrees of freedom. Each of these assumptions leads to omissions of details that should be considered by other models in the future. Firstly, analysing only the steady states of the system allows the omission of dynamic wind and wave loading. Studying the response of these systems to these loads, as has been done for moored FOWTs, is imperative to understanding whether they are feasible and what design and controls modifications are required. Standard operational design load cases and extreme events will need to be analysed, since the system loads and response may differ greatly from a moored FOWT in both cases. These studies may also help refine estimates of power performance by considering power production under dynamic inflow conditions. Secondly, by only modelling the surge and sway degrees of freedom, much is left out of the analysis. Modelling only surge and sway is adequate for representing the dominant steady loads on the system; however, future studies should consider more degrees of freedom. It will be especially important to analyse the pitching of each system when operating in severe wave conditions. The yaw behaviour of the UFOWT is also important to analyse, since to effectively generate power the wind turbine should minimize yaw error. Yaw moments on a moored floating wind turbine are counteracted by the mooring system; however, with no moorings the moments must be counteracted by other means. This may be through operation of the propellers or other methods such as individual blade pitch control for the wind turbine (Sandua-Fernández et al., 2022).
In addition to the assumptions above, some steady loads have also been omitted from the analysis. These are namely mean drift wave loading and loads from ocean currents. As mentioned in Sect. 1, mean drift loads were considered in a previous modelling study of UFOWTs (Alwan et al., 2021). However, for the semi-submersible platform used here it was shown in Sect. 3.2.2 that mean drift loads have a relatively small impact on the performance. A caveat is that we use a procedure for computing mean drift loads which is conventional for station-kept bodies. We adapt the method to account for the change in wave spectrum due to the frequency of encounter, but we use the QTF for a non-translating body. For a steadily translating body, potential flow theory and linear hydrodynamics theory may need to be adapted as is presented in Lewandowski (2004). The effect of ocean current is omitted for simplicity, although it has been shown that currents can have a significant impact on the power generated by an UFOWT (Xu et al., 2021; Connolly and Crawford, 2022). Currents will affect UFOWTs and ESs differently and therefore will impact the comparisons presented here, but as of yet the effect of currents on the performance of ESs has not been considered in any other study. Ocean currents should also be considered in larger-scale routing analysis as well, as they will impact on overall system trajectories.
There are many aspects which should be kept in mind when evaluating the comparisons between ESs and UFOWTs presented here (Figs. 15, 16, 18). One such aspect is that the design of both systems should undergo further iteration. Neither design has yet been optimized, in terms of subsystem design or overall sizing, for cost or power production. To establish a more fair comparison between the two technologies would require design optimization studies for each; however, this is far beyond the scope of the present work. We must also consider that there are effects outside of the scope of this work that will affect power production. Many such effects would only be realizable with a dynamic model of each system, which must be developed in the future to further advance these concepts.
4.2 Metrics of performance
The power performance of these systems has been compared under many environmental conditions; however, this alone is not adequate for determining if one or both of these technologies is feasible. More information is also required for clearly determining if one technology is a better candidate for further development than the other. Ideally, the two technologies would be compared on a basis of levelized cost of energy (LCOE) first, as well as other metrics such as the life-cycle emissions of the technologies and their impact on other sustainable development goals. Although there is existing and ongoing research into additional study of ESs, including cost predictions, so far UFOWTs have many more research gaps. To reasonably estimate the LCOE of an UFOWT will require dedicated design optimization work as well as implementation of a weather-routing algorithm for capacity factor optimization of UFOWTs, as has been done for ESs. The present work has performed some preliminary steps which are necessary for these proposed further works.
Comparing the two technologies on the basis of power performance has some inherent flaws. By directly comparing the power performance of the two, it is as if all other dimensions are assumed equal (or perhaps irrelevant) for the two technologies. In reality, there are many other dimensions which are equally as important. The first of which, as was mentioned above, is the cost of the system. Since ultimately the viability of MOWESs depends on whether or not they will be able to produce a valuable product (i.e. green e-fuel) at a profit, ultimately the cost per unit power should be considered. Here, the net power is instead normalized by the rated power of the system (Γp,net), which provides a less valuable means of comparison. An issue with Γp,net is that ESs can fundamentally never reach their nameplate rated power, specifically, the nameplate capacity of the water turbines installed. Thus Γp,net may be misleading, since at first glance it may seem that under ideal conditions both technologies should reach . This shows that for ESs the water turbine generators must be designed to be oversized, since some power will always be consumed to run the Flettner rotors. Indeed, ESs might also benefit from the use of rigid sails or kites as alternative propulsion technologies to avoid this issue. Normalizing by the rated power of each system also implies that the power curves and power polars for each system would scale linearly with increasing rated power. This assumption is valid in the case where multiples of the same design are deployed; i.e. a fleet of ten 1.5 MW ESs could be directly compared to a 15 MW UFOWT. However, for individual systems with different rated powers (i.e. a 5 MW wind turbine vs. a 15 MW wind turbine), this assumption may not hold exactly, since many design aspects may change.
There are many factors other than power production that are also important for the feasibility of MOWESs. One such factor is the system stability while in operation, as discussed earlier. The operational vessel speeds will strongly play into the dynamics of each system, and so it is important to also compare them. Under most operating conditions where the ES is producing considerable power, it is travelling at a speed of 10 m s−1 or about 20 kn (see Fig. 14). This is comparable to average speeds of container ships which range from 18–24 kn (Wang et al., 2019; Mao et al., 2016) but is much slower than the largest high-speed catamarans which travel at around 38 kn (Jacobi et al., 2014). For high-speed vessels in severe wave environments, wave-slamming loads and subsequent whipping effects may be crucial to the operation and lifetime of the vessel and so should also be considered for ESs in the future (Jacobi et al., 2014; Thomas et al., 2011). While the UFOWT travels much slower, only around 1–3 m s−1 (see Fig. 9), it is a much taller and heavier structure. No matter the effect of speed on the dynamics of the systems, moving faster may be an asset operationally, since it means the system can return to offload fuel more quickly and also travel to far-offshore areas with high wind speeds more quickly. This effect and the robustness of each technology to operate in non-ideal true wind angles (headings) come into play when determining routes for the system which maximize fuel/energy production, such as in Abd Jamil et al. (2019).
4.3 Other differences
Although this work has focused on quantitatively comparing the two MOWES technologies discussed, other important qualitative differences also exist between the two. One such difference is that each will rely on different supply chains to be manufactured at a large scale. UFOWTs will benefit greatly from the existing wind turbine manufacturers, as well as port infrastructure that is being developed for FOWTs and continues to develop as power grids become more electrified. On the other hand, ESs may benefit from growth of the wind propulsion sector, as the shipping sector decarbonizes. While some examples of deployed full-scale wind propulsion technologies exist, the global manufacturing capacity for wind turbine components is much greater.
As the offshore wind industry grows, far-offshore wind systems should be considered as an option for green e-fuel production. Steady-state, 2-degrees-of-freedom models of two candidate MOWESs, the ES and the UFOWT, are presented. The ES model is adapted from the work of Babarit et al. (2021b) to compare the power performance of ESs to that of UFOWTs. The UFOWT model achieves steady state in surge and sway by determining the thrust required by the propellers to sustain wind turbine thrust loads as well as platform drag. Both technologies have dedicated subsystems for power generation and subsystems which consume power for propulsion. An optimization is employed to determine operating points for these systems that maximize net power generation over a range of possible wind speeds and wind angles.
Model results presented show some relative strengths of the ES and the UFOWT when compared to one another. While an UFOWT is able to produce a higher fraction of its rated power under ideal wind conditions compared to an ES, an ES is more robust to operating in various wind angles as well as various vessel speeds. Both peak operating efficiency and robustness to operating in suboptimal conditions will impact the capacity factor of the systems. A relative advantage of UFOWTs over ESs is that they benefit more from the effect of wind shear because of their prodigious height. Regeneration via the propellers was not an exploitable means of power generation for the UFOWT design used here; however, it may be exploitable given a more rigorous design process. Further work is required to compute estimates of the capacity factor of an UFOWT to be compared to published ES capacity factors. Neither technology should be ruled out as a potentially cost-effective, novel, means of producing green e-fuels that are necessary for the ongoing global energy transition.
Source codes for the model presented and data used in system case studies are available from the corresponding author (Patrick Connolly) upon request.
PC: conceptualization, methodology, software, validation, formal analysis, investigation, and visualization. CC: methodology, resources, writing (review and editing), supervision, and funding acquisition.
The contact author has declared that neither of the authors has any competing interests.
Publisher’s note: Copernicus Publications remains neutral with regard to jurisdictional claims in published maps and institutional affiliations.
The authors would like to acknowledge the Pacific Institute for Climate Solutions (PICS) for funding this work.
This research has been supported by the Pacific Institute for Climate Solutions.
This paper was edited by Amy Robertson and reviewed by Aurélien Babarit and one anonymous referee.
Abd Jamil, R., Chaigneau, A., Gilloteaux, J.-C., Lelong, P., and Babarit, A.: Comparison of the capacity factor of stationary wind turbines and weather-routed energy ships in the far-offshore, J. Phys.-Conf. Ser., 1356, 012001, https://doi.org/10.1088/1742-6596/1356/1/012001, 2019. a, b, c
Abd Jamil, R., Gilloteaux, J., Lelong, P., and Babarit, A.: Investigation of the Capacity Factor of Weather-Routed Energy Ships Deployed in the Near-Shore, in: Proceedings of the ASME 2021 3rd International Offshore Wind Technical Conference, ASME 2021 3rd International Offshore Wind Technical Conference, Virtual, Online, 16–17 February, 2021, V001T01A003 https://doi.org/10.1115/IOWTC2021-3545, 2021. a
Allen, C., Viscelli, A., Dagher, H., Goupee, A., Gaertner, E., Abbas, N., Hall, M., and Barter, G.: Definition of the UMaine VolturnUS-S Reference Platform Developed for the IEA Wind 15-Megawatt Offshore Reference Wind Turbine, Tech. Rep. NREL/TP-5000-76773, 1660012, MainId:9434, https://doi.org/10.2172/1660012, 2020. a, b, c, d, e, f
Alwan, R., Babarit, A., and Gilloteaux, J. C.: Investigation of a dynamically positioned floating offshore wind turbine concept, J. Phys.-Conf. Ser., 2018, 012001, https://doi.org/10.1088/1742-6596/2018/1/012001, 2021. a, b, c, d
Annan, A. M., Lackner, M. A., and Manwell, J. F.: Wind Trawler: operation of a wind energy system in the far offshore environment, J. Phys.-Conf. Ser., 1452, 012031, https://doi.org/10.1088/1742-6596/1452/1/012031, 2020. a, b
Baba, E.: Wave resistance of ships in low speeds, Tech. rep., Nagasaki Technical Institute, https://repository.tudelft.nl/islandora/object/uuid:8fb1f3f7-fe76-4548-9597-28bd5e07e2bb/datastream/OBJ/download (last access: 6 March 2023), 1976. a
Babarit, A., Gilloteaux, J.-C., Clodic, G., Duchet, M., Platzer, M. F., and Simoneau, A.: Techno-economic feasibility of fleets of far offshore hydrogen-producing wind energy converters, Int. J. Hydrogen Energ., 43, 7266–7289, https://hal.archives-ouvertes.fr/hal-01766205 (last access: 10 November 2020), 2018. a
Babarit, A., Clodic, G., Delvoye, S., and Gilloteaux, J.-C.: Exploitation of the far-offshore wind energy resource by fleets of energy ships – Part 1: Energy ship design and performance, Wind Energ. Sci., 5, 839–853, https://doi.org/10.5194/wes-5-839-2020, 2020a. a
Babarit, A., Clodic, G., Delvoye, S., and Gilloteaux, J.-C.: Exploitation of the far-offshore wind energy resource by fleets of energy ships – Part 1: Energy ship design and performance, Wind Energ. Sci., 5, 839–853, https://doi.org/10.5194/wes-5-839-2020, 2020b. a, b, c
Babarit, A., Abdul Ghani, N., Brouillette, E., Delvoye, S., Weber, M., Merrien, A., Michou, M., and Gilloteaux, J. C.: Experimental validation of the energy ship concept for far-offshore wind energy conversion, Ocean Eng., 239, 109830, https://doi.org/10.1016/j.oceaneng.2021.109830, 2021a. a
Babarit, A., Gorintin, F., de Belizal, P., Neau, A., Bordogna, G., and Gilloteaux, J.-C.: Exploitation of the far-offshore wind energy resource by fleets of energy ships – Part 2: Updated ship design and cost of energy estimate, Wind Energ. Sci., 6, 1191–1204, https://doi.org/10.5194/wes-6-1191-2021, 2021b. a, b, c, d, e, f, g, h, i, j, k, l, m, n, o
Bernitsas, M. M., Ray, D., and Kinley, P.: Kt, Kq, and Effficiency Curves for the Wageningen B-Series Propellers, Tech. Rep. 237, University of Michigan, Departmenet of Naval Architecture and Marine Engineering, University of Michi, https://hdl.handle.net/2027.42/91702 (last access: 14 January 2022), 1981. a, b, c, d, e
Burton, T., Jenkins, N., Sharpe, D., and Bossanyi, E.: Aerodynamics of Horizontal Axis Wind Turbines, in: Wind Energy Handbook, John Wiley & Sons, Ltd, 39–136, https://doi.org/10.1002/9781119992714.ch3, 2011a. a
Burton, T., Jenkins, N., Sharpe, D., and Bossanyi, E.: The Wind Resource, in: Wind Energy Handbook, John Wiley & Sons, Ltd, 9–38, https://doi.org/10.1002/9781119992714.ch2, 2011b. a
Carlton, J. S.: Marine Propellers and Propulsion, Elsevier, 2nd edn., https://linkinghub.elsevier.com/retrieve/pii/B9780750681506X50001 (last access: 5 February 2021), 2007. a
Clodic, G., Babarit, A., and Gilloteaux, J.-C.: Wind Propulsion Options for Energy Ships, American Society of Mechanical Engineers Digital Collection, https://doi.org/10.1115/IOWTC2018-1056, 2018. a
Connolly, P. and Crawford, C.: Analytical modelling of power production from Un-moored Floating Offshore Wind Turbines, Ocean Eng., 259, 111794, https://doi.org/10.1016/j.oceaneng.2022.111794, 2022. a, b, c, d, e
DNVGL: Load and site conditions for wind turbines, Standard DNVGL-ST-0437, https://www.dnv.com/energy/standards-guidelines/dnv-st-0437-loads-and-site-conditions-for-wind-turbines.html (last access: 5 May 2023), 2016. a
Duarte, T. M., Sarmento, A. J., and Jonkman, J. M.: Effects of Second-Order Hydrodynamic Forces on Floating Offshore Wind Turbines, in: 32nd ASME Wind Energy Symposium, American Institute of Aeronautics and Astronautics, National Harbor, Maryland, https://doi.org/10.2514/6.2014-0361, 2014. a, b
Enge, S., Fjøsna, E., and Sigurbjarnarson, Ã.: Regenerative Hybrid-Electric Propulsion, Tech. Rep. 1, Bellona, North Sailing, https://bellona.no/assets/Hybrid-report_2013_v4_web.pdf (last access: 8 March 2022), 2013. a
Gaertner, E., Rinker, J., Sethuraman, L., Zahle, F., Anderson, B., Barter, G., Abbas, N., Meng, F., Bortolotti, P., Skrzypinksi, W., Scott, G., Feil, R., Bredmose, H., Dykes, K., Shields, M., Allen, C., and Viselli, A. M.: IEA Wind TCP Task 37: Definition of the IEA 15-Megawatt Offshore Reference Wind Turbine, Technical Report NREL/TP-5000-75698, NREL, https://www.nrel.gov/docs/fy20osti/75698.pdf (last access: 20 September 2021), 2020. a, b, c, d, e
Gaunaa, M., Øye, S., and Mikkelsen, R.: Theory and design of flow driven vehicles using rotors for energy conversion, in: EWEC Proceedings, https://backend.orbit.dtu.dk/ws/portalfiles/portal/3748519/2009_28.pdf (last access: 2 May 2023), 2009. a
Grujicic, M., Arakere, G., Pandurangan, B., Sellappan, V., Vallejo, A., and Ozen, M.: Multidisciplinary Design Optimization for Glass-Fiber Epoxy-Matrix Composite 5 MW Horizontal-Axis Wind-Turbine Blades, J. Mater. Eng. Perform., 19, 1116–1127, https://doi.org/10.1007/s11665-010-9596-2, 2010. a
Gunnarsson, G., Skúlason, J. B., Sigurbjarnarson, Á., and Enge, S.: Regenerative electric/hybrid drive train for ships, Tech. Rep. 2, Nordic Innovation, Oslo, Norway, https://norden.diva-portal.org/smash/get/diva2:1294665/FULLTEXT01.pdf (last access: 2 May 2023), 2016. a
Hasselmann, K., Barnett, T. P., Bouws, E., Carlson, H., Cartwright, D. E., Enke, K., Ewing, J. A., Gienapp, H., Hasselmann, D. E., Kruseman, P., Meerburg, A., Müller, P., Olbers, D. J., Richter, K., Sell, W., and Walden, H.: Measurements of wind-wave growth and swell decay during the Joint North Sea Wave Project (JONSWAP), Ergänzungsheft 8–12, http://resolver.tudelft.nl/uuid:f204e188-13b9-49d8-a6dc-4fb7c20562fc (last access: 2 May 2023), 1973. a
IRENA: A Pathway to Decarbonise the Shipping Sector by 2050, Technical Report, International Renewable Energy Agency (IRENA), Abu Dhabi, https://www.irena.org/publications/2021/Oct/A-Pathway-to-Decarbonise-the-Shipping-Sector-by-2050 (last access: 13 October 2021), 2021. a, b
Itoh, Y. and Satoh, A.: Measurement of Propeller Characteristics at a Negative Advance Ratio Using a Whirling Arm Facility, in: The Proceedings of the 2018 Asia-Pacific International Symposium on Aerospace Technology (APISAT 2018), edited by: Zhang, X., Lecture Notes in Electrical Engineering, Springer, Singapore, 1169–1188, https://doi.org/10.1007/978-981-13-3305-7_93, 2019. a
Jacobi, G., Thomas, G., Davis, M. R., and Davidson, G.: An insight into the slamming behaviour of large high-speed catamarans through full-scale measurements, J. Mar. Sci. Technol., 19, 15–32, https://doi.org/10.1007/s00773-013-0229-y, 2014. a, b, c
Karimi, M., Hall, M., Buckham, B., and Crawford, C.: A multi-objective design optimization approach for floating offshore wind turbine support structures, Journal of Ocean Engineering and Marine Energy, 3, 69–87, https://doi.org/10.1007/s40722-016-0072-4, 2017. a
Lele, A. and Rao, K. V. S.: Net power generated by flettner rotor for different values of wind speed and ship speed, in: 2017 International Conference on Circuit, Power and Computing Technologies (ICCPCT), 1–6, https://doi.org/10.1109/ICCPCT.2017.8074170, 2017. a
Lewandowski, E. M.: The dynamics of marine craft: maneuvering and seakeeping, no. v. 22 in Advanced series on ocean engineering, World Scientific, New Jersey, https://doi.org/10.1142/4815, 2004. a, b
Liu, W. T., Tang, W., and Xie, X.: Wind power distribution over the ocean, Geophys. Res. Lett., 35, L13808, https://doi.org/10.1029/2008GL034172, 2008. a
Mao, W., Rychlik, I., Wallin, J., and Storhaug, G.: Statistical models for the speed prediction of a container ship, Ocean Eng., 126, 152–162, https://doi.org/10.1016/j.oceaneng.2016.08.033, 2016. a
Martínez Beseler, X.: Innovative Autonomously-Driven Offshore Wind Turbines: a prefeasibility analysis, https://riunet.upv.es/handle/10251/142936 (last access: 1 February 2021), 2020. a
Norsepower: Rotor Sail Technical Specifications, Brochure, Norsepower, Helsinki, Finland, https://www.norsepower.com/download/brochure.pdf (last access: 8 March 2022), 2021. a, b, c
Pearson, D.: The use of Flettner rotors in efficient ship design, RINA, Royal Institution of Naval Architects – Influence of EEDI on Ship Design 2014, 162–169, https://www.researchgate.net/publication/287081987_The_use_of_Flettner_rotors_in_efficient_ship_design (last access: 19 January 2021), 2014. a
Rojon, I. and Dieperink, C.: Blowin' in the wind? Drivers and barriers for the uptake of wind propulsion in international shipping, Energ. Policy, 67, 394–402, https://doi.org/10.1016/j.enpol.2013.12.014, 2014. a
Sandua-Fernández, I., Vittori, F., Martín-San-Román, R., Eguinoa, I., and Azcona-Armendáriz, J.: Platform yaw drift in upwind floating wind turbines with single-point-mooring system and its mitigation by individual pitch control, Wind Energ. Sci., 8, 277–288, https://doi.org/10.5194/wes-8-277-2023, 2023. a
Scholtens, F.: Electric Aircraft Design Including an In-the-loop Propeller Design Model with Regenerative Mode, Master's thesis, TU Delft, Delft University of Technology, https://repository.tudelft.nl/islandora/object/uuid:692d9915-7aca-4094-8065-b336db3e1f91 (last access: 4 March 2022), 2021. a
Stewart, R. H.: Introduction To Physical Oceanography, in: Ocean waves, Texas A&M University, Department of Oceanography, 273–292, https://open.umn.edu/opentextbooks/textbooks/20 (last access: 2 May 2023), 2008. a
Sutter, D., van der Spek, M., and Mazzotti, M.: Evaluation of CO2-Based and CO2-Free Synthetic Fuel Systems Using a Net-Zero CO2-Emission Framework, Industrial & Engineering Chemistry Research, 58, 19958–19972, https://doi.org/10.1021/acs.iecr.9b00880, 2019. a
Thomas, G., Winkler, S., Davis, M., Holloway, D., Matsubara, S., Lavroff, J., and French, B.: Slam events of high-speed catamarans in irregular waves, J. Mar. Sci. Technol., 16, 8–21, https://doi.org/10.1007/s00773-010-0105-y, 2011. a
Tillig, F. and Ringsberg, J. W.: Design, operation and analysis of wind-assisted cargo ships, Ocean Eng., 211, 107603, https://doi.org/10.1016/j.oceaneng.2020.107603, 2020. a, b, c, d
Traut, M., Gilbert, P., Walsh, C., Bows, A., Filippone, A., Stansby, P., and Wood, R.: Propulsive power contribution of a kite and a Flettner rotor on selected shipping routes, Appl. Energ., 113, 362–372, https://doi.org/10.1016/j.apenergy.2013.07.026, 2014. a
Wang, H., Mao, W., and Eriksson, L.: A Three-Dimensional Dijkstra's algorithm for multi-objective ship voyage optimization, Ocean Eng., 186, 106131, https://doi.org/10.1016/j.oceaneng.2019.106131, 2019. a, b
Willeke, L.: Concept study of a sailing offshore wind turbine, Research Thesis, University of Stuttgart, Stuttgart Wind Energy (SWE) Institute of Aircraft Design, https://doi.org/10.18419/opus-11435, 2021. a
Xu, S., Murai, M., Wang, X., and Takahashi, K.: A novel conceptual design of a dynamically positioned floating wind turbine, Ocean Eng., 221, 108528, https://doi.org/10.1016/j.oceaneng.2020.108528, 2021. a, b, c, d, e, f, g, h, i, j, k, l, m, n
Yokota, K., Fujimoto, H., and Hori, Y.: Basic Study on Regenerative Air Brake Using Observer-based Thrust Control for Electric Airplane, in: 2020 IEEE 16th International Workshop on Advanced Motion Control (AMC), Kristiansand, Norway, 14–16 September 2020, 34–39, https://doi.org/10.1109/AMC44022.2020.9244329, 2020. a
Yoong, M., Gan, Y., Gan, G., Leong, C., Phuan, Z., Cheah, B., and Chew, K.: Studies of regenerative braking in electric vehicle, in: 2010 IEEE Conference on Sustainable Utilization and Development in Engineering and Technology, Kuala Lumpur, Malaysia, 20–21 November 2010, 40–45, https://doi.org/10.1109/STUDENT.2010.5686984, 2010. a