the Creative Commons Attribution 4.0 License.
the Creative Commons Attribution 4.0 License.
 | 29 Apr 2024
Control co-design optimization of floating offshore wind turbines with tuned liquid multi-column dampers
Sheng Tao Zhou
Frank Lemmer
Po Wen Cheng
The technical progress in the development and industrialization of floating offshore wind turbines (FOWTs) over the past decade has been significant. Yet, the higher levelized cost of energy (LCOE) of FOWTs compared to onshore wind turbines is still limiting the market share. One of the reasons for this is the larger motions and loads caused by the rough environmental excitations. Many prototype projects tend to employ more conservative substructure designs to meet the requirements for motion dynamics and structural safety. Another challenge lies in the multidisciplinary nature of a FOWT system, which consists of several strongly coupled subsystems. If these subsystems cannot work in synergy, the overall system performance may not be optimized. Previous research has shown that a well-designed blade pitch controller is able to reduce the motions and structural loads of FOWTs. Nevertheless, due to the negative aerodynamic damping effect, improvement in the performance by tuning the controller is limited. One of the solutions is adding tuned liquid multi-column dampers (TLMCDs), meaning that there is a structural solution to mitigate this limiting factor for the controller performance. It has been found that the additional damping, provided by TLMCDs, is able to improve the platform pitch stability, which allows a larger blade pitch controller bandwidth and thus a better dynamic response. However, if a TLMCD is not designed with the whole FOWT system dynamics taken into account, it may even deteriorate the overall performance. Essentially, an integrated optimization of these subsystems is needed. For this paper, we develop a control co-design optimization framework for FOWTs installed with TLMCDs. Using the multi-objective optimizer non-dominated sorting genetic algorithm II (NSGA-II), the objective is to optimize the platform, the blade pitch controller, and the TLMCD simultaneously. Five free variables characterizing these subsystems are selected, and the objective function includes the FOWT's volume of displaced water (displacement) and several motion and load indicators. Instead of searching for a unique optimal design, an optimal Pareto surface of the defined objectives is determined. It has been found that the optimization is able to improve the dynamic performance of the FOWT, which is quantified by motions and loads, when the displacement remains similar. On the other hand, if motions and loads are constant, the displacement of the FOWT can be reduced, which is an important indication of lower manufacturing, transportation, and installation costs. In conclusion, this work demonstrates the potential of advanced technologies such as TLMCDs to advance FOWTs for commercial competitiveness.
- Article
(3484 KB) - Full-text XML
- BibTeX
- EndNote


Structural control techniques play an important role in mitigating undesired motions or loads across various disciplines. For floating offshore wind turbines (FOWTs), the implementation of tuned mass dampers (TMDs) or tuned liquid column dampers (TLCDs) has been extensively investigated in recent years. Passive and active TMDs installed in the nacelle are investigated and compared by Lackner and Rotea (2011). The result shows that both passive and active TMDs are capable of reducing the tower fore–aft fatigue load by approximately 10 % compared to a baseline turbine using a passive TMD. Adding active control can improve the damping effect with a 30 % load reduction but requires additional active power and larger strokes. Cross-Whiter et al. (2018) compared nacelle-based TMDs with different control strategies for FOWTs of the tension leg platform (TLP) type. Despite the sensitivity of the load mitigation performance to water depth, the most effective load mitigation strategy is found to be the combination of advanced controls with TMDs. As with platform-based dampers, the specific geometric characteristics of FOWTs and the requirement for bi-directional damping effects necessitate the exploration of novel damping mechanisms. As a result, tuned liquid multi-column dampers (TLMCDs) have been recommended for semi-submersible or barge-type FOWTs (Coudurier et al., 2018), demonstrating the potential to effectively mitigate the dynamic responses of FOWTs. This numerical model for TLMCDs is further coupled with different aero-hydro-servo-elastic simulation tools for FOWTs in Yu et al. (2023) and validated by comparison with experimental results. A similar concept was presented by Tong et al. (2018), where a four-column TLMCD is installed on a 5 MW barge-type FOWT. The authors coupled the TLMCD model with OpenFAST and performed numerical simulations. Overall, if strategically designed and optimized, these TLMCD systems offer promising solutions for reducing structural vibrations and improving system stability of the FOWT.
Nevertheless, the application of TLMCDs alone may not fully address the unique challenges posed by FOWTs. While studies on nacelle-based TMDs have already addressed the importance of the control strategies for the damping effectiveness (Cross-Whiter et al., 2018), the interactions between the hydrodynamics, aerodynamics, and servo dynamics are more complex and have a profound impact on the effectiveness of this technology. According to the study by Yu et al. (2019), which evaluates the performance of a two-column passive TLMCD installed on a spar-type FOWT, adding a TLMCD alone provides very limited motion and load reduction in the FOWT. However, redesigning the blade pitch controller by incorporating the additional damping contributed by the TLMCD can effectively enhance the performance. This highlights that focusing solely on the design of the TLMCD without considering its impact on other subsystems and the overall system of a FOWT limits the performance of the TLMCD. In particular, a FOWT is an actively controlled system, where dynamic characteristics play a central role in determining the design of the control system. By providing additional damping, TLMCDs increase the flexibility to achieve effective and robust control for FOWTs. Taking into account all these highly coupled subsystems, the question arises as to how the benefits of TLMCDs can be exploited and how the overall system behavior can be optimized.
Given these challenges, integrated optimization techniques are the most suitable solutions to this problem. By exploring the design space of the whole FOWT system, design parameters that provide the best synergy between the coupled subsystems can be found. General best practices for design optimization of FOWTs have been extensively addressed in previous research. The aim of such optimization work is to reduce the levelized cost of energy (LCOE) of FOWTs. For the research community, this is usually represented by a reduction in size and weight, motion, and loads. A lot of work has been done on design optimization. Hall et al. (2013) applied a genetic algorithm to optimize the hull shape and mooring system with both a single objective and multiple objectives. The fitness of the three substructure concepts for their Pareto fronts was evaluated and compared. The selected design parameters characterizing the hull geometry and mooring layout are the optimal choices for each concept, ensuring a fair comparison. As the blade pitch controller interacts with the dynamics of the floating platform and instabilities may occur, Lemmer et al. (2017b) presented an integrated substructure optimization including a self-tuning controller. The work was further extended in Zhou et al. (2021) by adding the mooring system using a multi-objective optimizer, showing the significant impact of the mooring system on the optimal solutions. More comprehensively, Hegseth et al. (2020) established an integrated design optimization framework in which the platform, tower, mooring system, and blade pitch controller are optimized simultaneously using a gradient-based optimizer and considering both fatigue and extreme response constraints. A weighted combination of system cost and power quality is employed as the objective function, resulting in an unconventional hourglass-shaped spar-buoy floater. More recent publications have also highlighted the importance of control co-design (CCD). Since the control plays an important role in terms of motions and loads, it is important to optimize the blade pitch controller simultaneously during the design process. The ARPA-E ATLANTIS program (https://arpa-e.energy.gov/technologies/programs/atlantis, last access: 21 June 2023) has already announced several projects focusing on this topic (Garcia-Sanz, 2019).
Building on this prior research and its findings, this work explores the limits of the TLMCD's contribution to mitigating motions and loads of the FOWT system. This is done through a multi-objective optimization approach that incorporates control co-design (CCD) to simultaneously optimize the design of the substructure, the TLMCD, and the blade pitch controller. By coordinating the functions of these subsystems, the framework is expected to achieve the best possible synergy to maximize the potential of TLMCDs in improving the performance of FOWTs at a systems engineering level.
As emphasized in the previous introduction, the dynamic responses of FOWTs are significantly affected by the blade pitch controller and the TLMCD. In this section, the impacts of these influential subsystems are visually demonstrated, which provides a comprehensive understanding of these effects.
2.1 Reference FOWT and numerical tools
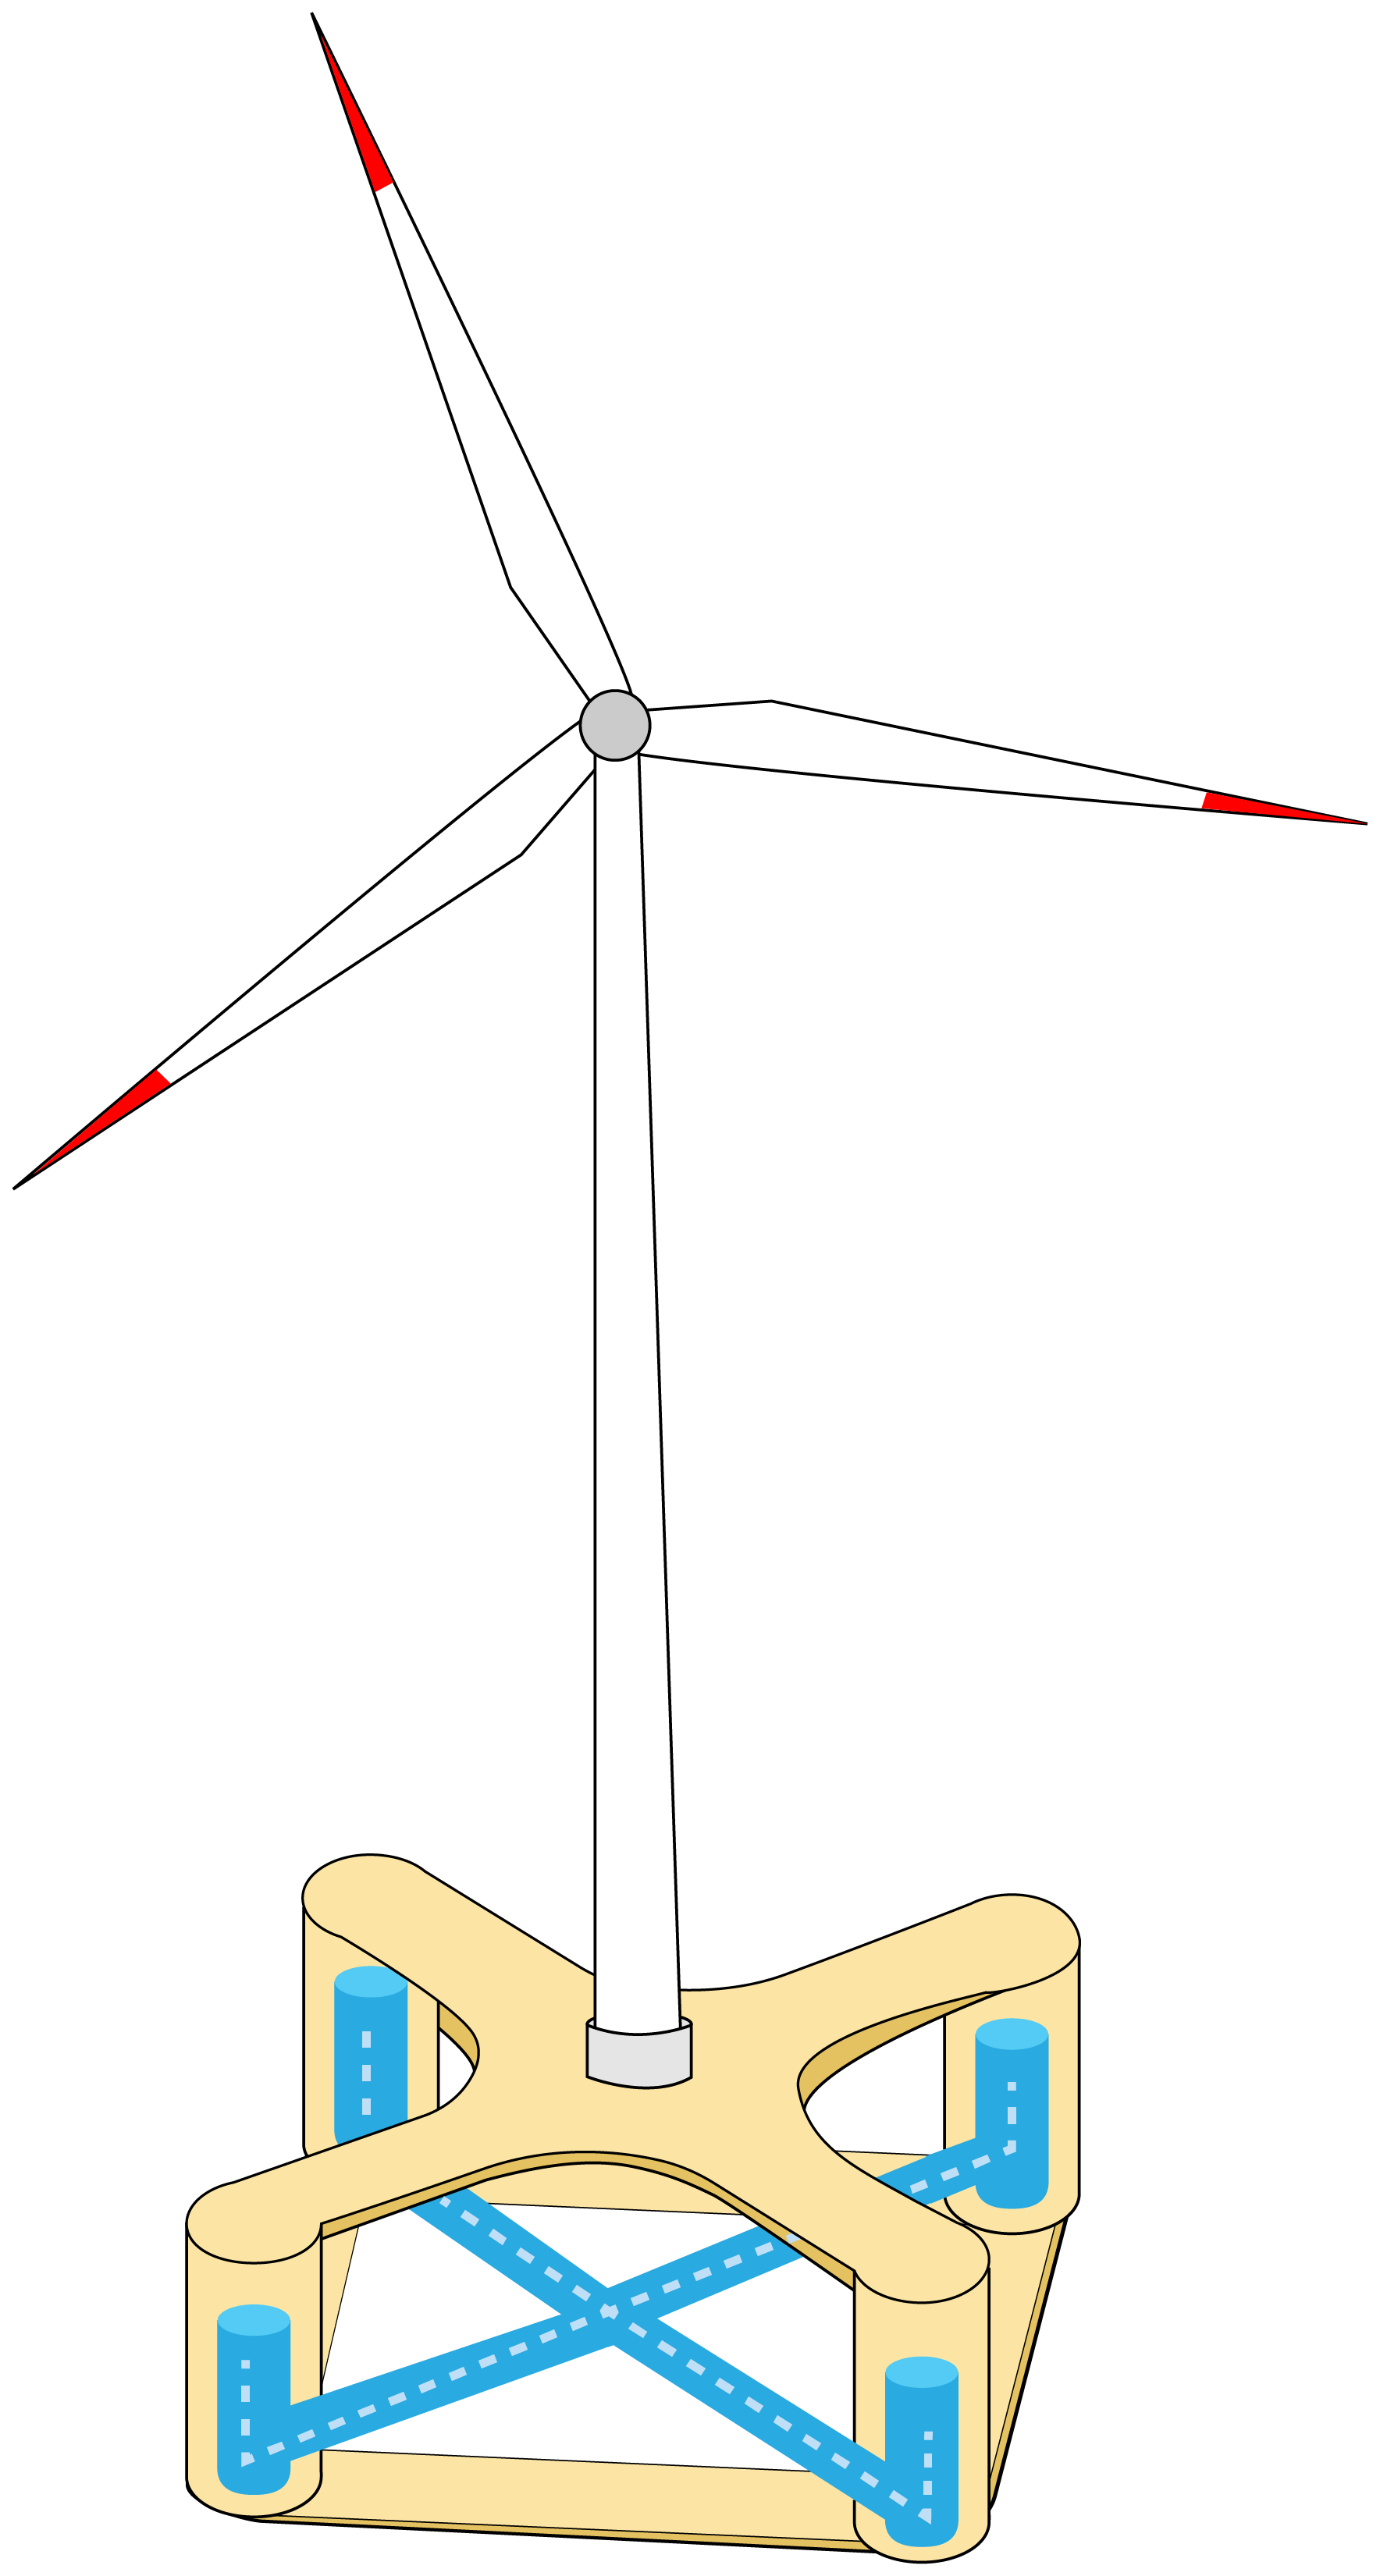
The original NAUTILUS-DTU 10MW FOWT (Yu et al., 2018b) is investigated as a case study, which is referred to as NAUTILUS-10 in the following discussion. The installation sketch is shown in Fig. 1. The analysis involves analyzing the linearized system and performing coupled time simulations. The linear analysis focuses on the influence of the controller and the TLMCD on the stability margin and step response to wind of the coupled system, while the coupled simulations evaluate the system performance in more realistic operation conditions. As for the numerical tool, a simplified low-order wind turbine model (SLOW) is used for both linear analysis and coupled simulation, which is originally developed in Lemmer et al. (2020) and coupled with the TLMCD model in Yu et al. (2023).
2.2 Linear analysis
For the stability margin, a Nyquist plot is used to visualize how system stability changes with control designs. Figure 2 presents the Nyquist plot at an operating wind speed of 16 m s−1 with various controller gains and TLMCD setups. The integral time constant Ti of the PI controller is kept constant, while different proportional gains are selected. In addition, the two systems with and without a TLMCD are compared; i.e., a reference system without TLMCD in the subplot on the left and on the right the FOWT is stabilized by a TLMCD system. Point (−1, 0), highlighted in red, represents the unstable point. According to the stability criteria using the Nyquist plot, the system becomes unstable when the contour lines encircle this point. When the proportional gain kp increases, the contour lines get closer to the unstable point and eventually the system becomes unstable. The shortest distance between (−1, 0) and the contour line dists determines the stability margin, which is quantified by the sensitivity peak . The larger the distance, the more robust the control system becomes. This allows for a higher uncertainty in the numerical modeling. By comparing the two subplots, the contribution of a TLMCD is also visible. The contour lines are moved further away from the unstable point with the same control gains. This proves that the TLMCD can improve the dynamic behavior of the system by increasing the stability margin.

Figure 2Nyquist plot of the open-loop transfer function L(s); the NAUTILUS-DTU 10MW FOWT with a fixed time constant Ti (Ti= 8 s) and varying proportional gain kp (value increases when the darkness increases) at a wind speed of 16 m s−1.
In addition to the stability margin, the step responses are also an important measure to describe the dynamic behavior. How the step responses react to wind change with control gains and TLMCD setups is presented in Fig. 3. Several standard definitions in control theory are used to quantify the response behavior, including the rise time Tr, the settling time Ts and the overshoot, which are described by Yu et al. (2020) in detail. As shown, when Ti is constant, a relatively large kp improves the disturbance rejection, implied by smaller overshoot and shorter rise time. However, this also leads to a negative effect on the settling time. With a higher gain, it takes longer for the system to reach a steady state after a step disturbance, which is equivalent to the situation when a system has insufficient damping. In some extreme cases, the system cannot converge any more. By comparing the above and below subplots of Fig. 3, the impact of the TLMCD can be inferred. First of all, the TLMCD does not change the response to the step wind within around 40 s. This is mainly dominated by the aerodynamics; since the turbine and control parameters are the same, one can expect the same rise time and overshoot. After this period, the platform motion continues to oscillate due to the coupled dynamics, resulting in a longer settling time than onshore turbines. When the TLMCD is activated, the low damping caused by the higher kp is partially compensated for so that the coupled dynamics of the platform motions are better damped.
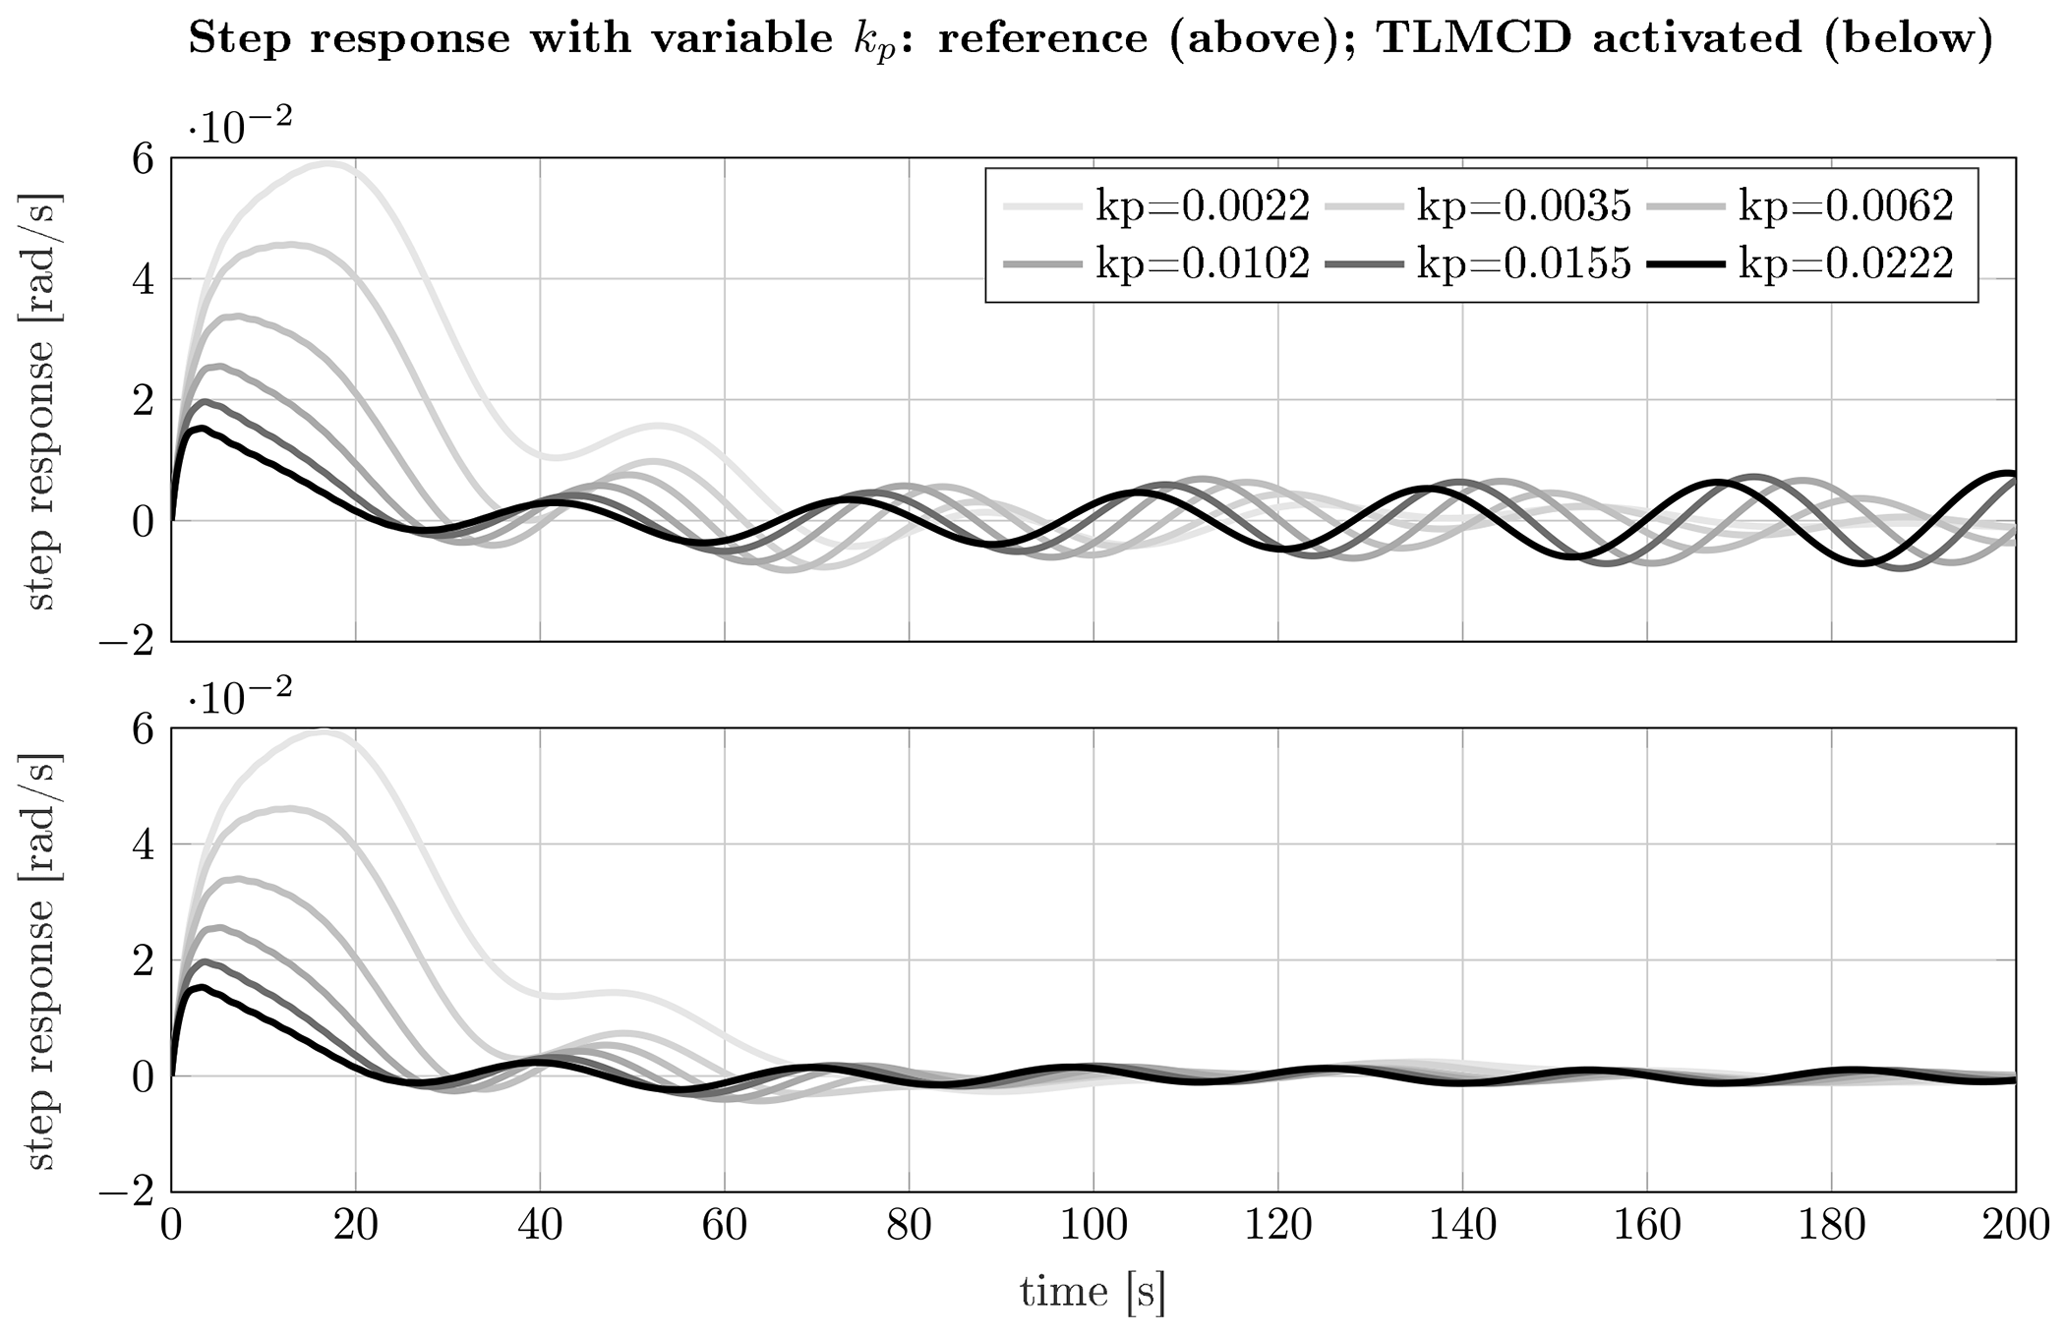
Figure 3Step response of generator speed to unit step wind with different control gains at 16 m s−1; the value of kp increases as the color darkness increases.
Combining the observations on the sensitivity margin in Fig. 2, it can be concluded that an improvement in generator speed control can be achieved at the expense of stability. This is also reported in Yu et al. (2018a) as a trade-off between the generator speed regulation and the platform pitch motion, which is found by studying a 5 MW FOWT. While a TLMCD can break this limitation by introducing additional damping into the system, a more aggressive controller with higher gains is generally possible. This not only improves the disturbance rejection, but also maintains the system stability.
2.3 Coupled simulation
The linear analysis clearly demonstrates the significant influence of both the TLMCD and the blade pitch controller on the system stability, as well as their role in shaping the closed-loop dynamic responses. However, it is still unclear how these subsystems interact and affect the coupled dynamic responses in real operating conditions. In order to gain a deeper insight into the coupled dynamics, a more comprehensive study using coupled aero-hydro-servo-elastic time simulations is conducted, and the statistics of the simulation results are presented in Fig. 4. Here, the original NAUTILUS-10 design is used as a reference for simulations to compare three different setups. These setups include scenarios with the TLMCD activated or deactivated, and the controller in its original state or redesigned. The original controller, as designed in Lemmer (né Sandner) et al. (2019), prioritizes stability margins without considering the presence of the TLMCD. In contrast, the redesigned controller takes into account the additional damping from the TLMCD and shapes the controller behavior through step responses under the stability constraints; the redesign procedure is described in Yu et al. (2020).
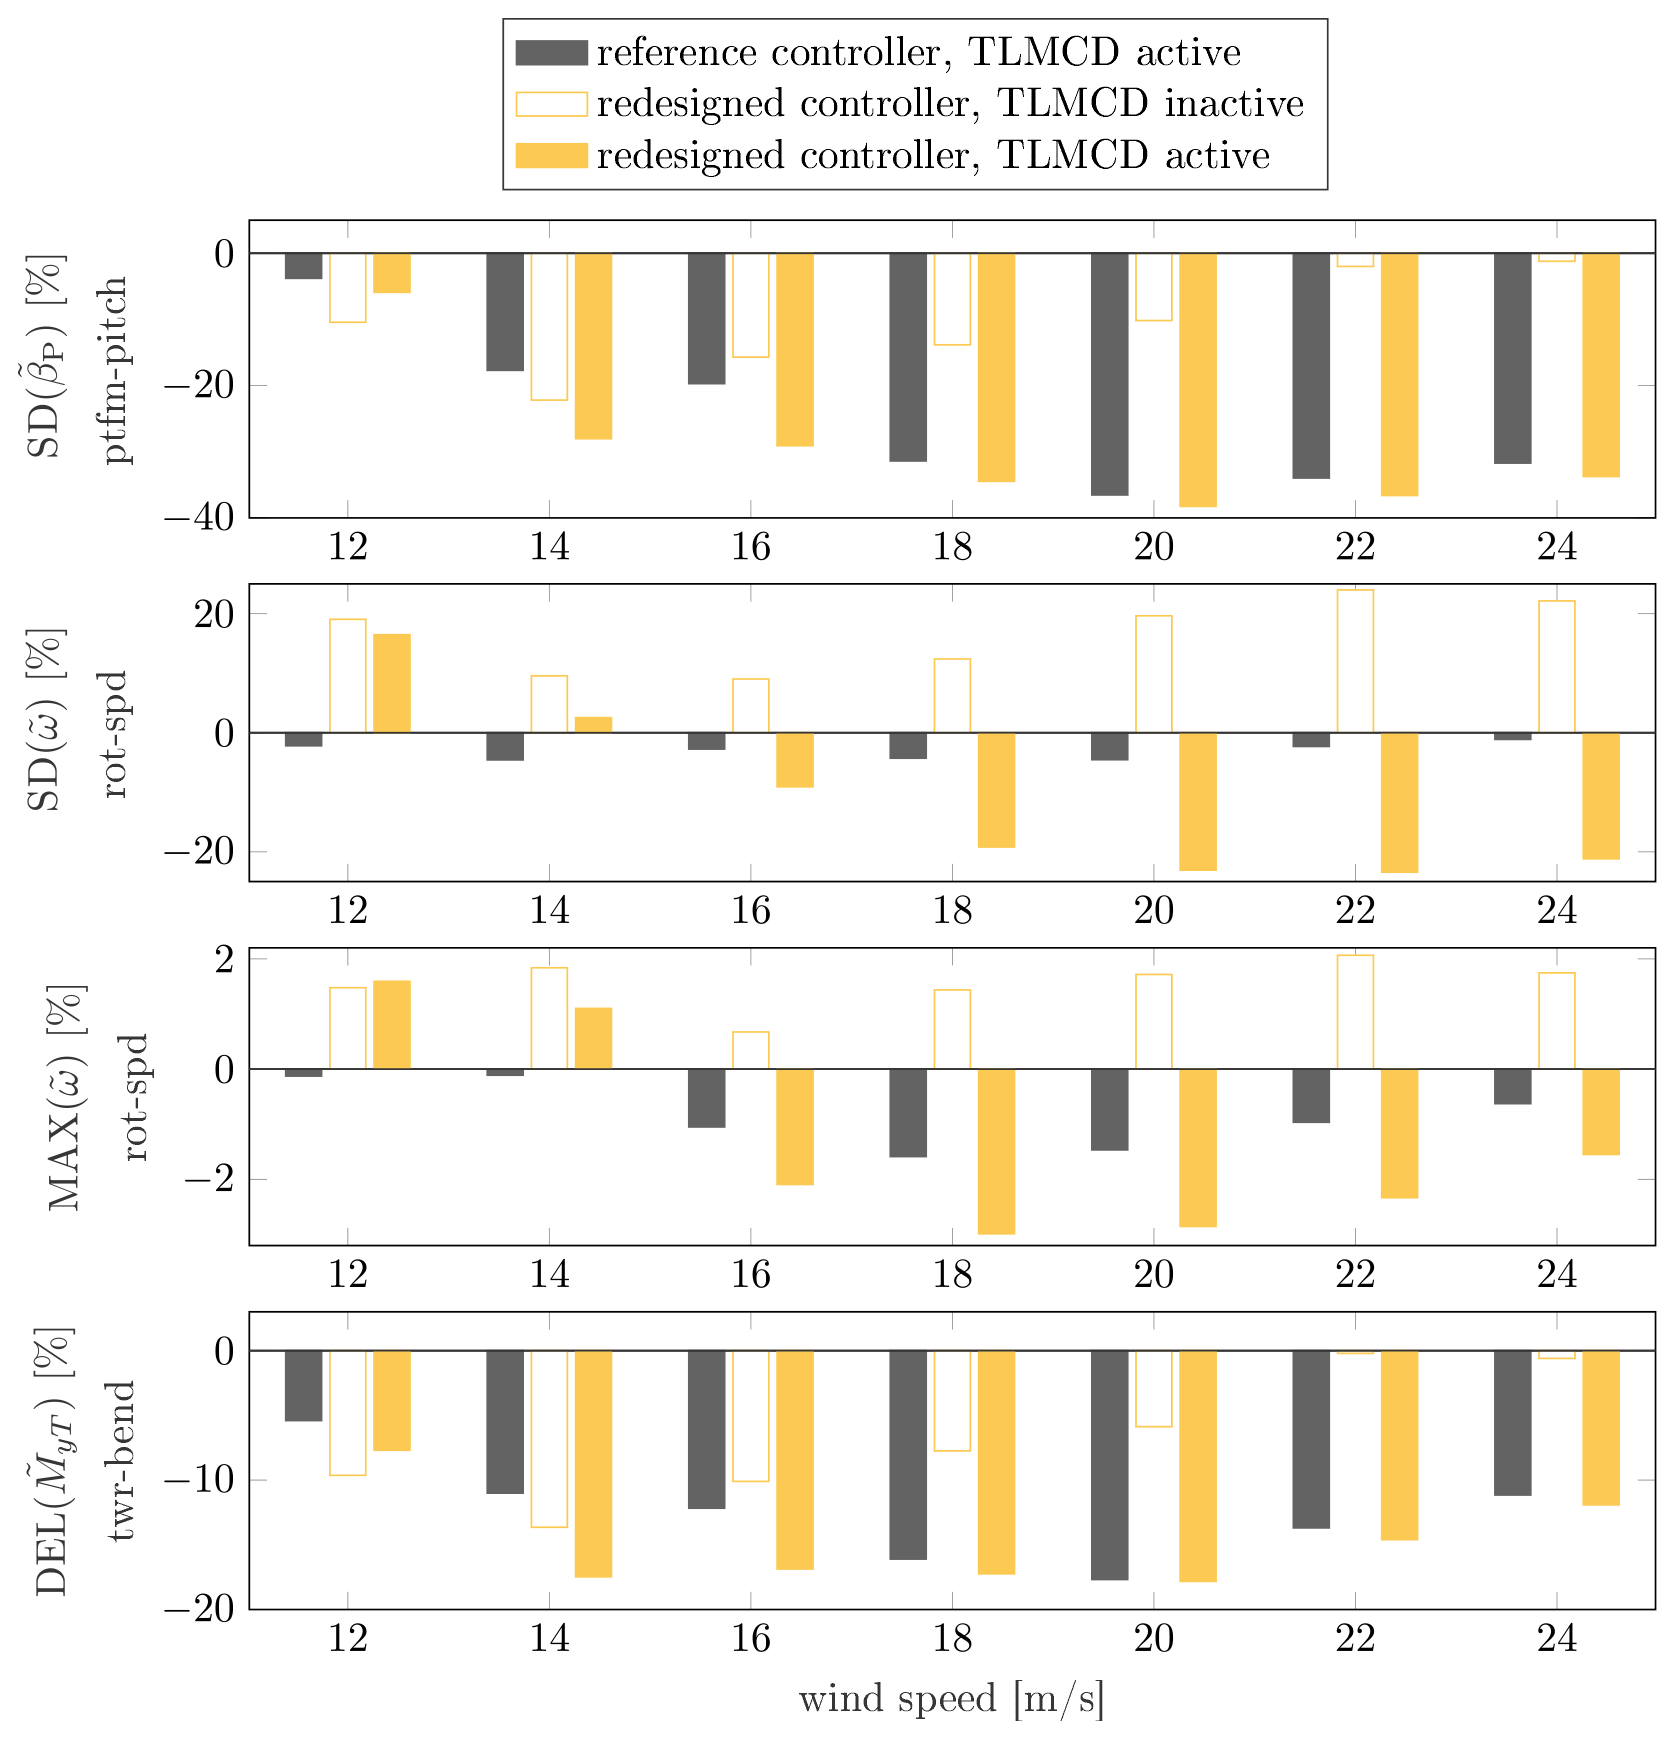
Figure 4Comparison of relative system statistical responses of the NAUTILUS-DTU 10MW FOWT with respect to the case with a reference controller and without a TLMCD at different operating wind speeds (sea states based on the design load cases at a site in the LIFES50+ project).
The first step is to understand the impact of the TLMCD. In both cases (i.e., with the reference controller and with the redesigned controller), the TLMCD can improve the pitch motion and the tower-base bending moment and do so more significantly at higher wind speeds. However, this improvement, especially the rotor speed performance, is independent of the blade pitch controller. When the TLMCD is active, redesigning the controller can significantly improve the rotor speed performance, which is evident when comparing the solid yellow and black bars. As the generator torque is constant in the simulation, the rotor speed also represents the power production quality.
In summary, adding structural damping to an actively controlled system does not automatically guarantee improved overall system performance. It is crucial to optimize the controller in conjunction with the damping system to achieve synergy and maximize benefits. This finding inspires the work described in the next section, where CCD optimization techniques are employed. By systematically considering the effects of the substructure design, the additional damping, and the active control system, the overall performance of the system is expected to be maximized.
This section outlines the setup of the optimization framework, which involves the design space, optimizer, constraints, and cost model. These elements are essential to ensure that the optimization process is well defined and that all subsystems can be optimized to maximize the desired performance while staying within the constraints. The entire framework is implemented in MATLAB® using the linearized SLOW for controller design and the nonlinear SLOW for coupled simulations.
3.1 Design space
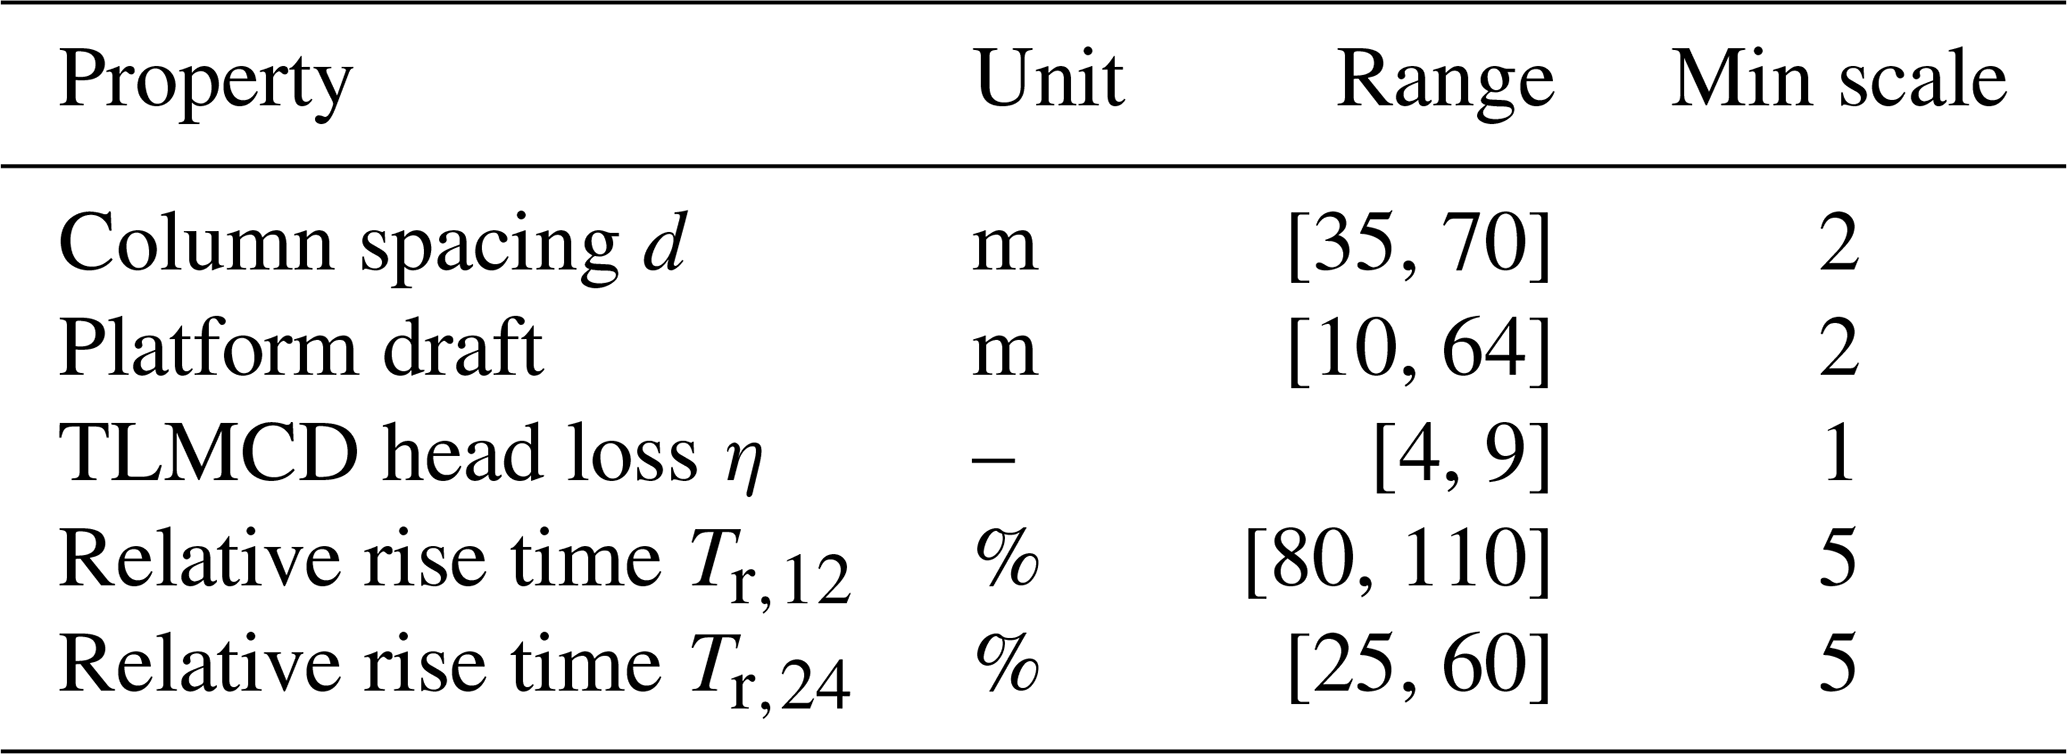
The optimization framework for the FOWT system includes several subsystems (i.e., the floating platform, the blade pitch controller, and the TLMCD). To ensure a manageable computational complexity, it is beneficial to limit the number of free variables for each subsystem. For the platform, the design space is derived from Zhou et al. (2019), with the free design variables comprising of the column spacing, d, and the draft of the platform. These variables were chosen based on a sensitivity study conducted during the LIFES50+ project (Lemmer et al., 2017a), which has highlighted their significant impact on the dynamic responses. Although the column diameter was also found to be an influential variable in dynamics responses (Zhou et al., 2021), only two design variables are selected for the optimization due to limited computational resources. These variables are highlighted in orange in Fig. 5, while the remaining dimensional parameters stay consistent with the original NAUTILUS-10 design (Yu et al., 2018b).
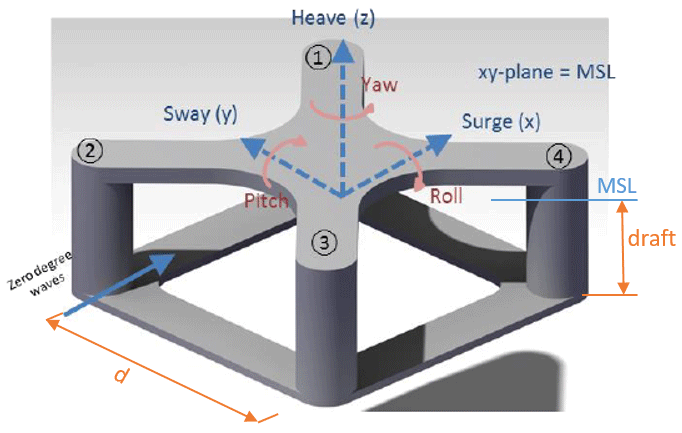
Figure 5Illustration of the design variables of the substructure used for the optimization (Yu et al., 2018b; Zhou et al., 2019).
The fairleads of the mooring system are attached to the outer walls of the four vertical columns. As the column spacing is a free variable, the fairleads' positions in the body frame of the floater are affected by the column spacing, d. Therefore, the radius of the fairleads can be expressed as a function of d. This means that changes in d can lead to corresponding changes in the fairlead radius, which is expressed as
where 5.25 is the original radius of the pontoon taken from Yu et al. (2018b) in meters.
Regarding the controller design, the automated design procedure in Yu et al. (2020) is used. It was found that the design parameter rise time Tr, which shapes the closed-loop step response, has a significant impact on the dynamic behavior of the controller design. As the linear model used for the closed-loop analysis varies with the operating wind speeds, it would be ideal to optimize Tr for the entire range of operating mean wind speeds. However, this leads to an extremely large design space. To simplify the optimization, only two free variables are chosen (i.e., the rise time at operating wind speeds of 12 and 24 m s−1). For other operating points, it is assumed that increases linearly with wind speed, allowing for a smooth transition between different operating points. Once the values of Tr are determined, the control parameters, the proportional gain kp, and the integral gain ki can be determined. It should be noted that the choice of Tr is influenced by the natural frequency of the platform pitch motion. As a result, the values of Tr are expressed as relative values with respect to the natural frequency of the platform pitch as a percentage of the natural frequency. The ranges for these percentages are narrowed down by a prior brute-force study.
As for the TLMCD, its horizontal arm must have a length of to accommodate the vertical columns of the TLMCD in the floater's vertical pontoons. The height of the vertical columns remains at 70 % of that of the draft. This leaves only two geometric free variables of the TLMCD, which are determined by setting the TLMCD fluid mass and the natural frequency. A lower TLMCD mass is generally favorable for the static stability but generates limited stabilizing moment. It is suggested in Gawad et al. (2001) that the best choice for a TLCD mass ratio for ships is around 3.5 %, so a TLMCD mass ratio of 3 % is chosen in this work. The natural frequency of the TLMCD is equal to that of the platform pitch. As a result, only the head loss η is defined as a free design variable, which is a measure of the energy loss of the TLMCD fluid system. On the one hand, it is an important factor for the floater dynamics; on the other hand, η can be adjusted by adding baffles inside the TLMCD, which is another reason for its inclusion as a free variable.
Table 1 summarizes all five free variables that are considered in the optimization. To accelerate the optimization process, minimum steps have been defined for each variable, which results in the design space being discretized instead of continuous. This means that the variables can only take on certain values within their respective ranges rather than any possible value within the ranges. By discretizing the design space, the optimization process can be performed more efficiently, which can help to reduce the time and computational resources required for the optimization.
3.2 Multi-objective optimizer
When evaluating the system performance of FOWTs, various factors come into play to define the cost model and assess the effectiveness of the FOWT design. These factors include structural loads, energy production, motions, and more. To consolidate these factors into a single objective function, weight coefficients are generally used to obtain the optimal solution. However, determining these coefficients poses challenges, especially in academic research settings where input from industry experts on realistic weighting factors may not be available. Furthermore, the choice of weight coefficients has a significant impact on the optimization process and final outcomes. Recognizing this, a multi-objective optimizer is chosen to address these complexities. By employing a multi-objective optimizer, designers can obtain a range of favorable designs across different scenarios, rather than a single unique optimum, which offers valuable flexibility and provides designers with a comprehensive understanding of trade-offs and design considerations.
Therefore, the NSGA-II (non-dominated sorting genetic algorithm II) is chosen as the optimization method in this study. A detailed description of the algorithm can be found in Deb et al. (2002). Since the optimization framework is implemented in MATLAB, an existing tool implementing NSGA-II is utilized, which can be found in Seshadri (2009). Regarding the general setup of NSGA-II, the initial population size is determined by a widely recognized guideline (Storn, 1996), which recommends a population size approximately 10 times larger than the number of design variables. The NSGA-II setup also includes two stopping criteria – a maximum allowed number of generations and the incorporation of the mutual domination rate (MDR) – to assess the progress of each generation (Martí et al., 2016).
3.3 Cost model
The cost model is an essential part of the optimization framework that can significantly influence the optimization results. While minimal LCOE is generally accepted as a good objective function in the wind industry, it is derived from a wide range of factors, some of which are not relevant to the subsystems under investigation, such as policy, market, or supply-chain-related issues. Moreover, certain components of the LCOE may vary in different markets or change with suppliers, making it less informative and potentially unable to reveal the influence of the design parameters. As a result, indicators that not only reflect the LCOE, but also have physical meanings and strong correlations with the design variables are used for optimization purposes.
Three indicators are selected for the optimization: a motion indicator, a load indicator, and a cost indicator. The motion indicator will be measured using sensors for the platform pitch and nacelle fore–aft acceleration, while the load indicator will be determined by measuring the tower-base bending moment and mooring fairlead tension. Instead of calculating the actual cost for materials, manufacturing, transportation, and so on, the total displaced tonnage (i.e., the weight of water displaced by the FOWT in normal operation) is used as the cost indicator. Although the term tonnage can have different meanings in the shipping industry depending on the loading condition of the vessel, the displaced tonnage is an important measure that can provide a qualitative indication of manufacturing, operation, and maintenance costs. Unlike direct cost calculation, which has many uncertainties and can vary over time and markets, displaced tonnage is a physical value that can be accurately calculated from the structural model. Therefore, it is the only measure used here to indirectly represent all costs associated with material, manufacture, transportation, and installation.
To account for the different units and magnitudes of the selected indicators, they are normalized by comparison to the original NAUTILUS-10 design. Denoting the displacement, the damage equivalent load (DEL) of the tower-base bending moment and the mooring fairlead tension, and the standard deviation (SD) of the platform pitch motion and the tower-top acceleration as Vdisp, DELMyT, DELmoor, SDβ, and SDTT, respectively. By comparison to these values in the original NAUTILUS-10 design, indicated by the subscript 0, the objective functions at each wind speed can be expressed as
As can be seen, both J2 and J3 show variations over different wind speeds. In commercial applications, it is ideal to weigh these objectives according to the probabilistic distribution of wind speeds. However, the resulting conclusion will inevitably depend on the chosen wind distribution. Since this study focuses on the general methodology rather than deriving an optimal industrial design, the objective functions for each mean wind speed are simply averaged, resulting in a final cost function with multiple objectives:
3.4 Constraints
In order to accelerate the optimization process, a set of design constraints has been defined to eliminate unfeasible designs. These constraints can be classified into two types: static and dynamic. The static constraints are applied at the beginning of the optimization process and immediately reject any designs that fail to meet the requirements, thus reducing the number of designs to be simulated. The dynamic constraints are applied during the simulation and take into account the behavior of the designs under various load conditions.
The static constraints are checked before a computationally intensive time simulation is conducted. If an individual design fails to satisfy the constraint criteria, it will be excluded from further evaluation. The algorithm will continue to search for potential candidates in order to maintain the size of the design candidates which are to be evaluated. The constraints on the natural frequencies of the floater are primarily intended to avoid the wave frequency range. These static constraints are defined as follows:
-
The displaced tonnage should not be more than twice as large as that of the NAUTILUS-10 design (i.e., ).
-
The maximum static pitch angle should be smaller than 10°.
-
The heave natural period should be greater than 15 s.
-
The pitch natural period should be greater than 18 s.
To further refine the optimization process, dynamic constraints are defined based on the statistical analysis of dynamic simulations. If a design exceeds these constraints, the algorithm sets high values to the cost model J, redirecting the optimization towards alternative designs. The dynamic constraints consider various scenarios, including the following:
-
The generator overshoot should be lower than 30 %.
-
The maximum dynamic pitch should not exceed 12°.
-
The nacelle acceleration should be smaller than 0.3 g, where g is the gravitational acceleration.
It is worth noting that ultimate limit state (ULS) and fatigue limit state (FLS) are not considered. The selection of constraints is based more on experience and established rules of thumb derived from previous research projects. This approach not only guarantees timely convergence, but also allows for a wider range of potential solutions to be explored within the design space. However, it is important to emphasize that the values chosen may be conservative and may not necessarily align with commercial standards.
3.5 Workflow for objective evaluation
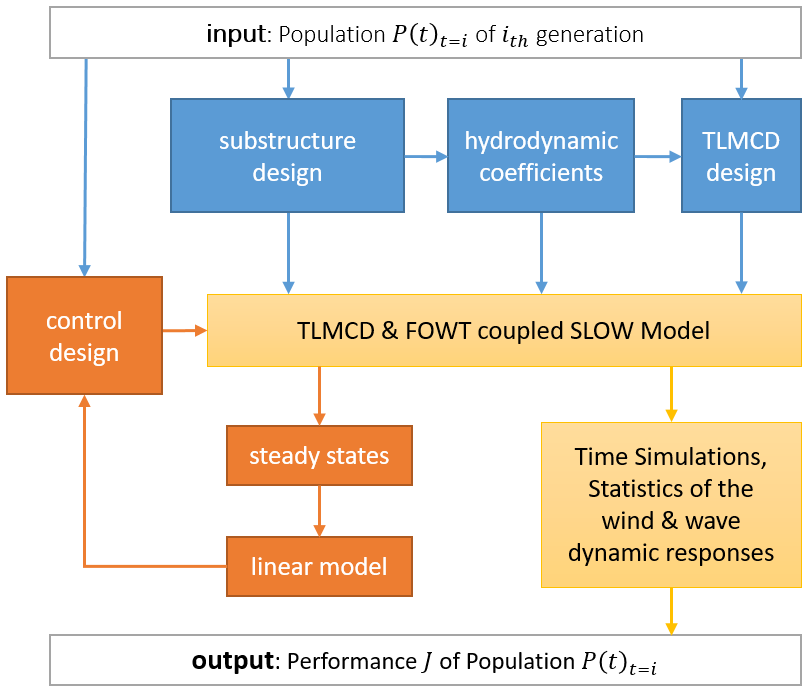
The most important and computationally intensive step is the performance evaluation based on the objective functions, which includes the design and modeling of the subsystems, the execution of coupled simulations in the time domain, and the post-processing of the simulation data to compute the objective functions. Figure 6 illustrates how these processes are interconnected during the evaluation of the possible designs. It can be roughly divided into three parts: the preparation of the dynamic model inputs (in blue), the model linearization and controller design (in orange), and the coupled design load case simulation (in yellow).
3.5.1 Inputs preparation of the dynamic model
The substructure design module is the first step of the optimization process. It takes the design variables of each offspring created by the generic algorithm as input and calculates the inertial properties of the FOWT based on its geometrical variables. At the same time, the module generates a mesh for the wet surface of the substructure and the associated panel coordinates. The data produced here are then passed on to the hydrodynamic module. The main function of this module is to generate the hydrodynamic coefficients using the panel code Ansys Aqwa. In addition, the module calculates the response amplitude operator (RAO) and natural frequency of the platform pitch motion, which serve as input data for the TLMCD design module. These design modules are developed in Lemmer et al. (2017b) and also utilized in Zhou et al. (2019). The TLMCD design module uses the same method as that presented in Yu et al. (2019). The main objective is to ensure that the TLMCD has the same natural frequency as the platform pitch while also keeping the total fluid mass within the TLMCD constant at 3 % of the total FOWT mass.
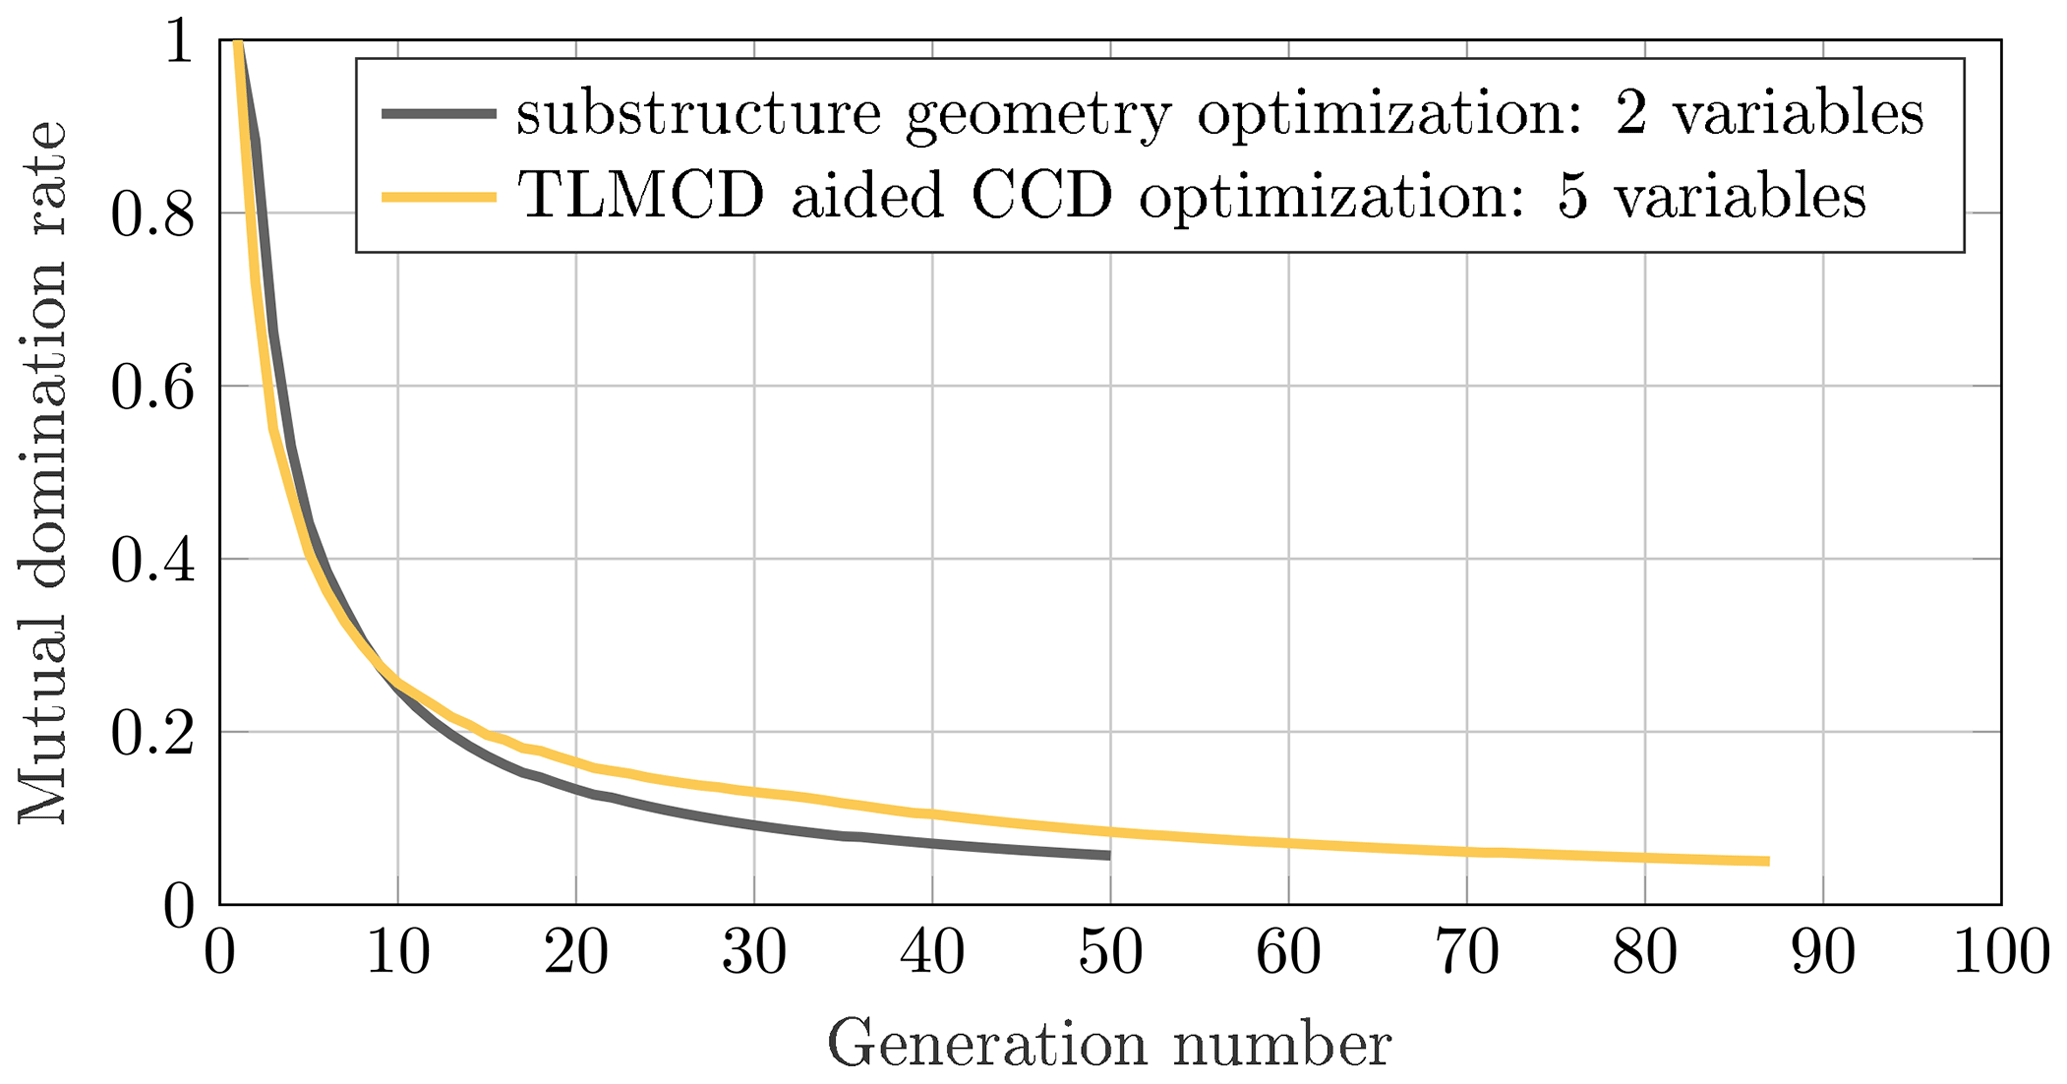
Figure 7Mutual domination rate of the optimization process, showing the convergence of the optimization process.
3.5.2 Model linearization and controller design
After all inputs for the dynamic plant are set up, steady states for various operating wind speeds can be simulated and calculated. These steady states are then used to linearize the model. The linearization of the FOWT is introduced in Lemmer et al. (2020), while the linearization of the coupled system including the TLMCD is established in Yu et al. (2023).
For the automated design of the blade pitch control for a specific FOWT, a loop-shaping-based methodology is used. A comprehensive description of the theoretical basis and evaluation based on coupled numerical simulation can be found in Yu et al. (2020). The main focus is on the search for optimal control configurations, quantified by the proportional and integral gains for the PI controller, taking into account both system stability and step response performance. The methodology primarily targets a desired closed-loop rise time Tr across the operational wind speeds. When the open-loop stability margin does not meet the requirement, the control gains prioritize the sensitivity margin, resulting in several potential combinations of control gains for each wind speed. To refine the selection into a unique control configuration for each operating point, an additional criterion (minimum settling time) is employed. However, distinguishing between different control configurations solely based on settling time alone proves challenging in this study as hydrodynamic platform characteristics often dominate this metric, leading to similar settling times across different control gains. As a result, this study diverges from the focus on minimum settling time, as presented in Yu et al. (2020), and instead targets a minimum overshoot in the design approach.
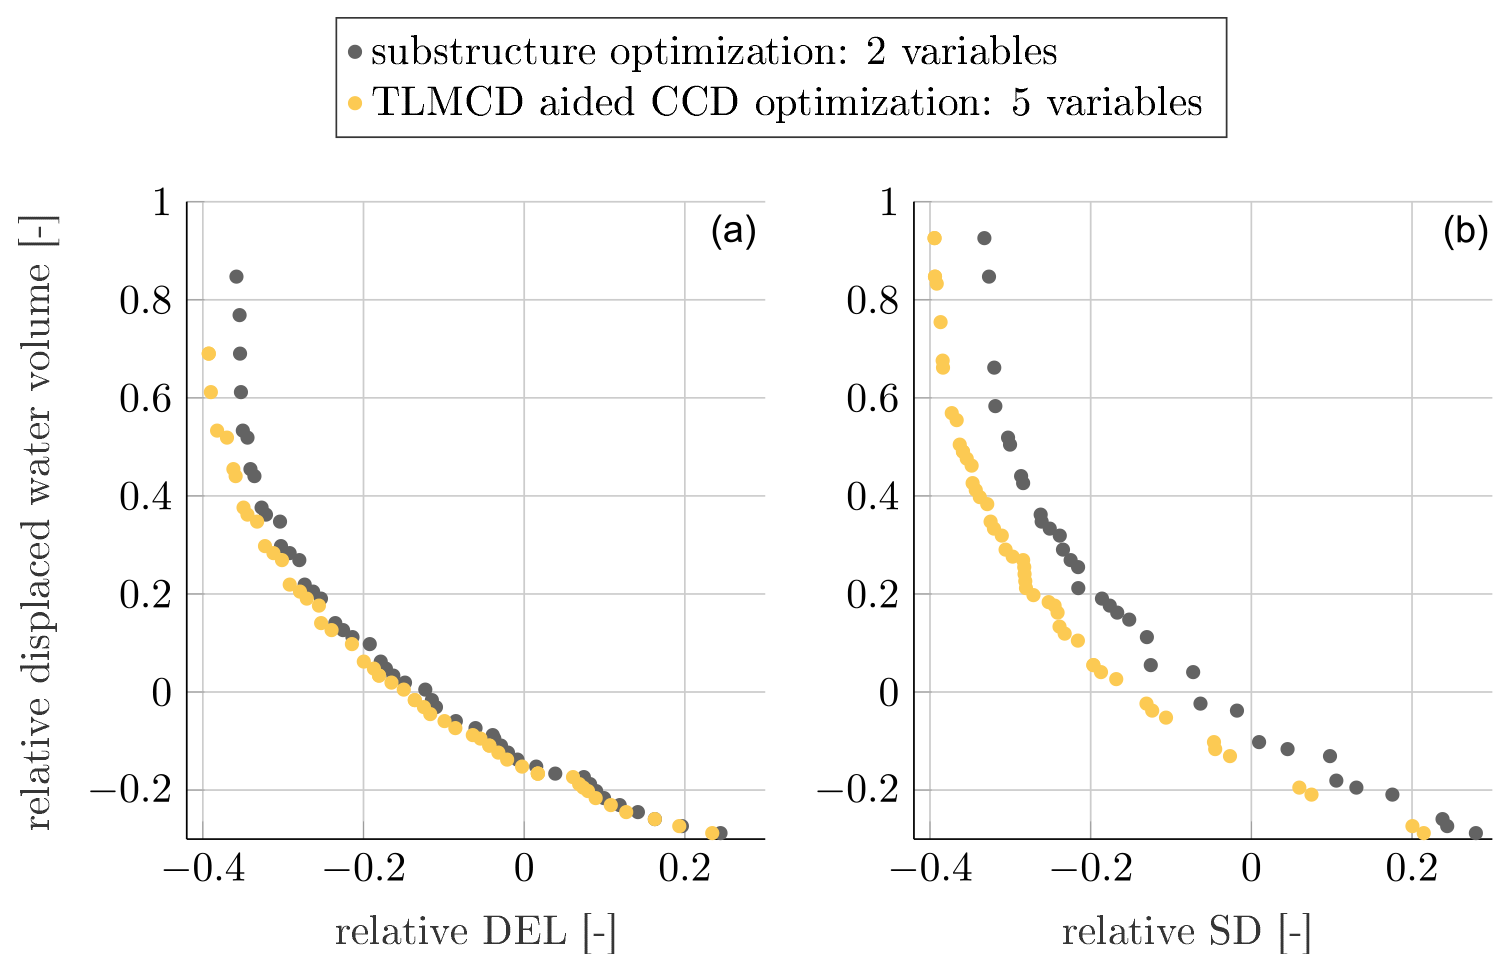
Figure 8Pareto fronts resulting from the two-variable substructure optimization, showing the trade-off between the relative displaced water volume and the relative costs defined in Eq. (2). (a) Relative displaced water volume versus relative DEL cost; (b) Relative displaced water volume versus relative SD cost.
3.5.3 Coupled design load case simulation and cost evaluation
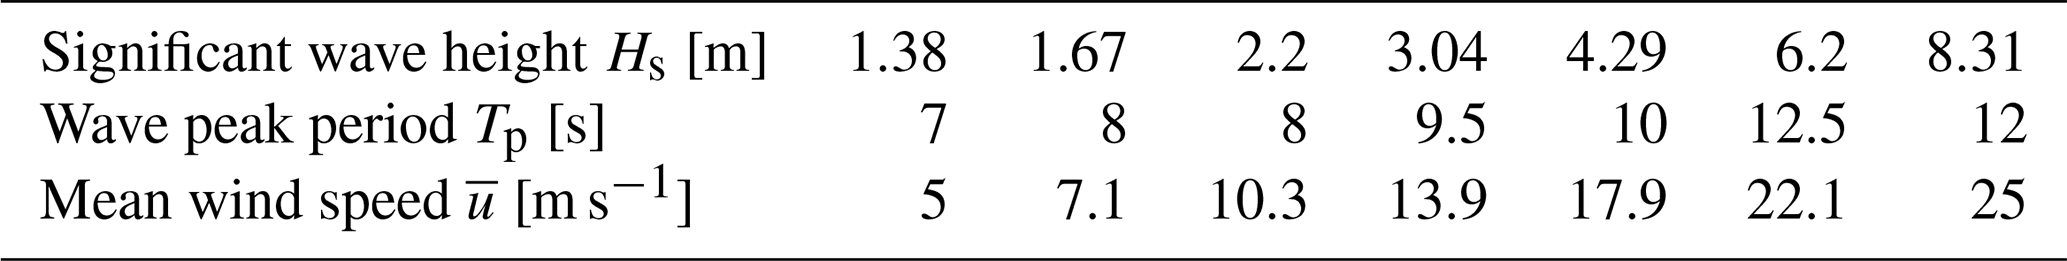
Once the dynamic plant and controller are established, the final step is to perform coupled time-domain simulations using a subset of design load cases recommended in the LIFE50+ project (Krieger et al., 2015). These load cases are listed in Table 2 and are used to evaluate the performance indicators for the objective functions.
This section discusses the results of two rounds of optimization performed to determine optimal designs. The first round only considers the geometric optimization of the substructure using two design variables: column spacing d and substructure draft. In the second round, all five variables listed in Table 1 are used in the optimization process that involves all subsystems. The results of both rounds are detailed in this section.
4.1 Initialization and convergence
For the first round of optimization, where only the substructure is optimized, a population size of 20 is used. For the second round, which involves the TLMCD and blade pitch controller in the optimization loop, the population size is increased to 50. Checking for convergence is essential to demonstrate the validity of the optimal solutions generated by the optimizer when using genetic algorithms. In this respect, Fig. 7 presents the convergence progress of both optimization rounds, indicating the evolution of the two stopping criteria previously defined. For the substructure-only optimization, it stops when the maximum generation of 50 is reached and the corresponding MDR value is 0.06. However, for the TLMCD-assisted CCD optimization, the optimization process stops before the 90th generation, as the MDR value reaches the stopping threshold of 0.05, rather than reaching the maximum allowed 100 generations. These results show the effectiveness of the two stopping criteria in ensuring convergence in the optimization process.
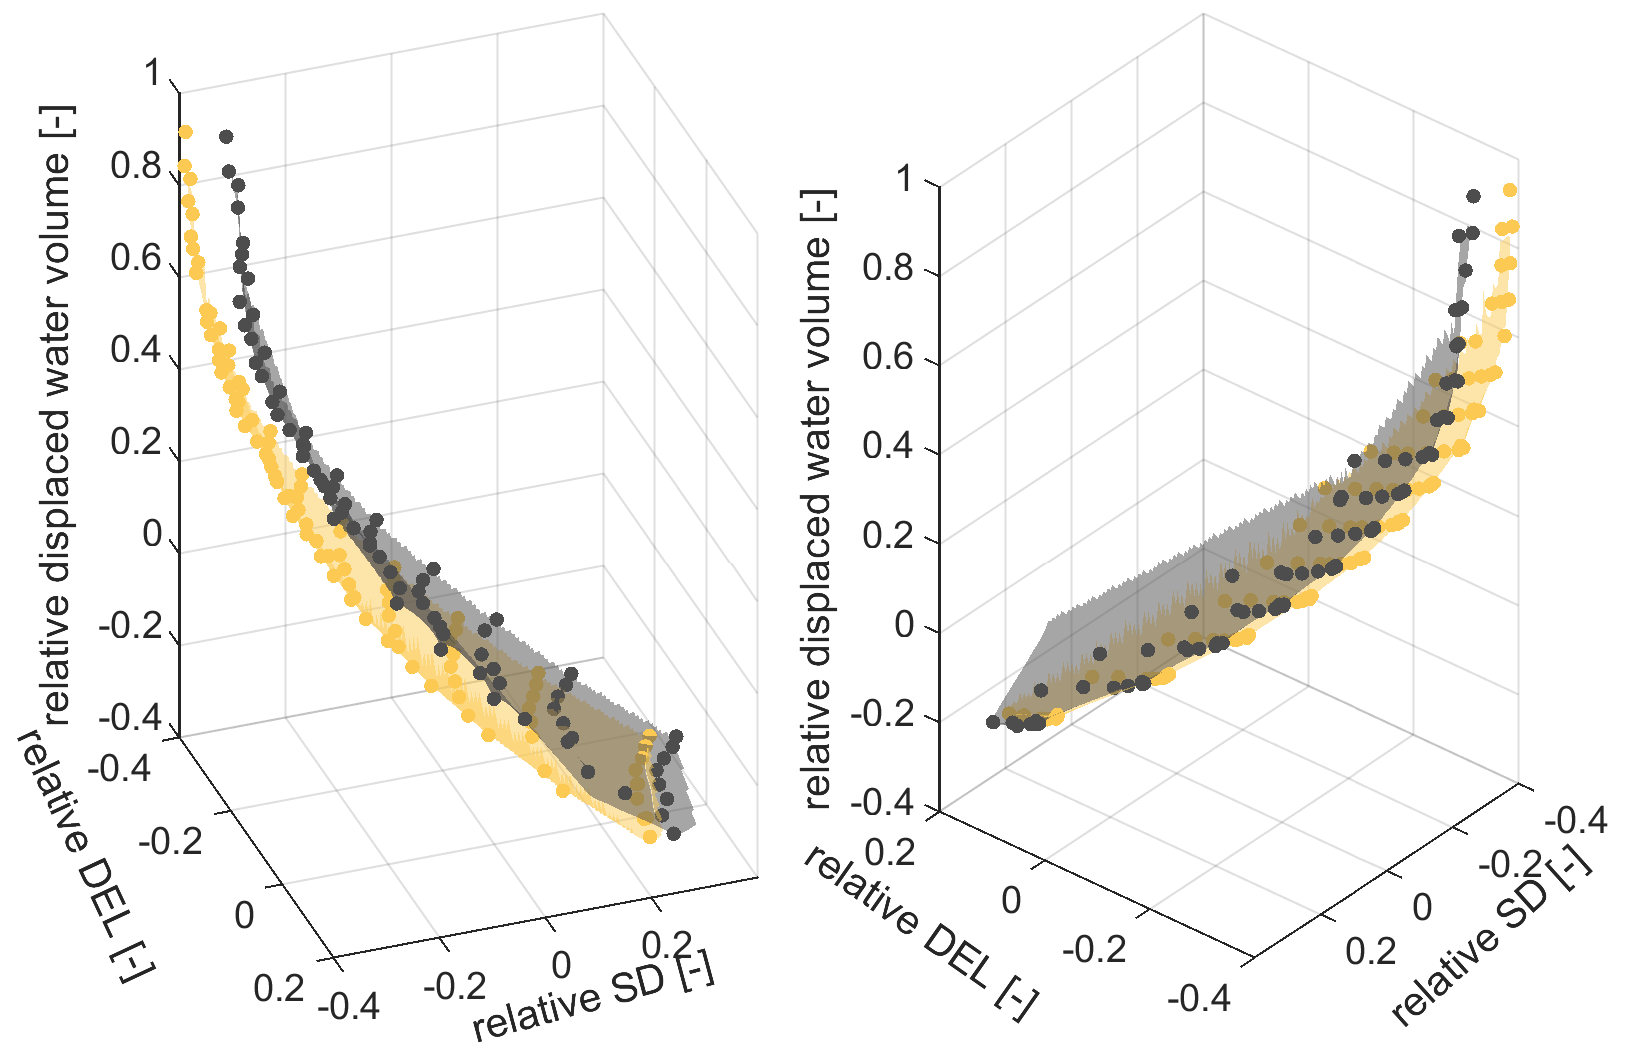
Figure 9Comparison of Pareto optimal surfaces between the two-variable geometric optimization (in black) and the five-variable TLMCD-aided CCD optimization (in yellow).
4.2 Optimal objective space
As mentioned earlier, the optimization process involves two rounds with different objectives. The following section discusses how the definition of the objectives can influence the final optimal solution.
4.2.1 Two-objective optimization
The results of a two-objective optimization are presented in Fig. 8, with two plots showing the Pareto fronts for different objectives. In the left plot, the objectives are the non-dimensional displacement, which measures the relative displaced volume compared to the original NAUTILUS-10 design, and the relative DEL. On the right plot, the relative DEL objective is changed to relative SD. The DEL objective, as defined in Eq. (2), is a combination of the tower-base fore–aft bending moment and the fairlead tension, while the SD objective includes the platform pitch motion and tower-top acceleration. For simplicity, these objectives are referred to as DEL cost and SD cost in the following discussion. In addition, the change in the Pareto front as the size of free variables is increased can be observed by comparing the black and yellow dots.
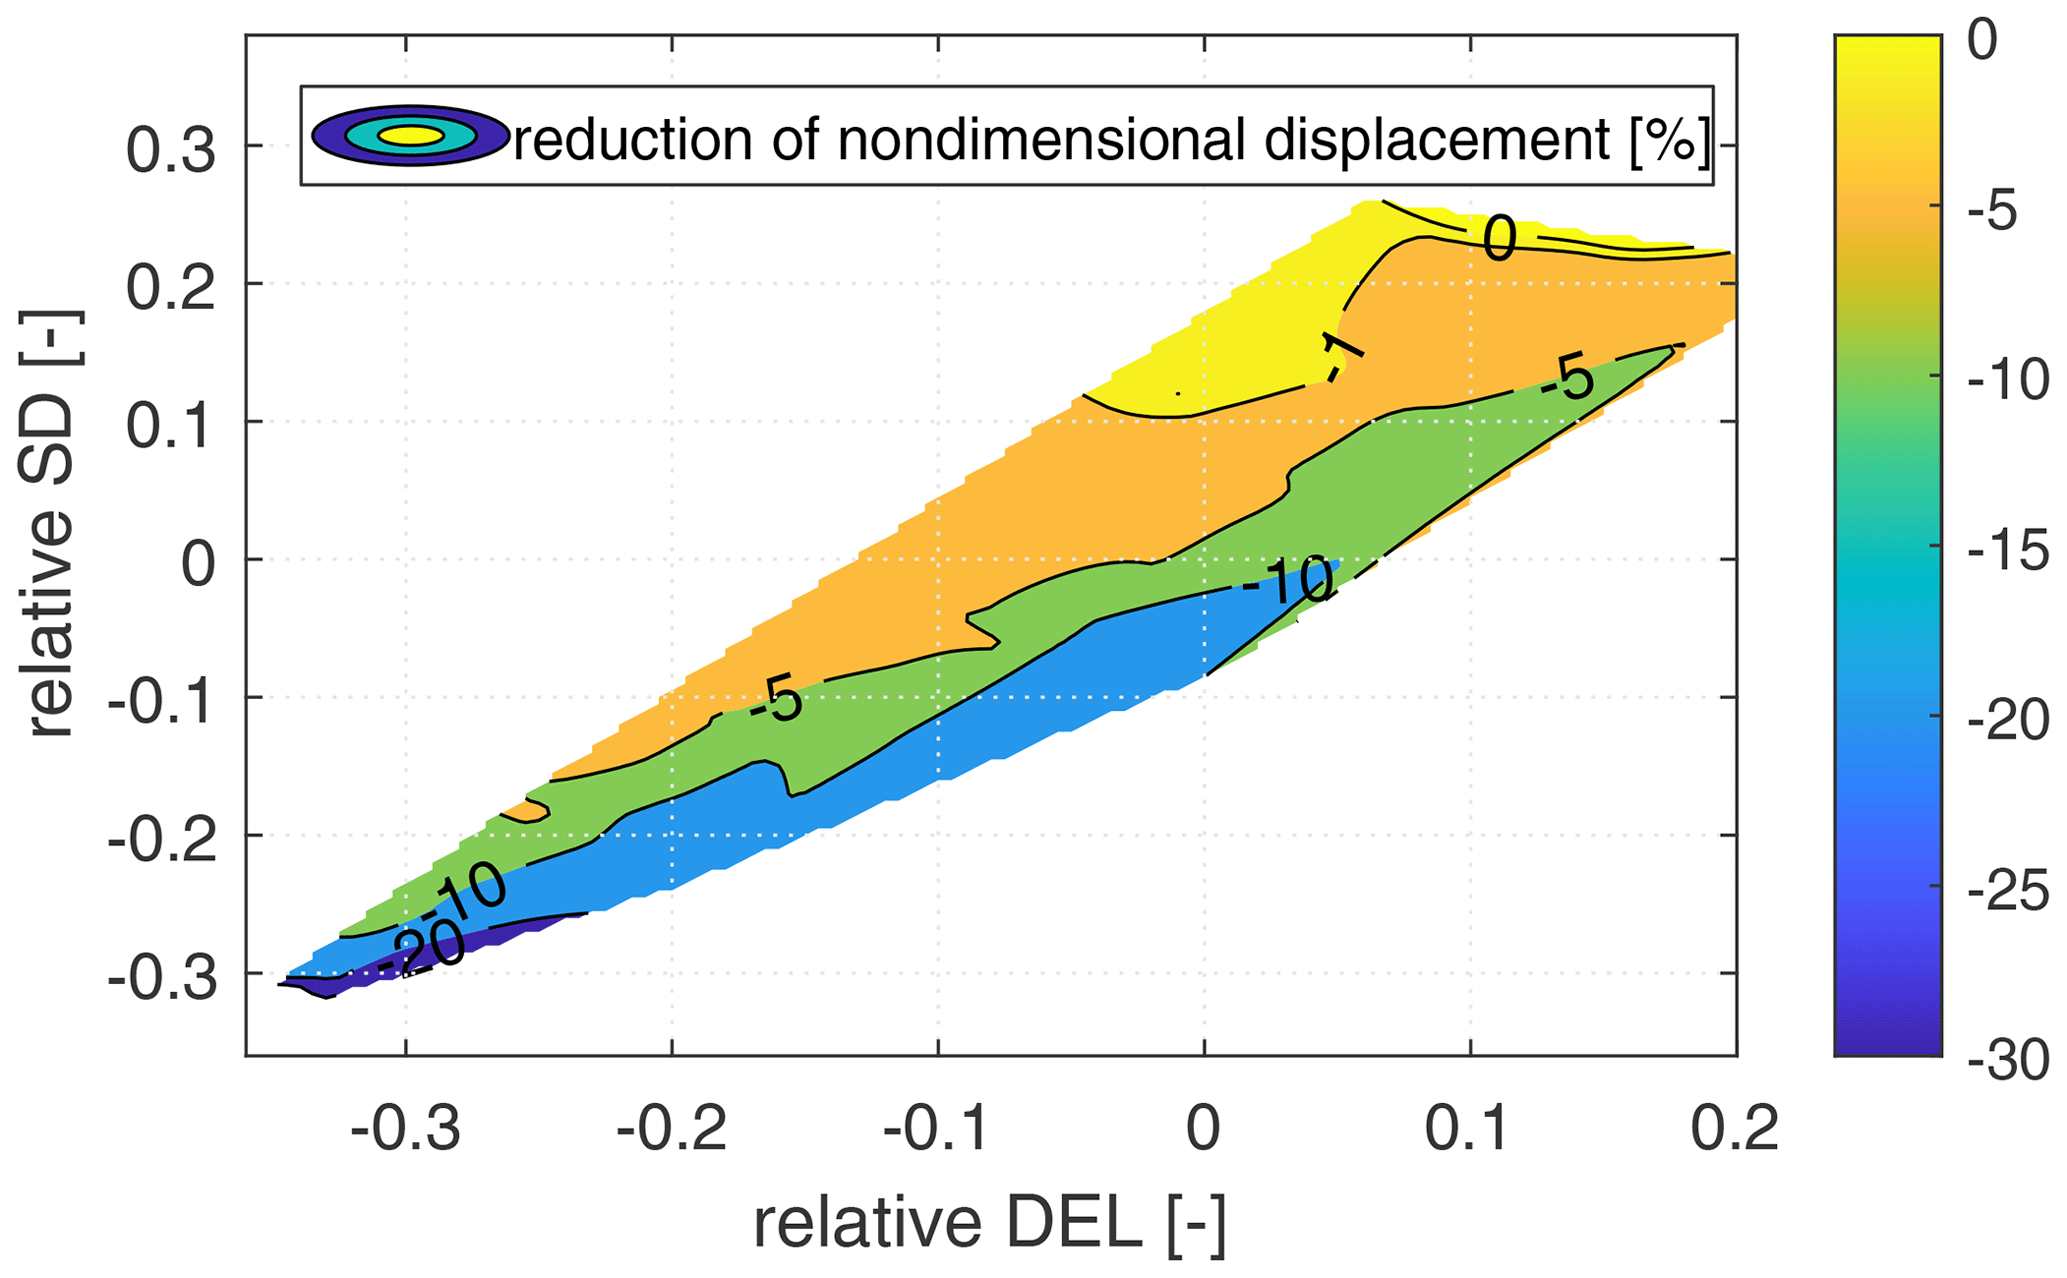
Figure 10Relative reduction in displacement contributed by the TLMCD-aided CCD optimization.
Looking at the black dots on the plots where only two variables related to the substructure geometry are optimized, two main observations can be made. Firstly, there is a strong inverse correlation between the DEL cost/SD cost and the relative displacement (displaced water volume). This correlation is nearly linear and is evident in the range where the relative displacement is approximately 20 % above and below zero. While decreasing the displacement can lead to a reduction in the total material, construction, transportation, and installation costs, this always comes at the expense of higher DEL and SD. It is worth noting that the DEL cost and SD cost are only slightly reduced when the relative displacement reaches 0.5, indicating a 50 % increase in displacement compared to the NAUTILUS-10. The second observation is that the point (0,0), which represents the same cost as the original NAUTILUS-10 design, almost coincides with the Pareto front when optimizing both displacement and SD cost. This indicates that the NAUTILUS-10 design is one of the optimal choices when considering the SD cost. However, this is not the case when the DEL cost is taken into account. In the left plot, which shows the relationship between DEL cost and displacement, it can be seen that the point (0,0) lies to the right of the Pareto front, indicating that the optimal solutions found have better performance than the original design.
The impact of the TLMCD and the blade pitch controller on the substructure geometry optimization can be seen by comparing the yellow and black dots. Obviously, the Pareto fronts are shifted to the left side, indicating an improved overall dynamic response. Despite this, the shape of the Pareto front is very similar to the one obtained from pure substructure geometry optimization; therefore, the previous observations still apply. However, a notable improvement in the platform pitch motion can be found as the SD cost is reduced by 5 % to 10 % for the same displacement. In terms of the DEL cost, the contributions of the TLMCD and the blade pitch controller are limited when the displacement is relatively small. These designs are typically lighter and have higher natural frequencies, which are closer to the wave frequency range. This makes them more susceptible to wave-induced excitation, and the dynamic response cannot be significantly improved even with additional damping. Of course, the mass of the TLMCD also plays an important role. As smaller substructures have a TLMCD with less fluid mass, their ability to compensate for motion induced by aerodynamics is limited. This explains why the designs with larger displacement in the optimization process can achieve a bigger improvement by including the TLMCD.
4.2.2 Three-objective optimization
The Pareto front obtained from a two-objective optimization only shows the optimal solutions for each optimization case, with only two objectives being optimized at a time. However, it is important to note that the decision space may be different for each of the cases shown in Fig. 8, which means that a design that minimizes SD cost may not necessarily minimize DEL cost at the same time. To address this limitation, it is necessary to optimize all three objectives.
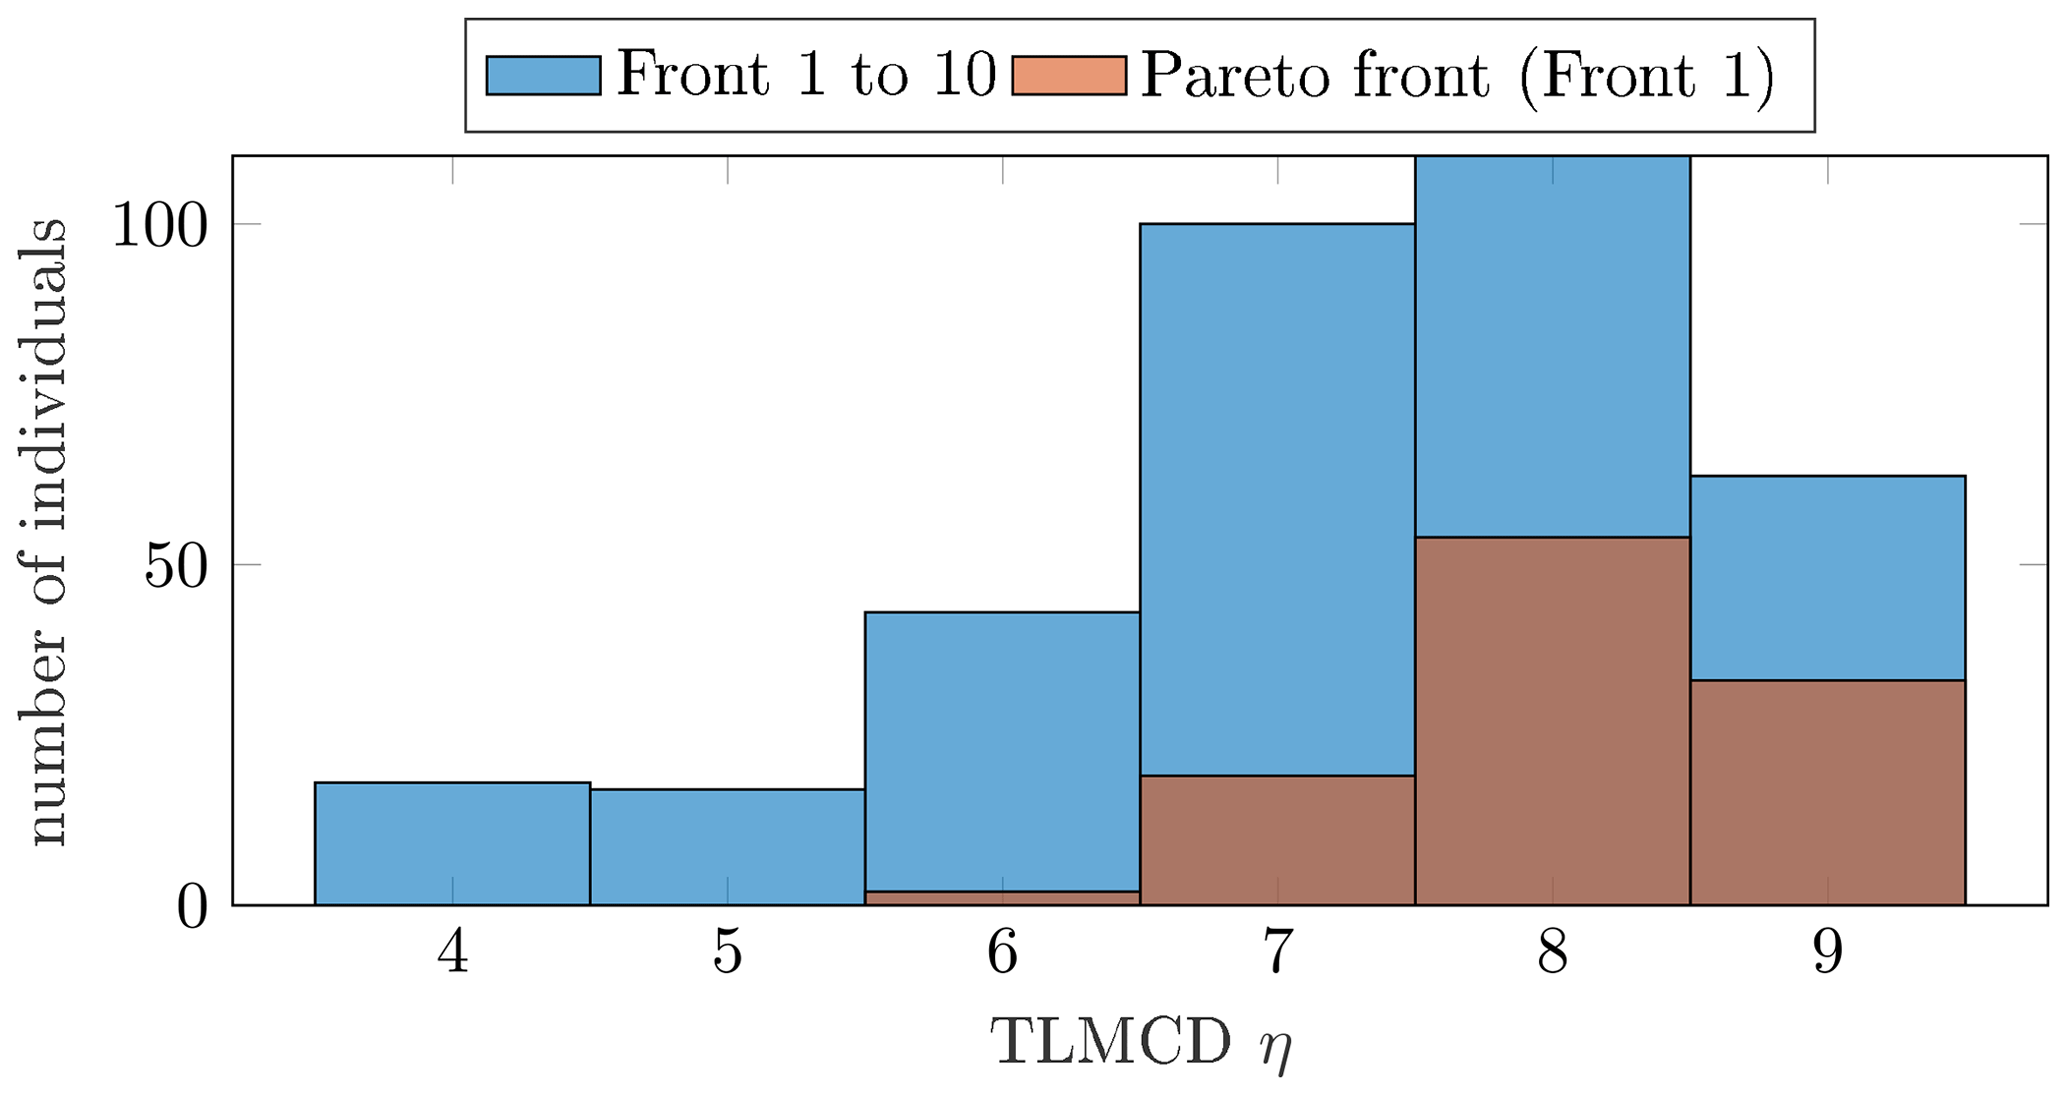
Figure 9 illustrates the Pareto surfaces from two different views, providing an insight into the impact of additional optimization variables and objectives. The main findings of the two-objective optimization are supported by the Pareto surfaces depicted in Fig. 9 as well. The inclusion of a TLMCD in the floater design can reduce the displacement required to achieve the same DEL cost and SD cost, resulting in a lower total substructure cost. However, it is noted that the displacement reduction is most apparent when the SD cost is relatively low, and when the SD cost is more than 20 % higher than the original NAUTILUS design, the effect of the TLMCD is almost negligible. This is probably due to the highly dynamic nature of the system, which is strongly influenced by wind and waves, making the use of a TLMCD unhelpful.
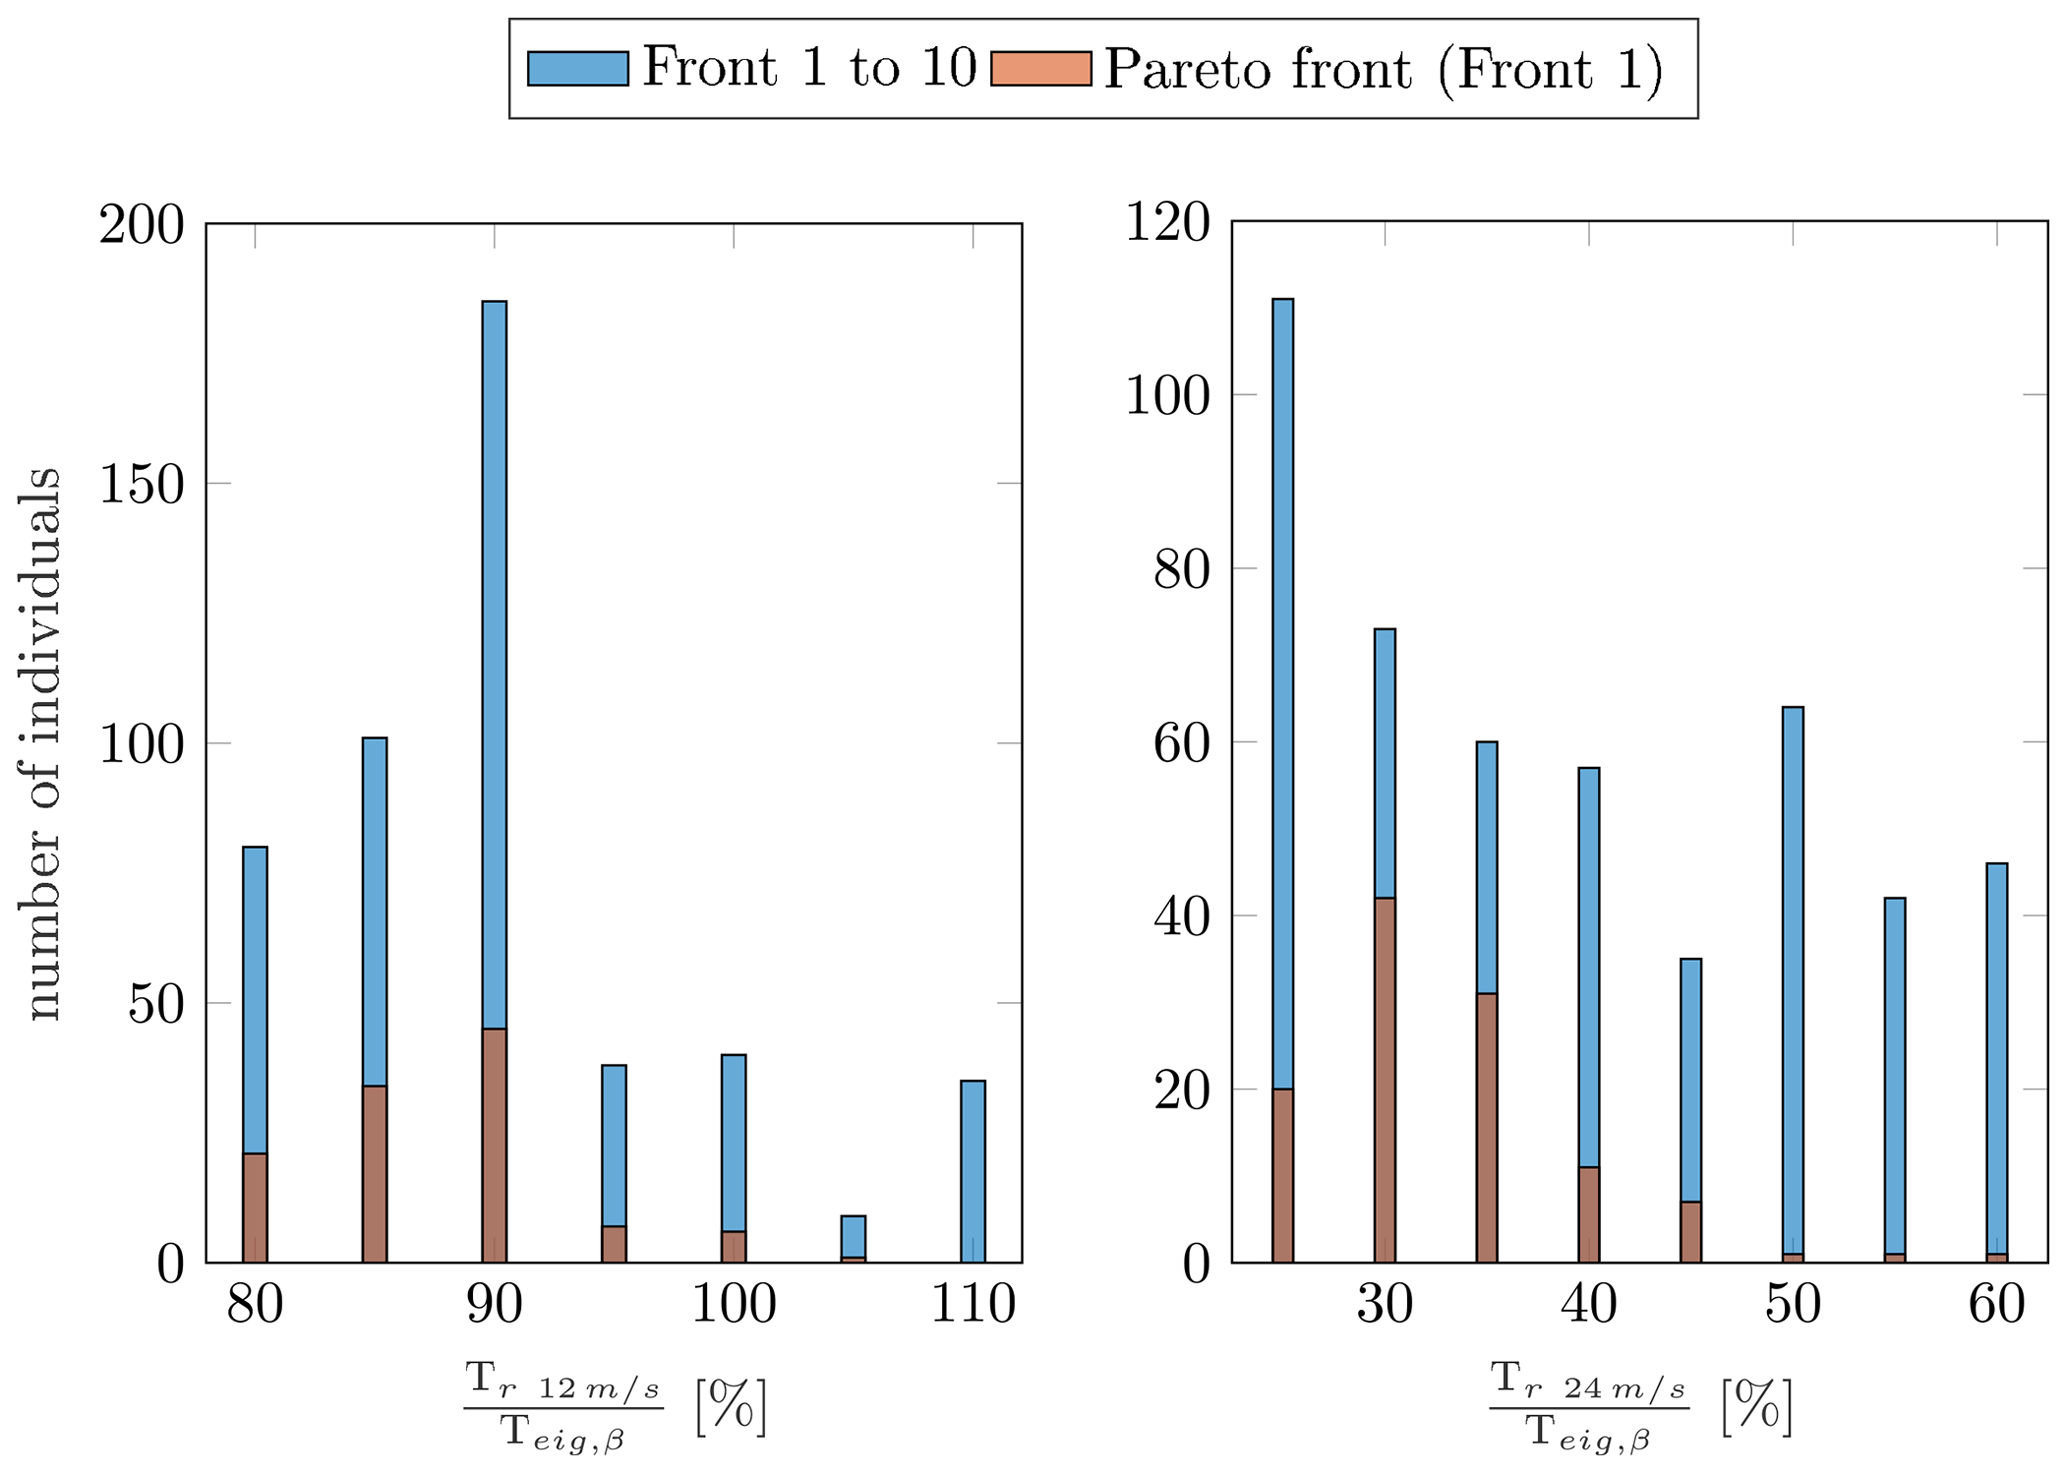
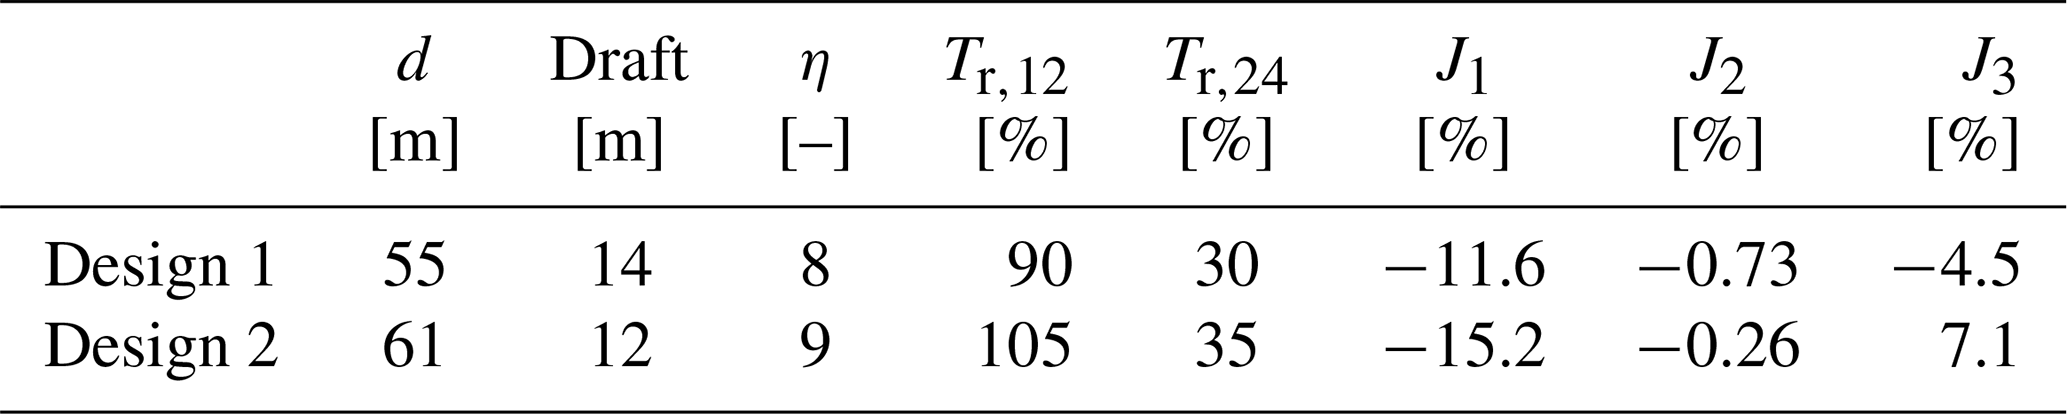
Table 3Properties and costs of the two selected designs on the optimal Pareto surface.
To gain a better understanding of the displacement reduction contributed by the TLMCD, the contour lines of the displacement reduction plotted against the SD cost and DEL cost are presented in Fig. 10. The displacement reduction is defined as the difference in the relative displaced water volume on the Pareto surfaces for the same DEL cost and SD cost as shown in Fig. 9. A negative value indicates that the design with TLMCD requires lower displacement to achieve the same DEL cost and SD cost, resulting in cost savings (indirectly reflected by the reduced displacement) without compromising the loads and motions. The results show that a well-designed TLMCD along with a tailored blade pitch controller can reduce the FOWT displacement by up to 20 %. When targeting the DEL cost and SD cost of the original NAUTILUS-10, the displacement reduction is approximately in the range from 5 % to 10 %.
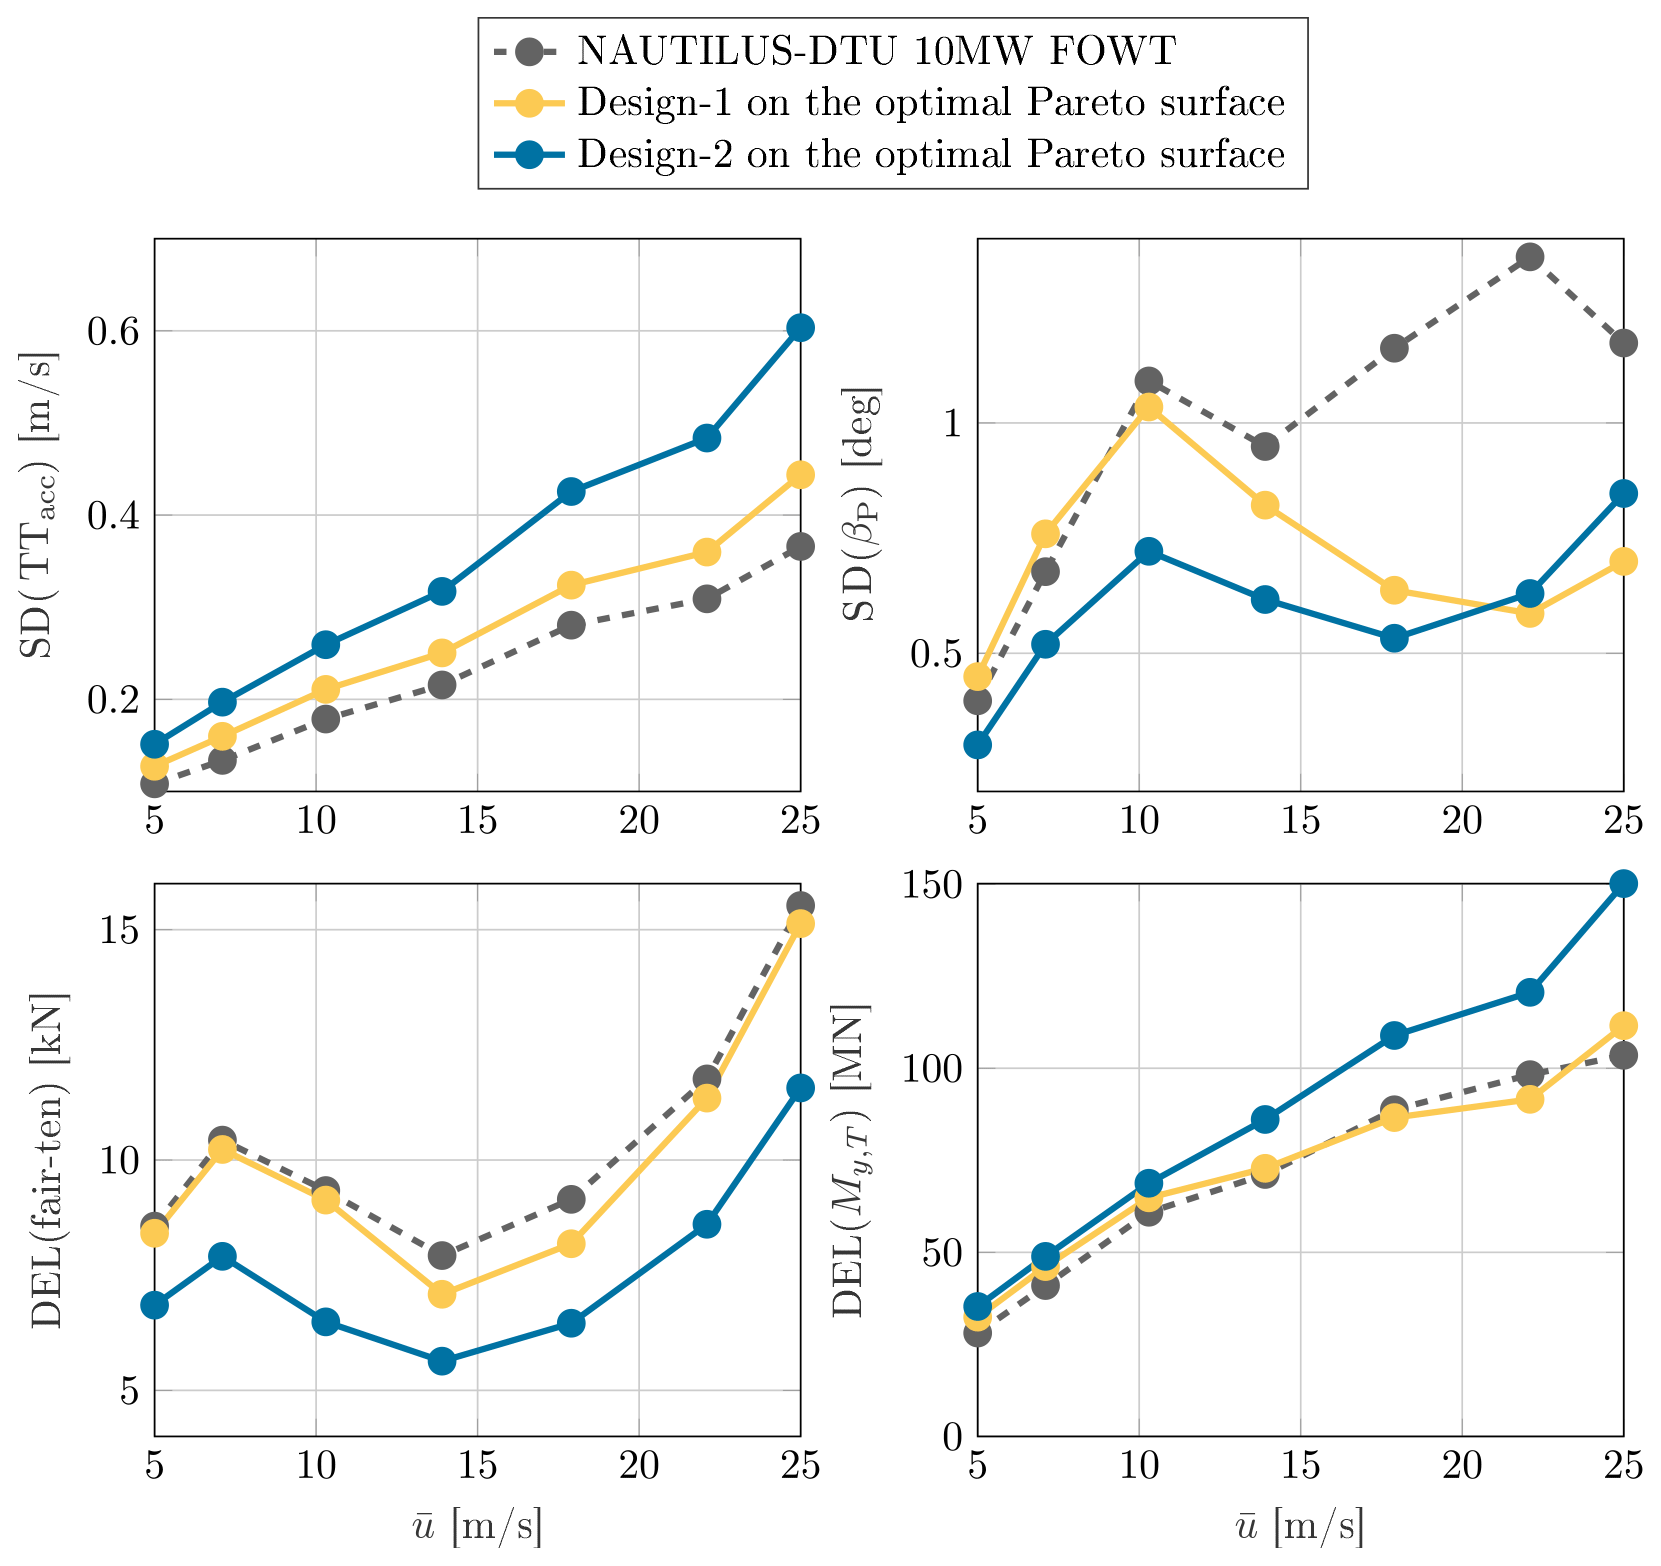
Figure 14Comparison of statistical responses between the original NAUTILUS-10 design and two selected designs with similar SD cost and DEL cost on the optimal Pareto surface.
4.3 Optimal decision space
While the focus so far has been on achieving optimal objectives, it is also essential for system designers to examine the design choices that can ensure good performance. The following section discusses the decision space, which represents the optimal subsystem designs chosen by the optimizer. This will provide a better insight into how design choices affect the overall performance of the system.
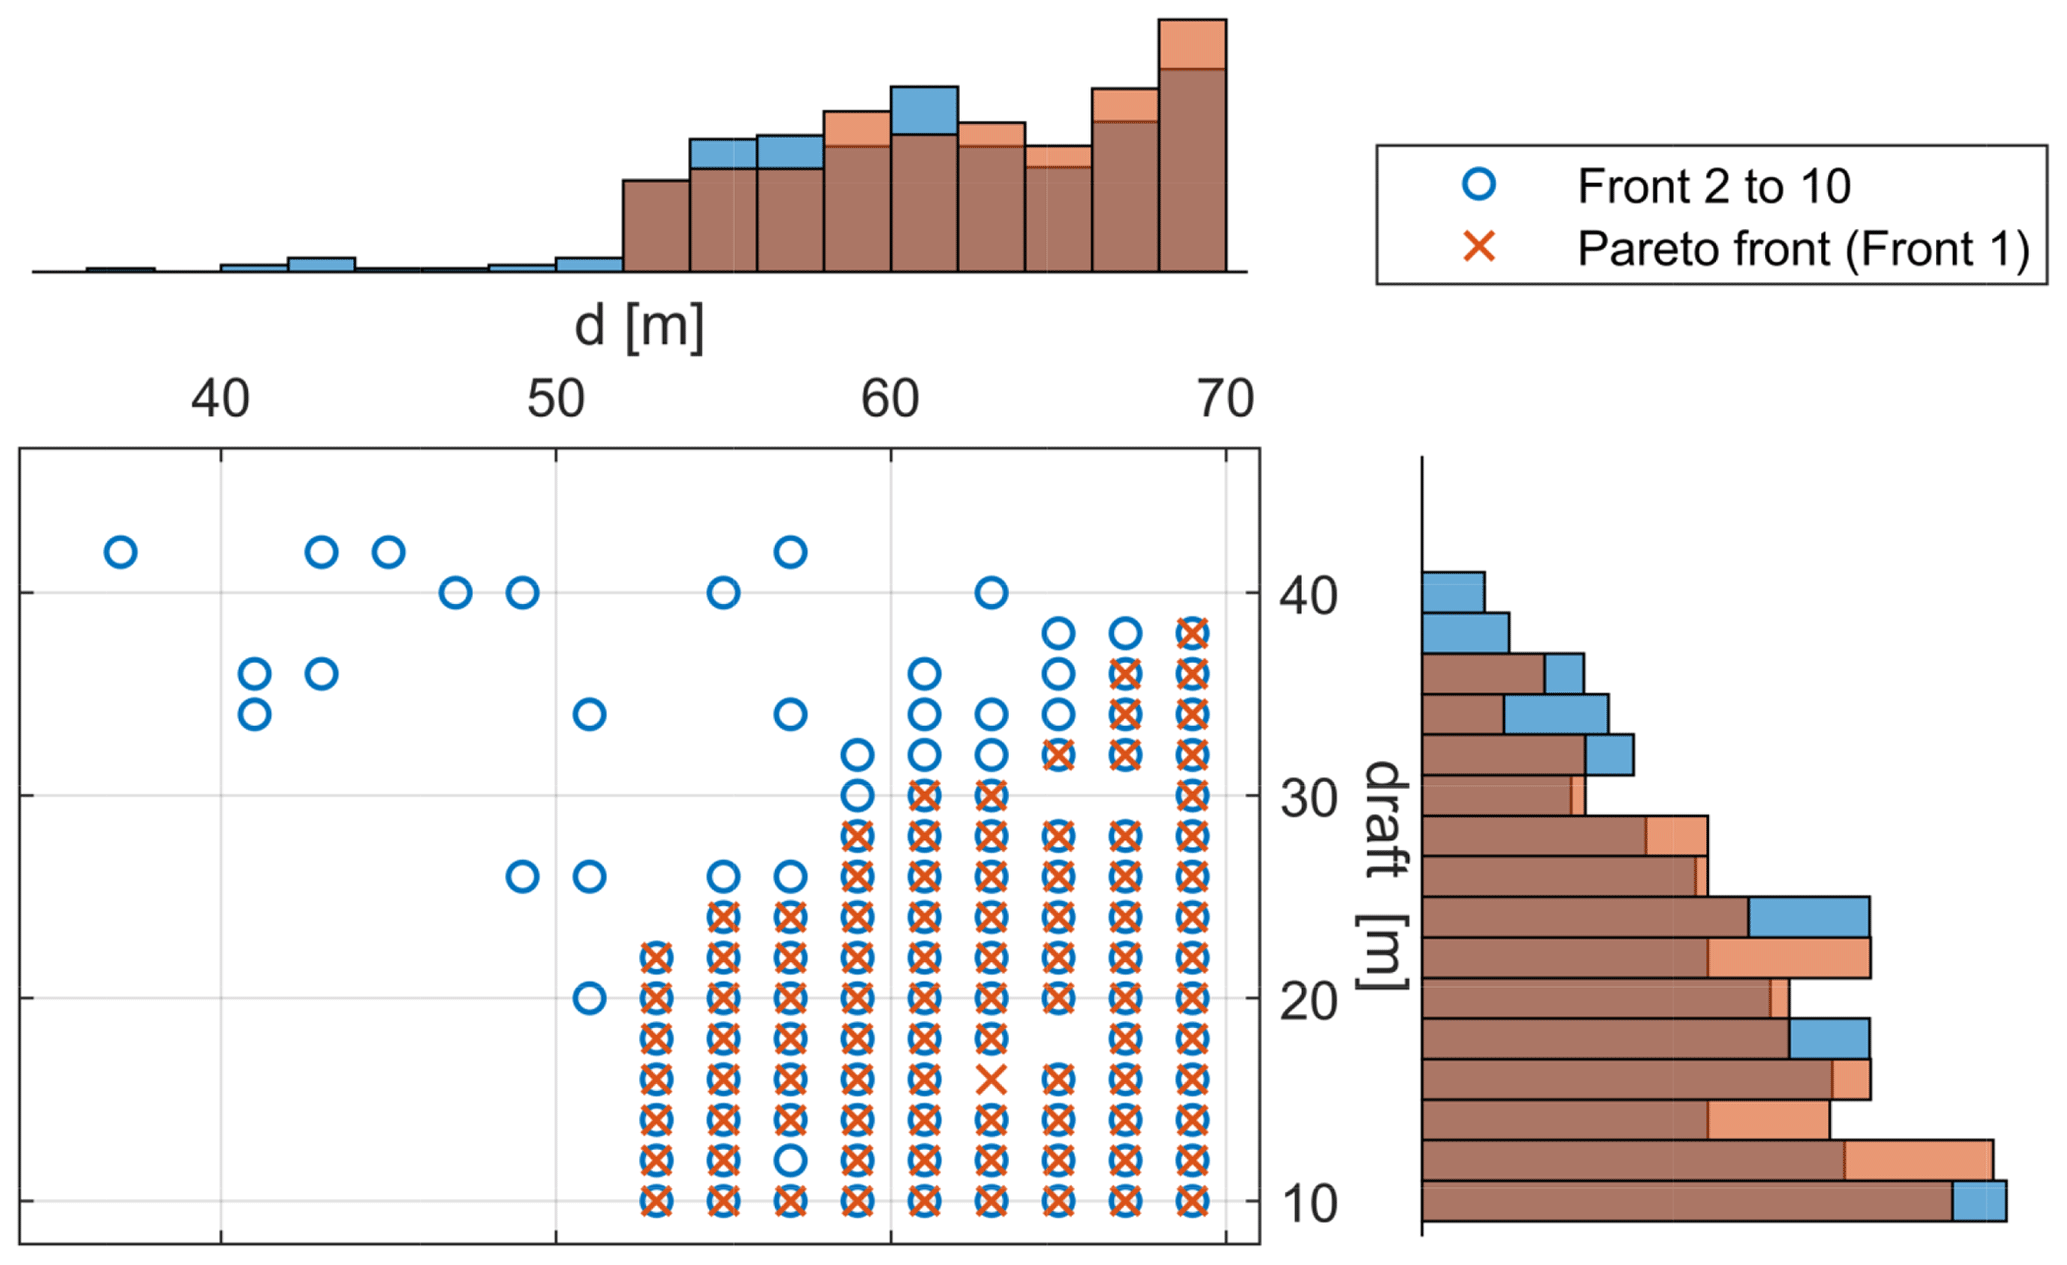
Figure 11 shows the optimal geometric design space of the substructure along with its corresponding histograms. The data indicate that the optimal designs tend to have a larger column spacing d as no solutions are found for d<50 m. Designs with the column spacing m account for the highest percentage of designs on the Pareto surface. This observation can be explained by the increased second-order moment of inertia of the water-plane area resulting from the larger column spacing. For the same mass and displacement, a substructure with a larger column spacing generates a higher restoring moment in roll and pitch directions, which reduces the pitch and roll motions. However, it is important to note that the optimization process does not consider the structural integrity of the deck and heave plate, which connect the four vertical columns. Consequently, the distribution of optimal designs may vary if this factor is taken into account. Nevertheless, many optimal solutions are found slightly below a draft of 60 m despite the smaller column spacing in this range, which may indicate the presence of local optima.
The design of the TLMCD involves only one free variable, namely the head loss η. The histogram in Fig. 12 indicates that most optimal solutions have head loss values ranging from 7 to 9, with η=8 being the most frequently selected value. However, it is important to note that this optimal value of η is only applicable to this specific concept and defined objectives. The optimal value of η may differ for other designs with different design objectives.
The last two design variables are associated with the blade pitch controller – specifically, the rise time, Tr, of the closed-control-loop shaping at wind speeds of 12 (Tr,12) and 24 m s−1 (Tr,24), as shown in Fig. 13. It was suggested in Yu et al. (2020) that the Tr value at 12 m s−1 should be slightly smaller than the platform pitch natural period. This recommendation is supported by the optimal Tr,12 distribution, where 90 % of the platform pitch natural period is the preferred choice, although a slightly smaller value of Tr (i.e., 85 % of the platform pitch natural period) can still achieve satisfactory performance. Regarding the optimal Tr at 24 m s−1, the histogram suggests that a value of 30 % or slightly higher (i.e., 35 %) provides the best performance. It is important to note that these optimal values are specific to the current design and may vary in other wind turbine systems.
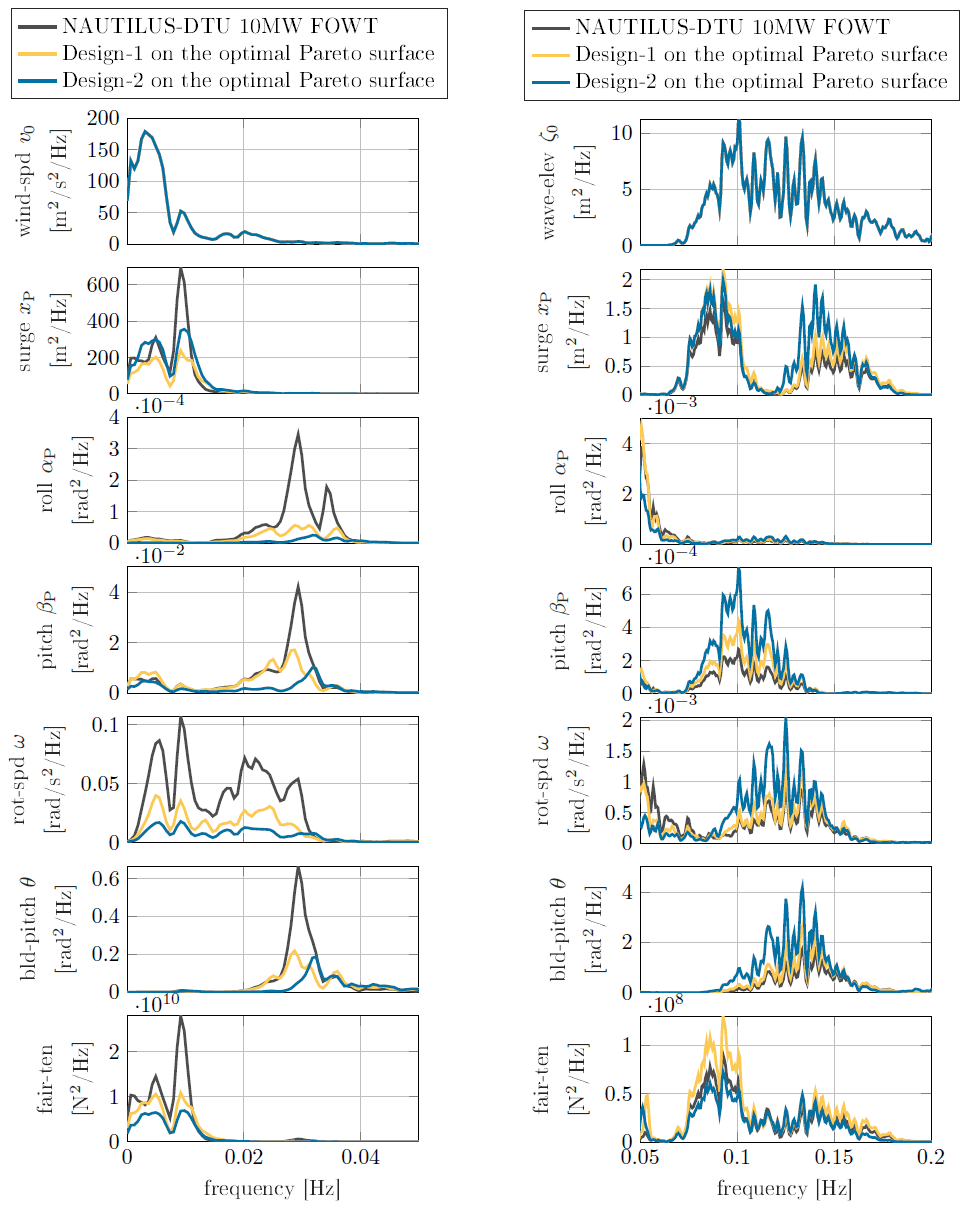
Figure 15Comparison of frequency responses between the original NAUTILUS-10 design and two selected designs with similar SD cost and DEL cost on the optimal Pareto surface at wind speed 13.9 m s−1.
The results of the TLMCD-aided CCD optimization show that the optimizer can potentially reduce the displaced tonnage of a FOWT by up to 20 %. While the optimizer only considers the defined design objectives, it is still important to examine the dynamic responses of the optimal designs. Hence, two designs with similar DEL costs and SD costs to the original NAUTILUS-10 design are selected. The corresponding design space and decision space are listed in Table 3.
Design 1 and Design 2 are two optimal designs on the Pareto surface that are selected for further analysis. Design 1 has a column spacing that is similar to the original NAUTILUS-10, but its draft is 4 m shorter, resulting in a reduction in the displaced tonnage of the FOWT by 11.6 %. In contrast, Design 2 has a larger column spacing and a further reduced draft, resulting in a reduction in the displaced tonnage of 20 %. Both designs have very similar DEL costs to the original NAUTILUS-10 design (less than 1 % difference). Additionally, Design 1 has a lower SD cost, while Design 2 has a 7.1 % increase in SD cost, which is a cost for the significantly reduced displacement.
In Fig. 14, a statistical analysis of all sensors used in the cost model is presented. The DELs of the tower-base bending moment and fairlead tension are quite similar between Design 1 and the original NAUTILUS-10 design, with a slightly lower fairlead tension for the former in the wind speed range of 11–20 m s−1. The fairlead tension of Design 2 is further reduced, while the tower-base bending moment is increased, resulting in an overall increase in DEL cost of 7.1 %. In terms of SD cost, the nacelle acceleration of the optimal design is higher across all operating wind speeds, mainly due to the reduced draft. This reduction results in a higher overall center of gravity and a lower pitch stiffness, leading to a slightly larger mean platform pitch angle for the optimal designs. At below rated wind speeds, the platform pitch of both designs is similar to the blade pitch is not yet activated. At higher wind speeds, the redesigned blade pitch controller and the positive contribution of the TLMCD significantly reduce the motions. Despite the higher nacelle acceleration, the overall SD cost of the optimal designs is comparable to that of the original NAUTILUS-10 design since the cost model considers tower-top acceleration and platform pitch motion equally in the cost calculation.
Figure 15 provides a detailed comparison of the power spectral density (PSD) of the dynamic responses at a wind speed of 13.9 m s−1. Due to the significant differences in the PSD amplitudes across the frequency range, the plots are split into two parts, with the left plots showing the frequency range from 0 to 0.05 Hz and the right plots showing the frequency range from 0.05 to 0.2 Hz. In the lower frequency range, wind excitation dominates the responses. In addition, the natural frequencies of platform motions also contribute to resonances in this region. Interestingly, Design 1 and Design 2 exhibit significantly lower roll and pitch response amplitudes near 0.03 Hz, which indicates the significant contribution of the TLMCD. This reduction results in lower rotor effective turbulence, which not only reduces the blade pitch activity, but also the rotor speed oscillation. In the higher frequency range, the system is primarily excited by the waves. However, the amplitudes of the PSDs are generally much smaller in this region. Both Design 1 and Design 2 show higher roll and pitch motions in this range due to the reduced displacement of the substructure, which negatively affects the dynamic responses in waves. However, the roll and pitch motions of both designs are still slightly lower than those of NAUTILUS-10 when considering the response across the entire frequency range.
Integrating a tuned liquid damping system into a FOWT presents a substantial system optimization challenge. The potential benefits of such a damping system to the overall system depend largely on its interaction with the turbine control system, the design of which is also linked to the substructure geometry. Due to the physical coupling between aerodynamics and hydrodynamics, the design of each subsystem has a significant impact on the overall system dynamics. The optimization of these individual subsystems, as well as their efficient cooperation, essentially influences the final system performance of the FOWT. To address this challenge, a multi-objective CCD optimization framework has been developed to optimize the substructure geometry, the TLMCD, and the blade pitch controller, systematically incorporating a tuned liquid damping system into a FOWT. The framework explores the design space of all three subsystems simultaneously, searching for the optimal synergy between them to achieve a good balance between production cost and response performance.
A case study based on the LIFES50+ NAUTILUS-10 design is performed to demonstrate the capability of the optimization framework including the TLMCD and CCD. It is found that a well-designed TLMCD can reduce both FOWT motions and loads. In addition, the power fluctuations are also reduced because of the increased flexibility of the blade pitch controller as the negative aerodynamic damping is partially compensated for by the additional damping of the TLMCD. On the contrary, if the motions and loads can remain similar to the benchmark optimization, a much lighter substructure design can be achieved. This contributes to reducing the manufacturing costs without deteriorating the motion and load performance. In summary, these results show that CCD optimization by incorporating a TLMCD has significant potential to improve the LCOE of a FOWT.
While the initial concept-level results show promise, further analysis tailored to industrial application is imperative. In particular, integrating considerations for the platform's structural integrity into the optimization framework as design constraints is essential. The current optimization findings suggest that larger column spacing between platforms tends to improve the dynamic responses; yet, this may conflict with the structural integrity of the heave plate. Further investigation of this component would provide a more realistic design assessment. Due to computational limitations, the platform geometry optimization currently focuses on only two free variables. Exploring enhancements by optimizing the column diameter could yield considerable benefits. Additionally, introducing more industry-specific objective functions that accurately reflect the LCOE will contribute to the derivation of more realistic and optimal designs.
The work presented uses SWE's in-house code for reduced-order wind turbine modeling and simulation, and simulation management, which have not yet been published. However, SWE is open to scientific collaborations in which the simulation models can be made available.
The data for the figures can be accessed via https://doi.org/10.5281/zenodo.10997873 (Yu, 2024).
WY: conceptualization, methodology, implementation of the framework, analysis, and writing (original draft preparation). STZ: parameterization of the NAUTILUS-10 semi-submersible substructure and writing (reviewing and editing). FL: supervision and writing (reviewing and editing). PWC: supervision and writing (reviewing and editing).
The contact author has declared that none of the authors has any competing interests.
Publisher’s note: Copernicus Publications remains neutral with regard to jurisdictional claims made in the text, published maps, institutional affiliations, or any other geographical representation in this paper. While Copernicus Publications makes every effort to include appropriate place names, the final responsibility lies with the authors.
This research was partly supported by the CROWN project. The CROWN project has received funding from the Eurostars-2 joint program, with co-funding from the European Union Horizon 2020 research and innovation program.
This research has been supported by the Eurostars-2 program (grant no. E!113443).
This open-access publication was funded by the University of Stuttgart.
This paper was edited by Amy Robertson and reviewed by two anonymous referees.
Coudurier, C., Lepreux, O., and Petit, N.: Modelling of a tuned liquid multi-column damper. Application to floating wind turbine for improved robustness against wave incidence, Ocean Eng., 165, 277–292, https://doi.org/10.1016/j.oceaneng.2018.03.033, 2018. a
Cross-Whiter, J., Ackers, B. B., Arora, D., Wright, A., Fleming, P., Lackner, M., and Park, S.: Load mitigation on floating offshore wind turbines with advanced controls and tuned mass dampers, in: Proceedings of the ASME 2018 1st International Offshore Wind Technical Conference, San Francisco, CA, 4–7 November 2018, https://doi.org/10.1115/IOWTC2018-1096, 2018. a, b
Deb, K., Pratap, A., Agarwal, S., and Meyarivan, T.: A fast and elitist multiobjective genetic algorithm: NSGA-II, IEEE T. Evolut. Comput., 6, 182–197, https://doi.org/10.1109/4235.996017, 2002. a
Garcia-Sanz, M.: Control Co-Design of Floating Offshore Wind Turbines, in: Presented at the 5th Wind Energy Systems Engineering Workshop, Pamplona, Spain, https://www.nrel.gov/wind/assets/pdfs/systems-engineering-workshop-2019-control-co-design-offshore.pdf (last access: 8 April 2024), 2019. a
Gawad, A. F., Ragab, S. A., Nayfeh, A. H., and Mook, D. T.: Roll stabilization by anti-roll passive tanks, Ocean Eng., 28, 457–469, https://doi.org/10.1016/S0029-8018(00)00015-9, 2001. a
Hall, M., Buckham, B., and Crawford, C.: Evolving offshore wind: A genetic algorithm-based support structure optimization framework for floating wind turbines, 2013 MTS/IEEE OCEANS – Bergen, 10 pp., https://doi.org/10.1109/OCEANS-Bergen.2013.6608173, 2013. a
Hegseth, J. M., Bachynski, E. E., and Martins, J. R.: Integrated design optimization of spar floating wind turbines, Mar. Struct., 72, 102771, https://doi.org/10.1016/j.marstruc.2020.102771, 2020. a
Krieger, A., Ramachandran, G. K. V., Vita, L., Gómez Alonso, P., Berque, J., and Aguirre-Suso, G.: LIFES50+ D7.2 Design basis, Tech. rep., DNVGL, https://lifes50plus.eu/wp-content/uploads/2015/11/D72_Design_Basis_Retyped-v1.1.pdf (last access: 8 April 2024), 2015. a
Lackner, M. A. and Rotea, M. A.: Structural control of floating wind turbines, Mechatronics, 21, 704–719, https://doi.org/10.1016/j.mechatronics.2010.11.007, 2011. a
Lemmer, F., Müller, K., Yu, W., Faerron-Guzmán, R., and Kretschmer, M.: LIFES50+ Deliverable D4.3 Optimization framework and methodology for optimized floater design, Tech. rep., University of Stuttgart, https://lifes50plus.eu/wp-content/uploads/2017/01/GA_640741_LIFES50_D4.3-web_Updated.pdf (last access: 8 April 2024), 2017a. a
Lemmer, F., Müller, K., Yu, W., Schlipf, D., and Cheng, P. W.: Optimization of Floating Offshore Wind Turbine Platforms With a Self-Tuning Controller, in: ASME 2017 36th International Conference on Ocean, Offshore and Arctic Engineering, Trondheim, Norway, 25–30 June, V010T09A080, https://doi.org/10.1115/OMAE2017-62038, 2017b. a, b
Lemmer, F., Yu, W., Luhmann, B., and Cheng, P. W.: Multibody modeling for concept-level floating offshore wind turbine design, Multibody Syst. Dyn., 49, 203–236, https://doi.org/10.1007/s11044-020-09729-x, 2020. a, b
Lemmer (né Sandner), F., Yu, W., Schlipf, D., and Cheng, P. W.: Robust gain scheduling baseline controller for floating offshore wind turbines, Wind Energy, 23, 17–30, https://doi.org/10.1002/we.2408, 2019. a
Martí, L., García, J., Berlanga, A., and Molina, J. M.: A stopping criterion for multi-objective optimization evolutionary algorithms, Inform. Sciences, 367–368, 700–718, https://doi.org/10.1016/j.ins.2016.07.025, 2016. a
Seshadri, A.: NSGA – II: A multi-objective optimization algorithm, MATLAB File Exchange [code], https://www.mathworks.com/matlabcentral/fileexchange/10429-nsga-ii-a-multi-objective-optimization-algorithm (last access: 8 April 2024), 2009. a
Storn, R.: On the usage of differential evolution for function optimization, in: Proceedings of North American Fuzzy Information Processing, 519–523, https://doi.org/10.1109/NAFIPS.1996.534789, 1996. a
Tong, X., Zhao, X., and Karcanias, A.: Passive vibration control of an offshore floating hydrostatic wind turbine model, Wind Energy, 21, 697–714, https://doi.org/10.1002/we.2188, 2018. a
Yu, W.: Dataset for “Control Co-Design optimization of FOWTs with tuned liquid multi-column dampers”, Zenodo [data set], https://doi.org/10.5281/zenodo.10997874, 2024. a
Yu, W., Lemmer, F., Schlipf, D., Cheng, P. W., Visser, B., Links, H., Gupta, N., Dankemann, S., Couñago, B., and Serna, J.: Evaluation of control methods for floating offshore wind turbines, J. Phys. Conf. Ser., 1104, 012033, https://doi.org/10.1088/1742-6596/1104/1/012033, 2018a. a
Yu, W., Müller, K., Lemmer, F., Schlipf, D., Bredmose, H., Borg, M., Landbø, T., and Andersen, H.: LIFES50+ Deliverable D4.2 Public Definition of the Two 10MW Floater Concepts, Tech. rep., University of Stuttgart, https://lifes50plus.eu/wp-content/uploads/2018/04/GA_640741_LIFES50_D4.2.pdf (last access: 8 April 2024), 2018b. a, b, c, d
Yu, W., Lemmer, F., and Cheng, P. W.: Performance of a passive tuned liquid column damper for floating wind turbines, in: Proceedings of the ASME 38th International Conference on Ocean, Offshore and Arctic Engineering, Glasgow, Scotland, UK, 9–14 June 2019, https://doi.org/10.1115/omae2019-96360, 2019. a
Yu, W., Lemmer, F., Schlipf, D., and Cheng, P. W.: Loop shaping based robust control for floating offshore wind turbines, J. Phys. Conf. Ser., 1618, 022066, https://doi.org/10.1088/1742-6596/1618/2/022066, 2020. a, b, c, d, e, f
Yu, W., Lemmer, F., and Cheng, P. W.: Modeling and validation of a tuned liquid multi-column damper stabilized floating offshore wind turbine coupled system, Ocean Eng., 280, 114442, https://doi.org/10.1016/j.oceaneng.2023.114442, 2023. a, b, c
Zhou, S., Li, C., Xiao, Y., Lemmer, F., Yu, W., and Cheng, P. W.: IOWTC2019-7553, in: Proceedings of the ASME 2019 2nd International Offshore Wind Technical Conference, St. Julian’s, Malta, 3–6 November 2019, 10 pp., https://doi.org/10.1115/IOWTC2019-7553, 2019. a, b, c
Zhou, S., Müller, K., Li, C., Xiao, Y., and Cheng, P. W.: Global sensitivity study on the semisubmersible substructure of a floating wind turbine: Manufacturing cost, structural properties and hydrodynamics, Ocean Eng., 221, 108585, https://doi.org/10.1016/j.oceaneng.2021.108585, 2021. a, b
- Abstract
- Introduction
- Impact of the TLMCD and the controller
- Optimization framework
- Optimization results
- Dynamic responses of the optimal designs
- Conclusions
- Code availability
- Data availability
- Author contributions
- Competing interests
- Disclaimer
- Acknowledgements
- Financial support
- Review statement
- References