the Creative Commons Attribution 4.0 License.
the Creative Commons Attribution 4.0 License.
 | 18 Jan 2024
Sensitivity of cross-sectional compliance to manufacturing tolerances for wind turbine blades
Vincent K. Maes
Terence Macquart
Paul M. Weaver
Alberto Pirrera
Wind turbine blades are complex structures and, despite advancements in analysis techniques, differences persist between predictions of their elastic response and experimental results. This undermines confidence in the ability to reliably design and certify novel blade designs that include self-regulating features like bend–twist coupling. To address these discrepancies, this study investigates the influence of manufacturing tolerances on the compliance properties of blade cross-sections, focusing specifically on a previously disregarded feature: the trailing edge bondline. To conduct this investigation, the validated cross-sectional modelling tools BECAS and VABS are used to demonstrate that even small geometric variations can have significant influence on cross-sectional stiffness properties. The results are further examined and substantiated through the utilisation of 3D finite element models, adopting both shell and solid elements. We reaffirm that an accurate geometric representation of the cross-section is necessary to adequately capture the shear flow within it and assure accurate predictions on cross-sectional stiffness properties, providing updated guidelines for designers in industry.
- Article
(3165 KB) - Full-text XML
- BibTeX
- EndNote


Over the past few decades, with an ever-increasing focus on climate change, the wind energy industry has seen growth in both cumulative installed power and the size of individual wind turbines (McKenna et al., 2016). The increasing length of blades exacerbates key load cases, such as gust and fatigue loads, with cascading implications. Higher loads indeed result in increased root bending moments, which are transmitted to the nacelle, necessitating heavier and more costly designs for the generator and tower components of the wind turbine. To address this issue, the literature explores load alleviation strategies, both in passive and active form, as summarised by McKenna et al. (2016).
Specifically, bend–twist coupling (BTC) has been explored by several authors – among other passive adaptive solutions (Ponta et al., 2014) – as a means of reducing the impact of peak (i.e. gust) and cyclical (i.e. fatigue) loads, thereby mitigating loads on other turbine components and structures (Bottasso et al., 2013; Vesel and McNamara, 2014; Gözcü and Kayran, 2014; Şener et al., 2017; Bagherpour et al., 2018; Manolas et al., 2018). As the name suggests, this aeroelastic tailoring principle operates through the elastic coupling of torsional and flapwise bending motions of the blade (i.e. a pure torsional load produces bending deflections, and a pure bending load produces twist), and achieves the goal of load alleviation most commonly by coupling flapwise deflection with twist towards feather. This twist causes a reduction of the aerodynamic loads, establishing in a self-regulating system.
Previous optimisation studies have investigated the benefits of BTC (Bottasso et al., 2013; Capuzzi et al., 2014, 2015; Scott et al., 2016, 2017; Bagherpour et al., 2018; Chen et al., 2019; Wiens et al., 2020; Serafeim et al., 2022). Three distinct approaches to achieve BTC have been examined: geometric coupling, material coupling and combined coupling. In this work the focus is on the application of material coupling, as enabled by composite materials, which, in addition to their excellent specific (i.e. per unit mass) properties, offer significant stiffness tailoring capabilities due to their anisotropy. With the stiffness in the fibre direction being generally many times greater than in the other directions, composite plies can be used to effectively induce a wide range of structural couplings. However, integration of non-standard angle plies within a structure raises many questions concerning manufacturability, as well as the strength properties at the laminate and blade scale. This is because material allowables are usually acquired through costly test campaigns, which is why there is not much data for non-conventional angles.
While the benefits of material BTC have been well documented, its commercial uptake remains limited, prompting the question of why it has not seen widespread adoption. Currently, only two publicly documented examples of structures using BTC exist: the Grumman X-29 (Greenhalgh et al., 1993; Pamadi, 2015) and the Westland BERP IV helicopter blade (Harrison et al., 2008; Moffatt and Griffiths, 2009). Both of these aerospace structures demonstrate the capabilities of BTC; however, publicly available documentation on their operating performance is scarce. Industrial hesitation can be attributed to various uncertainties around the strength performance as well as concerns around potential for thermally induced stresses and distortions. In addition, the limited industrial uptake of BTC may also be attributed to uncertainties surrounding the quantification of the stiffness of structures comprising coupled laminates. Focusing specifically on the wind energy field, while some studies have carried out experimental tests on the elastic performance of BTC blades, the results have been inconsistent. Significant discrepancies in predicted cross-sectional stiffness properties from different modelling and analysis schemes raise questions regarding the validity of the methods available (Chen et al., 2010; Saravia et al., 2017; Lekou et al., 2015). It is important to note that this issue extends beyond BTC blades and may be attributed to inconsistencies in the pre-processing steps preceding numerical analysis (Lekou et al., 2015). This work aims to address the previously observed discrepancies in cross-sectional properties between different models by investigating the sensitivity of numerical models for stiffness prediction to generally overlooked, detailed cross-sectional features.
A study by Lekou et al. (2015) revealed significant variations in numerically predicted stiffness performance metrics when the same blade description was provided to six different design and research teams. The authors of the study point out that many of the methods employed by the teams had been cross-validated for simpler geometries. This suggests that, as designs become more intricate, individual interpretation and handling of modelling inputs can lead to discrepancies. However, these discrepancies only become critical or even discernible if the structure's performance is sensitive to them. A BTC blade with high bending stiffness, for instance, will by its own nature not deflect much under loads and therefore experience minimal changes in torsional deflections, and hence performance, even if it is a few percent stiffer or more compliant than originally designed. Conversely, for a BTC blade with greater bending compliance, a slight variation in bending deflections can result in significant differences in torsional deflections and aeroelastic performance. For similar reasons, inaccuracies in torsional or bend–twist coupling stiffnesses have historically been uninfluential and have only emerged as a problem with the increase in rotors diameter and blade slenderness.
From previous work it is known that BTC is driven by the development of shear flow, and, as studied experimentally by (Lemanski, 2004), the resultant twisting behaviour can be heavily influenced by any changes in said stress distribution. Lemanski and Weaver (2005) showed the importance of the shear flow continuity between flanges and webs and the influence of the restraint put on the flange's deformation by the presence of the webs. Their work clearly demonstrated the improvement in prediction of the coupling stiffness terms obtained by accounting for these two effects. Their work was extended by Canale et al. (2018) by calculating the bending and torsional stiffnesses of box sections using the same considerations. Again, a significant improvement in agreement with finite element method results was demonstrated as a result of including the shear flow continuity and constraint effects of the webs on the deformation of the flanges. In light of this, shear flow behaviour in the scenarios studied will be considered in this work.
The main goal, however, is the further understanding of proper cross-sectional modelling guidelines to allow consistent predictions, to enable further uptake of BTC in industry. This is achieved by evaluating the influence of different geometrical variations on the stiffness properties of blade designs incorporating BTC using a set of representative wind turbine cross-sections, which are run through a sensitivity analysis, employing BECAS and VABS. The results in this paper include the variability of four compliance terms of key interest in this work for their relation to BTC: the bending compliance, the bend–twist coupling compliance, the torsional compliance and the shear compliance. These are the four compliance terms that drive the bend–twist coupling behaviour of a blade. However, the analysis performed does provide the full stiffness/compliance matrices, and hence readers seeking data on the remaining terms may refer to Maes (2021).
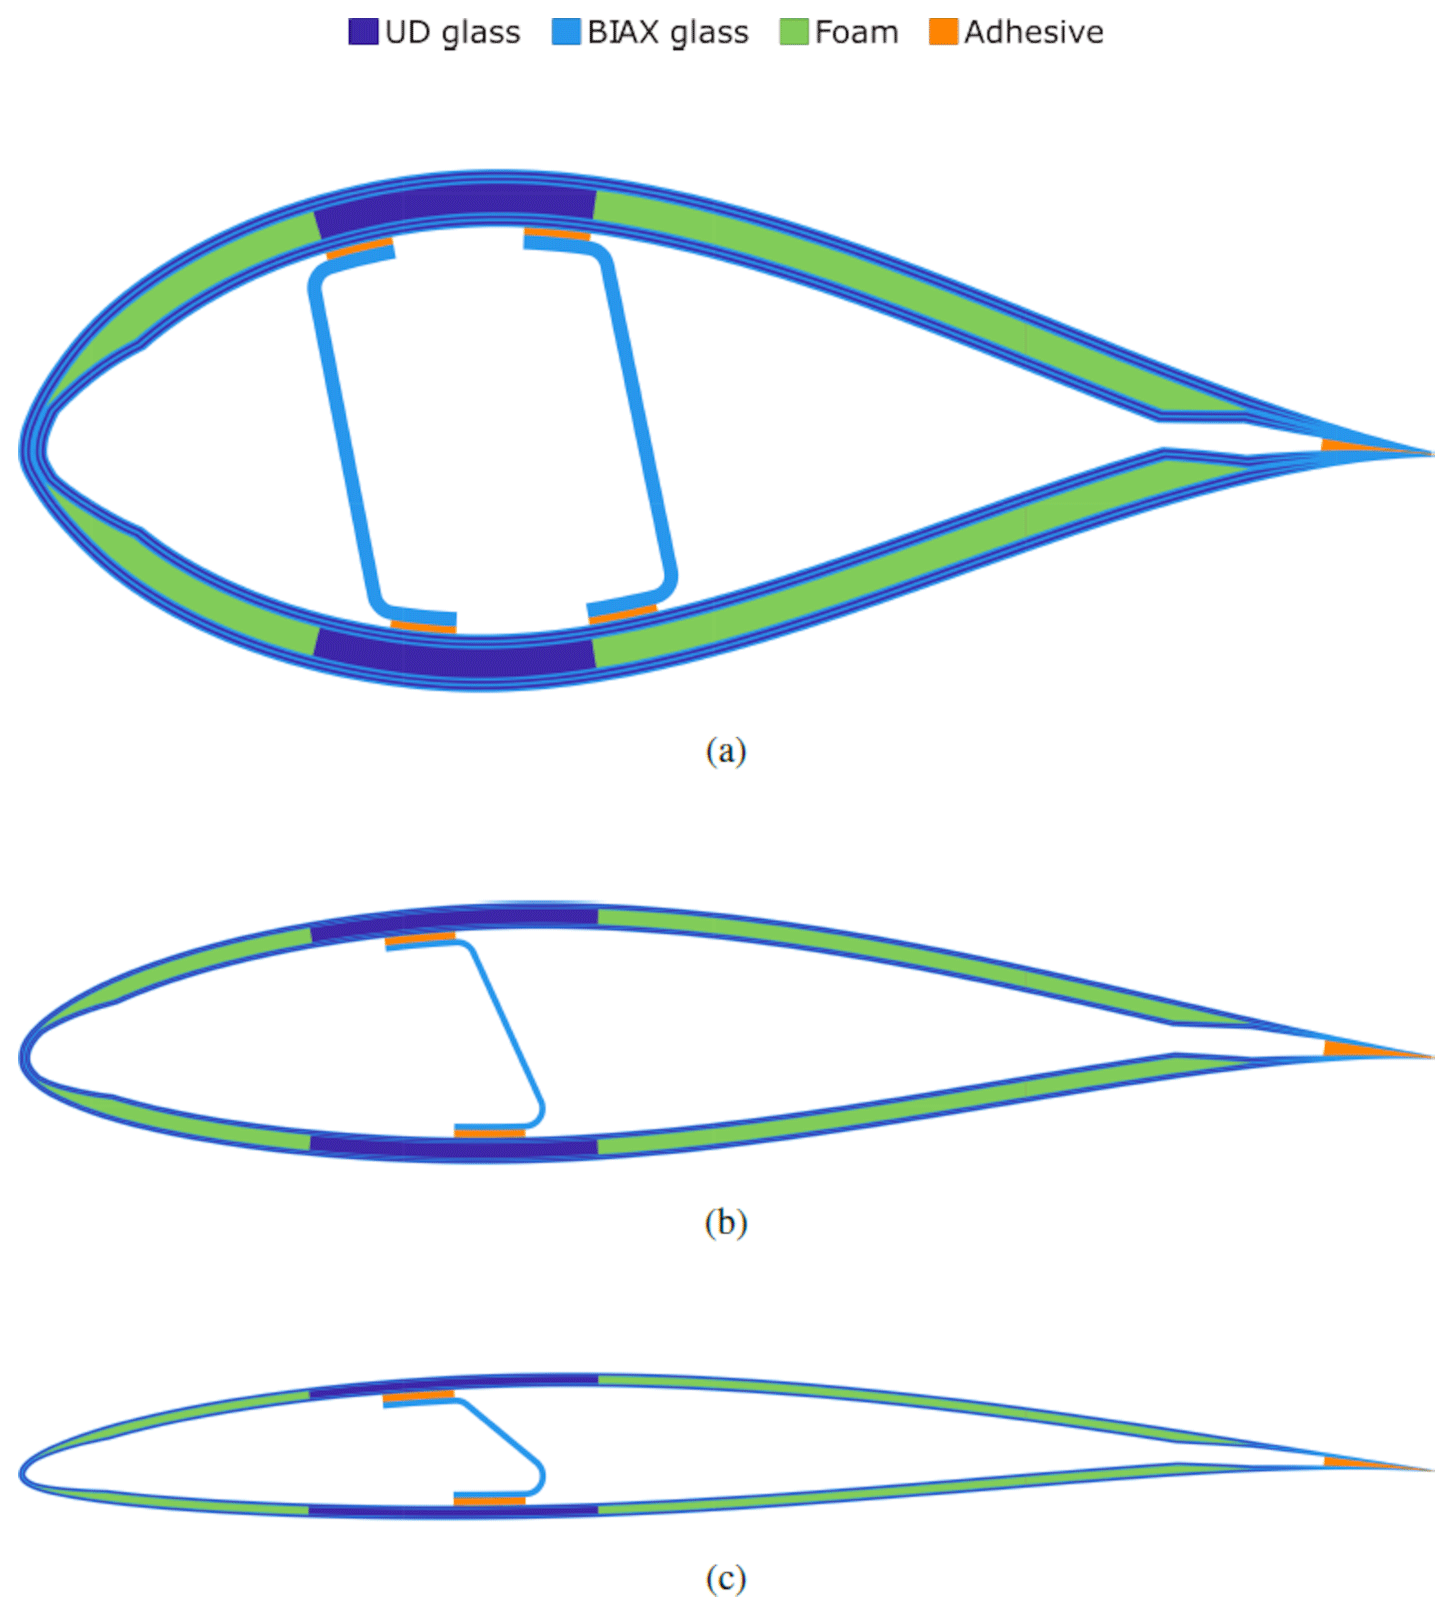
Figure 1Cross-sections of the base sections, including (a) a thick section representing a section close to the root and using NACA-63436, (b) a mid-section representative of a section along the blade using NACA-63418, and (c) a thin section representing a section close to the tip using NACA-63410. Each section shows material distribution, as generated by BECAS. In the legend, UD stands for uni-directional material and BIAX for bi-axial material.
To investigate the influence of manufacturing tolerances on stiffness properties, three cross-sections were generated. These cross-sections were designed to be representative of industrial blades in a general sense, without replicating any particular design, using a combination of unidirectional glass fibre epoxy (UD), bi-axial glass fibre epoxy (BIAX), structural foam and epoxy adhesive materials. Exact manufacturing tolerances are of course process dependent, and the designs and tolerances in this study are based on the most commonly adopted blade architecture, where suction-side and pressure-side sandwich skins form the aerodynamic shape of the structure and are bonded together encasing one or more internal webs. Other manufacturing processes will lead to different tolerances and would require separate analyses.
2.1 Geometry
The cross-sections under investigation are shown in Fig. 1, representing three stations along the length of a typical blade, with different thickness-to-chord ratios and relative material distributions.
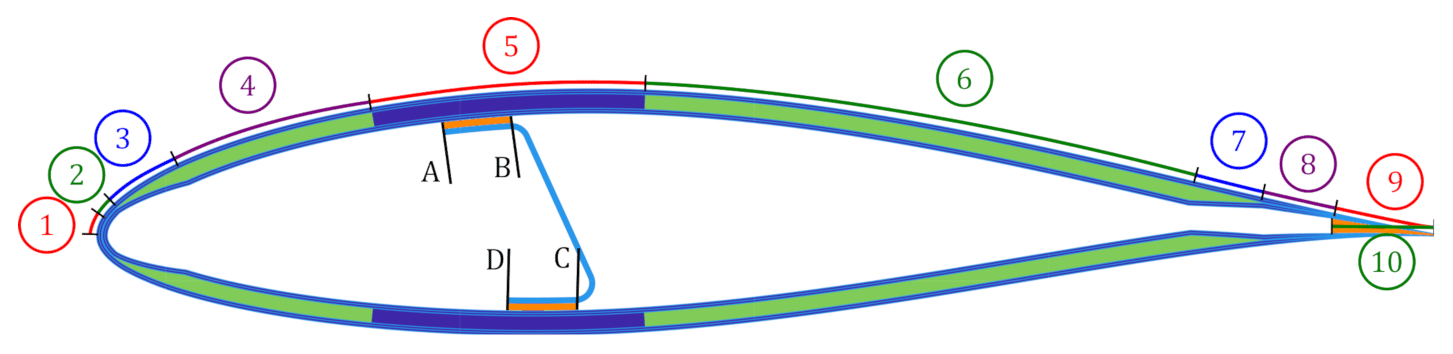
Figure 2Mid-cross-section indicating regions of blade, including contact points for webs, which are identically located along the chordwise direction for both top and bottom surface.
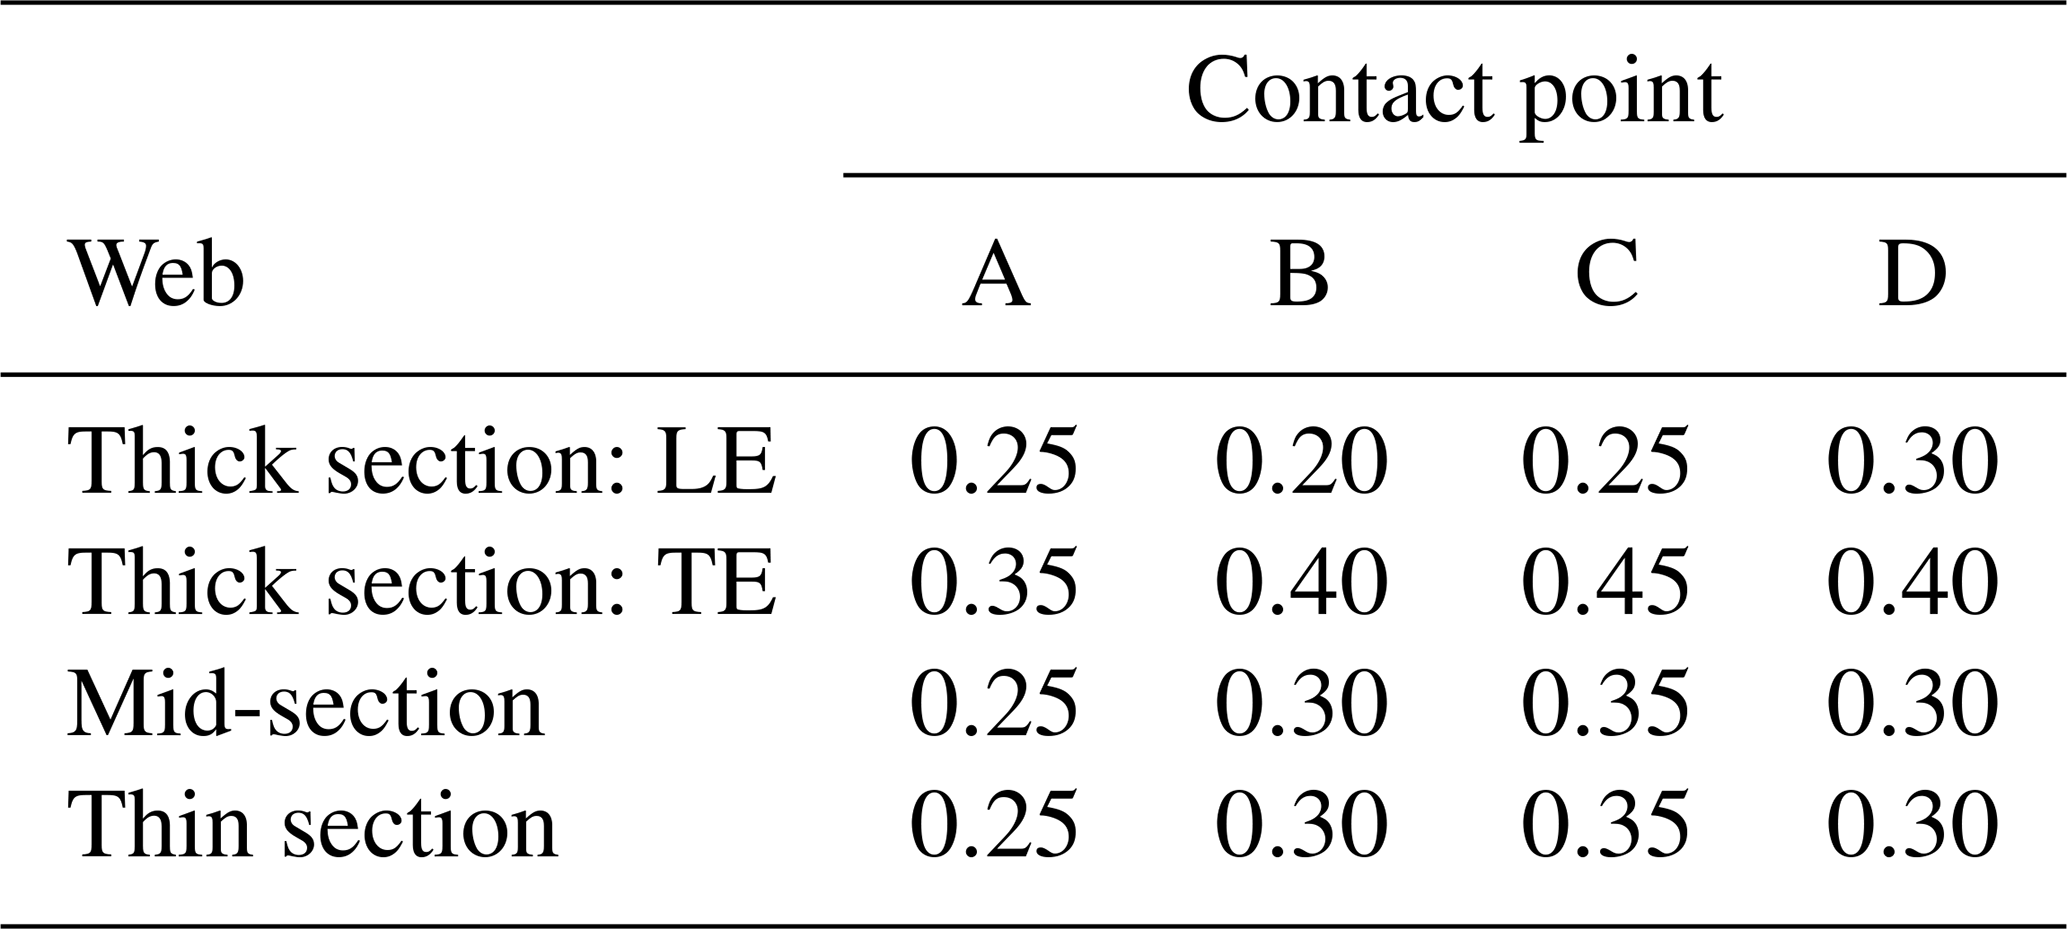
They are segmented into regions to which material properties are assigned, as illustrated in Fig. 2. The segmentation allows for parameterisation of the cross-section by defining the chordwise locations of the boundaries of each region. The baseline values for these boundary locations are provided in Table 1. Additionally, the corner radii (0.01 in all cases) and the locations of the web's contact points, as indicated in Table 2, are taken into account to complete the definition of each geometry.
Table 1Bounds for regions in Fig. 2, which are identical for all cross-sections. All dimensions relative to chord length, which is zeroed at leading edge (LE). The trailing edge (TE) is trimmed at 0.975 of chord length.
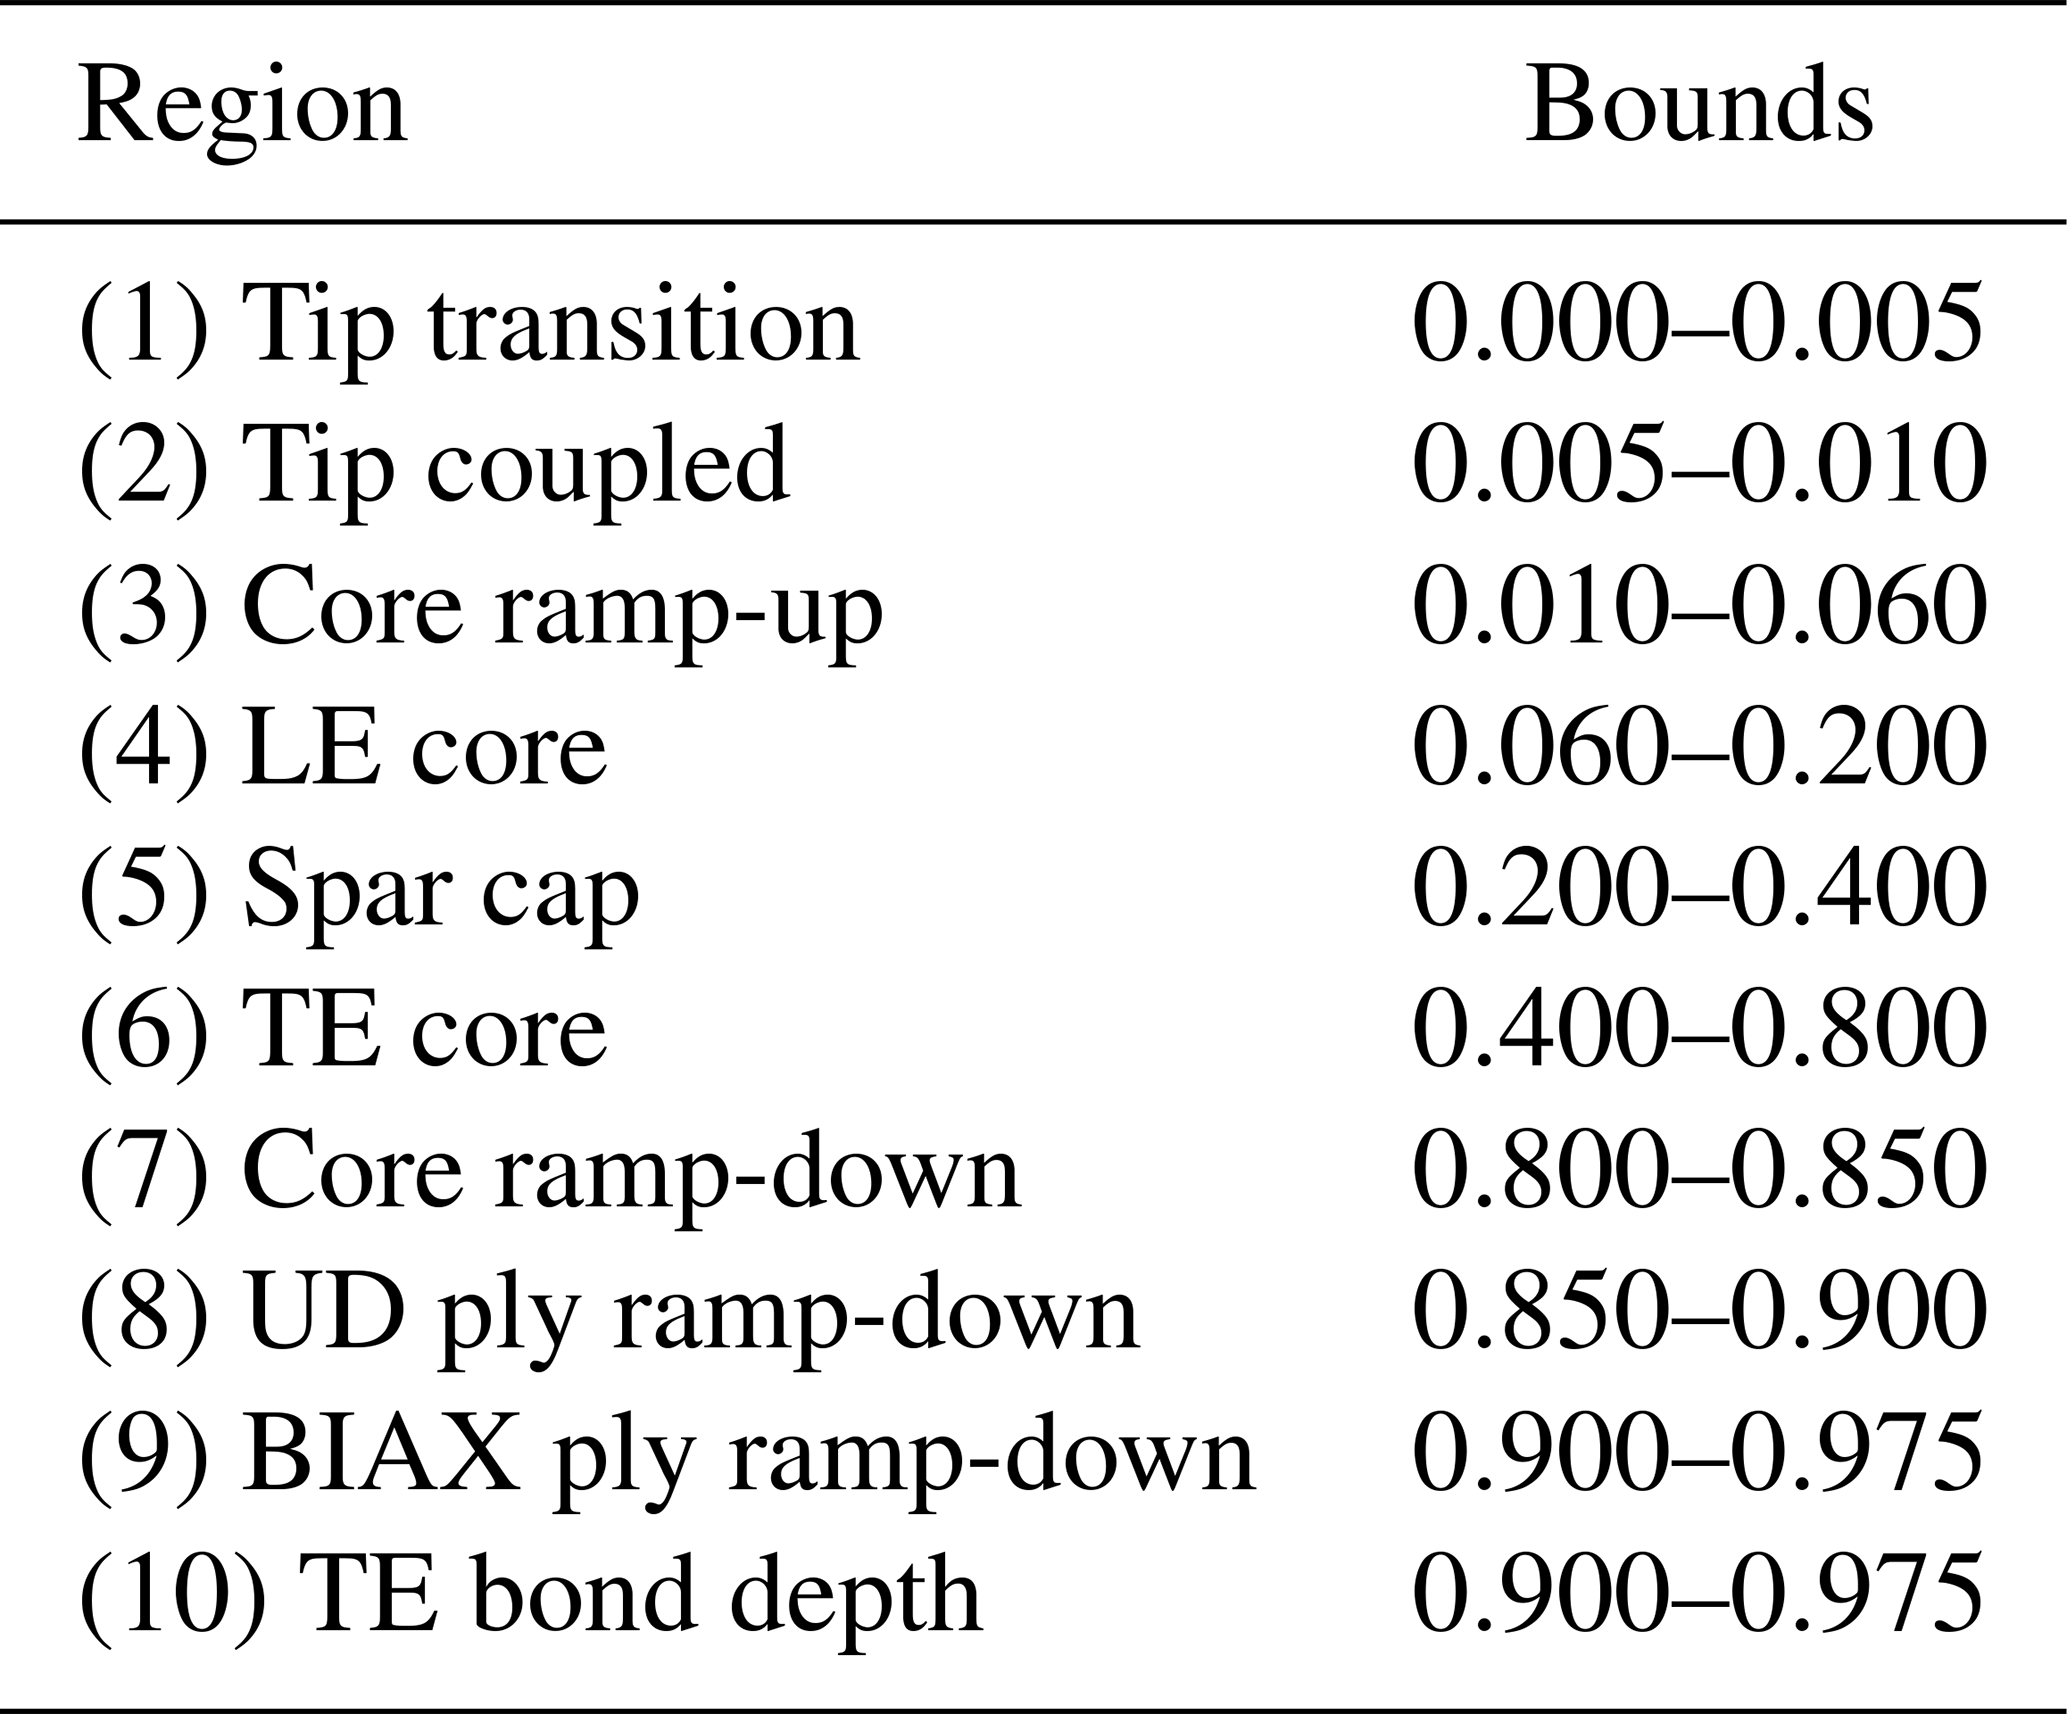
Table 2Chordwise location of contact points for webs in base configurations. Order is always (A) top surface start of web flange, (B) top surface contact point of web, (C) bottom surface contact point of web, and (D) bottom surface end of web flange.
The geometries studied here are not actually existing designs but are inspired by some older blade designs. While it is expected that similar trends are likely to be observed in other designs, the exact values will be case specific. Two significant differences that the studied designs may have to other popular designs include (a) the number of blades, where modern large blades will often have 2–3 webs running most, if not all, of the length of the blade, and (b) the manner in which webs are integrated into the spar caps. The studied designs represent a case where webs are separately manufactured and then bonded in, while some manufacturers may use an integral approach where the webs are directly co-cured into/onto the outer shell. Such variations experience both different levels of sensitivity and manufacturing tolerances to consider.
For the airfoil shapes, publicly available NACA profiles were used as indicated in Fig. 1 for each section. All dimensional inputs, including the cured ply thickness, are described relative to the chord length, which for the purpose of the results presented is 1 m. The analyses used do not account for any scale-dependent non-linear effects. This means that, as long as dimensions are kept proportional, the properties simply scale as a function of the chord length. Hence, the changes/sensitivities documented herein are not affected by the choice of chord length, as long as the other dimensions are scaled proportionally. For this reason, all dimensions in the x axis of the plots in this paper have an asterisk added to them to remind the reader that these changes are actually relative (i.e. can be read as percentage changes).
While in this study a clear position of the trailing edge bondline is given in the descriptions of the designs, this is rather unique. As many studies use shell elements, the trailing edge bondline is often not modelled at all. For example, the study by Branner et al. (2007), which looked specifically at the efficacy of shell element models vs. shell-solid hybrid models, does not include a trailing edge (TE) bondline. In general, top and bottom surfaces are either simply put into contact (Chen et al., 2010), connected at a single point (Branner et al., 2007), or cut off in a flatback style configuration (Lekou et al., 2015). The extensive study evaluating different structural analysis tools across multiple research groups by Lekou et al. (2015) based its cross-sectional definitions on aerodynamic profiles and key points to indicate material distribution similar to the one used here, but it left both the full geometry of the webs and the TE bondlines ambiguous. These observations motivate the choice in variations investigated in this work.
2.2 Material properties and lay-ups
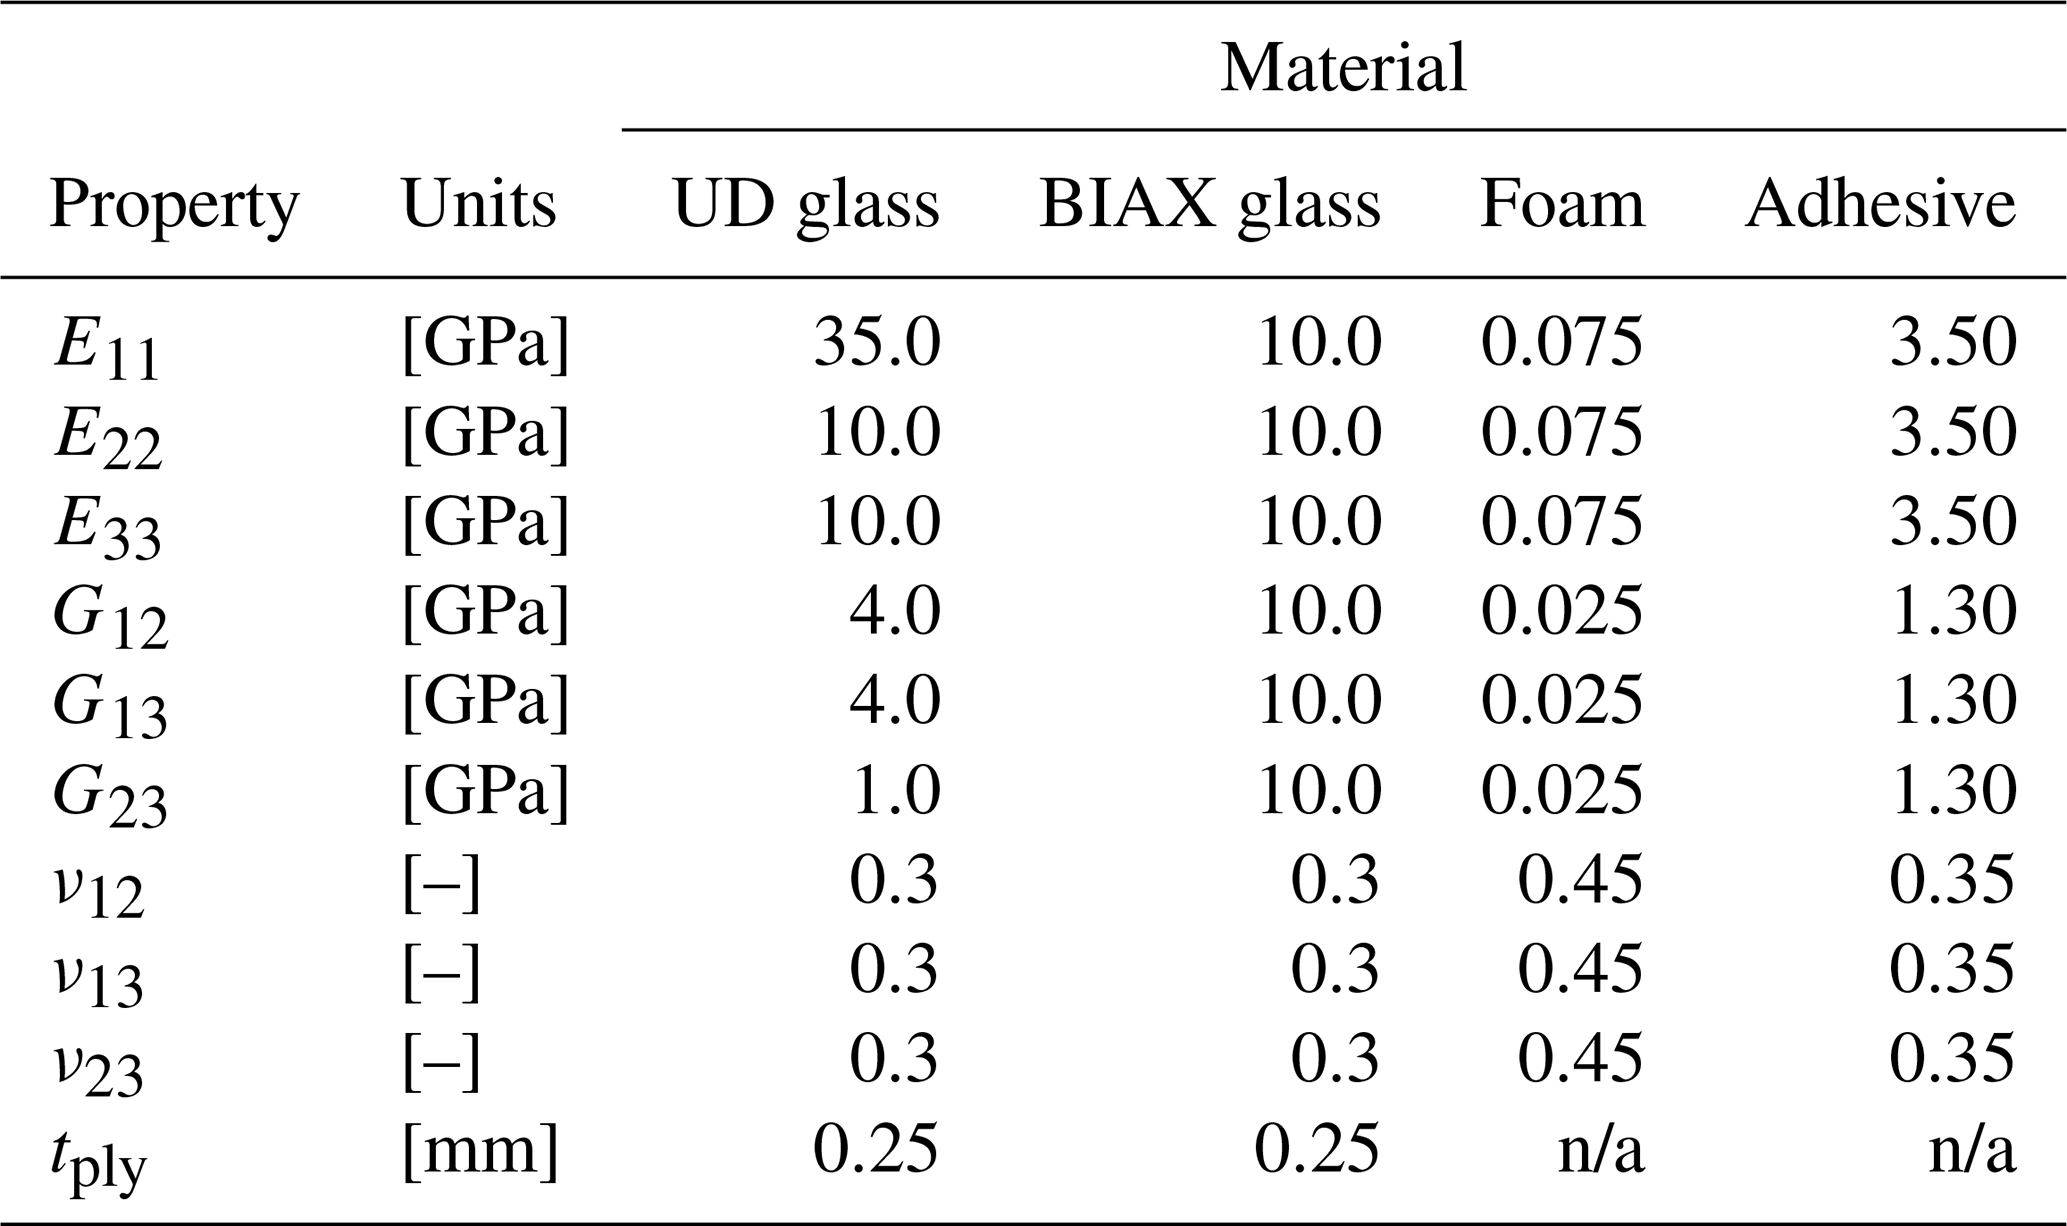
For material properties, the values listed in Table 3 were used. These values do not belong to any specific material but are representative of the properties of materials used in industry. Due to IP restrictions imposed by our sponsors it is not possible to use the exact properties or share the material system names.
Table 3Elastic properties for materials used for the numerical study, including uni-directional (UD) material, bi-axial (BIAX) material (± 45), foam care material, and adhesive material used for bondlines. n/a stands for not applicable.
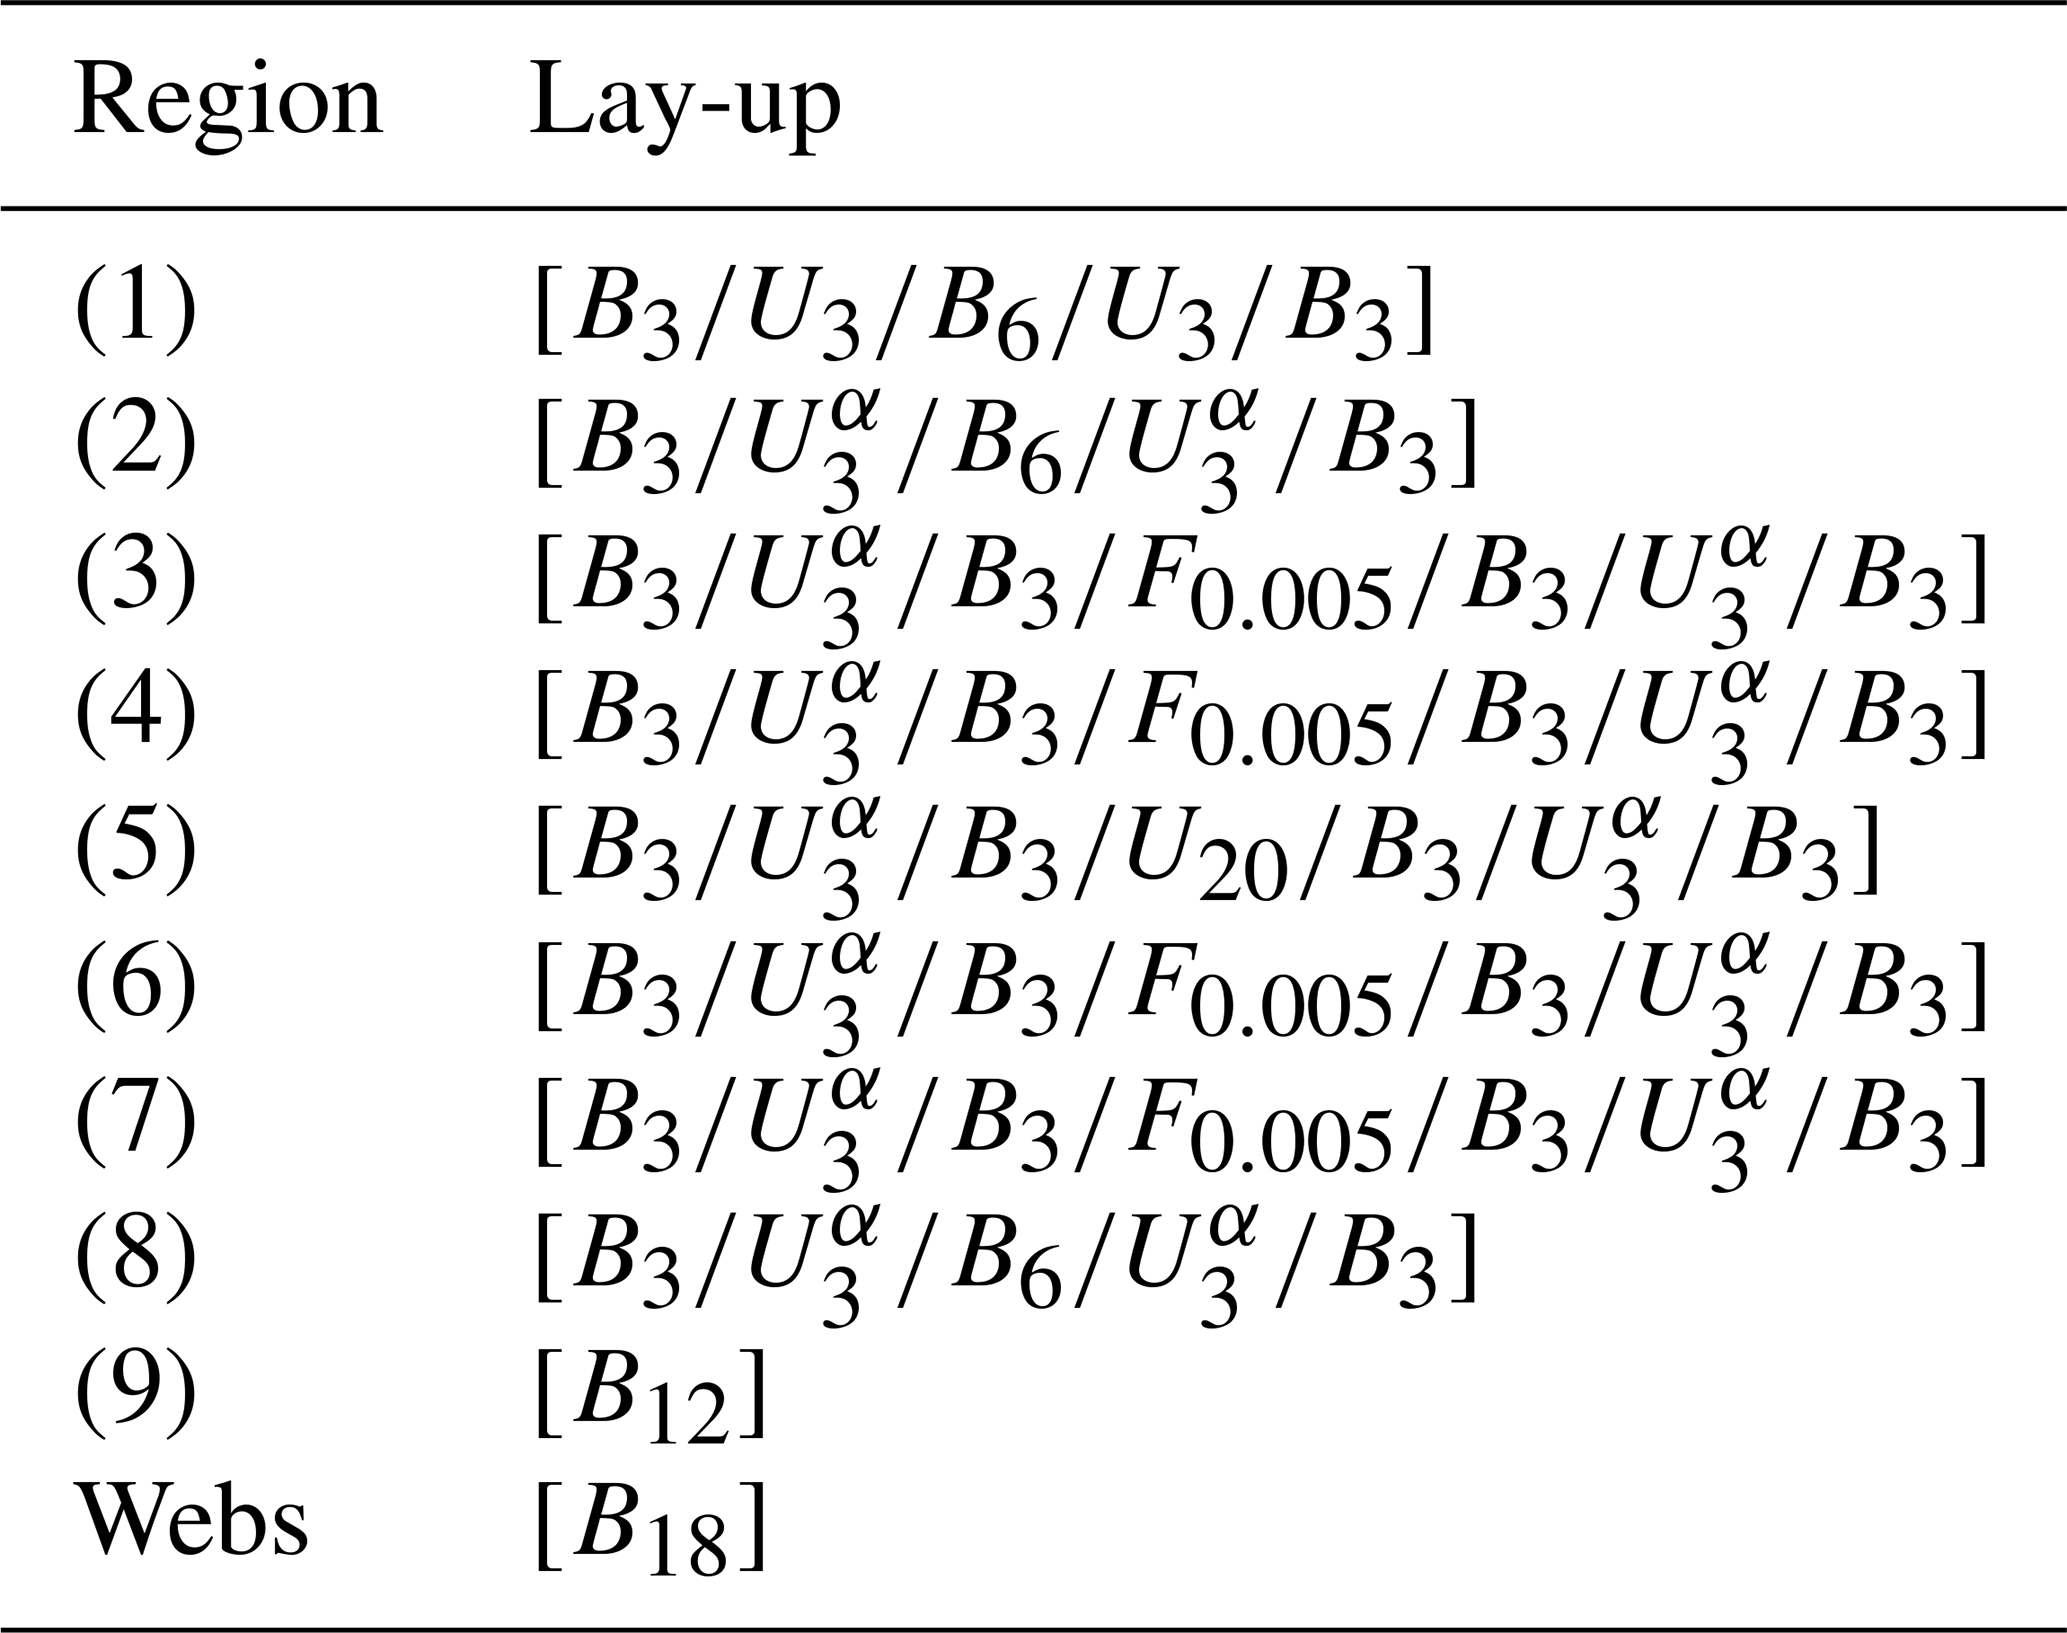
BTC is designed into the mid-section and thin-section models – Fig. 1b and c, respectively – by introducing UD plies within the skins (zones 4–6 in Fig. 2) that are at an angle to the beam axis (the out of the page direction). The full lay-ups for each of the regions in the three cross-sections are provided in Tables 4–6. The web bondline thickness is 0.005 for all locations and cross-sections. It should be noted that in regions 3 and 7, the foam core thickness is being ramped from (or to) zero and so has a linearly varying thickness in those regions. In region 8 and 9, the UD and BIAX plies are similarly tapered in their thickness. For the UD plies in region 8, this is done to ensure a smooth reduction in thickness, while for the BIAX plies in region 9, it is done to ensure no material overlap at the TE of the blade. The UD plies are tapered to zero, while the BIAX plies are tapered to one-eighth of their full ply thickness.
Table 4Lay-ups for the thick section. For materials a shorthand is used; U = UD at 0∘, Uα = UD at 20∘, B = BIAX, with subscript indicating repeated plies, and FX = FOAM of thickness-to-chord ratio X.
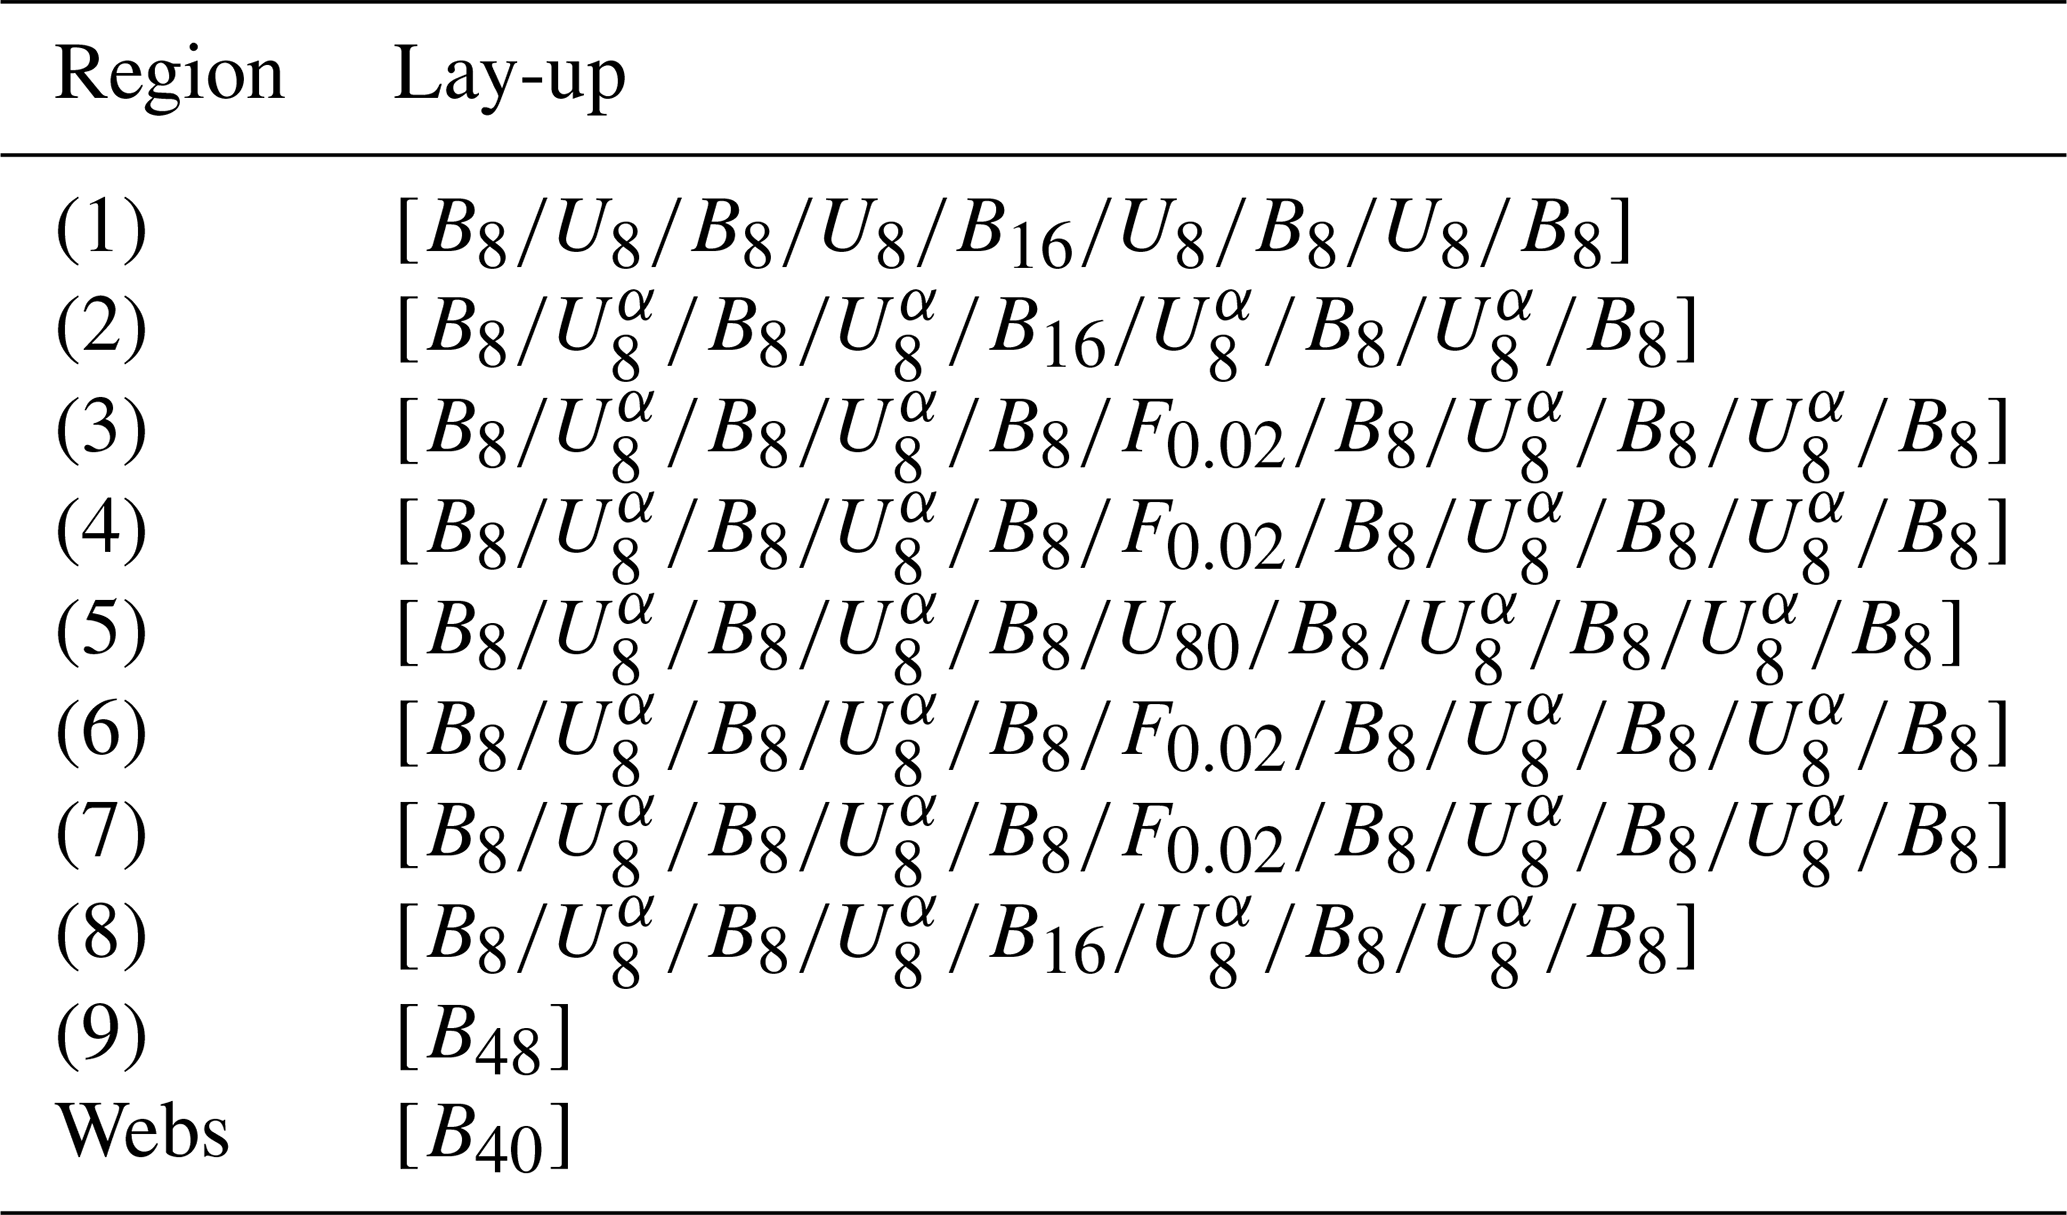
Table 5Lay-ups for mid-section. For materials a shorthand is used; U = UD at 0∘, Uα = UD at 20∘, B = BIAX with subscript indicating repeated plies, and FX = FOAM of thickness-to-chord ratio X.
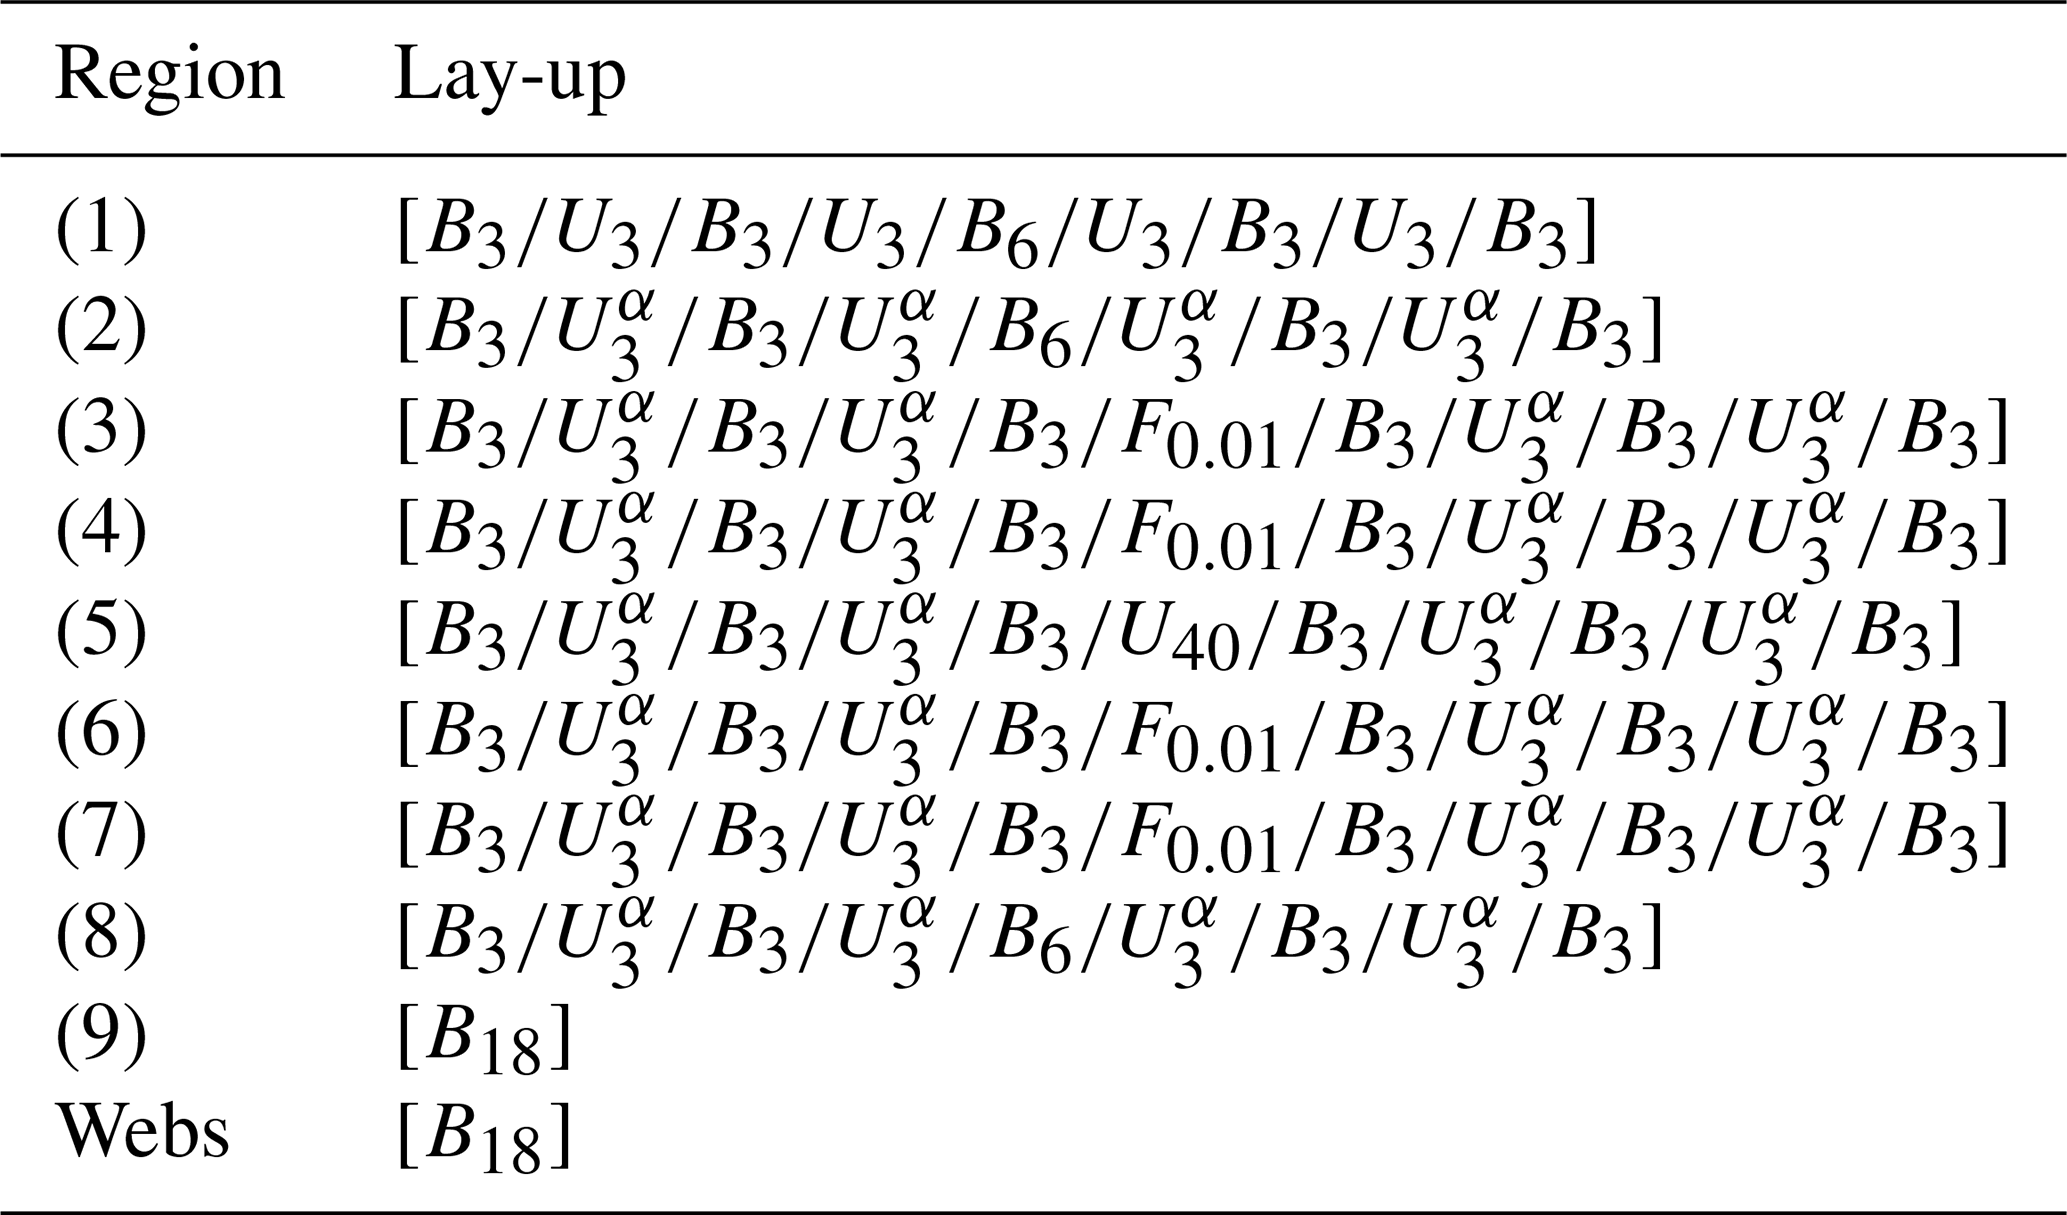
Table 6Lay-ups for thin section. For materials a shorthand is used; U = UD at 0∘, Uα = UD at 20∘, B = BIAX with subscript indicating repeated plies, and FX = FOAM of thickness-to-chord ratio X.
To analyse the proposed cross-sections and evaluate the sensitivities of cross-sectional parameters to variations in geometry, the cross-sectional modellers BECAS (Blasques and Bitsche, 2014) and VABS (Hodges, 2006; Yu et al., 2012) are used, as they are both well-established, widely adopted tools. A parameterised script written in MATLAB is used to generate the input files for both tools, submit the analysis, and extract the cross-sectional stiffness properties. The cross-sectional stiffness matrices are inverted to obtain the cross-sectional compliance properties as it is deemed more intuitive to assess changes in compliance as opposed to changes in stiffness. Especially due to the presence of coupling, it is easier to think of how pure bending load produces a certain amount of bending and twisting deflection (the compliance view) instead of how pure bending deflection would induce a mixture of bending and twisting reaction loads (the stiffness view). For the results presented, the inversions tell us that if stiffness terms are used, opposite trends would be observed (i.e. if compliance correlates positively with a variation, stiffness would correlate negatively).
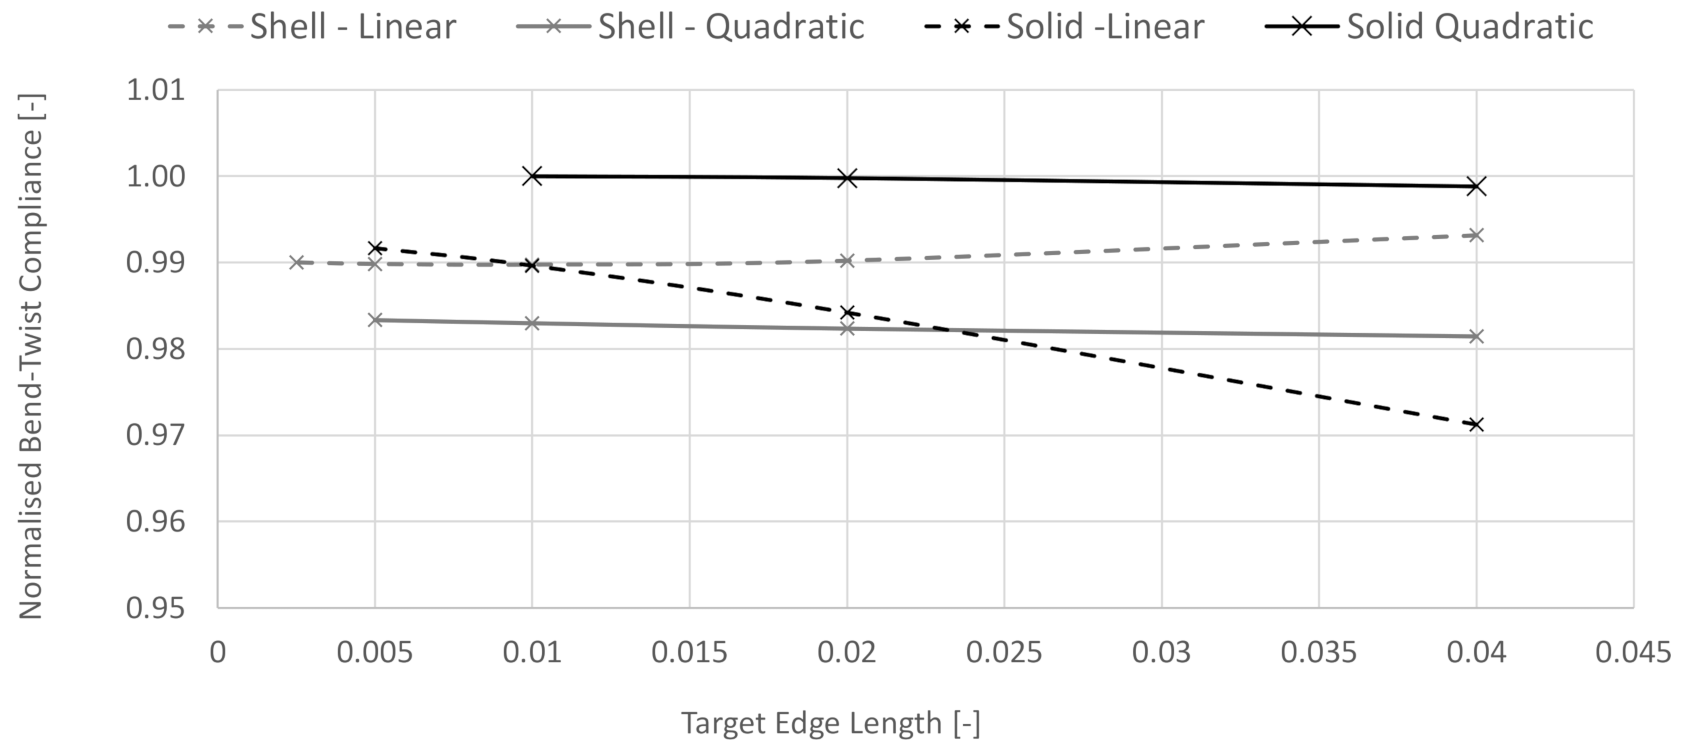
Figure 3Convergence behaviour of the normalised bend–twist compliance term, S46, for the different 3D models run in ABAQUS for the benchmark.
To benchmark the cross-sectional analysers, BECAS and VABS, the mid-section reference geometry, i.e. the baseline configuration used as a reference in the sensitivity studies, was analysed using four different additional modelling approaches. These approaches include 3D finite element method (FEM) models in ABAQUS utilising linear shell elements (S4R), quadratic shell elements (S8R), linear solid elements (C3D8R), and quadratic solid elements (C3D20R). The shell models used conventional shell definitions, and the solid models used solid element definitions with two elements through the thickness of the full stack (i.e. one element on either side of the core). The final converged meshes used an average edge length of 0.005 for the linear element models and 0.01 for the quadratic element models (see Fig. 3 for convergence behaviour). For the 2D cross-sectional analysis a target edge length of 0.01 was used with a single element per material layer.
A single script was used to generate all the required geometries for the 2D cross-section, 3D shell, and 3D solid models, including the segmentation for assigning material properties. The 2D cross-section geometry was then used directly to generate BECAS and VABS models, while the 3D shell and 3D solid geometries were imported into ABAQUS to complete the model description. This approach ensured consistency in the geometries among the different solvers, minimising discrepancies that could arise from separate geometry generation.
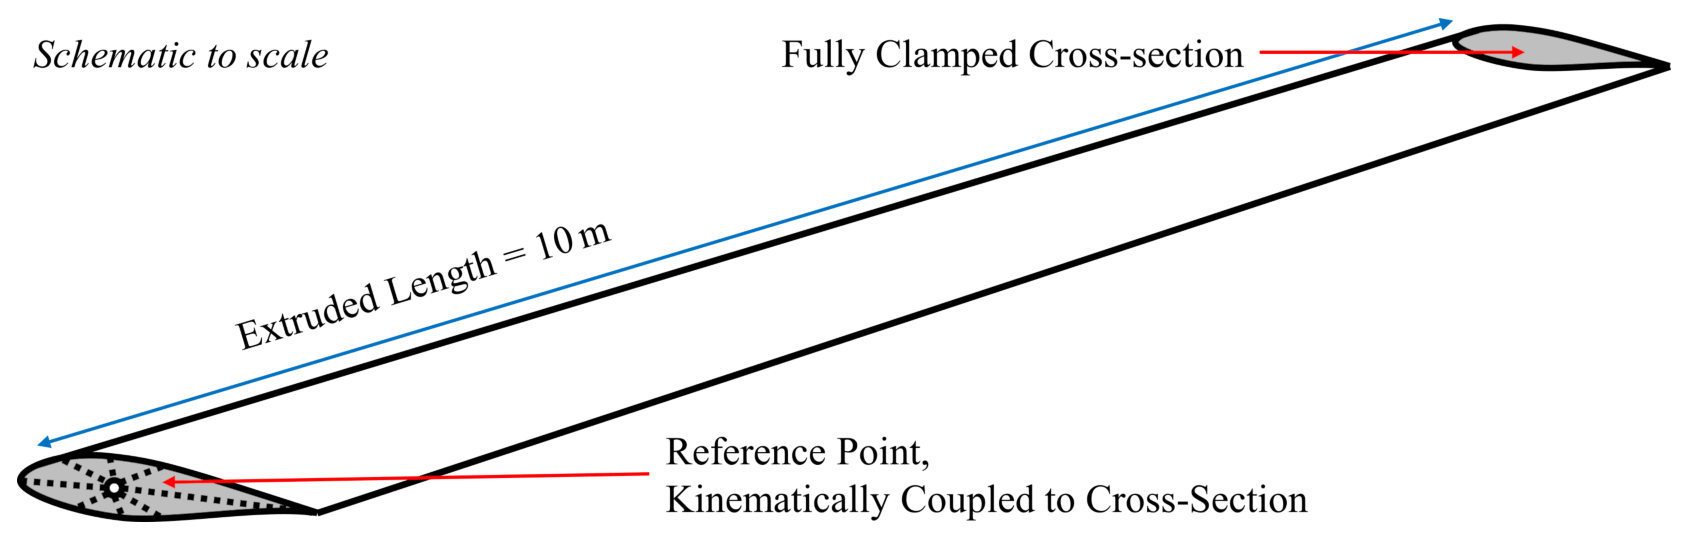
The ABAQUS models were analysed using clamped boundary conditions on one end of the beam and a kinematic coupling constraint on the other end, which tied the entire tip cross-section to a single reference point on the beam axis (see Fig. 4). The analysis consisted of six linear perturbation steps, where for each step a different load component was set to a unit value (i.e. step 1 had a unit load applied in the x direction, step 2 had a unit load applied in the y direction, etc.) so that in total each force and moment component is applied in one step. The linear perturbation step does not update the base state, allowing the unit load cases to be run in sequence with each step loading from the unloaded state in a different load vector.
To extract cross-sectional properties from the 3D ABAQUS models, the 3D solution needs to be mapped onto a 1D beam model, based on either Euler–Bernoulli beam theory or Timoshenko beam theory equations. The equations used in this work, provided next, are similar to those previously derived by other authors in the literature (Hill and Weaver, 2004; Malcolm and Laird, 2007) and use Timoshenko beam theory due the lower shear stiffness of composite materials, making capturing the shear effects explicitly relevant to the results. In order to back calculate the beam model properties, one starts with the basic 6×6 Timoshenko compliance matrix for a beam with 6 degrees of freedom – including two shear strains (γ13 and γ23), one extensional strain (ϵ33), two bending curvatures (κ1 and κ2), and one twist curvature () – and the complementary sectional loads, including two shear loads (f1 and f2), one extensional load (f3), two bending moments (m1 and m2), and one torsional moment (m3).
The cross-sectional deformation gradients and cross-sectional loads are related through the compliance matrix, [S], as
For a beam of length L, deforming linearly under tip loads, the linearised equations for deflections and rotations as a function of the position, z, along the beam as integrals of the cross-sectional deformation gradients above are
and the sectional loads – also known as internal loads – along the beam length can be shown, on the basis of statics, to be
where F1, F2, F3, M1, M2, and M3 are the tip shear forces, tip extension force, tip bending moments, and tip torsion moment, respectively.
In the simplest case, assuming constant properties and clamped boundary conditions at z=0, the relationship between deflections and loads at the tip can be derived through integration yielding a beam level compliance matrix, [C], such that
where the respective beam compliance coefficients can be linked to the cross-sectional compliance coefficients through a matrix [L], which contains polynomials of the length of the beam obtained through the integration step, such that
where [S]v and [C]v refer to the vectorised versions of the cross-sectional and beam level compliance matrices, respectively. To determine the beam level compliance matrix six simulations are run, with each applying only one of the six individual tip load cases. The resulting tip deflections can then be grouped and used to compute [C] using
If the simulations are run using tip loads of magnitudes of one, this relation simplifies down to
In combination with Eq. (5) it is possible to calculate the cross-sectional compliance terms from the deflections either along the beam or at the tip using
4.1 Benchmarking
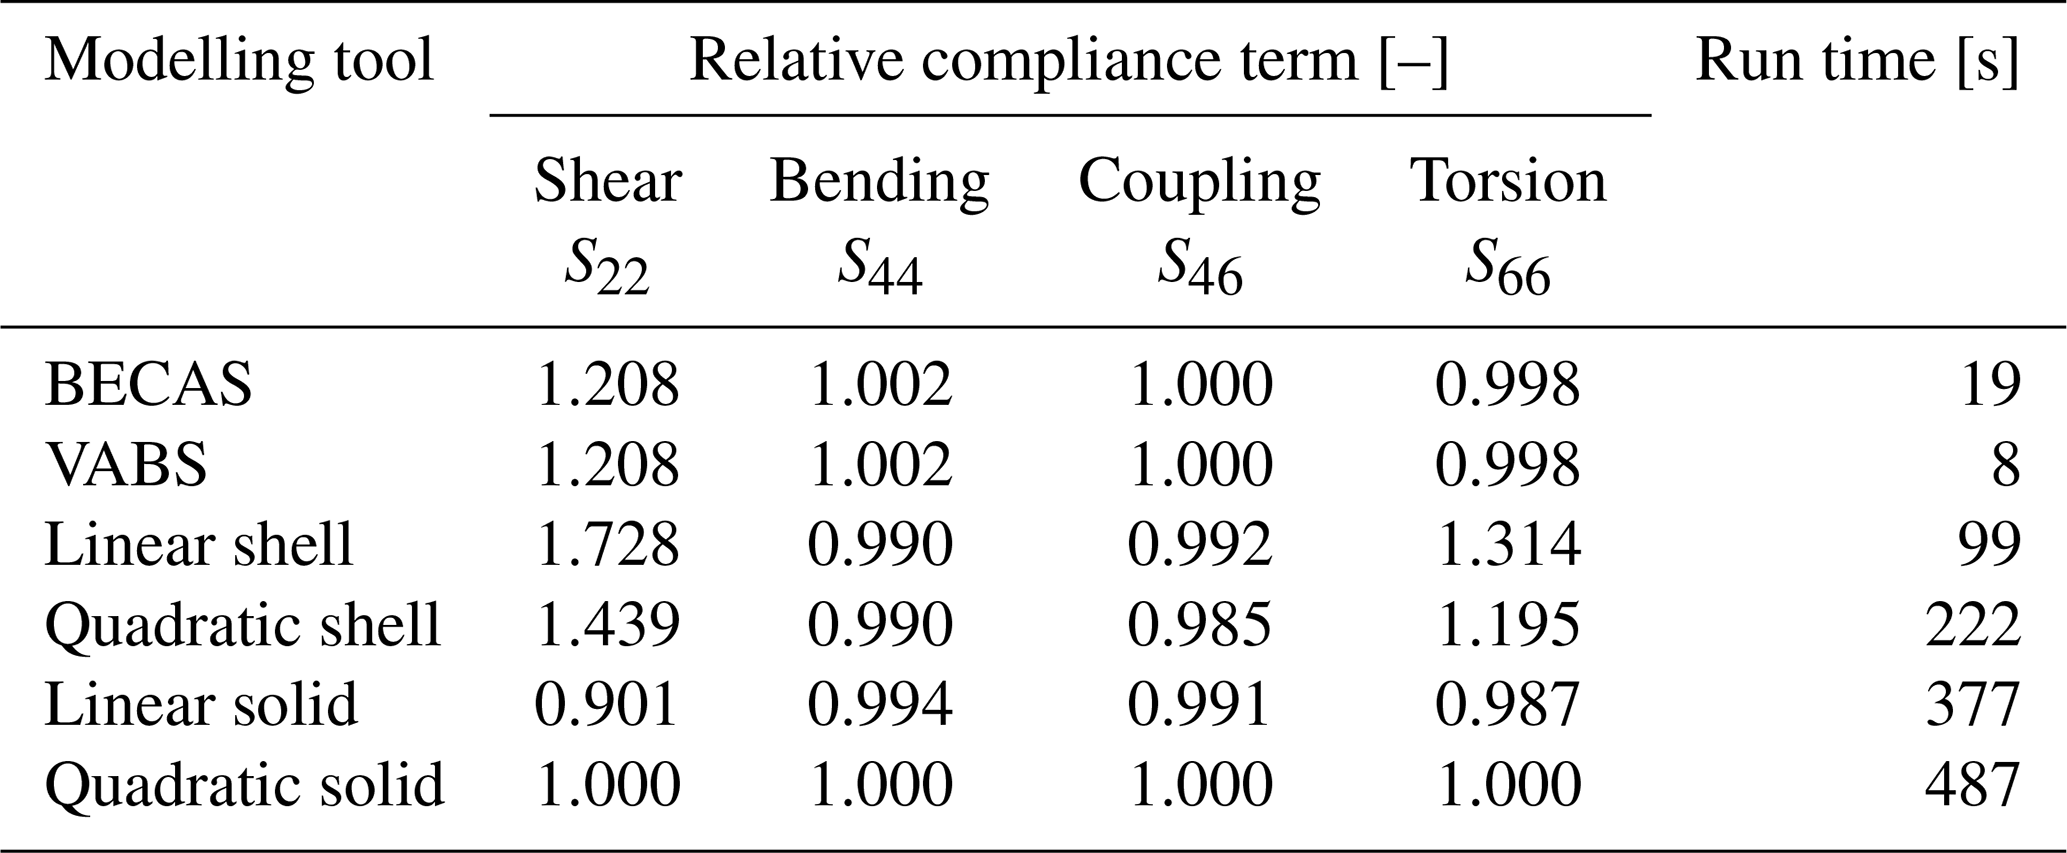
The comparison of the converged results from all tools for the baseline case, along with the run times for each analysis, is presented in Table 7. All compliance values are normalised to the predictions of the quadratic solid element model in ABAQUS, which, based of fundamental principles of solid mechanics, is deemed to be the most accurate representation of the cross-section. It is evident that the cross-sectional modellers are an order of magnitude faster, which was to be expected. However, it should be noted that the meshes were not optimised for convergence at minimum computational cost.
In terms of predicted compliance terms, both the linear and quadratic shell element models perform poorly across the board, consistent with the findings of previous studies (Branner et al., 2007). On the other hand, there is excellent agreement between the cross-sectional modellers and the quadratic solid element models in ABAQUS, with good agreement also observed with the linear solid elements models. The only significant discrepancy is observed in the shear compliance term.
Further simulations found this discrepancy to be roughly consistent. As such, while the exact values of S22 do not agree with that predicted by solid element models, the sensitivity trends of interest in this study can still be reliably determined. Furthermore, S22 plays only a small role in actual bend–twist coupling behaviour, and hence small errors in its sensitivities are considered acceptable in exchange for increased simplicity of speed of analysis. As BECAS and VABS agree with one another, only a single set of results is presented even though both tools were used for all variations.
4.2 Web placement
Due to the general multi-part approach to assembling wind turbine blades, the bonding of webs is a source of geometric variation. The placement of the web influences the development of the shear flow, especially in sections where there are multiple webs. As the shear flow in each cell of the cross-section is related to its enclosed area, a shift of the web's position can have a drastic effect on torsional compliance. Furthermore, shifting of the webs changes the width of the sections of unsupported skin, which influences the warping deformations under loading, again affecting the compliance of blade.
Web positions can be off target in two distinct manners, the first being chordwise location and the second being their angle. To capture these two distinct possible variations, the contact points on the top and bottom surface for each of the webs are varied by up to ± 5 % of the chord length towards the leading edge or towards the trailing edge, where translation is achieved by moving both top and bottom surface contact points in the same direction and rotation is achieved by moving them in opposing directions.
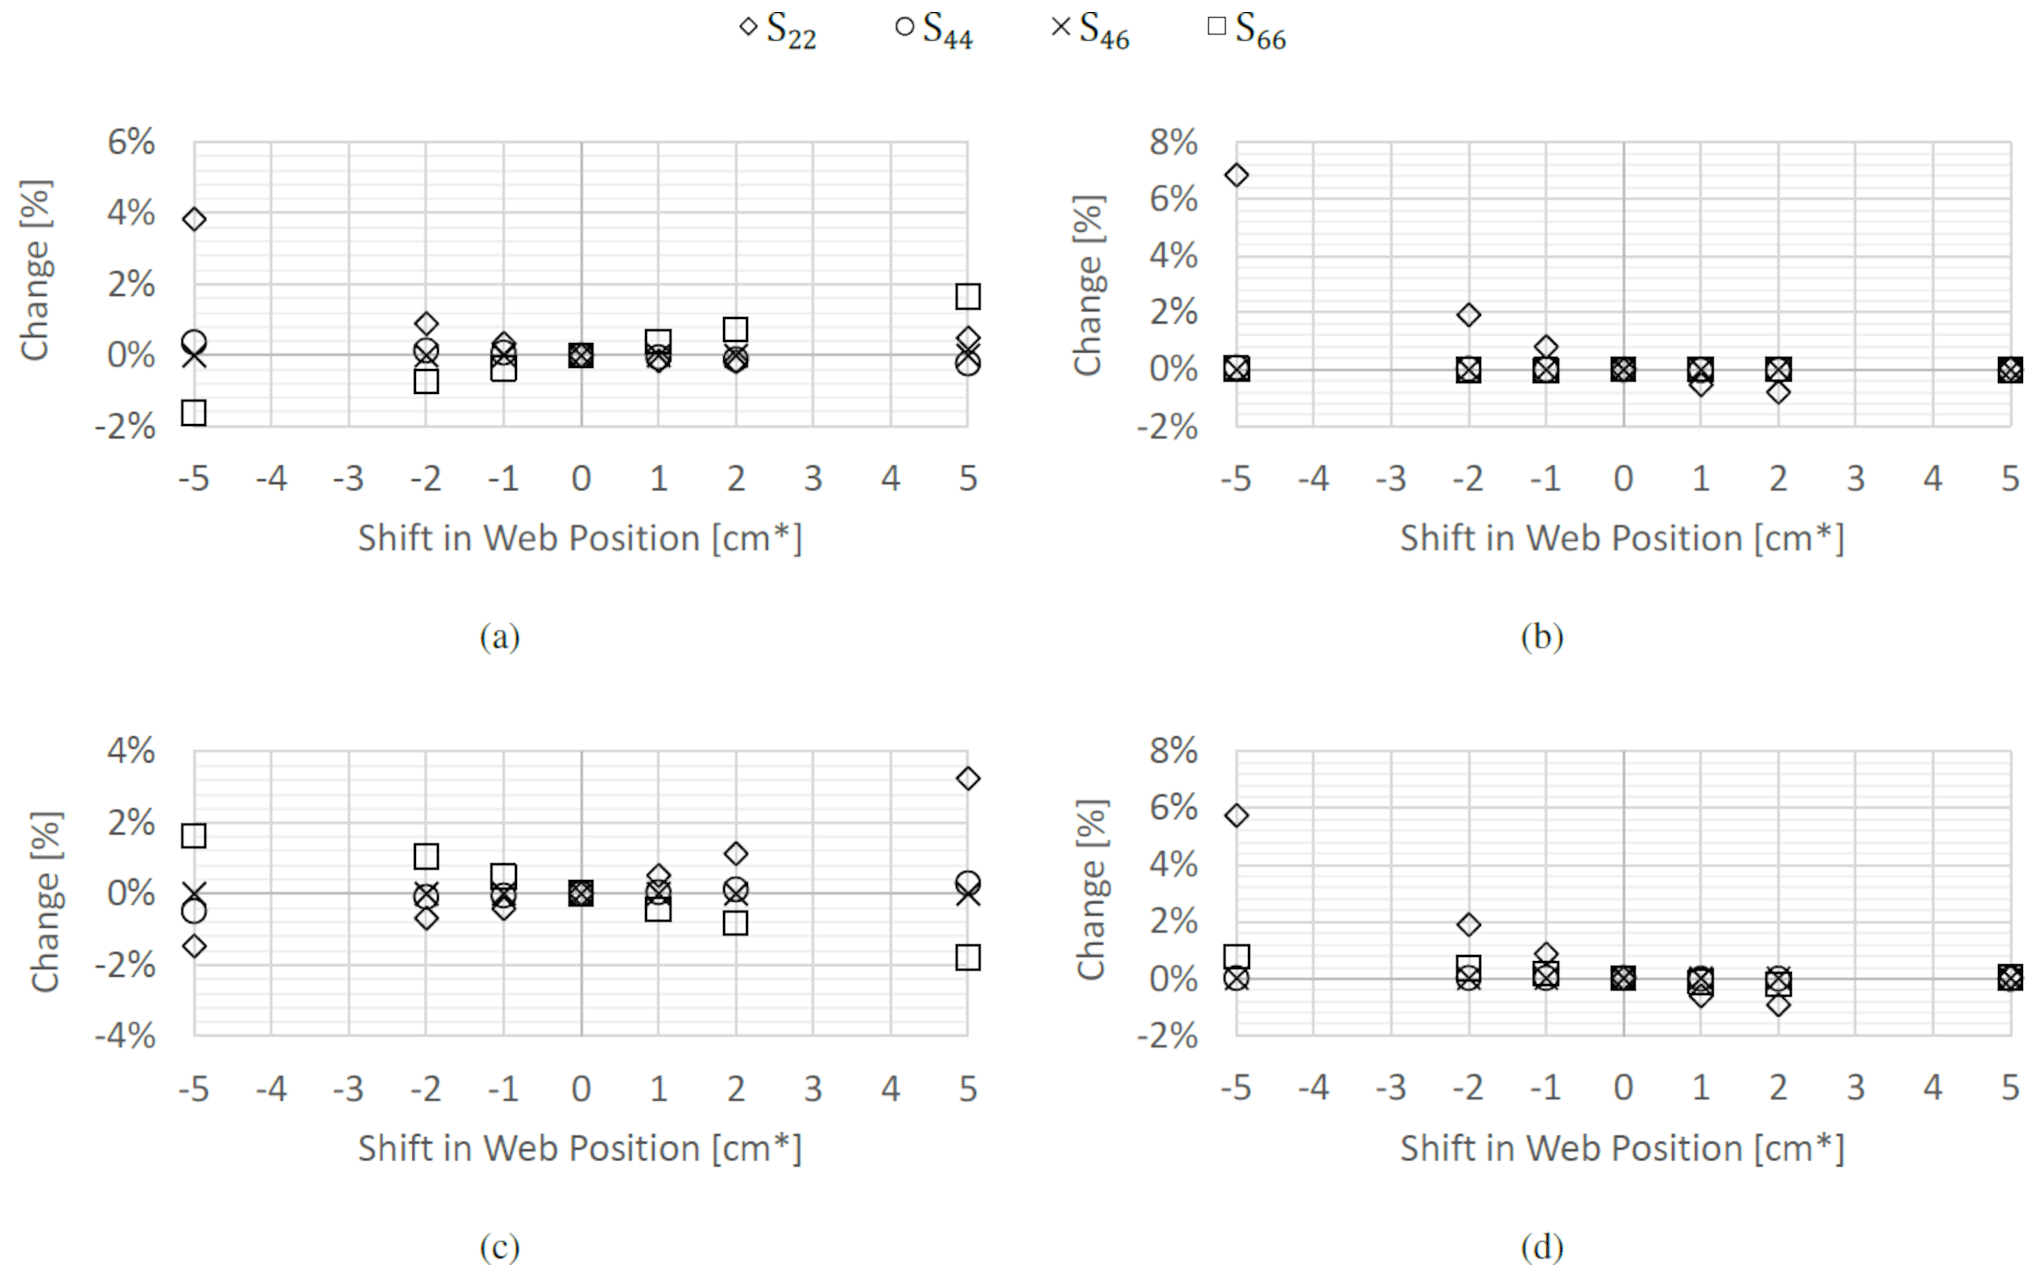
Figure 5Variation in the compliance terms of thick section due to changes in the web placement captured as motion of contact points for a chord length of 1 m, including (a) shifting of the leading edge web, (a) rotating of the leading edge web, (c) shifting of the trailing edge web, and (d) rotating of the trailing edge web.
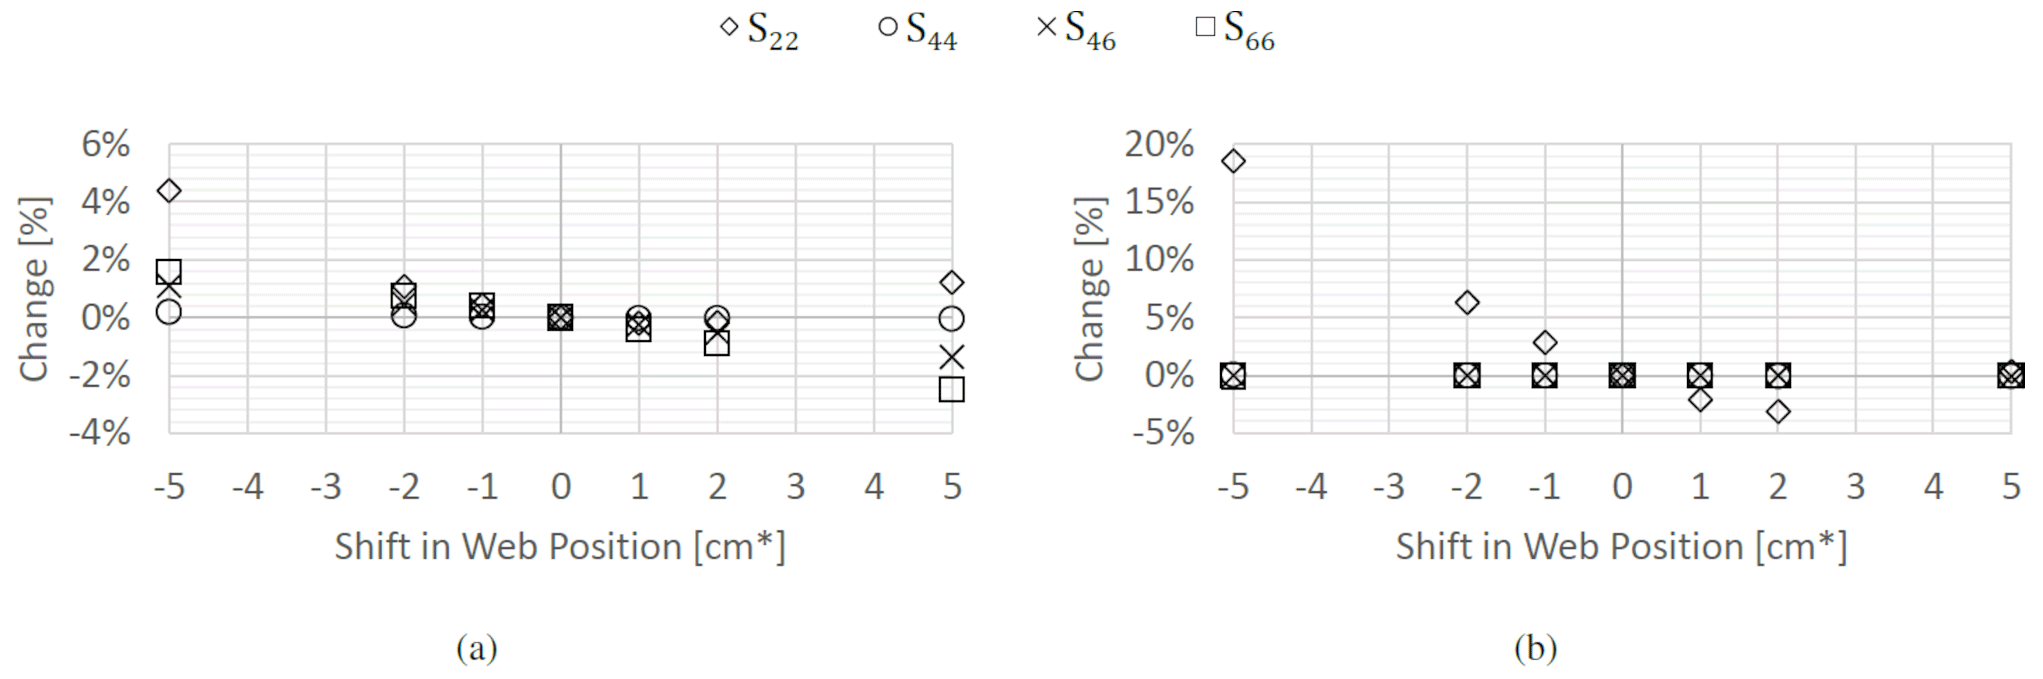
Figure 6Variation in the compliance terms of mid-section due to changes in the web placement captured as motion of contact points for a chord length of 1 m, including (a) shifting of the web and (b) rotating of the web.
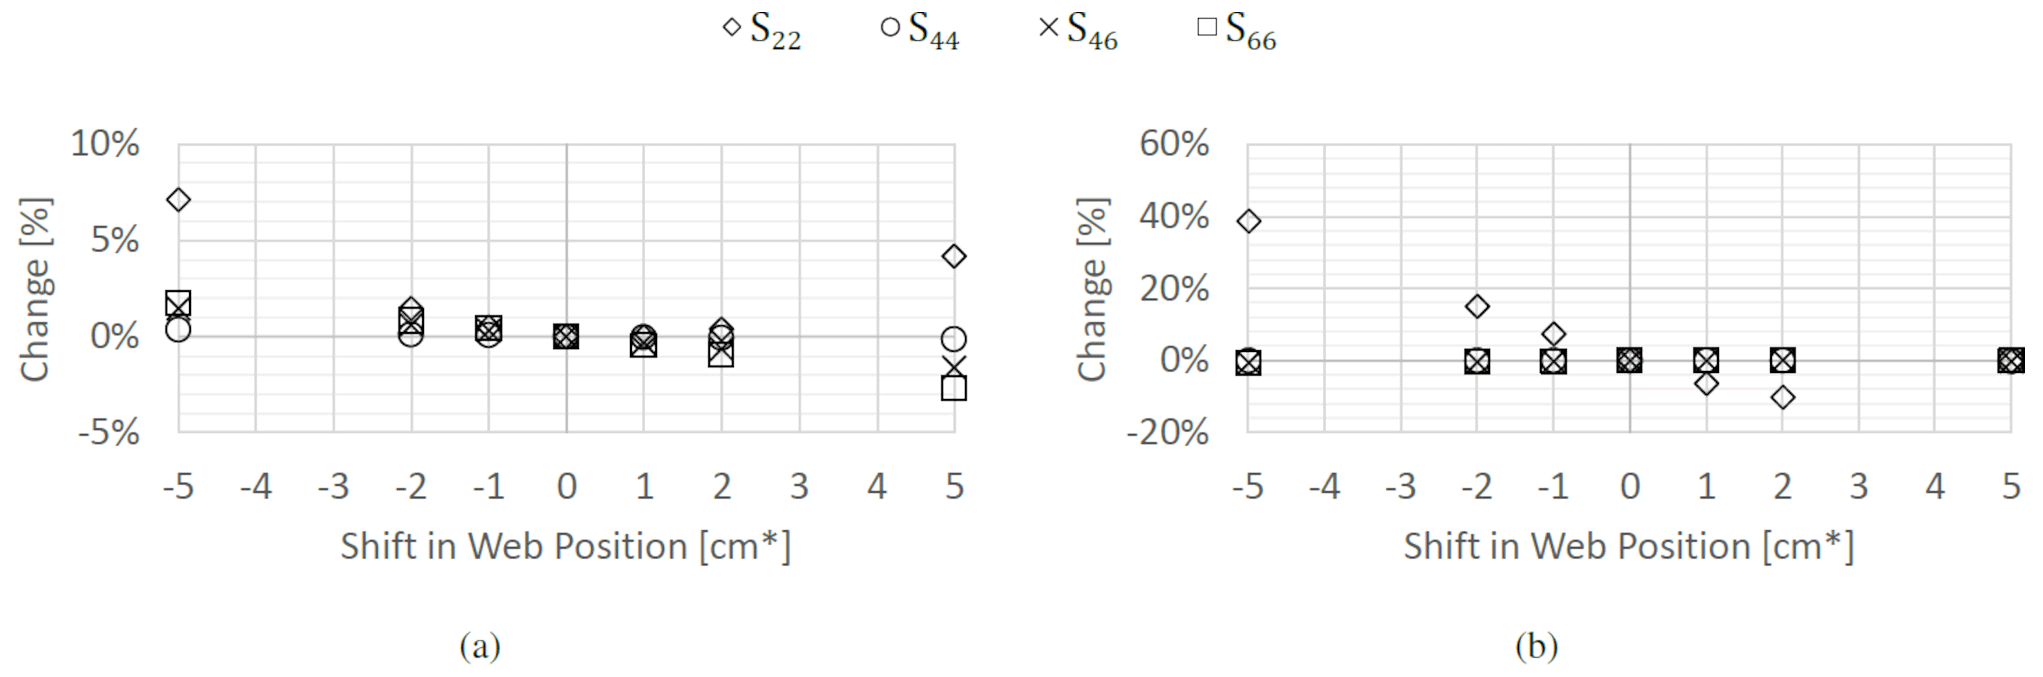
Figure 7Variation in the compliance terms due to changes in the web placement captured as motion of contact points for a chord length of 1 m, including (a) shifting of the web and (b) rotating of the web.
The results for all four webs – two in the thick section and one each in the mid-section and thin section – are shown in Figs. 5–7. The main clear trend is that, apart from the shear term, S22, the influence of web placement on compliance is actually minimal, with all other terms changing by no more than 2 % over the ranges investigated. The rotation of the webs, especially, has little to no effect in all terms aside from S22. This can be explained by the fact that apart from realigning the web to be more or less in line with the shear force, the rotation has little effect on the enclosed area of each cell, hence not meaningfully changing the shear flow within the cross-section.
The bending compliance, S44, is largely unaffected by either shift or rotation, as the web contributes little to bending compliance. This can be traced to the BIAX lay-up in the webs, which gives it relatively little axial stiffness to combine with its small offset relative to the neutral axis. The fact that the bending compliance shifts slightly in the extremes of the range stems from the fact that as the web is shifted and rotated it effectively changes size to match the inner contours of the skin, changing slightly the total area in the cross-section.
It is finally worth reflecting on the change to the coupling and torsional compliance caused by shifting of the web. This effect, which at the extremes of the changes can reach between 1 % and 2 %, reflects the influence the web placements have on the distribution of shear flow between the different cells in the cross-section. From a design point of view, for the single web sections, industry trends pointed to pushing the web further back to reduce torsional and bend–twist coupled compliance. This can be traced both to the effect of reducing the size of the TE cell and reducing the width of the TE panels, which reduces their ability to warp under loading and hence has a stiffening effect on the cross-section as a whole. Interestingly, for the thick section with two webs, the data suggest that the leading edge web should be located further forward and the trailing edge web further backwards to reduce torsion compliance most significantly. This could, however, be a consequence of the starting positions of the webs, which were both ahead of the half chord point, which is common in wind turbine designs.
4.3 Web-to-skin bondline thickness
The second manufacturing tolerance to be investigated is the bondline thickness between the web flange and both the upper and lower skins (see blade cross-section close-up in Fig. 8). This is done with rather large margins using a variation of up to 50 % of the original bondline thickness. It should be noted that these changes are done without shifting the webs; hence this effectively also changes the height of the webs by the change in bondline thickness. Furthermore, as the contact points do not alter their positions, the change in bondline thickness also slightly changes the angle of the web. In spite of these variations clearly modifying the amounts of material present in the cross-section, the results as shown in Fig. 9 demonstrate the limited impact this feature has on the predicted performance.
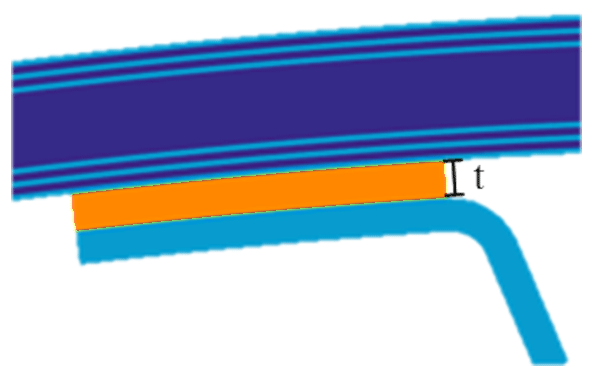
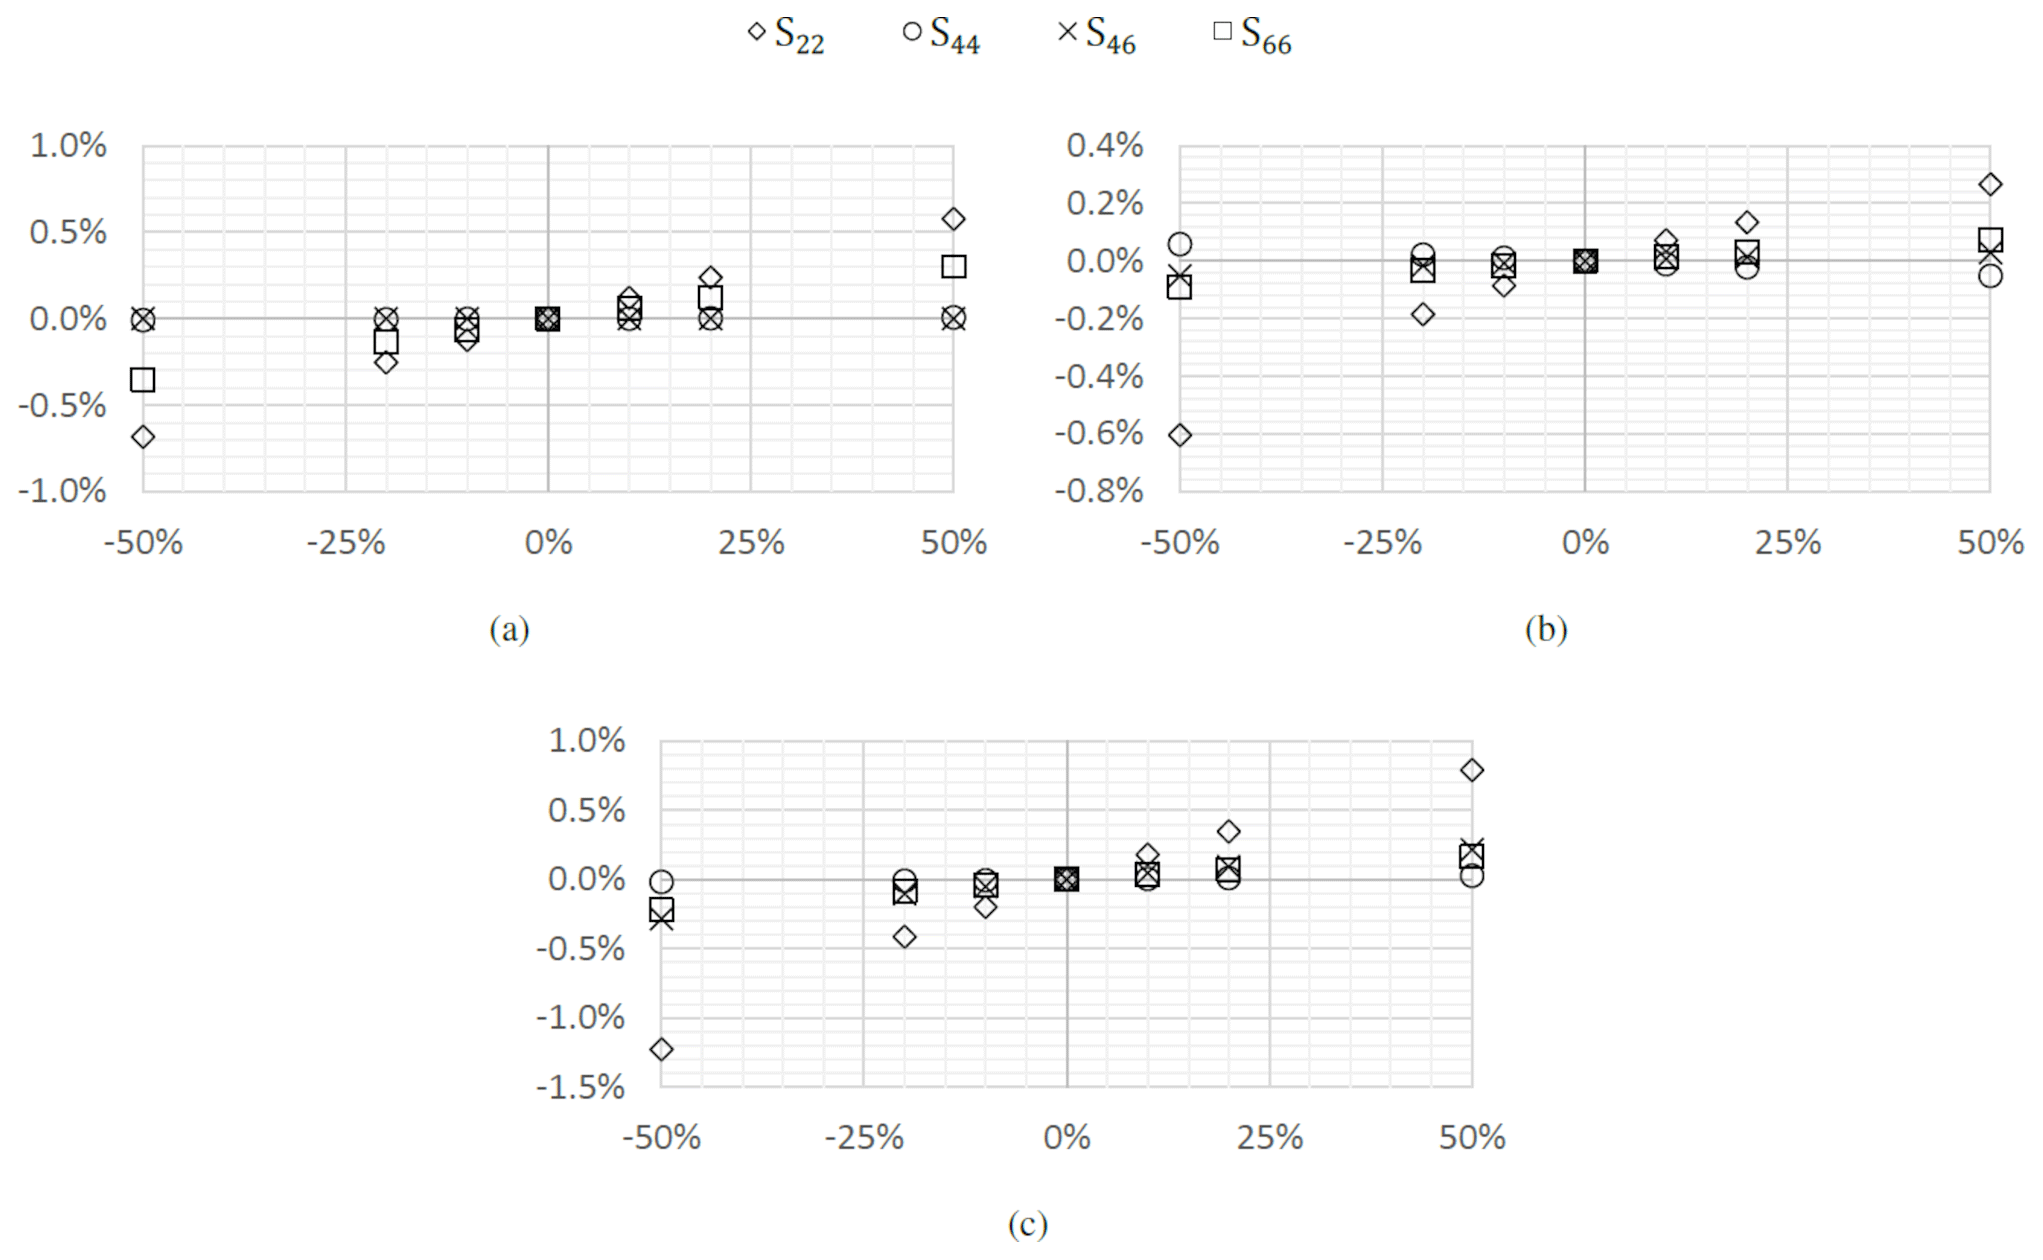
Figure 9Variation in the compliance terms due to changes in the web bondline thickness for (a) the thick section, (b) the mid-section, and (c) the thin section.
For all sections and all variations, the changes are within 1.5 %. The largest sensitivity again occurs in the shear compliance, S22. This can be traced to the minor rotation of the web induced by changing the bondline thickness without shifting the web. Previous results already demonstrated the sensitivity of the shear compliance to the angle of the web. The remaining terms are generally within 0.3 % across the whole range of different bondline thickness variations investigated. While critical for the strength performance of a blade, it is clear from these findings that stiffness performance is not sensitive to tolerances in bondline thicknesses between the webs and the skins.
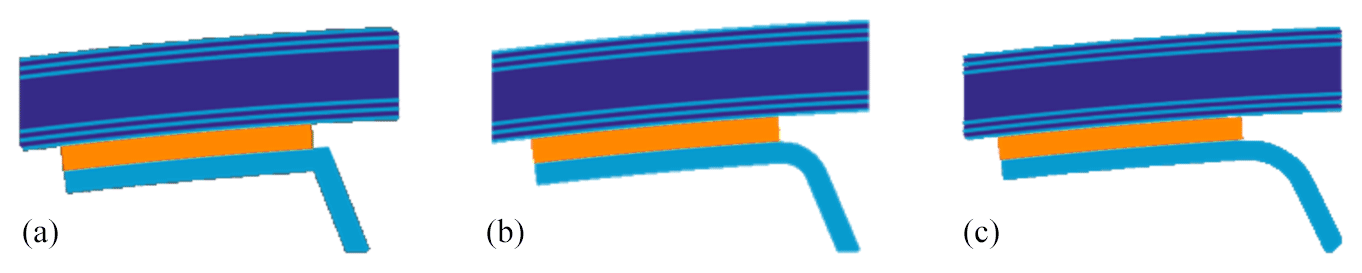
Figure 10Cross-section detail showing range of corner radii from zero (a) through baseline (b)) to 50 % larger (c).
4.4 Corner radii
The next modelling variation to be explored is the corner of the webs. While manufacturing variations do exist in the corners of webs – especially considering the potential thermal spring back after cure – the biggest variation will come from instances where this feature is entirely ignored by the modelling approach. Here especially, it is worth noting that not only shell models tend to ignore this feature. Various example cross-sections in the literature are depicted (and supposedly modelled) without a corner on the webs (see Fig. 8 on page 512 in Chen et al. (2010) as an example). In these studies the cross-sections contain box beams or webs with no corners. Realistically speaking, however, it is known that these components are always produced with corners. As such, while a variation in corner radii is explored (see Fig. 10), the main focus is on the comparison between a corner radius being present and no corner radius being present.
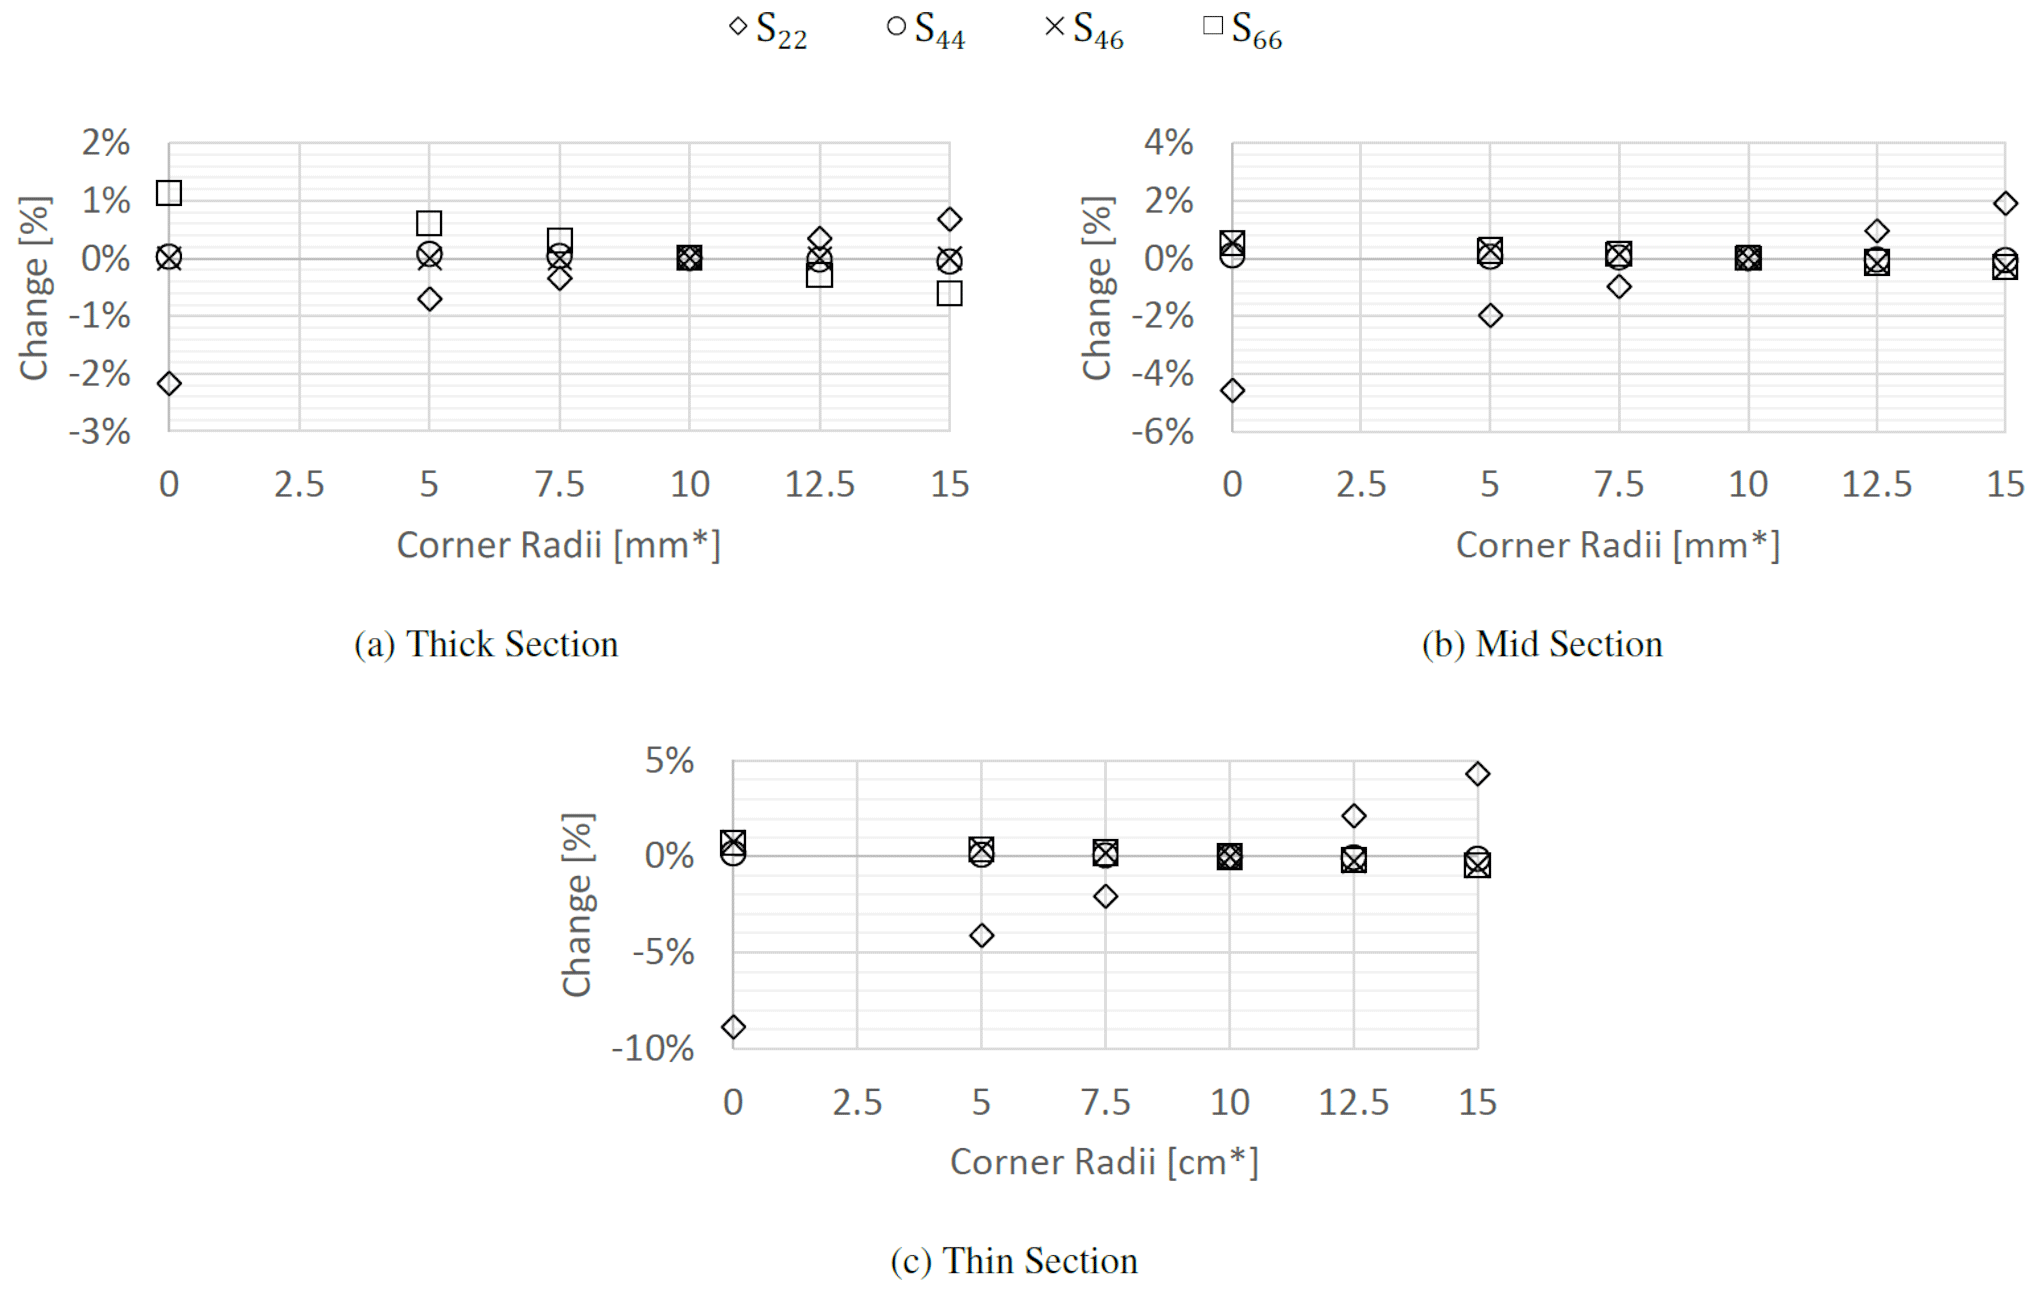
Figure 11Variation in the compliance terms due to changes in the web corner radius for (a) the thick section, (b) the mid-section, and (c) the thin section.
The results, shown in Fig. 11, contain two distinct trends. The first is the overall lack of sensitivity, except for the thick section, of the bending, coupling, and torsional compliance to all changes including the exclusion of the corner radius. The second is the pronounced – up to 9 % for the thin section – impact on the shear compliance when removing the corner radii. For the thin section, where the webs constitute a larger portion of the total material in the cross-section, this change, combined with the slight rotation also caused, can explain the more pronounced influence on the shear compliance observed.
Finally, it is worth noting the relatively pronounced impact on the torsional stiffness in the thick section. For this cross-section, removing the corner radius increases the predicted torsional compliance by around 1 %. While the changes for the three cross-sections analysed here are minor, the increased sensitivity in the torsional compliance case for the thick section poses the possibility that other design cases could show even larger sensitivities. The purpose of trialling three cases from different regions of the blade was to start to capture specific trends to highlight, in a broader design set, which variations may be critical to consider. The influence of the corner radii for the thick section suggests potentially larger impacts for other design cases. For instance, the sensitivity of the torsional term may grow with an increase in the number or relative placement of webs. Further trials on a wider set of baseline designs are needed to investigate this effect.
4.5 Trailing edge bondline depth
The last modelling variation to be explored is the trailing edge bondline depth. Similar to the web corner radii, while there are genuine manufacturing tolerances at play, the largest predictive sensitivity stems from the way in which the feature is, or is not, modelled. Realistically, wind turbine blades contain a trailing edge bondline, distinct from the rest of the material in the section. From a shear flow point of view, the depth of the TE bondline simultaneously changes the size of the TE cell as well as the width of the TE panel and the level of support/clamping it receives at the TE. As such, an increase in TE bondline depth can be expected to cause reduction in torsional compliance from both effects combining. It is also worth noting that the TE bond is a common point of failure in many blades. For these reasons, the trailing edge bondline is varied across a relatively large scope, and also removed almost entirely, to assess the impact on the predicted properties.
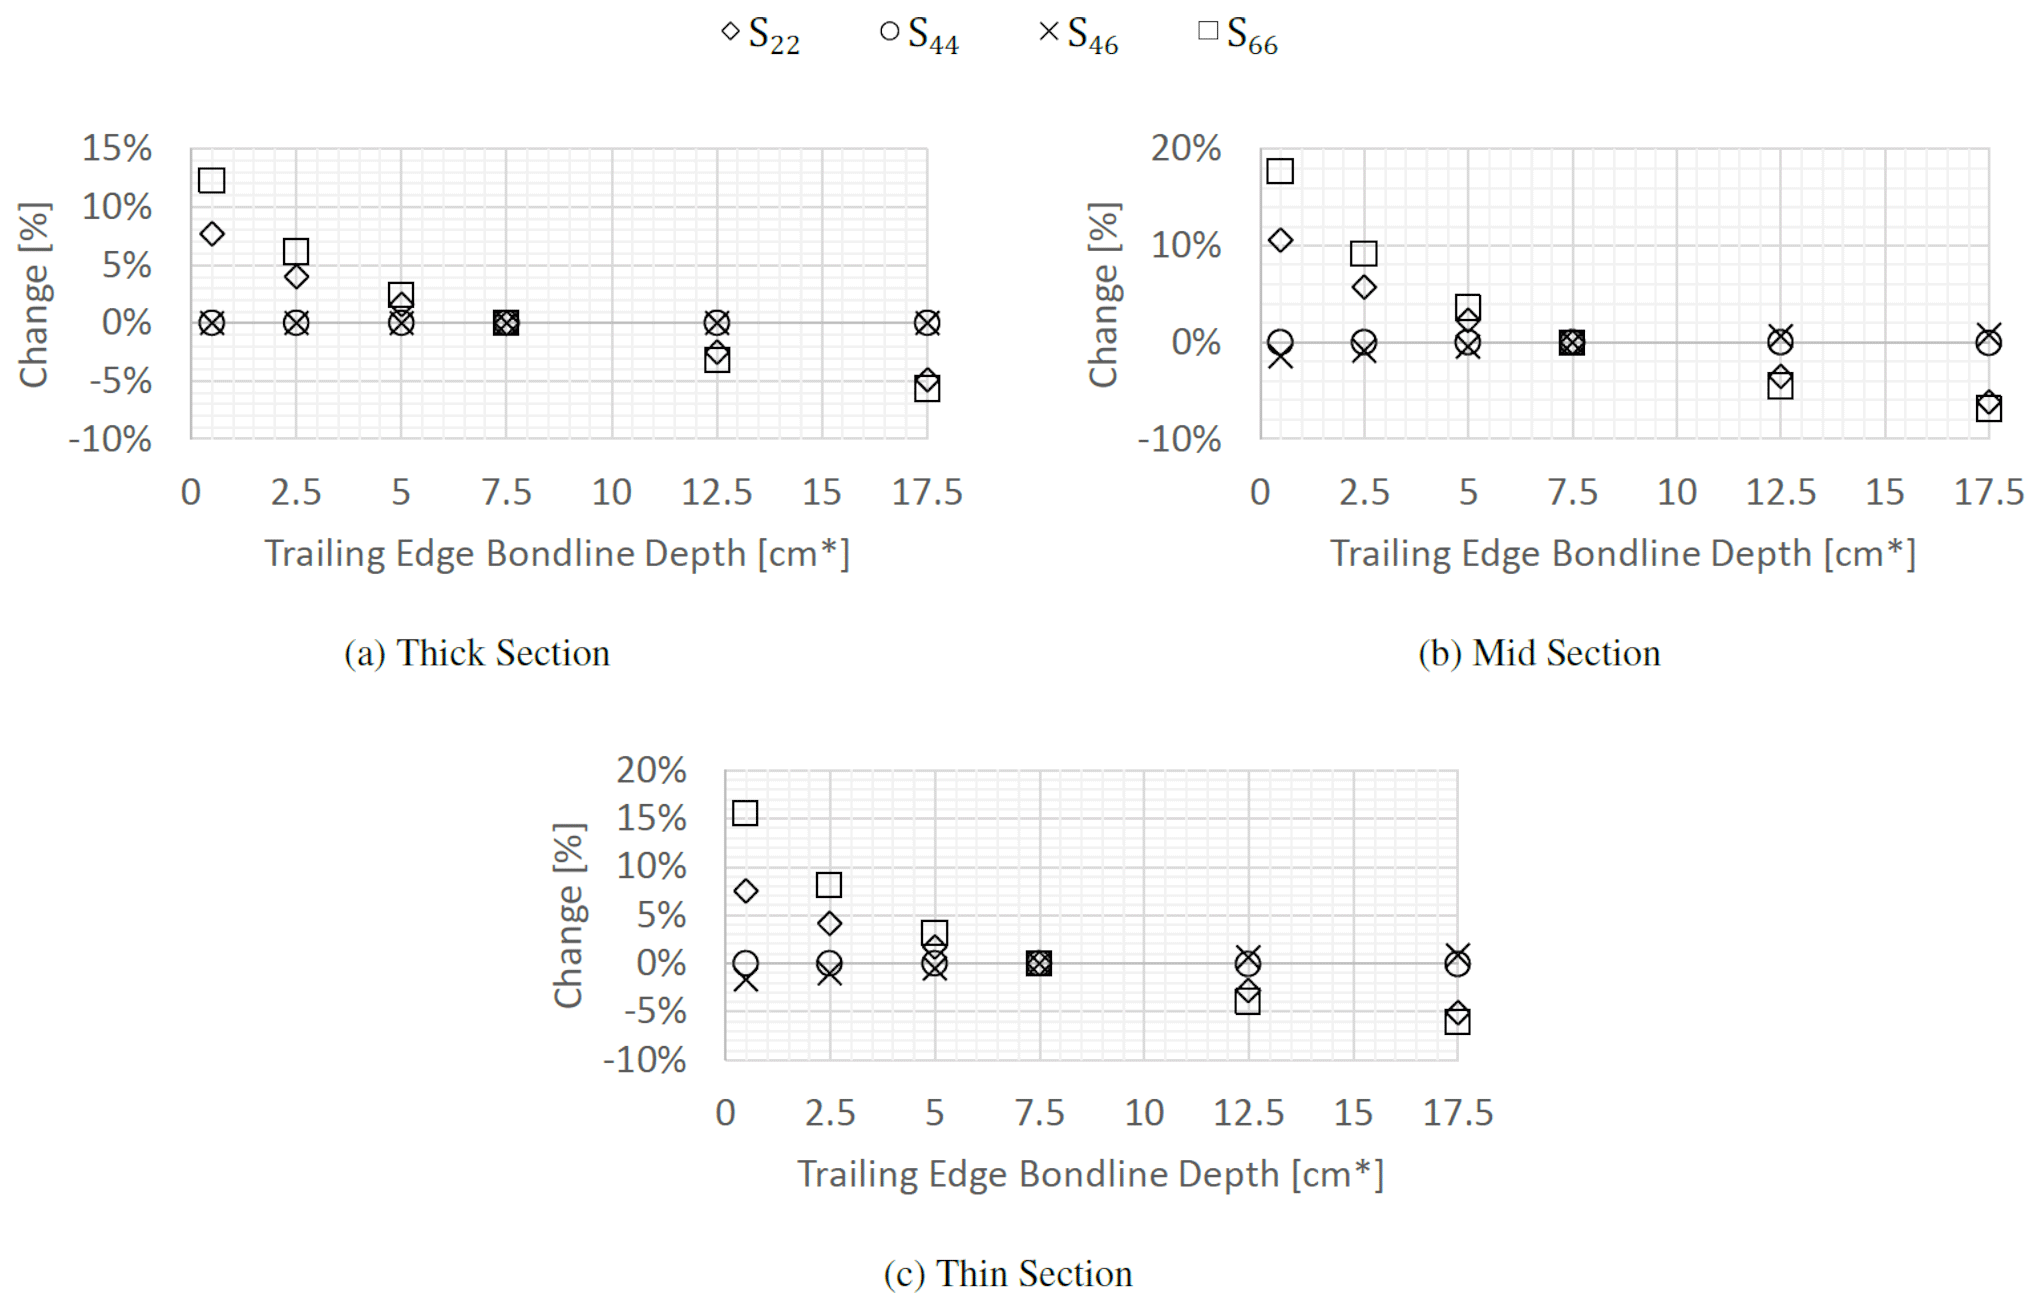
Figure 12Variation in the compliance terms due to changes in the TE bondline depth for (a) the thick section, (b) the mid-section, and (c) the thin section.
From the plots in Fig. 12, the influence of the TE bondline becomes readily apparent. Especially in the extreme case where it is reduced to a single element, the torsional compliance is 12 % higher for the thick section, almost 18 % higher for the mid-section, and nearly 16 % higher for the thin section. Even if the baseline depth is considered to be too large as a starting point, the difference from a base bondline of only 2.5 % of the chord length to a single element is still between 6 % and 8 %. These results were checked by recreating the single contact point scenario for the mid-section in 3D FEM using quadratic solid elements. The difference in the predicted torsional compliance between the cross-sectional modellers and the 3D FEM was 0.06 %.
Beyond the effect on the torsional compliance, the results are in line with many of the other trends observed. The shear compliance shows a meaningful sensitivity to the changes, while the bending compliance shows almost no influence. Due to the significantly larger variations in the torsion and shear terms, the variation in the coupling compliance of around 2 % from the baseline to the single contact point case is difficult to see. It is worth noting that the large variation in torsional compliance also means that the commonly used coupling stiffness coefficient (Ong and Tsai, 1999), which is a function of both direct and coupling compliance terms, reduces by around 7.5 % for the mid-section and 6 % for the thin section.
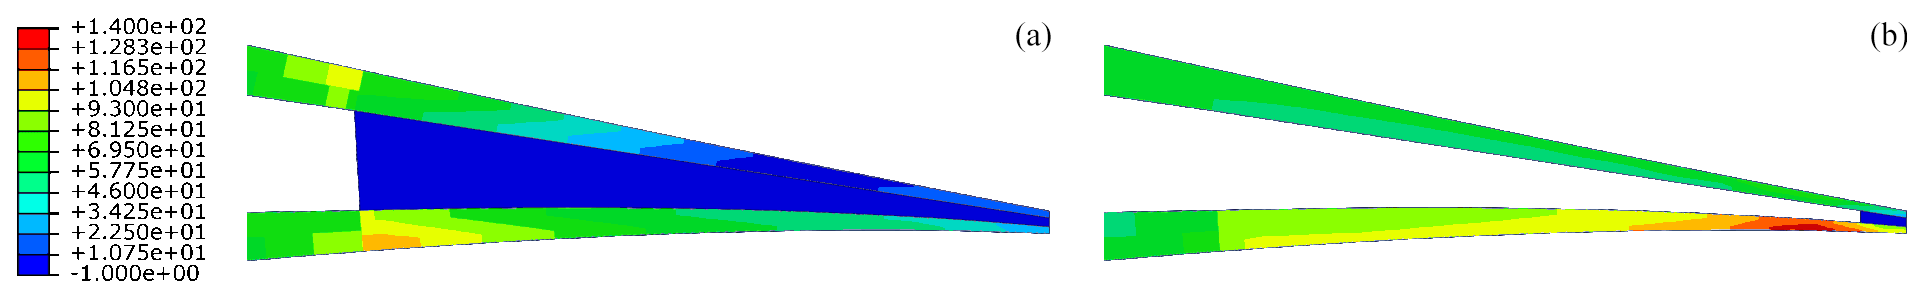
Figure 13Shear stress plots (in N m−2), under bending loading, looking at the trailing edge region of the mid-section for the base case (a) and the minimum bondline depth case (b). Results from the ABAQUS quadratic solid element model.
The influence of the trailing edge bondline on compliance terms can be readily understood on the basis of the shear flow in the trailing edge region. For the case of the baseline trailing edge depth against the minimum trailing edge bondline depth, when comparing the shear stress in the trailing edge region under unit bending loading, Fig. 13 shows that there are two key differences. Firstly, in the baseline case, the shear stress in the upper surface, all of which is the consequence of BTC, drops to nearly zero shortly after the bondline begins. This is indicative of the shear stress transfer happening in the first few centimetres of the bondline. As such, the remaining area of the TE is effectively not carrying shear. It is also possible to note that the shear stresses overall are much higher in the case of the minimum bondline depth. This reflects the reduction in support experienced by the upper and bottom surface, which leads to higher deformations and hence higher peak stress near the constrained point (i.e. the point where the surfaces are joined and hence restrict one another's motion). A final note can be made on the low shear stress in the bondline itself. This is due to its low stiffness resulting in stresses that are much smaller than those in the composite laminate regions. The stresses in the bondline are only of the order of 0.1 Nm−2, hence appearing to be zero using the current legend.
Returning to the initial comparison between the modelling approaches, as documented in Table 7 for the mid-section base case, the shell models were shown to give fairly poor predictions. Based on the sensitivity data gathered, it appears that several features that are not properly resolved in the shell model could explain this error. To evaluate this, a comparison can be made between the shell model and a solid model that approximates the 3D reality the shell model implies. In the shell model three key features are missing: the web corner radii, the web bondline, and – most importantly – the TE bondline. Specifically, the shell model, using the outer surface of the blade skin as the shell element reference plane, only has a single contact point at the very tip of the trailing edge. This is most closely recreated in a solid element model by the minimum bondline depth of one element (see right-hand side of Fig. 13).
When a solid model, using quadratic elements, was created with these features missing and/or misrepresented to agree more closely with the shell model representation, the compliance terms showed similar deviations relative to the 3D FEM quadratic solid results for the actual base case. Specifically, the new normalised bending compliance was 1.003, the normalised coupling compliance was 0.989, and the normalised torsional compliance was 1.170. This is close to the relative compliance value predicted by the original quadratic element shell model, which was 0.990 for the bending compliance, 0.985 for the coupling compliance, and 1.195 for the torsional compliance. The difference between the modified solid model and the shell model in terms of bending compliance is believed to be due to the thickness of the spar caps, a feature the shell model does not explicitly capture but the solid model does and which has already been shown to impact the shell model accuracy (Branner et al., 2007). The new comparison between shell and solid models made here adds to the existing literature by highlighting further limitations of shell models, where the accurate representation of the webs and the TE edge bondline needs to be added to the list of features shell models do not adequately account for.
In this work, the overall sensitivity of the shear, bending, coupling, and torsional compliance with regard to a selection of manufacturing tolerances and modelling simplifications was captured for three representative cross-sections of a wind turbine blade. This was achieved by comparison of the predicted cross-sectional properties as provided by BECAS and VABS. To give credence to these results, for the mid-section, the base cases as well as one of the key variations were also carefully modelled in 3D FEM. For both these cases the 3D quadratic solid element models gave excellent agreement with the BECAS and VABS predictions. This was made possible in part by assuring the inputs provided to all tools were as near to identical as possible within machine precision limits.
In its totality, the sensitivity study has provided two key findings regarding the compliance terms of coupled wind turbine blade sections. First, the compliance terms are mostly insensitive to the vast majority of manufacturing tolerances and modelling variations trialled. This finding should boost the confidence of industry in using BTC as it shows the technique can be used with the certainty that predicted performance can be achieved reliably. The key exception to this was the shear compliance, S22, which showed significant sensitivity to almost all variations. To the best of the authors' knowledge there are no studies that have isolated the influence of the shear compliance on the aeroelastic behaviour of wind turbine blades, so it is not known how this affects accurate aeroelastic performance predictions.
Aside from the shear compliance, some of the other terms also showed larger sensitivity in a select set of cases. In general, the compliance terms changed by much less than 1 % across what could be considered the acceptable range of tolerances for the manufacturing variations investigated. In many instances, as the applied changes increased, the observed variations in the compliance terms grew rapidly, exceeding 5 % at extremes of the trialled domains. This is important to note when setting guidelines for manufacturing tolerances. However, it should be taken into account that all applied variations to dimensions were expressed as relative to the chord length. This means that at the extremes of most domains, the manufacturing tolerances being evaluated – given typical chord lengths on blades between 1 and 5 m – correlated to shifts of between 5 and 25 cm. While, to the best of the authors' knowledge, no data on the manufacturing tolerances investigated in this study are available for real blades within the published literature, they are expected to be well within those limits numerically assessed here.
The second major finding of this numerical study relates to critical guidelines for modelling blade cross-sections and the overall fidelity and limitations of 3D shell modelling approaches for this purpose. While Branner et al. (2007) have explored this to some extent, the only feature deemed important for the overall performances was the spar caps. The results presented in this article strongly suggest that, for accurately capturing the torsional performance, the model must fully resolve all features involved in the development of the shear flow within a cross-section. In this, 3D shell models suffer from an inability to properly capture the influence of the trailing edge bondline. Specifically, it was found that across all cases, when the trailing edge bondline depth was reduced, the torsional compliance increased significantly. This result was confirmed for the mid-section using a 3D quadratic solid element model which gave almost the exact same prediction of torsional compliance (difference of only 0.06 %) compared to the cross-sectional modellers. A 3D quadratic solid element model was also used to further demonstrate that the inability of shell model to properly represent the trailing edge bondline was responsible for the error in the torsion and coupling compliance terms for the shell models for the base case.
In summary, this study reviewed the influence of various geometric features on the accuracy of common cross-sectional modelling methods. Particular focus was placed on the features whose representation, based on common cross-sectional parameterisation approaches, can be ambiguous or even disregarded when using reduced geometrical models (i.e. shell elements). The findings highlight the importance of exercising careful control over inputs to ensure reliable predictions across different modelling techniques and may help explain some of the discrepancies seen by Lekou et al. (2015). Based on the results presented, the authors propose the following modelling guidelines:
-
Pure shell models, still very popular in industry especially for early stage studies, cannot be solely relied upon to accurately predict torsional compliance, even for relatively thin sections, when significant bondlines are present.
-
Hybrid shell–solid models should incorporate solid elements not only in the spar cap areas, as previously demonstrated by Branner et al. (2007), but also in the trailing edge region to capture the bondline and accurately predict the torsional behaviour of the structure.
-
Detailed features such as corner radii on webs and any fillets that similarly affect material distribution should be adequately resolved. Some allowances here can be made depending on acceptable level of fidelity.
-
All known manufacturing tolerances should be investigated to assess whether the design point exhibits sufficient robustness in its performance. For more complex blade designs than studied here, these manufacturing tolerances could include ply drop locations, fillet radii of adhesive joints, fibre alignment of whole stack or individual layers, missing layers within a stack, amongst others.
Understanding the limitations of numerical methods and establishing best practices for modelling is a crucial step in building confidence in the use of BTC. Future work should pursue experimental validation of the models, to demonstrate the accuracy of the models and the feasibility of implementing BTC in real-world applications.
Data are available at the University of Bristol data repository, data.bris, at https://doi.org/10.5523/bris.o8a8gs1ee73y2ivi94338ghg4 (Pirrera et al., 2023).
VKM: conceptualisation, data curation, investigation, methodology, project administration, validation, visualisation, writing; TM: conceptualisation, supervision, writing – review and editing; PMW: conceptualisation, funding acquisition, supervision, writing – review and editing; AP: conceptualisation, funding acquisition, supervision, writing – review and editing.
This work was funded in part by Vestas Wind Systems A/S.
Publisher's note: Copernicus Publications remains neutral with regard to jurisdictional claims made in the text, published maps, institutional affiliations, or any other geographical representation in this paper. While Copernicus Publications makes every effort to include appropriate place names, the final responsibility lies with the authors.
This research was supported by Vestas Wind Systems A/S and co-funded by Vestas Wind Systems A/S and the UK Engineering and Physical Sciences Research Council (EPSRC) through the Centre for Doctoral Training in Advanced Composites for Innovation and Science (grant no. EP/L016028/1). The support and funding are gratefully acknowledged.
This research has been supported by the Engineering and Physical Sciences Research Council (grant no. EP/L016028/1).
This paper was edited by Julie Teuwen and reviewed by two anonymous referees.
Bagherpour, T., Li, X. M., Manolas, D. I., and Riziotis, V. A.: Modeling of material bend-twist coupling on wind turbine blades, Compos. Struct., 193, 237–246, 2018. a, b
Blasques, J. P. and Bitsche, R. D.: User 's Manual for BECAS, Tech. rep., Department of Wind Energy – Technical University of Denmark, Roskilde, 2014. a
Bottasso, C. L., Campagnolo, F., Croce, A., and Tibaldi, C.: Optimization-based study of bend–twist coupled rotor blades for passive and integrated passive/active load alleviation, Wind Energy, 16, 1149–1166, 2013. a, b
Branner, K., Berring, P., Berggreen, C., and Knudsen, H. W.: Torsional performance of wind turbine blades – Part II: Numerical validation, in: 16th International Conference on Composite Materials, 8–13 July 2007.Kyoto, Japan, FrAA2-02ge_brannerk223512p, https://iccm-central.org/Proceedings/ICCM16proceedings/ (last access: 17 January 2024), 2007. a, b, c, d, e, f
Canale, G., Rubino, F., Weaver, P. M., Citarella, R., and Maligno, A.: Simplified and Accurate Stiffness of a Prismatic Anisotropic Thin-Walled Box, Open Mechanical Engineering Journal, 12, 1–20, 2018. a
Capuzzi, M., Pirrera, A., and Weaver, P. M.: A novel adaptive blade concept for large-scale wind turbines. Part II: Structural design and power performance, Energy, 73, 25–32, 2014. a
Capuzzi, M., Pirrera, A., and Weaver, P.: Structural design of a novel aeroelastically tailored wind turbine blade, Thin Wall. Struct., 95, 7–15, 2015. a
Chen, H., Yu, W., and Capellaro, M.: A critical assessment of computer tools for calculating composite wind turbine blade properties, Wind Energy, 13, 497–516, 2010. a, b, c
Chen, J., Shen, X., Zhu, X., and Du, Z.: Study on composite bend-twist coupled wind turbine blade for passive load mitigation, Compos. Struct., 213, 173–189, https://doi.org/10.1016/j.compstruct.2019.01.086, 2019. a
Gözcü, M. and Kayran, A.: Investigation of the effect of bending twisting coupling on the loads in wind turbines with superelement blade definition, J. Phys. Conf. Ser., 524, 012040, https://doi.org/10.1088/1742-6596/524/1/012040, 2014. a
Greenhalgh, E., Pastore, C., and Garfinkle, M.: A continuous-fibre composite wing box-beam exhibiting twist-bend coupling, Compos. Eng., 3, 691–697, 1993. a
Harrison, R., Stacey, S., and Hansford, B.: BERP IV the design, development and testing of an advanced rotor blade, in: American Helicopter Society 64th Annual Forum, American Helicopter Society International, Inc., Montréal, Canada, pp. 1334–1353, 2008. a
Hill, G. F. and Weaver, P. M.: Analysis of anisotropic prismatic sections, Aeronaut. J., 108, 197–205, 2004. a
Hodges, D. H.: Nonlinear Composite Beam Theory, American Institute of Aeronautics and Astronautics, Reston, Virigina, 2006. a
Lekou, D., Bacharoudis, K. C., Farinas, A. B., Branner, K., Berring, P., Croce, A., Philippidis, T., and de Winkel, G. D.: A Critical Evaluation of Structural Analysis Tools used for the Design of Large Composite Wind Turbine Rotor Blades under Ultimate and Cycle Loading, in: 20th International Conference on Composite Materials ICCM20 Secretariat, 19–24 July 2015, Copenhagen, Denmark, 4219-1, https://iccm-central.org/Proceedings/ICCM20proceedings/ (last access: 17 January 2024), 2015. a, b, c, d, e, f
Lemanski, S. and Weaver, P.: Flap-torsion coupling in sandwich beams and filled box sections, Thin Wall. Struct., 43, 923–955, 2005. a
Lemanski, S. L.: Static optimisation of prismatic structures as applied to helicopter rotor blades General, PhD thesis, University of Bristol, https://hdl.handle.net/1983/52d324a6-7c08-4ca7-8cf1-284afe59964f (last access: 17 January 2024), 2004. a
Maes, V. K.: On the sensitivity and validation of bending, twisting, and bend-twist coupling behaviour of wind turbine blade cross-sections, PhD thesis, University of Bristol, https://hdl.handle.net/1983/c768d821-be53-4fee-84fd-9f32629d3bfa (last access: 17 January 2024), 2021. a
Malcolm, D. J. and Laird, D. L.: Extraction of equivalent beam properties from blade models, Wind Energy, 10, 135–157, 2007. a
Manolas, D. I., Serafeim, G. P., Chaviaropoulos, P. K., Riziotis, V. A., and Voutsinas, S. G.: Assessment of load reduction capabilities using passive and active control methods on a 10 MW-scale wind turbine, J. Phys. Conf. Ser., 1037, 032042, https://doi.org/10.1088/1742-6596/1037/3/032042, 2018. a
McKenna, R., Ostman V.d. Leye, P., and Fichtner, W.: Key challenges and prospects for large wind turbines, Renewable and Sustainable Energy Reviews, 53, 1212–1221, 2016. a, b
Moffatt, S. and Griffiths, N.: Structural optimisation and aeroelastic tailoring of the BERP IV demonstrator blade, in: American Helicopter Society 65th Annual Forum, American Helicopter Society International, Inc., Grapevine, Texas, pp. 770–789, 2009. a
Ong, C. H. and Tsai, S. W.: Design, Manufacture and Testing of a Bend-Twist D-Spar, Tech. rep., Sandia National Laboratories, https://doi.org/10.2172/9461, 1999. a
Pamadi, B. N.: Performance, Stability, Dynamics and Control of Airplanes, third edit edn., American Institute of Aeronautics and Astronautics, Reston, Viriginia, https://doi.org/10.2514/4.102745, 2015. a
Pirrera, A., Macquart, T., and Maes, V.: Sensitivity of Cross-sectional Compliance Terms to Manufacturing Tolerances for Wind Turbine Blades, University of Bristol [data set], https://doi.org/10.5523/bris.o8a8gs1ee73y2ivi94338ghg4, 2023. a
Ponta, F. L., Otero, A. D., Rajan, A., and Lago, L. I.: The adaptive-blade concept in wind-power applications, Energy Sustai. Dev., 22, 3–12, 2014. a
Saravia, C. M., Gatti, C. D., and Ramirez, J. M.: On the determination of the mechanical properties of wind turbine blades: Geometrical aspects of line based algorithms, Renew. Energ., 105, 55–65, 2017. a
Scott, S., Capuzzi, M., Langston, D., Bossanyi, E., McCann, G., Weaver, P., and Pirrera, A.: Gust response of aeroelastically tailored wind turbines, J. Phys. Conf. Ser., 753, 042006, https://doi.org/10.1088/1742-6596/753/4/042006, 2016. a
Scott, S., Capuzzi, M., Langston, D., Bossanyi, E., Mccann, G., Weaver, P., and Pirrera, A.: Effects of aeroelastic tailoring on performance characteristics of wind turbine systems, Renew. Energ., 114, 887–903, 2017. a
Şener, Ö., Farsadi, T., and Kayran, A.: Effect of Fiber Orientation of Bend-Twist Coupled Blades on the Structural Performance of the Wind Turbine System, in: 35th Wind Energy Symposium, 9–13 January 2017, Grapevine, Texas, USA, https://doi.org/10.2514/6.2017-1167, 2017. a
Serafeim, G. P., Manolas, D. I., Riziotis, V. A., Chaviaropoulos, P. K., and Saravanos, D. A.: Optimized blade mass reduction of a 10MW-scale wind turbine via combined application of passive control techniques based on flap-edge and bend-twist coupling effects, J. Wind Eng. Ind. Aerod., 225, 105002, https://doi.org/10.1016/j.jweia.2022.105002, 2022. a
Vesel, R. W. and McNamara, J. J.: Performance enhancement and load reduction of a 5 MW wind turbine blade, Renew. Energ., 66, 391–401, 2014. a
Wiens, M., Meyer, T., and Wenske, J.: Exploiting Bend-Twist Coupling in Wind Turbine Control for Load Reduction, 21st IFAC World Congress, IFAC PapersOnLine, 53, 12139–12144, https://doi.org/10.1016/j.ifacol.2020.12.781, 2020. a
Yu, W., Hodges, D. H., and Ho, J. C.: Variational asymptotic beam sectional analysis – An updated version, Int. J. Eng. Sci., 59, 40–64, 2012. a