the Creative Commons Attribution 4.0 License.
the Creative Commons Attribution 4.0 License.
 | 17 Oct 2024
Force-partitioning analysis of vortex-induced vibrations of wind turbine tower sections
Delphine De Tavernier
Dominic von Terzi
Marco Belloli
Axelle Viré
Vortex-induced vibration (VIV) of wind turbine towers during installation is an aero-structural problem of significant practical relevance. Vibrations may happen in the tower structure, especially when the rotor-nacelle assembly is not yet attached to the tower or if the rotor blades are not yet connected to the tower-nacelle assembly. The complexity of aeroelastic phenomena involved in VIV makes modelling and analysis challenging. Therefore, the aim of the current research is to investigate the fundamental mechanisms causing the onset and sustenance of vortex-induced vibrations. To gain more understanding of the nature of vibrations, a methodology is established that distinguishes between different components of the forces at play. This approach allows for identifying how various force components impact the oscillation of a rigid body. The method is executed using the OpenFOAM open-source software. Numerical simulations are conducted on a two-dimensional smooth cylinder at both subcritical and supercritical Reynolds numbers to establish a correlation between wind turbine tower vibrations and the force mechanism. The analysis involves performing unsteady Reynolds-averaged Navier–Stokes (URANS) simulations using the modified pimpleFoam solver with the k–ω shear stress transport (SST) turbulence model. Both fixed and free-vibrating cases are studied for smooth cylinders. For the high-Reynolds-number cases, a setup matching the tower top segment of the IEA 15 MW reference wind turbine was chosen. Studying the flow around a cylinder at a subcritical Reynolds number reveals that the primary force involved is the vortex-induced force. The combined force due to viscosity, added mass, and vorticity contributes most to the overall force. For a freely vibrating cylinder with a single degree of freedom in the crossflow direction, the analysis indicates that the force component associated with the cylinder's motion is crucial and significantly affects the total force. Moreover, analysing the energy transfer between the fluid and the structure, a positive energy contribution by the vortex-induced force is observed on or before the dominant Strouhal velocity. This confirms observations at low Reynolds numbers in the literature that the vortex shedding predominantly contributes to the initiation of oscillations during VIV. The kinematic force contributes to the energy transfer of the system, but the mean energy transfer per cycle is negligible.
- Article
(5793 KB) - Full-text XML
- BibTeX
- EndNote


Wind turbines continue to grow in size for energy production at a lower cost of energy. One of the challenges that follows this trend is the scaling of wind turbines, as taller wind turbines have longer and more flexible blades and towers (Hoen et al., 2023; Veers et al., 2019). Many physical phenomena must be taken into consideration during the design process for such large turbines. Vortex-induced vibration (VIV) is one such aerodynamic phenomenon that must be understood in detail during the design of wind turbines. Both wind turbine blades and towers can suffer from VIV, for which many studies have been carried out in the past (Livanos, 2018; Derksen, 2019; Horcas et al., 2020; Riva et al., 2022). However, the complex aerodynamic interactions that give rise to VIV are not fully understood, especially for the complex flow conditions experienced by wind turbines. The towers are prone to oscillations or vibrations due to vortex shedding, particularly when the rotor-nacelle assembly or the rotor blades are not yet installed. The load cases in which the wind turbine towers are susceptible to VIV are when the towers are (i) standing on the quayside, (ii) transported in a vessel, and (iii) standing on the foundation (e.g. monopile or jacket for offshore turbines) either without the rotor-nacelle assembly or before the installation of the blades on the tower-nacelle assembly. Figure 1 shows a load case when a tower is standing on the foundation during installation at the site. Understanding VIV and its impact on wind turbine towers is crucial for the design and operation of these structures. Therefore, further studies are needed to analyse VIV and its mitigation for wind energy systems.
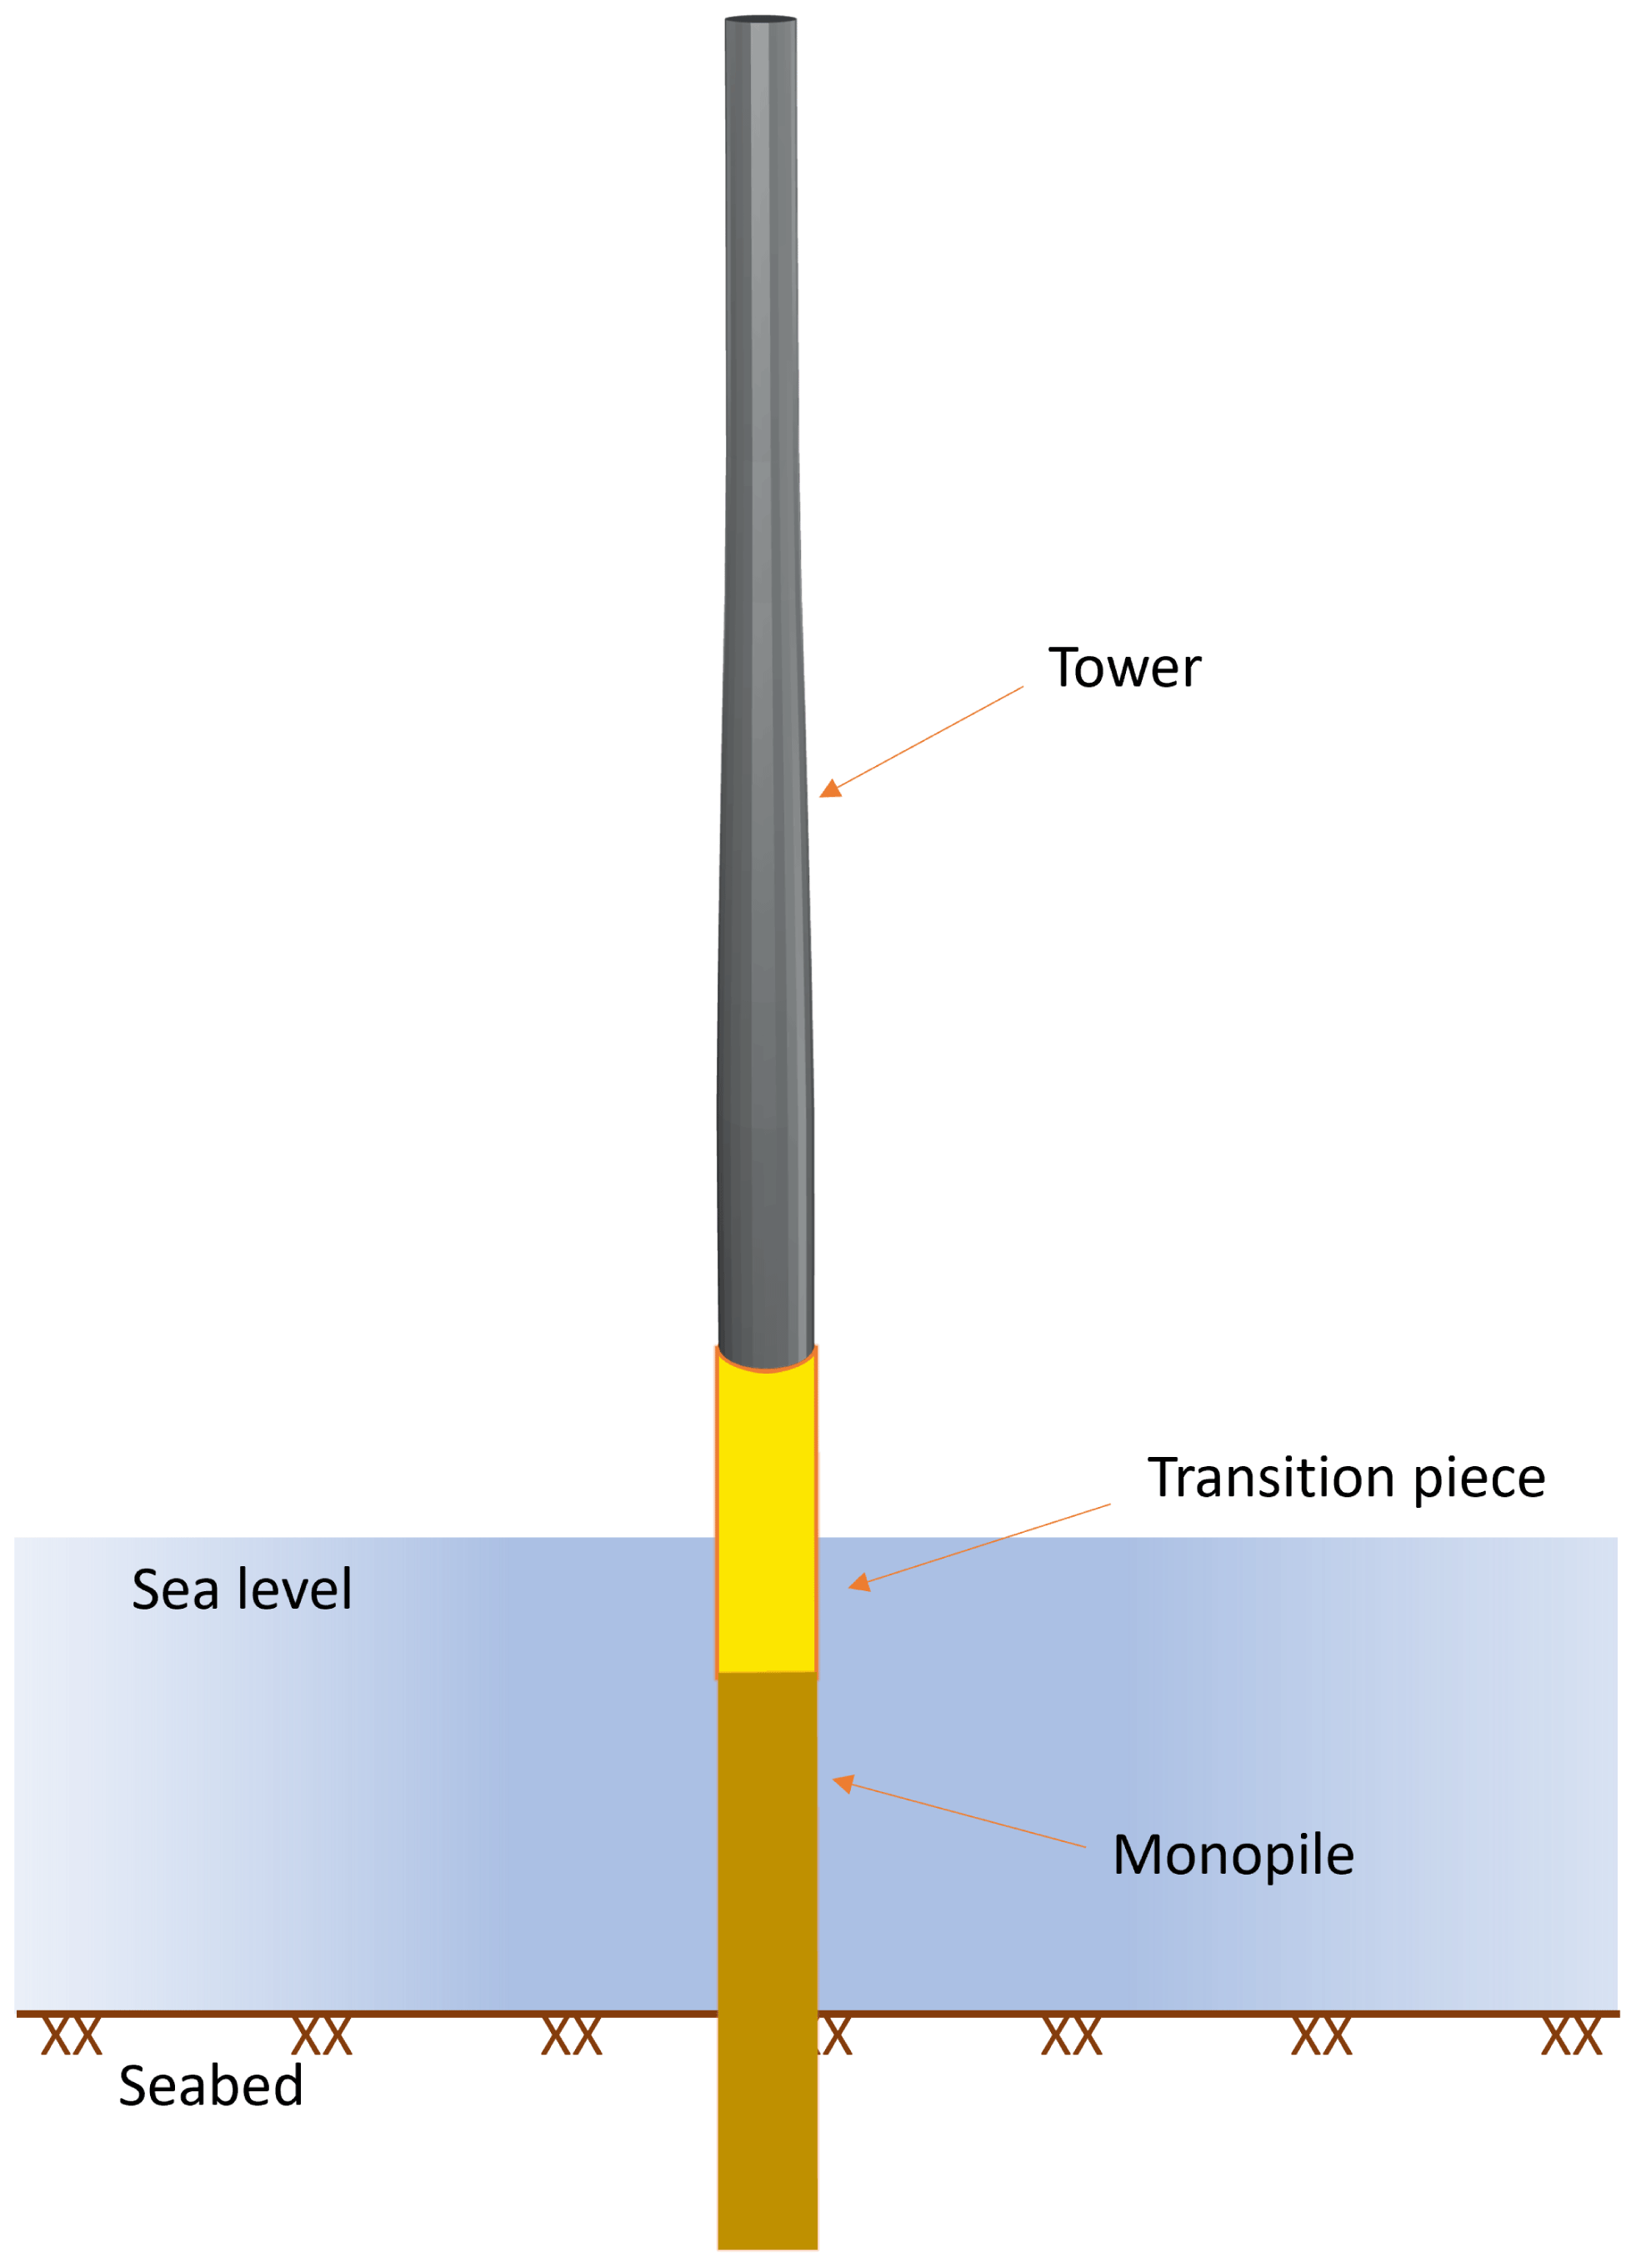
Figure 1Example of a load case where a wind turbine tower is susceptible to VIV, with the tower standing on the foundation during installation.
Extensive research has been conducted in the past to investigate VIV of circular cylinders, particularly for subcritical and critical Reynolds numbers (Williamson and Roshko, 1988; Bishop and Hassan, 1964; Brika and Laneville, 1993; Williamson and Govardhan, 2004). These studies investigated the vortex patterns and associated forces at various Reynolds numbers and the vibration pattern with respect to amplitude and direction. However, VIV is a complex phenomenon that depends on many other structural and fluid properties, like mass, natural frequency, damping ratio, inflow velocity, turbulence intensity, viscosity, etc. Whilst most of these studies have been carried out for low-Reynolds-number regimes, significantly fewer studies have been done for super- and transcritical Reynolds numbers. This is mainly due to the difficulties of performing experiments at these high Reynolds numbers and the high computational expense of numerical simulations. Experiments carried out by Belloli et al. (2012, 2015) analyse the lift force behaviour and the wakes formed behind the cylinder. The cylinder is covered with a rough mesh to increase roughness and an effective Reynolds number to perform these experimental analyses. Upon further investigation, the motion experienced at a high mass ratio (m*) and low structural damping shows that the vibration amplitudes are much higher than those according to the Griffin plot (Griffin, 1980).
In addition to the experimental studies, several numerical studies were carried out at transcritical Reynolds numbers. These studies were performed using large-eddy simulations (LESs), unsteady Reynolds-averaged Navier–Stokes (URANS) simulations, and a hybrid RANS–LES approach (Catalano et al., 2003; Squires et al., 2008; Travin et al., 2000). These studies analysed the force and pressure around the cylinder at Reynolds numbers ranging from 1 to 8 million. Some observations indicated significant disparities between the simulations conducted using LES (with wall functions) and those performed using the URANS methodology. With the developments in hybrid RANS–LES (see Fröhlich and von Terzi, 2008, for a review), the simulations have become simpler to execute as the resolution in the boundary layer on the cylinder could be significantly reduced over wall-resolved LESs. Detached eddy simulation (DES) and its variants (see Spalart, 2009, for a review) is one such method that showed great promise for cylinder flows. This is shown in the work by Squires et al. (2008), where DES and delayed DES (DDES) for flow over cylinders at transcritical Reynolds numbers are performed and compared with experimental data. Nevertheless, the more recent study by Viré et al. (2020) gives confidence in performing URANS simulations for transcritical Reynolds numbers as envisioned here. Moreover, the studies were also carried out for oscillating cylinders under free and forced vibrations. Their results showed sufficient agreement for the purpose of the study between their URANS and work in the literature, for both experiments and high-fidelity simulations. Most previous works analysed the numerical simulations for flow over cylinders at supercritical and/or transcritical Reynolds numbers for the total force and surface pressure over the cylinder. The vorticity and wake patterns are deduced qualitatively from their various mode shapes and shedding frequencies. But to better understand the fundamental mechanisms of initiation and sustenance of VIV, it is important to look into the details of the various force components and their relations with the cylinder motions.
By quantifying different force mechanisms acting on the cylinder, more insight into the behaviour of oscillations can be gained. The work of Quartapelle and Napolitano (1983) proved to be a fundamental base for the force-partitioning method (FPM). A generic formula was derived for the force and moment of a rigid body immersed in incompressible flow. It was achieved by solving the Navier–Stokes equations where the momentum equation was projected on the gradient of a harmonic function, which satisfies appropriate boundary conditions. Chang (1992) further showed the force contribution due to potential flow, vorticity within the flow, and surface vorticity on the finite body, subsequently providing a further understanding of different force components.
The influence of different forces on the oscillation of a rigid body provides more insight into the nature of the force mechanism. Morse and Williamson (2009) showed that the energy extracted in forced oscillations is closely related to amplitude response in free oscillations. This is found to be useful in complicated nonlinear responses and has been shown for oscillating cylinders by Williamson and Govardhan (2004). This was combined along with the force-partitioning approach to analyse the force mechanisms in the sustenance of VIV by Menon and Mittal (2021). The latter found that the vortex shedding behind the cylinder contributes only during the initiation of VIV, whilst the vorticity in the shear layer leads to the sustenance of VIV. Hence, the vortex-induced force was found to be the most crucial for oscillations during VIV compared to the vortices in the wake behind the cylinder. While the previous study focuses on the flow around a cylinder at Reynolds number ≤ 250, the importance of the force-partitioning method at transcritical Reynolds numbers is yet to be understood, as the flow around wind turbines is characterised by a high Reynolds number ().
Even though VIV of circular cylinders has been extensively studied in the past, the study of VIV of cylinders under the influence of high-Reynolds-number flows and a large mass ratio is still limited. Moreover, as investigated by Viré et al. (2020), there is an interchange between self-exciting and self-limiting oscillation when the cylinder is allowed to vibrate freely. It is interesting to see how various force mechanisms contribute to such behaviour during VIV. Hence, the aim of the current work is twofold: (a) to implement the force-partitioning method in the open-source computational fluid dynamics (CFD) software OpenFOAM (Bainbridge et al., 2012) and (b) to determine the nature of the force mechanism that leads to initiation and sustenance of VIV of wind turbine towers in the transcritical Reynolds number regime. Additionally, it is intended to derive a correlation between the oscillations of the wind turbine tower and different force mechanisms using the above-mentioned approaches.
2.1 Force-partitioning method
The force-partitioning method aims to separate the forces experienced by a body in a fluid into various components in order to better understand the physical mechanisms between structural motions and the surrounding fluid flow. The method used in the current study to analyse the various forces is derived from the previous works of Quartapelle, Mittal, and Zhang (Quartapelle and Napolitano, 1983; Menon and Mittal, 2021; Zhang et al., 2015). This section explains the methodology used for the partitioning of forces in detail.
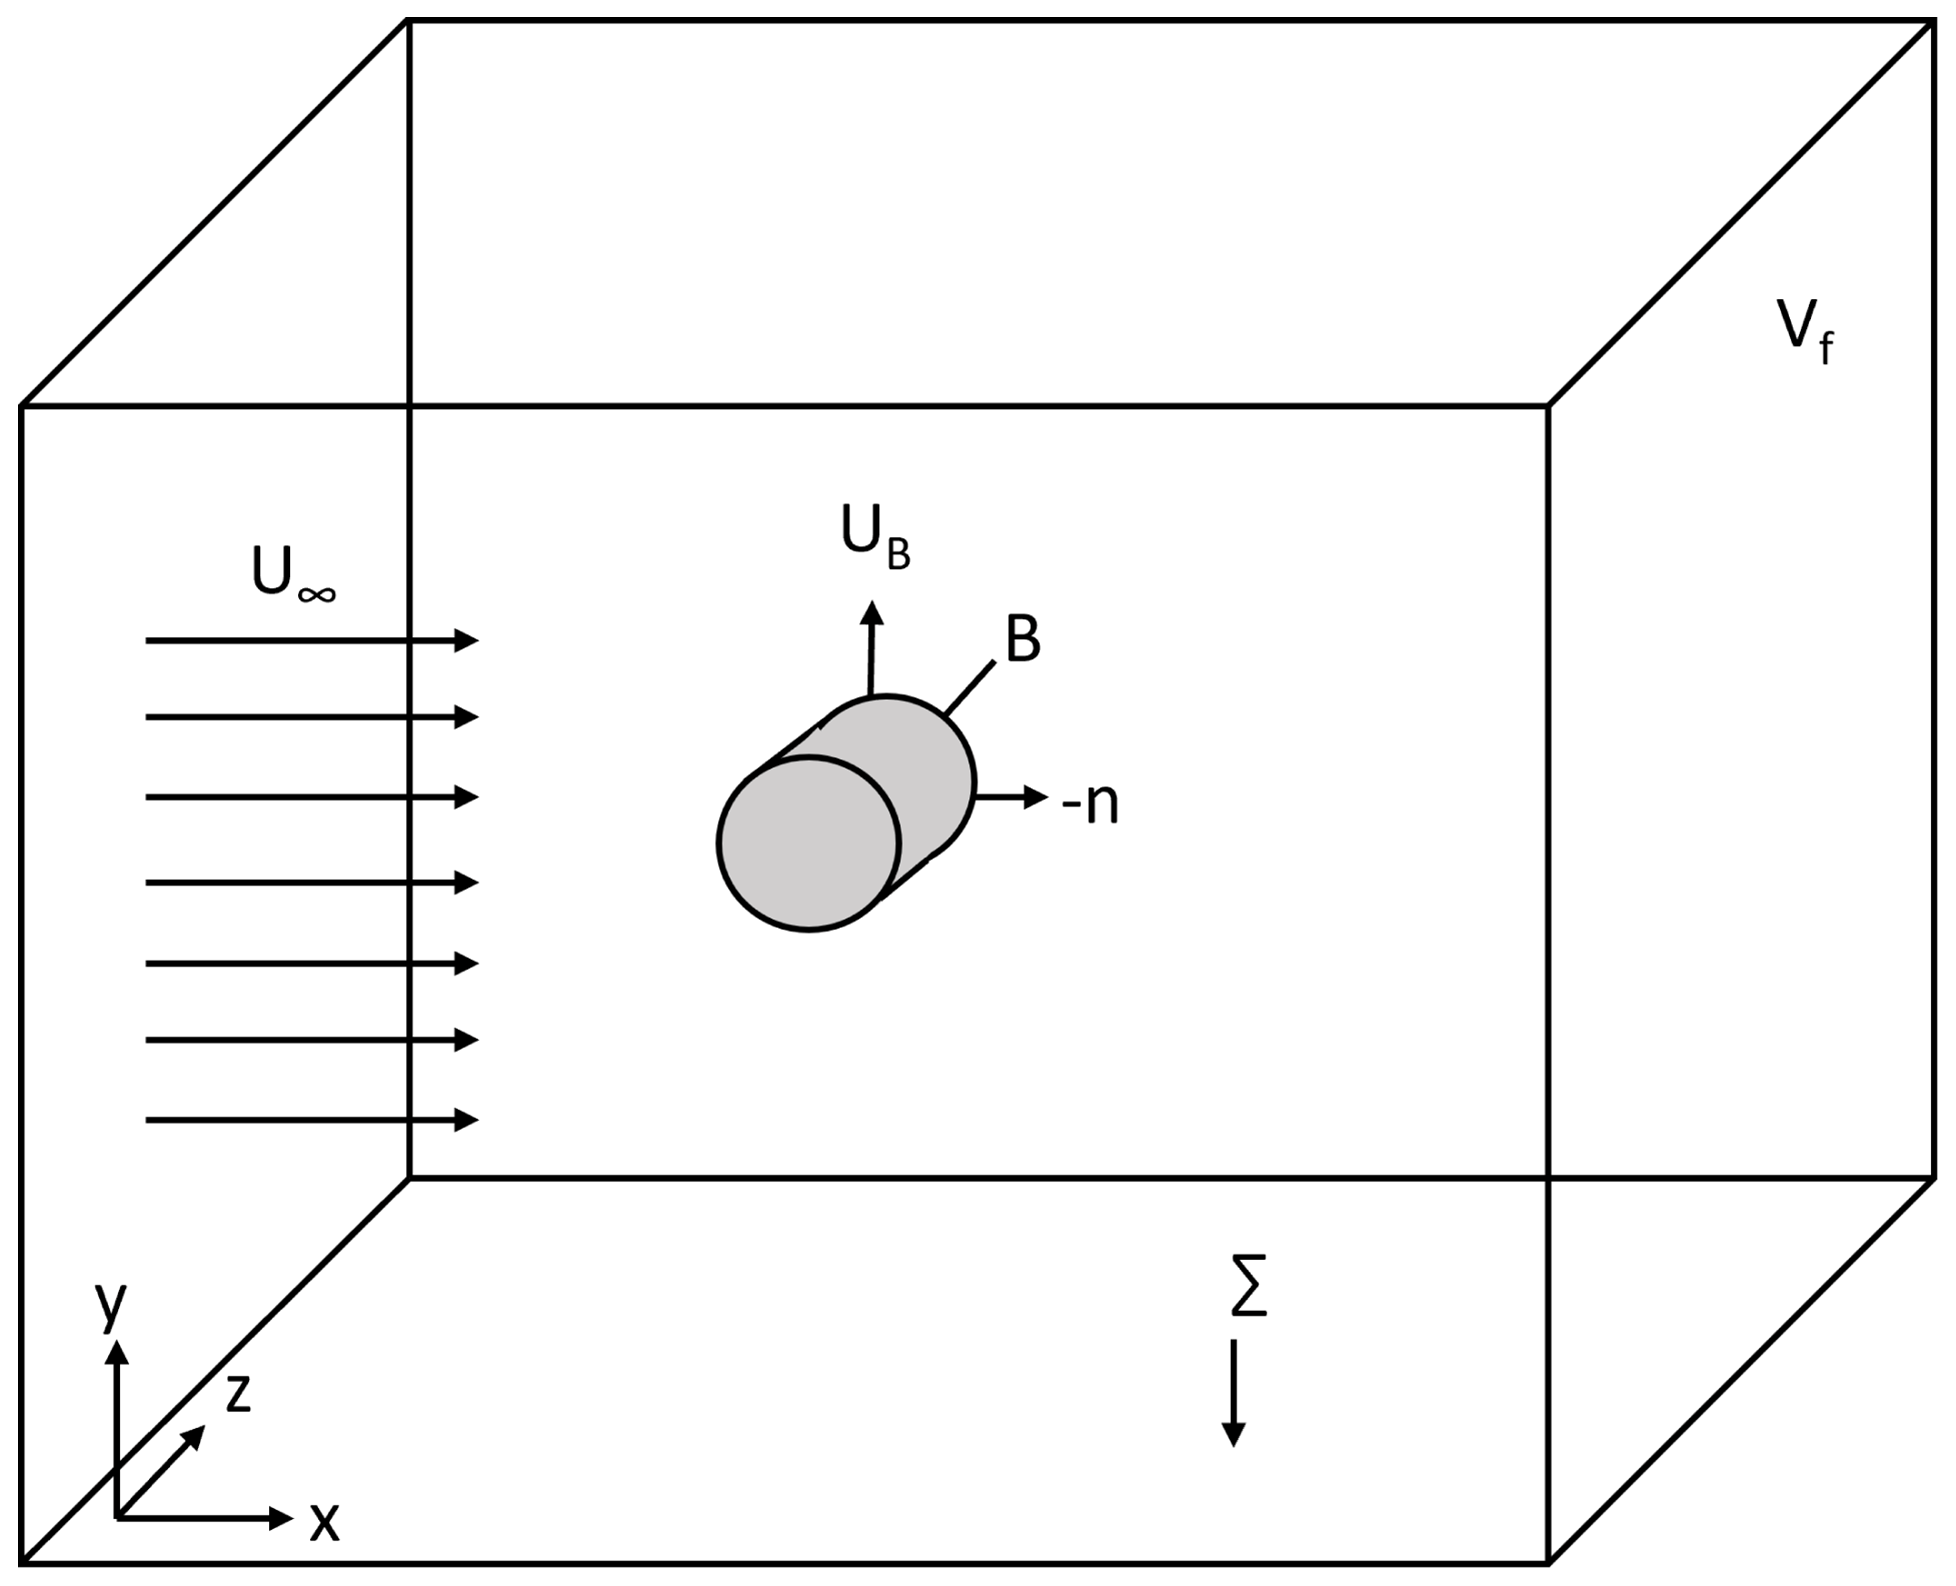
Figure 2 shows the schematic representation of the domain. The surface of the body is represented as B, where the body is placed in the fluid domain Vf, which is bounded by an outer boundary ∑. The unit normal of every surface point of the object is represented as n. The method starts by introducing a harmonic function ϕ(i), where represents the direction in which the force is partitioned. The harmonic function corresponds to the potential associated with the flow around the body for a shape and position for time t=τ as shown in Eq. (1):
The derivation starts with the momentum conservation equation written in Lamb–Gromeka form, as shown in Eq. (2):
where t represents the time, and p, ρ, and μ correspond to pressure, density, and dynamic viscosity, respectively. The partitioned forces can be obtained by projecting this momentum equation on the gradient of the harmonic function, ϕ(i), and integrating it over the fluid domain Vf; i.e.
Upon further mathematical simplifications, Eq. (3) yields the final decomposition of the forces acting on the body FB. This has been explained in detail in Menon and Mittal (2021). The final force is the summation of the kinematic force (FK), the vortex-induced force (Fω), the viscous force (Fσ), the force that results purely from potential flow (Fϕ), and the force due to the effects of the outer boundary (Fϵ), as shown in Eq. (4). The coefficient of each force component can be obtained by dividing the force component by the free-stream dynamic pressure, q∞, and the area, A, namely .
The velocity of the body at every point is represented as UB, also shown in Fig. 2. The velocity components uϕ and uν are obtained using the Helmholtz decomposition to expand the velocity vector into curl-free and divergence-free components as shown in Eq. (5) (Batchelor, 2000):
where Φ and A are scalar and vector potentials, respectively.
2.2 OpenFOAM implementation
The numerical simulations for the present study are carried out using the open-source computational fluid dynamics (CFD) software OpenFOAM-v2012 (Bainbridge et al., 2012). OpenFOAM consists of many solvers and libraries, making it useful for various applications like fluid dynamics, structural dynamics, electromagnetics, etc. Modifications made in the libraries of OpenFOAM for the implementation of the force-partitioning method (FPM) are explained in the current section.
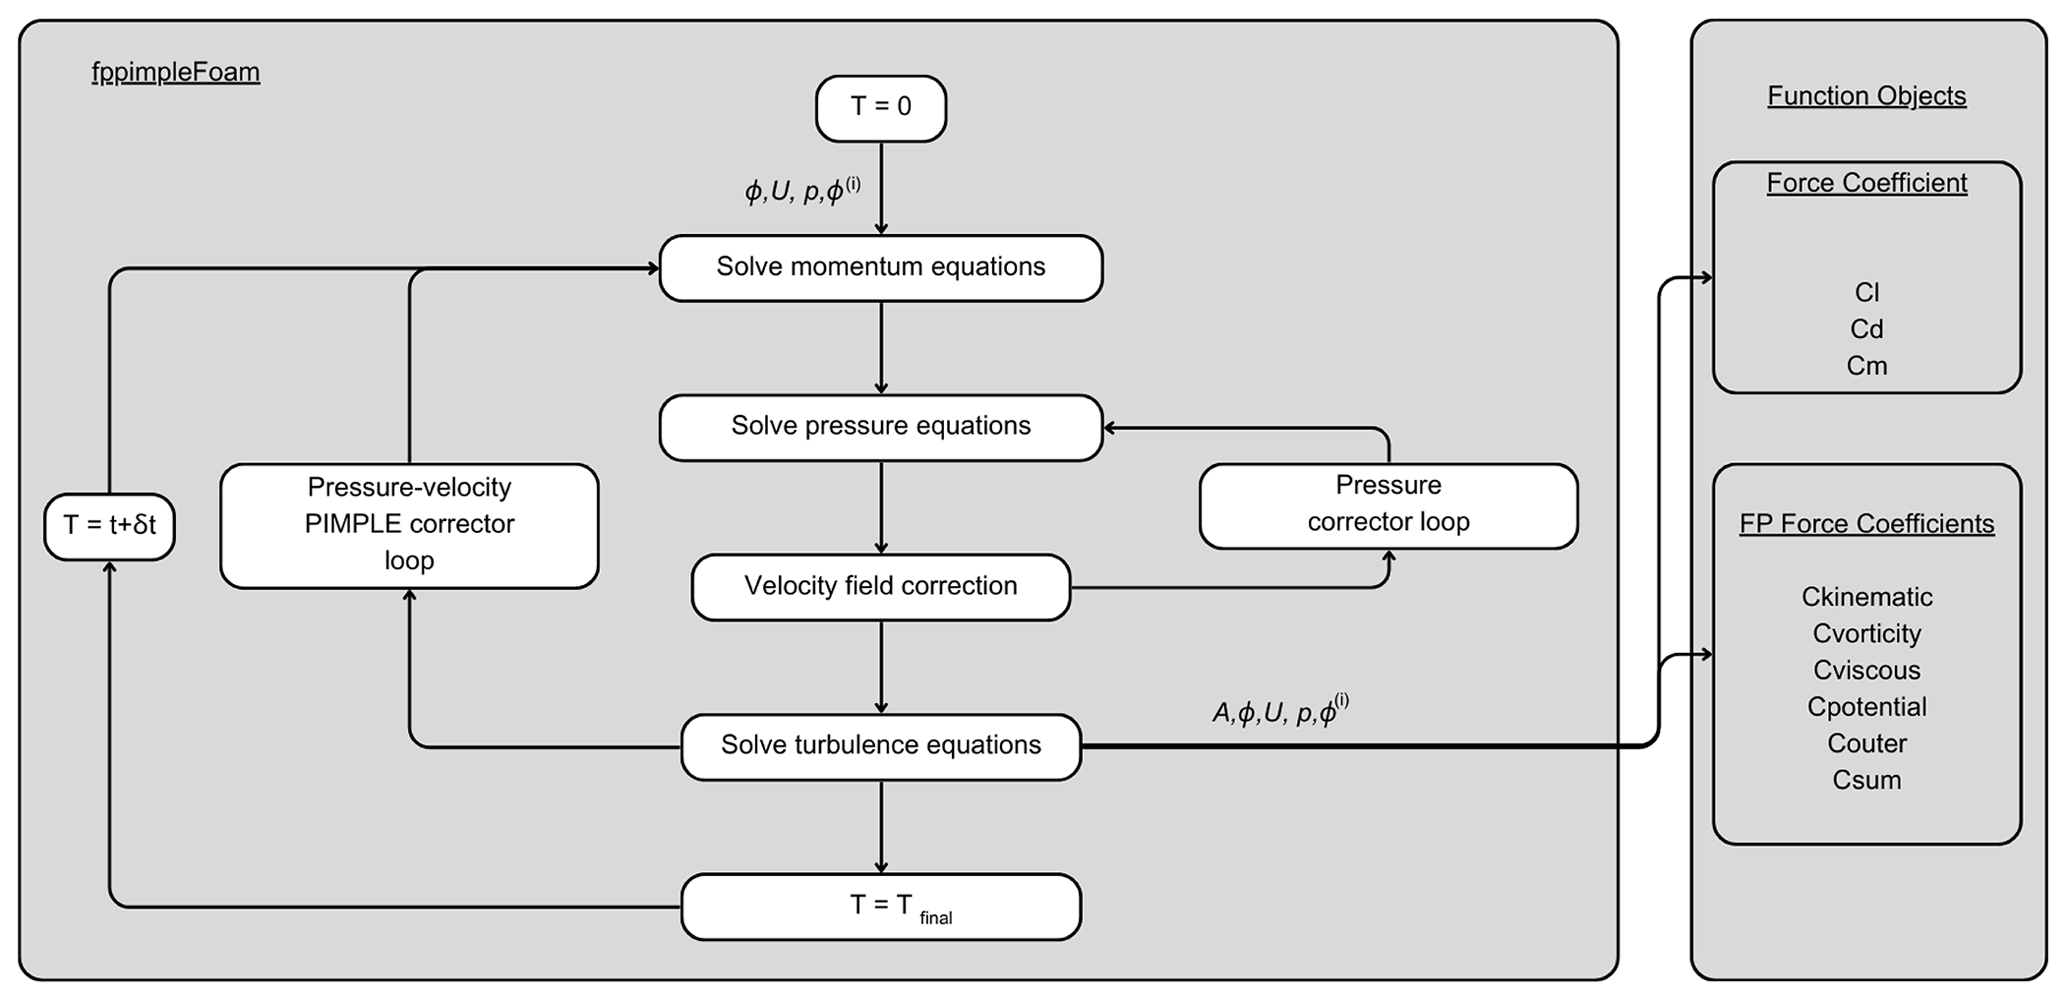
OpenFOAM consists of an incompressible solver named pimpleFoam, which solves for pressure and velocity according to the PIMPLE algorithm. PIMPLE is a combination of the Pressure Implicit with Splitting of Operator (PISO) and Semi-Implicit Method for Pressure-Linked Equations (SIMPLE) algorithms. The incompressible solver is modified, named fppimpleFoam, to calculate the velocity potential ϕ and the harmonic function ϕ(i). However, to solve ϕ(i), a boundary condition called fppotentialGradient is made, which satisfies Eq. (1). The variable i, being equal to 1, 2, and 3, partitions the force in the x, y, or z direction, respectively. The boundary condition is then given as input for the CFD simulation to consider the direction in which the force is partitioned. The auxiliary function ϕ(i) is introduced in the 0 folder, where the surface can be given the boundary type fppotentialGradient and the direction as (1 0 0) in order to partition the force in the x direction. Finally, a customised function object, fpforceCoeff, is derived from the force class. This function object calculates the different force coefficients for every time step according to Eq. (4), which can later be accessed for post-processing. The equations mentioned above work for an immersed boundary method. If a moving mesh is used to simulate the motion of the object, then a correction term is to be introduced as shown in Eq. (6):
This term corrects for the influence of mesh motion in the Lamb vector as seen in Eq. (2), thereby calculating the rotational characteristics purely arising from the fluid flow. The complete flowchart of the implementation is shown in Fig. 3. The source code of the implementation can be found in the repository (VimalKumar, 2023), where the fundamental description of running the OpenFOAM simulation is explained in detail.
3.1 Governing equations and numerical methods
The numerical simulations in the current study are performed using fppimpleFoam together with the function object fpforceCoeff. As it is a relatively simple geometry, a mesh with O-grid topology is made to carry out the simulations. The unsteady Reynolds-averaged Navier–Stokes (URANS) equations are solved using the following equations:
The corresponding velocity and velocity fluctuations are represented by U and , where the overbar represents a suitable Reynolds average. For laminar simulations, and , and the equations revert to the traditional Navier–Stokes equations. The time derivatives in the above equation are solved using an implicit second-order backward scheme, and the spatial derivatives are computed using a second-order Gauss linear scheme. For the transcritical Reynolds numbers, the two-equation k–ω shear stress transport (SST) turbulence model (Menter, 1994) is used to compute the turbulent kinetic energy, k; its specific dissipation rate, ω; and from these the eddy viscosity, νT. These are then used to close Eq. (7) with
where I represents the identity matrix, which is equivalent to Kronecker delta. A two-dimensional cylindrical section with a spring–mass–damper system, as a way to represent wind turbine towers, is considered to analyse the fluid–structure interaction in this study. The spring and the damper are attached to the centre of mass of the cylinder. The spring has a spring constant of ks, and the viscous damper has the damping coefficient c. The spring–mass–damper in this study gives the cylinder a single degree of freedom in the crossflow direction. The schematic representation of the system and the mesh are shown in Fig. 4. As OpenFOAM is a code designed for three-dimensional space, the mesh is extruded in the z direction with one cell thickness.

Figure 4Schematic representation of the computational domain: computational mesh (a), domain characteristics (b).
The governing equations for the motion of this rigid cylinder are represented as follows:
where ÿ, , and y represent the acceleration, velocity, and displacement in the y direction, respectively. The natural frequency of the system is determined by for a damping ratio defined as . The fluid–structure interaction (FSI) simulations are carried out across various reduced velocities U* for a single mass ratio m*. The reduced velocity is calculated as and mass ratio as .
The structural properties of wind turbine towers must be calculated accurately to perform FSI simulations, which are carried out using modal approximation. With a given variation in mass density and stiffness, the natural frequency of the tower can be calculated. This is calculated from Rayleigh's method using the principle of equating maximum potential energy and maximum kinetic energy in the vibration mode (Clough and Penzien, 1993). The wind turbine is considered to be a stepped tower with n segments to calculate the natural frequency, as shown in Fig. 5. The displacement of the tower at any height z and time t can be written as
where ψ(z) is the shape function, which represents the ratio of the displacement at the point z to the reference displacement y(t). The reference displacement y(t) is represented as a sinusoidal function with amplitude y0. As mentioned above, the maximum potential energy is equated to the maximum kinetic energy to obtain the natural frequency. The potential energy of the system is given by
where EI(z) is the flexural stiffness of the tower and ′ represents the space derivative. The kinetic energy of the non-uniformly distributed mass is
where represents the derivative in time. Upon substituting the displacement from Eq. (10), the maximum potential and kinetic energy can be written as
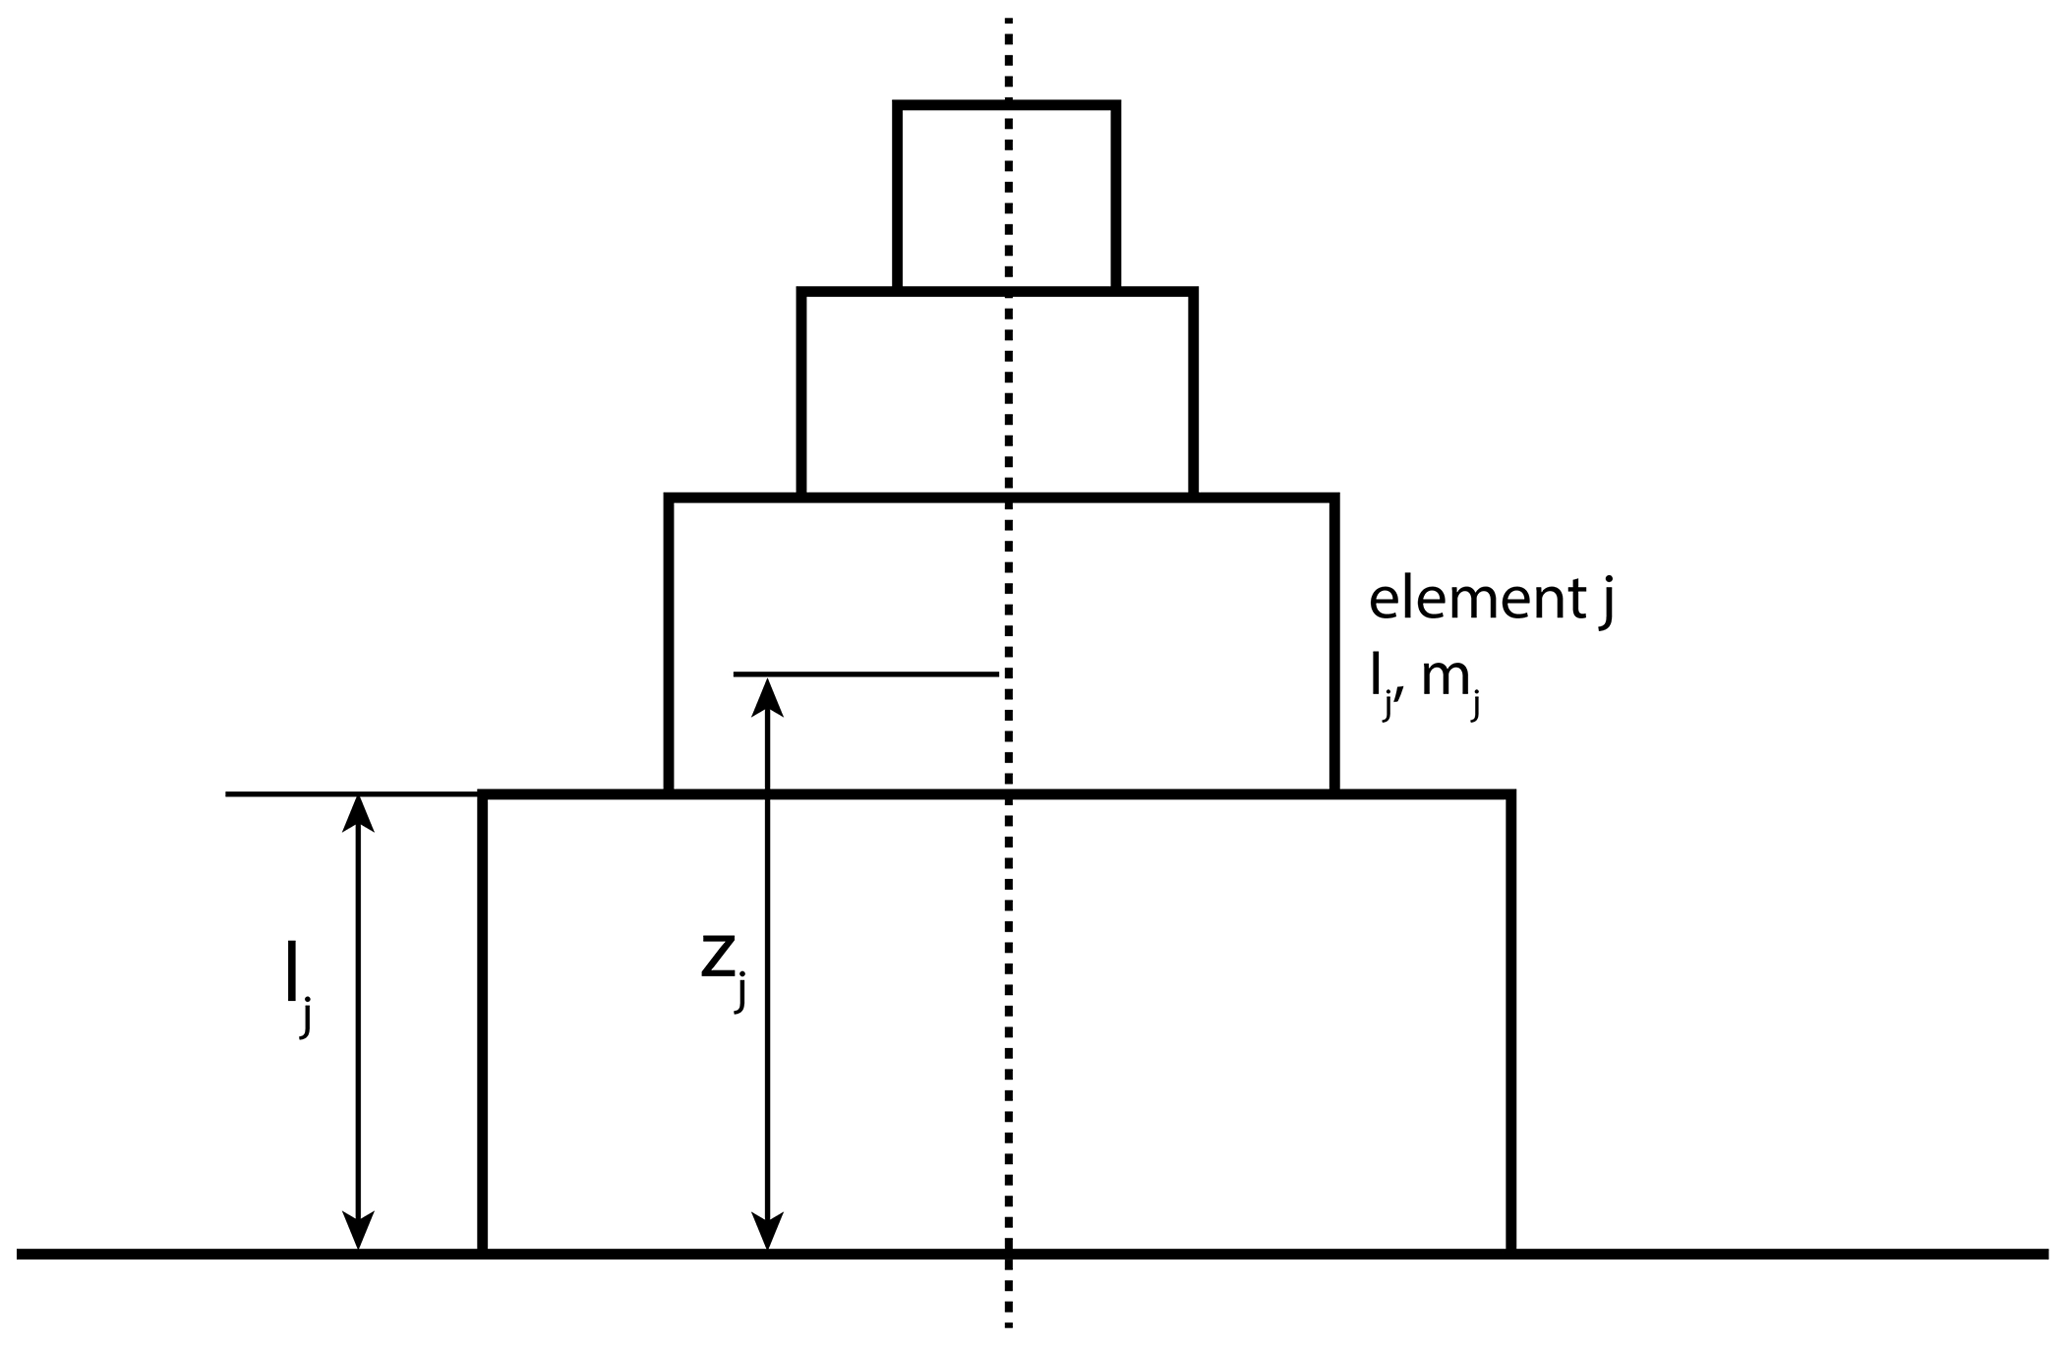
Figure 5Illustration of a stepped tower with element j, length of an element lj, height Zj, mass of the element mj, and moment of inertia Ij.
The natural frequency of the system can be obtained by equating Vmax and Tmax as
The exact mode shape of a uniform beam of length L undergoing vibration is taken as
By considering the different mass density m(z) over different turbine height l(z) for n sections and substituting Eq. (15) in Eq. (14), we get
where the moment of inertia of a section of the tower is calculated as
where Dout is the outer diameter of the cylinder, and Din is the inner diameter of the cylinder. Defining an equivalent moment of inertia and mass per unit length of the stepped beam,
Considering the tower top mass to be 0, Eq. (16) then condenses to
A strong coupling algorithm is utilised for the present study to give accurate results for modelling VIV. The structural parameters are computed for each iteration of the fluid solver, where the fluid solvers are sub-iterated for multiple iterations until the convergence criteria are met. The computed displacement of the cylinder moves the mesh according to a spherical linear interpolation scheme (SLERP).
3.2 Grid convergence study
The structured grid for the computational domain is generated using the blockMesh module of OpenFOAM and is shown in Fig. 4 (left). Richardson's extrapolation method (Roache, 1994) is used for calculating a grid convergence index (GCI) and quantifying the errors from the spatial discretisation of the mesh. This is a standardised method to analyse the numerical solution's dependence on spatial discretisation. Three different grids are compared by having doubled the number of elements in the domain and carrying out h refinement. The first cell height of the mesh, ywall, is m, satisfying the near-wall dimensionless distance (y+) to be less than or equal to 1 for every mesh. The domain consists of an O grid of 5 D diameter with the same degree of refinement throughout the meshes with a different number of elements. The ratio of the number of elements in a dimension between two meshes (coarse to medium and medium to fine) is adjusted to 1.26 in order to achieve an approximate total number of points of around two between them. The details of the meshes are given in Table 1.
Table 1Parameters of three different grids used in the grid convergence study.
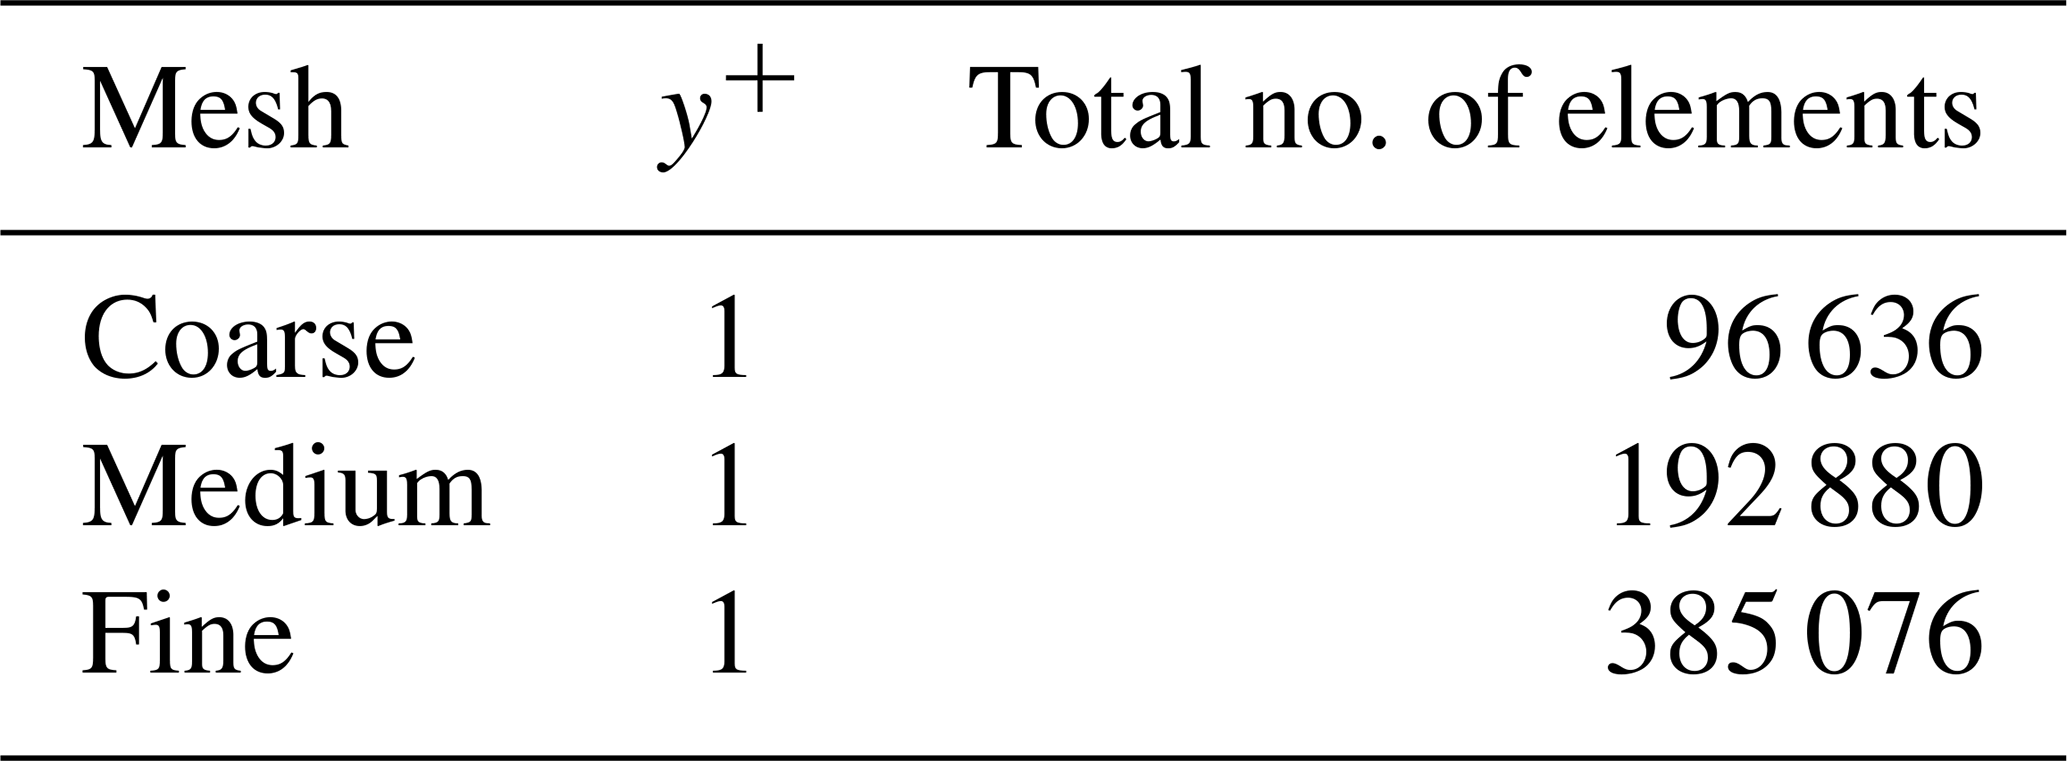
The pressure coefficient around the cylinder section is considered for the GCI study for a Reynolds number of 3.6 million, as the paper mainly focuses on the VIV at transcritical Reynolds number regimes. Figure 6b shows the coefficient of pressure along the cylinder surface of the medium grid with the error bars obtained using the GCI. The normalised x coordinate x* is the x coordinate normalised to the chord of the cylinder, as . The maximum error from the GCI study is found to be 2.45 %, but the mean error is calculated to be 0.68 %. The figure also shows the variation in pressure along the cylinder surface for various meshes in comparison to the study from Viré et al. (2020). It can be seen that there is hardly any difference in the pressure along different meshes until the flow separates. However, the coarse mesh underpredicts the pressure coefficient after the separation point in comparison to other meshes. Furthermore, the medium and fine meshes predict the separation point to be 112.2° () and 111.8° (), respectively, in comparison to 111° () from the literature. Hence, the meshes are discretised with acceptable error, and further simulations are carried out with the medium mesh, as this mesh balances the complexity of the mesh motion and computational costs.
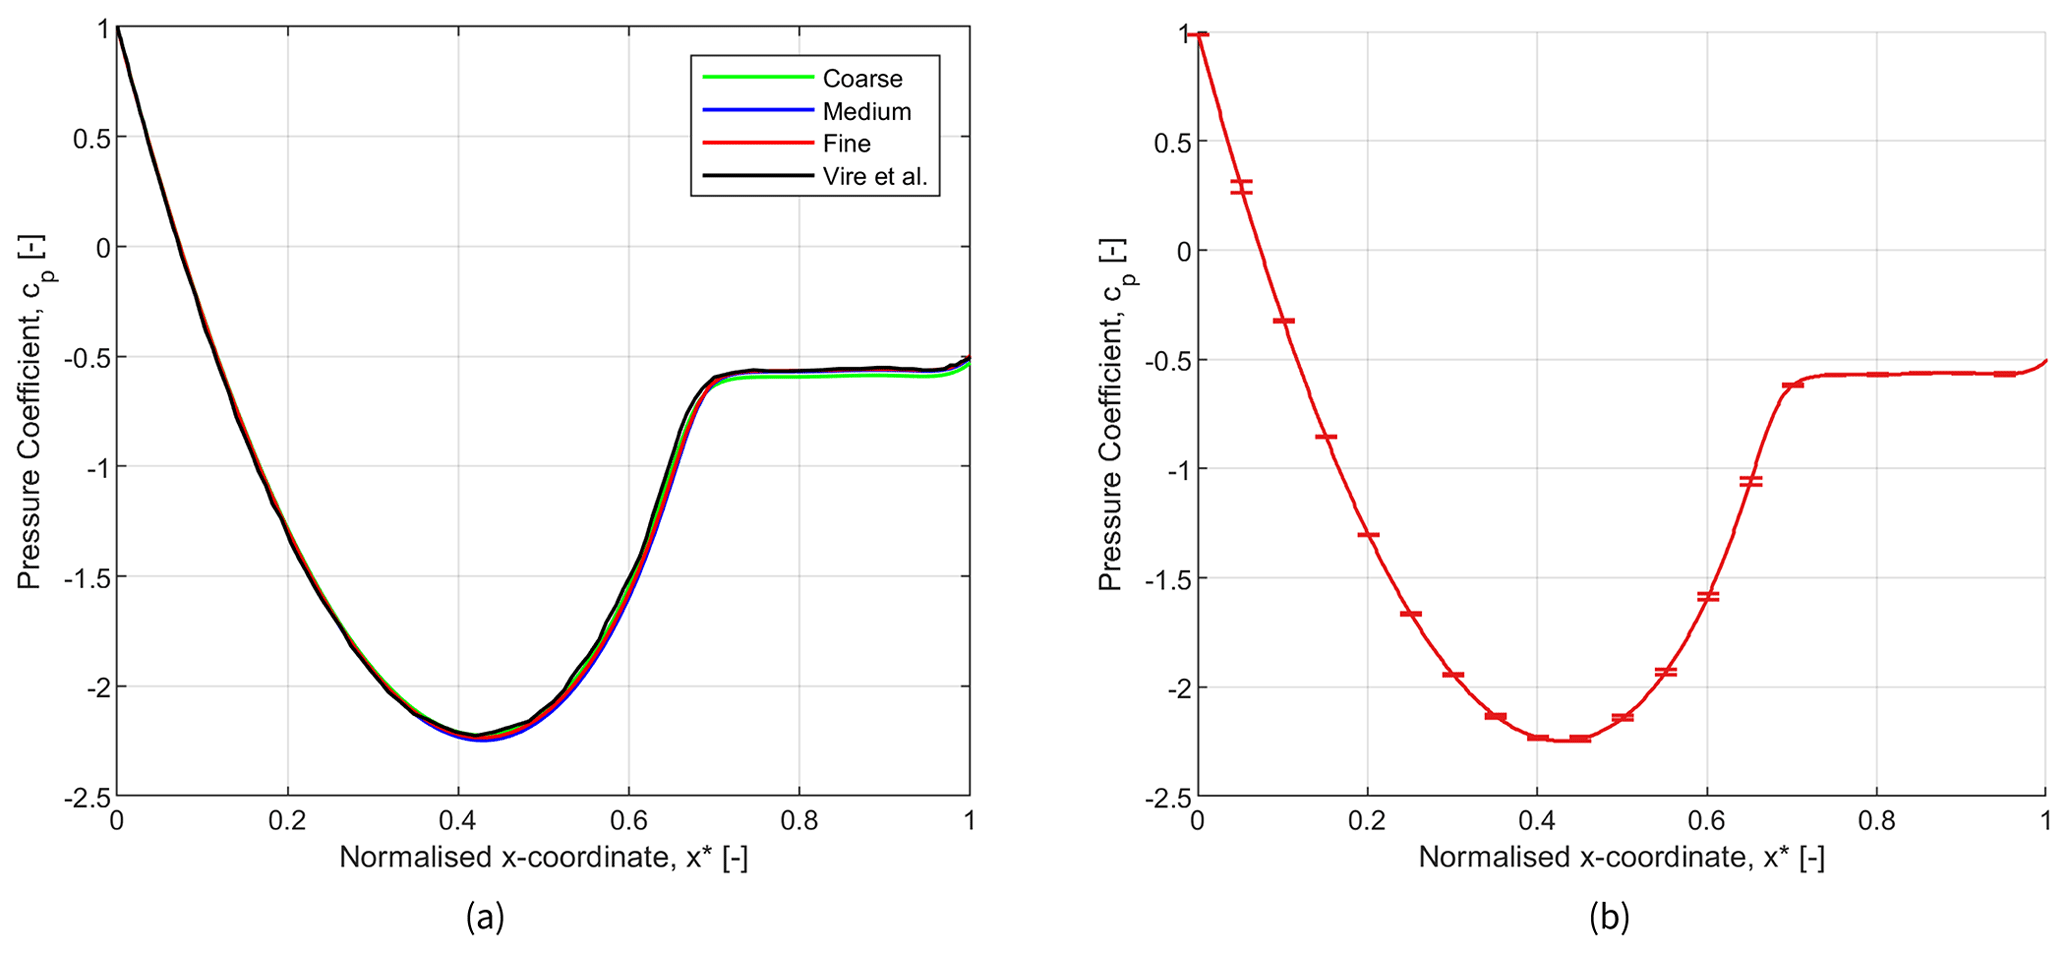
Figure 6(a) Pressure coefficient along the surface of the cylinder section for coarse, medium, and fine meshes in comparison to Viré et al. (2020). (b) Pressure coefficient along the surface of the cylinder section with error bars, using the GCI on the medium grid.
Simulations are conducted for both laminar and turbulent Reynolds number regimes. Initially, simulations in the laminar regimes are performed to validate and verify the code implemented in OpenFOAM. Subsequently, simulations are carried out to replicate realistic wind conditions encountered by wind turbines. The focus of these simulations is primarily on free vibrations, mirroring real-world scenarios.
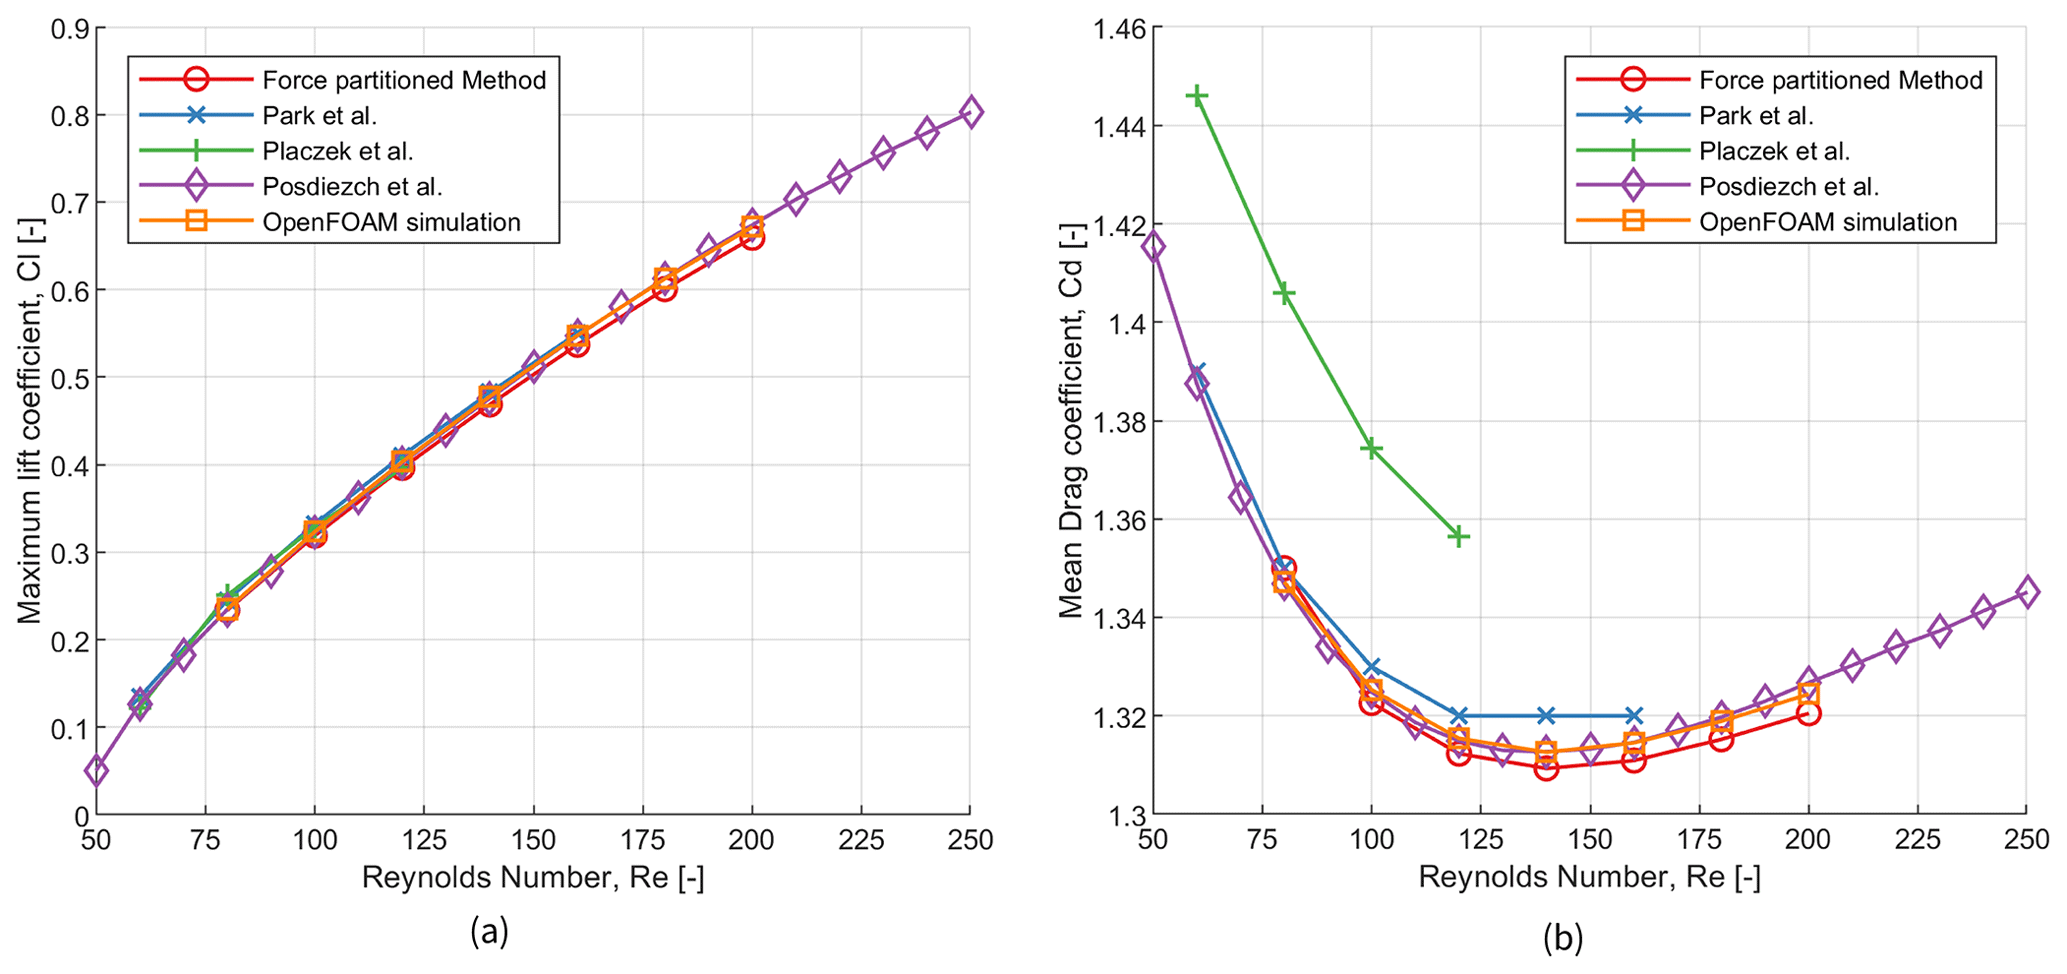
Figure 7Variation in (a) maximum lift coefficient and (b) mean drag coefficient for a fixed cylinder at different subcritical Reynolds numbers compared against the literature: Park et al. (1998), Placzek et al. (2009), and Posdziech and Grundmann (2007).
4.1 Flow in the laminar regime
A cylinder with a diameter of 2 m is considered for the simulations with subcritical Reynolds numbers. The simulations are performed for Reynolds numbers ranging from 80 to 200. The cylinder is considered to be rigid and steady, and hence no structural properties are defined. The time step used for all the simulations maintains a Courant–Friedrichs–Lewy (CFL) number equal to 0.7. The force coefficients are then validated with results from the literature as shown in Fig. 7, where numerical simulations are performed using second-order finite-difference or volume methods (Park et al., 1998; Placzek et al., 2009) and a spectral element method (Posdziech and Grundmann, 2007). The lift and drag coefficients calculated from the sum of the various force coefficients are marked as the force-partitioning method, and those obtained directly from the OpenFOAM simulation are marked accordingly. The lift and drag coefficients calculated from the OpenFOAM post-processing function tool are explained in Eq. (20), where u and v are the velocity components in the x direction and y direction, respectively. The lift and drag forces are defined as Fl and Fd, respectively, and the surface area of the cylinder is defined as S. It can be seen that the sum of the force coefficients matches well with both the data from the literature and the present OpenFOAM simulation results.
The flow around the cylinder subjected to motion in the crossflow direction is also validated and is shown in Fig. 8. For a mass ratio of 2 and a damping ratio of 0.007, the cylinder is subjected to a motion with various reduced velocities between 2 and 15 at a constant Reynolds number of 150. It can be seen that there is a jump in the amplitude at a reduced velocity of 4, where the frequency of vortex shedding matches the natural frequency of the cylinder. The maximum amplitude attenuates for higher velocity ratios and approaches an almost-constant amplitude from a velocity ratio of 10 onwards. This matches well with results in the literature (see e.g. Carmo et al., 2011).
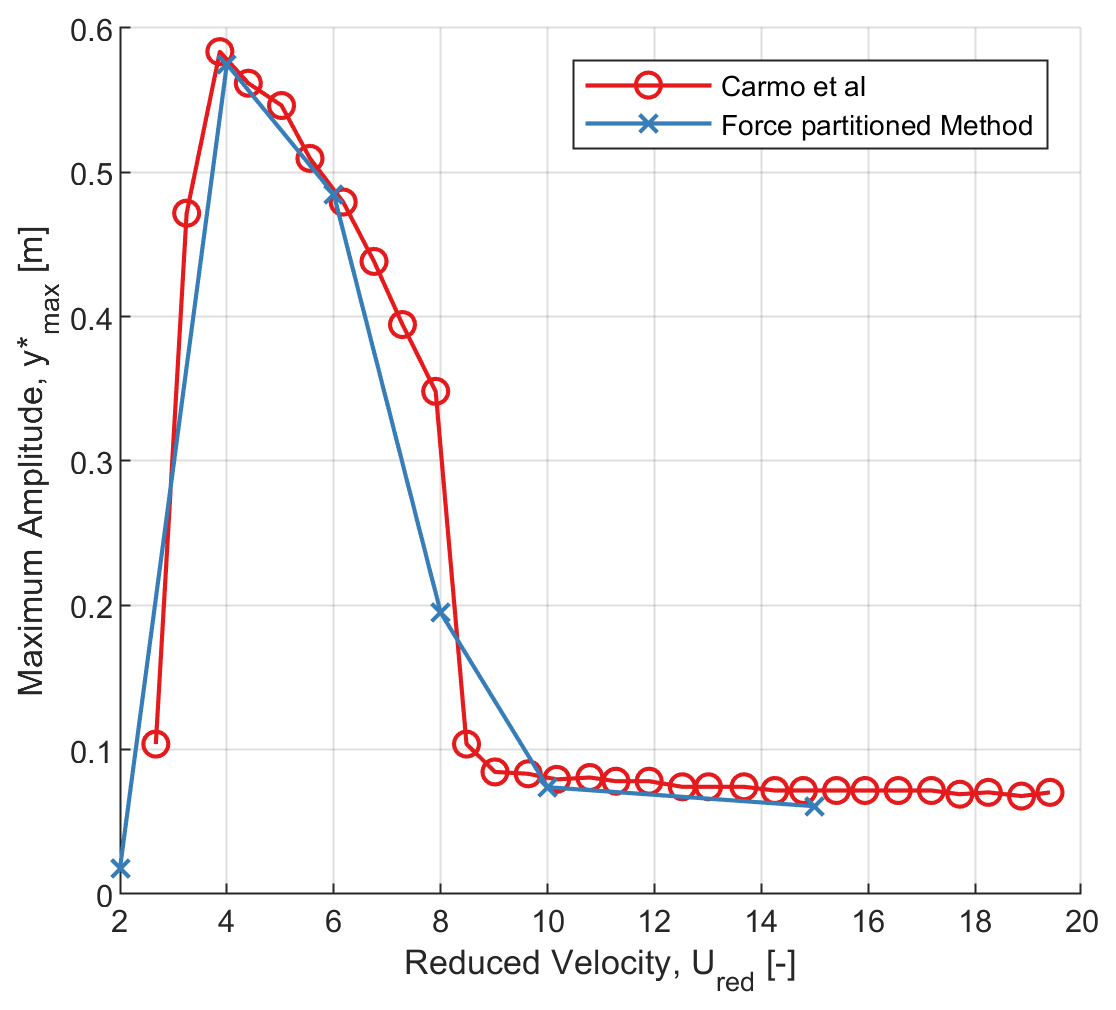
Figure 8Comparison of the variation in the non-dimensional maximum amplitude of a two-dimensional cylinder for various reduced velocities with results from Carmo et al. (2011); Re=150, , and c=0.007.
The implementation of the force-partitioning method is verified against the calculation of the total force coefficient calculated by OpenFOAM. The solvers in OpenFOAM are well-validated and benchmarked, which is one of the main motivations for verifying the code implementation with the OpenFOAM solver itself. Figure 9 shows the simulation results along with the partitioned forces. The forces are partitioned in the y direction, corresponding to the direction of the lift force on the cylinder. As shown in the figure, the lift force matches well with the sum of the force coefficients. The slight difference between the total lift coefficient and the sum of the force coefficient is due to the discretisation errors in computing the forces with different methods (Viré and Knaepen, 2009).
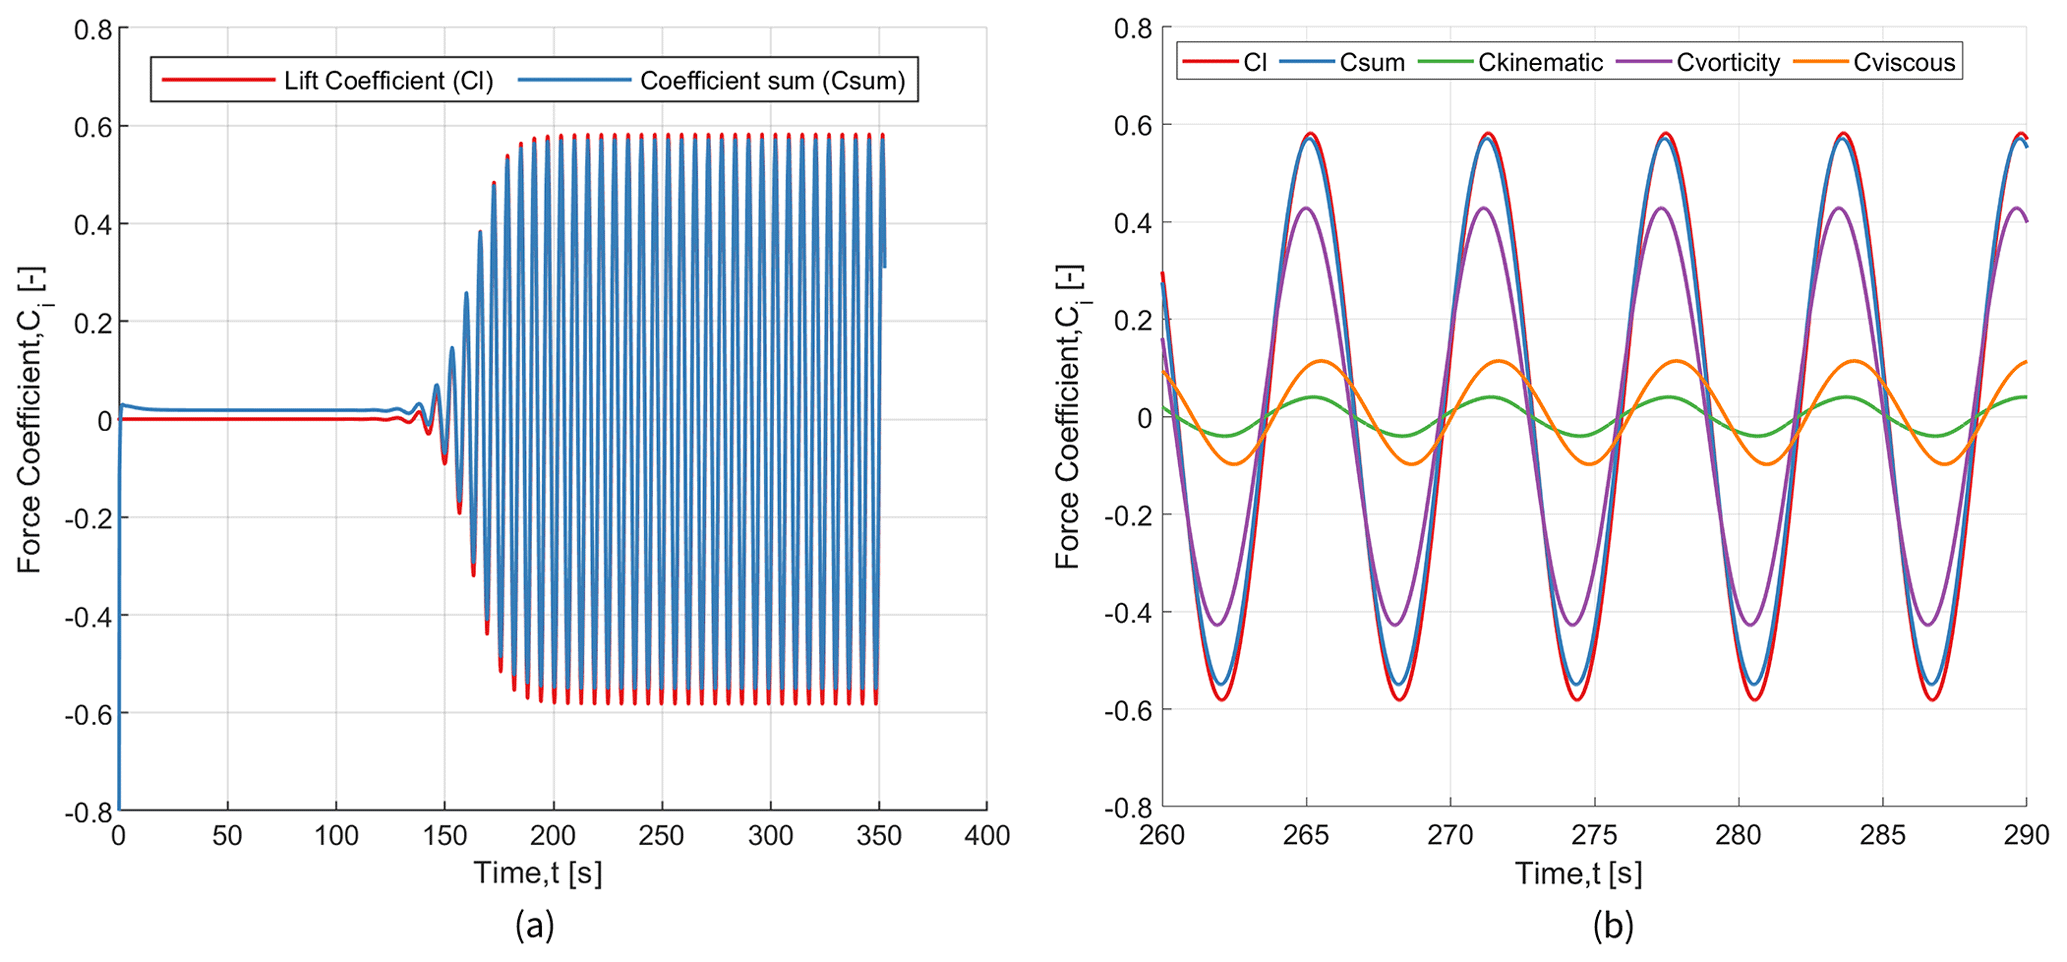
Figure 9(a) Comparison of the lift force coefficient against the sum of the force coefficients from the force-partitioning method. (b) A zoomed-in snippet is shown, which breaks down the total force coefficient into partitioned force coefficients.
When the total force is separated based on different coefficients, it becomes evident that the predominant factor influencing the force is the vortex-induced force. The force due to the vortices formed behind the cylinder is in phase with the total force, and it drives the total contribution. The other major contributors are the forces due to the motion of the cylinder and the viscous force. Depending on the oscillation frequency, the force could be in phase with or out of phase from the motion of the cylinder, which is explained in more detail in Sect. 4.2.1. The results obtained above are in accordance with the results observed by Menon and Mittal (2021) for subcritical Reynolds numbers.
4.2 Flow in the turbulent regime
The laminar flow regime is far from a realistic scenario for wind turbine towers. Therefore, this section analyses the motion due to VIV of a section representative of the tower top of the IEA 15 MW reference wind turbine (Gaertner et al., 2020). The characteristics of the top section of the IEA 15 MW reference wind turbine are chosen as the analysis of a three-dimensional structure in a two-dimensional cylinder is not straightforward, and it simplifies the overall analysis. The tower top section is chosen as it experiences the maximum displacement in the scenario of VIV and is not due to being a critical section during a lock-in.
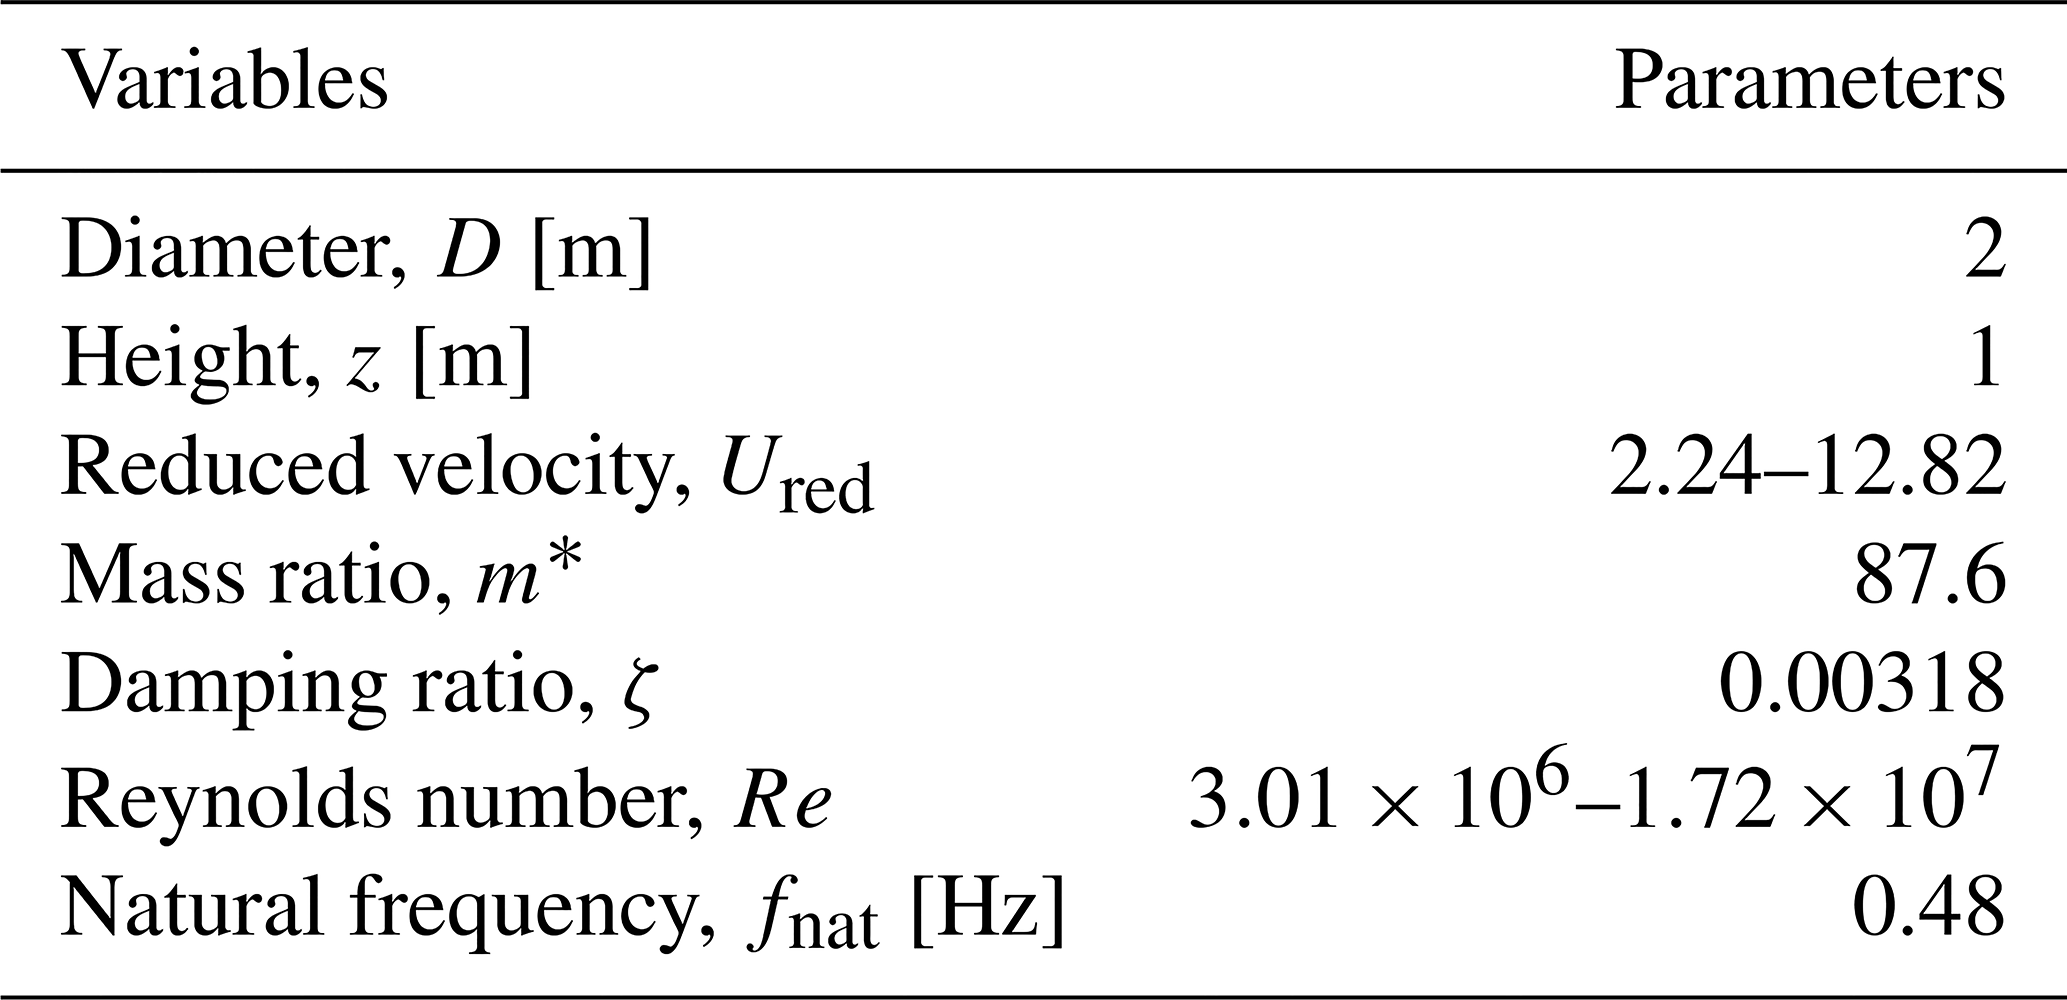
Following the procedure explained in Sect. 3.1, the natural frequency of the tower is calculated to be 0.48 Hz. The parameters used for the simulation are mentioned in Table 2. The fppimpleFoam solver is employed to simulate and analyse the flow behind the two-dimensional cylinder, which gives insights into the various forces acting on the cylinder for the transcritical Reynolds number regime. The cylinder has 1 degree of freedom in the y direction. For the mass–damper system assumed for the motion of the cylinder, the parameters are tuned to obtain the required structural properties compiled in Table 2. The height parameter shows the single cell thickness in the z direction as mentioned in Sect. 3.1.
Table 2Simulation parameters used for the free-vibration simulations of the IEA 15 MW reference wind turbine tower section.
In order to carry out the simulations for the turbulent Reynolds number regime, the k–ω SST turbulence model was chosen, as it is reported in the literature to be a good choice for flows with flow separation. The model also calculates the turbulent kinetic energy k and the turbulent dissipation rate ω at every time step. The initial value of the turbulent kinetic energy is calculated as
where the turbulence intensity, TI, is taken as 0.03, and the inlet velocity is calculated depending on the reduced velocity used in the simulation. The turbulent dissipation rate is calculated as
where is taken as 10, and μ is the dynamic viscosity of the fluid. The mesh parameters are explained in Sect. 3.2. The turbulence parameters at the cylinder boundary are taken as m2 s−2, and ω is calculated as
where β1=0.075 (Menter, 1992). The boundary conditions for k and ω are Dirichlet boundary conditions at the inlet with values equal to the initial values as calculated above. A Neumann boundary condition is imposed for both the variables at the outlet.
As explained in Sect. 3.2, the simulations performed at Reynolds number serve as a validation for the simulations at the turbulent regime. The force coefficient, pressure distribution, and separation point align with the results observed from the work of Viré et al. (2020).
4.2.1 Free vibration
As mentioned in Sect. 3.1, the simulations at turbulent Reynolds numbers are carried out with a single degree of freedom with translational motion in the y direction. The cylinder has structural properties as mentioned in Table 2, and the simulations are performed for 12 different reduced velocities. The Reynolds number varies from 3 million to 17.2 million.
Figure 10 shows the variation in the force coefficients (Fig. 10a) and the maximum amplitude (Fig. 10b) for various velocity ratios. The Strouhal velocity is represented as Ust, which is defined as the wind velocity for which the vortex shedding frequency equals the natural frequency of the cylinder. The lift coefficient experiences a sharp rise when the velocity ratio reaches a value of unity. This also results in a peak in the normalised maximum amplitude of the cylinder, where it almost reaches 0.7. The normalised maximum amplitude becomes significantly less when is 1.2 or higher.
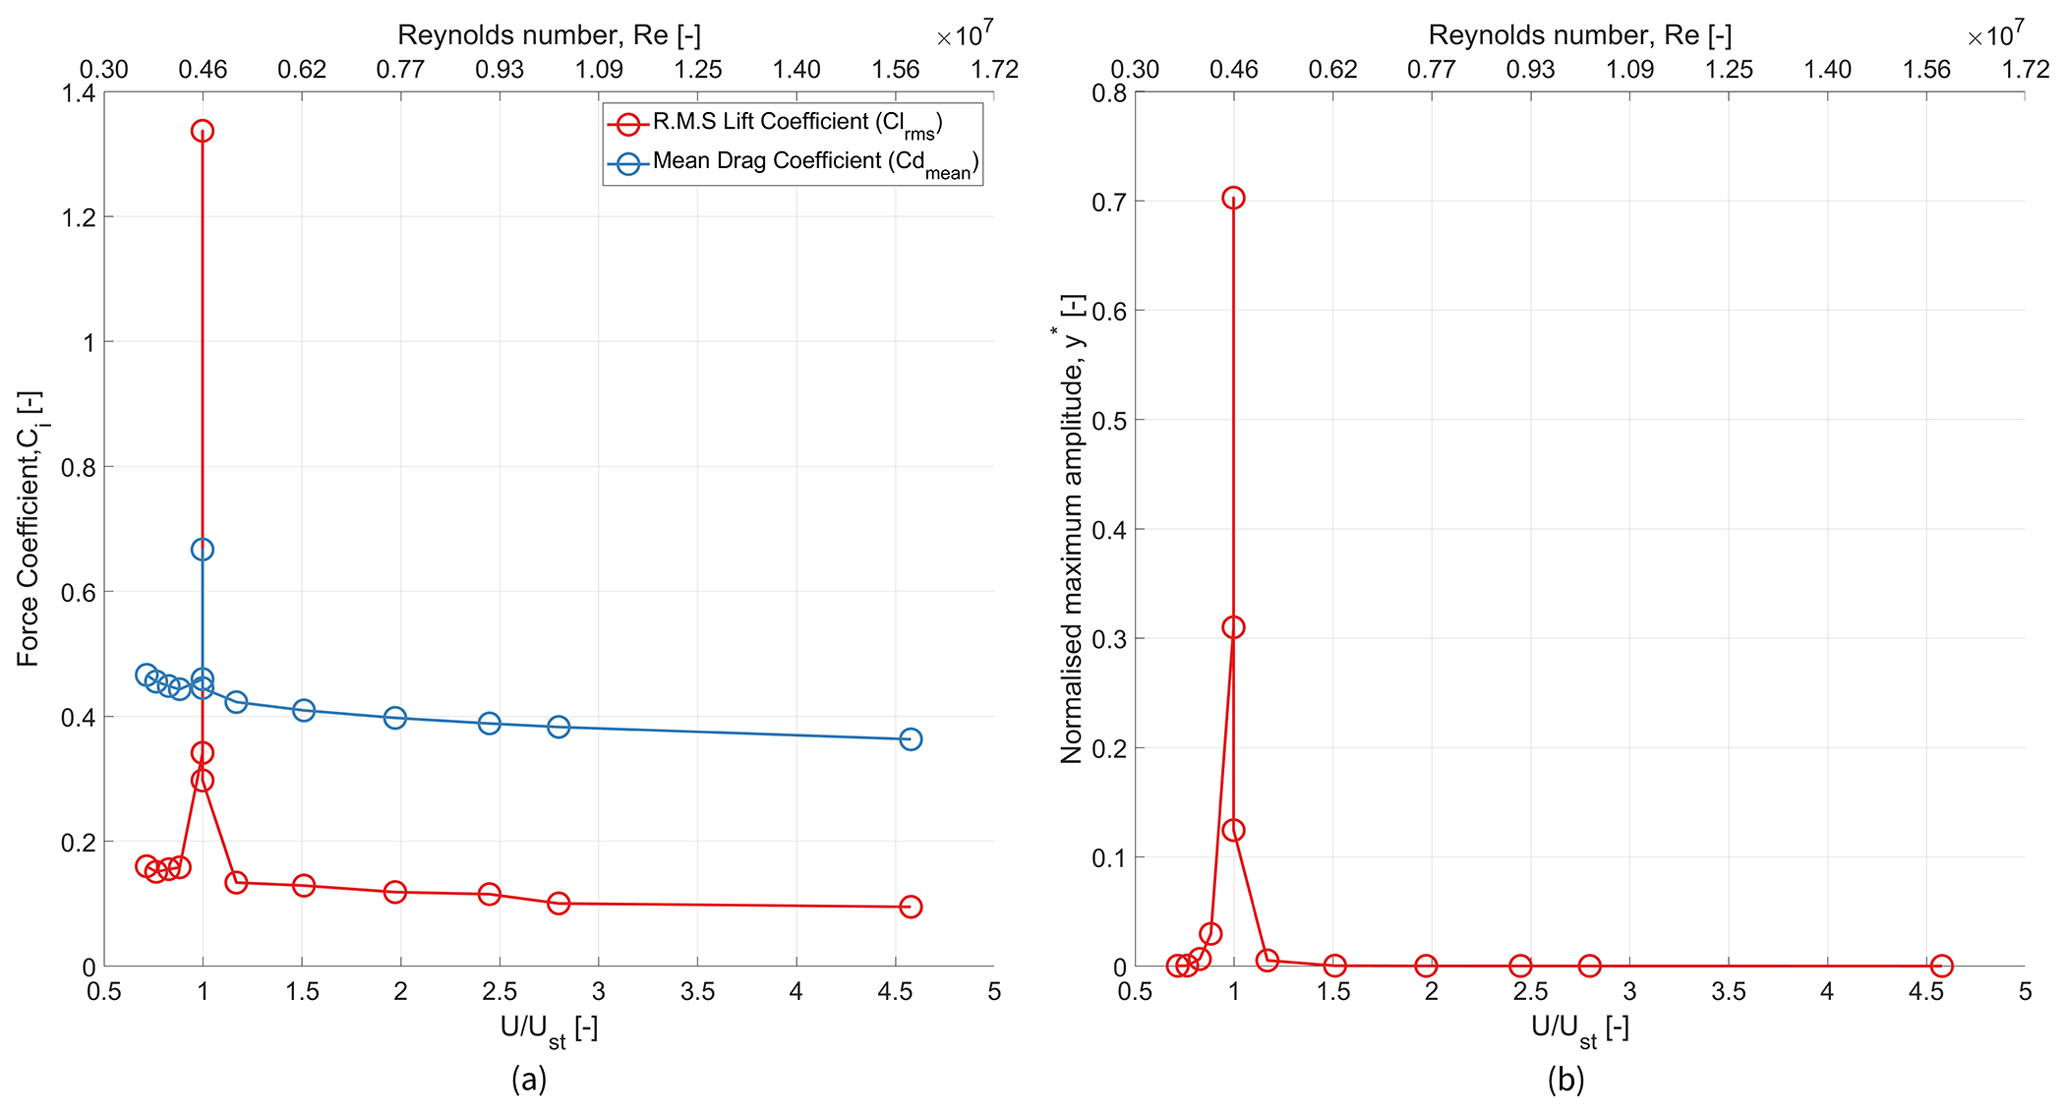
Figure 10Variation in (a) the root mean square of the lift coefficient and mean drag coefficient and (b) the normalised maximum amplitude for various velocity ratios and corresponding Reynolds numbers.
Figure 11a and b show the behaviour of various partitioned forces at a reduced velocity of 2.24. It can be seen from Fig. 11a that the main contributor to the lift force is the force due to vorticity. However, for the laminar (low-Reynolds-number) flow case, other significant contributors to the total force were present, i.e. the force due to added mass and the viscosity of the fluid. The zoomed-in figure from Fig. 11b shows that, for the turbulent (high-Reynolds-number) case without cylinder motion, the influence of the vortex-induced force on the total force is the primary or rather the only significant contributor to the total force.
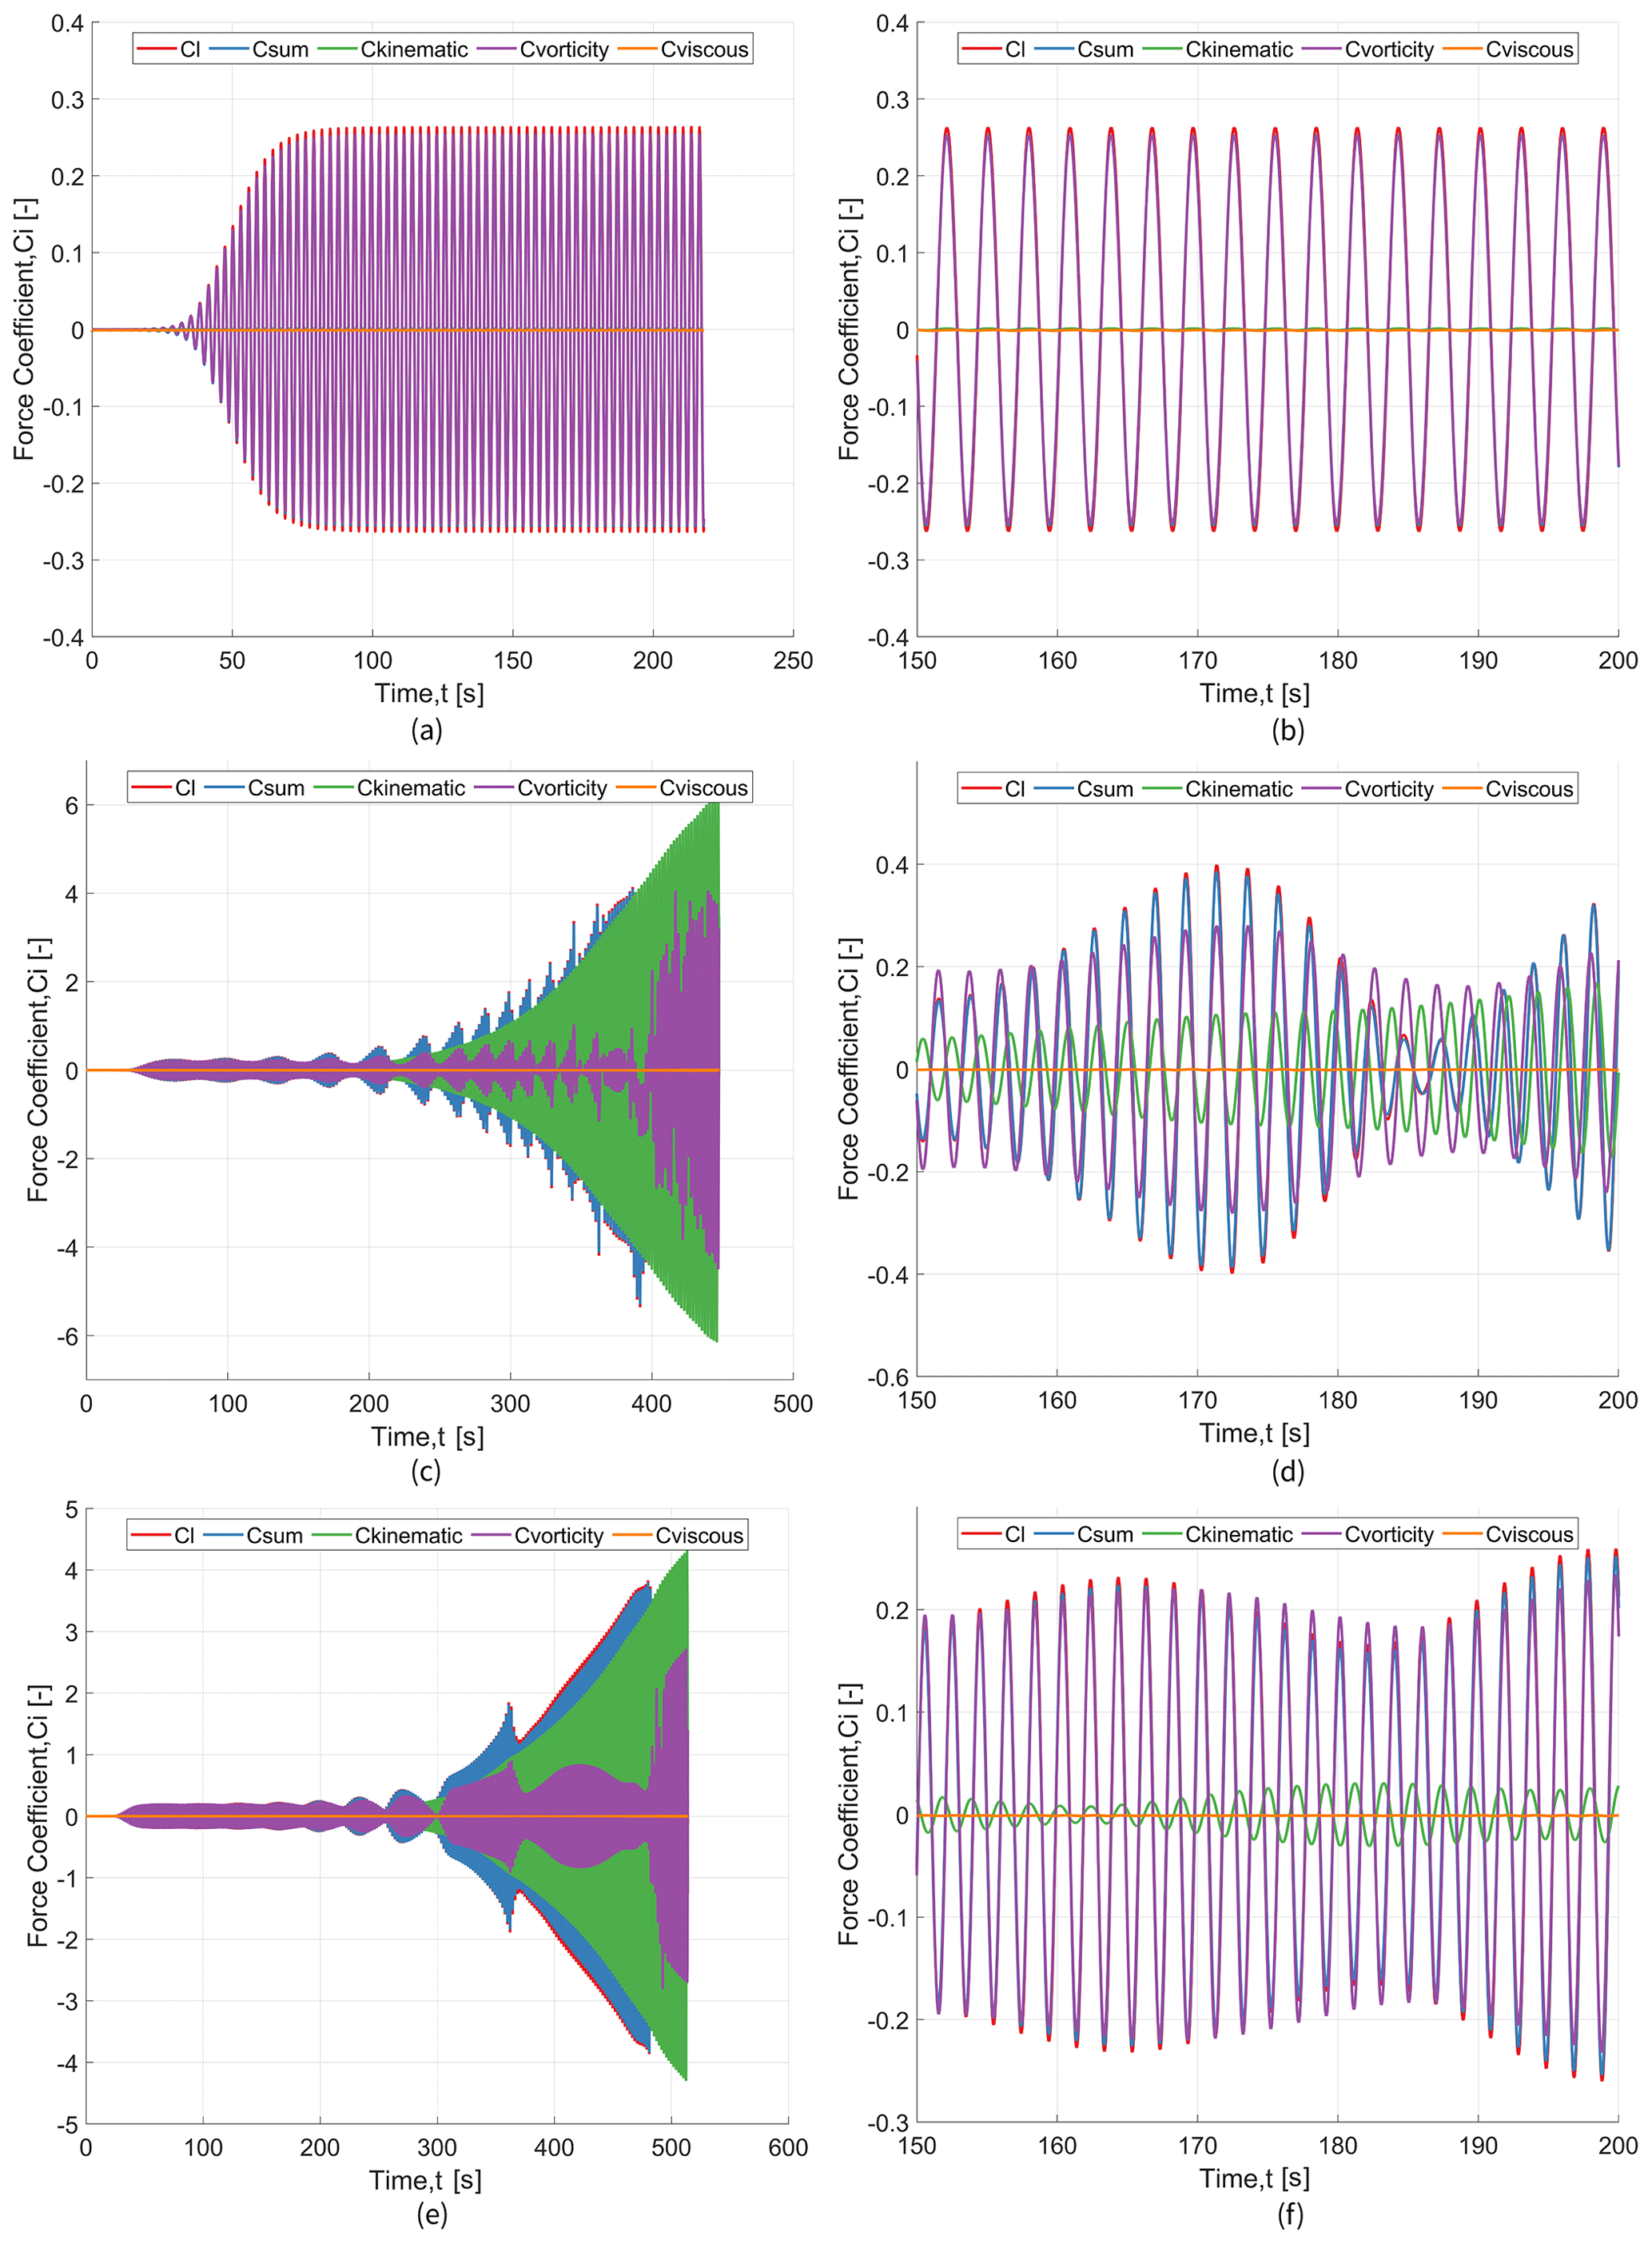
Figure 11(a, c, e) Comparison of the lift force coefficient with the partitioning coefficient at Ured=2.24 (), Ured=2.88 (), and Ured=3.20 (), respectively. (b, d, f) Zoomed-in snippets of the time series of (a) ,(c), and (e), respectively.
As the free-stream velocity reaches the Strouhal velocity, the behaviour changes drastically, as seen from Fig. 11c and e. As the lift force develops a beating pattern, the vortex-induced force follows a similar behaviour. But the kinematic force is the dominating force overall. The magnitude of the lift force reduces mainly due to the out-of-phase behaviour between the kinematic force and the vortex-induced force. This is a similar behaviour for both values of the velocity ratio: and . The kinematic force is equally dominating as the oscillation continues, but any reduction in the total lift force is due to the out-of-phase trend of the two major force contributors, as can be seen in Fig. 11d and f.
Figure 12 shows the vorticity formed behind the cylinder when the lift force develops a beating pattern. Figure 12a and b show the wake pattern at maximum positive displacements in a cycle, where Fig. 12a depicts the time when the vortex-induced force is in phase with the kinematic force. However, Fig. 12b illustrates the wake pattern when the two forces have a significant phase difference. It can be observed that vortices are shed from the bottom part of the cylinder when the forces are in phase. In contrast, vortices are shed from the top of the cylinder when the kinematic force and vortex-induced force are out of phase. The wake pattern development observed here is similar to that reported in previous studies by Viré et al. (2020).

Figure 12Non-dimensional vorticity magnitude for at the maximum positive displacement observed when the lift force develops a beating pattern and when the kinematic force and vortex-induced force (a) are in phase and (b) have a phase difference between them.
Figure 11 illustrates the changes in partitioned forces as the velocity ratio approaches and surpasses 1. The force coefficient amplitudes exhibit heightened values as the ratio nears unity, primarily attributed to the vortex-induced force. However, reductions in amplitude are influenced by the kinematic force. This pattern reduces as the ratio exceeds 1.2.
As seen in Fig. 11, the simulations were stopped once the vortex-induced force became completely transient in nature. The system becomes self-exciting, and the fluid imparts energy to the structure if the structural damping coefficient is not enough to suppress the aerodynamic excitement. This can be analysed with a longer simulation time, which is out of the scope of the current study due to increased time and cost. Moreover, the simulations are carried out with 20 cores, where one of the expensive simulations required approximately 4950 CPU hours for a velocity ratio of and 2520 CPU hours for , using the Intel® Xeon® CPU E5-2670 v2 processor.
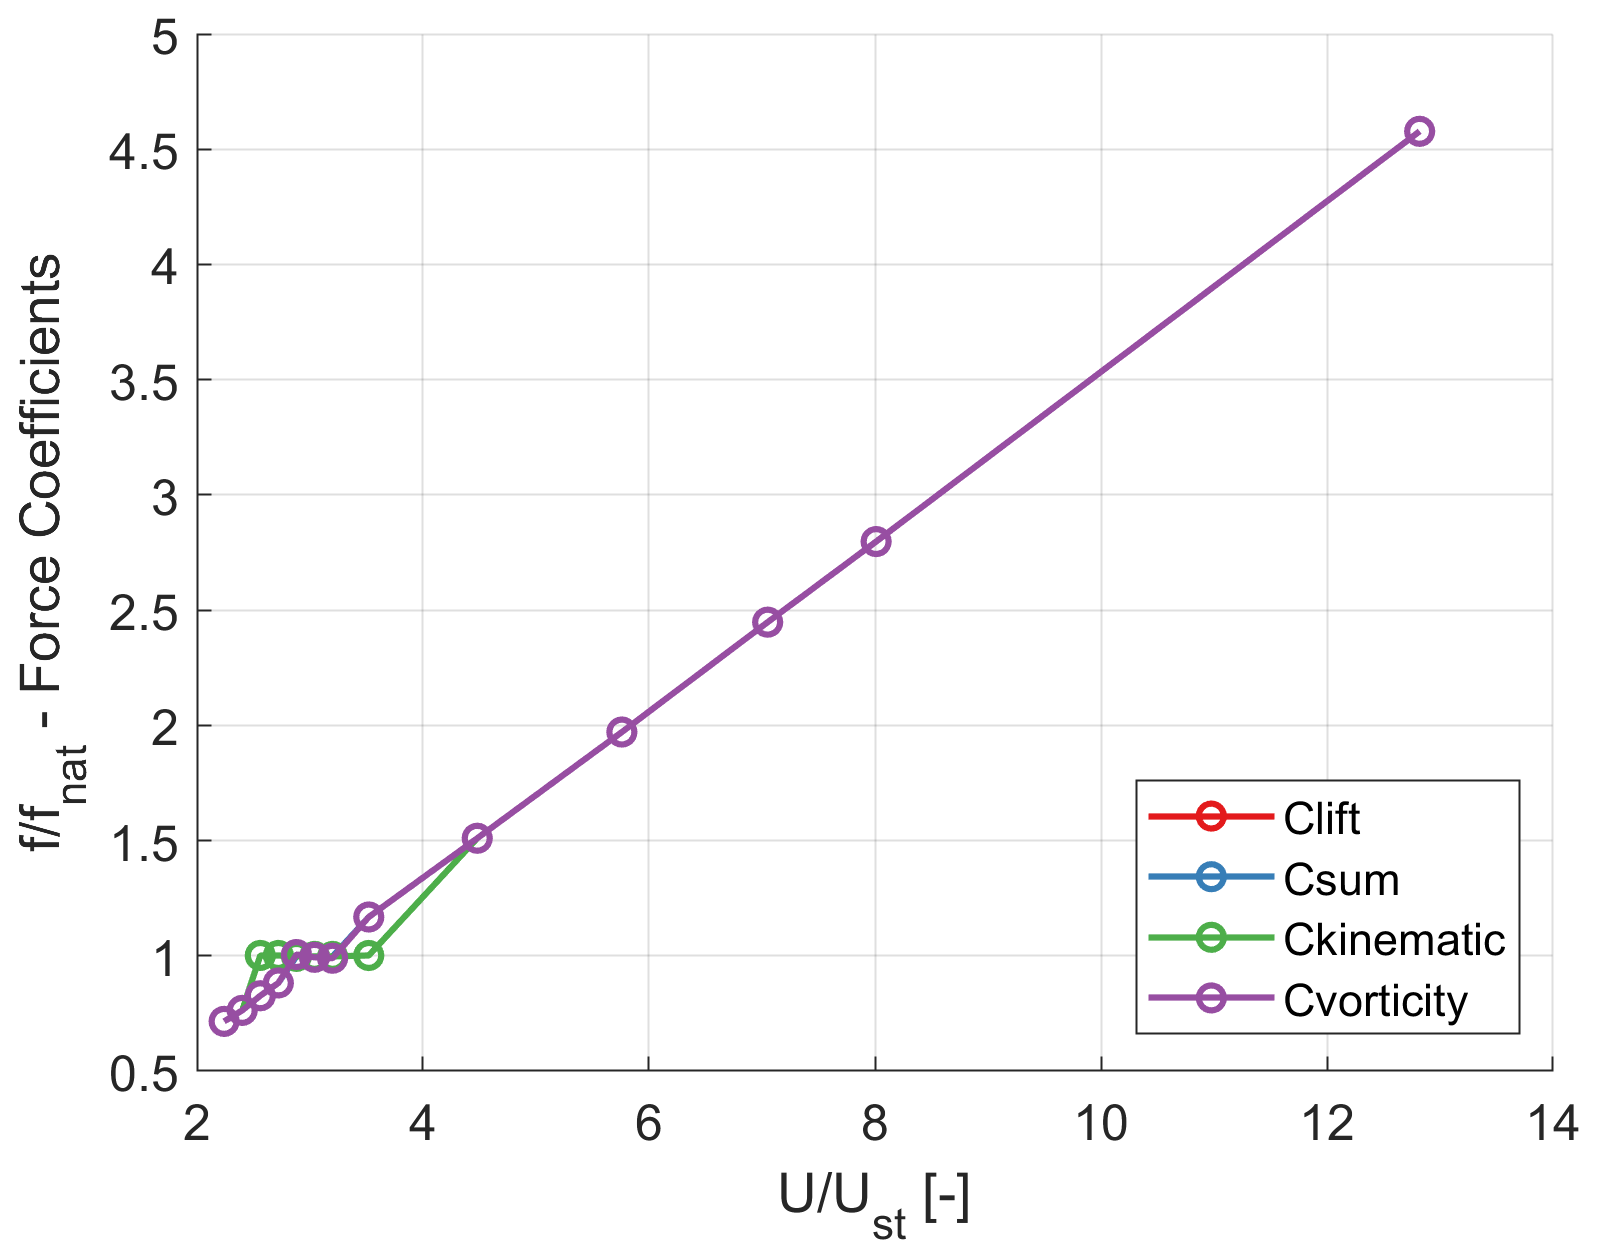
Figure 13 shows the frequency ratio of forces observed at various normalised velocities. It can be observed that the kinematic force fluctuates at the natural frequency of the structure, even before the structure starts to oscillate at its natural frequency. This provides the reason for the erratic fluctuations in the lift force. This behaviour continues even after the natural frequency is reached until almost a frequency ratio of 1.2. This suggests that it may be important to analyse the phase difference of the forces from the displacement of the structure. Understanding the nature of the phase differences along with the energy mapping can give more insights into the nature of the oscillations experienced by wind turbine tower sections, as is shown in the next section.
4.2.2 Phase difference and energy transfer
The phase difference gives a first look into how energy transfers between the fluid and the structure. From Fig. 14, it can be seen that there is a considerable phase difference between the lift force and the displacement of the cylinder as the velocity ratio reaches unity. By breaking down the contribution from the different forces, it can be seen that the vortex-induced force is the driving factor during this scenario. However, the phase difference between the kinematic force and the cylinder displacement is slightly negative when the velocity ratio is approximately unity. This could be interpreted as energy being added to the system primarily from the force due to the vortex shedding. This shows the influence of vortices in driving the oscillation, especially around the natural frequency of the system. Meanwhile, the viscous force has a constant negative phase difference with a sink around the velocity ratio of unity. This shows the damping nature of the force throughout, and it is significantly influenced when the system oscillates at its natural frequency.

Figure 14(a) Phase difference between dominant forces and the displacement of the cylinder section for various velocity ratios. (b) Zoomed-in snippet between .
A deeper analysis of the energy transfer between the fluid and the system provides more insights into the nature of each partitioned force. According to the literature (Morse and Williamson, 2009; Menon and Mittal, 2021; Kumar et al., 2016), the non-dimensional energy extracted by the cylinder can be written as
where Ci is the partitioned force, y* is the non-dimensional velocity of the cylinder, and dt is the time step. A positive energy transfer means that the system takes energy from the fluid. Furthermore, this provides better insight into the major contributor to the motion of the cylinder, along with the initiation and sustenance of the oscillations. The energy transfer is analysed for the velocity ratios of interest (, 1, 1.05), which are close to the Strouhal velocity. Figures 15–17 show the energy transfer per time step and the mean transfer during the oscillation cycles for the lift force, the kinematic force, the vortex-induced force, and the viscous force.
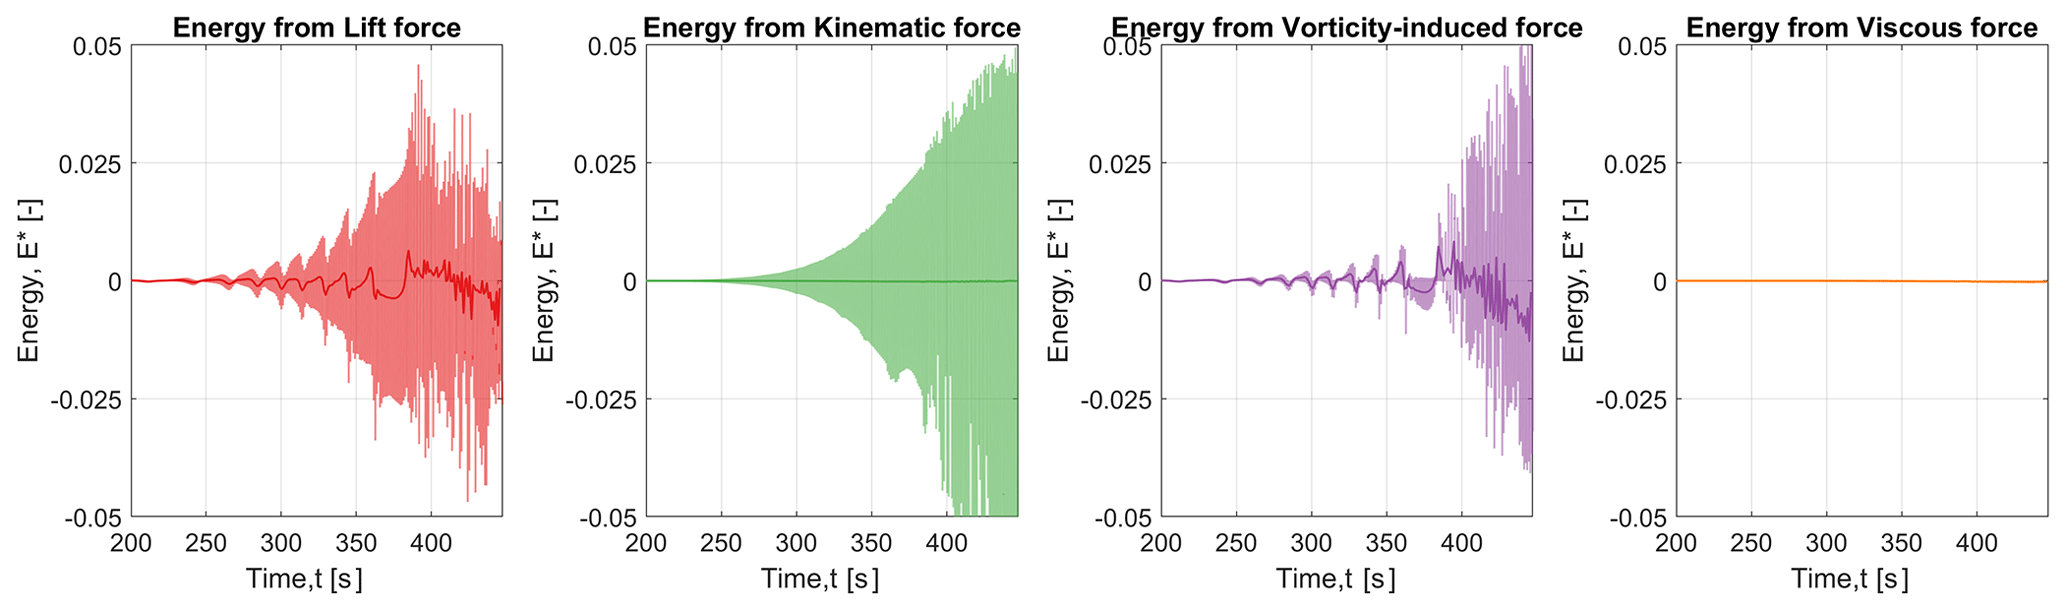
Figure 15Non-dimensionalised energy transfer from the lift force and partitioned forces between the fluid and the structure at a reduced velocity of 2.88 (). The continuous dark line shows the moving average of the instantaneous normalised energy, while the shaded curve shows the instantaneous value.

Figure 16Non-dimensionalised energy transfer from the lift force and partitioned forces between the fluid and the structure at a reduced velocity of 3.04 (). The continuous dark line shows the moving average of the instantaneous normalised energy, while the shaded curve shows the instantaneous value.
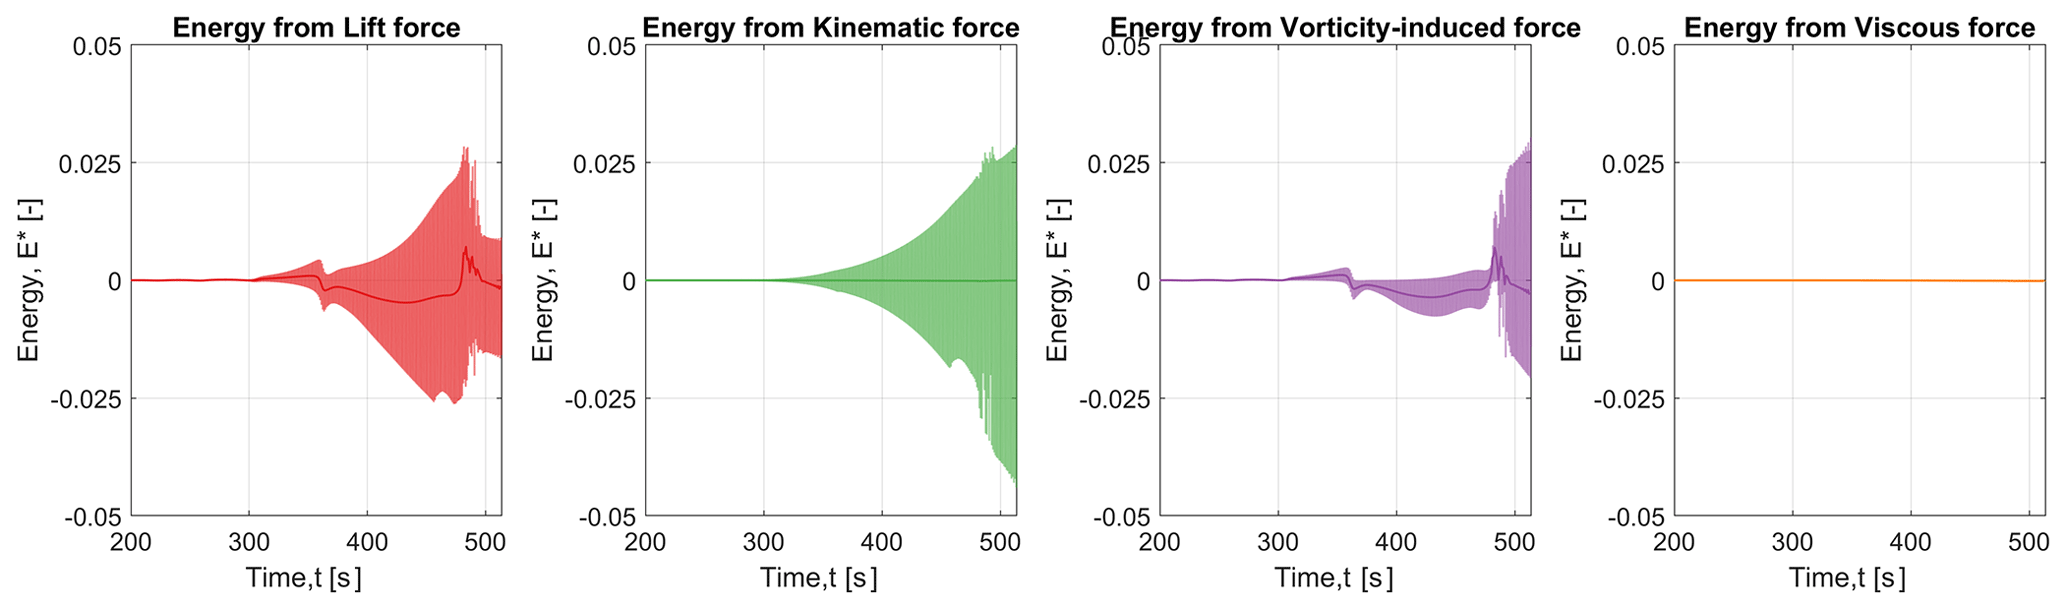
Figure 17Non-dimensionalised energy transfer from the lift force and partitioned forces between the fluid and the structure at a reduced velocity of 3.20 (). The continuous dark line shows the moving average of the instantaneous normalised energy, while the shaded curve shows the instantaneous value.
Figure 15 shows the energy transfer when the reduced velocity is 2.88 and the velocity ratio is 0.997. The major energy contributor to the lift force during the onset of VIV is the energy from the vortex-induced force. There is a pattern that is similar to the beating pattern observed in the time series of the lift force. However, the mean non-dimensionalised energy from the vortex-induced force is positive, . As the oscillations become significantly larger, the energy from the added mass contributes to the overall energy in the lift force. Even though there is an overall contribution of energy from the kinematic force, the mean energy transfer as a result of this is almost zero. As the fluid flow considered during the simulations is at a high Reynolds number, the energy from the viscous force is negligible as well.
At a velocity ratio of unity, it can be observed from Fig. 16 that the transient nature of the flow is attained much more quickly than for the other velocity ratios. The non-dimensionalised energy transfer happens from the structure to the fluid until a peak is observed, at t≈320 s, before the system becomes completely transient in nature. Eventually, there is a net mean positive energy transfer from the fluid to the structure. This change in the nature of the energy transfer may be due to the fact that the energy extracted from the shear layer increases as the cylinder oscillates at the natural frequency and that dissipation to the wakes is comparatively less, as explained in Menon and Mittal (2021).
For the velocity ratio , the net energy from the vortex-induced force is largely negative, which implies that it starts to have a damping nature after the vibrations have been initiated. The rest of the oscillations are sustained by the energy from the added mass. As seen from previous figures, the mean energy contribution from the kinematic force is also negligible in this scenario. When the lift force is completely transient, it can be observed that the vortex-induced force increases as seen in previous conditions. Generally, the energy transition between the fluid and the structure shifts relatively swiftly to a fully transient state before reaching the Strouhal velocity.
In this work, vortex-induced vibrations of a circular cylinder at a transcritical Reynolds number are analysed using the force-partitioning method. This method dissects the total force into various force components, such as the force due to added mass, vorticity, the viscosity of the fluid, forces associated with the potential flow, and the force due to the boundary of the domain. The methodology is implemented in the CFD software OpenFOAM, where pimpleFoam is modified to fppimpleFoam and the force coefficients are calculated using fpforceCoeff. Unsteady RANS simulations were carried out to analyse the oscillation in the crossflow direction using the k–ω SST turbulence model. The structural parameters corresponded to the tower top section of the IEA 15 MW reference wind turbine tower.
Upon analysing the decomposed forces at Reynolds numbers greater than 3×10⁶, the major forces that contribute to the lift force are the vortex-induced force and the kinematic force. When the cylinder oscillation is sufficiently far from the natural frequency (), the dominant force contributor is the vortex-induced force. But as the frequency ratio increases, the amplitude of the oscillation increases, which leads to increased contribution of the kinematic force. The patterns observed in the total lift force are mainly due to the phase difference between the kinematic force and the vortex-induced force. The oscillations are initiated by the vortex formed behind the cylinder; consequently, the major force contributor in the initial time periods is the vortex-induced force. The kinematic force oscillates at the natural frequency even before the system does, which explains the transient fluctuations in the lift force.
The energy transfer between the system and the fluid gives a better idea of the nature of the force contribution. The mean energy contribution by the vortex-induced force is positive on or before the Strouhal velocity. Therefore, the net energy transfer occurs from the fluid to the system. Even though there is a high energy contribution from the kinematic force, the mean energy transfer between the system and the fluid is negligible. The energy contribution from the viscous force is negligible as the Reynolds numbers are high. This is in contradistinction to the low-Reynolds-number validation case investigated before.
Similar to the studies by Menon and Mittal (2021), even at transcritical Reynolds numbers, the main contributor to the initiation and sustenance of the oscillations is the vortex-induced force. Even though force-partitioning analyses have been carried out in previous studies, investigating the phenomenon of VIV at such high Reynolds numbers with this method is the first of its kind. In the present research, the analysis of energy derived from vortices spans the entire domain, while the impact of vortices in both the near field and the far field has not been considered and was explored in the previous study; see Menon and Mittal (2021). As the shape and size of the cylinder matter predominantly in the oscillation, care must be taken in designing the wind turbine towers. The change in taper ratio and tower top diameter will also significantly influence VIV, making it important to analyse the critical section regarding a potential lock-in. The current work can be extended to analyse how the various force components vary for a three-dimensional tower. It is critical to understand how the vortices in the near field and far field affect the oscillations for a complete tower. Furthermore, the effect of the taper ratio could be investigated with the force-partitioning method, as a tapered tower potentially reduces the occurrence or strength of VIV. As mentioned in the previous section, surface roughness is imparted to mimic flows with high Reynolds numbers at a low-Reynolds-number range. Here, this methodology can shed light on the contribution of surface roughness to VIV at lower Reynolds numbers.
The force-partitioning method implemented in OpenFOAM is available at https://gitlab.tudelft.nl/svimalkumar/fpfoam (VimalKumar, 2023). The datasets generated from the simulations, the post-processed results, and the scripts are available at https://doi.org/10.5281/zenodo.10529196 (VimalKumar, 2024).
SV carried out the overall research under the guidance of DDT, DvT, MB, and AV. The conceptualisation of the research and the methodology was done by SV, DDT, and AV. SV implemented the force-partitioning method, numerical simulations, and preliminary analysis. The results were interpreted and visualised by SV, DDT, DvT, MB, and AV. SV prepared the original draft, which was thoroughly reviewed and edited by DT, DvT, MB, and AV.
The contact author has declared that none of the authors has any competing interests.
Publisher's note: Copernicus Publications remains neutral with regard to jurisdictional claims made in the text, published maps, institutional affiliations, or any other geographical representation in this paper. While Copernicus Publications makes every effort to include appropriate place names, the final responsibility lies with the authors.
This paper was edited by Emmanuel Branlard and reviewed by four anonymous referees.
Bainbridge, W., Barajas, G., Bercin, K., Clifford, I., Collecutt, G., Cranford, J., Ferraris, S., Forman, M., Fuchs, M., Ghildiyal, P., Greenshields, C., Gschaider, B., Heather, A., Hill, D., Janssens, M., Jackson, A., Jasak, H., vel Job, A. K., Knacke, T., Lucchini, T., Macpherson, G., Matveichev, A., Meredith, K., McGlashan, L., Niemi, T., Nilsson, H., Nordin, N., Olesen, M., Olesen, V., Papoutsis-Kiachagias, E., Peltola, J., Roenby, J., Rusche, H., Santos, B., Scheufler, H., Smith, R., Sonakar, P., Spencer, H., Tabor, G., Tukovic, Z., Villiers, E. D., Wang, Y., Weber, N., Weller, H., Wikstrom, N., and Zirwes, T.: OpenFoam-v2012, https://www.openfoam.com/news/main-news/openfoam-v20-12 (last access: 15 August 2022), 2012. a, b
Batchelor, G. K.: An Introduction to Fluid Dynamics, Cambridge Mathematical Library, Cambridge University Press, https://doi.org/10.1017/CBO9780511800955, 2000. a
Belloli, M., Giappino, S., Muggiasca, S., and Zasso, A.: Force and wake analysis on a single circular cylinder subjected to vortex induced vibrations at high mass ratio and high Reynolds number, J. Wind Eng. Indust. Aerodynam., 103, 96–106, https://doi.org/10.1016/j.jweia.2012.03.005, 2012. a
Belloli, M., Giappino, S., Morganti, S., Muggiasca, S., and Zasso, A.: Vortex induced vibrations at high Reynolds numbers on circular cylinders, Ocean Eng., 94, 140–154, https://doi.org/10.1016/j.oceaneng.2014.11.017, 2015. a
Bishop, R. E. D. and Hassan, A. Y.: The lift and drag forces on a circular cylinder oscillating in a flowing fluid, P. Roy. Soc. Lond. A, 277, 51–75, https://doi.org/10.1098/rspa.1964.0005, 1964. a
Brika, D. and Laneville, A.: Vortex-induced vibrations of a long flexible circular cylinder, J. Fluid Mech., 250, 481–508, https://doi.org/10.1017/S0022112093001533, 1993. a
Carmo, B., Sherwin, S., Bearman, P., and Willden, R.: Flow-induced vibration of a circular cylinder subjected to wake interference at low Reynolds number, J. Fluids Struct., 27, 503–522, https://doi.org/10.1016/j.jfluidstructs.2011.04.003, 2011. a, b
Catalano, P., Wang, M., Iaccarino, G., and Moin, P.: Numerical simulation of the flow around a circular cylinder at high Reynolds numbers, Int. J. Heat Fluid Flow, 24, 463–469, https://doi.org/10.1016/S0142-727X(03)00061-4, 2003. a
Chang, C.-C.: Potential flow and forces for incompressible viscous flow, P. Roy. Soc. Lond. A, 437, 517–525, https://doi.org/10.1098/rspa.1992.0077, 1992. a
Clough, R. and Penzien, J.: Dynamics of Structures, Civil engineering series, McGraw-Hill, ISBN 9780071132411, 1993. a
Derksen, A.: Numerical simulation of a forced and freely-vibrating cylinder at supercritical Reynolds numbers, MS thesis, TU Delft, https://resolver.tudelft.nl/uuid:4c92eee4-8378-4a40-9180-bcb72f751076 (last access: 20 January 2024), 2019. a
Fröhlich, J. and von Terzi, D.: Hybrid RANS/LES methods for the simulation of turbulent flows, Prog. Aerosp. Sci., 44, 349–377, 2008. a
Gaertner, E., Rinker, J., Sethuraman, L., Zahle, F., Anderson, B., Barter, G., Abbas, N., Meng, F., Bortolotti, P., Skrzypinski, W., Scott, G., Feil, R., Bredmose, H., Dykes, K., Sheilds, M., Allen, C., and Viselli, A.: Definition of the IEA 15-Megawatt Offshore Reference Wind Turbine, Tech. rep., International Energy Agency, https://www.nrel.gov/docs/fy20osti/75698.pdf (last access: 20 January 2024), 2020. a
Griffin, O. M.: Vortex-Excited Cross-Flow Vibrations of a Single Cylindrical Tube, J. Press. Vessel Technol., 102, 158–166, https://doi.org/10.1115/1.3263315, 1980. a
Hoen, B., Darlow, R., Haac, R., Rand, J., and Kaliski, K.: Effects of land-based wind turbine upsizing on community sound levels and power and energy density, Appl. Energy, 338, 120856, https://doi.org/10.1016/j.apenergy.2023.120856, 2023. a
Horcas, S. G., Barlas, T., Zahle, F., and Sørensen, N. N.: Vortex induced vibrations of wind turbine blades: Influence of the tip geometry, Phys. Fluids, 32, 065104, https://doi.org/10.1063/5.0004005, 2020. a
Kumar, S., Navrose, and Mittal, S.: Lock-in in forced vibration of a circular cylinder, Phys. Fluids, 28, 113605, https://doi.org/10.1063/1.4967729, 2016. a
Livanos, D.: Investigation of Vortex Induced Vibrations on Wind Turbine Towers, MS thesis, TU Delft, https://resolver.tudelft.nl/uuid:90b62a9f-0740-4798-8a9a-7b2708756268 (last access: 20 January 2024), 2018. a
Menon, K. and Mittal, R.: On the initiation and sustenance of flow-induced vibration of cylinders: insights from force partitioning, J. Fluid Mech., 907, A37, https://doi.org/10.1017/jfm.2020.854, 2021. a, b, c, d, e, f, g, h
Menter, F.: Improved Two-equation K–ω Turbulence Models for Aerodynamic Flows, Technical Memorandum 103978, NASA, https://ntrs.nasa.gov/citations/19930013620 (last access: 20 January 2024), 1992. a
Menter, F. R.: Two-equation eddy-viscosity turbulence models for engineering applications, AIAA J., 32, 1598–1605, https://doi.org/10.2514/3.12149, 1994. a
Morse, T. L. and Williamson, C. H. K.: Prediction of vortex-induced vibration response by employing controlled motion, J. Fluid Mech., 634, 5–39, https://doi.org/10.1017/S0022112009990516, 2009. a, b
Park, J., Kwon, K., and Choi, H.: Numerical solutions of flow past a circular cylinder at Reynolds numbers up to 160, KSME Int. J., 12, 1200–1205, https://doi.org/10.1007/BF02942594, 1998. a, b
Placzek, A., Sigrist, J.-F., and Hamdouni, A.: Numerical simulation of an oscillating cylinder in a cross-flow at low Reynolds number: Forced and free oscillations, Comput. Fluids, 38, 80–100, https://doi.org/10.1016/j.compfluid.2008.01.007, 2009. a, b
Posdziech, O. and Grundmann, R.: A systematic approach to the numerical calculation of fundamental quantities of the two-dimensional flow over a circular cylinder, J. Fluids Struct., 23, 479–499, https://doi.org/10.1016/j.jfluidstructs.2006.09.004, 2007. a, b
Quartapelle, L. and Napolitano, M.: Force and Moment in Incompressible Flows, AIAA J., 21, 911–913, 1983. a, b
Riva, R., Horcas, S. G., Sørensen, N. N., Grinderslev, C., and Pirrung, G. R.: Stability analysis of vortex-induced vibrations on wind turbines, J. Phys.: Conf. Ser., 2265, 042054, https://doi.org/10.1088/1742-6596/2265/4/042054, 2022. a
Roache, P. J.: Perspective: A Method for Uniform Reporting of Grid Refinement Studies, J. Fluids Eng., 116, 405–413, https://doi.org/10.1115/1.2910291, 1994. a
Spalart, P. R.: Detached-Eddy Simulation, Annu. Rev. Fluid Mech., 41, 181–202, 2009. a
Squires, K. D., Krishnan, V., and Forsythe, J. R.: Prediction of the flow over a circular cylinder at high Reynolds number using detached-eddy simulation, J. Wind Eng. Indust. Aerodynam., 96, 1528–1536, https://doi.org/10.1016/j.jweia.2008.02.053, 2008. a, b
Travin, A., Shur, M., Strelets, M., and Spalart, P.: Detached-Eddy Simulations Past a Circular Cylinder, Flow Turbul. Combust., 63, 293–313, https://doi.org/10.1023/A:1009901401183, 2000. a
Veers, P., Dykes, K., Lantz, E., Barth, S., Bottasso, C. L., Carlson, O., Clifton, A., Green, J., Green, P., Holttinen, H., Laird, D., Lehtomäki, V., Lundquist, J. K., Manwell, J., Marquis, M., Meneveau, C., Moriarty, P., Munduate, X., Muskulus, M., Naughton, J., Pao, L., Paquette, J., Peinke, J., Robertson, A., Rodrigo, J. S., Sempreviva, A. M., Smith, J. C., Tuohy, A., and Wiser, R.: Grand challenges in the science of wind energy, Science, 366, eaau2027, https://doi.org/10.1126/science.aau2027, 2019. a
VimalKumar, S.: Force Partitioned Method – OpenFOAM, TU Delft [code], https://gitlab.tudelft.nl/svimalkumar/fpfoam (last access: 20 January 2024), 2023. a, b
VimalKumar, S.: Dataset for Force Partitioning Analysis of Vortex-Induced Vibrations of Wind Turbine Tower Sections (Version 1.0) [Data set], Zenodo [data set], https://doi.org/10.5281/zenodo.10529196, 2023. a
Viré, A. and Knaepen, B.: On discretization errors and subgrid scale model implementations in large eddy simulations, J. Comput. Phys., 228, 8203–8213, https://doi.org/10.1016/j.jcp.2008.12.024, 2009. a
Viré, A., Derksen, A., Folkersma, M., and Sarwar, K.: Two-dimensional numerical simulations of vortex-induced vibrations for a cylinder in conditions representative of wind turbine towers, Wind Energ. Sci., 5, 793–806, https://doi.org/10.5194/wes-5-793-2020, 2020. a, b, c, d, e, f
Williamson, C. and Govardhan, R.: Vortex-induced vibrations, Annu. Rev. Fluid Mech., 36, 413–455, https://doi.org/10.1146/annurev.fluid.36.050802.122128, 2004. a, b
Williamson, C. and Roshko, A.: Vortex formation in the wake of an oscillating cylinder, J. Fluids Struct., 2, 355–381, https://doi.org/10.1016/S0889-9746(88)90058-8, 1988. a
Zhang, C., Hedrick, T. L., and Mittal, R.: Centripetal Acceleration Reaction: An Effective and Robust Mechanism for Flapping Flight in Insects, PLoS ONE, 10, e0132093, https://doi.org/10.1371/journal.pone.0132093, 2015. a