the Creative Commons Attribution 4.0 License.
the Creative Commons Attribution 4.0 License.
 | 09 Sep 2025
Developing an atlas of rain-induced leading edge erosion for wind turbine blades in the Dutch North Sea
Gerwin van Dalum
To support the ongoing development of offshore wind energy in the Netherlands and to maintain current assets, it is essential to provide wind farm operators with accurate estimates of wind turbine blade erosion. Unfortunately, there is currently a shortage of information on wind turbine erosion risk, especially in offshore regions. In this work, we developed an atlas detailing rain-induced leading edge erosion for wind turbine blades in the Dutch North Sea, using weather simulations spanning a decade to capture long-term climate patterns. These simulations, based on a meso-scale model, were incorporated into a fatigue-based damage model, linking weather conditions to blades’ leading edge erosion. The results reveal that the erosive impact of rainfall on wind turbine blades varies across the Dutch North Sea. The estimated average incubation period, which indicates the leading edge protection system's lifespan, ranges from 8 to 9 years in the southwestern region, decreasing to 6 to 7 years in the northeastern area. This is due to both the higher average wind speeds and greater rainfall amounts occurring in the northeastern locations compared to the southwestern ones. This paper emphasizes that the northeastern regions of the Dutch North Sea, which are being examined for potential wind farm developments post-2030, will encounter higher erosion risks compared to those currently operating in southern locations, possibly requiring enhanced mitigation strategies. Additionally, a year-long comparison of meso-scale simulations, high-resolution large eddy simulations (LESs), and measurements revealed that meso-scale simulations estimate 7 %–20 % less damage than LES, which captures more extreme events. Nonetheless, meso-scale simulations and LESs reveal alignment in the spatial patterns of erosion-related parameters, confirming that meso-scale simulations produce satisfactory atlases where regional differences are consistently captured with LES. Through the comparison between LES and measurements, it was found that LES estimates 23 %–66 % less damage than actual weather data, due to underestimating larger droplets and recording fewer extreme events.
- Article
(23866 KB) - Full-text XML
- BibTeX
- EndNote


The Dutch North Sea is undergoing significant development in wind energy, with numerous wind farms currently operating and more planned (Noordzeeloket, 2024). For developers of offshore wind farms and turbines, assessing the risk of rain-induced leading edge erosion (LEE) is crucial. Raindrops hitting the blades lead to gradual mechanical wear on the surface of their leading edge (Slot et al., 2015). Leading edge wear continues to occur despite the development and implementation of advanced leading edge protection (LEP) systems on modern wind turbine blades (Mishnaevsky et al., 2021). Damaged blades result in decreased turbine performance (Bak et al., 2020; Maniaci et al., 2020; Vimalakanthan et al., 2023; Castorrini et al., 2023), forcing wind farm operators to conduct frequent, costly, labor-intensive, and possibly hazardous maintenance procedures to fix the blades. LEE poses a significant challenge to the rapid deployment of wind energy, particularly in offshore environments.
LEE is a fatigue-driven process in which each droplet impact contributes to cumulative damage (Slot, 2021; Mishnaevsky, 2019). The severity of LEE is tied to the frequency and speed of impacts, as well as to the drop size distribution (DSD). Although the quantity of impacts and the size of raindrops are linked to rain conditions, the speed of the impacts primarily depends on the turbine's rotational speed, which is linked to wind speed. Thus, evaluating LEE must consider the simultaneous conditions of both rain and wind speed. Caboni et al. (2024) carried out concurrent measurements of rain and wind speed at an offshore platform in the Dutch North Sea, linking the weather conditions to the accumulation of wind turbine damage. Other recent studies have focused on evaluating LEE using measurements carried out at onshore and coastal areas (Hasager et al., 2020, 2021; Shankar Verma et al., 2021; Verma et al., 2021; Letson and Pryor, 2023; Hannesdóttir et al., 2024; Méndez et al., 2024; Pryor et al., 2025b). Numerical techniques can be utilized to bridge the gap in onshore and offshore measurements, providing essential data to assess erosion risks associated with wind energy deployment (Pryor et al., 2023; Hannesdóttir et al., 2024). Other studies have concentrated on creating maps of wind resources without addressing the issue of wind turbine erosion (Nawri et al., 2014; Hahmann et al., 2020; Davis et al., 2023; Larsén et al., 2022; Mortensen et al., 2014; Copernicus-Climate-Change-Service, 2024). The report by Pryor et al. (2025a) offers an excellent overview of the various meteorological datasets that have been utilized in the creation of erosion atlases.
The literature review reveals a significant gap in knowledge regarding the large-scale mapping of rain erosion risks for wind turbine blades, particularly in the Dutch North Sea. Hannesdóttir et al. (2024) incorporated wind turbine erosion into their analysis by creating a rain erosion atlas for the Norwegian and Danish North Sea, along with the Baltic Sea. This was achieved by linking the ERA5 and NORA3 reanalysis datasets to a wind turbine erosion model. Although focusing on the Norwegian and Danish North Sea, the erosion atlas by Hannesdóttir et al. (2024) covers part of the Dutch North Sea as well, but it is insufficient to determine the differences within the region. This is because it does not encompass a significant portion of the Dutch North Sea, particularly the central and southern areas where most current Dutch wind farms are situated. This study aims to fill this gap by creating an atlas based on long-term meso-scale simulations to assess the risk of LEE in the Dutch North Sea. By spanning 10 years to capture the long-term precipitation climate, this study surpasses the erosion atlas by Hannesdóttir et al. (2024), which was developed over 5 years. Additionally, it offers slightly better spatial resolution (2 km instead of 3 km) while maintaining the same temporal resolution (1 h).
As part of this project, we aimed to identify potential improvements for simulations used to determine erosion atlases. To achieve this goal, we compared our meso-scale simulations with a high-resolution large eddy simulation (LES) setup over the course of a year over the Dutch North Sea. The advantage of using LES over meso-scale simulations is that it involves less spatial and temporal averaging of local variables, allowing it to better capture extreme precipitation events. LESs were carried out with a spatial resolution of 120 m and a temporal resolution of 1 min. The drawback of LEE is that it requires significantly more computational resources than meso-scale simulations. To date, no such simulation with comparison has been published. To gain a deeper understanding of the simulations, LESs were also compared with the experimental data published by Caboni et al. (2024), introducing an additional novel aspect.
The remainder of this paper is organized into three sections. The methodology section details the models and simulations, including the methodology used to evaluate erosion damage and the measurements utilized to provide a comparison to the simulations. In the results section, we present the developed atlas, along with a comparison between measurements and simulations. The final section draws conclusions and outline future research directions.
2.1 Whiffle's ASPIRE weather simulations
The innovative numerical method used in this research relies on Whiffle's LES model ASPIRE (Atmospheric Simulation Platform for Innovation, Research, and Education). ASPIRE started as a GPU implementation of the DALES (Dutch Atmospheric Large-Eddy Simulation) model (Heus et al., 2010; Schalkwijk et al., 2012) that has since received numerous improvements that allow it to be used as an operational weather model. Its main innovation is that the model's calculations are highly parallelized using the capabilities of the GPU, which cuts down the runtime by several orders of magnitude compared to traditional implementations on a CPU. Crucially, this allows for simulations on a much larger domain and/or a much higher resolution at the same computational cost. ASPIRE can also run meso-scale simulations that do not resolve any turbulence like in LES but benefit from the same computational speed-up.
ASPIRE was used to create a precipitation atlas for the Dutch North Sea by simulating weather conditions over a long period of time. A description of the model, its governing equations, and its boundary conditions can be found in Baas et al. (2023). Following the methods described by Storey and Rauffus (2024), simulations of historical weather conditions are performed by coupling large-scale data from ECMWF's ERA5 reanalysis dataset (Hersbach et al., 2020) to the lateral boundaries of a meso-scale version of the model. In a similar manner, this meso-scale simulation is in turn coupled to the boundaries of a nested high-resolution LES. Both the meso-scale simulation and the LES use an implementation of the microphysics model by Grabowski (1998), which locally calculates the rate of rain droplet formation and simulates the subsequent precipitation. Since ASPIRE works with model time steps of a few seconds, it is able to capture short-lived events such as the high-rain-rate events that are of special interest for this study.
Within ASPIRE, moisture is treated using two prognostic variables, distinguishing between the total non-precipitating specific humidity qt, consisting of water vapor and non-precipitating liquid and ice water, and precipitating water qr. The former is diagnostically partitioned into its components using an all-or-nothing scheme that assumes the water to be homogeneously distributed over a grid cell. As such, grid cells with qt below the local saturation mixing ratio qsat contain no clouds, whereas any qt above saturation is immediately interpreted as non-precipitating liquid or ice water, depending on the temperature. Following Grabowski (1998), this cloud water content is subsequently used to calculate autoconversion and accretion rates for droplet formation, as well as deposition and evaporation rates. Finally, precipitation of the formed droplets is accounted for by an additional advective term that makes the droplets fall. The resulting change in precipitating water content qr is subtracted from qt such that the total amount of water is conserved. Note that although ASPIRE works with a single prognostic precipitation variable qr, different species (most importantly rain and snow) are diagnosed using a temperature-based partitioning, each with their own version of the DSD, mass–diameter relation, and fall velocity. However, as this study is specifically about rain-induced LEE, the remainder of this section focuses solely on rain.
To determine the incubation period, information about the rain DSD is required. This information can be extracted from the simulations by utilizing the fact that the underlying microphysics model assumes the Marshall–Palmer distribution (Marshall and Palmer, 1948):
where N(D) is the DSD in m−4 as a function of drop diameter D, λ is a shape parameter, and N0 is a fixed prefactor. The shape parameter λ depends on the local amount of rainwater qr (in kg kg−1), the local air density ρ, and the density of water ρw through the following relation:
Combined with the fall velocity used in ASPIRE (Lin et al., 1983),
where a, b, and ρ0 are empirical constants, the rain rate RR can be calculated as a function of the shape parameter λ by using its definition:
with Γ(x) being the gamma function. As a best estimate for the DSD from the simulation, we assume the rain rate to be constant over the output interval and use its value to determine the shape parameter (and by extension the corresponding DSD) by inverting Eq. (4). The reason we do this is because rain-related quantities such as λ and the rain rate can vary strongly on short timescales, while simulation output is always an average over a certain period of time and not an instantaneous value. This method of dealing with the consequences of temporal averaging guarantees that the estimated DSD matches the total precipitation during a given time interval, which is not the case with most other methods due to the nonlinearity of the equations involved. Since the rain rate fluctuates constantly, the accuracy of this estimated DSD increases with decreasing output intervals.
Within the framework of this research, two ASPIRE simulations have been performed. The first is a high-resolution 1-year LES (March 2022–March 2023) covering most of the Dutch North Sea. In addition, a larger but much lower-resolution standalone meso-scale simulation was done, covering a period of 10 years (2014–2023) with a domain size of over 1000 km. The goal of the latter is to provide data for an atlas that spans a long period of time, while the former is a shorter but much higher fidelity simulation that can be used to verify the latter. The settings used for the simulations are summarized in Table 1.
Table 1 Summary of the settings used in the simulations. Note that the vertical levels are non-uniformly distributed.
All simulations were performed “in series” on a per-month basis, i.e., the next simulation starting from the end state of the previous simulation, so only the first day of a month required spin-up time. Furthermore, the output, consisting of two-dimensional grids of time series for multiple variables, most importantly includes rain rate and wind speed. The output is always sampled at 100 m elevation, and it is sampled locally (no spatial averaging over multiple grid points).
2.2 Accumulated damage estimation
The erosion process is influenced by the fatigue properties of the blade's LEP systems, as well as the size and number of droplets impacting the surface at a specific speed. Wear particle emission from the leading edge begins once the incubation period ends. Typically, the incubation period is considered the LEP system's lifespan (Slot, 2021). In this study, we estimated the incubation period using the “ASTM – Multiple linear regression fit equations”, which include a modified dependence on drop size. This model applies only to liquid drop impacts. Heymann (1979) developed multiple linear regression fit equations for the incubation life based on an extensive ASTM test program, where each material is characterized by its normalized incubation resistance number (NOR). To determine the NOR for current LEP systems on wind turbine blades, we conducted a literature review on rotating arm rain erosion tests on LEP systems (Caboni et al., 2025). The NOR values for current LEP systems range from 0.001 to 0.033. For details on the equations used, the reader is referred to Caboni et al. (2024). To consider the cumulative impact of varying rain and wind speed conditions on the erosion process, assuming linear damage accumulation, the Palmgren–Miner rule was applied. The accumulated damage is represented by a parameter F, which starts at zero at the onset of the erosion process and reaches 1 at the conclusion of the incubation period.
For simplicity, this study concentrated on the accumulated damage at the blade tips of the virtual IEA 15 MW reference wind turbine (Gaertner et al., 2020), which have a maximum tip speed of 95 m s−1 and utilize a polyurethane LEP system with an estimated NOR of 0.003. The cumulative damage is closely linked to the relative impact velocity between the blade and the raindrops. This velocity is influenced by the blade's rotational speed, the fall velocity of the droplets, and the aerodynamic interactions between the rain and the wind (Barfknecht and von Terzi, 2024). For simplicity in this work, we assumed that the fall velocity of the raindrops is negligible compared to the blade tip speed and that there are no aerodynamic interactions between the droplets and the wind. Therefore, we considered the impact speed between the blade and the raindrops to be equal to the tangential tip speed. The tangential tip speed is determined by the rotor speed, which is connected to the wind speed. The current maximum tip speed of modern offshore wind turbines is around 90 m s−1 (Wind Energy – The Facts, 2024).
2.3 Rain and wind speed measurements
From March 2022 to March 2023, TNO conducted simultaneous measurements of rainfall and wind speed at three locations in the Netherlands (Caboni et al., 2024). These sites included an offshore location (LEG), a coastal location (GEHALX), and an onshore location (EWTW), as shown in Fig. 1. Rainfall was measured using OTT Parsivel2 disdrometers at LEG and GEHALX and a Thies LPM disdrometer at EWTW. Wind speed was recorded with cup anemometers at EWTW and GEHALX and a Leosphere WindCube V2 lidar at LEG. To focus on rain-induced erosion, events involving snow and hail were excluded, leaving only rainy periods. Rainfall data were collected at a frequency of 1 Hz, while wind speed data were recorded at 0.1 Hz.
Figure 1Map illustrating the locations in the Netherlands where simultaneous wind and rain measurements were conducted as part of the PROWESS project (Caboni et al., 2024). Image courtesy of © Google Earth 2024.
For each observation interval, we calculated the rain parameters like intensity and amount with the measured DSD and droplet fall velocity, using the formulas presented by Tilg et al. (2020). However, it is essential to note that DSD measurements obtained from current sensors, such as disdrometers, remain quite uncertain (Letson and Pryor, 2023; Caboni et al., 2024; Hannesdóttir et al., 2024). This is due to the fact that these sensors and their algorithms are typically optimized to accurately detect total precipitation amounts rather than the DSD itself. Disdrometers indeed detect droplets, and the rain amount is derived from the DSD. However, disdrometers cannot measure the full spectrum of droplet sizes and therefore rely on algorithms that make assumptions to improve the estimation of the rain amount. In our experience this seems to be rather site/precipitation dependent. Additionally, uncertainties in sensor calibration and potential measurement errors caused by wind turbulence, insects, or, at offshore locations, sea spray contribute to the overall uncertainty in disdrometer measurements.
In this section we present the LEE atlas and show the comparison between measurements and ASPIRE simulations. The atlas was developed using a standalone 10-year meso-scale simulation. The comparison between measurements and ASPIRE simulations was carried out over the span of a year, during which standalone meso-scale simulations, high-resolution LES, and measurements were available. Initially, meso-scale simulations were compared to LES, followed by a comparison of LES to measurements.
3.1 Dutch North Sea wind turbine blades' rain-induced leading edge erosion atlas
Meso-scale simulations are conducted to develop the long-term atlas. Figures 2, 3, 4 and 5 illustrate contour maps of the annual accumulated damage, annual incubation period, annual mean wind speed at 100 m above ground level (a.g.l.) and above mean sea level (a.m.s.l.), and annual rainfall, respectively. The contour maps presented here are derived by averaging the yearly simulation results over a 10-year period, from 2014 to 2023. Coastlines are depicted by solid black lines on the maps, while dashed lines indicate the boundaries of the Dutch North Sea. Current, planned, and (estimated) future wind farm areas (North-Sea-Energy, 2024) are represented by blue, red, and green lines, respectively.
Figure 3 shows that the incubation period within the Dutch North Sea varies. It ranges from 8 to 9 years in the southwest and decreases to 6 to 7 years as one moves towards the northeast.
Figure 2Contour map of yearly accumulated damage based on 10 years of meso-scale simulations. Zones of currently operational wind farms are depicted in blue, while areas of wind farms planned to be operational before 2030 and search areas for wind farms to be commissioned after 2030 are depicted in red and green, respectively. Dashed lines depict the boundaries of the Dutch North Sea.
Figure 3Contour map of yearly incubation period based on 10 years of meso-scale simulations. Zones of currently operational wind farms are depicted in blue, while areas of wind farms planned to be operational before 2030 and search areas for wind farms to be commissioned after 2030 are depicted in red and green, respectively. Dashed lines depict the boundaries of the Dutch North Sea. The color scale of this map is adapted to highlight differences across the Dutch North Sea. This results in nearly constant coloring in other areas, which should be interpreted not as constant values but rather as values outside the selected scale.
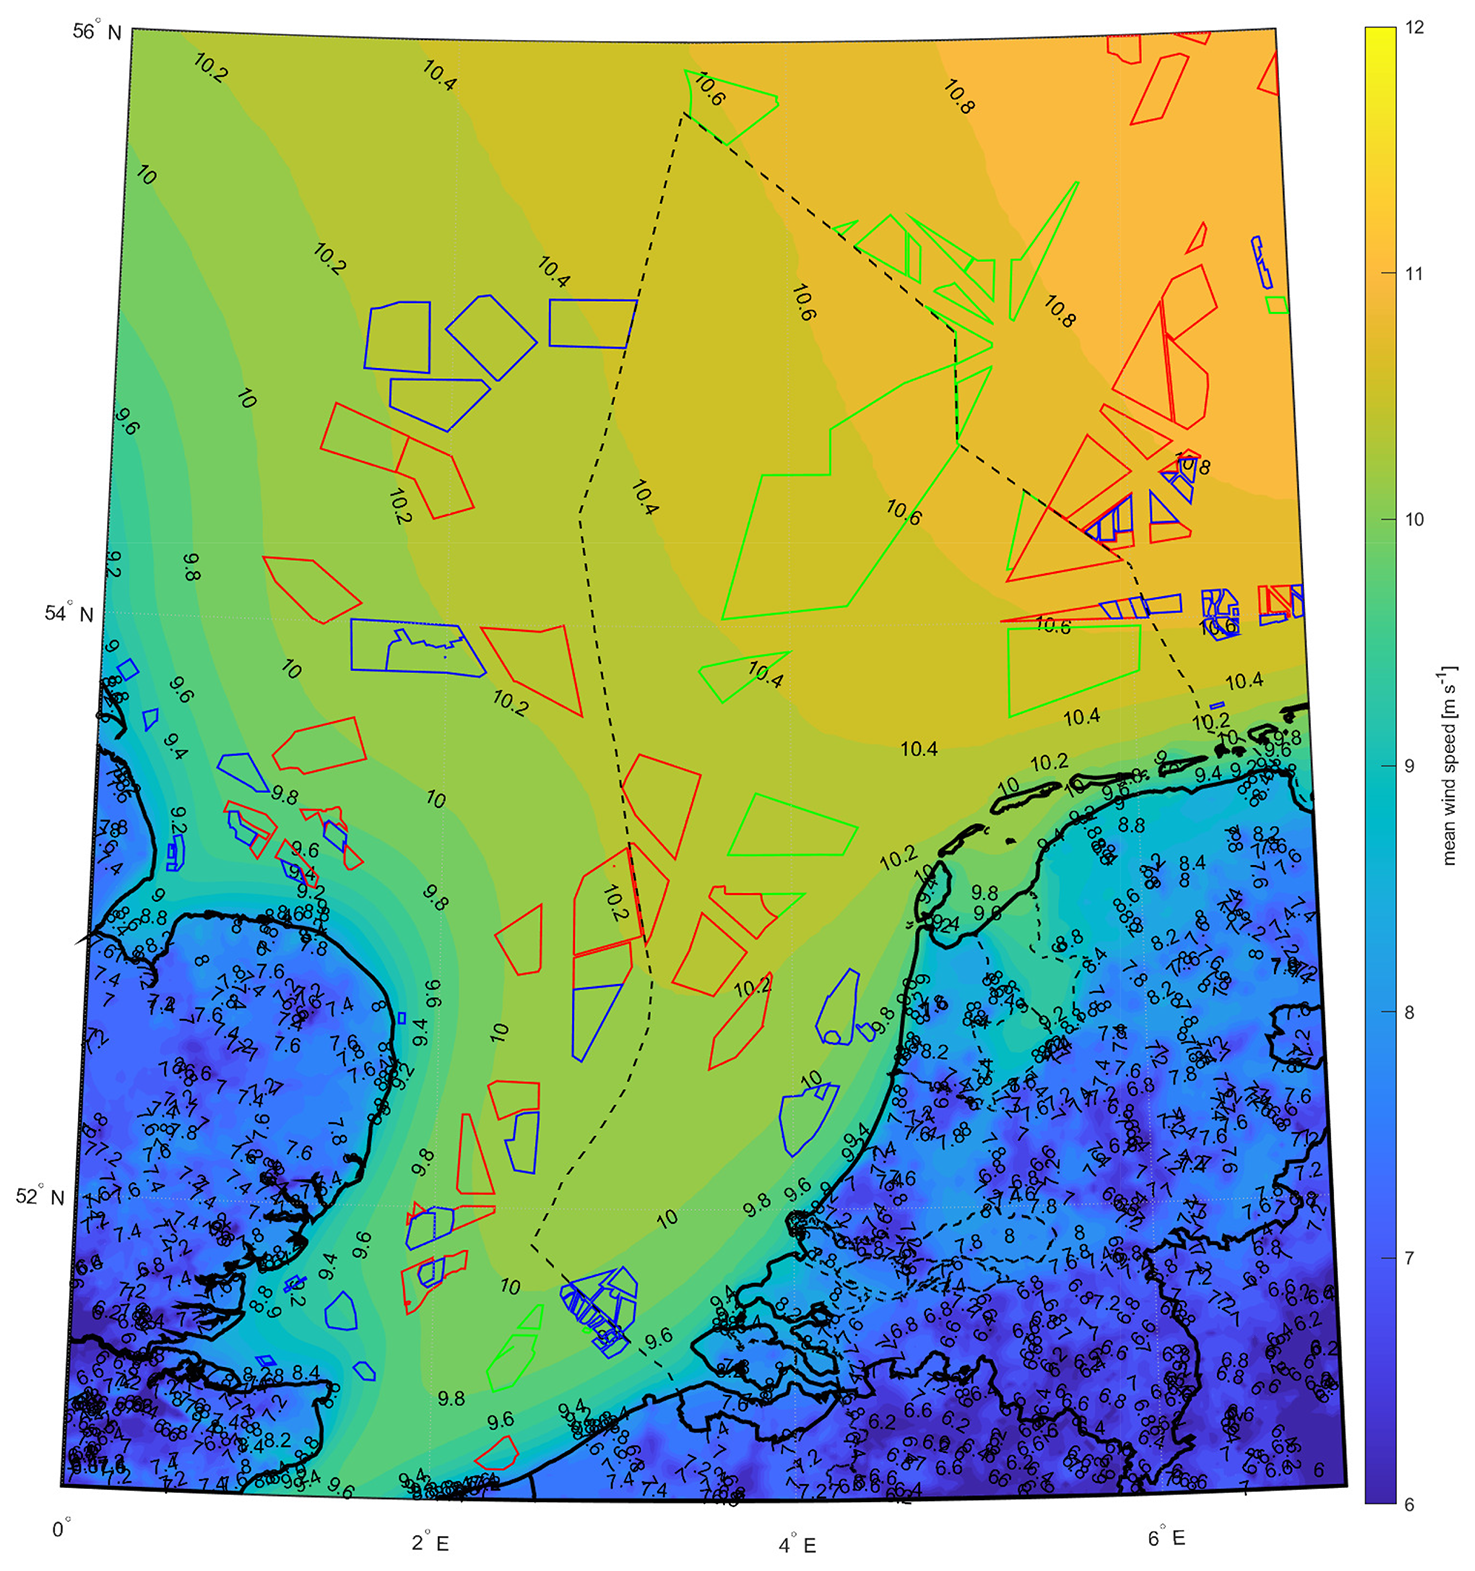
Figure 4Contour map of yearly mean wind speed at 100 m a.g.l. and 100 m a.m.s.l. based on 10 years of meso-scale simulations. Zones of currently operational wind farms are depicted in blue, while areas of wind farms planned to be operational before 2030 and search areas for wind farms to be commissioned after 2030 are depicted in red and green, respectively. Dashed lines depict the boundaries of the Dutch North Sea.
The variation in the incubation period is linked to differences in the mean wind speed and annual rainfall. As shown in Fig. 4, the wind speed is approximately 9.6 m s−1 in the south and increases to about 10.6 m s−1 in the northeast.
Additionally, the northeast experiences higher rainfall, up to 600 mm annually, compared to 500 mm in the south, as shown in Fig. 5.
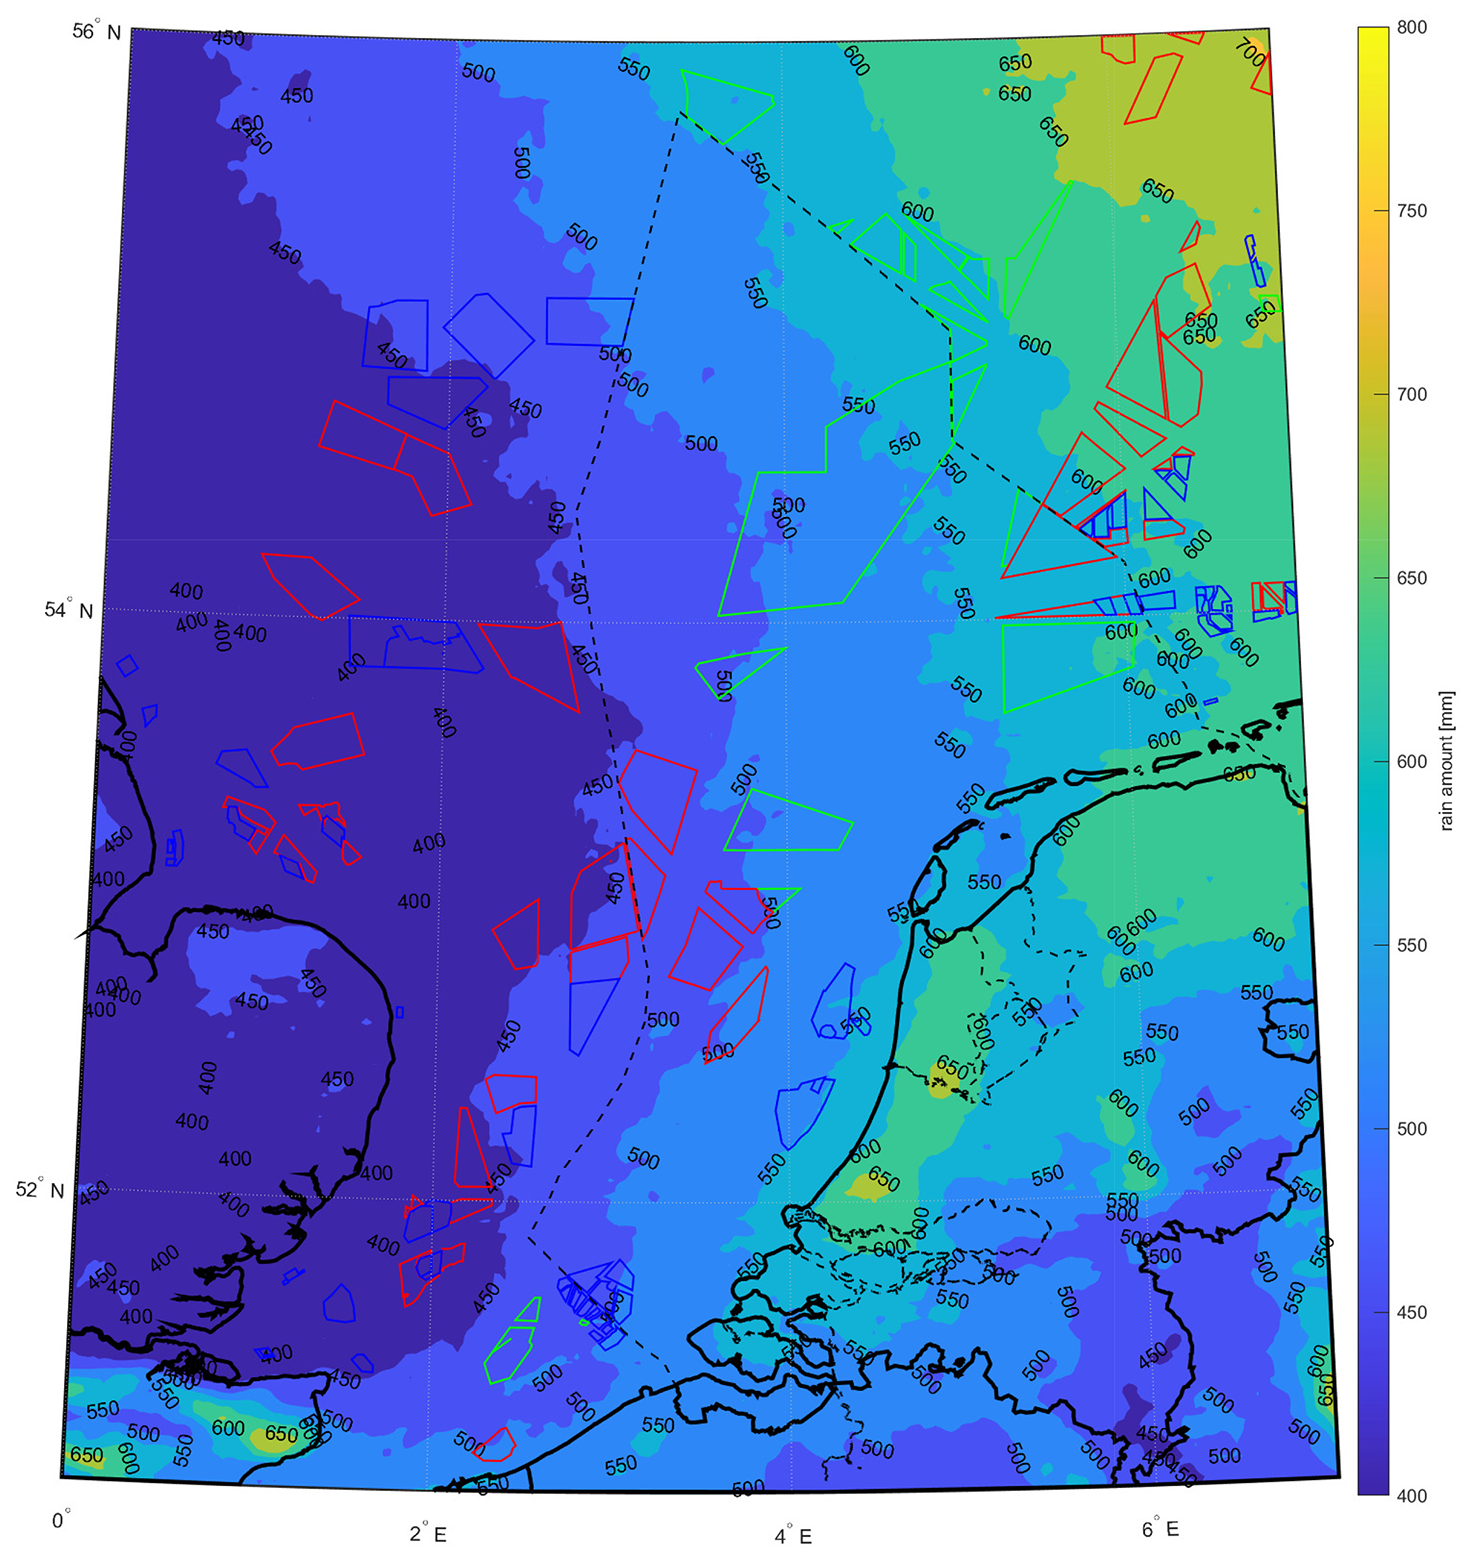
Figure 5Contour map of yearly rain amount based on 10 years of meso-scale simulations. Zones of currently operational wind farms are depicted in blue, while areas of wind farms planned to be operational before 2030 and search areas for wind farms to be commissioned after 2030 are depicted in red and green, respectively. Dashed lines depict the boundaries of the Dutch North Sea.
Therefore, in the northeastern part of the Dutch North Sea, which is a potential area for future wind farms, developers will need to consider the greater impact of LEE compared to wind farms in the southern regions. The reason for this is that these areas experience higher wind speeds and greater rainfall. To clarify the differences between the southern and northern areas, Fig. 6 presents a comparison of the simulated annual rainfall and accumulated damage at two locations: one at the LEG offshore platform (situated in the southwest) and the other in the northeast, located at coordinates 53.9968, 6.0106. It appears that in the southwest there was more rainfall with relatively high intensity, whereas in the northeast, more rain fell but with relatively low intensity. However, in the northeast, more rain falls at higher wind speeds, which contributes to greater erosivity in that region.
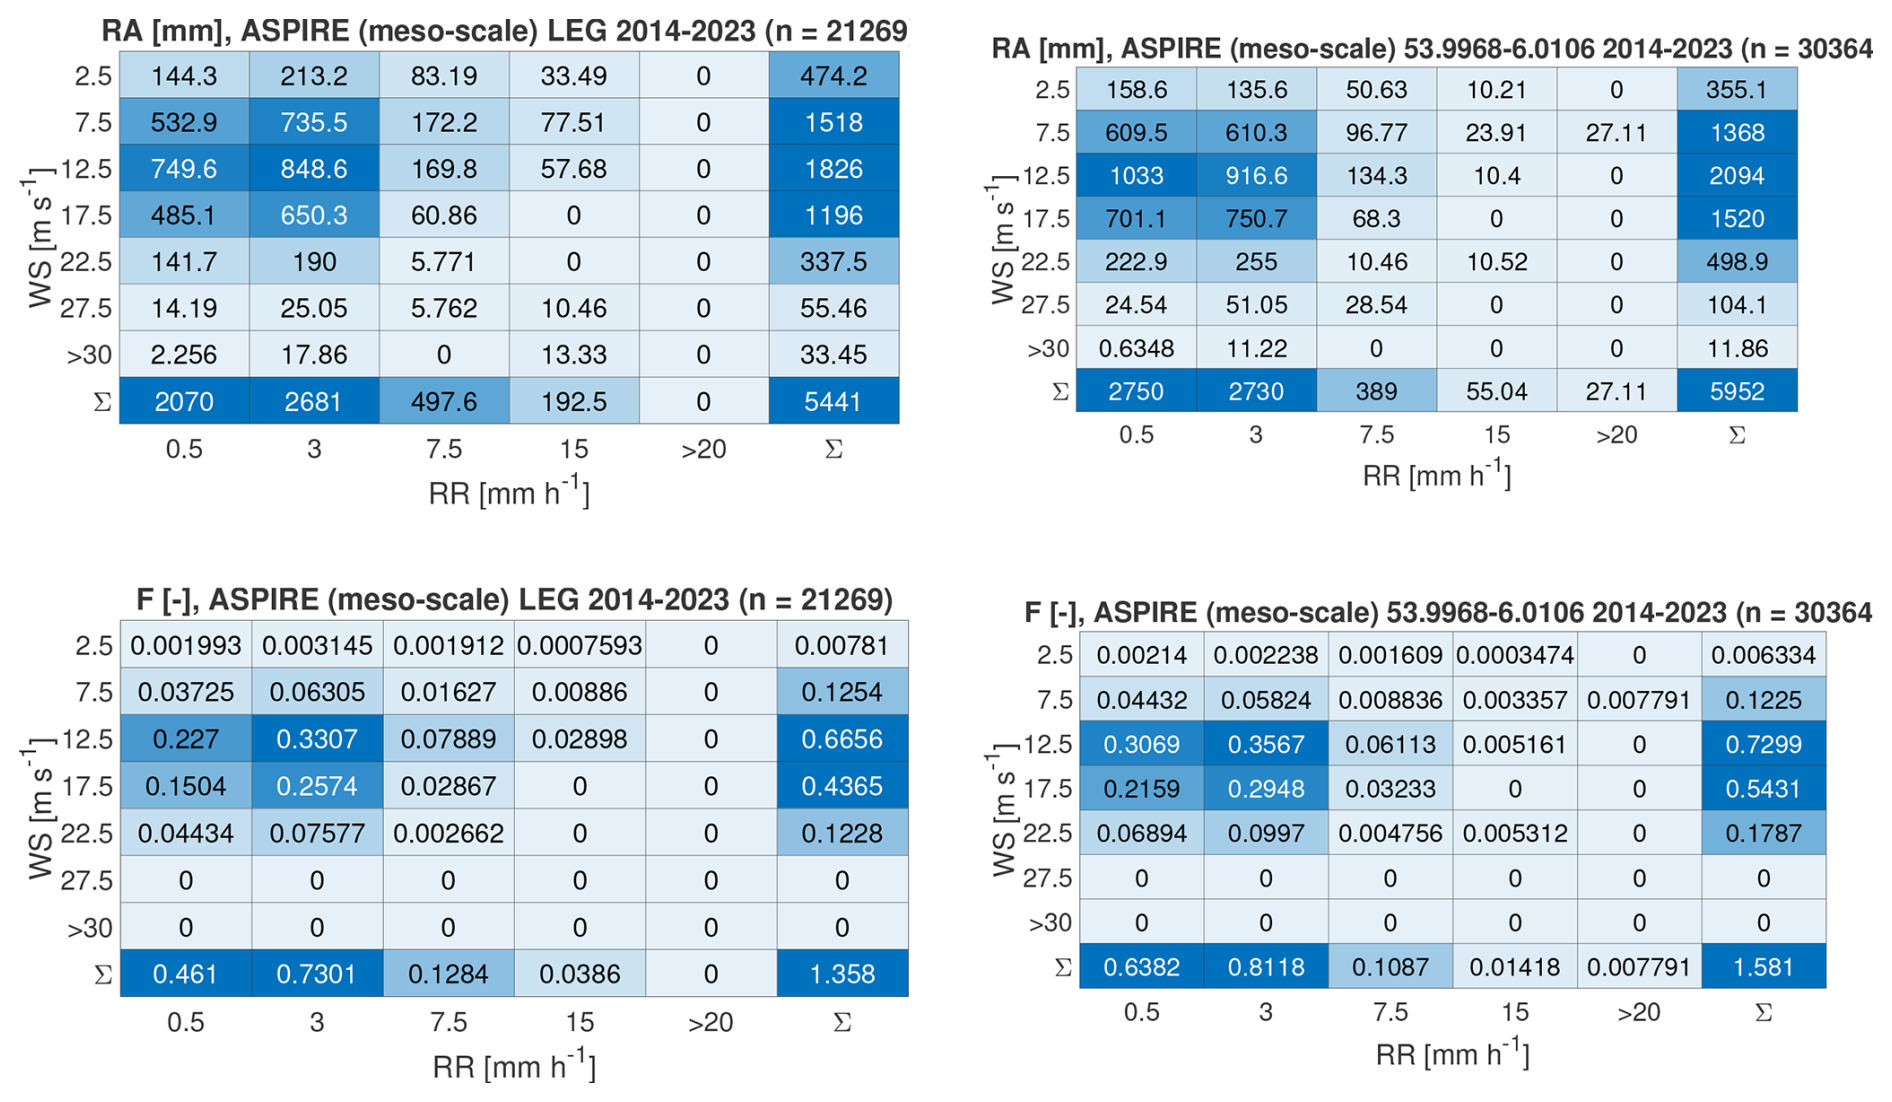
Figure 6Yearly rain amount and accumulated damage sorted into wind speed (WS) and rain rate (RR) bins. This figure compares a location situated in the southern part of the Dutch North Sea (LEG platform) with a location in the northeast (with coordinates 53.9968, 6.0106). The ASPIRE results presented in this figure are obtained from the meso-scale simulations.
3.2 Comparison between measurements and ASPIRE
The comparison between measurements and ASPIRE simulations is presented in three sections. The first section deals with the comparison of aggregated figures related to erosion, such as rain amount and accumulated damage, obtained using measurements, LES, and meso-scale simulations. The second section focuses on a more detailed comparison between meso-scale simulations and high-resolution LES. The third section focuses on comparing measurements with high-resolution LES, including DSD and droplet fall velocities.
3.2.1 Comparison of aggregate erosion figures between measurements, high-resolution LES, and standalone meso-scale simulation
In this section, numerical results and measurements over 1 year are compared at the three aforementioned locations, estimating aggregate erosion figures such as yearly rainfall and accumulated damage. Numerical data and measurements are utilized to assess the accumulated tip damage of the IEA 15 MW reference wind turbine, virtually installed at the specified locations. It is assumed that the turbine blades utilize a polyurethane LEP system. Table 2 presents a comparison of aggregated meteorological and erosion data between simulations and experiments at the three locations.
LESs overestimate the average wind speed during rainy events at LEG and EWTW by up to 6 %, while at GEHALX, it is underestimated by 8 %. The predicted rain amount is up to 13 % lower than the measurements at LEG and EWTW, while at GEHALX, it is 13 % higher. To provide further insight into the wind speed comparison, Fig. 7 displays the measured and LES-simulated and meso-scale-simulated probability distribution functions for wind speed during rainy events. By utilizing the measured annual wind speed and rainfall, we calculated the yearly accumulated damage. Taking the reciprocal of this accumulated damage provides an estimate of the incubation period (in years). As seen in Table 2, LESs underestimate the accumulated damage by 23 % at EWTW, 45 % at GEHALX, and 66 % at LEG.
Compared to measurements, the meso-scale average wind speed during rain is underestimated by 2 % at LEG and 10 % at GEHALX, while it is overestimated by about 4 % at EWTW. The meso-scale rain amount is underestimated by 4 % at LEG and 8 % at EWTW but overestimated by approximately 21 % at GEHALX. Consequently, meso-scale simulations underestimate accumulated damage by 29 % at EWTW, 55 % at GEHALX, and 70 % at LEG.
In terms of absolute values, the accumulated damage is significantly lower when either meso-scale or LESs are used compared to measurements. The accumulated damage predicted with LES aligns more closely with experimental results than when meso-scale simulations are employed. As demonstrated in the following paragraph, this is because our LES setup is more effective at capturing extreme events than our meso-scale simulation, especially those characterized by high intensity and high wind speeds. In terms of trends, the comparison between measurements and simulations reveals differences as well. According to the measurements, the accumulated damage at EWTW is 58 % less and at GEHALX is 42 % less compared to LEG. According to LES, the accumulated damage at EWTW and GEHALX is 7 % less compared to LEG. According to the meso-scale simulations, the accumulated damage is 7 % more at EWTW and 7 % less at GEHALX compared to LEG.
Table 2Comparison between measured and simulated average wind speed during rainy intervals, total rainfall, accumulated damage, and estimated incubation period, based on 1 year of measurements from 21 March 2022 to 21 March 2023. The table shows ASPIRE's numerical results from the high-resolution LES and standalone meso-scale simulation.
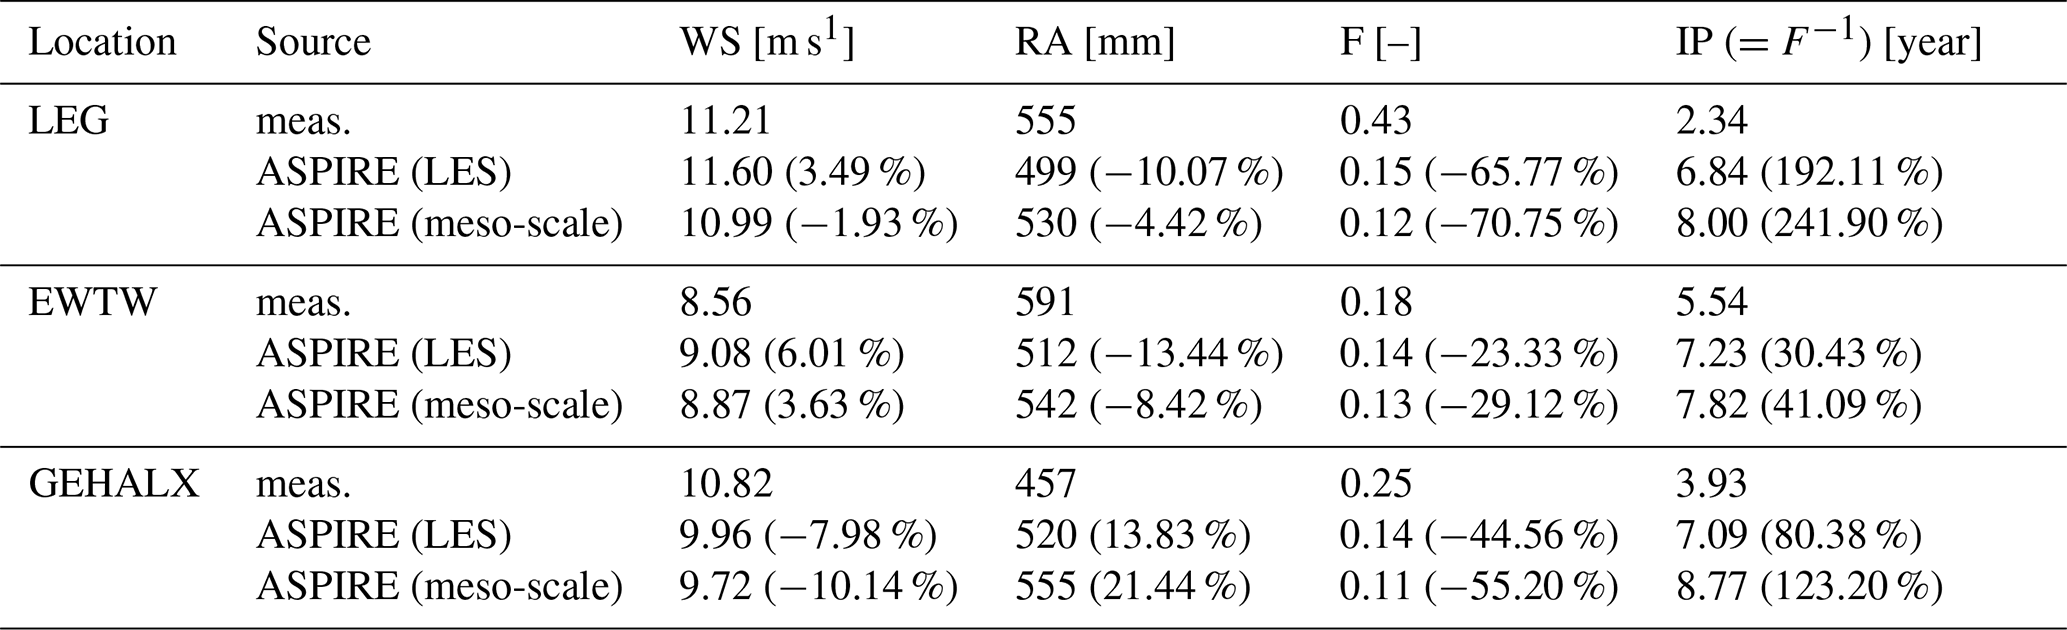
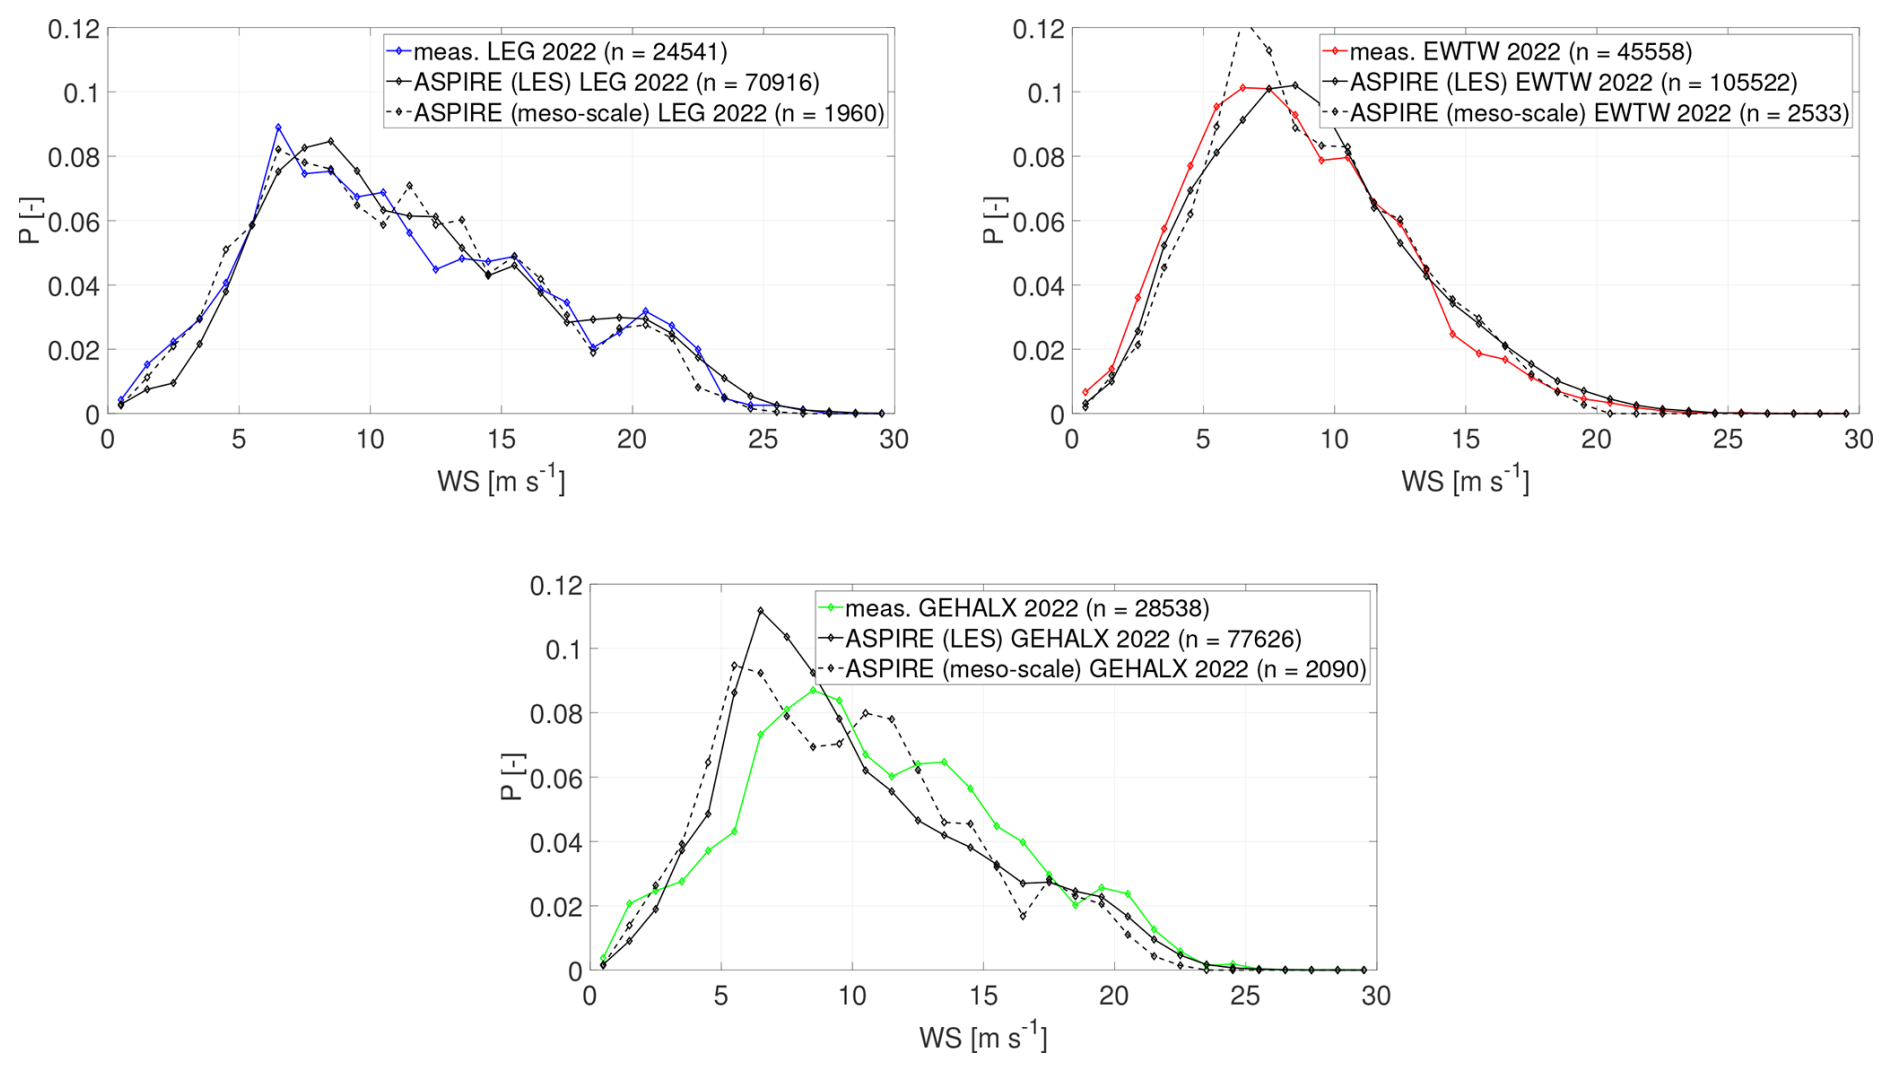
Figure 7Comparison of measured and simulated probabilities of wind speed during rainy intervals at the measurement sites. Here, the numerical results are from the high-resolution LES.
3.2.2 Detailed comparison between meso-scale simulations and high-resolution LES
Table 2 shows that the estimated accumulated damage is higher when using LES compared to meso-scale simulations for all the studied locations. Specifically, it is 20 %, 7 %, and 21 % higher at LEG, EWTW, and GEHALX, respectively. The explanation for this can be found in the distribution of simulated rainfall across different rain rates and wind speed conditions. Figure 8 depicts the annual rainfall broken down into wind speed and rain rate bins. According to this figure, LES predicts a lower total rain amount at all locations compared to meso-scale simulations. However, the distribution of rainfall varies across wind speed and rain rate bins. More specifically, LES captures more extreme events, with higher rainfall occurring at greater rain rates and higher wind speeds. As depicted in Fig. 9, these extreme events result in larger accumulated damage because high-intensity rain events contain larger and more erosive raindrops. As mentioned, the ability of our LES setup to capture more extreme events than meso-scale simulations is related to temporal averaging. Meso-scale simulations use a 1 h temporal resolution, while LESs use a 1 min temporal resolution. Temporal averaging implies that the rain rate remains constant over the output interval. The rain rate varies significantly within an hour, with extreme events occurring over minutes. This is why the temporal resolution used by LES allows them to capture these events, while they are averaged out by the meso-scale simulations.
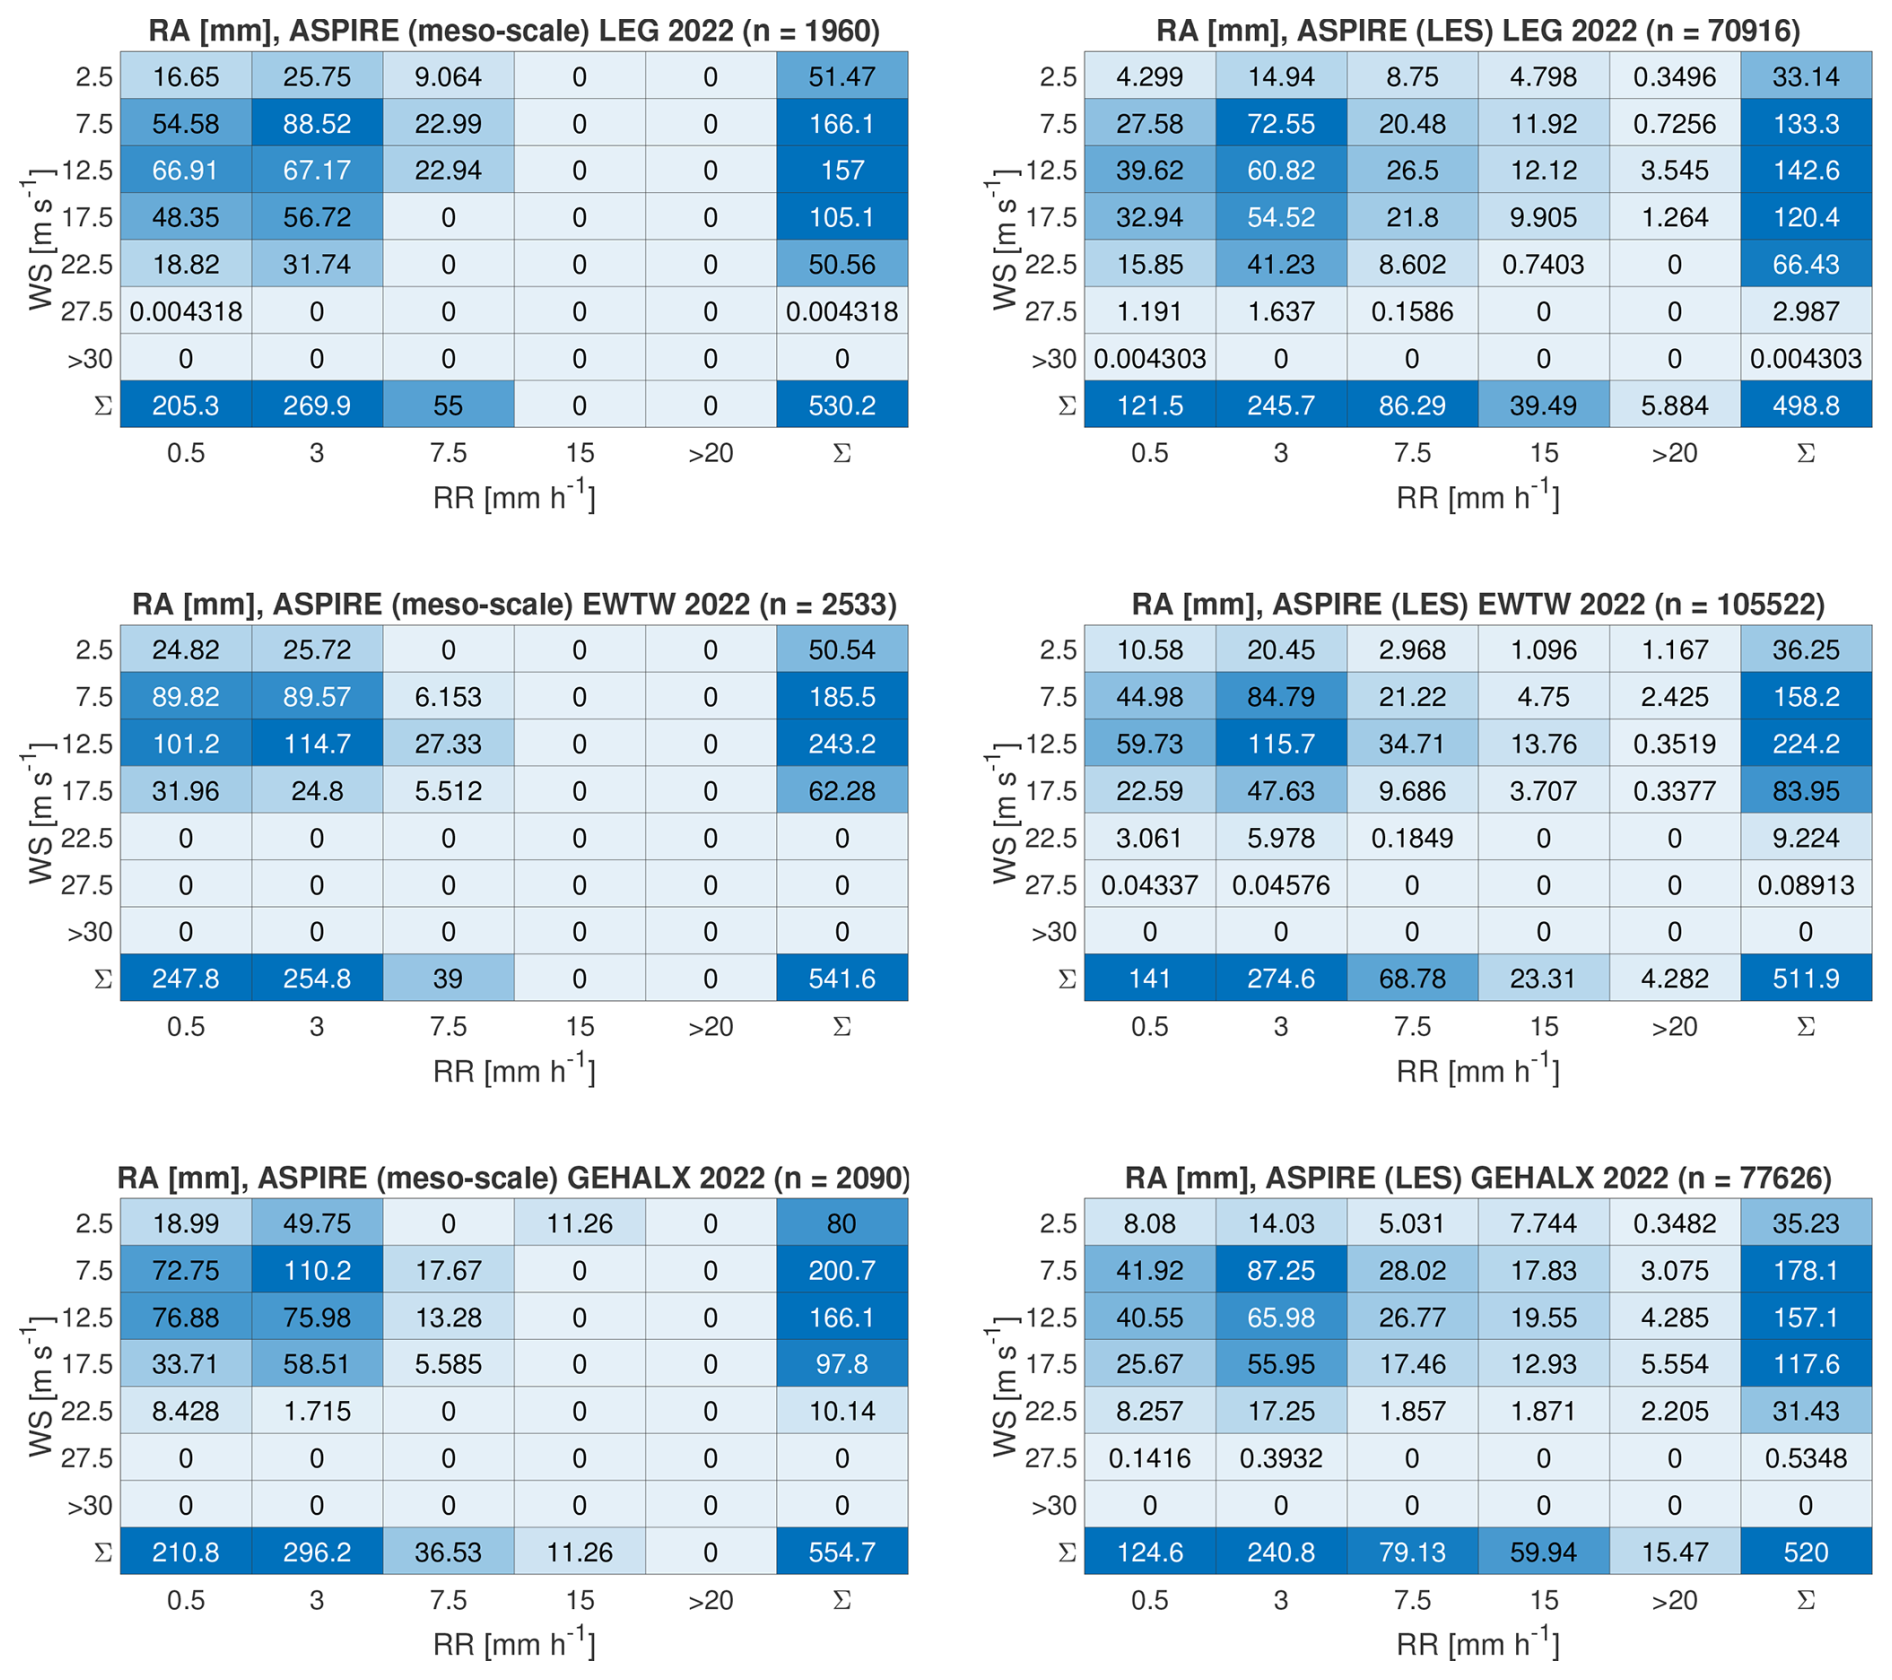
Figure 8Annual rainfall categorized into bins based on wind speed and rain rate. Presented here are the numerical results from meso-scale simulations and high-resolution LES.
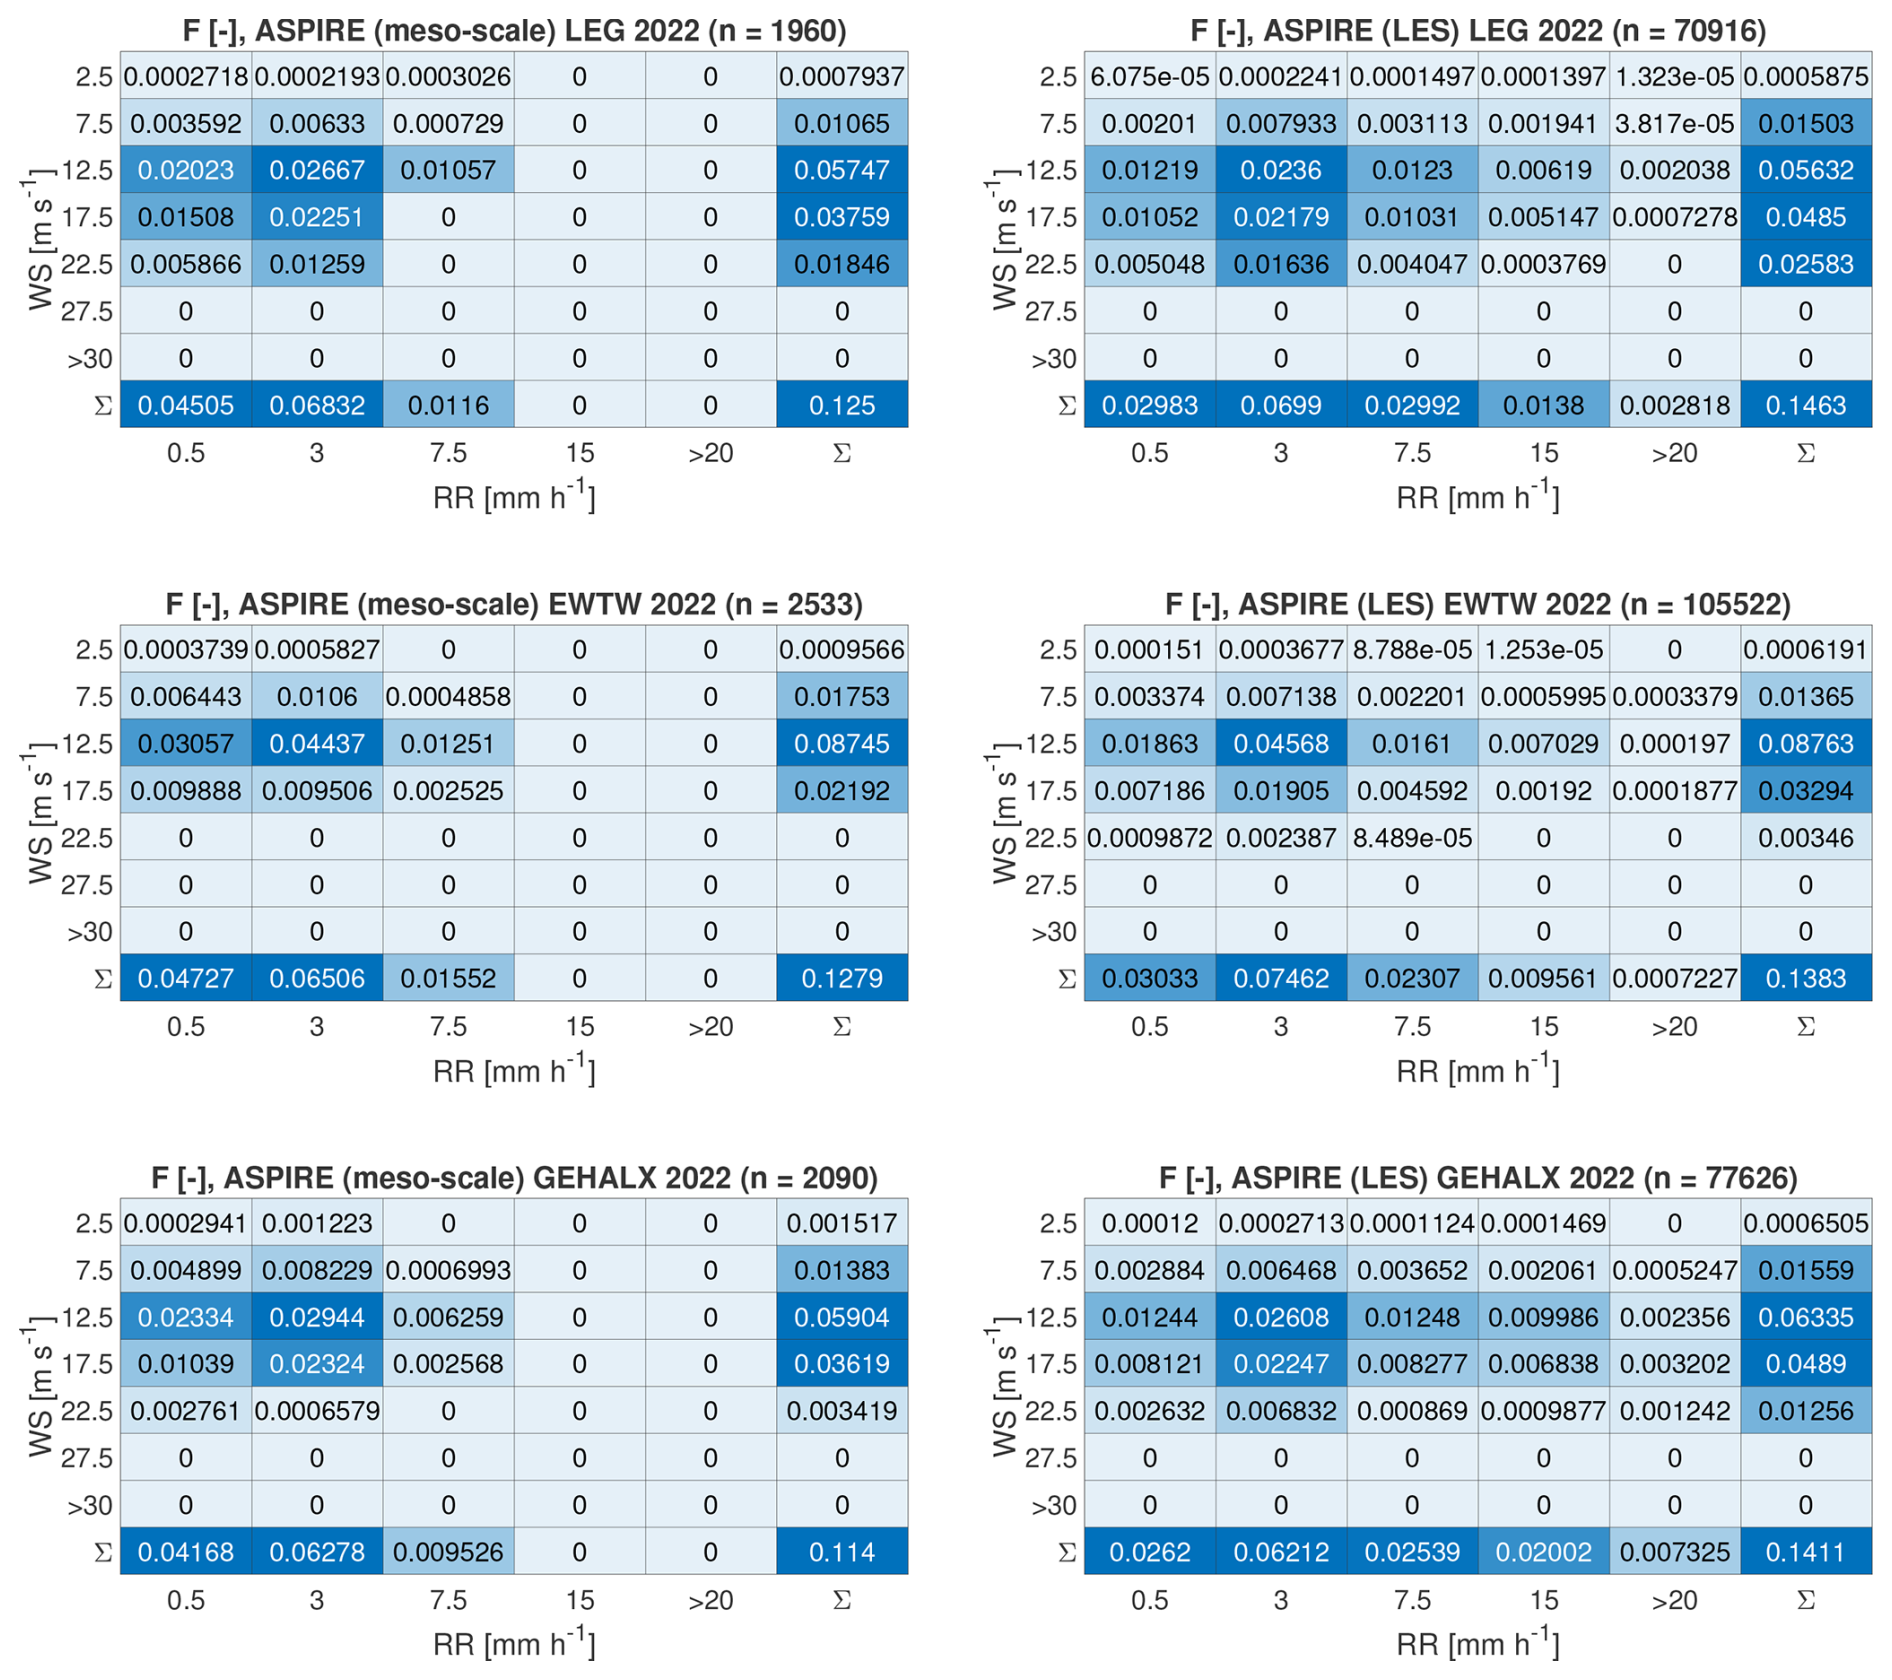
Figure 9Total annual damage classified into categories based on wind speed and rain rate. Presented here are the numerical results from meso-scale simulations and high-resolution LES.
Figures 10, 11, 12, and 13 depict the comparison between meso-scale simulations and high-resolution LES on the derived contour maps for the annual accumulated damage, annual incubation period, annual mean wind speed at 100 m a.g.l. and 100 m a.m.s.l., and annual rainfall, respectively. It is observed that these calculations yield consistent maps. The side-by-side comparison of the contour maps obtained using meso-scale simulations and LES reveals alignment in the spatial patterns, confirming that meso-scale simulations produce satisfactory results where regional differences are captured consistently with LES.
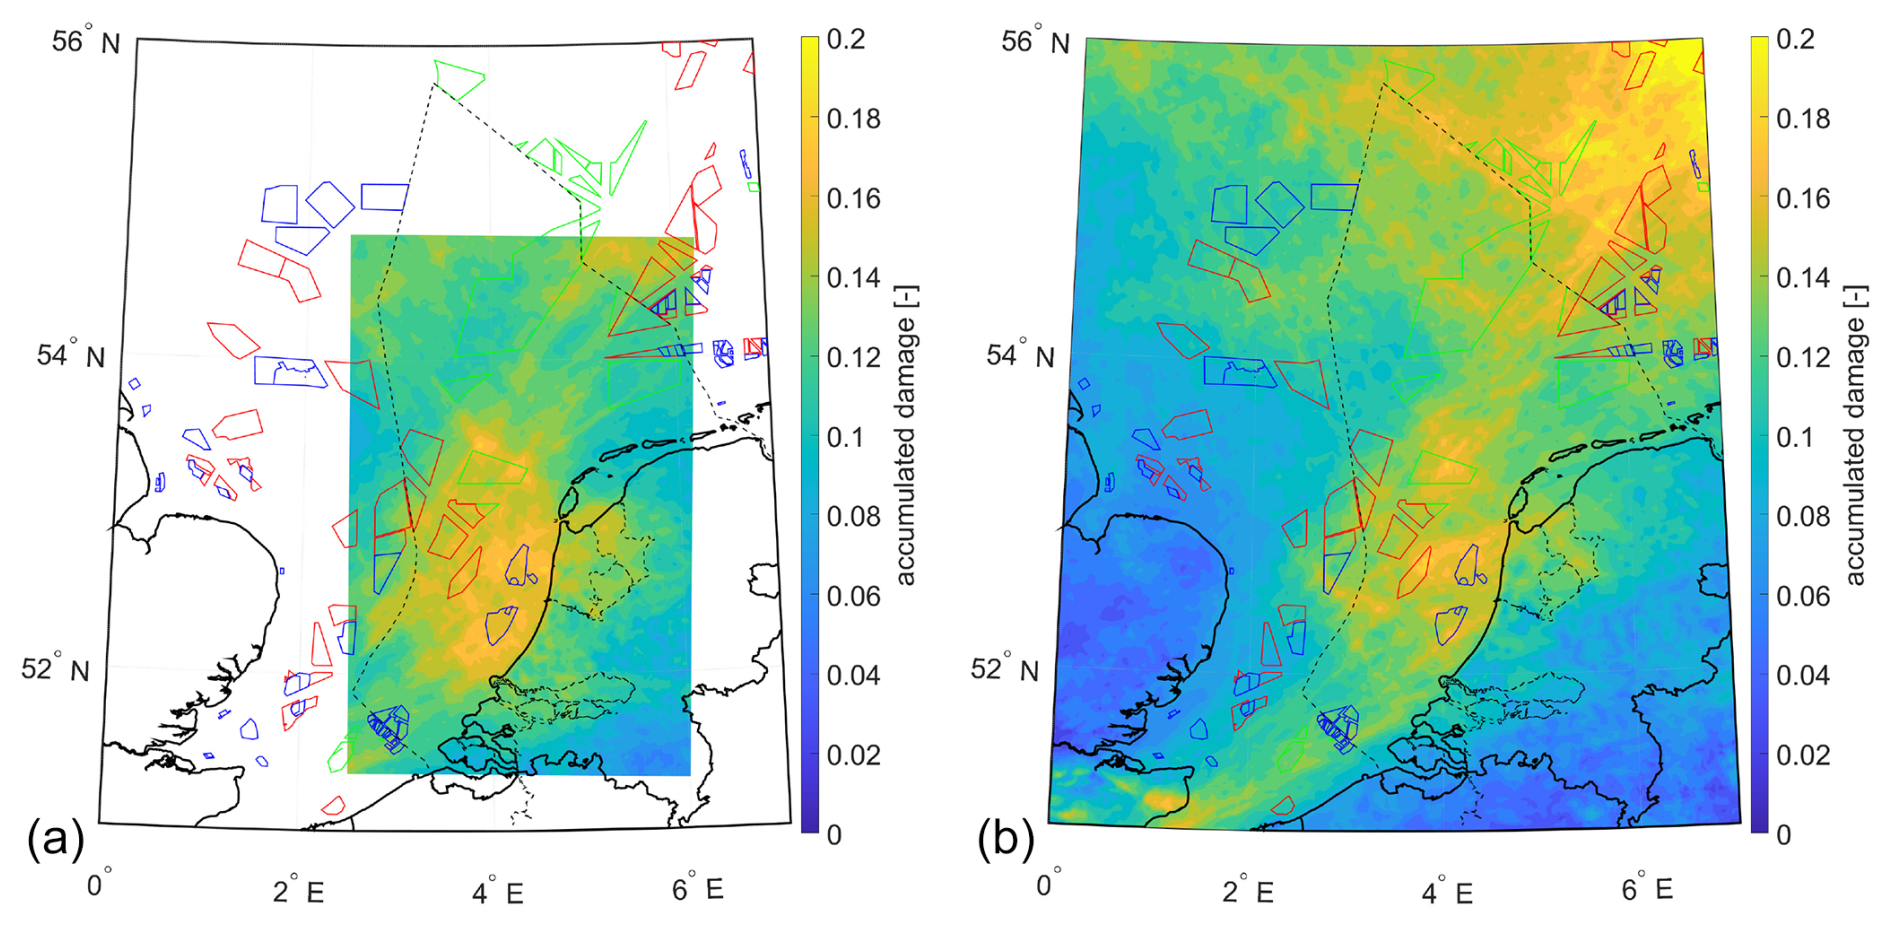
Figure 10Contour map of yearly accumulated damage based on 1 year of high-resolution LES (a) and meso-scale simulations (b).
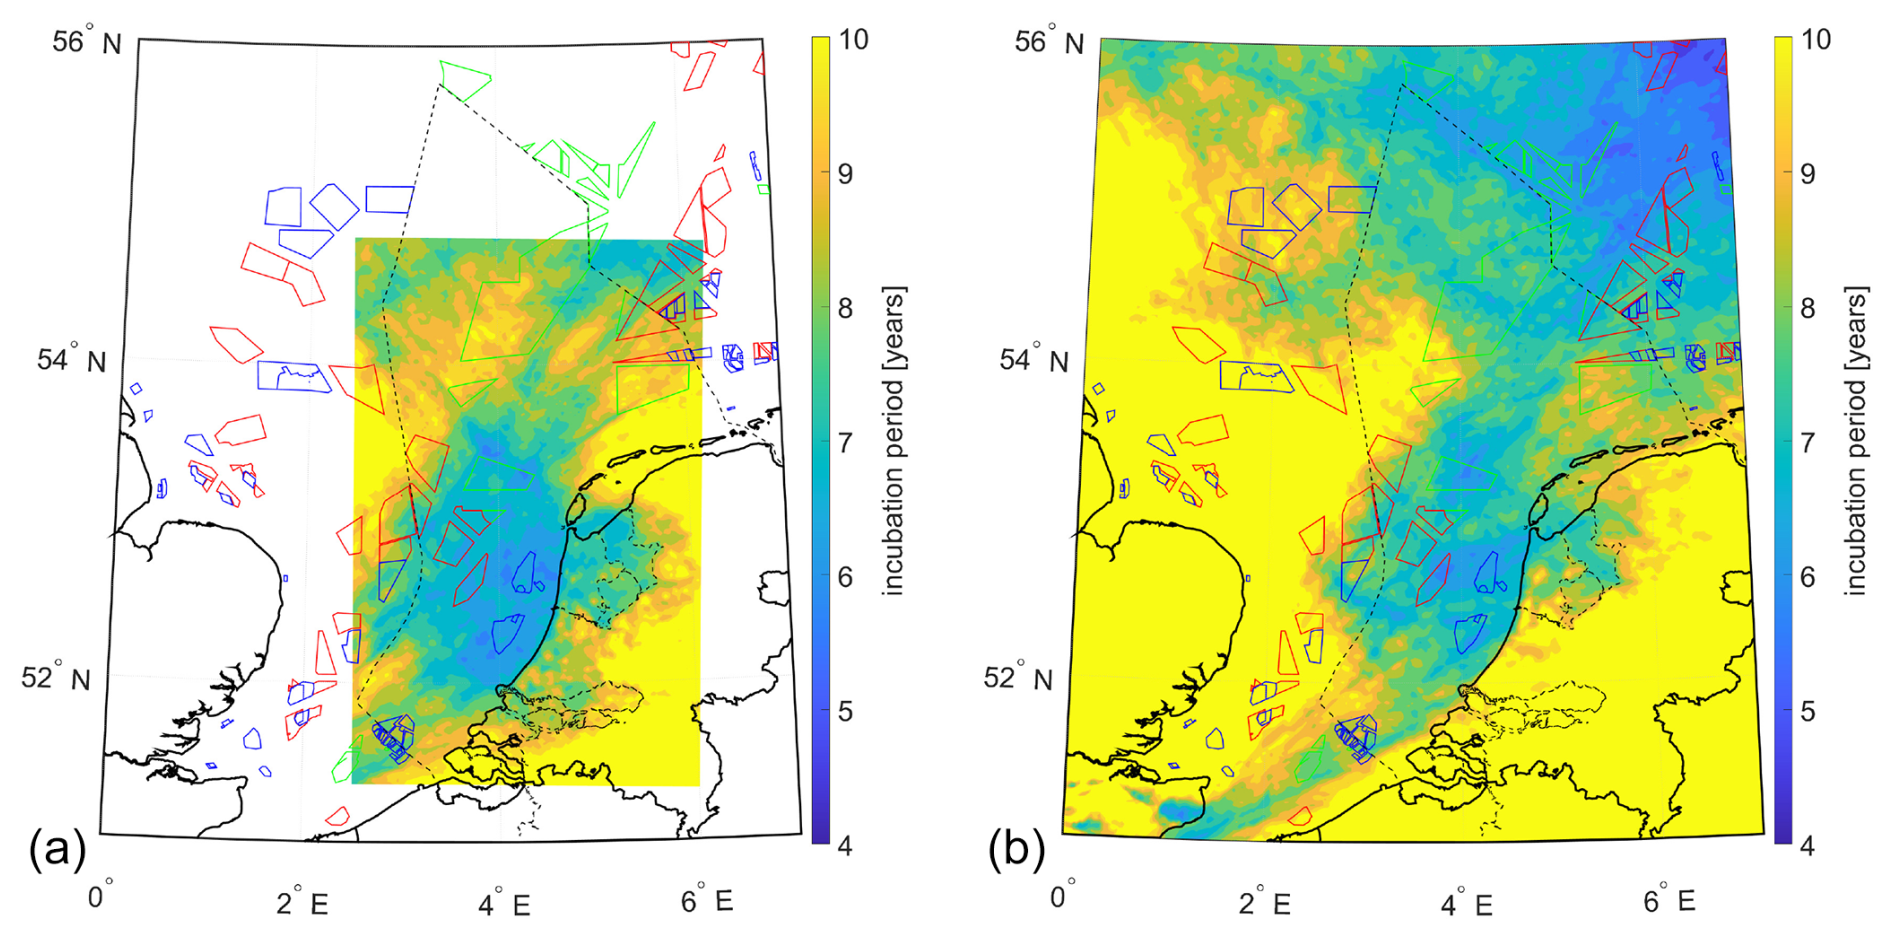
Figure 11Contour map of yearly incubation period based on 1 year of high-resolution LES (a) and meso-scale simulations (b).
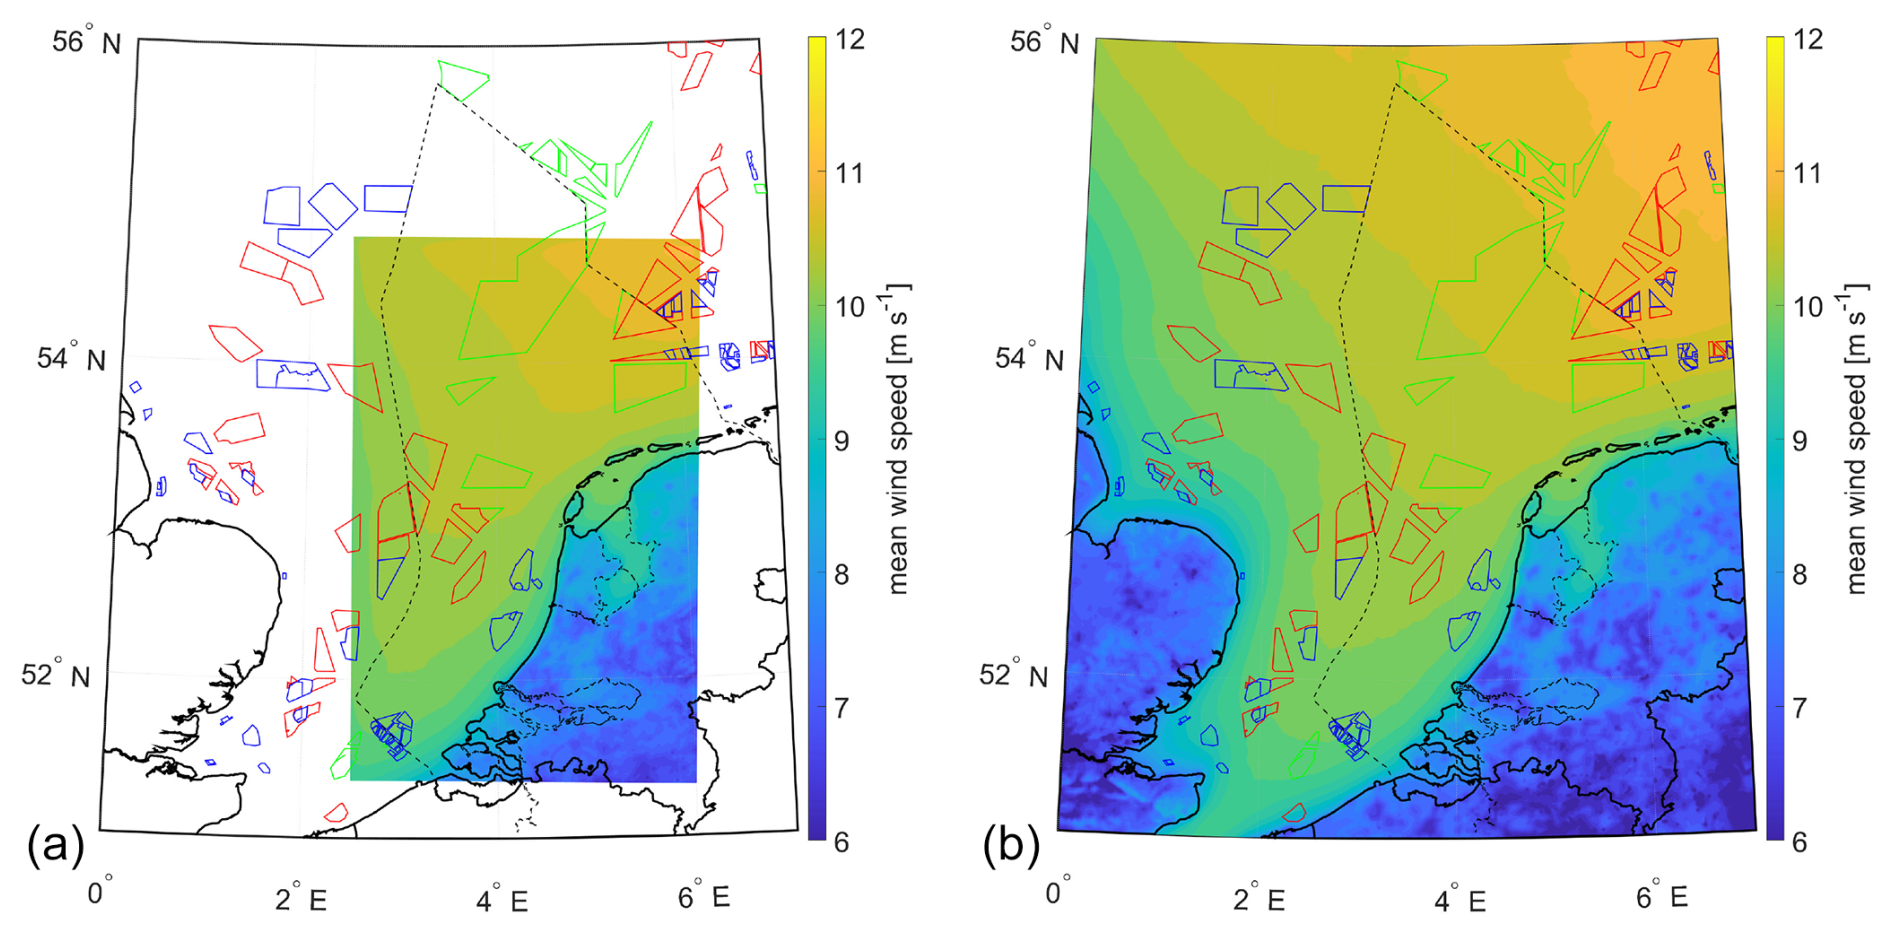
Figure 12Contour map of yearly mean wind speed at 100 m a.g.l. and 100 m a.m.s.l. based on 1 year of high-resolution LES (a) and meso-scale simulations (b).
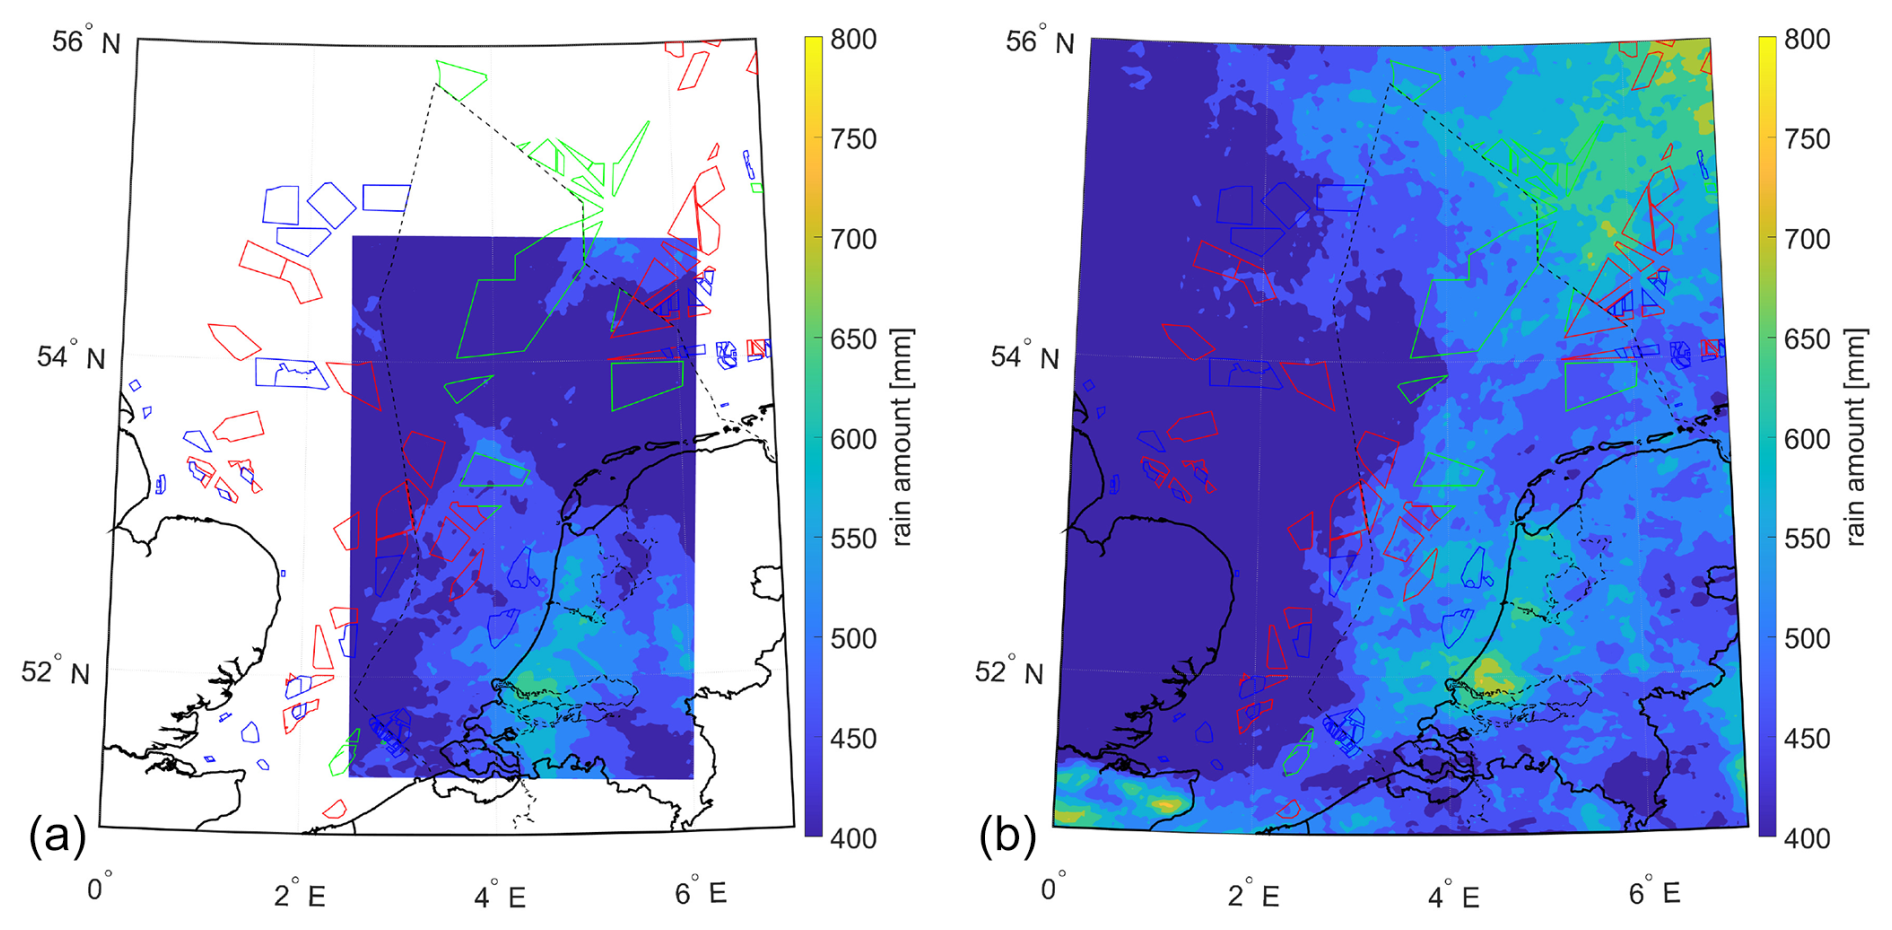
Figure 13Contour map of yearly rain amount based on 1 year of high-resolution LES (a) and meso-scale simulations (b).
In summary, Figs. 10, 11, 12, and 13 provide a convincing argument supporting the claim that meso-scale simulations can produce satisfactory atlases. However, Figs. 8 and 9 effectively illustrate the extent to which LES is superior in capturing more extreme events. LES is much better at capturing local short-lived extreme events, which are of high importance for LEE, but it requires significantly more computational resources.
3.2.3 Detailed comparison between measurements and high-resolution LES
To explore the aforementioned differences between simulations and measurements in total accumulated damage in greater detail, we present the annual rainfall, total damage, and accumulated damage per rain amount organized into bins based on wind speed and rain rate in Figs. 14, 15, and 16, respectively. The findings in this section remain consistent whether we consider LES or meso-scale simulations. The primary difference, as previously explained, is that LES captures more extreme events compared to meso-scale simulations. Both LES and meso-scale simulations rely on the same model for the DSD. Therefore, for the sake of brevity, we will conduct this analysis using only the LES.
Damage accumulation is more significant during extreme events, namely events of high rain intensity and strong wind speeds. Caboni et al. (2024) noted that at LEG 30 % of the yearly damage is accumulated over just 12 h, during which the wind speed is greater than 17.5 m s−1 and the rain rate is greater than 7.5 mm h−1. In fact, high-intensity events feature a greater number of relatively large droplets compared to low-intensity events. Larger droplets are more erosive than smaller ones when comparing the same volume of liquid (Barfknecht and von Terzi, 2025). As noted earlier, wind speed also influences LEE. At higher wind speeds, the blades rotate faster, resulting in a greater impact speed between the rain droplets and the blades. Figures 14 and 15 show that the extreme events differ between measurements and simulations, offering a first explanation for the variations in accumulated damage. Except for GEHALX, both LEG and EWTW have recorded more extreme events than those predicted by simulations. The difference in extreme events is especially pronounced at LEG, resulting in significant variation in accumulated damage. Currently, the authors cannot explain why extreme events are more underestimated at LEG compared to other locations. It is possible that this discrepancy is related to the aforementioned uncertainties affecting disdrometer measurements. Compared to onshore locations, offshore and coastal environments are experimentally shown to experience more extreme rain events (Caboni et al., 2024; Hasager et al., 2020). This trend also appears to be captured by the simulations (see Fig. 14).
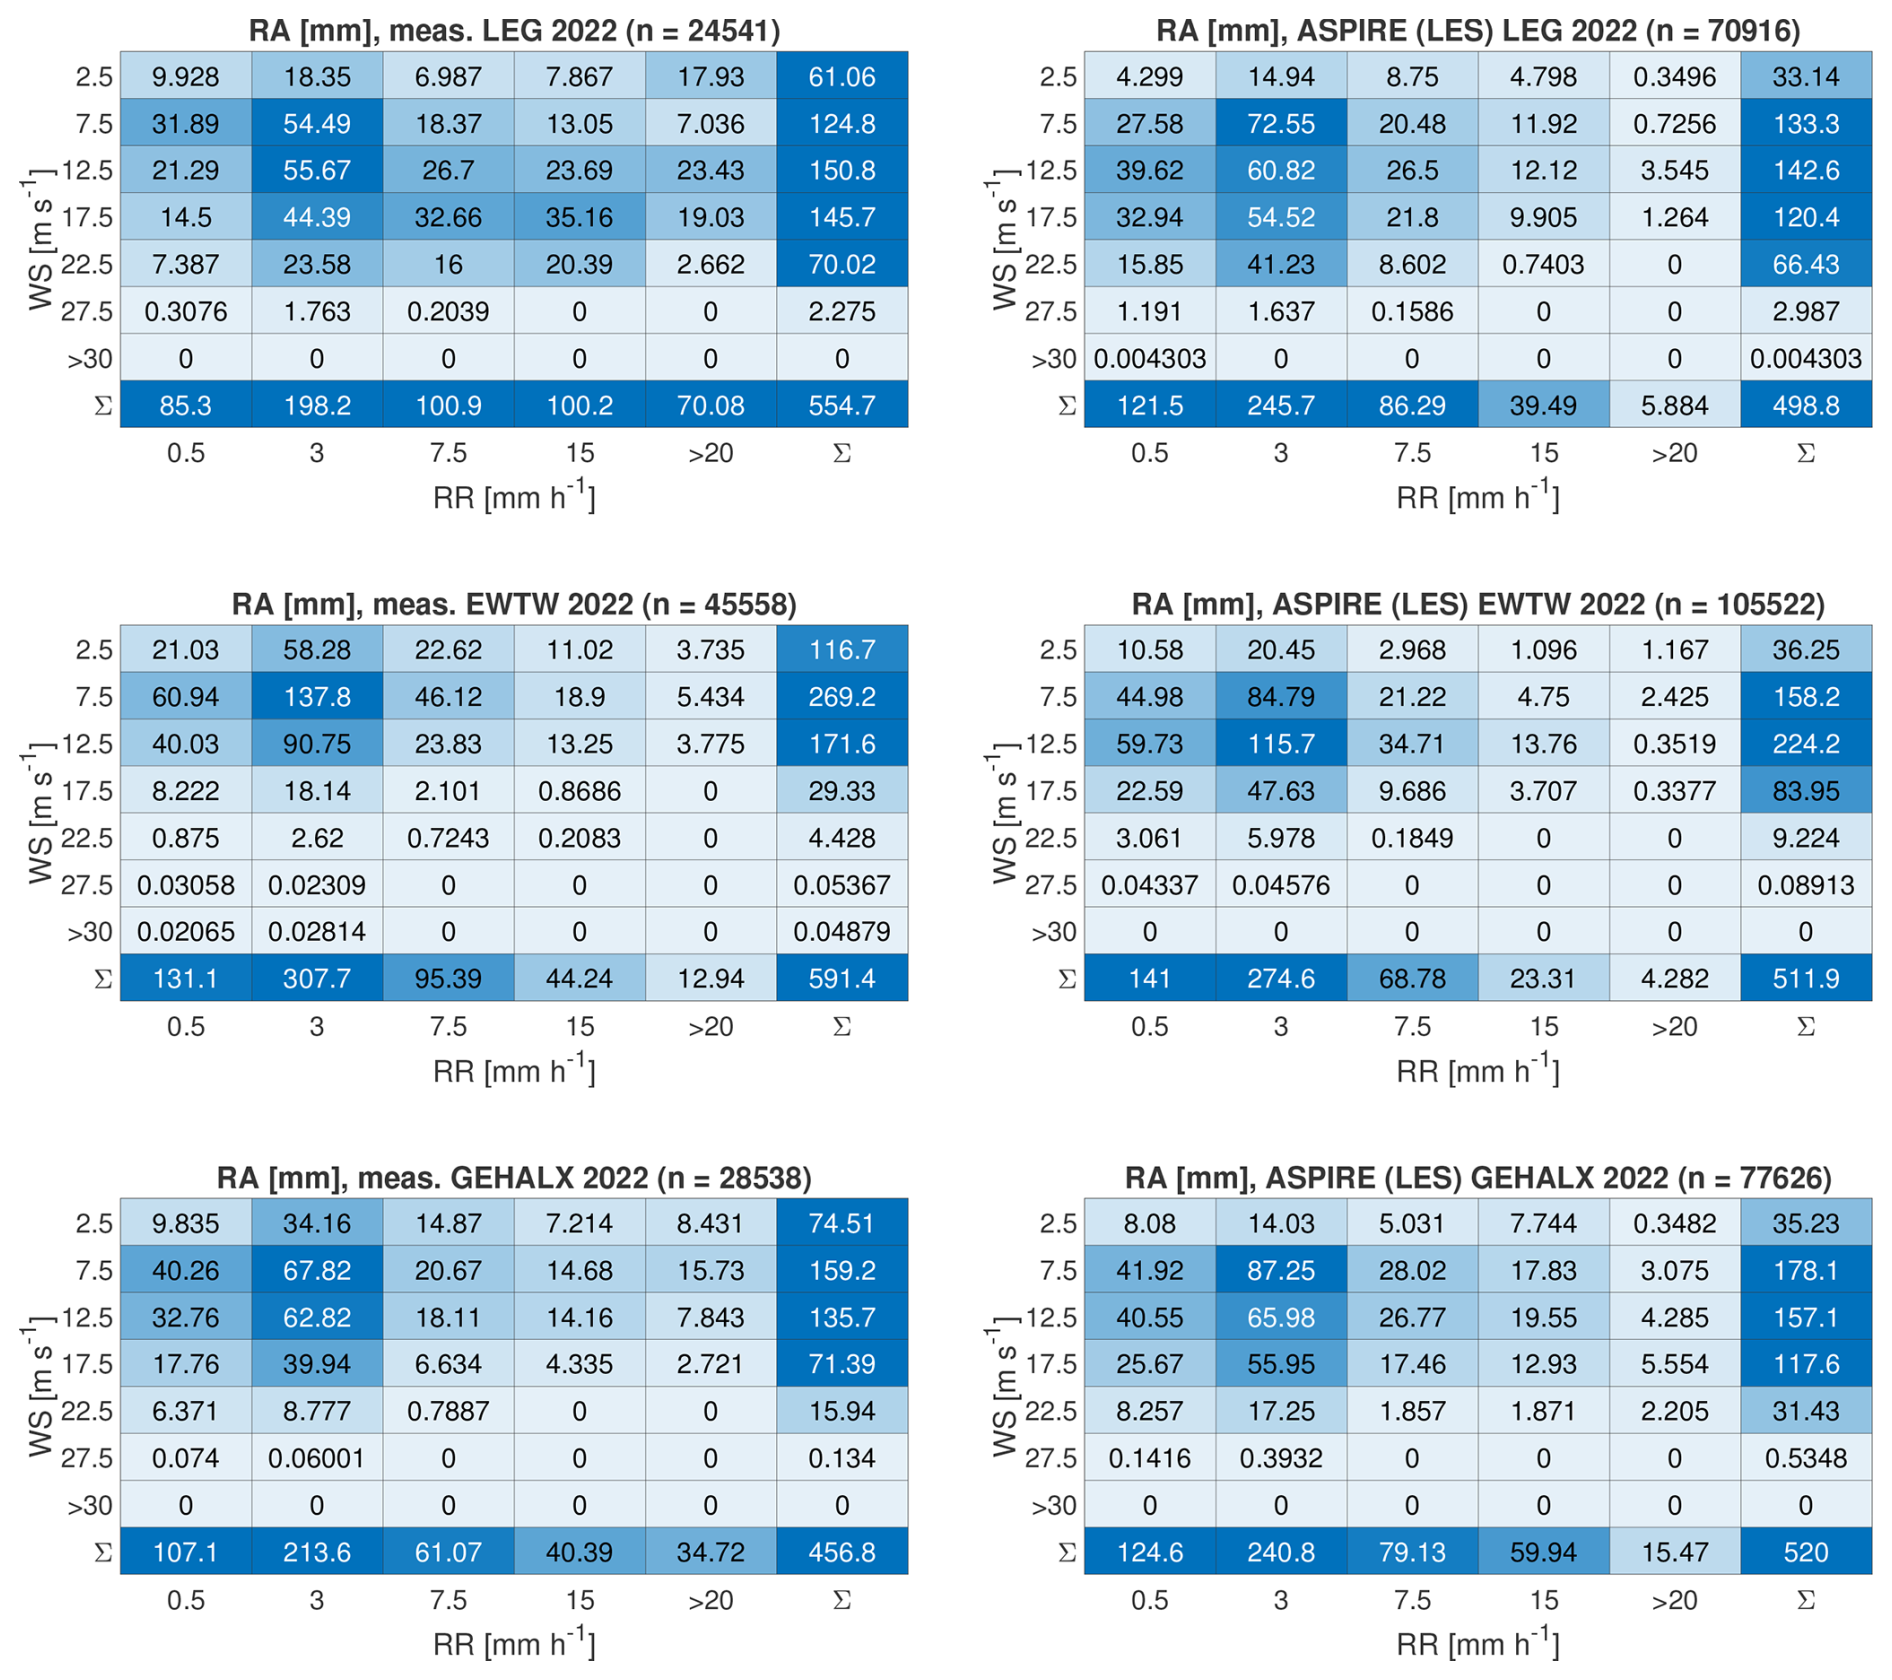
Figure 14Annual rainfall categorized into bins based on wind speed and rain rate. Presented here are the numerical results from the high-resolution LES.
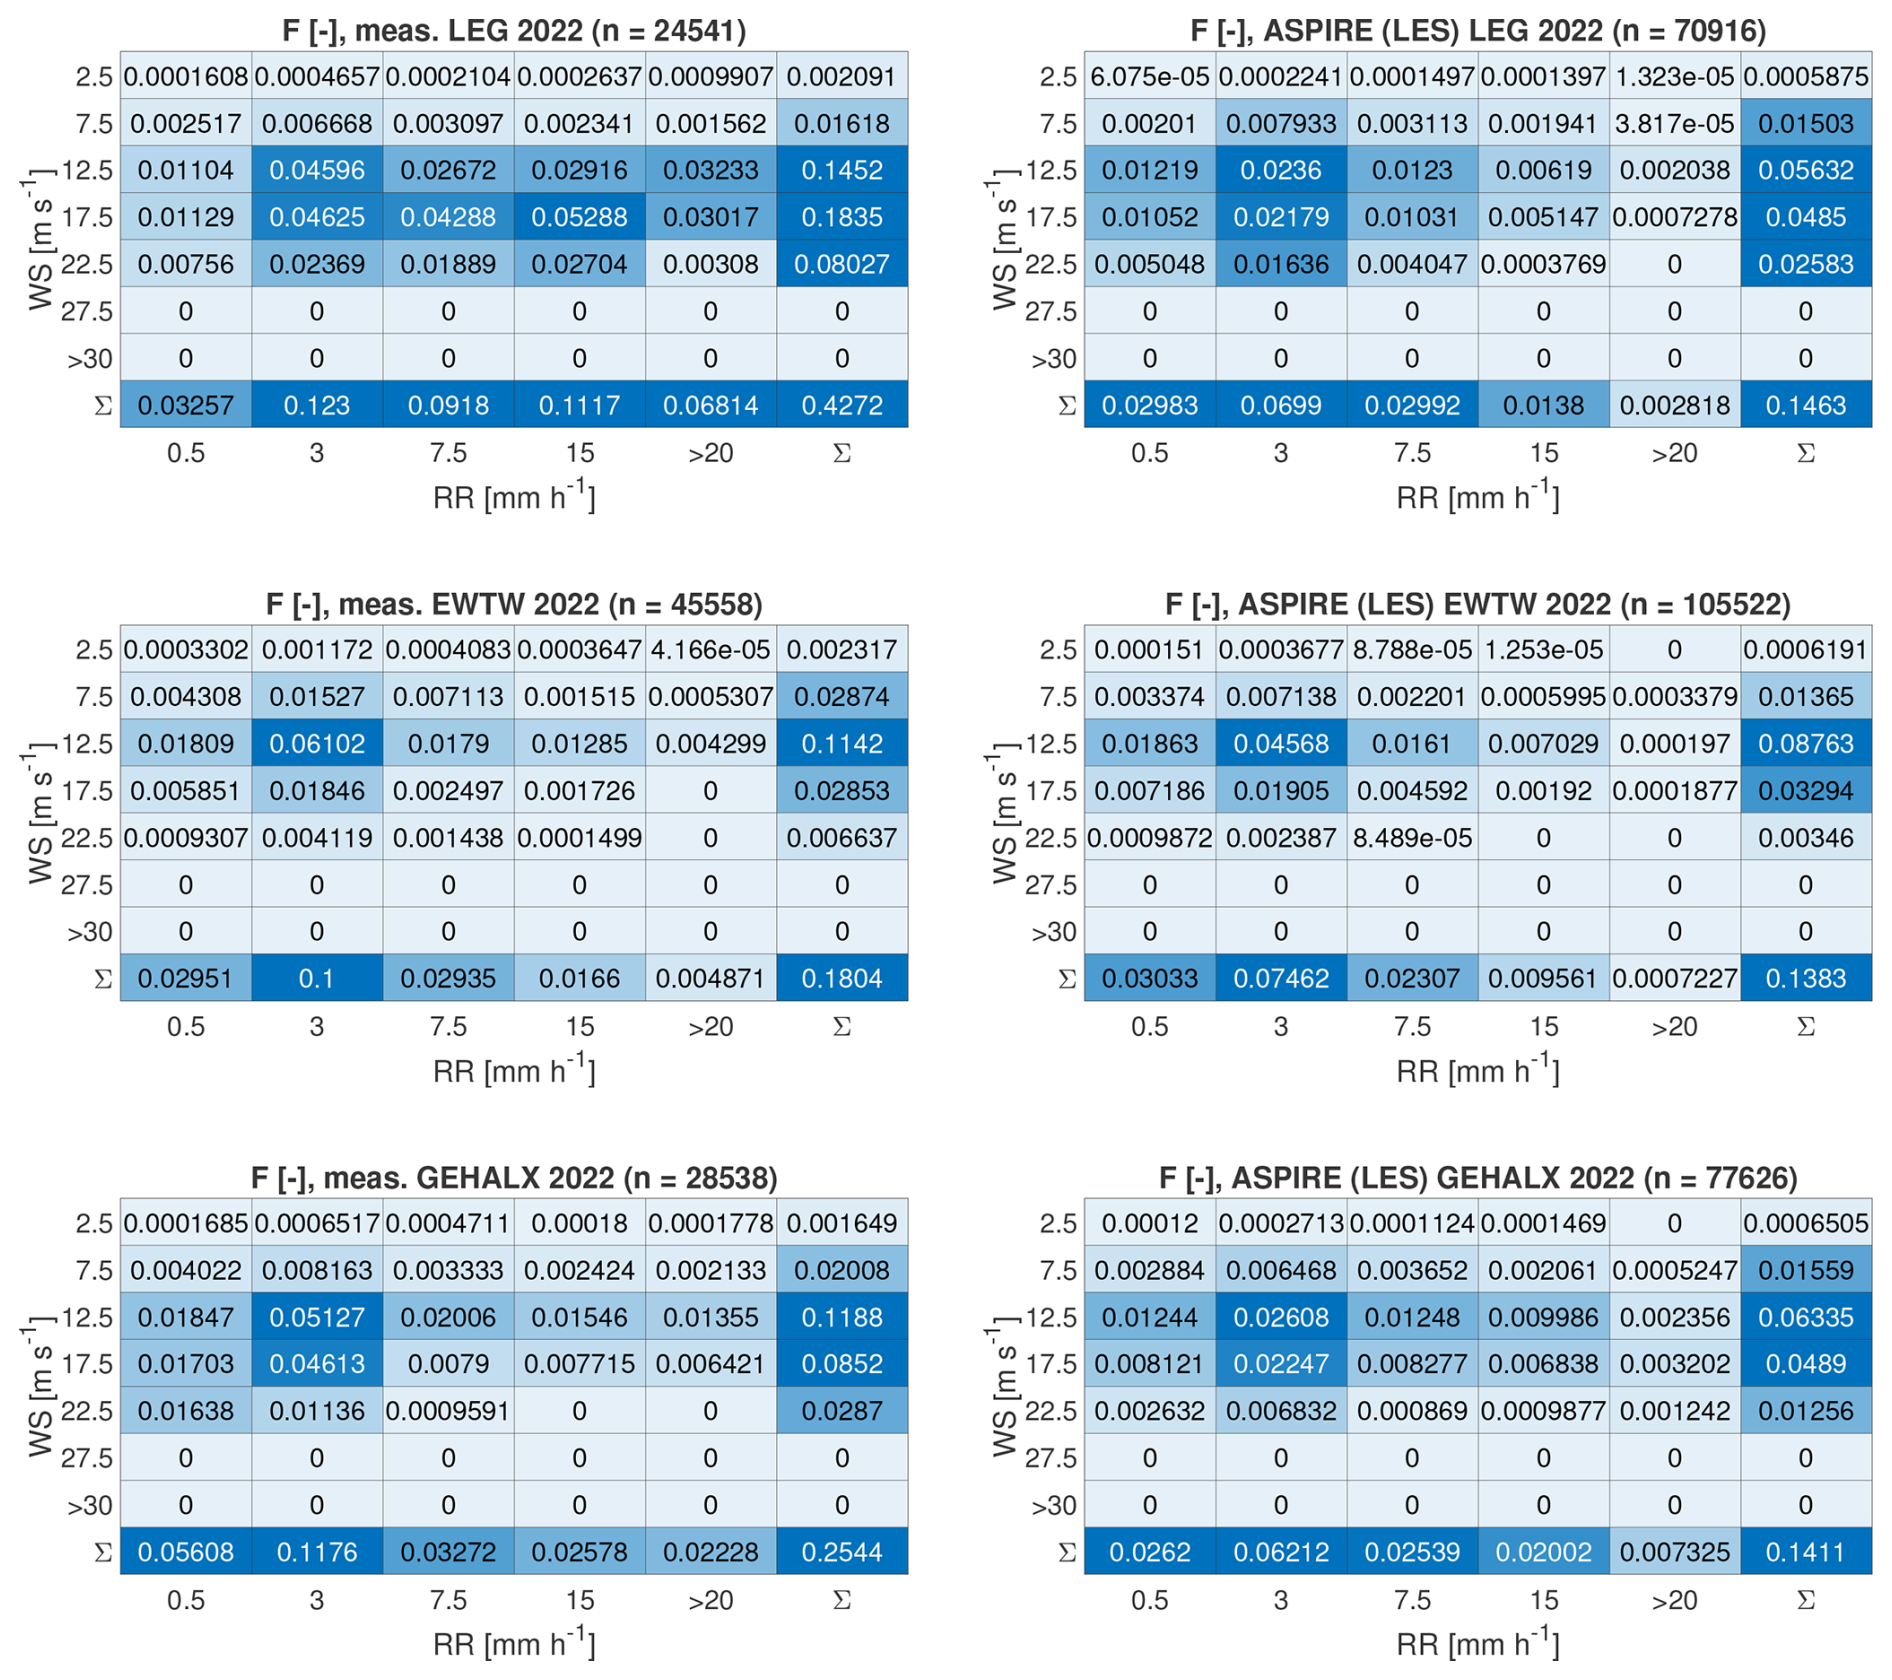
Figure 15Total annual damage classified into categories based on wind speed and rain rate. Presented here are the numerical results from the high-resolution LES.
In addition to extreme events, variations in DSD also contribute to differences in damage accumulation. The impact of these DSD differences is illustrated in Fig. 16, which shows accumulated damage per unit of rainfall. The tables for each bin display the accumulated damage corresponding to every millimeter of rain that has fallen. It is noted that, within the same categories, the observed accumulated damage per millimeter of rain exceeds the predictions made by the simulations. This discrepancy is linked to the DSD.
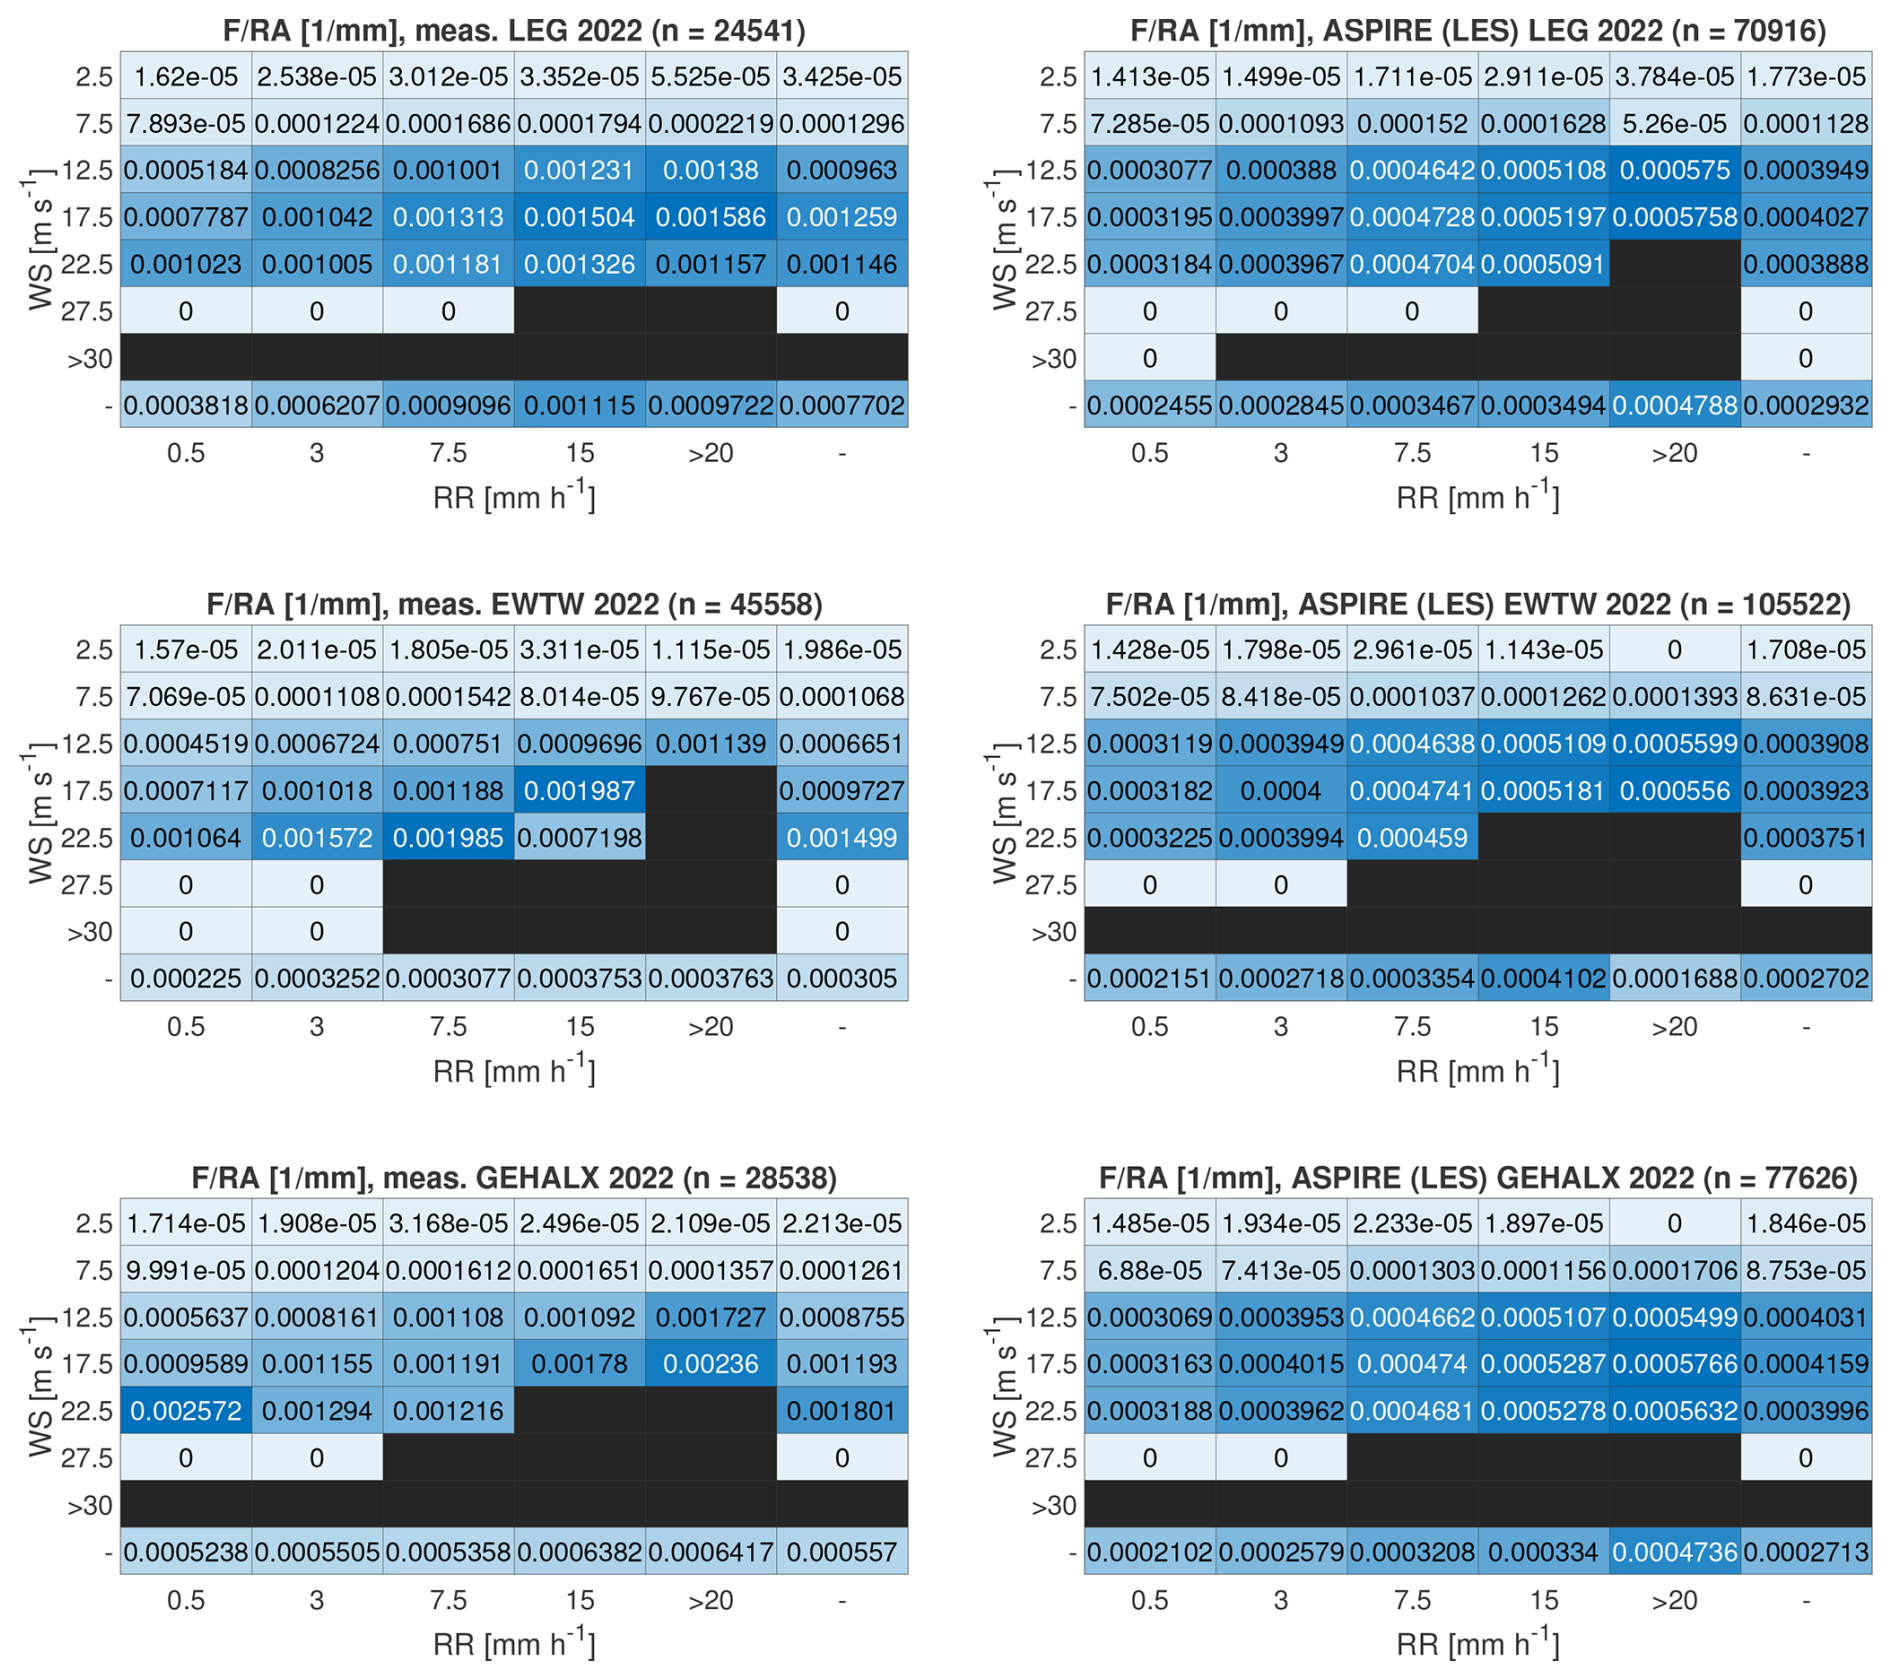
Figure 16Yearly accumulated damage per rain amount sorted into wind speed and rain rate bins. Presented here are the numerical results from the high-resolution LES.
Figure 17 shows the comparison between the measured and simulated DSD at the three locations, for a fixed rain rate and varying wind speeds. As mentioned above, the simulations assume a DSD based on a Marshall–Palmer distribution. The comparison shows that the Marshall–Palmer distribution matches the measured DSD for drop sizes up to approximately 3 mm. Beyond this size, the Marshall–Palmer distribution significantly underestimates the droplet quantity. This difference becomes more pronounced as the wind speed increases. Indeed, the measurements clearly indicate that wind speed influences the DSD. At higher wind speeds, a greater number of relatively large droplets are observed. Similar results were also observed by Montero-Martínez and García-García (2016) and Thurai et al. (2019).
To finalize the comparison between observations and simulations, we also include the drop fall velocity. Figure 18 presents the comparison between the measured and simulated drop fall velocities at the three locations, for a fixed rain rate and different wind speeds. Concerning fall velocity, the approximation used in ASPIRE is based on a simple model provided by Lin et al. (1983). The approximation by Lin et al. (1983) aligns well with measurements for droplets with diameters of up to 2 mm. Beyond this value, the measurements show a constant falling speed, whereas the approximation of Lin et al. (1983) assumes that the fall velocity increases. Similarly to the DSD, the measured fall speed also appears to vary with wind speed, showing lower fall speeds at higher wind velocities.
By conducting 10-year-long meso-scale simulations to account for long-term climatology, our study has highlighted the variation in rain-induced erosivity across the Dutch North Sea. Examining the portion of the Dutch North Sea covered in the reanalysis-based erosion atlas by Hannesdóttir et al. (2024), no clear trends can be inferred within this region. This is because their atlas focuses on Scandinavian regions and only marginally and partially covers the Dutch North Sea. According to this atlas, the incubation period is approximately 4 years over the covered Dutch North Sea, which is about 40 % lower than the incubation period resulting from our meso-scale-based erosion atlas. These differences can be attributed not only to the weather model with specific resolutions and periods but also to assumptions regarding the DSD, drop fall speed, damage model, and fatigue characteristics of the LEP system. Such assumptions have a dramatic effect on the resulting incubation period. Due to the complexity of the calculations behind an erosion atlas, considering the assumptions and models used to generate it, it is not possible to detail where the differences between our atlas and the one by Hannesdóttir et al. (2024) come from. Future research should aim at dedicated comparisons of erosion atlases, systematically breaking down the calculation chain and comparing results for each portion.
Our study indicates that a LES setup with finer spatial and temporal resolution enhances the ability of simulations to capture more extreme events. This is because the smaller temporal resolution allows the simulations to detect more short-term extreme events with high rain intensity. Such high-intensity events contain larger and more erosive droplets. With larger temporal resolutions, these events are averaged out. Our comparative analysis with actual measurements reveals that both meso-scale and LES models tend to underpredict the accumulated damage. One reason for this is that the Marshall–Palmer distribution assumed by both numerical models significantly underestimates the quantity of large droplets compared to what is measured. Another reason is that more extreme events are recorded than those simulated, especially at the instrumented offshore location. Significant uncertainties still exist in detecting such events in both measurements and simulations. Detailed measurements of rain in offshore locations are new, and further research is required to improve these measurements and establish confidence bounds.
As previously mentioned, the estimates of incubation periods provided by this study, whether derived from measurements or simulations, are based on various methods and several assumptions. Unfortunately, these estimates have not been validated in real-world conditions yet. However, we can say that these figures are roughly in line with the leading edge repair interventions of wind turbines in the Dutch North Sea.
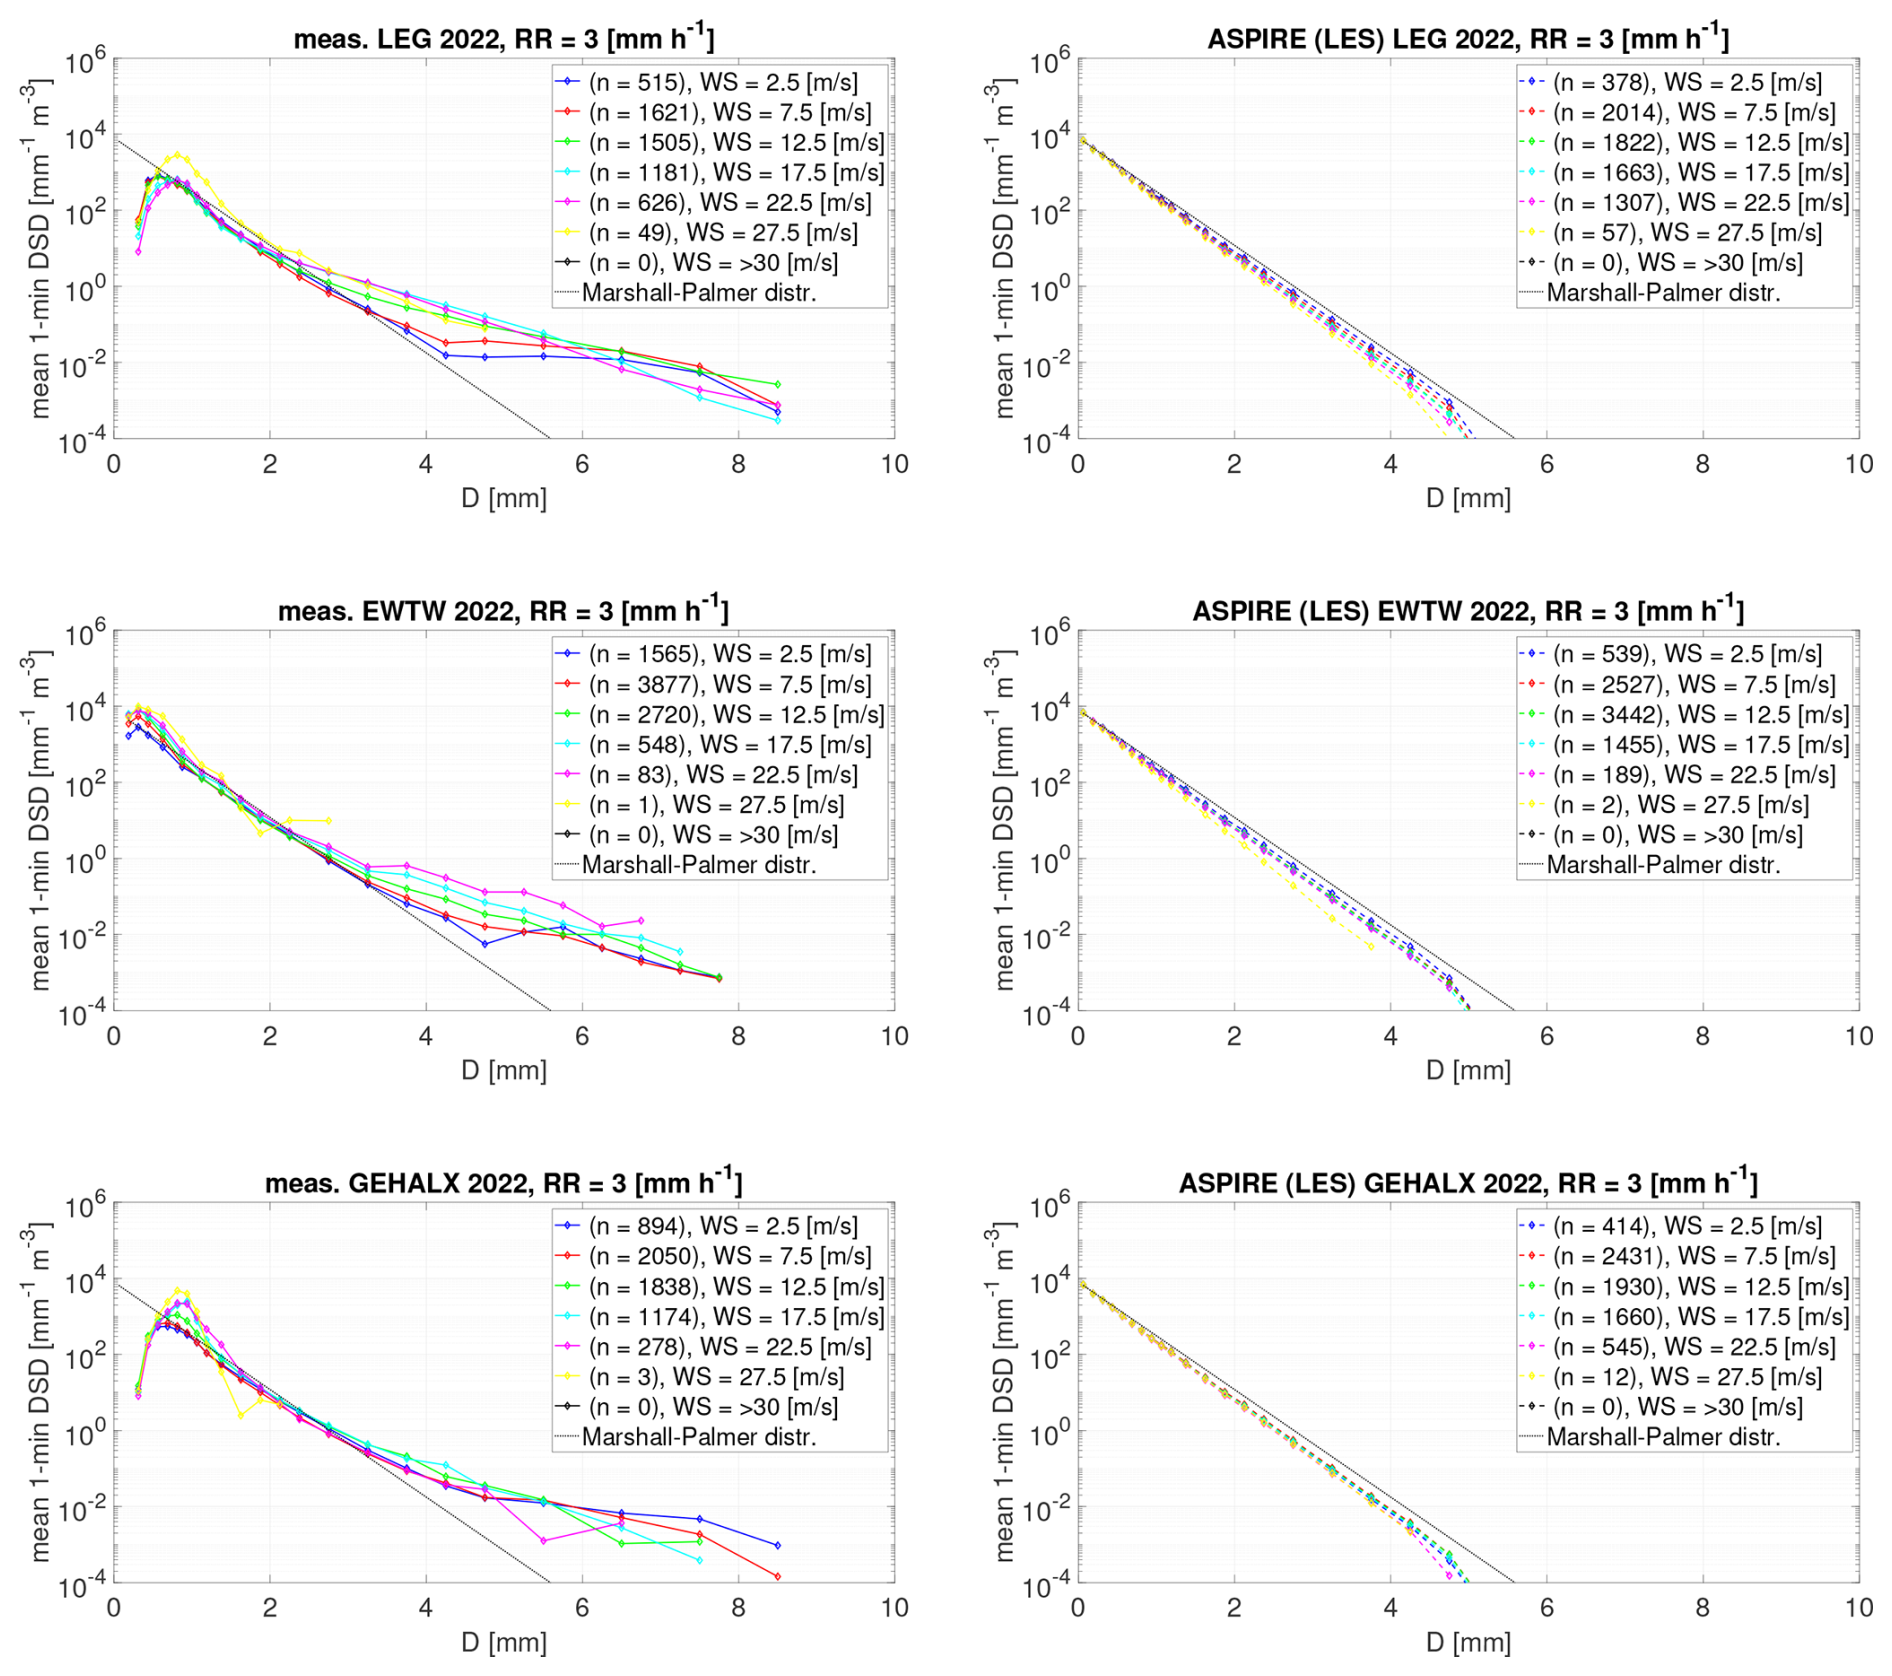
Figure 17Mean drop size distributions for a fixed rain rate of 3 mm h−1 and different wind speeds. ASPIRE's results are here derived from the LES data.
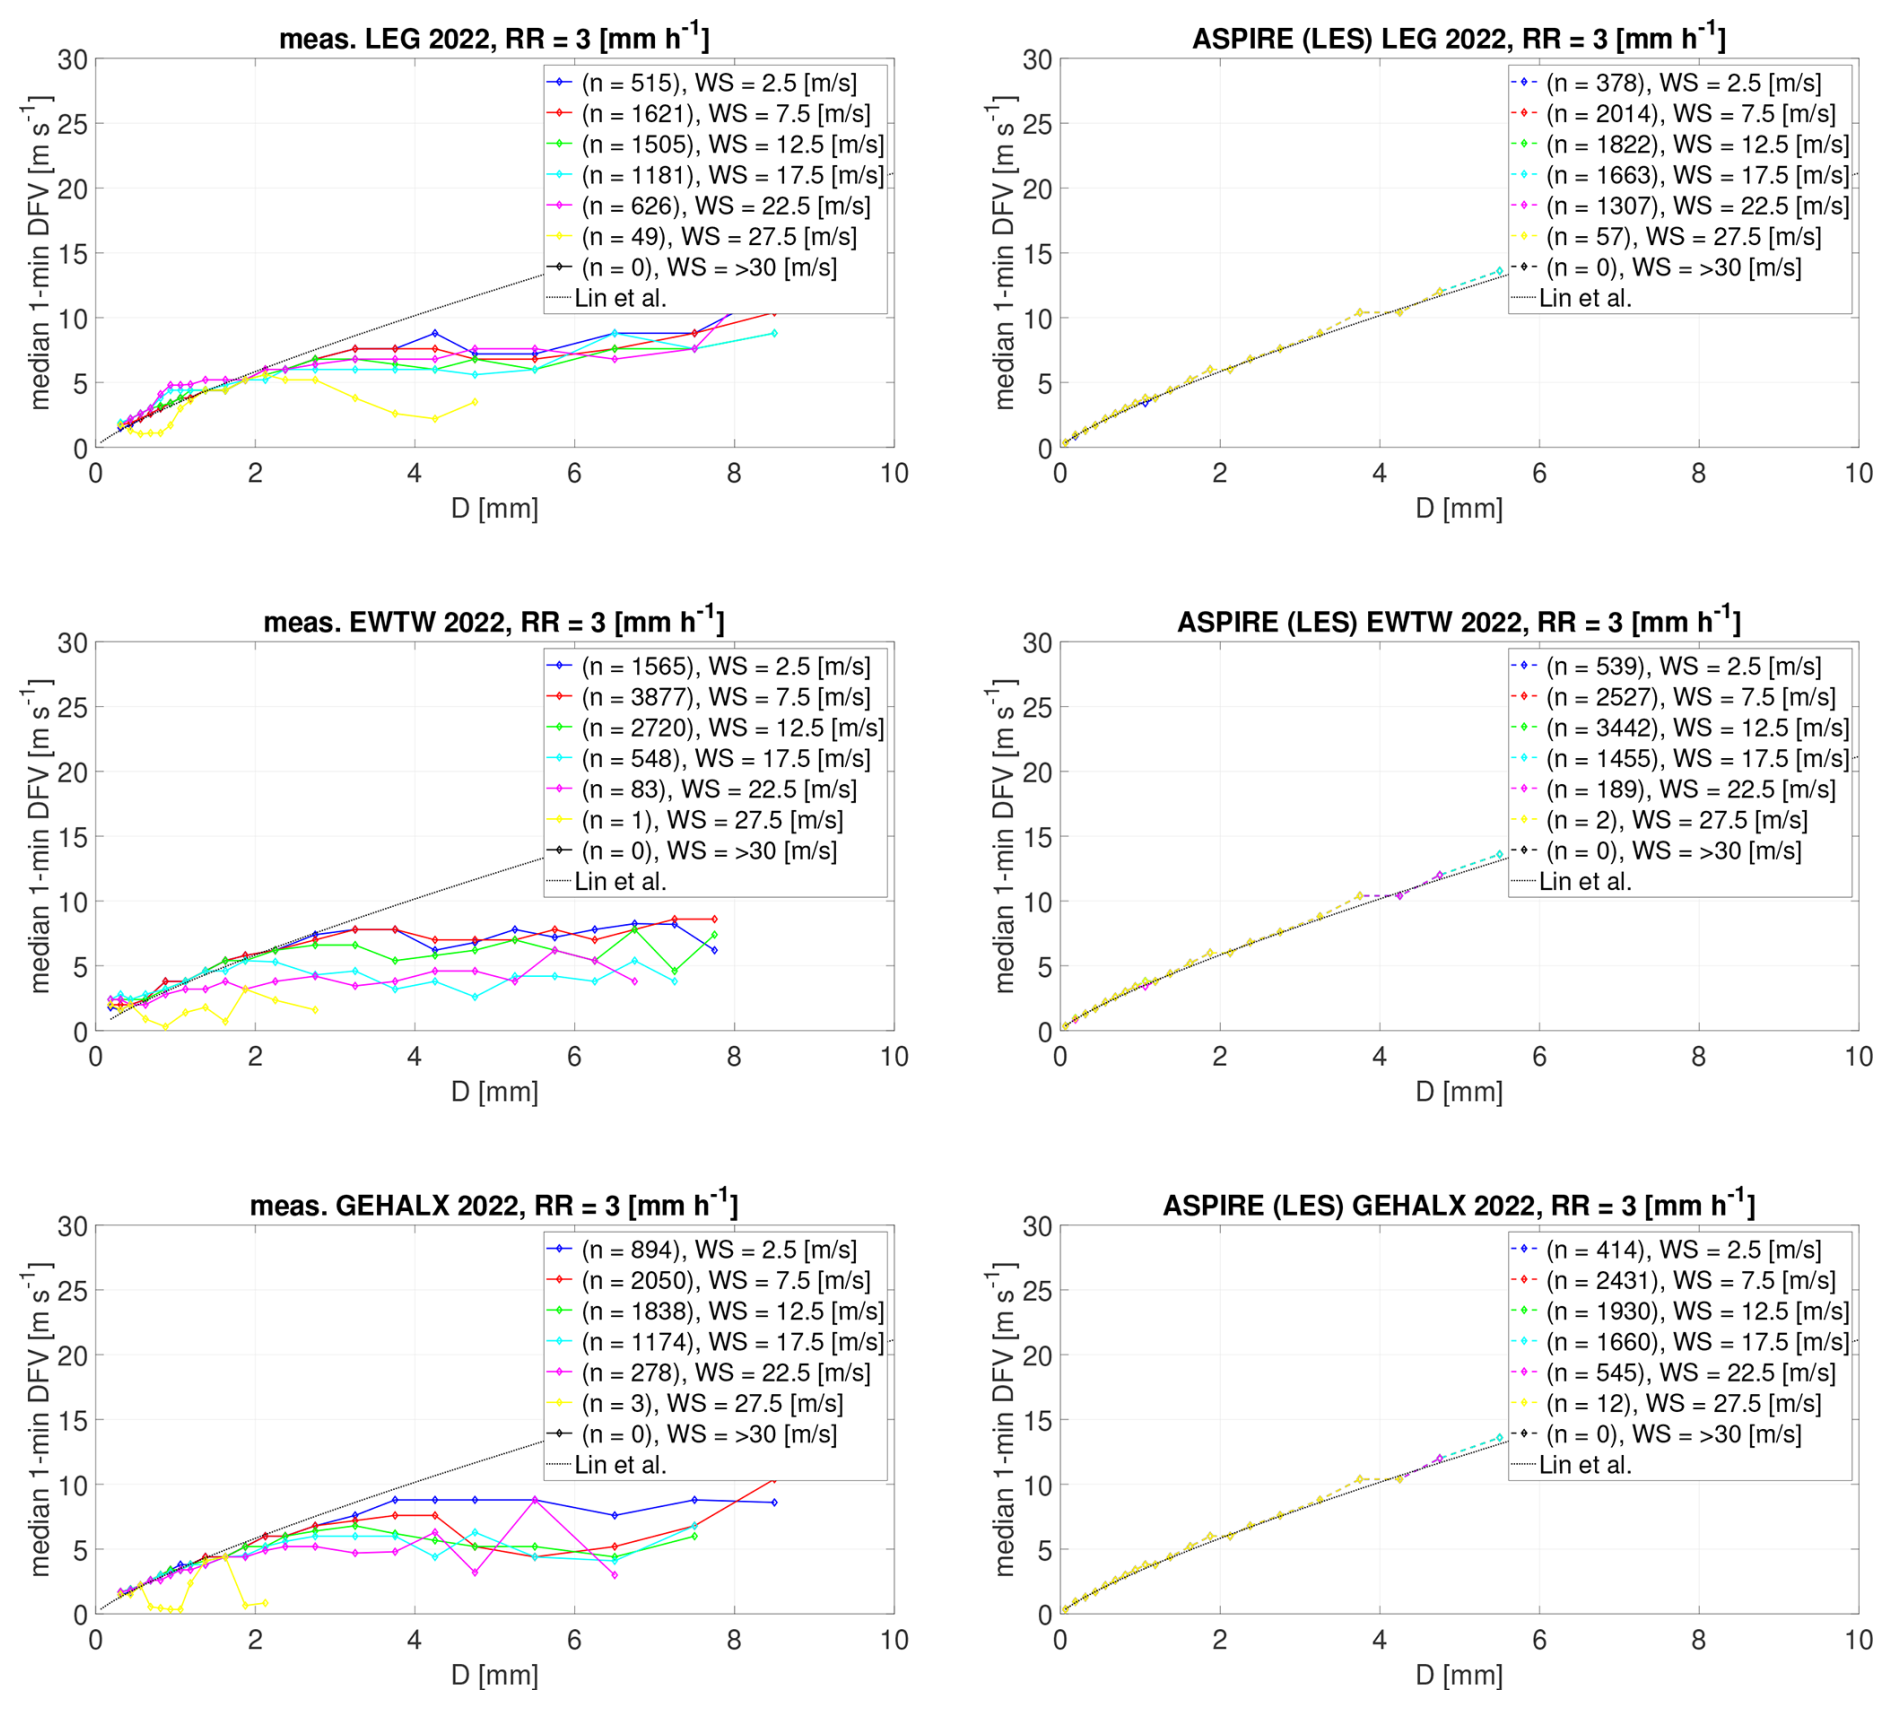
Figure 18Median drop fall velocity for a fixed rain rate of 3 mm h−1 and different wind speeds. ASPIRE's results are here derived from the LES data.
Meso-scale simulations carried out over a decade showed that the average erosivity of rainfall on wind turbine blades increases from the southwestern part of the Dutch North Sea to the northeastern region. Indeed, the simulations indicate that the northeastern regions are characterized by both higher average wind speeds and a larger amount of rainfall. These results suggest that future wind farms developed in the northeast are likely to encounter higher erosion rates compared to those currently operating in the southwest. This requires special attention when developing mitigation strategies, such as the development of advanced leading edge protection systems, the implementation of effective maintenance practices for erosion prevention, and the application of erosion-safe modes, which involve reducing rotor speed during extreme events to prolong the blades’ lifespan.
A year-long comparison of meso-scale simulations and high-resolution large eddy simulations (LESs) showed that the accumulated damage estimated from meso-scale simulations is 7 %–20 % lower than that obtained from LES. These differences can be attributed to the LES setup's ability to capture more extreme events due to its finer spatial and temporal resolution. However, a side-by-side comparison of the contour maps obtained using meso-scale simulations and LES reveals alignment in the spatial patterns of erosion-related parameters, confirming that meso-scale simulations produce satisfactory atlases where regional differences are consistently captured with LES. Additionally, a comparison of LES and measurements at selected sites in the Netherlands over a 1-year period revealed that the accumulated damage estimated from simulations is 23 %–66 % lower than that obtained from actual weather data. These differences can be attributed to two main factors. Firstly, there are more extreme events recorded than those predicted by LES. Secondly, the Marshall–Palmer distribution, assumed by the simulations, tends to underestimate the quantity of larger droplets. Together, these factors result in simulations predicting less accumulated damage.
Future work will involve implementing a more representative drop size distribution and fall velocity in the weather model. In this context, models will need to be validated with more reliable measurements, which is also a topic of ongoing and future research. To mitigate erosion on wind turbines, high-resolution weather models could be employed to investigate a now-cast-based erosion-safe mode, where the model could forecast extreme events, enabling operators to adjust rotor speed accordingly.
This research used the Whiffle proprietary LES model ASPIRE, which is commercially available as a software as a service (SaaS) solution from https://whiffle.nl (last access: 28 August 2025).
The simulation data underlying this paper can be provided upon request.
MC: contributed in the conception and design of the study, developed the methodology for evaluating leading edge erosion using weather data, and conducted the analysis of the results. GvD: implemented precipitation in the weather model and performed the simulations.
Gerwin van Dalum is employed at Whiffle, the developer of ASPIRE, the weather model utilized in this study. Marco Caboni and Gerwin van Dalum conducted this research as part of their collaboration within the PRecipitation atlas for Offshore Wind blade Erosion Support System (PROWESS) project, which was funded by the Netherlands Enterprise Agency (RVO), part of the Dutch Ministry of Economic Affairs.
Publisher’s note: Copernicus Publications remains neutral with regard to jurisdictional claims made in the text, published maps, institutional affiliations, or any other geographical representation in this paper. While Copernicus Publications makes every effort to include appropriate place names, the final responsibility lies with the authors.
Linked to the PRecipitation atlas for Offshore Wind blade Erosion Support System (PROWESS) project, this research was supported by the Netherlands Enterprise Agency (RVO), part of the Dutch Ministry of Economic Affairs. EWTW is acknowledged for providing measurements from meteorological mast 6 at their test site in Wieringermeer. General Electric (GE) is acknowledged for providing measurements from meteorological mast MMX at the SIF site in Maasvlakte Rotterdam. We extend our gratitude to Aravind Satish (TNO) for supplying the GeoJSON data for the wind farms, coastlines, and boundaries of the Dutch North Sea.
This research has been supported by the Rijksdienst voor Ondernemend Nederland (grant no. HER 00900701).
This paper was edited by Shawn Sheng and reviewed by two anonymous referees.
Baas, P., Verzijlbergh, R., van Dorp, P., and Jonker, H.: Investigating energy production and wake losses of multi-gigawatt offshore wind farms with atmospheric large-eddy simulation, Wind Energ. Sci., 8, 787–805, https://doi.org/10.5194/wes-8-787-2023, 2023. a
Bak, C., Forsting, A. M., and Sorensen, N. N.: The influence of leading edge roughness, rotor control and wind climate on the loss in energy production, J. Phys. Conf. Ser., 1618, 052050, https://doi.org/10.1088/1742-6596/1618/5/052050, 2020. a
Barfknecht, N. and von Terzi, D.: Aerodynamic interaction of rain and wind turbine blades: the significance of droplet slowdown and deformation for leading-edge erosion, Wind Energ. Sci., 9, 2333–2357, https://doi.org/10.5194/wes-9-2333-2024, 2024. a
Barfknecht, N. and von Terzi, D.: Drop-size-dependent effects in leading-edge rain erosion and their impact on erosion-safe mode operation, Wind Energ. Sci., 10, 315–346, https://doi.org/10.5194/wes-10-315-2025, 2025. a
Caboni, M., Slot, H. M., Bergman, G., Wouters, D. A. J., and Meijer, H. J. V. D. M.: Evaluation of wind turbine blades’ rain-induced leading edge erosion using rainfall measurements at offshore, coastal and onshore locations in the Netherlands, J. Phys. Conf. Ser., 2767, 062003, https://doi.org/10.1088/1742-6596/2767/6/062003, 2024. a, b, c, d, e, f, g, h
Caboni, M., Schwarz, A. E., Slot, H., and van der Mijle Meijer, H.: Estimating microplastic emissions from offshore wind turbine blades in the Dutch North Sea, Wind Energ. Sci., 10, 1123–1136, https://doi.org/10.5194/wes-10-1123-2025, 2025. a
Castorrini, A., Ortolani, A., and Campobasso, M. S.: Assessing the progression of wind turbine energy yield losses due to blade erosion by resolving damage geometries from lab tests and field observations, Renew. Energ., 218, 119256, https://doi.org/10.1016/j.renene.2023.119256, 2023. a
Copernicus-Climate-Change-Service: Copernicus Interactive Climate Atlas, https://atlas.climate.copernicus.eu/atlas, last access: 2 December 2024. a
Davis, N. N., Badger, J., Hahmann, A. N., Hansen, B. O., Mortensen, N. G., Kelly, M., Larsén, X. G., Olsen, B. T., Floors, R., Lizcano, G., Casso, P., Lacave, O., Bosch, A., Bauwens, I., Knight, O. J., van Loon, A. P., Fox, R., Parvanyan, T., Hansen, S. B. K., Heathfield, D., Onninen, M., and Drummond, R.: The Global Wind Atlas: A High-Resolution Dataset of Climatologies and Associated Web-Based Application, Bull. Am. Meteorol. Soc., 104, E1507–E1525, https://doi.org/10.1175/BAMS-D-21-0075.1, 2023. a
Gaertner, E., Rinker, J., Sethuraman, L., Zahle, F., Anderson, B., Barter, G., Abbas, N., Meng, F., Bortolotti, P., Skrzypinski, W., Scott, G., Feil, R., Bredmose, H., Dykes, K., Shields, M., Allen, C., and Viselli, A.: Definition of the IEA 15-Megawatt Offshore Reference Wind Turbine, Tech. Rep. NREL/TP-5000-75698, National Renewable Energy Laboratory (NREL), Golden, CO, USA, https://doi.org/10.2172/1603478, 2020. a
Grabowski, W. W.: Toward Cloud Resolving Modeling of Large-Scale Tropical Circulations: A Simple Cloud Microphysics Parameterization, J. Atmos. Sci., 55, 3283–3298, https://doi.org/10.1175/1520-0469(1998)055<3283:TCRMOL>2.0.CO;2, 1998. a, b
Hahmann, A. N., Sīle, T., Witha, B., Davis, N. N., Dörenkämper, M., Ezber, Y., García-Bustamante, E., González-Rouco, J. F., Navarro, J., Olsen, B. T., and Söderberg, S.: The making of the New European Wind Atlas – Part 1: Model sensitivity, Geosci. Model Dev., 13, 5053–5078, https://doi.org/10.5194/gmd-13-5053-2020, 2020. a
Hannesdóttir, A., Kral, S. T., Reuder, J., and Hasager, C. B.: Rain erosion atlas for wind turbine blades based on ERA5 and NORA3 for Scandinavia, Results Eng., 22, 102010, https://doi.org/10.1016/j.rineng.2024.102010, 2024. a, b, c, d, e, f, g, h
Hasager, C., Vejen, F., Bech, J., Skrzypiński, W., Tilg, A.-M., and Nielsen, M.: Assessment of the rain and wind climate with focus on wind turbine blade leading edge erosion rate and expected lifetime in Danish Seas, Renew. Energ., 149, 91–102, https://doi.org/10.1016/j.renene.2019.12.043, 2020. a, b
Hasager, C. B., Vejen, F., Skrzypiński, W. R., and Tilg, A.-M.: Rain Erosion Load and Its Effect on Leading-Edge Lifetime and Potential of Erosion-Safe Mode at Wind Turbines in the North Sea and Baltic Sea, Energies, 14, 1959, https://doi.org/10.3390/en14071959, 2021. a
Hersbach, H., Bell, B., Berrisford, P., Hirahara, S., Horányi, A., Muñoz-Sabater, J., Nicolas, J., Peubey, C., Radu, R., Schepers, D., Simmons, A., Soci, C., Abdalla, S., Abellan, X., Balsamo, G., Bechtold, P., Biavati, G., Bidlot, J., Bonavita, M., De Chiara, G., Dahlgren, P., Dee, D., Diamantakis, M., Dragani, R., Flemming, J., Forbes, R., Fuentes, M., Geer, A., Haimberger, L., Healy, S., Hogan, R. J., Hólm, E., Janisková, M., Keeley, S., Laloyaux, P., Lopez, P., Lupu, C., Radnoti, G., de Rosnay, P., Rozum, I., Vamborg, F., Villaume, S., and Thépaut, J.-N.: The ERA5 global reanalysis, Q. J. Roy. Meteorol. Soc., 146, 1999–2049, https://doi.org/10.1002/qj.3803, 2020. a
Heus, T., van Heerwaarden, C. C., Jonker, H. J. J., Pier Siebesma, A., Axelsen, S., van den Dries, K., Geoffroy, O., Moene, A. F., Pino, D., de Roode, S. R., and Vilà-Guerau de Arellano, J.: Formulation of the Dutch Atmospheric Large-Eddy Simulation (DALES) and overview of its applications, Geosci. Model Dev., 3, 415–444, https://doi.org/10.5194/gmd-3-415-2010, 2010. a
Heymann, F. J.: Conclusions from the ASTM interlaboratory test program with liquid impact erosion facilities, in: International Conference on Erosion by Liquid and Solid Impact, 1–10, https://ui.adsabs.harvard.edu/abs/1979elsi.conf...20H, 1979. a
Larsén, X. G., Davis, N., Hannesdóttir, A., Kelly, M., Svenningsen, L., Slot, R., Imberger, M., Olsen, B. T., and Floors, R.: The Global Atlas for Siting Parameters project: Extreme wind, turbulence, and turbine classes, Wind Energy, 25, 1841–1859, https://doi.org/10.1002/we.2771, 2022. a
Letson, F. and Pryor, S. C.: From Hydrometeor Size Distribution Measurements to Projections of Wind Turbine Blade Leading-Edge Erosion, Energies, 16, 3906, https://doi.org/10.3390/en16093906, 2023. a, b
Lin, Y.-L., Farley, R. D., and Orville, H. D.: Bulk Parameterization of the Snow Field in a Cloud Model, J. Appl. Meteorol. Climatol., 22, 1065–1092, https://doi.org/10.1175/1520-0450(1983)022<1065:BPOTSF>2.0.CO;2, 1983. a, b, c, d
Maniaci, D. C., Westergaard, C., Hsieh, A., and Paquette, J. A.: Uncertainty Quantification of Leading Edge Erosion Impacts on Wind Turbine Performance, J. Phys. Conf. Ser., 1618, 052082, https://doi.org/10.1088/1742-6596/1618/5/052082, 2020. a
Marshall, J. S. and Palmer, W. M. K.: The distribution of raindrops with size, J. Atmos. Sci., 5, 165–166, https://doi.org/10.1175/1520-0469(1948)005<0165:TDORWS>2.0.CO;2, 1948. a
Méndez, B., Saenz, E., Pires, Ó., Cantero, E., Bech, J., Polls, F., Peinó, E., Udina, M., and Garcia-Benadí, A.: Experimental campaign for the characterization of precipitation in a complex terrain site using high resolution observations, J. Phys.: Conf. Ser., 2767, 042016, https://doi.org/10.1088/1742-6596/2767/4/042016, 2024. a
Mishnaevsky, L.: Repair of wind turbine blades: Review of methods and related computational mechanics problems, Renew. Energ., 140, 828–839, https://doi.org/10.1016/j.renene.2019.03.113, 2019. a
Mishnaevsky, L., Hasager, C. B., Bak, C., Tilg, A.-M., Bech, J. I., Doagou Rad, S., and Fæster, S.: Leading edge erosion of wind turbine blades: Understanding, prevention and protection, Renew. Energ., 169, 953–969, https://doi.org/10.1016/j.renene.2021.01.044, 2021. a
Montero-Martínez, G. and García-García, F.: On the behaviour of raindrop fall speed due to wind, Q. J. Roy. Meteorol. Soc., 142, 2013–2020, https://doi.org/10.1002/qj.2794, 2016. a
Mortensen, N., Hansen, J., Kelly, M., Prinsloo, E., Mabille, E., and Szewczuk, S.: Wind Atlas for South Africa (WASA) Station and Site Description Report, no. 0242(EN) in DTU Wind Energy I, DTU Wind Energy, Denmark, for an electronic copy please contact the first author, Published as DTU Wind Energy E-0071 in 2014., 2014. a
Nawri, N., Petersen, G. N., Bjornsson, H., Hahmann, A. N., Jónasson, K., Hasager, C. B., and Clausen, N.-E.: The wind energy potential of Iceland, Renew. Energ., 69, 290–299, https://doi.org/10.1016/j.renene.2014.03.040, 2014. a
Noordzeeloket: Energy Transition in the North Sea, https://www.noordzeeloket.nl/en/functions-and-use/offshore-wind-energy/energy-transition-north-sea/, last access: 6 December 2024. a
North-Sea-Energy: Offshore Renewables - Offshore Wind Visibility, https://northseaenergy.projectatlas.app/atlas/, last access: 30 November 2024. a
Pryor, S. C., Letson, F., Shepherd, T., and Barthelmie, R. J.: Evaluation of WRF Simulation of Deep Convection in the U.S. Southern Great Plains, J. Appl. Meteorol. Climatol., 62, 41–62, https://doi.org/10.1175/JAMC-D-22-0090.1, 2023. a
Pryor, S. C., Barthelmie, R. J., and Hannedóttir, A.: A roadmap for producing wind turbine blade coating leading edge erosion atlases: Preliminary results, Tech. rep., IEA Wind Task 46: Erosion of wind turbine blades, https://iea-wind.org/wp-content/uploads/2025/03/IEA_Wind_Task_46_WP2.6-RoadmapErosionAtlases.pdf, last access: 26 March 2025a. a
Pryor, S. C., Coburn, J. J., and Barthelmie, R. J.: Spatiotemporal Variability in Wind Turbine Blade Leading Edge Erosion, Energies, 18, 425, https://doi.org/10.3390/en18020425, 2025b. a
Schalkwijk, J., Griffith, E. J., Post, F. H., and Jonker, H. J. J.: High-Performance Simulations of Turbulent Clouds on a Desktop PC: Exploiting the GPU, Bull. Am. Meteorol. Soc., 93, 307–314, http://www.jstor.org/stable/26218643 (last access: 28 August 2025), 2012. a
Shankar Verma, A., Jiang, Z., Ren, Z., Caboni, M., Verhoef, H., van der Mijle-Meijer, H., Castro, S. G., and Teuwen, J. J.: A probabilistic long-term framework for site-specific erosion analysis of wind turbine blades: A case study of 31 Dutch sites, Wind Energy, 24, 1315–1336, https://doi.org/10.1002/we.2634, 2021. a
Slot, H.: A fatigue-based model for the droplet impingement erosion incubation period, Ph.D. thesis, University of Twente, Enschede, the Netherlands, ISBN: 978-90-365-5191-5, https://doi.org/10.3990/1.9789036551915, 2021. a, b
Slot, H., Gelinck, E., Rentrop, C., and van der Heide, E.: Leading edge erosion of coated wind turbine blades: Review of coating life models, Renew. Energ., 80, 837–848, https://doi.org/10.1016/j.renene.2015.02.036, 2015. a
Storey, R. and Rauffus, R.: Mesoscale-coupled Large Eddy Simulation for Wind Resource Assessment, J. Phys. Conf. Ser., 2767, 052040, https://doi.org/10.1088/1742-6596/2767/5/052040, 2024. a
Thurai, M., Schönhuber, M., Lammer, G., and Bringi, V.: Raindrop shapes and fall velocities in “turbulent times”, Adv. Sci. Res., 16, 95–101, https://doi.org/10.5194/asr-16-95-2019, 2019. a
Tilg, A.-M., Vejen, F., Hasager, C. B., and Nielsen, M.: Rainfall Kinetic Energy in Denmark: Relationship with Drop Size, Wind Speed, and Rain Rate, J. Hydrometeorol., 21, 1621–1637, https://doi.org/10.1175/JHM-D-19-0251.1, 2020. a
Verma, A. S., Jiang, Z., Caboni, M., Verhoef, H., van der Mijle Meijer, H., Castro, S. G., and Teuwen, J. J.: A probabilistic rainfall model to estimate the leading-edge lifetime of wind turbine blade coating system, Renew. Energ., 178, 1435–1455, https://doi.org/10.1016/j.renene.2021.06.122, 2021. a
Vimalakanthan, K., van der Mijle Meijer, H., Bakhmet, I., and Schepers, G.: Computational fluid dynamics (CFD) modeling of actual eroded wind turbine blades, Wind Energ. Sci., 8, 41–69, https://doi.org/10.5194/wes-8-41-2023, 2023. a
Whiffle B. V.: Precision Weather Forecasting with Large Eddy Simulation [code], https://whiffle.nl, 2025.
Wind Energy – The Facts: Tip Speed Trends, https://www.wind-energy-the-facts.org/tip-speed-trends.html, last access: 6 December 2024. a