the Creative Commons Attribution 4.0 License.
the Creative Commons Attribution 4.0 License.
 | 04 Nov 2025
Investigating lab-scaled offshore wind aerodynamic testing failure and developing solutions for early anomaly detections
Yuksel R. Alkarem
Ian Ammerman
Kimberly Huguenard
Richard W. Kimball
Babak Hejrati
Amrit Verma
Amir R. Nejad
Reza Hashemi
Stephan Grilli
As offshore wind systems become more complex, the risk of human error or equipment malfunction increases during experimental testing. This study investigates a lab-scale incident involving a 1 : 50 scale 5 MW wind turbine, where a generator failure led to rotor overspeed and a blade–tower strike. To improve early fault detection, we propose a data-driven method based on multivariate long short-term memory (LSTM) models. High-frequency measurements are projected onto principal components, and anomalies are identified using reconstruction error and its time derivative. Two models are trained on different healthy datasets and tested using single- and multi-principal component (1PC and MPC) variations. Results show that combining both error and error derivative improves detection accuracy. The 1PC model detects faults faster, has a higher recall rate, and achieves a 43 % improvement in anomaly detection accuracy, while the MPC model yields higher precision. This approach provides a simple and effective tool for early anomaly detection in lab-scale experiments, helping to reduce the risk of future failures during the testing of new technologies.
- Article
(6209 KB) - Full-text XML
- BibTeX
- EndNote


Model-scale laboratory testing is a necessity for early development of grid-scale on- and offshore wind energy technologies, and recent industry trends have driven increased demand for such testing (Mehlan and Nejad, 2025; Soares-Ramos et al., 2020). In the case of offshore wind energy projects, operation and maintenance costs can amount to a third of a project's life-cycle cost, often quantified as the levelized cost of energy (LCOE). Small-scale validation and testing improve the maturity of new technologies (Mehlan and Nejad, 2025; Leahy et al., 2016; Wang et al., 2022).
To meet this demand, lab-scale turbine systems are designed to match the performance of full-scale offshore commercial wind plants, enabling accurate coupling between wind turbine aerodynamics and the hydrodynamic forces on the substructure (Fowler et al., 2023; Kimball et al., 2014; Cao et al., 2023). Due to the low Reynolds number at lab scale, thin airfoil sections are used for the model turbine blades, such as the SD7032, to achieve full-scale rotor performance. However, this increases blade flexibility and reduces structural strength. Additionally, because of strict mass constraints – particularly for floating configurations – system redundancy that accommodates equipment malfunctions is typically not included in the design (Parker, 2022). As a result, lab-scale turbines are highly sensitive systems that require careful handling by operators to ensure safe and reliable operation throughout a test campaign.
In experimental testing campaigns, particularly when testing novel control algorithms, the likelihood of fault events increases, and their impacts can be severe. These faults may arise from operator errors, incorrect control commands, or instrumentation malfunctions (Peng et al., 2023). Such incidents can result in costly equipment damage, violations of laboratory safety standards, and substantial project delays. Therefore, efforts to develop efficient methods of detecting operational faults are critical to improving the testing process (Leahy et al., 2016; Lu et al., 2024).
In many condition-monitoring applications, anomaly detection is performed using dedicated sensors. For instance, vibration-based techniques, often evaluated using the root mean square (RMS) of velocity or acceleration signals, are widely used for drivetrain fault detection and are assessed against standards such as ISO 10816-21 (ISO, 2025). However, deploying additional instrumentation is not always feasible or cost-effective. Nejad et al. (2018) demonstrated that angular velocity measurements already available within existing control systems can be repurposed for fault detection, thereby eliminating the need for supplementary sensors. Similarly, Dameshghi and Refan (2019) proposed a diagnostic approach for gearbox faults based on supervisory control and data acquisition (SCADA) information multi-sensor fusion, avoiding the need for additional data collection systems. These approaches illustrate the potential of multi-sensor anomaly detection methods that leverage existing system measurements.
To mitigate these issues, dimensionality reduction techniques, such as principal component analysis (PCA), are often employed during pre-processing to retain the most informative features while reducing data redundancy. For instance, Dibaj et al. (2022) applied PCA to multi-point raw vibration data as a means of compressing the dataset prior to classification, thereby improving computational efficiency without sacrificing key diagnostic information. These reduced-dimensional signals were then input to a convolutional neural network (CNN) for automated fault classification and pattern recognition. Similarly, adaptive filtering techniques, including linear and non-linear Kalman filters, have been used to enhance fault detection capabilities in dynamic environments, though their implementation can become increasingly complex for large-scale systems (Zhou and Zhu, 2023; Le and Matunaga, 2014; Ammerman et al., 2024). Overall, data-driven models, when combined with feature extraction or filtering techniques, provide a robust framework for detecting changes in system state and identifying early signs of failure or adverse environmental conditions (Dibaj et al., 2022; Alkarem et al., 2024, 2023).
These and similar methods can also be applied to lab-scale models, with the additional caveat that computational efficiency is even more critical. Due to time scaling and typically higher frequencies of motion at lab scale, fault detection strategies on models must be able to operate quickly and with minimal overhead. To meet this need, pre-trained data-driven approaches offer significant performance benefits over non-linear physics-based models.
The case study in this work comes from a fault incident which occurred during a standard scale model characterization test, wherein the turbine generator disengaged during an experiment, causing the turbine to spin out of control and one of the blades to strike the tower. The resulting damages caused significant delays in the campaign. Using this incident as a real example of the need for online fault detection and mitigation strategies, a data-driven approach was applied to develop an efficient online monitoring system which can detect failures or anomalous behavior before significant system effects are realized, increasing reaction time for operators or enabling automated shutdown procedures to take place.
2.1 Experimental setup
The experimental data for this study come from a wind turbine characterization test performed on a scale model at the Harold Alfond Ocean Engineering Laboratory at the University of Maine's Advanced Structures and Composites Center. The layout of the experiment is shown in Fig. 1a, illustrating the arrangement of the wind machine and turbine model. During the experiments, the turbine was controlled and monitored by one or two test operators stationed on the side of the basin, via a data acquisition system (DAQ) based on the National Instruments cRIO platform. Figure 1b shows the installed experimental turbine before testing began. To properly characterize the turbine's aerodynamic performance, it was installed in a fixed configuration within the wind field. Cross-bracing was installed to keep the turbine tower and mounting surface rigid during the test to target rotor performance only.
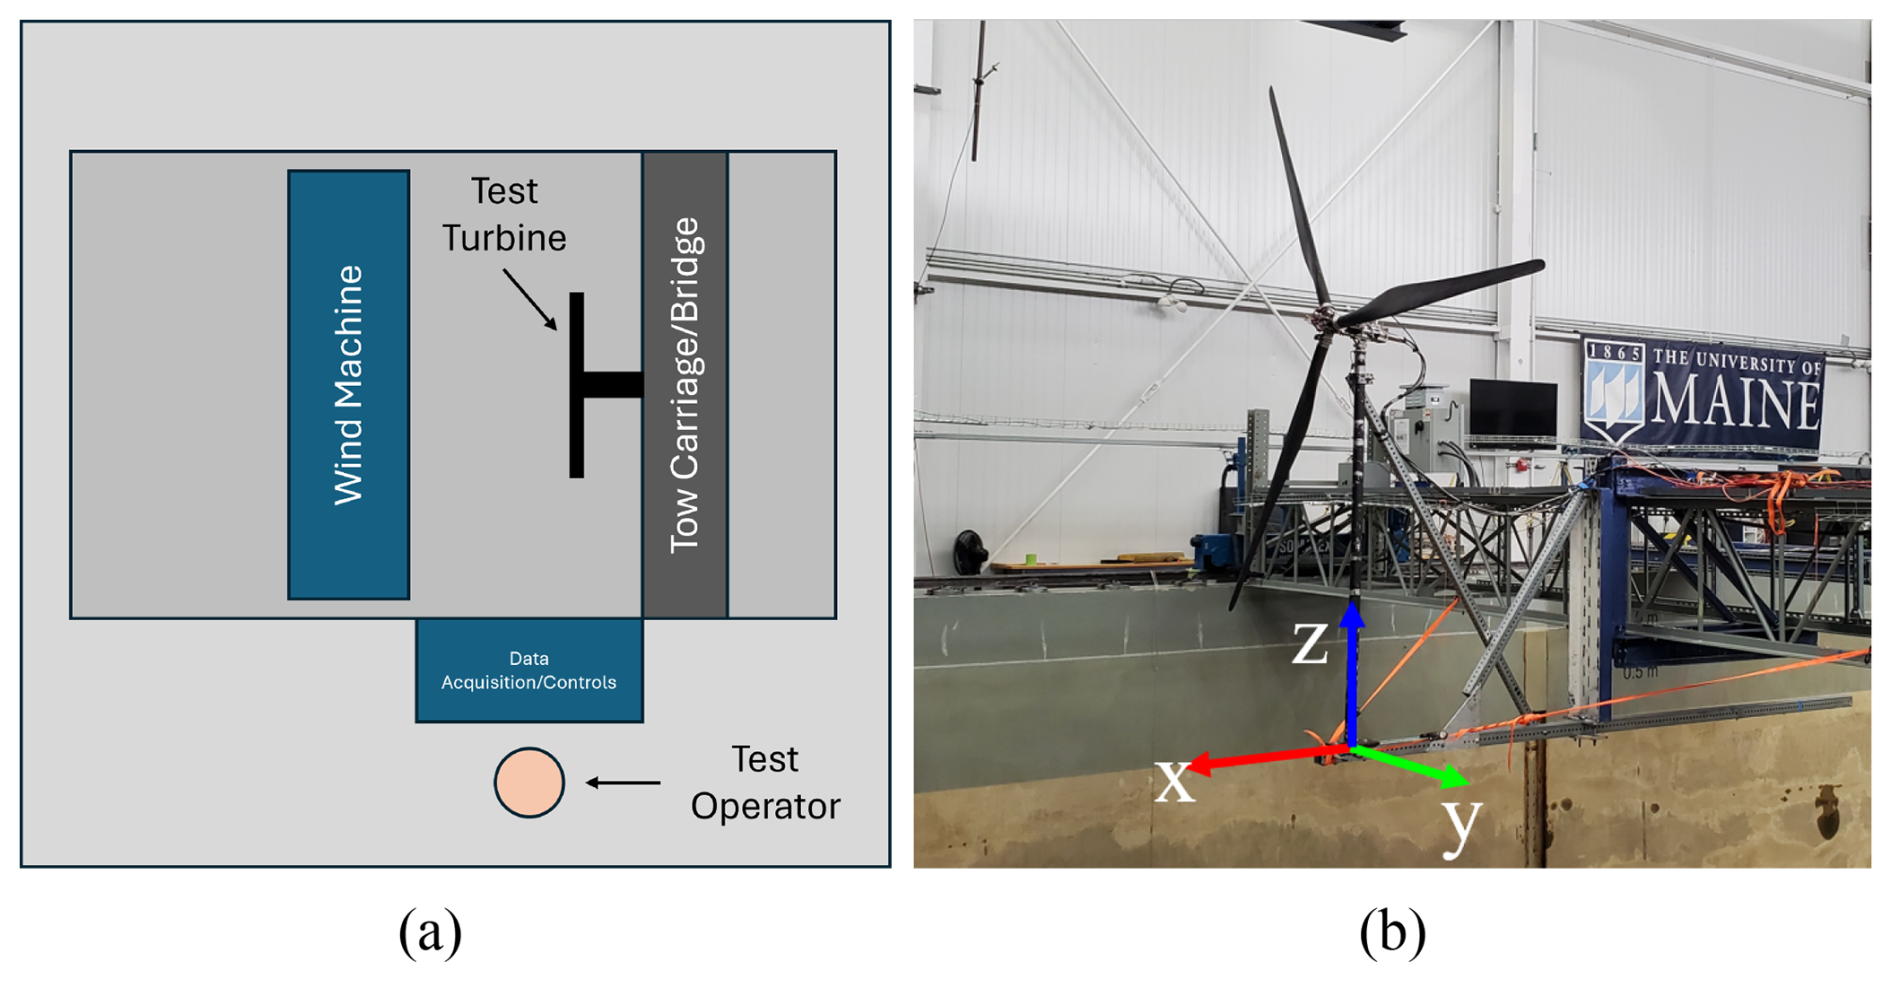
Figure 1(a) Basin layout for scaled turbine characterization experiment and (b) photograph of the experimental test turbine installed in the basin.
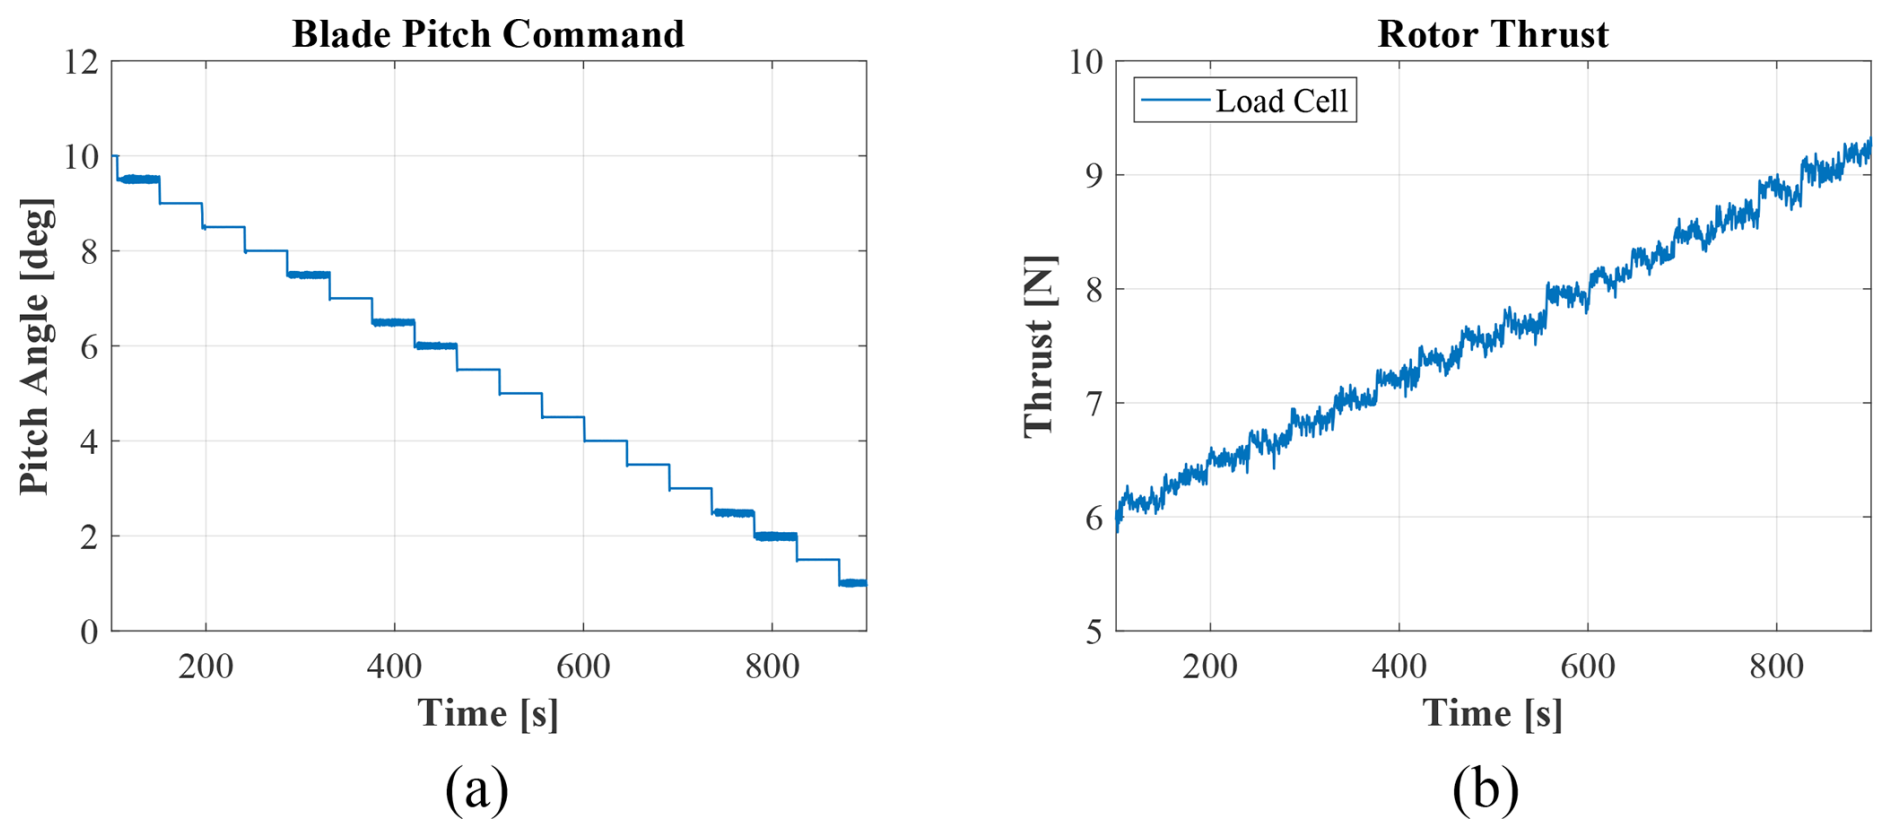
Figure 2(a) Scheduled blade pitch and (b) measured rotor thrust for sample characterization experiment run.
To fully characterize the rotor, experiments were performed at various wind speed/RPM pairs. Each experiment used a previously generated set point file to cycle through blade pitch set points. Figure 2 shows blade pitch and rotor thrust from one of the experiments. Results from these tests were then used to form rotor performance surfaces for future experiment design.
2.2 Failure incident
During one of the characterization runs, an operator mistakenly triggered an emergency stop on the turbine generator. As a result, the rotor began accelerating unrestricted until a blade strike occurred with the tower. Plots of rotor speed and thrust load during the incident are shown in Fig. 3, with a vertical line indicating when the blade struck the tower.
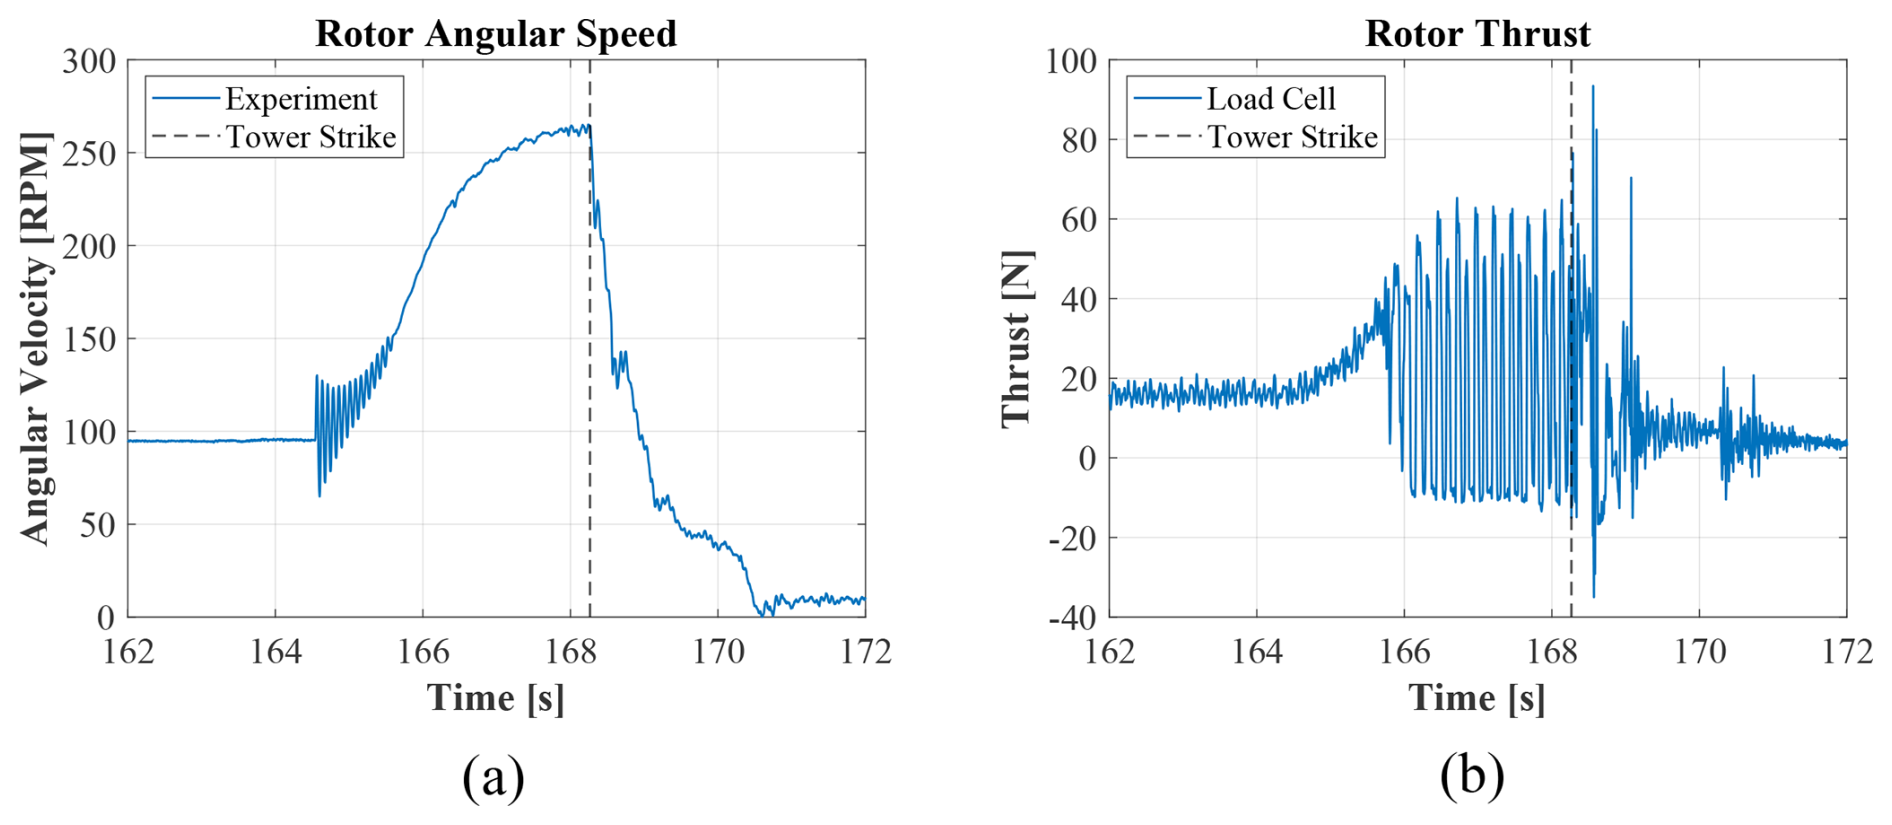
Figure 3Blade strike incident: (a) angular velocity in RPM and (b) rotor thrust force. The dashed line represents the blade strike instance.
2.3 Predictive model description
Detecting early signs of anomalies in testing campaigns can be beneficial. It can either provide data upon which operators can act on with informative decisions and/or be automated to abort the test if certain thresholds are exceeded. However, signaling the possibility of an anomaly requires real-time processing of incoming measurement data, which can be best achieved using deep machine learning algorithms. Such algorithms indeed make it possible for predictive models to be trained on certain healthy data and provide predictions of the systems' states during similar runs.
Accidents with lab equipment can be costly and labor-intensive and can cause delays. To mitigate such incidents, we propose an early anomaly detection model to improve response times and reduce human error. To this effect, a multi-step, multivariate long short-term memory (LSTM) model – a type of recurrent neural network (RNN) designated to addressing the vanishing gradient issue that traditionally prevents models from capturing long-term dependencies – was developed and trained on data from healthy aerodynamic characterization tests with similar wind speeds. When an anomaly occurs, the error between the predicted signal and the measured signal increases, which can be used to inform the operator of such an incident. The model parameters were initially estimated intuitively, but these could be further refined for enhanced predictive accuracy.
2.4 Anomaly detection over the span of multiple channels
In complex systems such as offshore wind testing, there are numerous measurements and data channels, which can be used to understand the overall behavior of the system. However, for anomaly detection purposes, it can be overwhelming and computationally expensive to manually and in real time search the data space for deviation in measured data. The operator might not have sufficient time to abort the test before the anomaly becomes too consequential. Additionally, an anomaly might not be detectable based on any single data channel to comprehend the full state of the system. Therefore, the predictive model must be based on multiple data channels related to the test being conducted while providing the operator with a single, concise anomaly detection capability based on the most relevant information. To accomplish that, principal component analysis (PCA) was carried out. A PCA creates combinations of variables that explain the largest amount of variance in the data.
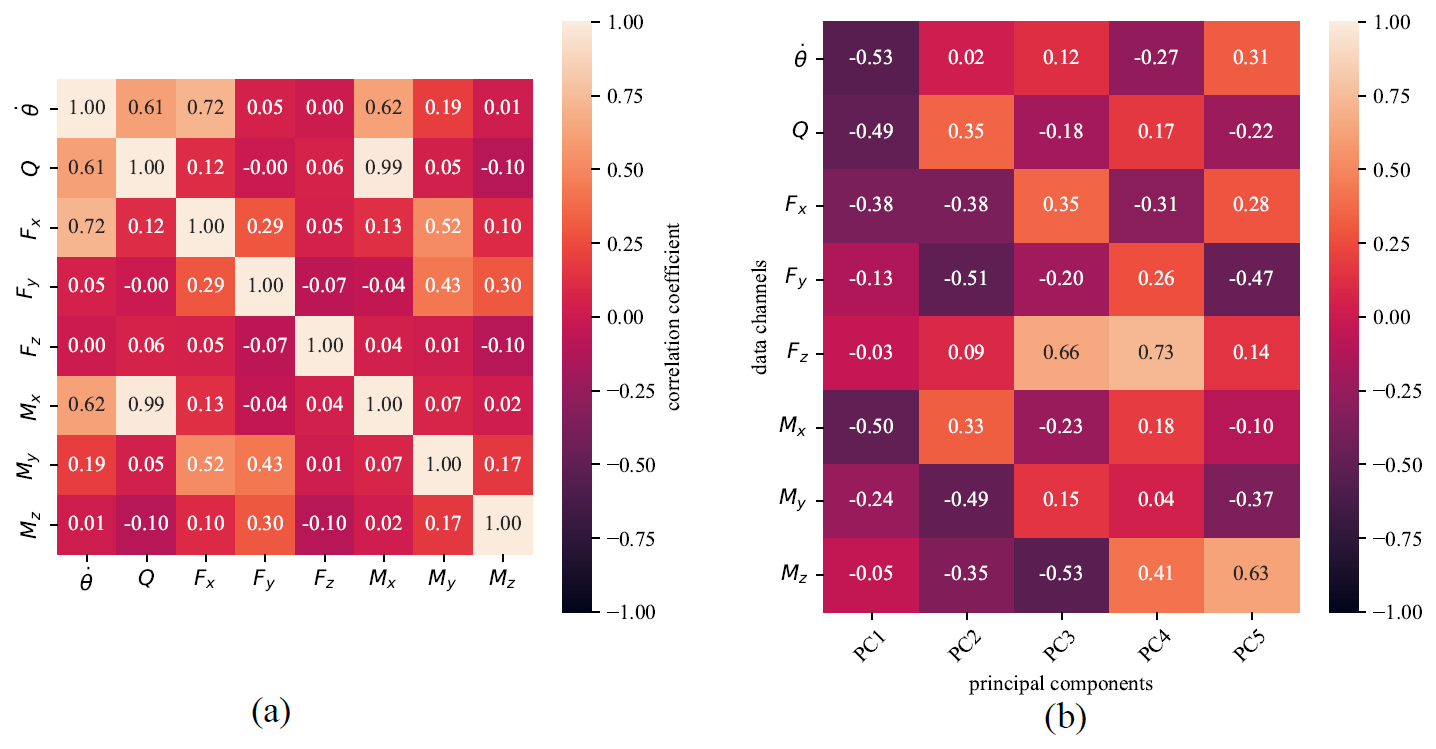
Figure 4Data pre-processing: (a) correlation matrix between available channels used in the models and (b) covariance loadings of the first five principal components.
Before performing the analysis, the raw data recorded by the data acquisition system were pre-processed to remove idle measurements and non-numeric entries. Data channels collected comprise wind speed, the angular velocity of the rotor, azimuth angle, all blade pitch angles, generator torque, rotor torque, and forces and moments at the base of the tower. We assume the digital twin has access to only some of these channels (i.e., angular velocity, ; rotor torque, Q; and tower base forces and moments, ) to simulate cases where some measurements can be restricted by turbine manufacturers and validate the model's operability under restrictive data access. Figure 4a illustrates the correlation matrix between the channels of interest.
Data are then standardized to ensure all channels (features) in the training dataset have a mean value, μ, of 0 and a standard deviation, σ, of 1:
where N is the number of channels included in the model. All subsequent testing datasets (whether healthy or anomalous) are standardized using these scaler parameters. This ensures that the resulting transformed values might reflect deviations from the training dataset, allowing the model to identify anomalous behavior.
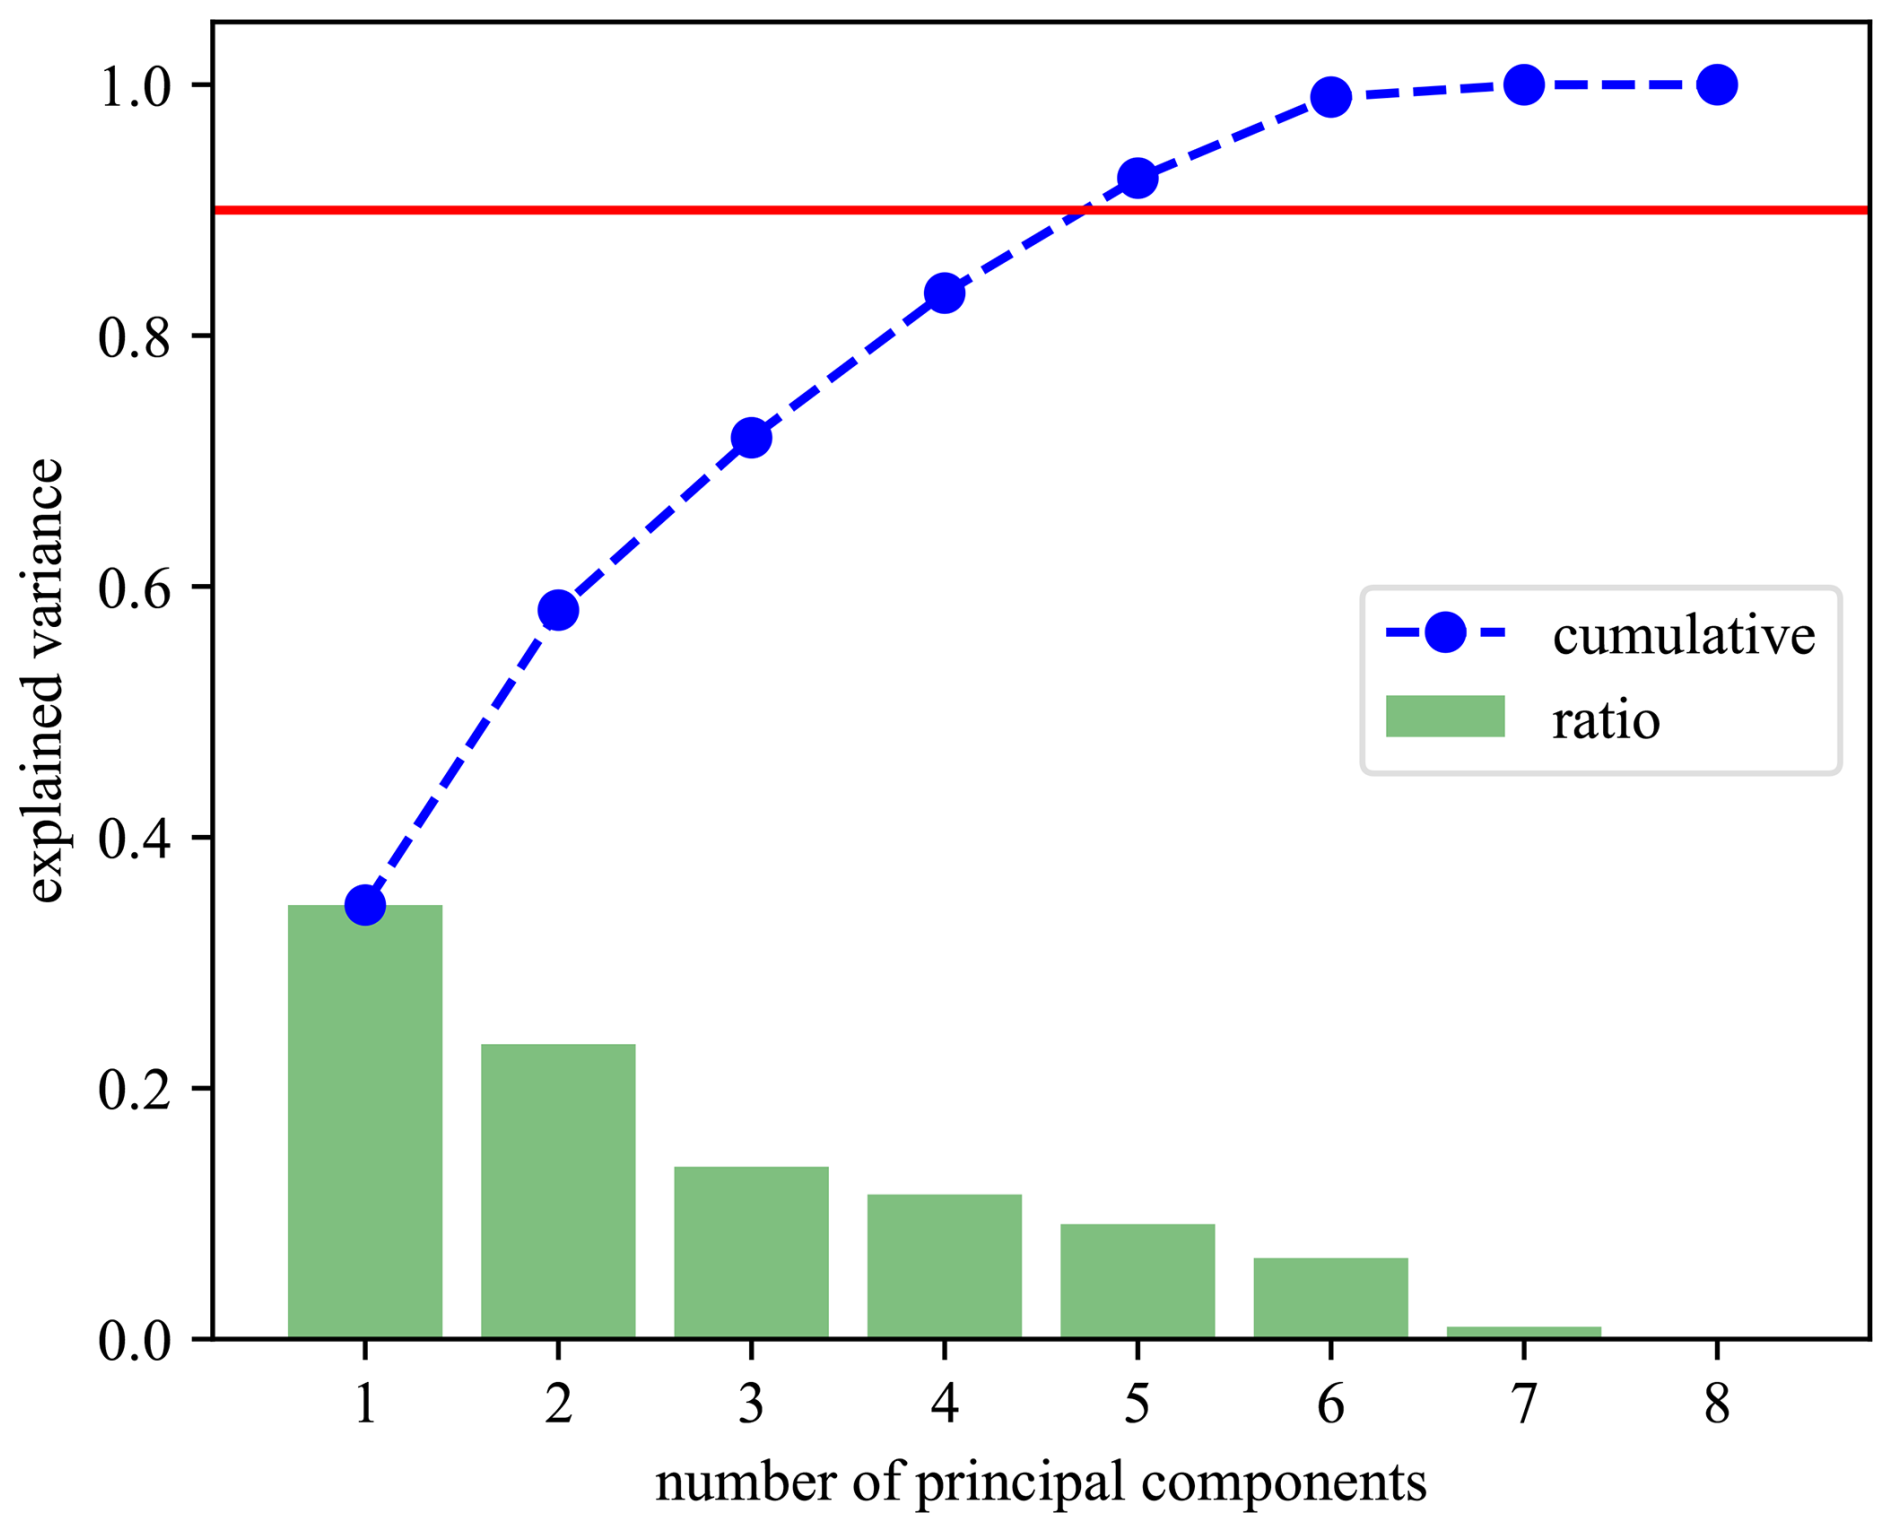
Following standardization, the covariance matrix of the variables was computed and then diagonalized through eigen decomposition, yielding a set of orthogonal transformed variables – i.e., the principal components (PCs) – ordered by the amount of total variance they explain. Based on this ranked structure, a subset of components can be selected to reduce the dimensionality of the problem while preserving as much of the original variance as possible. For instance, the first five PCs and channel loads/contributions are illustrated in Fig. 4b.
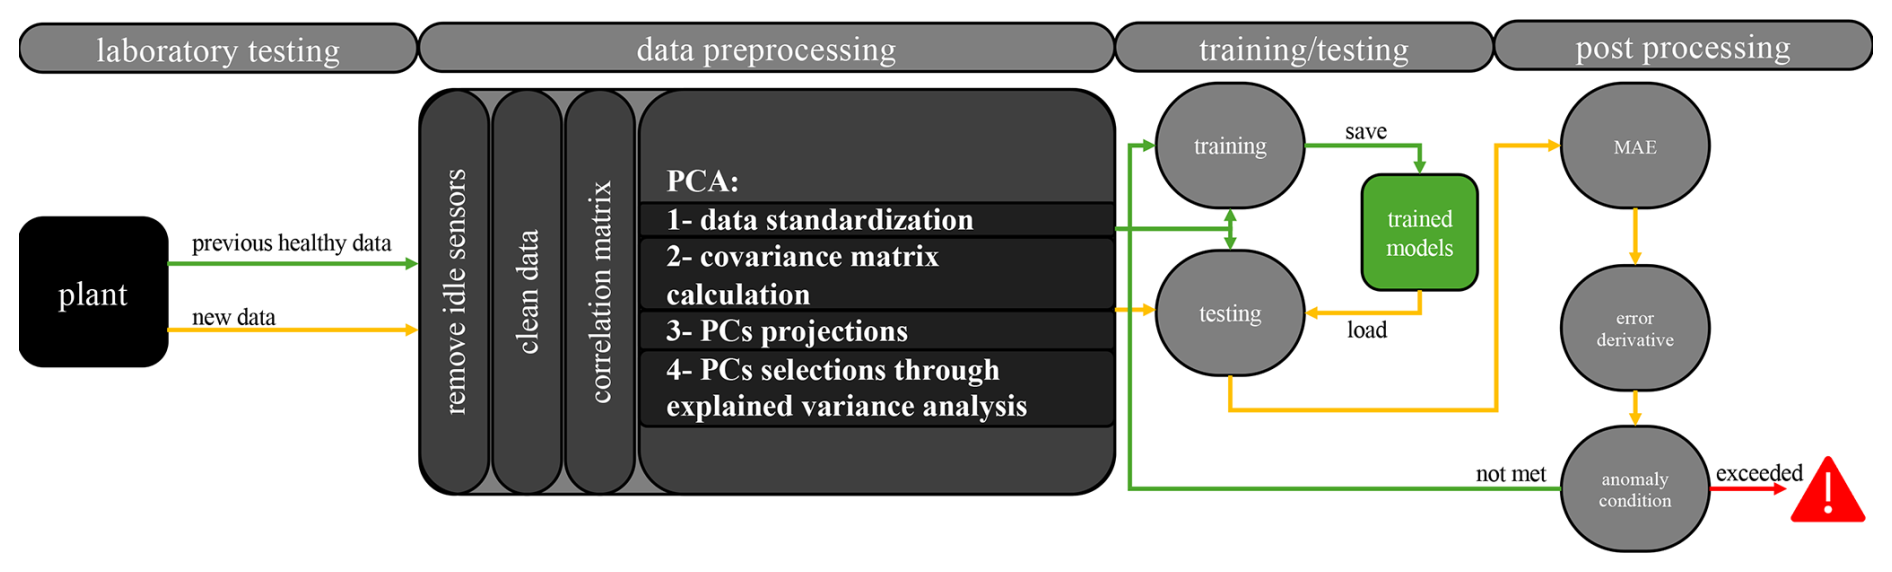
Figure 5Flowchart describing the data stream, data pre-processing, LSTM model training, and its use for anomaly detection.
The PCs were then used to train the LSTM models that would later be used for prediction. As new data are acquired, they are transformed/projected onto the same PCs that were used in training the models. For the purpose of anomaly detection, the mean absolute error (MAE) is computed between measurements and predictions from the LSTM models, and the error derivative is calculated to estimate rapid fluctuations in the quality of the predictions. The choice of MAE as the reconstruction error metric was made to reduce model sensitivity to transient spikes or noise, which may not correspond to true anomalies. An anomaly alert is reported to the operator when certain anomalous conditions are met. In this research, we investigate conditions when both the error and its derivative crossed certain thresholds. This procedure is illustrated in Fig. 5 and is explained in Sect. 2.6.
2.5 Principal component selection
The two models developed vary in their projected principal component selection. The projected PC results from training data are presented in Fig. 6. The first model compresses the data by retaining only the first PC; it is therefore named “1PC”. The second model selects the group of (M) PCs that cumulatively explain 90 % of the total variance, thus only neglecting the remaining 10 %; this model is hence called “MPC”.
2.6 Error and error derivative threshold selection for single/multiple PCs
The histograms of error metrics between the trained model and the training data for the 1PC and MPC models are shown in Fig. 7 for the 1PC model and in Fig. 8 for the MPC model. Inspired by the work of Dibaj et al. (2024), the thresholds were selected to be the highest values in the histogram for the training data error. However, in the case of multiple principal components being used, the weighted average of maximum errors (and error derivatives) of all principal components was computed. The per-PC thresholds are weighted by the explained variance ratio of the corresponding principal component shown in Fig. 6. These threshold values were used to assess the accuracy of the predictive model against measured data during the testing/anomaly detection stage.
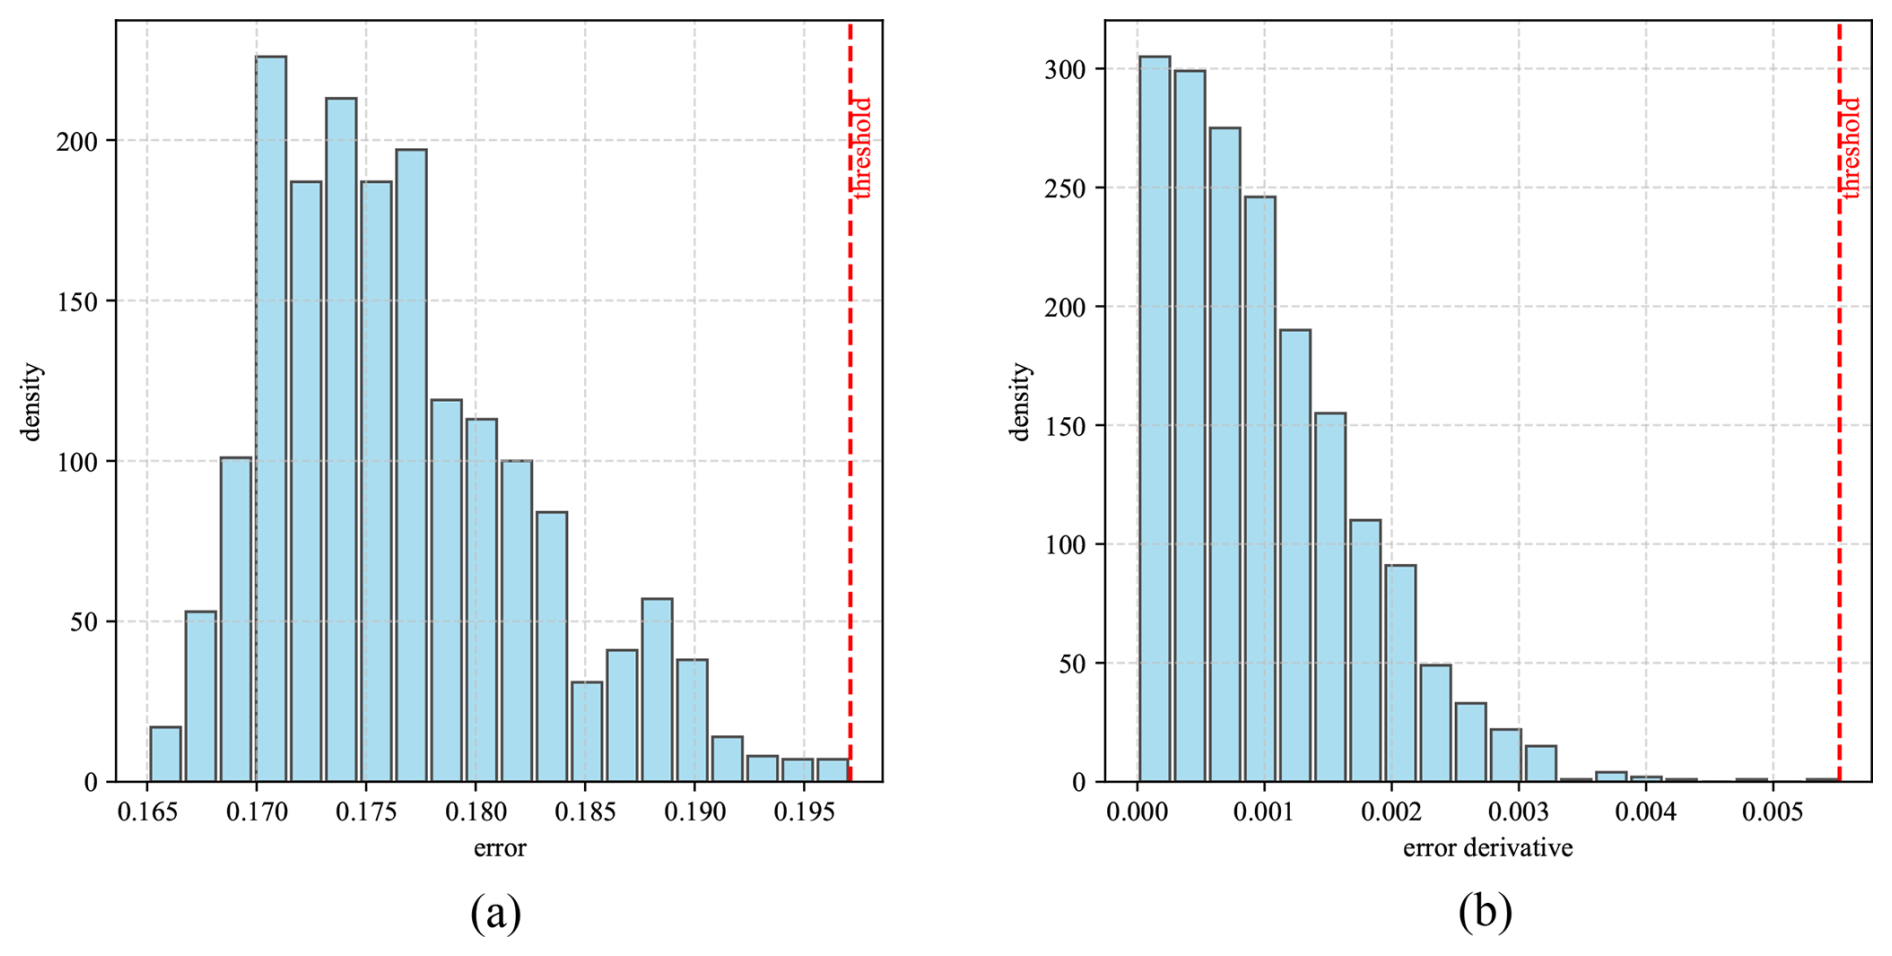
Figure 71PC histograms of the (a) error and (b) error derivative, generated by comparing the model with the training data, and the maximum error/error derivative as the selected threshold.
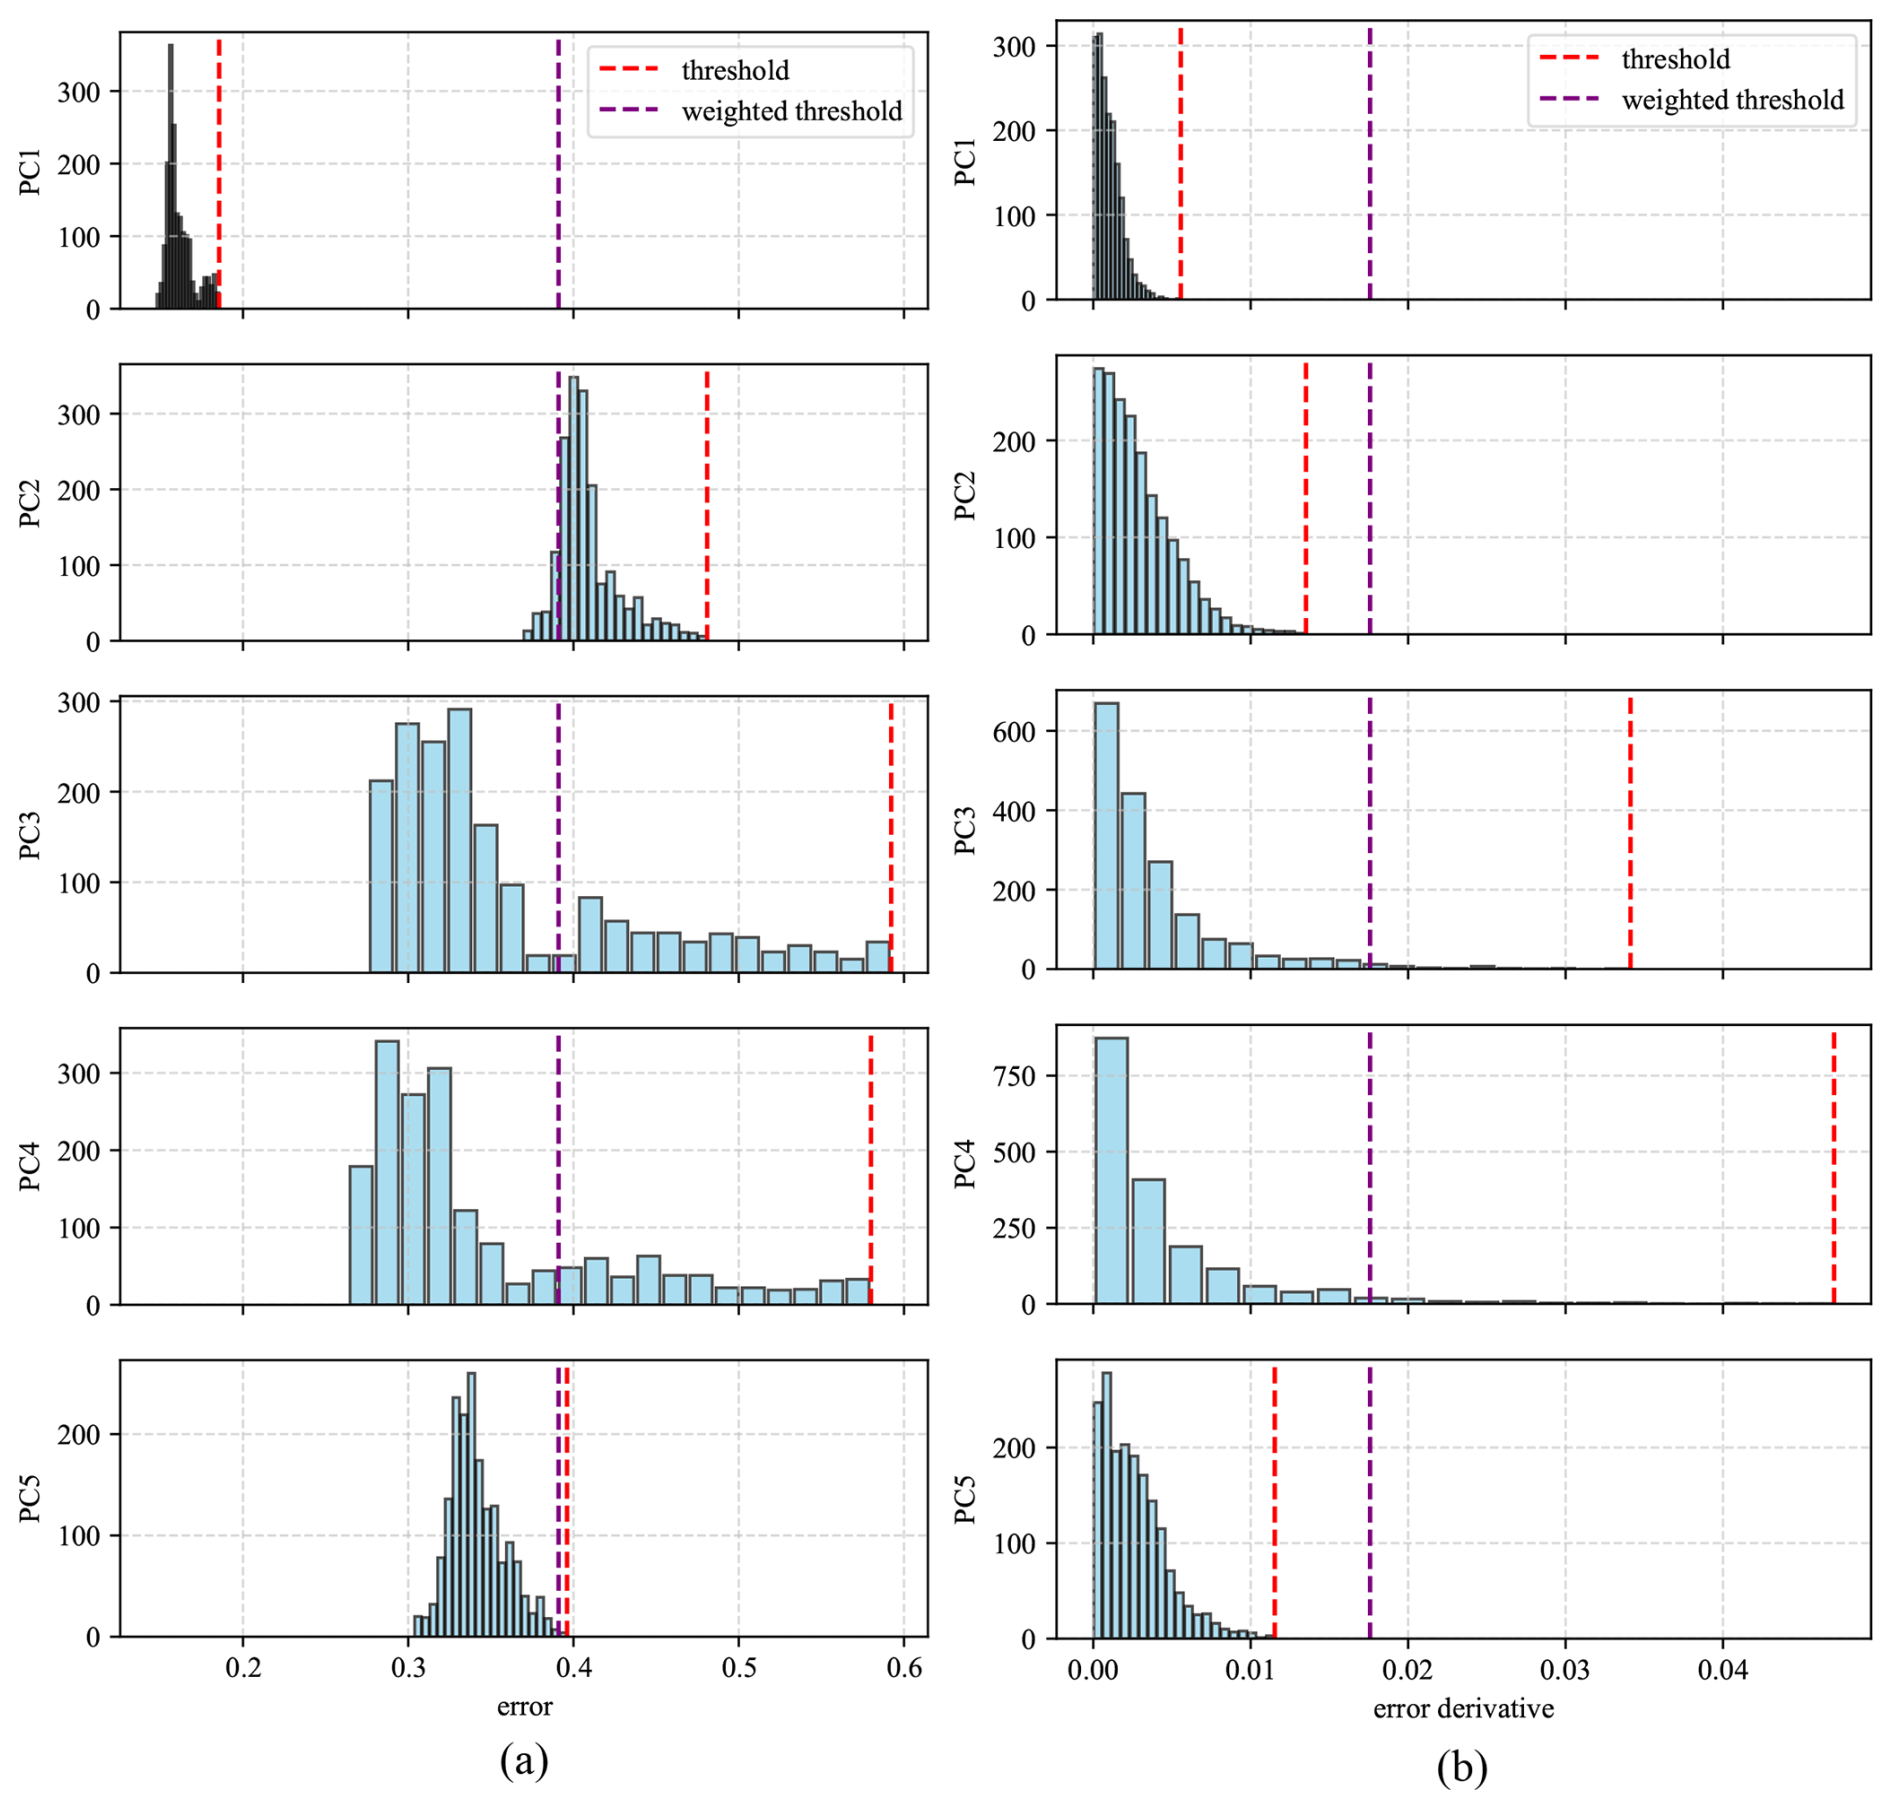
Figure 8MPC histograms of the (a) error and (b) error derivative for the first five PCs, generated by comparing the model with the training data, and the maximum error/error derivative per PC and the weighted average threshold.
2.7 Performance metrics
The overall accuracy of the model(s) was measured by a single score that combines precision and recall in its calculation (Miele et al., 2022; Wang et al., 2019). Precision, P, illustrates the proportion of anomalies detected that are true, while recall, R, indicates which proportion of true anomalies are detected. They can be computed as
where T+ represents the count of true positives (the identified anomalies are true), F+ is the count of false positives (i.e., for which the identified anomalies are not true), and F− is the false negatives (i.e., the unidentified true anomalies). These contribute to an overall FI score that ranges between 0 and 1, with 1 being a perfectly precise model, and is expressed as
Three datasets, 𝒟1, 𝒟2, and 𝒟3, were gathered during the test campaign. While wind speeds were kept constant (variation < 1 %), the rotor angular velocity for 𝒟2 was slightly lower by 12 % and higher by 51 % for 𝒟3 relative to 𝒟1. The angular velocity and the resulting thrust force variations are illustrated in Fig. 9. The blade pitch varied the same way for these cases based on the pre-generated set points. The actual anomaly and blade strike occurred near the end of 𝒟3, which was truncated to < 200 s, while 𝒟1 and 𝒟2 each span 1000 s. In addition, three altered variants of 𝒟2 were generated to introduce a synthetic anomaly for further evaluation of the developed models: , , and . The synthetic anomaly was imposed by modifying the tower base fore–aft bending moment, My, through a time-varying amplification factor. This factor was applied starting from an arbitrary onset time (225 s), increased linearly to a maximum value by 250 s, and then reduced back to unity by 275 s. The variants amplify the signal by 0.25 %, 0.5 %, and 1.00 % per Δt for , , and , respectively. Table 1 summarizes the model setup and intervals of datasets utilized during training, validation, anomaly criterion threshold selection, and testing tasks.
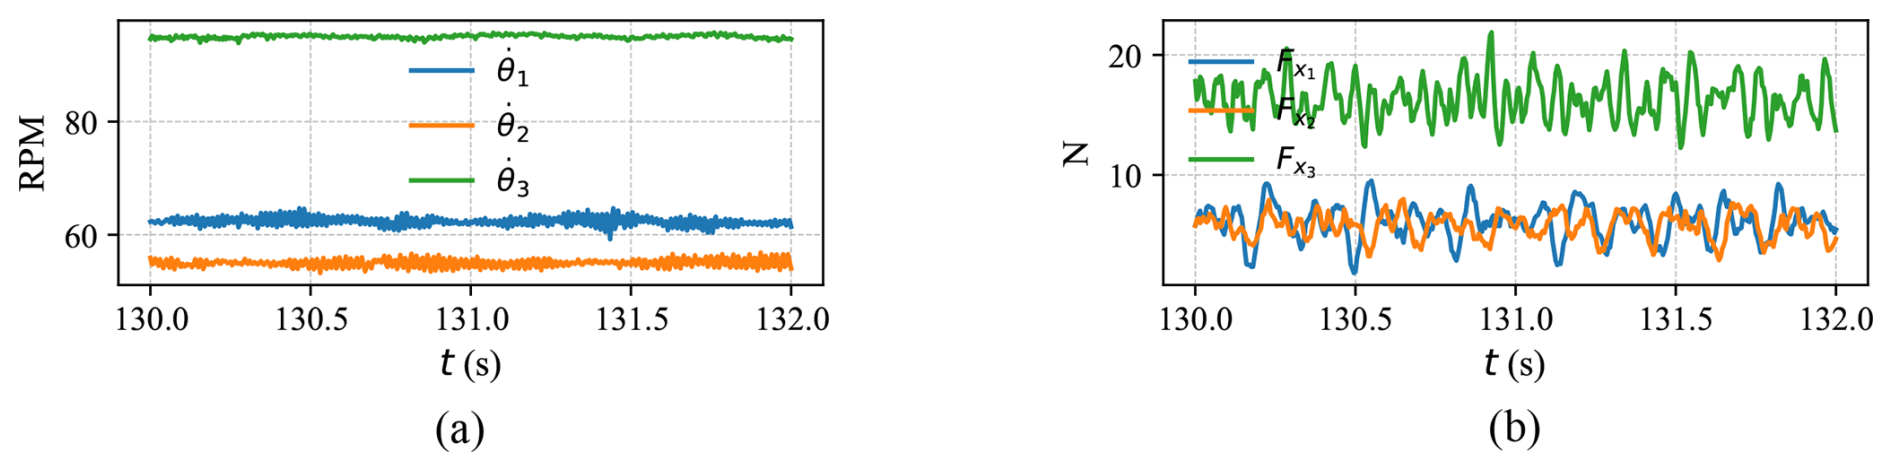
Figure 9Three experimental datasets and their variations in (a) angular velocities and (b) thrust forces.
Table 1Dataset usage by models ℳ1 and ℳ3 for different tasks. Time intervals are in seconds.
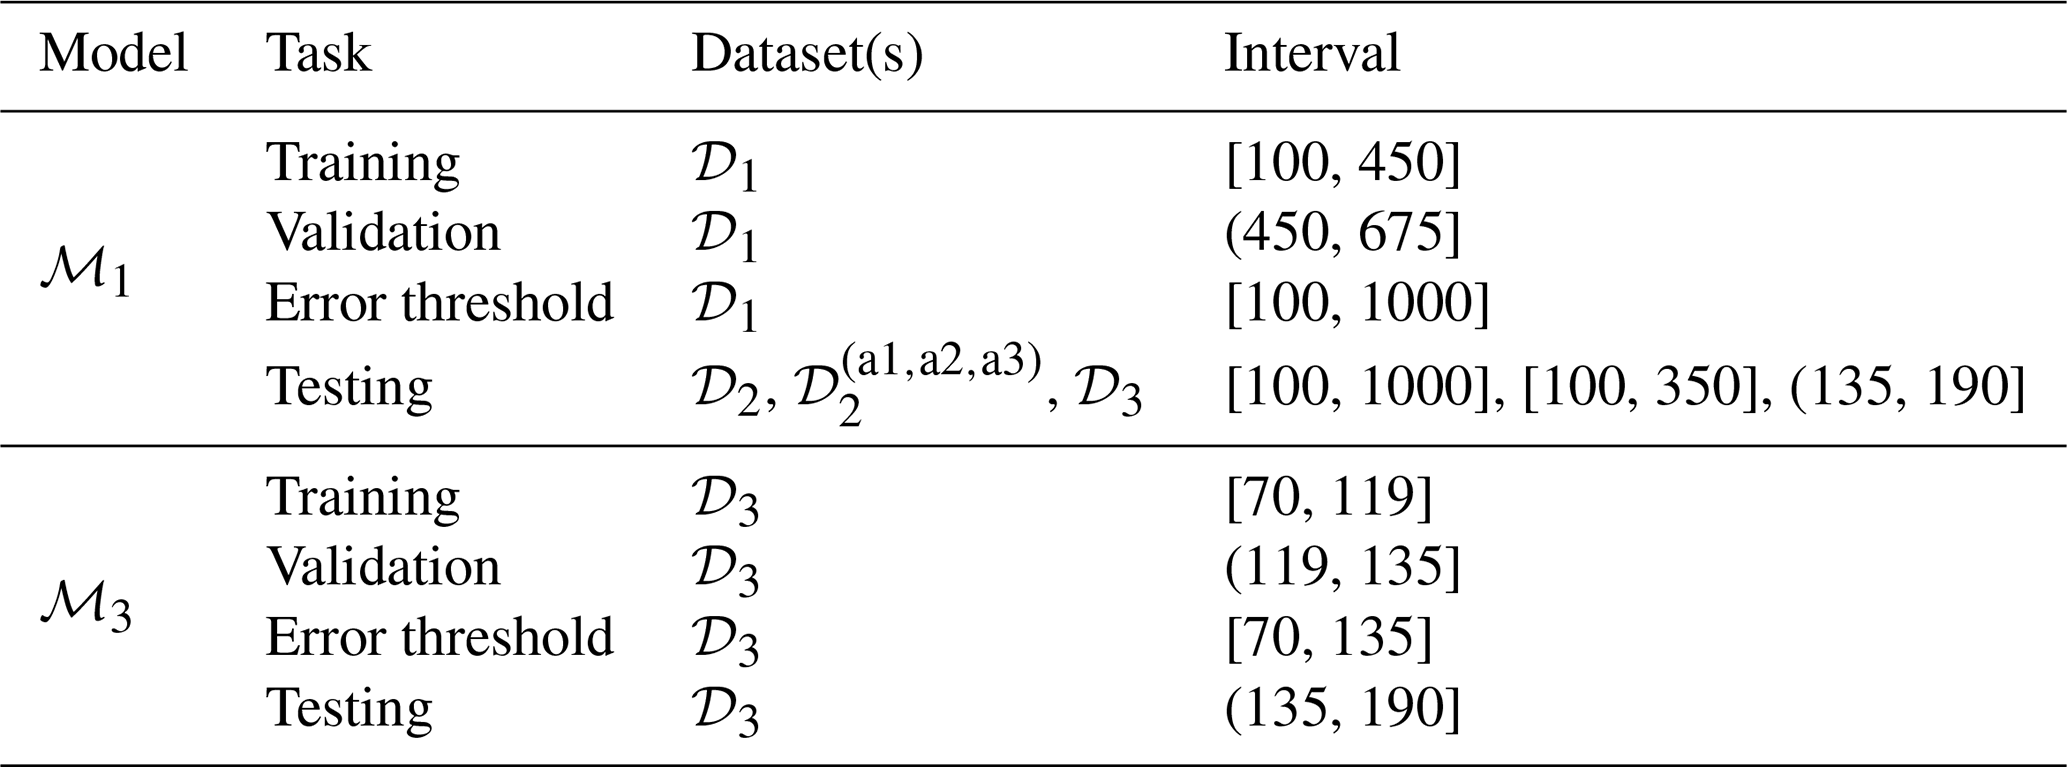
Channels used in training the models include angular velocity, rotor torque, and tower base forces and moments. For most of the analyses presented in this paper, model ℳ1 was employed. This model is trained on a previously available healthy dataset, 𝒟1, and serves as the primary reference. The rationale for this approach is based on the practical constraint that datasets containing anomalies rarely have a corresponding healthy segment recorded immediately beforehand. As such, training a model in real time using only the healthy portion of a dataset that later exhibits an anomaly is typically infeasible. Nonetheless, for comparative purposes, we also evaluate model ℳ3, which is trained on the healthy portion of dataset 𝒟3, under the hypothetical assumption that similar data had been recorded under identical conditions in advance.
Models ℳ1 and ℳ3 were configured with identical training hyperparameters, except for the number of training epochs. Both models utilize a prediction horizon of a single time step and a look-back to prediction ratio of , corresponding to an input sequence length of 10 time steps. The network architecture consists of a single hidden layer with 100 neurons, trained using a batch duration of 60 s, a learning rate of 0.001, and no dropout regularization. Model ℳ1 was trained for 60 epochs, whereas model ℳ3 required an extended training schedule of 1000 epochs. This increase was motivated by the significantly shorter duration of training data available for ℳ3, which span only from 70 to 119 s due to the presence of an anomaly later in the dataset, as detailed in Table 1.
Three combinations of anomaly detection criteria were investigated. The symbols E and ΔE refer to threshold-exceeding conditions based on the model prediction error and its time derivative, respectively. The detection logic tested includes the following:
-
ΔE. The derivative of the error must exceed a threshold.
-
ΔE∨E. Either the error or its derivative must exceed its threshold.
-
ΔE∧E. Both the error and its derivative must simultaneously exceed their respective thresholds.
4.1 Model performance during healthy conditions
The performance of the ℳ1 model, in terms of the normalized error and error derivative relative to their respective threshold values, when tested against measured data during healthy operations (𝒟2), is shown in Fig. 10. When using the lead principal component (i.e., 1PC variation of the ℳ1 model), the error values were consistent throughout the test. The MPC variation experienced a slight decline in error values as time progressed. As desired, both model variations exhibited no predicted anomalies based on any of the exceeding threshold criteria discussed.
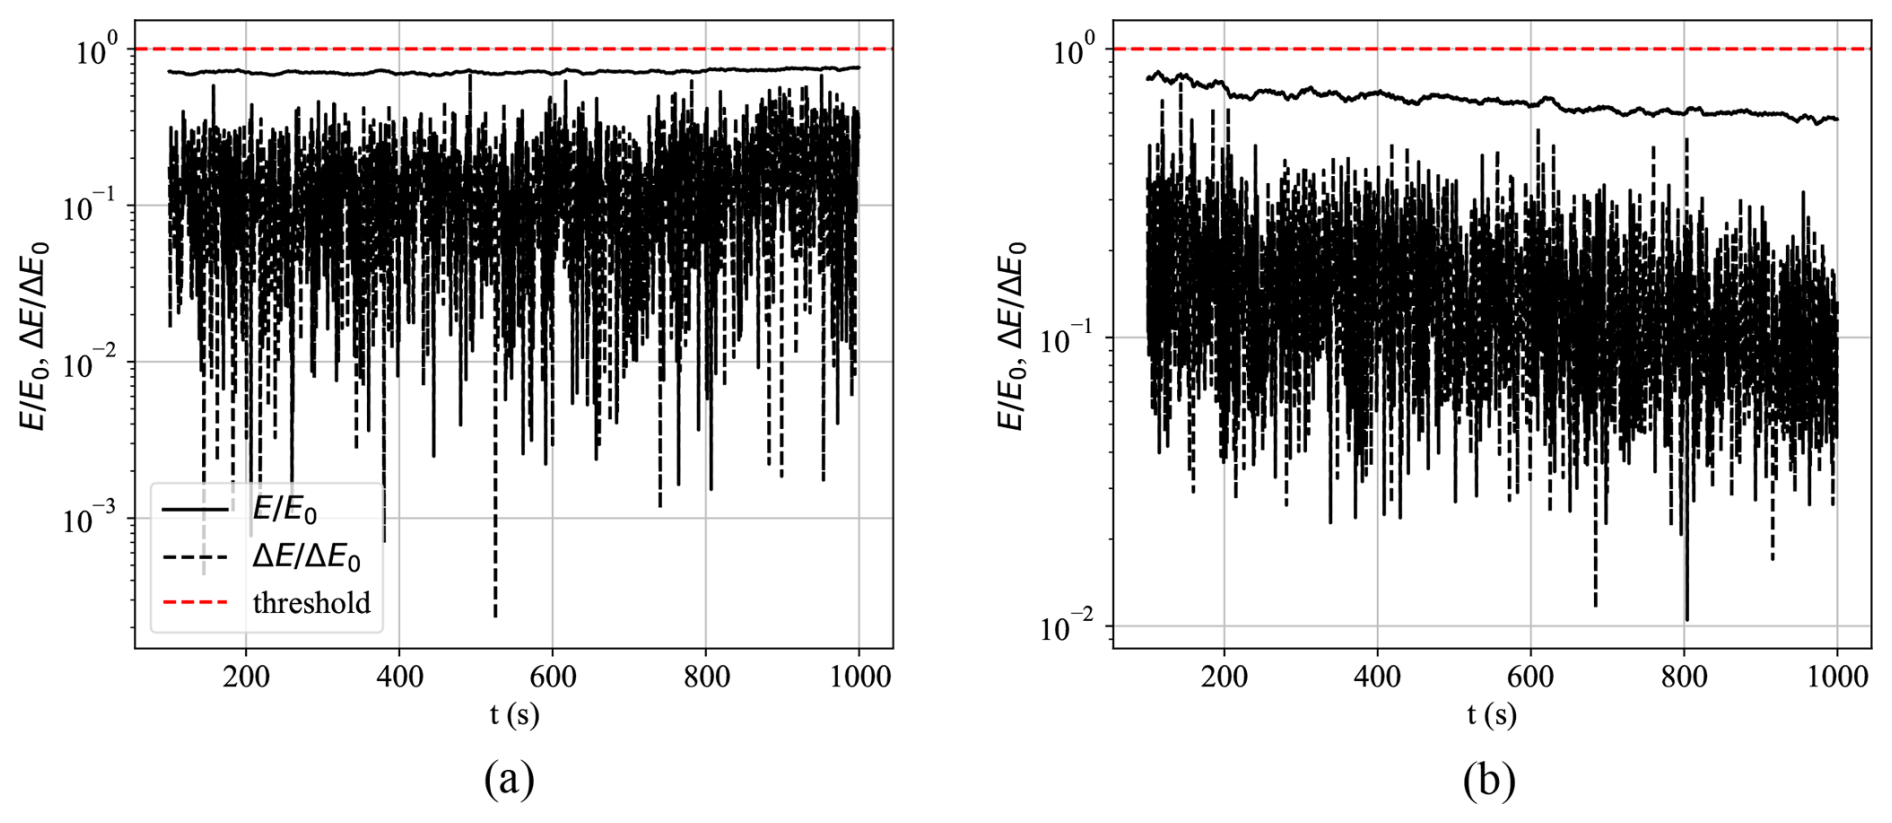
Figure 10Error and error derivative curves between measured data and the ℳ1 model during healthy 𝒟2 testing dataset conditions when (a) a single or (b) multiple principal components are used.
4.2 Performance under synthetic anomaly realizations
Model ℳ1 was tested on the synthetically altered variations of 𝒟2 – datasets , , and – using both 1PC and MPC variations. The results are presented in Fig. 11, where the first row (Fig. 11a–c) shows the 1PC model responses, and the second row (Fig. 11d–f) presents the MPC model responses. The anomaly criterion selected for this analysis is the joint condition (ΔE∧E).
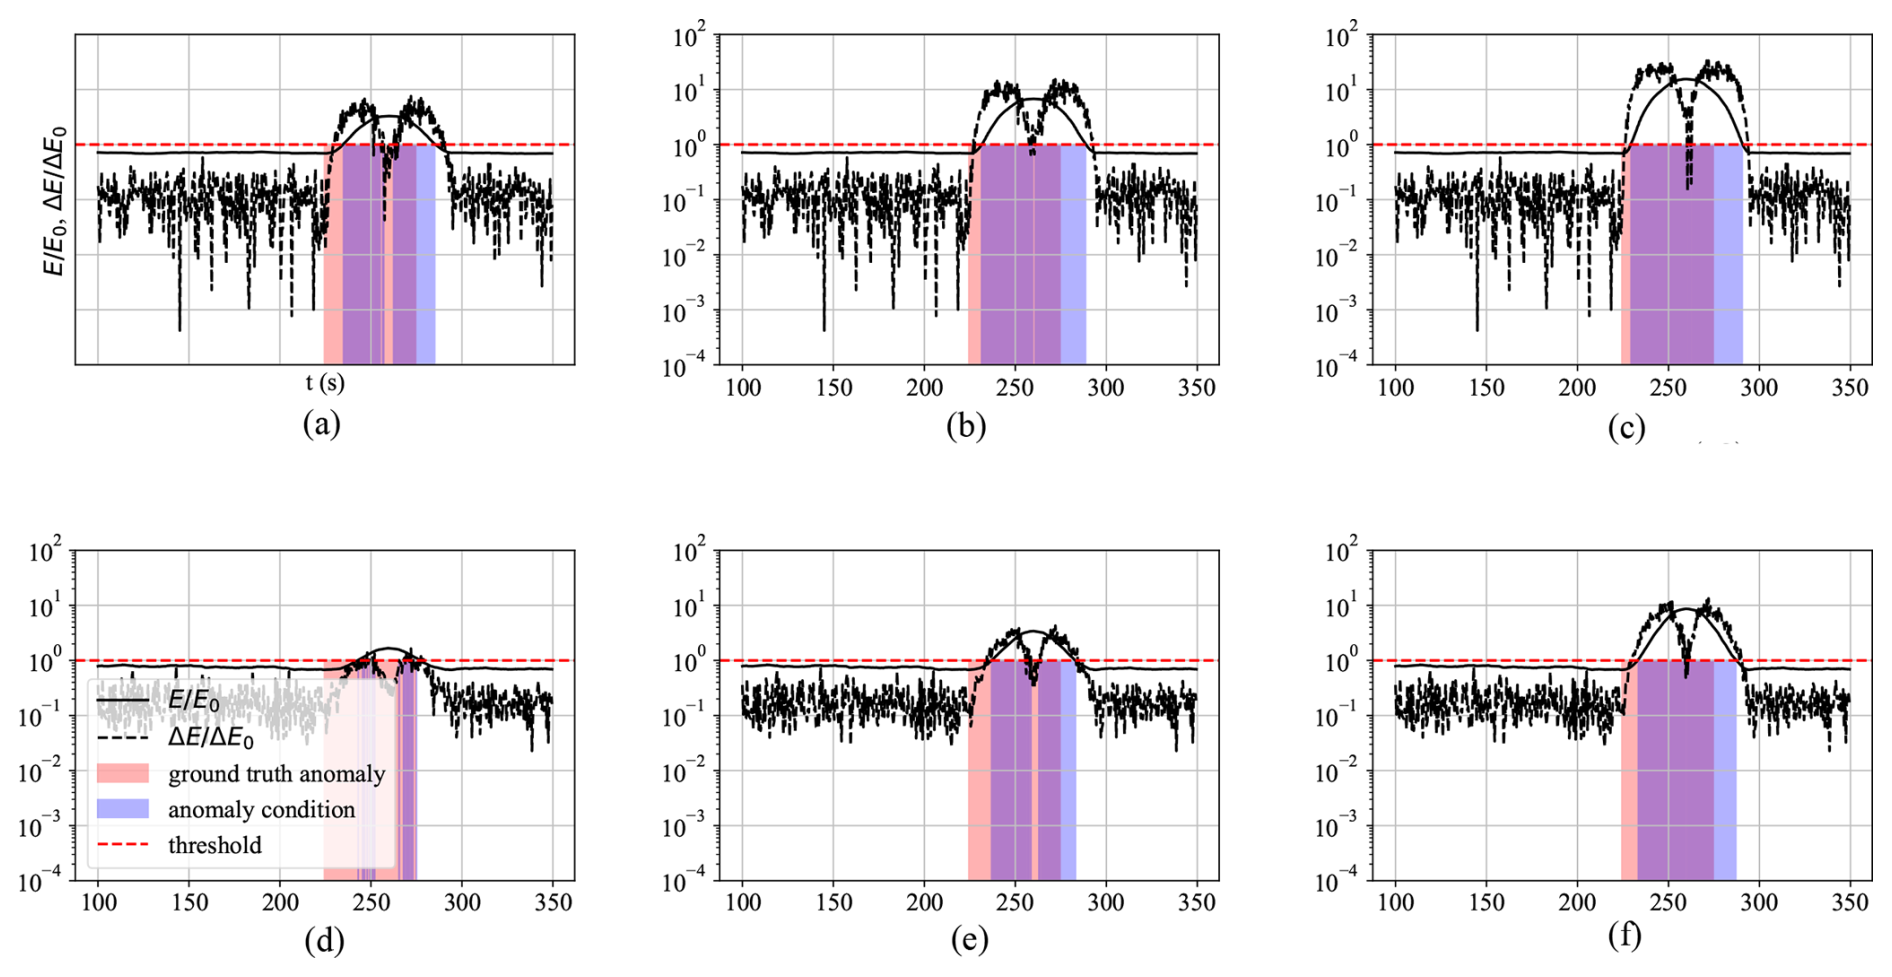
Figure 11Anomaly detection based on ΔE∧E criterion during synthetically altered dataset variations in 𝒟2 and the ℳ1 model detection response, with (a) 1PC – , (b) 1PC – , (c) 1PC – , (d) MPC – , (e) MPC – , and (f) MPC – variations.
The 1PC variation demonstrates overall enhanced coverage (highlighted in blue) and reduced detection delay relative to the onset of the ground-truth anomaly (highlighted in red). This is particularly evident in Fig. 12, which compares detection delays for 1PC and MPC under various anomaly scenarios. Although the MPC model includes more principal components, this added information can dilute the influence of specific anomalous channels, especially when the anomaly is strongly represented in the leading component but has minimal contributions in subsequent components. Conversely, if an anomaly were introduced in a channel with weak or near-zero loading in PC1, its detection would likely require the inclusion of additional components. Thus, while MPC offers broader coverage across the feature space, it may also distribute the reconstruction error in a way that reduces sensitivity to certain localized anomalies. Additionally, detection performance generally improved with increasing severity of the synthetically introduced anomaly. This is indicated in Fig. 12, which shows detection delay in seconds between the synthetically introduced anomaly and the predicted anomaly by the models. The figure also shows a sensitivity analysis of the models to the time step at which the data are sampled. Small time steps (high sampling frequency) can reduce anomaly detection delay but at the expense of computational cost.
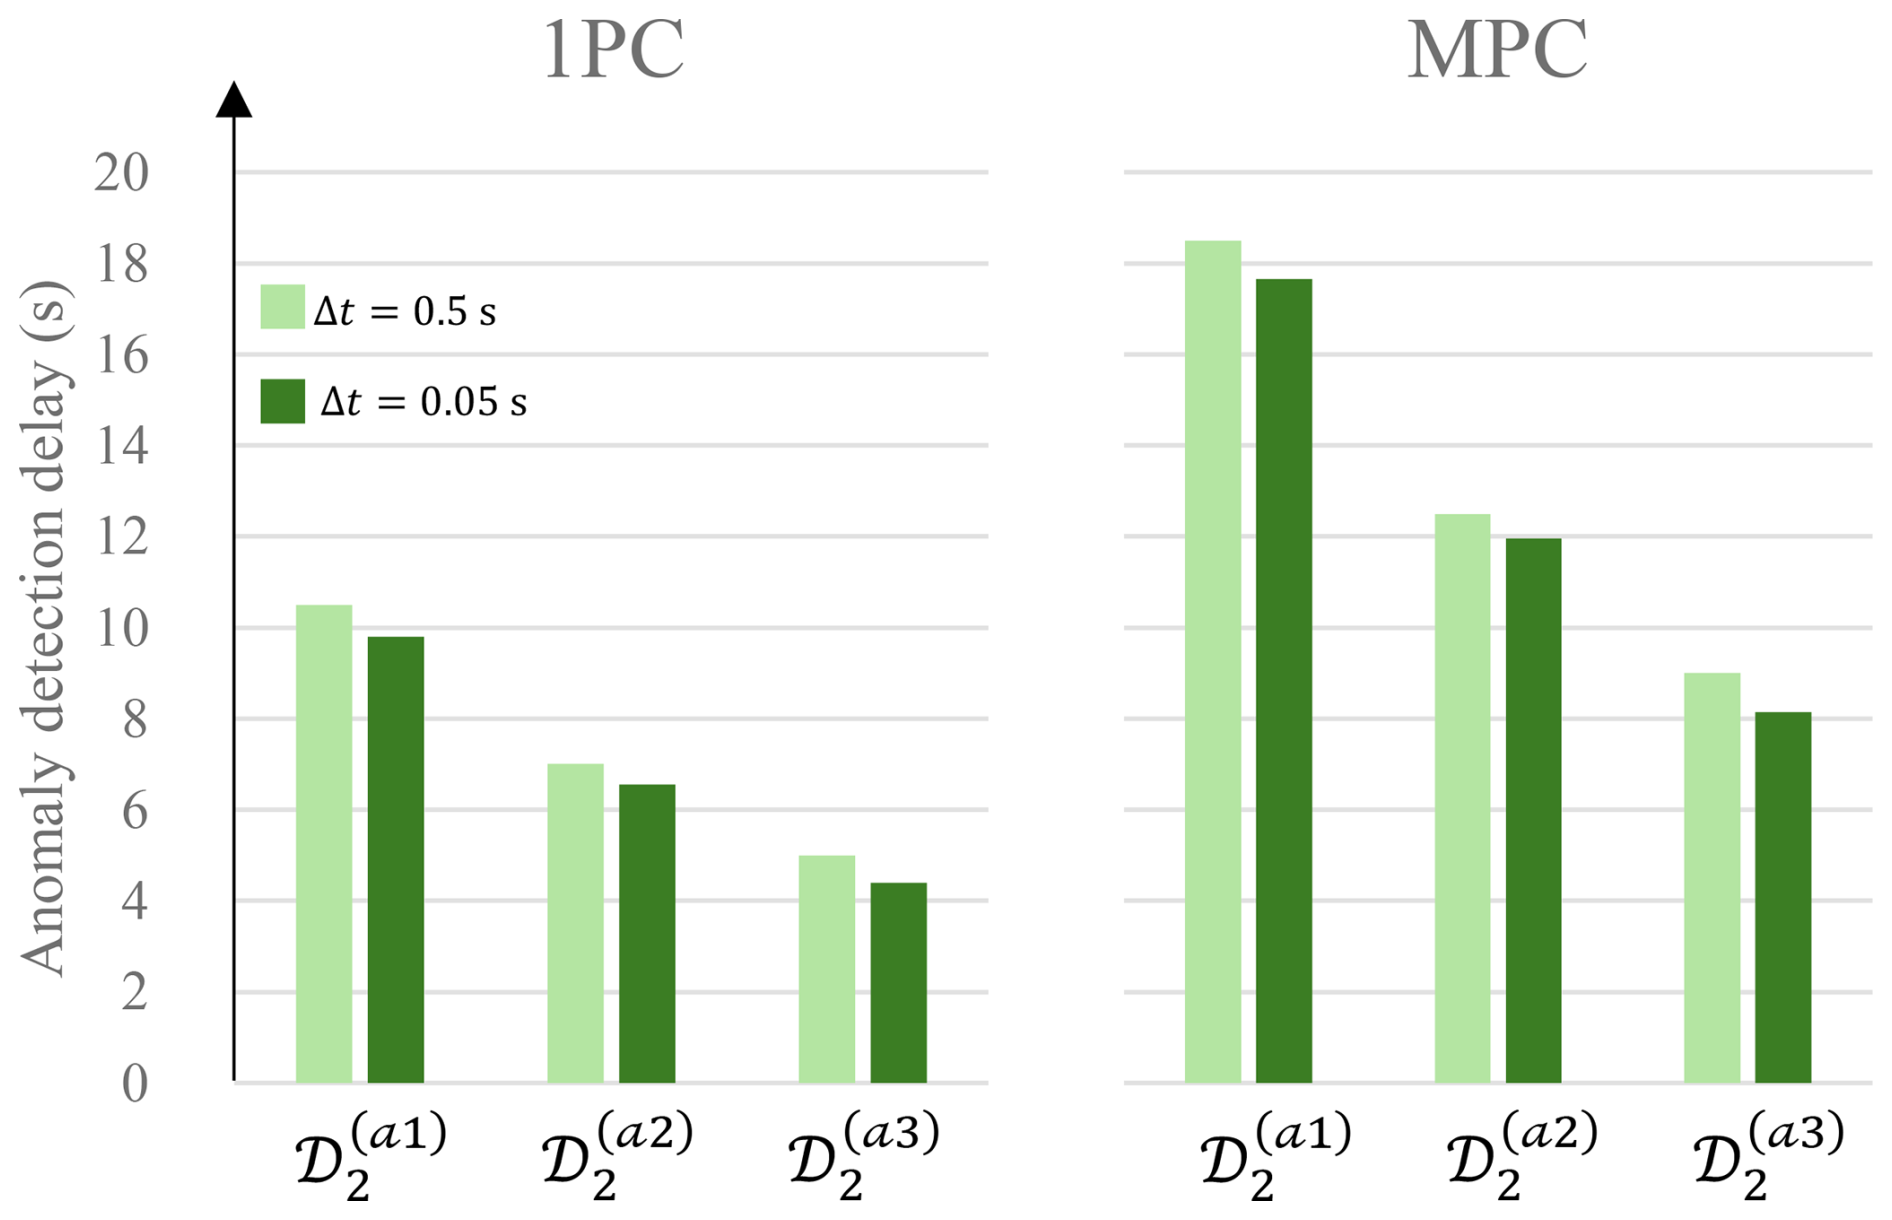
Figure 12Anomaly detection delay in seconds for ℳ1 (both 1PC and MPC variations) when tested during various altered 𝒟2 datasets for two time step realizations.
4.3 Pre-strike anomaly detection
During a high-rotor-angular-velocity test, 𝒟3, an unexpected anomaly caused the rotor to accelerate rapidly. The resulting increase in thrust forces caused significant blade deflection, and within 4 s, one of the blades struck the tower, leading to severe damage, as shown in Fig. 13.
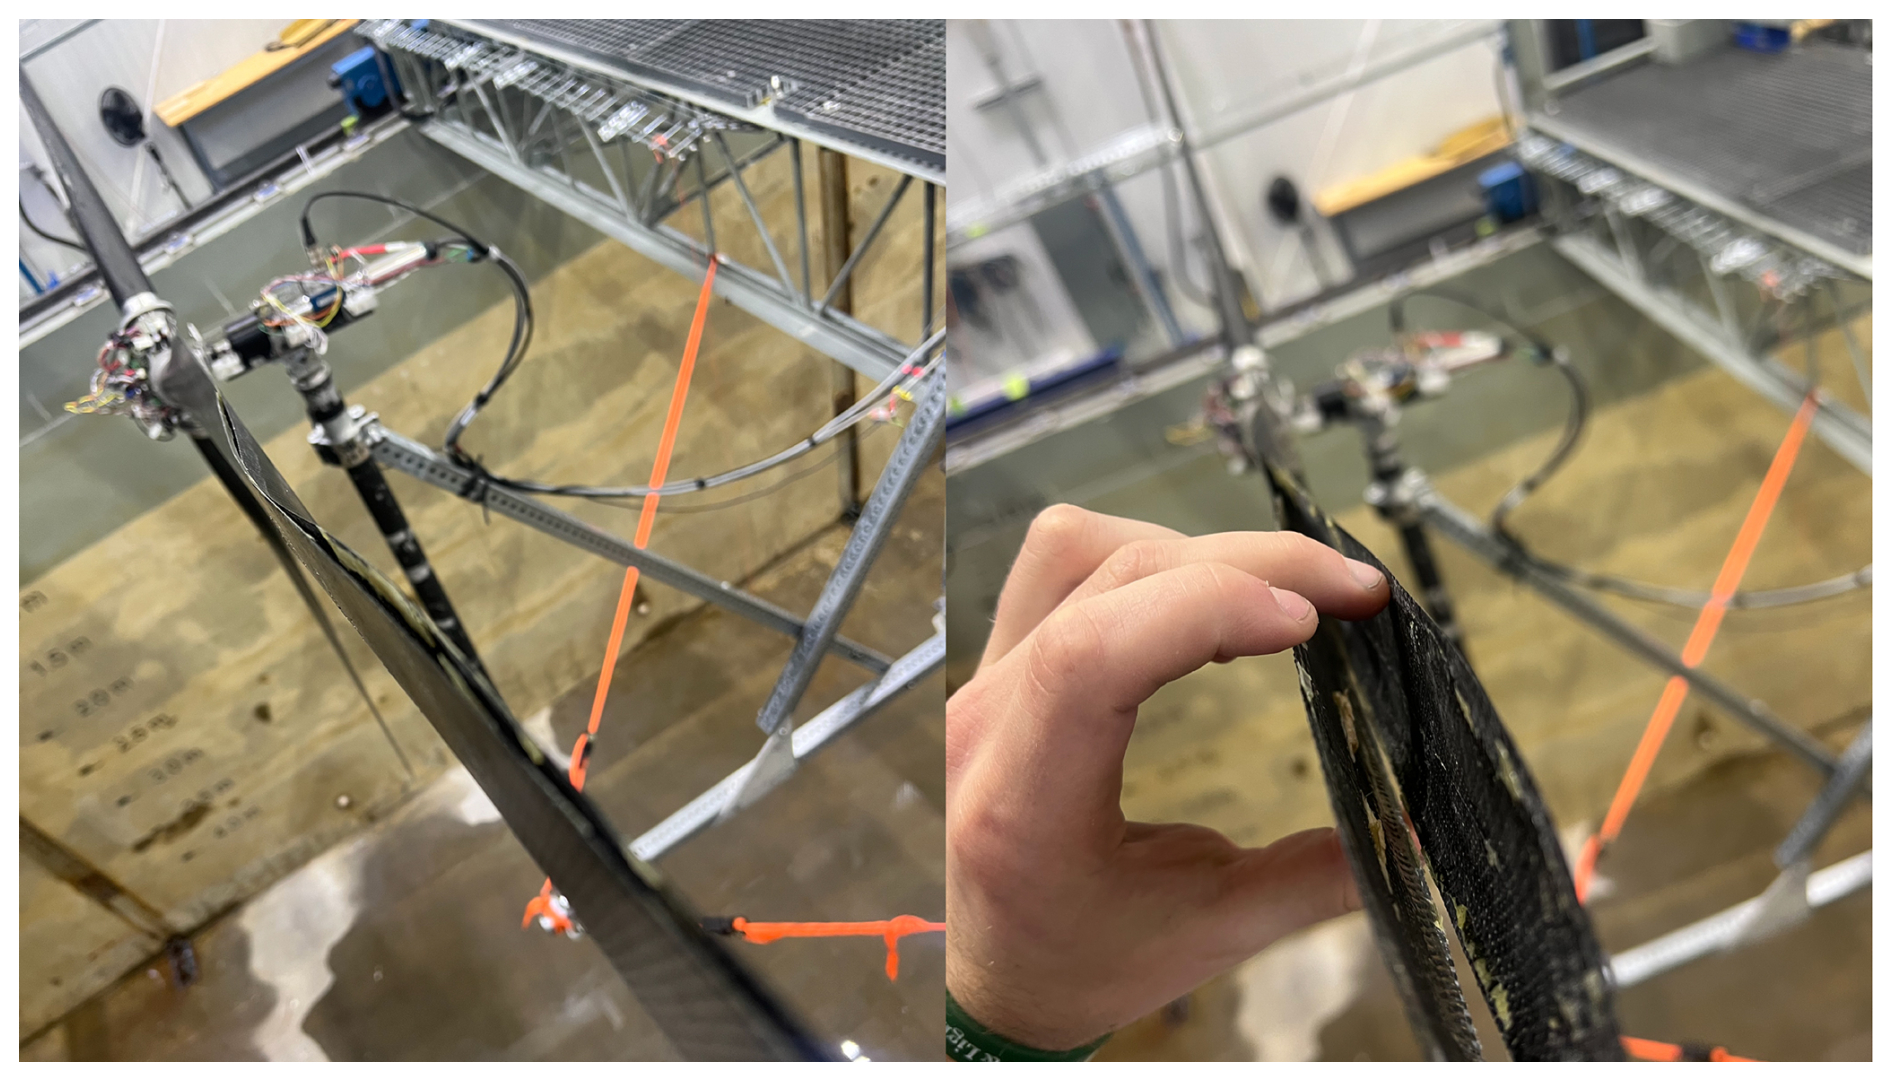
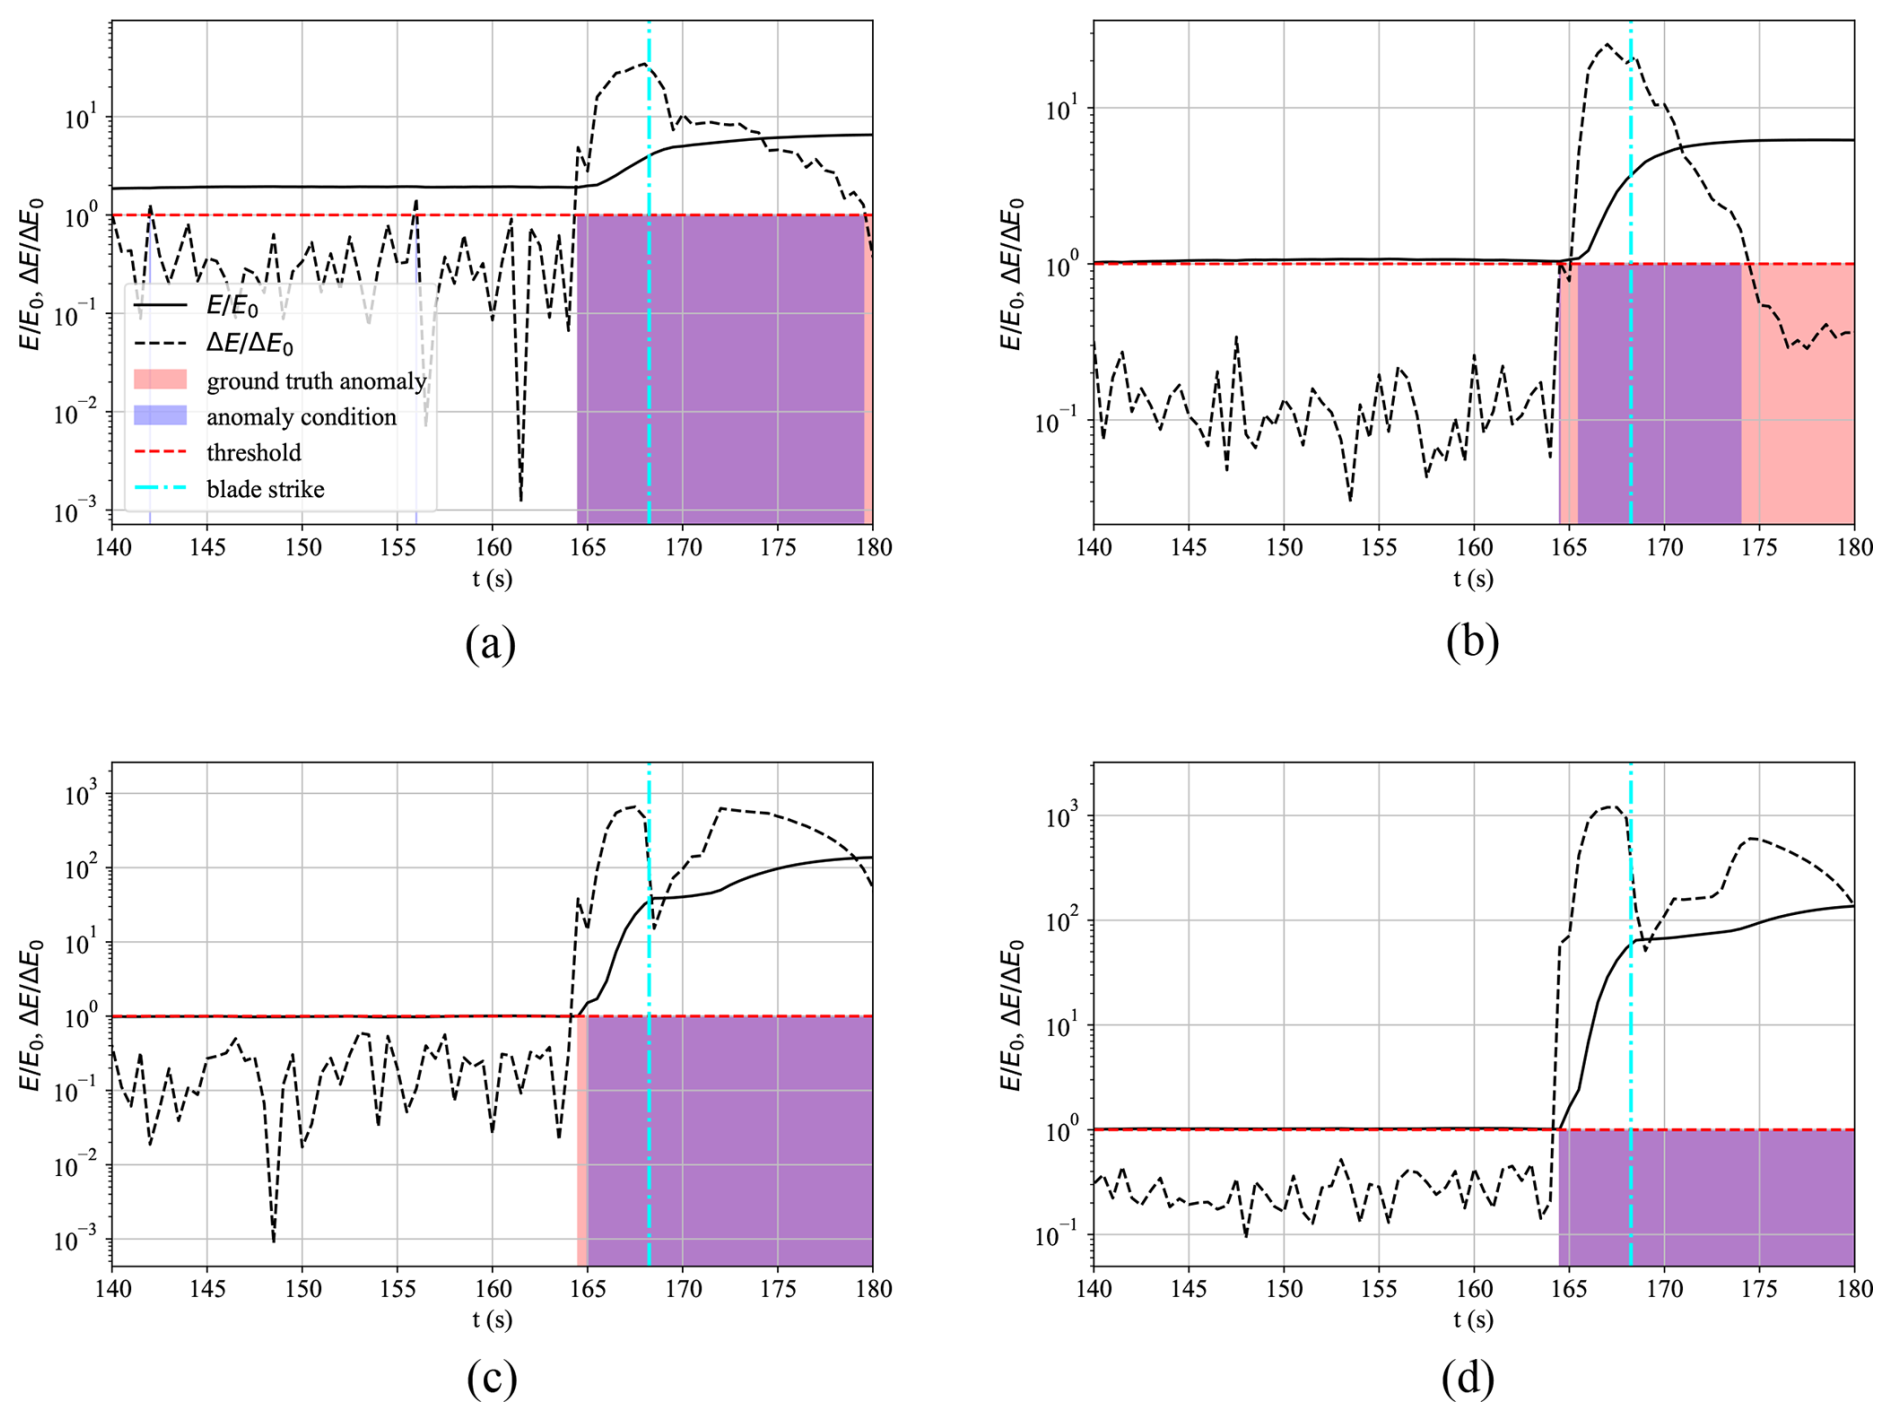
Figure 14Anomaly detection based on the ΔE∧E criterion during the 𝒟3 anomaly dataset and model detection response of the (a) ℳ1 – 1PC variation, (b) ℳ1 – MPC variation, (c) ℳ3 – 1PC variation, and (d) ℳ3 – MPC variation.
Models ℳ1 and ℳ3 were evaluated using both 1PC and MPC variations. The normalized error and error derivative, each scaled by their respective threshold values, are presented in Fig. 14. Anomalies are identified based on the joint exceedance of both criteria (ΔE∧E). As shown in the figure, the predicted anomaly region (blue) aligns well with the ground-truth anomaly (red), demonstrating the efficacy of the detection method. Additionally, anomaly conditions are detected prior to the blade strike, suggesting that such models could be used as preventive measures against consequential incidents.
For all models, the error derivative remains below the threshold prior to the anomaly, indicating that system behavior was consistent with healthy operation. However, the 1PC variation in model ℳ1 shows threshold violations in the error metric, E, before the onset of the actual anomaly. This can be attributed to a mismatch in operating conditions: ℳ1 was trained on dataset 𝒟1, where the turbine operated at significantly lower angular velocity, as illustrated earlier in Fig. 9a. This discrepancy introduces errors when applied to data from 𝒟3, which exhibits 51 % higher angular velocity.
Notably, this premature threshold crossing is not observed in the MPC variation of ℳ1. By incorporating multiple principal components, the MPC approach distributes the reconstruction error across several components, thereby diluting the influence of a mismatch from a single channel. This is further supported by the principal component contribution analysis in Fig. 4b, which shows that angular velocity is the dominant contributor to the leading principal component. Consequently, in the 1PC case, discrepancies in angular velocity have a large impact on the error.
Despite the error in ℳ1 1PC exceeding the threshold prior to the anomaly, the error derivative ΔE remains within acceptable bounds, ensuring no false positive detection. When model ℳ3, trained on the healthy segment of dataset 𝒟3, is used instead, the predicted anomaly coincides precisely with the true event. This underscores the importance of matching operating conditions between training and deployment for reliable anomaly detection.
Table 2 summarizes the anomaly detection performance of model ℳ1 with its 1PC and MPC variations, evaluated on the healthy dataset, 𝒟2; synthetically altered anomaly datasets ; and the blade–tower strike dataset, 𝒟3. From these results, the following key observations can be made:
-
The 1PC variation generally yields higher F1 scores compared to the MPC variation (43 % enhancement under ΔE∧E criterion).
-
The combined threshold criterion ΔE∧E provides the most consistent and reliable detection performance across datasets.
-
While the 1PC model achieves higher recall (R), the MPC model tends to produce higher precision (P).
Table 2Anomaly detection performance for models tested on datasets 𝒟2, , , , and 𝒟3, under different detection criteria: ΔE, ΔE∨E, and ΔE∧E. n/a = not applicable.
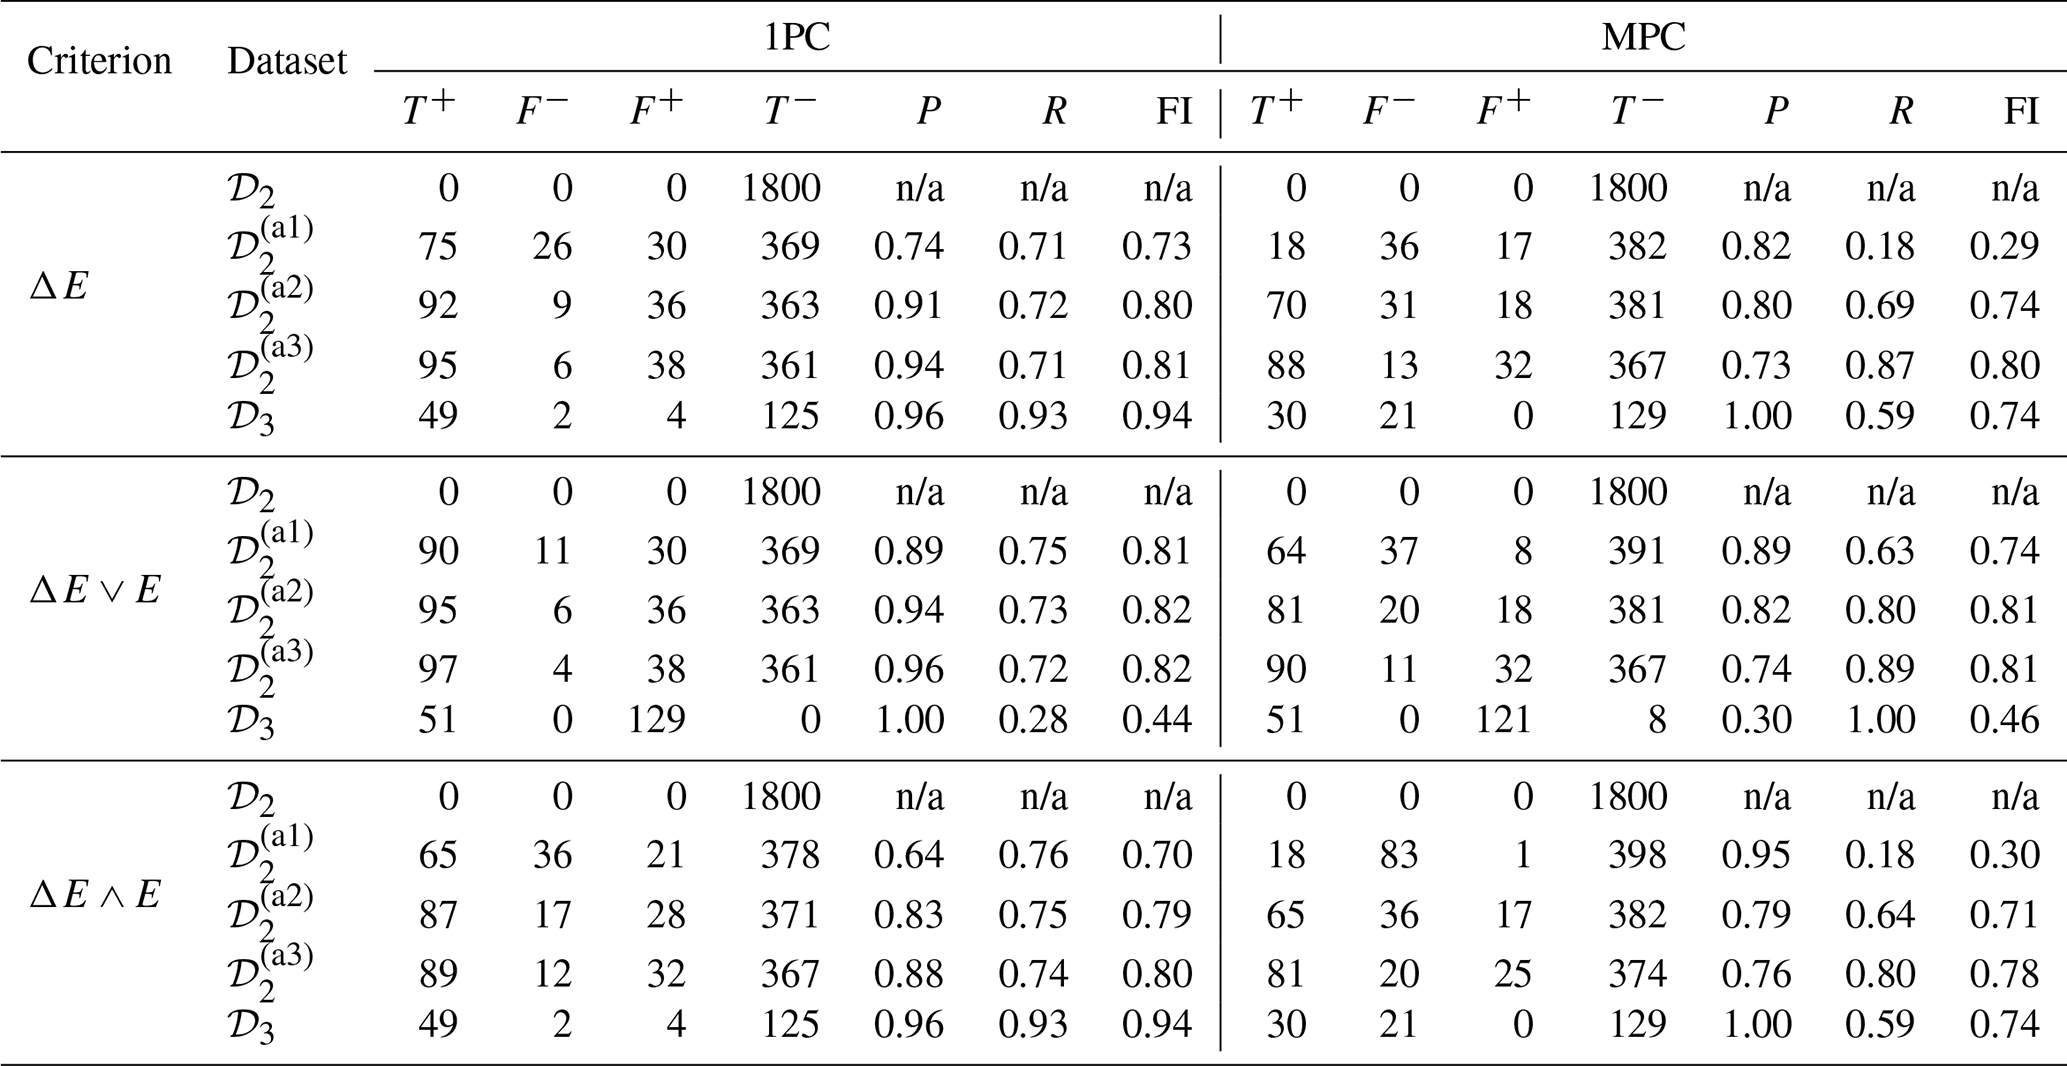
Importantly, both model variations produce no false positive detections under healthy conditions (𝒟2), regardless of the threshold criterion employed. The 1PC model typically reacts more rapidly to actual anomalies, as it is not constrained by the averaging of reconstruction errors across multiple principal components. This responsiveness contributes to its higher recall scores. However, this same sensitivity can lead to over-detection, which reduces precision. In contrast, the MPC model's error aggregation results in more conservative detection behavior, improving its precision at the expense of some detection latency.
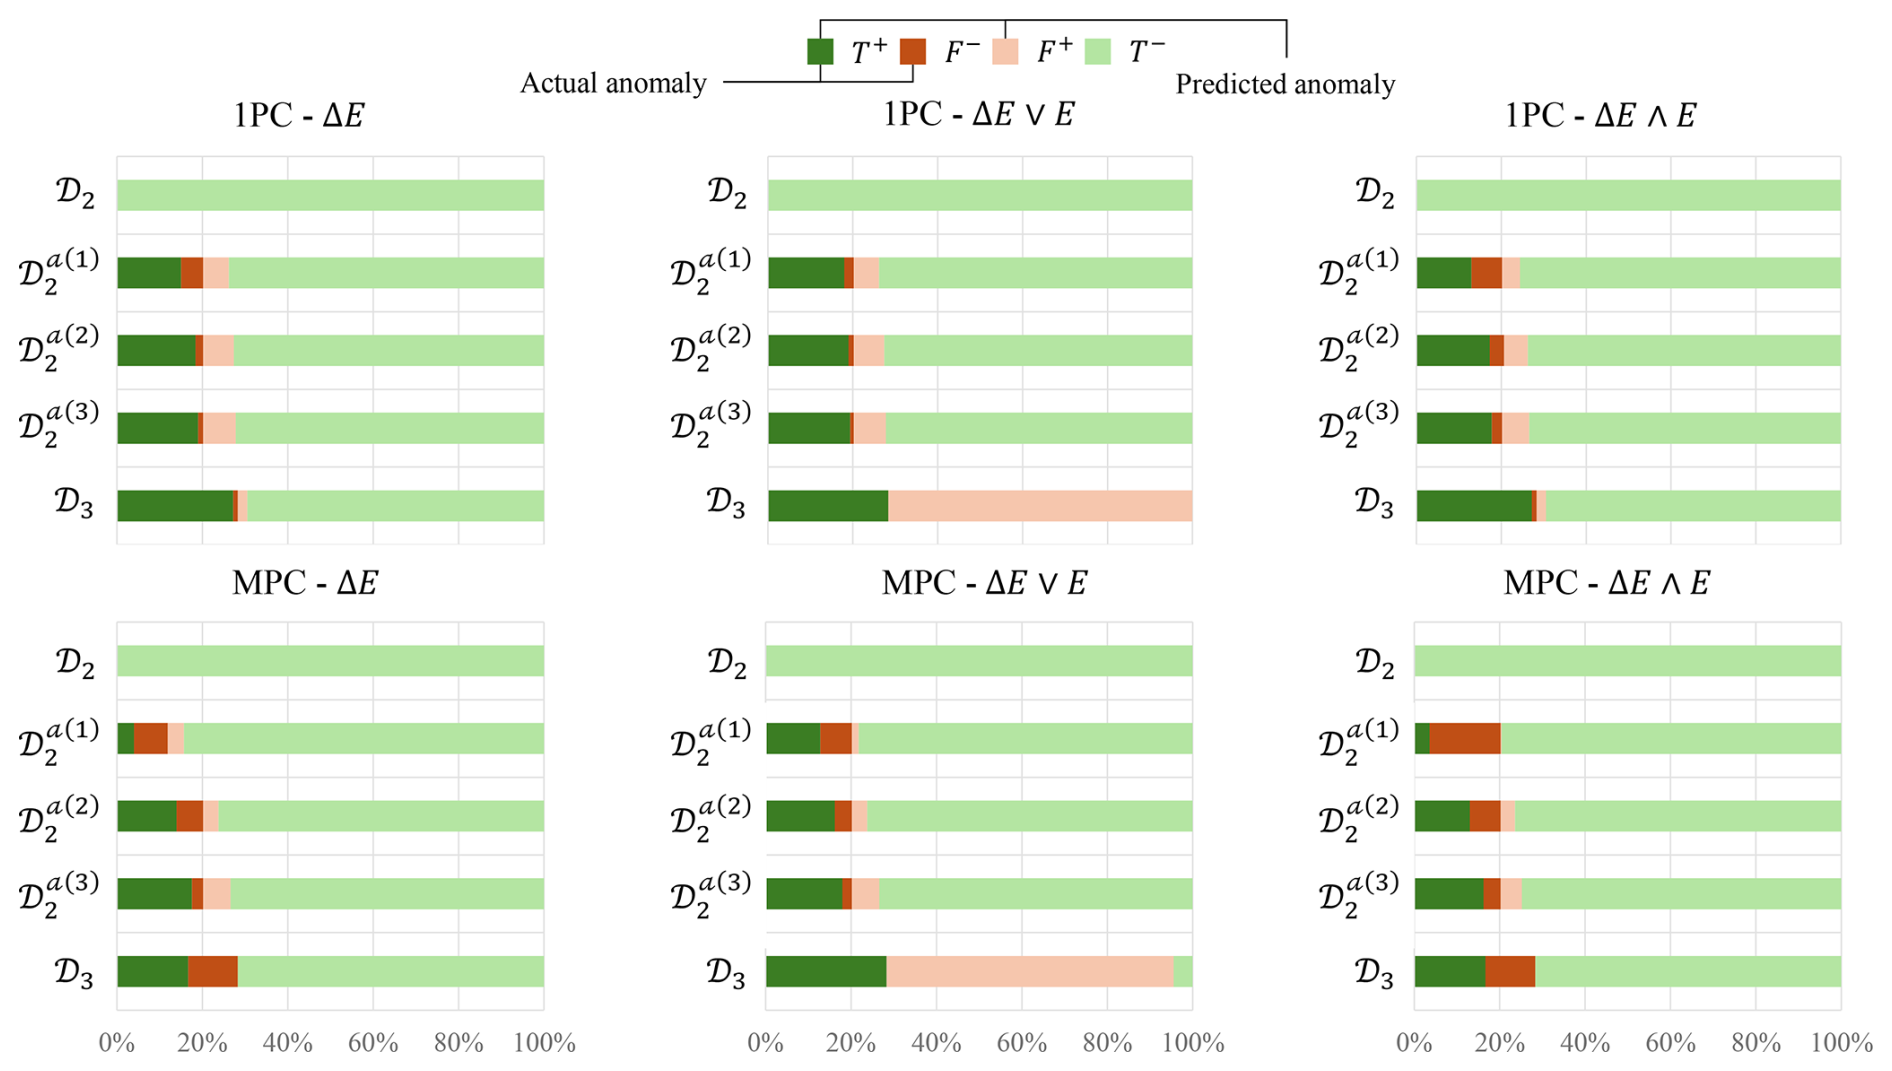
Figure 15Percentage of true positive, false negative, false positive, and true negative occurrences when testing the ℳ1 model for the various testing datasets.
Figure 15 presents the relative percentages of true positives, false negatives, false positives, and true negatives for model ℳ1 across the same set of testing datasets. In the horizontal bar charts, darker shades correspond to the presence of anomalies in the data – hence their absence in the healthy dataset 𝒟2. The sign of each classification outcome indicates whether the model successfully detected an anomaly (positive) or failed to do so (negative). Color is used to convey prediction quality and context: green denotes correct classifications, while red indicates incorrect ones. This visual encoding effectively communicates both the correctness of model predictions and the operational context in which they occur, thereby emphasizing the model’s ability to distinguish between healthy and anomalous system states.
The error derivative appears to be the dominant criterion for accurate anomaly detection. As shown in Fig. 15, the combined threshold criterion ΔE∧E results in fewer incorrect classifications (i.e., reduced red regions), whereas more flexible criteria – where either the error or its derivative alone exceeds the threshold – lead to increased misclassifications. Notably, the reconstruction error E serves as a useful indicator for identifying deviations due to previously unseen operating conditions. In contrast, the error derivative ΔE is particularly effective in capturing abrupt transitions between the reconstructed and measured signals, making it well suited for detecting sudden-onset anomalies such as the one present in this paper.
As for the incident dataset, 𝒟3, since the turbine operated under different conditions than those in the training dataset for the ℳ1 model, the error was high. Therefore, using the error derivative as an additional criterion helps with detecting true positives. This is an important aspect of a good anomaly detection model because most of the time the anomaly will most likely occur under conditions that have not been seen before.
It is ultimately up to the developer/operator to gather a certain number of anomaly points before activating an alerting system or before acting upon it to limit disturbance to the main testing campaign. The system could also be developed such that the model can trace back to which of the channels contributed to the anomaly based on the correlation matrix calculated during PC analysis.
This study demonstrates the feasibility and effectiveness of a multivariate long short-term memory (LSTM)-based reconstruction model for early anomaly detection in scaled wind turbine experiments. By leveraging principal component projections of healthy operational data, the model enables robust monitoring through the reconstruction error and its derivative. Various detection criteria were evaluated, including threshold exceedance of the error E, its time derivative ΔE, and their logical combination. Two models were trained on distinct datasets, each evaluated using both single and multiple principal component (1PC and MPC) variations.
The results indicate that the criterion combining both the error and the error derivative (ΔE∧E) yields the most consistent and accurate anomaly detection performance across test cases. The 1PC model offers superior responsiveness and recall, making it well suited for identifying abrupt anomalies, though at the expense of precision. In contrast, the MPC model exhibits greater robustness to false alarms due to its conservative aggregation of the reconstruction error. Importantly, both model variations demonstrated zero false positives when applied to healthy test data, underscoring their reliability for real-time deployment.
This work serves as a proof of concept that simple, interpretable, and computationally efficient techniques can be deployed to enhance safety and operational awareness during laboratory-scale wind turbine testing. The approach holds promise for extension to ocean-based and full-scale wind energy systems, where early anomaly detection is critical for preventing equipment failure and improving system reliability during experimental campaigns and operational phases.
The analysis scripts used in this study are available on Zenodo via the following DOI: https://doi.org/10.5281/zenodo.16615048 (Alkarem, 2025). The archive includes the exact version of all scripts used to generate the results in this paper. All data supporting the findings of this study are available in the same Zenodo archive. The deposit contains the raw experimental data in a dedicated subfolder labeled “data”.
KH, RK, and BH were responsible for the acquisition of the financial award for the project, alongside SG and RH from the University of Rhode Island, and coordinated this research activity. AV and AN initiated a research exchange between the University of Maine and the Norwegian University of Science and Technology, which equipped YA and IA with the methodologies and tools used in this research and ultimately led to this publication. BH and IA designed the experiments, and IA and YA carried them out. IA managed data collection, while YA – with vital input from AN and SG – developed the models and performed the analysis. KH, AV, and RH supervised the experiment and the analysis. YA prepared the paper with contributions from all co-authors.
At least one of the (co-)authors is a member of the editorial board of Wind Energy Science. The peer-review process was guided by an independent editor, and the authors also have no other competing interests to declare.
Publisher's note: Copernicus Publications remains neutral with regard to jurisdictional claims made in the text, published maps, institutional affiliations, or any other geographical representation in this paper. While Copernicus Publications makes every effort to include appropriate place names, the final responsibility lies with the authors.
The authors gratefully acknowledge the US Department of Energy Office of Science for funding this project through the DOE-EPSCOR program awarded to the University of Rhode Island and the University of Maine.
The research has been supported by the US Department of Energy (grant nos. DE-SC0022103 and DE-SC0024295).
This paper was edited by Yolanda Vidal and reviewed by three anonymous referees.
Alkarem, Y. R.: Dataset and Script Codes Regarding the Publication: Investigating Lab-scaled Offshore Wind Aerodynamic Testing Failure and Developing Solutions for Early Anomaly Detections, Zenodo [data set], https://doi.org/10.5281/zenodo.16615048, 2025.
Alkarem, Y. R., Huguenard, K., Kimball, R. W., Hejrati, B., Goupee, A., Albertson, S., and Dahl, J.: Digital twin model development for mitigating floating offshore wind turbine motions due to wave actions, in: ISOPE International Ocean and Polar Engineering Conference, ISOPE-I, ISBN 978-1-880653-80-7, ISSN 1098-6189, 2023. a
Alkarem, Y. R., Huguenard, K., Kimball, R. W., Hejrati, B., Ammerman, I., Nejad, A. R., and Grilli, S.: On Building Predictive Digital Twin Incorporating Wave Predicting Capabilities: Case Study on UMaine Experimental Campaign-FOCAL, J. Phys. Conf. Ser., 2745, 012001, https://doi.org/10.1088/1742-6596/2745/1/012001, 2024. a
Ammerman, I., Alkarem, Y., Kimball, R., Huguenard, K., and Hejrati, B.: Experimental validation of a Kalman observer using linearized OpenFAST and a fully instrumented 1 : 70 model, Wind Energy, https://doi.org/10.1002/we.2915, 2024. a
Cao, Q., Chen, Y., Zhang, K., Zhang, X., Cheng, Z., and Wen, B.: Design approach of thrust-matched rotor for basin model tests of floating straight-bladed vertical axis wind turbines, Journal of Renewable and Sustainable Energy, 15, 063308, https://doi.org/10.1063/5.0176064, 2023. a
Dameshghi, A. and Refan, M. H.: Wind turbine gearbox condition monitoring and fault diagnosis based on multi-sensor information fusion of SCADA and DSER-PSO-WRVM method, International Journal of Modelling and Simulation, 39, 48–72, 2019. a
Dibaj, A., Nejad, A. R., and Gao, Z.: A data-driven approach for fault diagnosis of drivetrain system in a spar-type floating wind turbine based on the multi-point acceleration measurements, J. Phys. Conf. Ser., 2265, 032096, https://doi.org/10.1088/1742-6596/2265/3/032096, 2022. a, b
Dibaj, A., Valavi, M., and Nejad, A. R.: Unsupervised anomaly detection of permanent-magnet offshore wind generators through electrical and electromagnetic measurements, Wind Energ. Sci., 9, 2063–2086, https://doi.org/10.5194/wes-9-2063-2024, 2024. a
Fowler, M., Lenfest, E., Viselli, A., Goupee, A., Kimball, R., Bergua, R., Wang, L., Zalkind, D., Wright, A., and Robertson, A.: Wind/Wave Testing of a 1:70-Scale Performance-Matched Model of the IEA Wind 15 MW Reference Wind Turbine with Real-Time ROSCO Control and Floating Feedback, Machines, 11, https://doi.org/10.3390/machines11090865, 2023. a
ISO: Mechanical vibration-evaluation of machine vibration by measurements on non-rotating parts, International Standard published [60.60], ISO 20816-21:2025, 28 pp., 2025. a
Kimball, R., Goupee, A. J., Fowler, M. J., de Ridder, E., and Helder, J.: Wind/Wave Basin Verification of a Performance-Matched Scale-Model Wind Turbine on a Floating Offshore Wind Turbine Platform, Proceedings of the ASME 2014 33rd International Conference on Ocean, Offshore and Arctic Engineering, Volume 9B: Ocean Renewable Energy, San Francisco, California, USA, 8–13 June 2014, ASME, V09BT09A025, https://doi.org/10.1115/OMAE2014-24166, 2014. a
Le, H. X. and Matunaga, S.: A residual based adaptive unscented Kalman filter for fault recovery in attitude determination system of microsatellites, Acta Astronautica, 105, 30–39, 2014. a
Leahy, K., Hu, R. L., Konstantakopoulos, I. C., Spanos, C. J., and Agogino, A. M.: Diagnosing wind turbine faults using machine learning techniques applied to operational data, in: 2016 IEEE International Conference on Prognostics and Health Management (ICPHM), IEEE, 1–8, https://doi.org/10.1109/ICPHM.2016.7542860, 2016. a, b
Lu, B., Dibaj, A., Gao, Z., Nejad, A. R., and Zhang, Y.: A class-imbalance-aware domain adaptation framework for fault diagnosis of wind turbine drive trains under different environmental conditions, Ocean Engineering, 296, 116902, https://doi.org/10.1016/j.oceaneng.2024.116902, 2024. a
Mehlan, F. C. and Nejad, A. R.: On the modeling errors of digital twins for load monitoring and fatigue assessment in wind turbine drivetrains, Wind Energ. Sci., 10, 417–433, https://doi.org/10.5194/wes-10-417-2025, 2025. a, b
Miele, E. S., Bonacina, F., and Corsini, A.: Deep anomaly detection in horizontal axis wind turbines using graph convolutional autoencoders for multivariate time series, Energy and AI, 8, 100145, https://doi.org/10.1016/j.egyai.2022.100145, 2022. a
Nejad, A. R., Odgaard, P. F., and Moan, T.: Conceptual study of a gearbox fault detection method applied on a 5-MW spar-type floating wind turbine, Wind Energy, 21, 1064–1075, 2018. a
Parker, A.: Development and Testing of a 1 : 70 Scale Model Wind Turbine of the IEA Reference 15 MW Floating Offshore System, Master's thesis, University of Maine, No. 3548, https://digitalcommons.library.umaine.edu/etd/3548 (last access: 5 August 2025), 2022. a
Peng, H., Li, S., Shangguan, L., Fan, Y., and Zhang, H.: Analysis of wind turbine equipment failure and intelligent operation and maintenance research, Sustainability, 15, 8333, https://doi.org/10.3390/su15108333, 2023. a
Soares-Ramos, E. P., de Oliveira-Assis, L., Sarrias-Mena, R., and Fernández-Ramírez, L. M.: Current status and future trends of offshore wind power in Europe, Energy, 202, 117787, https://doi.org/10.1016/j.energy.2020.117787, 2020. a
Wang, Y., Yoshihashi, R., Kawakami, R., You, S., Harano, T., Ito, M., and Naemura, T.: Unsupervised anomaly detection with compact deep features for wind turbine blade images taken by a drone, IPSJ Transactions on Computer Vision and Applications, 11, 1–7, 2019. a
Wang, Z., Guo, Y., and Wang, H.: Review on monitoring and operation-maintenance technology of far-reaching sea smart wind farms, Journal of Marine Science and Engineering, 10, 820, https://doi.org/10.3390/jmse10060820, 2022. a
Zhou, J. and Zhu, Y.: On the optimality of Kalman Filter for Fault Detection, arXiv [preprint], https://doi.org/10.48550/arXiv.2301.11573, 27 January 2023. a