the Creative Commons Attribution 4.0 License.
the Creative Commons Attribution 4.0 License.
 | 17 Nov 2025
Hurricane impacts in the United States East Coast offshore wind energy lease areas
Kelsey B. Thompson
Rebecca J. Barthelmie
Sara C. Pryor
Wind turbines deployed in offshore wind energy lease areas along the US East Coast could significantly contribute to the national electricity supply. This region is also impacted by powerful tropical and extratropical cyclones that may lead to high structural loading on wind turbines and support structures and, in the event of above cut-out wind speed, low power production (capacity factors < 0.2). Four sets of high-resolution simulations are performed for two category 3 tropical cyclones that tracked close to current offshore wind energy lease areas to assess the possible impacts on, and from, wind turbines. Simulations of Hurricanes Irene and Sandy are performed at convective-permitting resolution (grid spacing in inner domain of 1.33 km) with both the Weather Research and Forecasting model (WRF, v4.2.2) and the Coupled Ocean–Atmosphere–Wave–Sediment Transport (COAWST, v3.7) model to characterize geophysical conditions of relevance to offshore wind turbines. These simulations are performed without and with a wind farm parameterization (WFP) active, with the latter using the assumption that existing lease areas are fully populated with 15 MW wind turbines at a 1.85 km spacing. Many aspects (e.g., track, near-surface wind speed, sea level pressure, precipitation volumes) are well reproduced in control simulations (no WFP) with both WRF and COAWST, particularly for Hurricane Sandy. COAWST simulations lead to more intense cyclones with a slightly larger area of storm-force wind speeds, a higher likelihood of hub-height wind speeds > 25 m s−1, and higher precipitation volumes, possibly indicating underestimation of hurricane risk in uncoupled simulations. All eight simulations indicate maximum hub-height wind speeds within the existing lease areas below 50 m s−1. However, COAWST simulations indicate frequent wind–wave misalignment of > 30°, and the joint occurrence of significant wave height, hub-height wind speed, and wave period in some lease areas reaches levels that are likely to be associated with large structural loads. This work re-emphasizes the utility of coupled simulations in describing geophysical conditions of relevance to offshore wind turbine operating conditions.
- Article
(6589 KB) - Full-text XML
-
Supplement
(3620 KB) - BibTeX
- EndNote


1.1 Motivation
At the end of 2023, the global offshore wind energy installed capacity (IC) was approximately 75.2 GW (GWEC, 2024a) due in part to a 24 % increase in IC during 2023 (GWEC, 2024b). The plentiful offshore wind resource (Marvel et al., 2013; Bodini et al., 2024; Pryor and Barthelmie, 2024a) and recent reductions in the levelized cost of energy for offshore deployments (Jansen et al., 2020; Wiser et al., 2021) mean that the number of wind turbines (WTs) deployed in (coastal) offshore regions is projected to rapidly increase (GWEC, 2024b; Pryor and Barthelmie, 2024a). For example, substantial offshore wind energy developments are planned or in progress along the US East Coast (Fig. 1) in regions with high wind resource (power generation potential), close proximity to major demand centers, and shallow water depths (Pryor et al., 2021; Pryor and Barthelmie, 2024a, b).
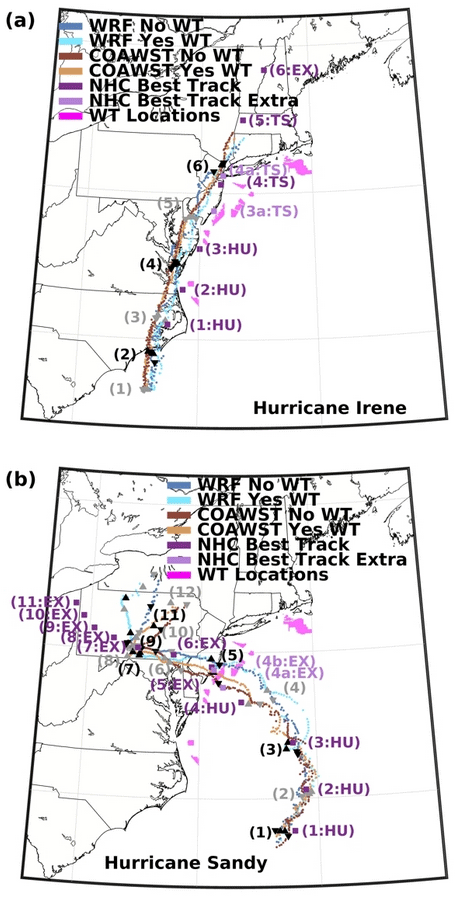
Figure 1Tracks of Hurricane (a) Irene and (b) Sandy from the WRF and COAWST simulations derived from the minimum sea level pressure (SLP) every 10 min, along with the corresponding National Hurricane Center (NHC) best track locations every 6 h. Two-letter abbreviations indicate variations in cyclone intensity/type: HU indicates hurricane stage, TS indicates tropical storm stage, and EX indicates extratropical stage. Also shown (in magenta) are the locations of the wind turbines (WTs) in the offshore lease areas (LAs) considered herein. Numbers in parentheses represent the location at the 6 h NHC increments, where “1” represents 27 August 2011 at 18:00 UTC with Irene and 29 October 2012 at 00:00 UTC with Sandy; 3a (28 August 2011 at 09:35 UTC) and 4a (28 August 2011 at 13:00 UTC) represent landfall with Irene, while 4a (29 October 2012 at 21:00 UTC) represents a downgrade to extratropical cyclone intensity and 4b (29 October 2012 at 23:30 UTC) represents when Hurricane Sandy made landfall. Additional details are provided in Table S1.
The offshore environment presents significant challenges for making long-term, climatologically representative robust measurements of properties such as wind speed at WT hub height (HH WS) (Foody et al., 2024) that are critical for determining the wind resource and key aspects of operating conditions (IEC, 2019a, b; Mudd and Vickery, 2024). The relative paucity of measurements leads to financial uncertainty and thus potentially jeopardizes realizing national goals for achieving the energy transition (Hansen et al., 2024). It also means that numerical modeling is playing a critical role in projecting wind resource and operating conditions in offshore wind energy development areas (Kresning et al., 2020; Pryor and Barthelmie, 2021, 2024a; Bodini et al., 2024; Wang et al., 2024). Limited over-ocean observations also compromise our ability to characterize aspects of high-intensity hurricanes, including those of relevance to the wind energy industry, particularly in environments such as the US East Coast, which has the potential to be impacted by tropical cyclones and/or transitioning tropical–extratropical cyclones (Xie et al., 2005; Baldini et al., 2016; Barthelmie et al., 2021; Wang et al., 2024) but experiences only relatively few such storms each century (Schreck et al., 2021).
Wind speeds (WSs) within tropical cyclones frequently exceed the threshold at which WTs cease power production (25 to 30 m s−1) to avoid high operational loads (Petrović and Bottasso, 2014). There are reports of individual WT failures during hurricanes (Chen and Xu, 2016), and six WTs in a wind farm without hurricane-resistant WTs were damaged by 65 m s−1 WSs during Typhoon Yagi in September 2024 (Yihe, 2024). Accordingly, hurricane-induced extreme wind conditions represent an important component of WT design standards (IEC, 2019a, b; Ju et al., 2021; Martín del Campo et al., 2021). For offshore wind farm lease areas (LAs) in coastal waters along the US East Coast (Fig. 1), past research has suggested that areas north of Maryland have the lowest risk of hurricane damage (< 5 % probability that in a 20-year period more than 10 % of the WTs would be destroyed) (Rose et al., 2012b, a). Offshore LAs near North Carolina experienced fewer than 40 instances of hurricane-force winds (10 m WS > 33 m s−1) between 1900 and 2013, while those located near Maryland and farther northward experienced ∼ 20 instances (Hallowell et al., 2018). Based on output from the 30 km resolution ERA5 gridded dataset, the highest 50-year return period (RP) WS at 100 (above sea level) and significant wave heights (Hs, i.e., the mean height – crest to trough of the largest one-third of waves) for the US East Coast offshore wind energy LAs are ∼ 39.7 m s−1 and ∼ 11 m, respectively (Barthelmie et al., 2021). Equivalent estimates of extreme WSs and Hs from buoy measurements are; 32.6 m s−1 and 9.5 m, respectively (Kresning et al., 2024). A further model-based study indicated 50-year RP Hs of 9 to 11 m for the northernmost LA considered here (McElman et al., 2024).
Wind–wave coupling plays a key role in both near-surface atmospheric processes and WT loading (Valamanesh et al., 2013; Valamanesh et al., 2015; Koukoura et al., 2016; Hallowell et al., 2018; Hashemi et al., 2021; Li et al., 2022; Müller et al., 2024). Analyses based on buoy-based measurements of wind and waves along the US East Coast indicated that the mean failure probability during a 20-year WT lifetime is 9.6 × 10⁻⁶ for a functional WT yaw control system and 2.9 × 10⁻⁴ for a nonfunctional yaw control system (Hallowell et al., 2018). Wind–wave directional offset is also considered in offshore WT design codes (IEC61400-3) for loading on the support structure (IEC, 2019a). A 90° wind–wave misalignment is projected to increase the mud-line bending moment for a monopile foundation by up to a factor of 5, and even more modest misalignment of 30° approximately doubles this bending moment (Fischer et al., 2011). This amplification of bending moment with wind–wave misalignment is greatly enhanced under high HH WS (Stewart and Lackner, 2014).
Estimation of design criteria extreme WSs from numerical modeling is critically dependent on the grid spacing at which the model is applied (Larsén et al., 2012) and momentum dissipation at the ocean surface, which in turn is determined by wind–wave coupling and the parameterization used to dictate the surface roughness length (z0) (Larsén et al., 2019; Wang et al., 2024). The Coupled Ocean–Atmosphere–Wave–Sediment Transport (COAWST) modeling system (Warner et al., 2010) comprises a series of linked model components. In this research these model components are the Weather Research and Forecasting (WRF) model (Skamarock et al., 2019), Regional Ocean Modeling System (ROMS) (Shchepetkin and McWilliams, 2005; Haidvogel et al., 2008; Shchepetkin and McWilliams, 2009), and Simulating Waves Nearshore (SWAN) model (Booij et al., 1999), and they interact through the Model Coupling Toolkit (MCT) (Jacob et al., 2005; Larson et al., 2005; Warner et al., 2008).
Only limited previous research has sought to quantify the degree to which wind–wave coupling improves simulation fidelity and/or intensity for WSs at heights of relevance to offshore WTs, particularly during extreme events. One such study focused on 23 intense cyclones in the North Sea and found that when WRF is coupled to SWAN through a wave boundary layer model with an innermost domain with grid spacing of 2 km, the inferred 50-year RP WSs were systematically higher than those from WRF alone and the degree of agreement in extreme WSs at five offshore and/or coastal masts was improved (Larsén et al., 2019). A further study found that for Tropical Storm Ana in the mid-Atlantic Bight, two-way coupled WRF and WaveWatch III (WW3) simulated peak 90 m WSs were a closer match to observations than the corresponding values from either a standalone WRF or one-way coupled WRF simulation (Gaudet et al., 2022). Simulation of Hurricane Sandy with WRF coupled to the unstructured-grid, Finite-Volume Community Ocean Model (FVCOM) through the Earth System Model Framework also found improved agreement with observations for the central pressure location and intensity plus 10 m WSs relative to simulation solely with WRF (Li and Chen, 2022). COAWST (configured with WRF 3.2, ROMS 3.3, and SWAN 40.81) coupled with the MCT showed “modest improvement in track but significant improvement in intensity … versus uncoupled (e.g., standalone atmosphere, ocean, or wave) model simulations” for Hurricane Ivan (Zambon et al., 2014a). Thus, there is provisional evidence that, in accord with expectations, detailed coupling of atmosphere–wave and ocean models improves simulation of atmospheric parameters within these extreme events relative to simulations with WRF alone.
In addition to the importance of intense cyclones (e.g., hurricanes) to WT design standards, there have also been suggestions that very widespread deployment of offshore WTs in the US coastal zone could aid in reducing the intensity of tropical cyclones and thus reduce damage onshore (Jacobson et al., 2014). Simulations of three hurricanes using the GATOR-GCMOM model indicated that offshore WT arrays comprising 110 000 and 420 000 WTs (IC > 300 GW) at installed capacity densities (ICDs) of 8 to 17 MW km−2 might reduce 15 m WS by over 25 m s−1 and reduce storm surge by up to 79 % (Jacobson et al., 2014). Simulations with 22 000 to 74 000 WTs also suggested that offshore WTs could reduce the amount of precipitation over land, downstream of the wind farms (Pan et al., 2018).
1.2 Objectives
Research presented herein focuses on simulations of two of the most powerful hurricanes that have occurred within the US eastern coastal waters in which offshore wind energy LAs have been auctioned (Fig. 1, see further details in Table S1 and Figs. S1 and S2 in the Supplement). Four sets of simulations are performed for each of these hurricanes: (a) WRF, (b) WRF with the action of WTs included in offshore wind energy LAs purchased prior to mid-2023, (c) COAWST, and (d) COAWST with the action of WTs included. Our specific research questions are as follows:
-
Are the characteristics of these hurricanes well captured using either the WRF or COAWST models? A sub-component of this question is does the more explicit coupling in COAWST improve simulation fidelity?
-
Do these simulations suggest that either of these hurricanes would have been characterized by either (a) widespread loss of power production across these LAs due to cut-out at high WSs and for how long and/or (b) exceedance of WT design WSs and/or very high wind–wave structural loading? Again, a sub-component of this question is does use of COAWST versus WRF change WS intensity and/or the duration of time with low power production?
-
If WT rotor extraction of momentum is simulated using a WFP in WRF and COAWST, is there evidence of weakening of the hurricanes for WT numbers and ICDs that are likely to be achieved using the offshore wind energy LAs considered here?
2.1 Characteristics of the hurricanes considered herein
Research presented herein focuses on two recent hurricanes:
-
Hurricane Irene became a category 3 hurricane, with 54 m s−1 WSs at 10 m height in the Bahamas on 24 August 2011 at 12:00 UTC (Avila and Cangialosi, 2011). It made landfall at Cape Lookout, North Carolina, on 27 August at 12:00 UTC with 39 m s−1 10 m WSs. After moving out over the water, it again made landfall, this time as a tropical storm, with 31 m s−1 WSs reported at Brigantine, New Jersey, on 28 August 2011 at 09:35 UTC (Fig. 1a). The cyclone then moved over Coney Island, New York, with 28 m s−1 WSs reported at 13:00 UTC. Simulations presented herein are initialized on 24 August 2011 at 12:00 UTC and run through 29 August 2011 at 12:00 UTC.
-
Hurricane Sandy became a category 3 hurricane, with 51 m s−1 WSs at 10 m height in eastern Cuba on 25 October 2012 at 05:25 UTC (Blake et al., 2013; Lackmann, 2015). It grew to have a roughly 1611 km diameter of tropical-storm-force WSs, before making landfall near Brigantine, New Jersey, as a post-tropical cyclone with 36 m s−1 10 m WSs and a minimum pressure of 945 hPa on 29 October 2012 at 23:30 UTC (Fig. 1b). Simulations presented herein run from 25 October 2012 at 12:00 UTC through 1 November 2012 at 12:00 UTC.
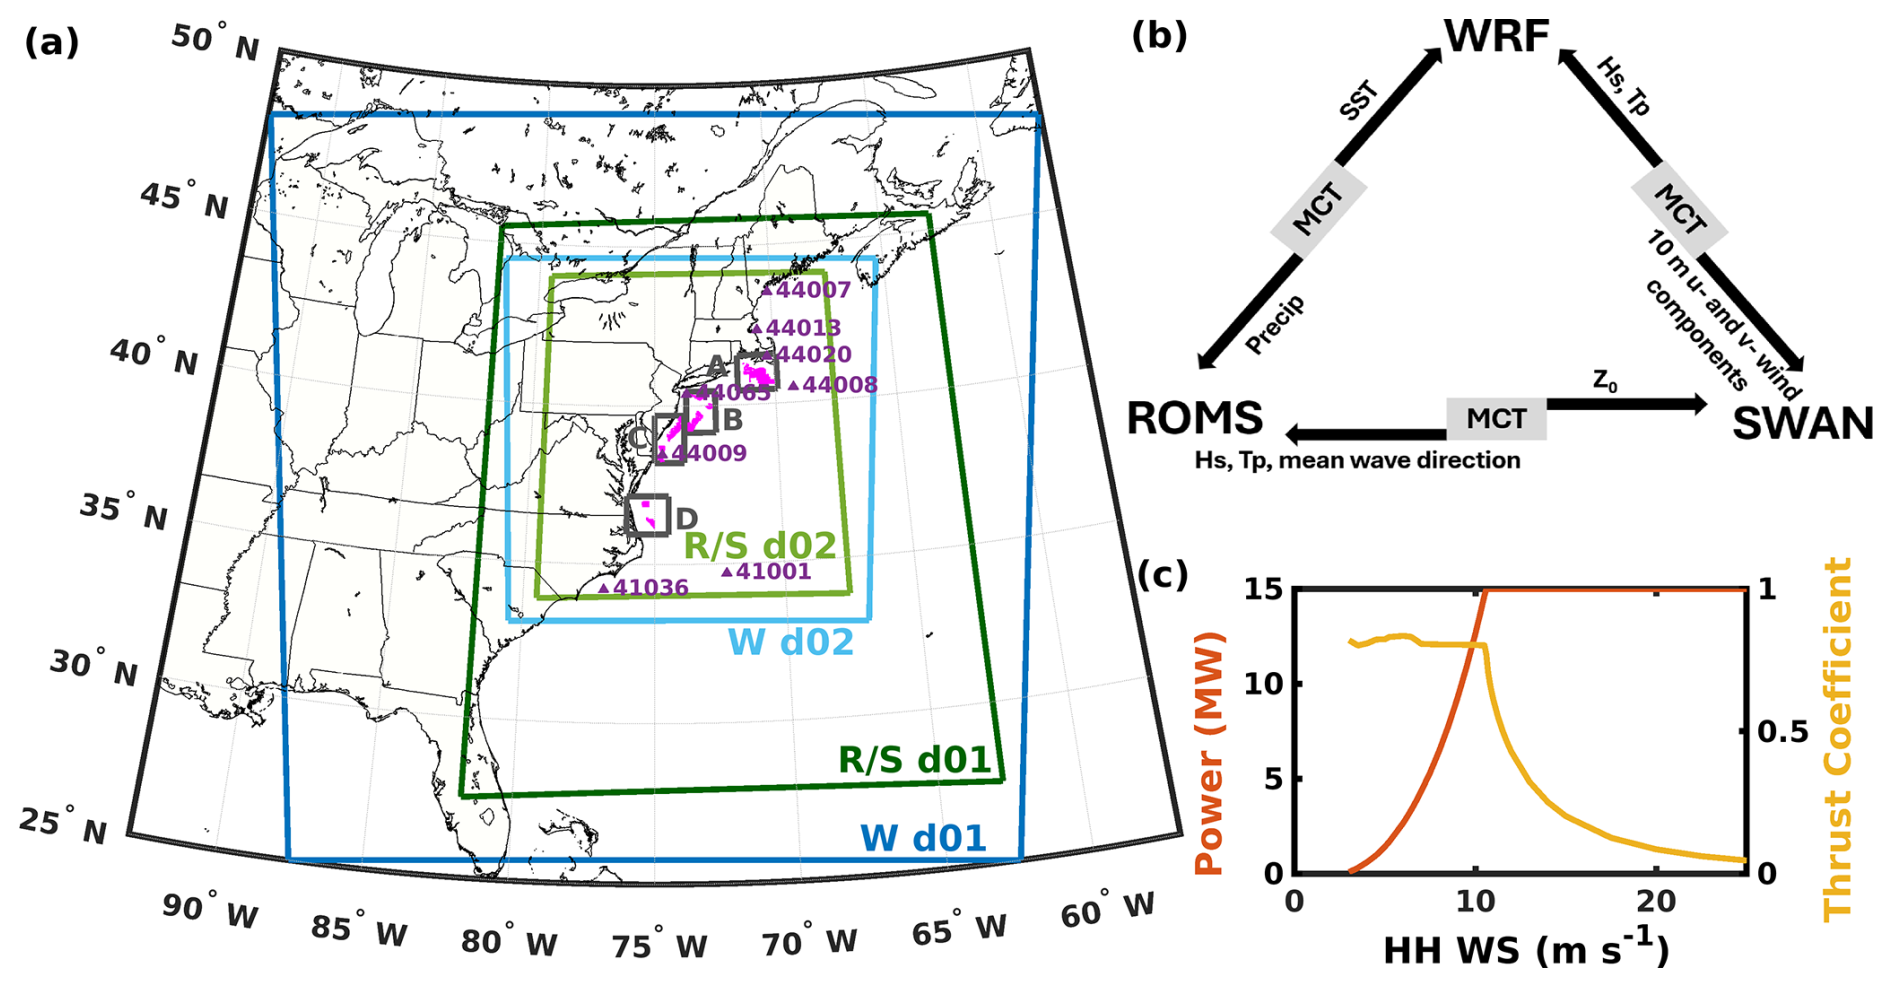
Figure 2(a) Simulation domains (d01 and d02) for WRF (W), ROMS (R), and SWAN (S) and locations of the wind turbines (WTs) in the offshore wind energy lease areas (LAs) considered herein (magenta). In the simulations with WTs, these LAs contain 2642 WTs. Also shown are the locations of the eight National Data Buoy Center (NDBC) buoys used in the simulation evaluation (purple). (b) Schematic of information flow between COAWST model components for variables discussed herein: significant wave height (Hs), peak wave period (Tp), 10 m u- and v-wind components, surface roughness length (z0), mean wave direction, precipitation (Precip), and sea surface temperature (SST). For the complete information flow, see Fig. S3 and Table S2. (c) Power and thrust coefficients as a function of hub-height wind speed (HH WS) for the 15 MW IEA reference WT (Gaertner et al., 2020).
2.2 Modeling
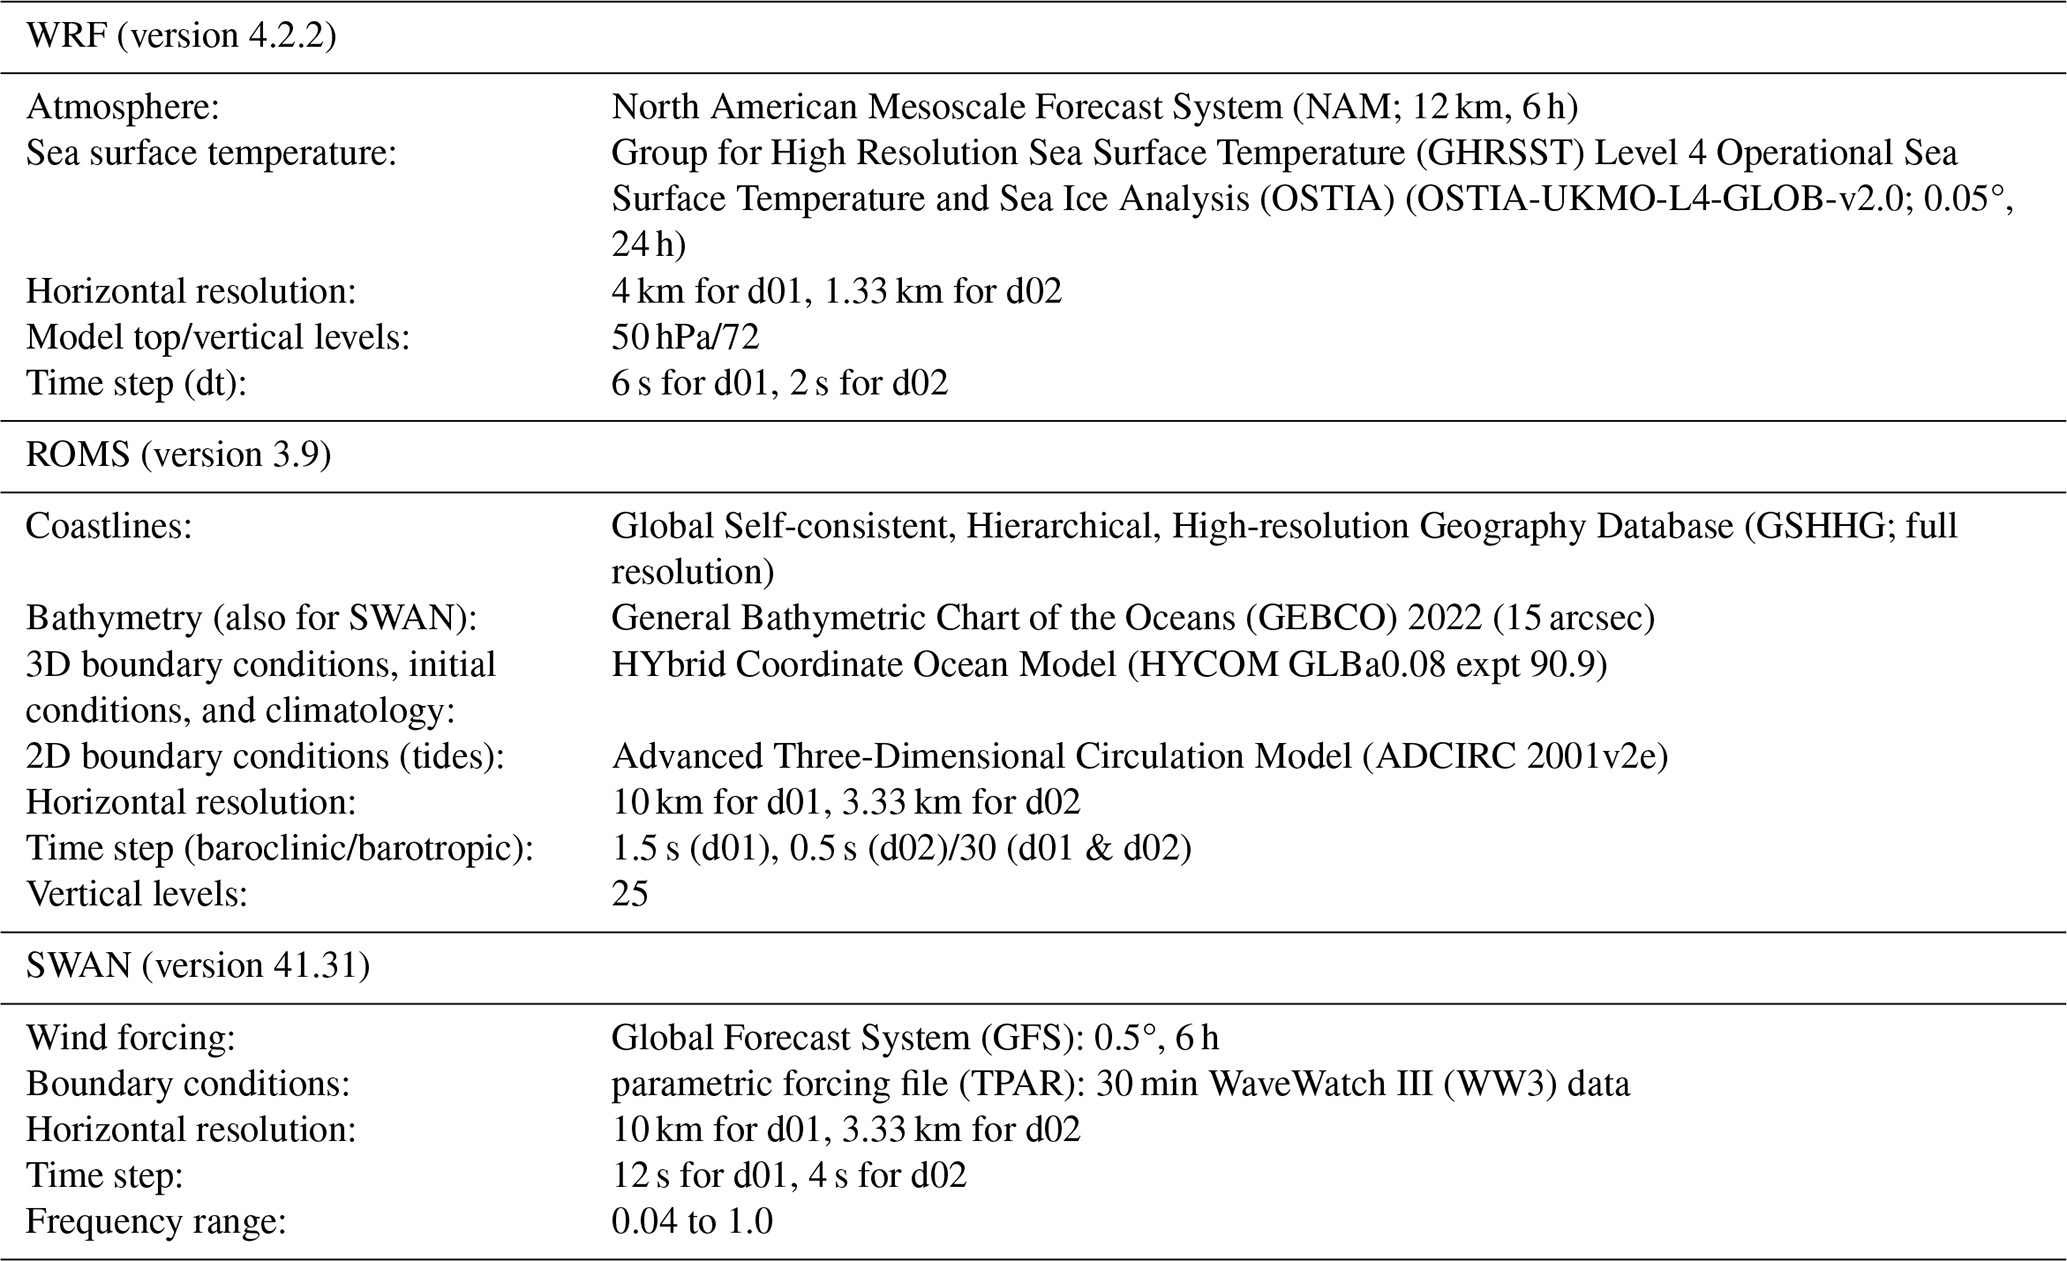
The source of initial and lateral boundary conditions (Khaira and Astitha, 2023) and specific model configurations employed within WRF and COAWST (including the coupling system) have a critical impact on simulated flow conditions (Mooney et al., 2019). In this research, both WRF (v4.2.2) and COAWST (v3.7 and MCT v2.6.0) simulations use two domains (Fig. 2a) and the coupling interval in COAWST is 10 min. At this coupling interval, a number of variables that are critical to air–sea coupling and lower atmosphere structure and/or WT design standards are exchanged between the model components (Figs. 2b and S3 in the Supplement, and Table S2 in the Supplement). The selection of these variables is based on previous research (Warner et al., 2010; Zambon et al., 2014a) and include sea surface temperature (SST) that is passed from ROMS to WRF, 10 m u- and v-wind components which are passed from WRF to SWAN, and Hs and Tp (period of peak energy in the wave spectrum) that are passed from SWAN to WRF and ROMS. The source of boundary and initial conditions (Table 1) and key physics options are informed by previous simulations of Hurricanes Sandy (Zambon et al., 2014b) and Irene (Mooney et al., 2016). Physics settings include the WRF single-moment 6-class (WSM6; Hong and Lim, 2006) microphysics scheme, the Rapid Radiative Transfer Model (RRTM; Mlawer et al., 1997) for longwave radiation, the Dudhia scheme (MM5; Dudhia, 1989) for shortwave radiation, and the Unified Noah land surface model (Chen and Dudhia, 2001b, a; Ek et al., 2003; Tewari et al., 2004). The Kain–Fritsch (Kain, 2004) cumulus parameterization is used in the outer domain and no cumulus parameterization is used in the inner domain. The Mellor–Yamada Nakanishi and Niino Level 2.5 (MYNN2; Nakanishi and Niino, 2006) planetary boundary layer scheme is used due to the compatibility with the Fitch windfarm parameterization (WFP; Fitch et al., 2012) that is used here in both domains to compute power production, momentum extraction, and turbulent kinetic energy (TKE) induced by the action of WTs. Following previous research (Pryor and Barthelmie, 2024a, b), we assume that all auctioned offshore LAs along the US East Coast (Fig. 2a) are populated with 2642 IEA reference 15 MW WTs, each of which has a hub height of 150 m and a rotor diameter of 240 m (see power and thrust curves in Fig. 2c) at a spacing of 1.85 km for an average ICD of 4.3 MW km−2. This spacing and 1.33 km WRF domain 02 (d02) grid spacing (dx) result in 2641 grid cells with at least one WT; one grid cell has two WTs. Of the 71 unstaggered WRF vertical levels, level 15 has a mean height of 155 m in grid cells with WTs and is therefore used for HH WS. Note that it is not an expectation that spatially averaged model output will perfectly match time-averaged point observations, and further, the design standards are articulated for a sustained WS at a point (Larsén and Ott, 2022). The WSs presented here are output from d02, represent a nominal model time step of 2 s, and are from a grid cell with an area of 1.33 km by 1.33 km, but the effective model resolution is ∼ 7 times the grid spacing (Skamarock, 2004); thus, any spatial gradients will be underestimated.
Variation of wave state and z0 with WS is an important determinant of extreme, near-surface WSs, and turbulence intensity (Zambon et al., 2014a; Porchetta et al., 2019, 2020, 2021; Wang et al., 2024). Further, wind–wave misalignment also plays a key role in near-surface WSs and z0 (Porchetta et al., 2019), and machine learning tools have suggested that z0 prediction accuracy can be improved by inclusion of wind–wave directional misalignment as a predictor (Fu et al., 2023). The COAWST simulations are configured using the Taylor–Yelland formulation (Taylor and Yelland, 2001) to calculate z0 following past research (Zambon et al., 2014b) that found that the use of this parameterization resulted in better fidelity for Hurricane Sandy track, intensity, SST, and Hs than alternatives (Oost et al., 2002; Drennan et al., 2005). Use of the MYNN surface layer with WRF and the DRAGLIM_DAVIS drag limiter option with COAWST means all simulations implement a maximum ocean roughness drag coefficient of 2.85 × 10⁻³, consistent with research that has shown asymptotic behavior of drag at high WSs (Davis et al., 2008). Data are output every 10 min, and each simulation is subject to a warm restart every 6 h due to wall-clock limitations on the compute platform.
2.3 Evaluation datasets
Critical aspects of the WRF and COAWST simulations without the action of WTs are evaluated using the following:
-
National Hurricane Center (NHC) best track information and wind radii maximum extent data from Tropical Cyclone Reports (Avila and Cangialosi, 2011; Blake et al., 2013) and the Atlantic hurricane database (HURDAT2; Landsea and Franklin, 2013).
-
30 min precipitation at 0.1° resolution from the Integrated Multi-satellitE Retrievals for the Global Precipitation Measurement (GPM) mission (IMERG) V07 final run dataset (Huffman et al., 2024).
-
National Data Buoy Center (NDBC) buoy-based measurements of WS and wind gust (WG), sea level pressure (SLP), SST, and Hs (NDBC, 2009) (Fig. 2a). Note: the eight buoys from which data are presented are a mixture of 3 m foam and 3 m discus buoys. The anemometer and barometer heights vary between 3.8 and 4.1 m and between 2.4 and 3.4 m.
These datasets have some inherent constraints. For the HURDAT2 dataset this includes use of subjective smoothing to produce representative 6 h track data, which does not necessarily equate to a precise storm history (Landsea and Franklin, 2013). HURDAT2 accuracy for landfalling hurricanes has been estimated as ∼ 2.5 m s−1 for maximum WS and 1 hPa for SLP, and the location is correct within approximately 0.1° of latitude and longitude (Landsea and Franklin, 2013). Spatial averaging naturally impacts the spatial distribution of precipitation within the gridded IMERG data and can lead to underestimation of high precipitation rates compared to point measurements (Hu and Franzke, 2020; Nie and Sun, 2020; Huffman et al., 2024). With respect to the NDBC data, there is a limited number and thus spatial coverage of buoys (NDBC, 2009). Efforts to optimize buoy design to enhance NDBC measurement accuracy have been previously documented (Taft et al., 2009) as have data quality control procedures (NDBC, 2023). The best available information suggests that the total sensor accuracy for WS is ± 1 m s−1, although lower accuracy may arise during high wave states (NDBC, 2023). For Hs the stated accuracy is ± 0.2 m and for SLP it is ± 1 hPa.
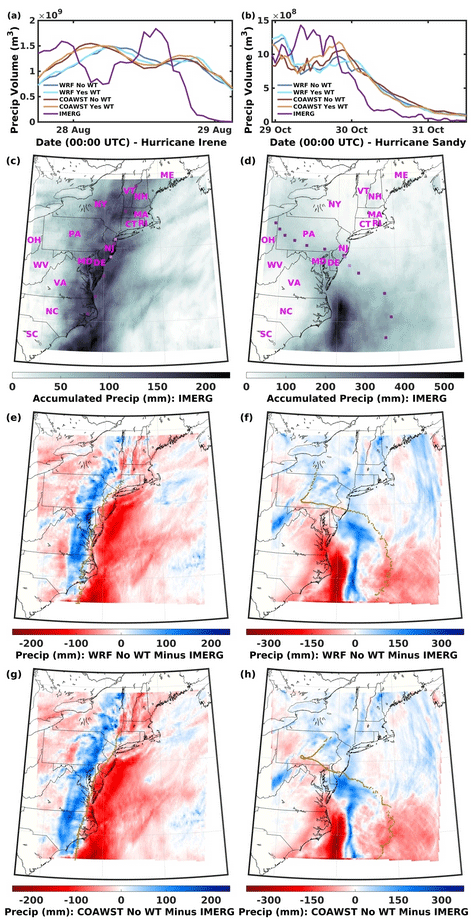
Figure 3Time series of 1 h precipitation volume within 375 km of the cyclone centroid in each simulation and IMERG for (a) Hurricane Irene and (b) Hurricane Sandy. Accumulated precipitation from IMERG for (c) Hurricane Irene from 24 August 2011 at 12:00 UTC through 29 August 2011 at 12:00 UTC and (d) Hurricane Sandy from 25 October 2012 at 12:00 UTC through 1 November 2012 at 12:00 UTC. National Hurricane Center (NHC) best track locations are shown in purple, and the magenta letters denote the US state abbreviations: Maine (ME), New Hampshire (NH), Vermont (VT), Massachusetts (MA), Rhode Island (RI), Connecticut (CT), New York (NY), New Jersey (NJ), Pennsylvania (PA), Ohio (OH), West Virginia (WV), Maryland (MD), Delaware (DE), Virginia (VA), North Carolina (NC), and South Carolina (SC). Difference in modeled total precipitation minus IMERG for (e, g) WRF for (e) Hurricane Irene and (g) Hurricane Sandy and (f, h) COAWST for (f) Hurricane Irene and (h) Hurricane Sandy. Simulations exclude the actions of wind turbines (WTs). Brown dots denote the hurricane location (every 10 min) from the simulations.
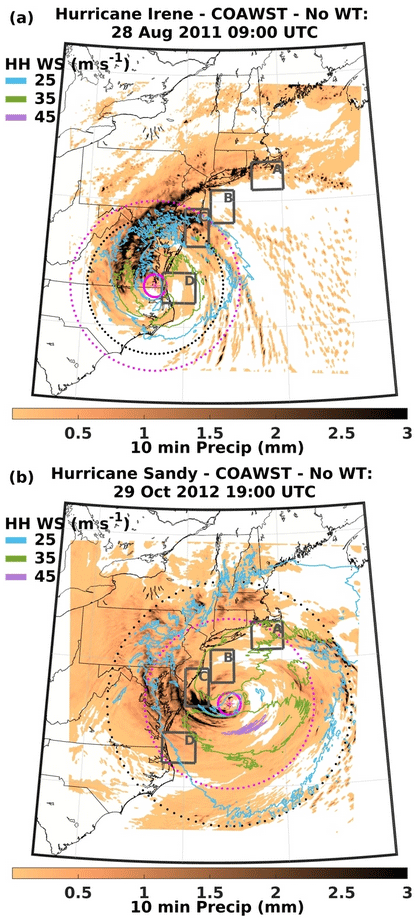
Figure 4Simulated precipitation from COAWST during two example 10 min periods (background color) and contours of hub-height wind speed (HH WS) at 25, 35, and 45 m s−1 for (a) 28 August 2011 at 09:00 UTC and (b) 29 October 2012 at 19:00 UTC when the hurricanes are close to wind turbine (WT) lease areas (LAs). Magenta rings mark 50 and 375 km from the minimum sea level pressure (SLP). The black rings mark the mean outermost radii of 18 m s−1 WSs at 10 m (R18): (a) 301 km and (b) 541 km. For legibility, the color bar is truncated. Maximum 10 min precipitation in any grid cell is (a) 13.8 mm and (b) 16.8 mm. Similar output from WRF is shown in Fig. S4.
2.4 Analysis approach
Hurricane centroid locations are computed every 10 min as the minimum SLP after 3 × 3 smoothing is applied to the model output (a mean value of SLP is computed for each grid cell based on output for that grid cell and the eight adjacent grid cells) and compared with the NHC best track information. The initial tracking position is the first time step when the minimum SLP lies within d02 and tracking continues until the implied motion between adjacent time steps is inconsistent with physical expectations in terms of direction or translational speed. Hurricane Irene is tracked for 33 h, from 27 August 2011 at 18:00 UTC through 29 August 2011 at 03:00 UTC, and Hurricane Sandy is tracked for 67 h, from 28 October 2012 at 23:00 UTC through 31 October 2012 at 18:00 UTC (Fig. 1). Evaluation relative to SLP and WS data from the NDBC buoys is performed using a search area of 3 × 3 grid cells. Evaluation of simulated precipitation within d02 relative to IMERG is performed after regridding output to the IMERG grid (Fig. 3). The volume of water exhausted as precipitation from the tropical cyclone is computed using a search radius of 375 km (see examples in Fig. 4) around the cyclone centroid in the simulation output and from the best track locations applied to IMERG.
Because prior research has indicated the challenges in perfectly reproducing hurricane tracks, when evaluating hurricane impacts on WTs within the LAs, analyses are presented for all 2641 grid cells containing WTs, the four LA clusters (Pryor and Barthelmie, 2024a) A (1073 WT), B (662 WT), C (624 WT), and D (283 WT), and all ocean grid cells within the respective LA cluster area (Fig. 2a). Capacity factors (CFs), which are the ratio of the power produced divided by that which would be produced if all WTs were operating at rated capacity (15 MW), are used to facilitate comparison of power production computed by the Fitch WFP across the LA clusters. System-wide CF < 0.2 values are used here as an indicator of low power production.
Three-dimensional and joint occurrences of HH WS, Hs, and Tp in WT-containing grid cells from the COAWST simulations are presented along with histograms of estimated wind–wave misalignment at the LA cluster centers in HH WS classes of 3 to < 10.6, 10.6 to 25, and > 25 m s−1 to represent high thrust, moderate thrust, and above-rated WS (Fig. 2c). We caution that the specific model set-up may play a critical role in dictating wind–wave misalignment and feedback via the z0 (Porchetta et al., 2019).
Three metrics are used to analyze the impact of WTs on hurricane intensity and are compared for simulations with WRF and COAWST without and with the WFP active. The cumulative volume of precipitation within 375 km of the minimum SLP and the mean WS at 500 hPa (approximately the level of non-divergence; Riehl and Malkus, 1961) computed for grid cells that lie 50 to 375 km from the centroid (beyond the likely eye radius) (Morin et al., 2024; Müller et al., 2024) are used as metrics of intensity. The mean outermost radius of tropical-storm-force WSs at 10 m (R18, 18 m s−1, Fig. 4) is computed using azimuth sectors of 10° (Powell and Reinhold, 2007) for all sectors where the distance from the cyclone centroid to the d02 boundary is ≥ 200 km and used as a measure of cyclone size. Mood's test (Hettmansperger and Malin, 1975) is used to assess the statistical significance of differences in the median values of these metrics.
Table 2Magnitude and time (in UTC) of near-surface maximum wind speed (max WS), maximum significant wave height (max Hs), and minimum sea level pressure (min SLP) for each buoy and simulations with WRF and COAWST without wind turbines (WTs) for Hurricane Irene (August 2011). Simulated WSs are shown at two heights, 10 m | 2.6 m, and all variables are computed every 10 min. WS magnitudes from the buoys are available every 10 min, while Hs and SLP are reported at 50 min past the hour.
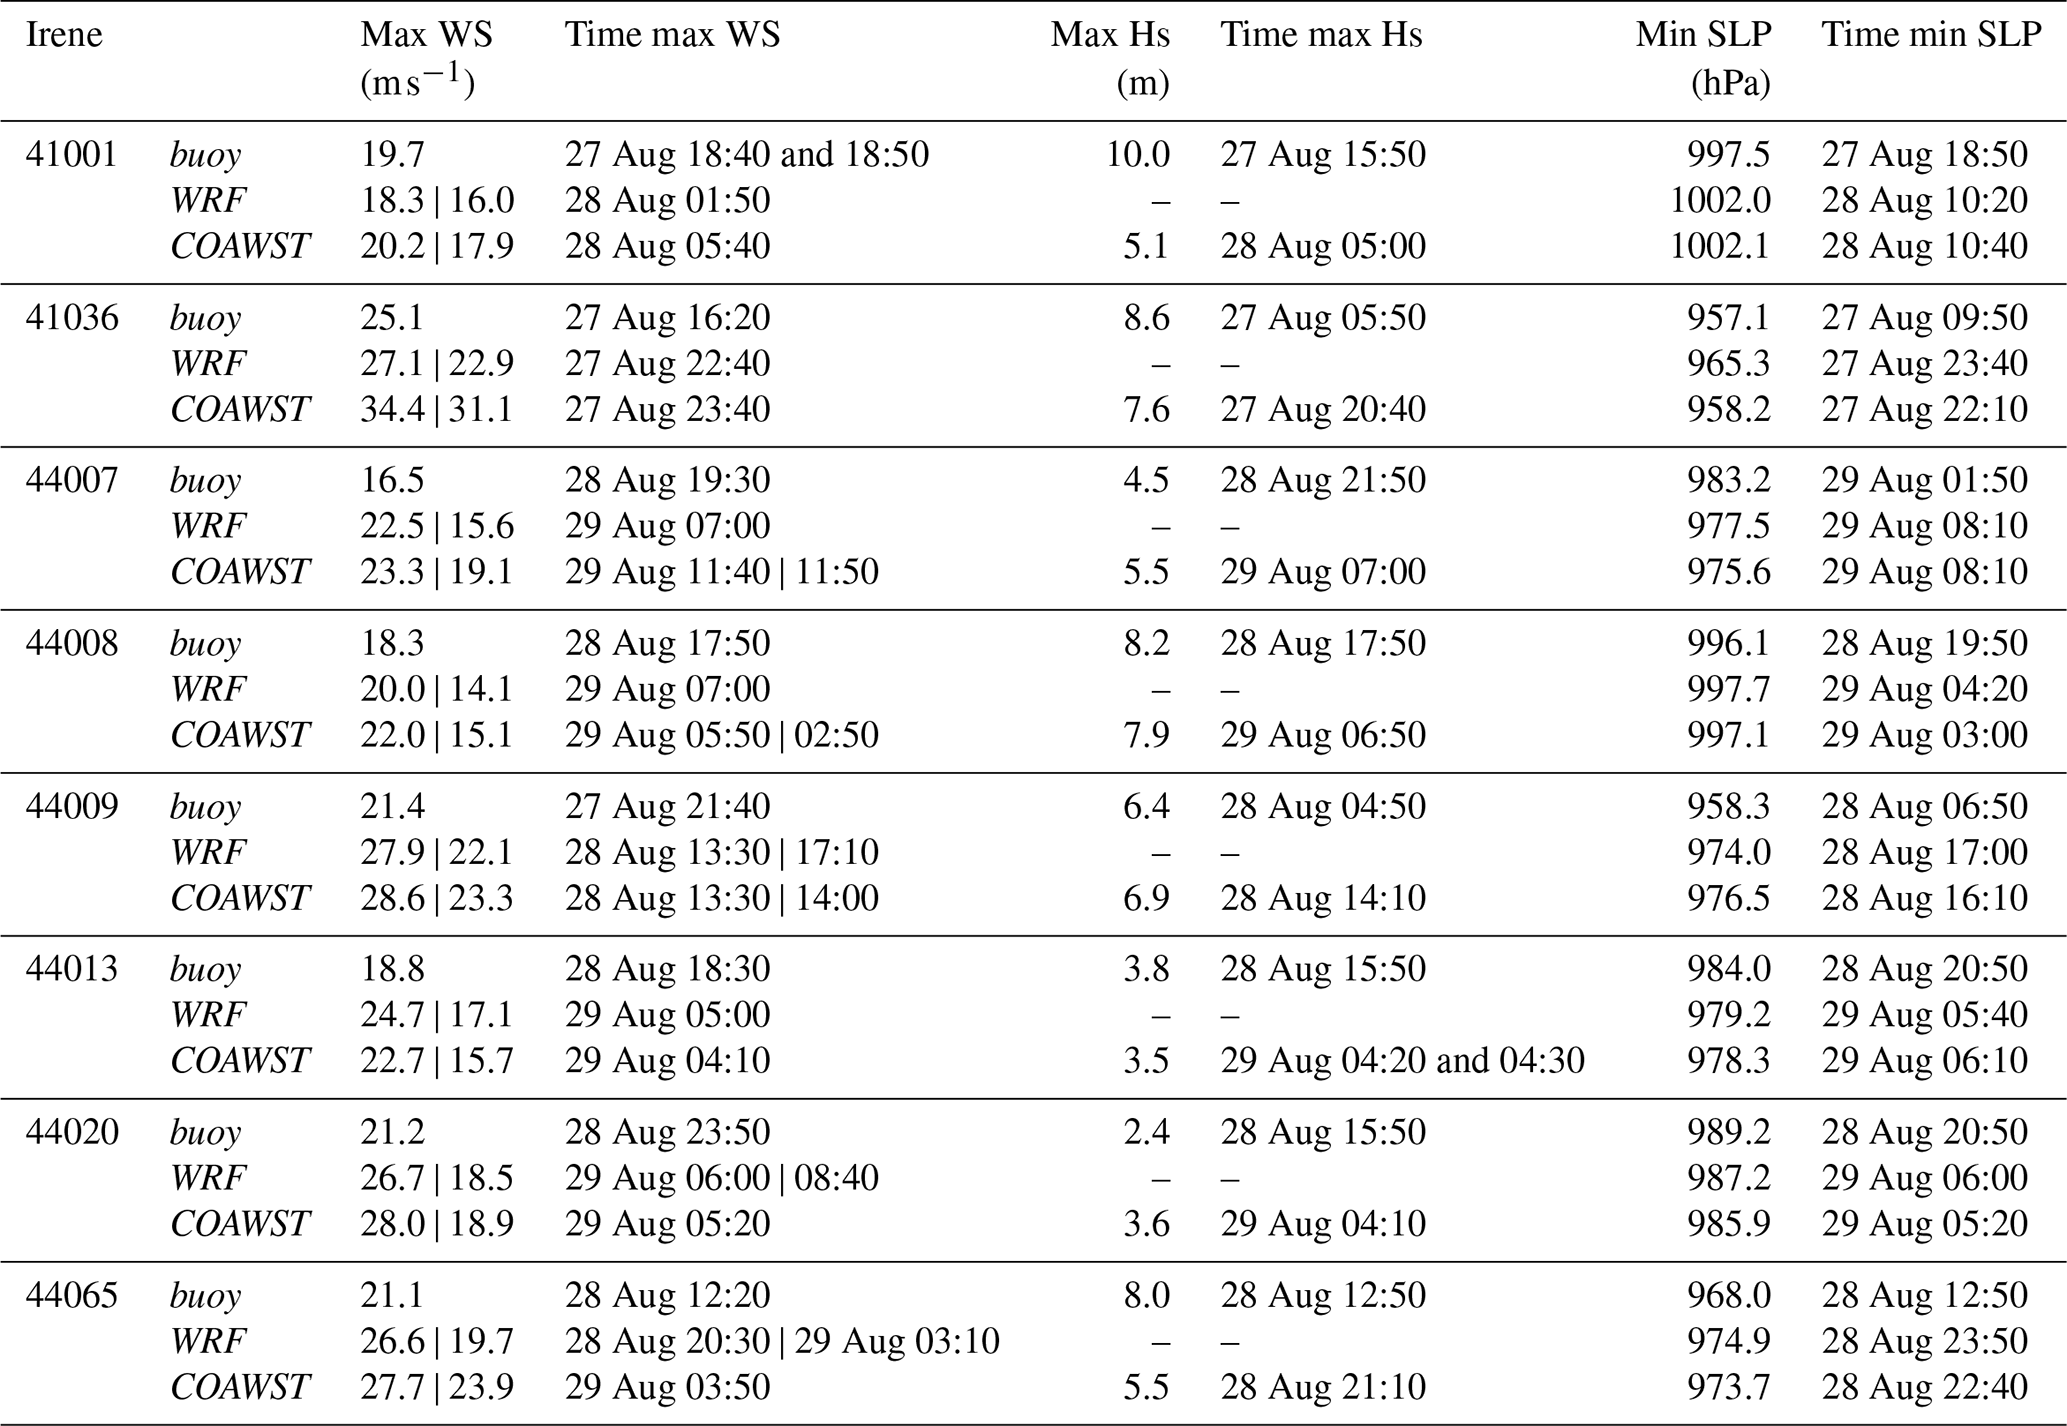
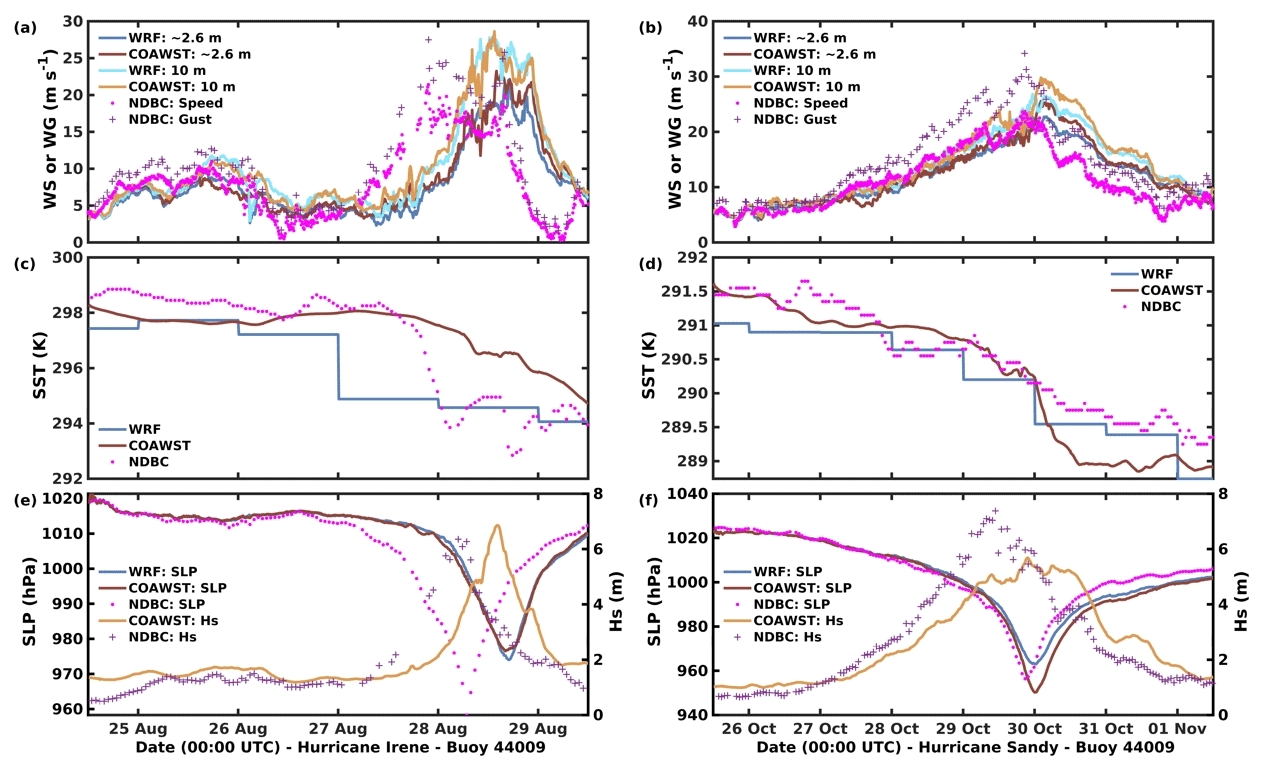
Figure 5Time series of (a, b) wind speed (WS) and wind gust (WG), (c, d) sea surface temperature (SST), and (e, f) sea level pressure (SLP) and significant wave height (Hs) from observations and simulations (WRF and COAWST without wind turbines, WTs) for Hurricane Irene (a, c, and e) and Hurricane Sandy (b, d, and f) at buoy 44009 (see location in Fig. 2a). See Figs. S5–S11 for other buoys.
3.1 Evaluation of simulations without the action of wind turbines
3.1.1 Hurricane Irene
As shown in detail below, simulations of Hurricane Irene exhibit lower fidelity than those of Hurricane Sandy. The centroid of Hurricane Irene is consistently displaced west (further inland, Fig. 1a) compared to the NHC best track data, and the translational speed is also negatively biased in both WRF and COAWST simulations. This bias is consistent with previous COAWST simulations of this hurricane performed with 12 km grid spacing and using a range of initial and lateral boundary conditions (Mooney et al., 2019). Simulation bias is also evident in comparison with buoy observations (Table 2, Figs. 5, and S5–S11 in the Supplement) in terms of both the magnitudes and timing of the maximum WSs and minimum SLP. Maximum near-surface WSs (at 2.6 m) differ (model minus buoy observations) by −4.2 to 0.7 m s−1 (WRF) and −3.2 to 6.0 m s−1 (COAWST). The displacement with Hurricane Irene in the simulations results in higher over-land precipitation (by up to 209 mm in some IMERG grid cells) and negative bias offshore (Fig. 3). However, the volume of water vented from the hurricane is relatively well reproduced in the simulations. During the time of tracking, the mean (1 h) precipitation volume within 375 km of the centroid is 9.87 × 10⁸ m3 based on IMERG combined with the NHC best track data, while the corresponding values (and percent error) are 1.14 × 10⁹ m3 (15.1 % overestimation) and 1.18 × 10⁹ m3 (19.9 % overestimation) for the WRF and COAWST simulations, respectively (Fig. 3). Mean R18 is 279 km in the WRF simulation but is larger by an average of 23 km in 192 of the 199 tracked 10 min positions in the COAWST simulation. These mean R18 values are similar to, but smaller than, those reported at a 6 h interval from HURDAT2 based on analyses in four quadrants (mean R18 of 495 km in the SE quadrant and 157 km in the NW quadrant). The differences in R18 and precipitation in these simulations versus HURDAT2 and IMERG are likely due to challenges in accurately computing these metrics when the simulated position is close to the d02 boundary and differences in the fraction of the cyclone over land (Chen and Yau, 2003) due to differences in storm tracks (Fig. 1).
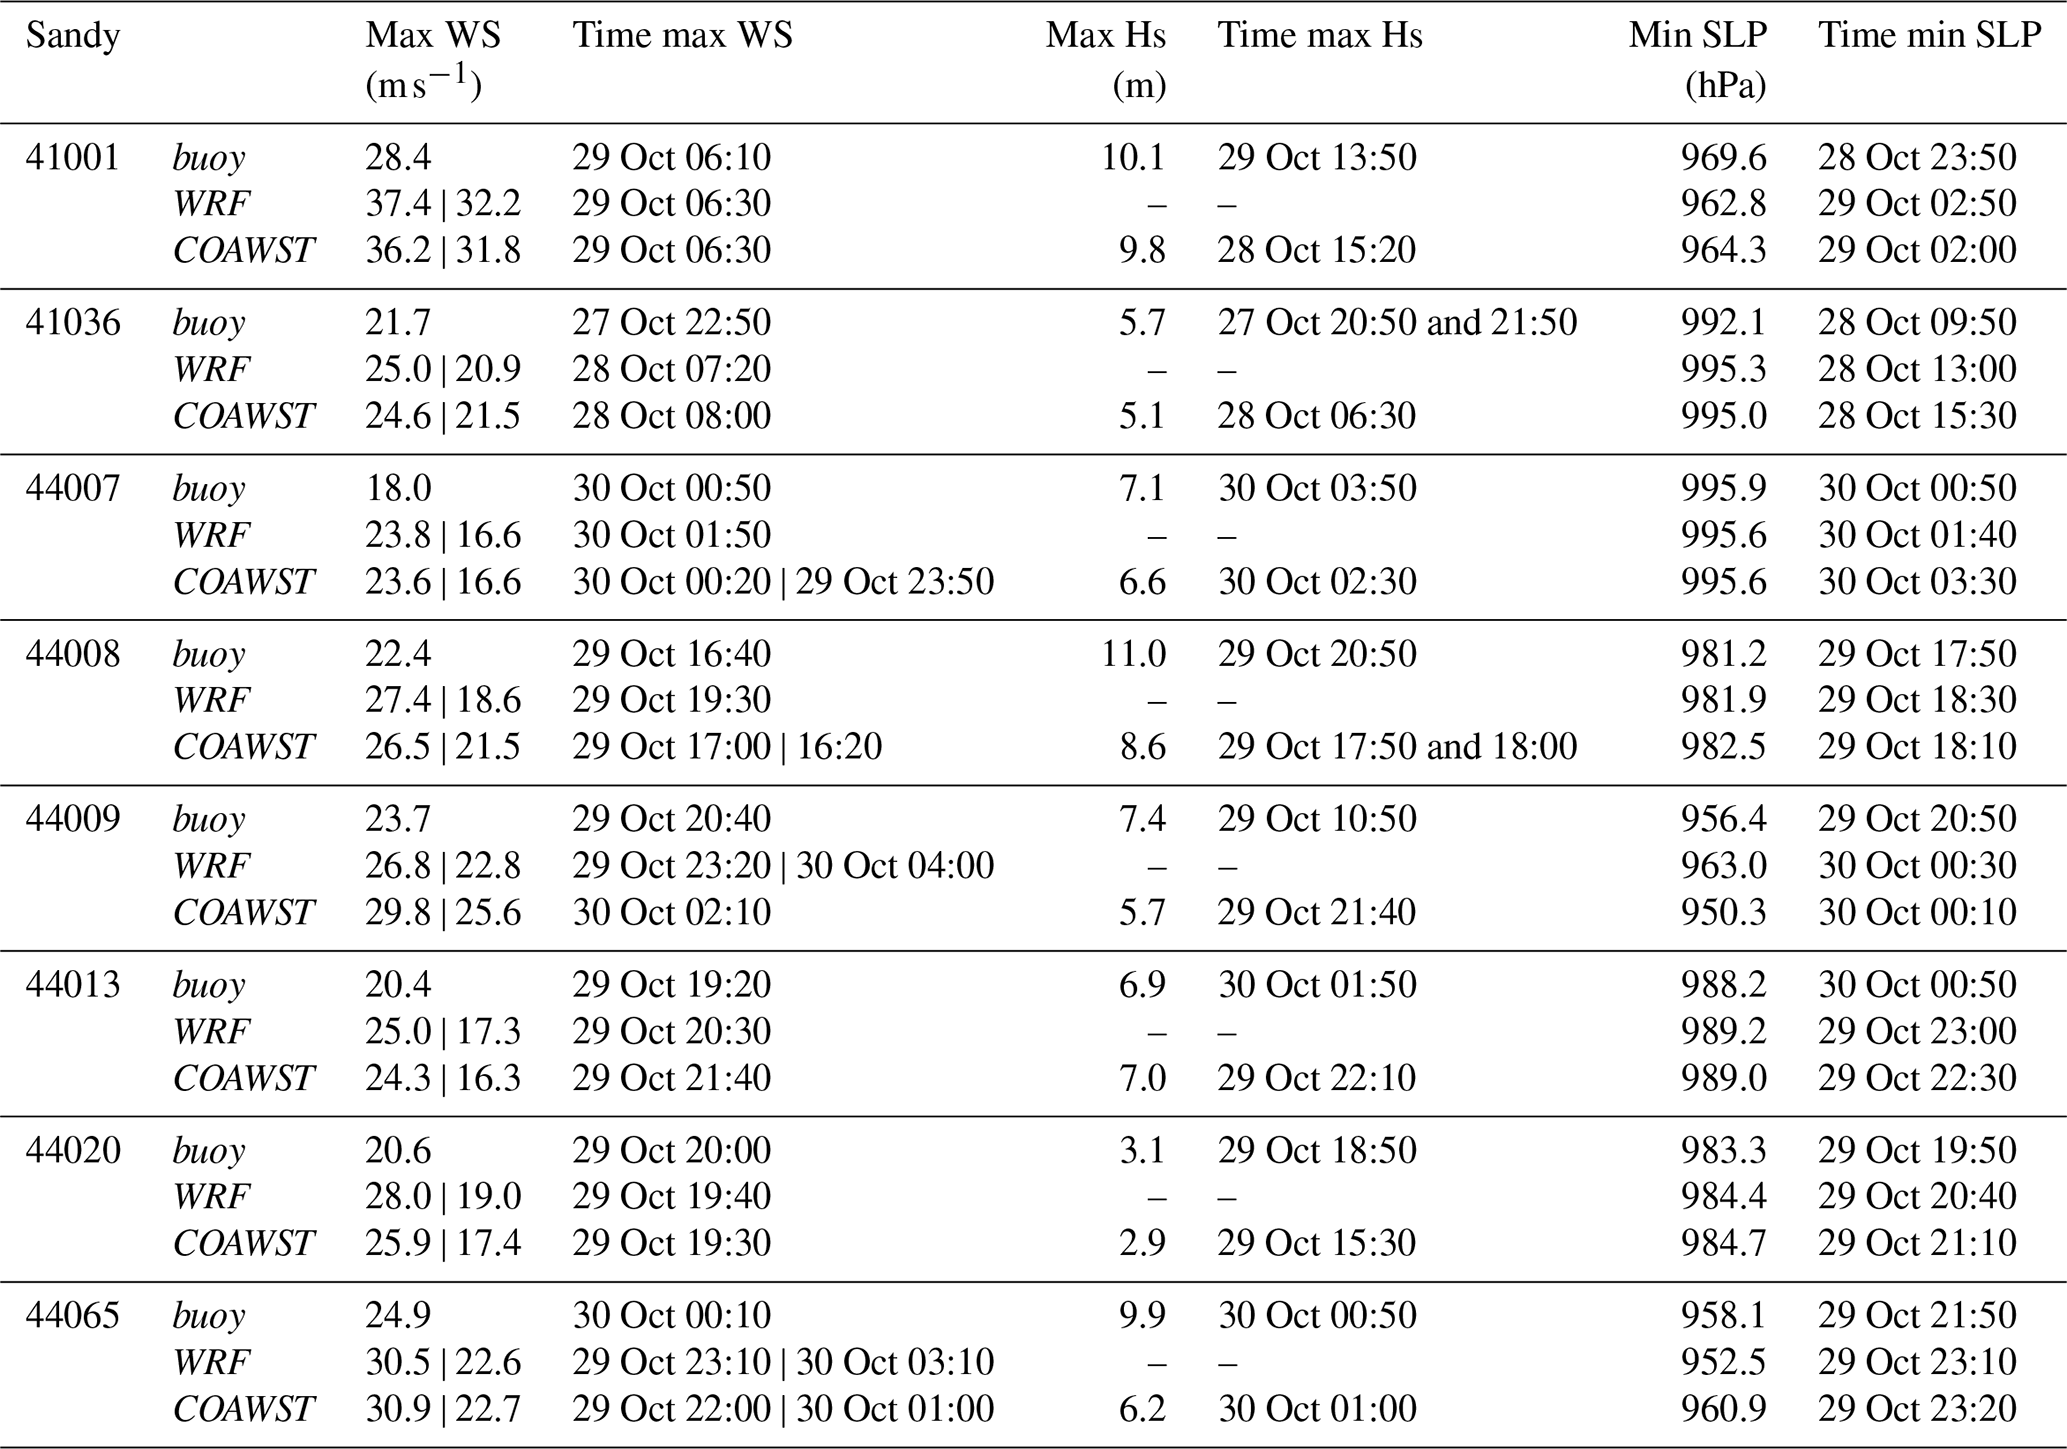
Table 3Magnitude and time (in UTC) of near-surface maximum wind speed (max WS), maximum significant wave height (max Hs), and minimum sea level pressure (min SLP) for each buoy and simulations with WRF and COAWST without wind turbines (WTs) for Hurricane Sandy (October 2012). Simulated WSs are shown at two heights, 10 m | 2.6 m, and all variables are computed every 10 min. WS magnitudes from the buoys are available every 10 min, while Hs and SLP are reported at 50 min past the hour.
3.1.2 Hurricane Sandy
As in past research (Zambon et al., 2014b), both the WRF and COAWST simulations of Hurricane Sandy exhibit good agreement with NHC best track data up to about 12 h after landfall in New Jersey (Fig. 1b). The mean distance between the NHC and simulated cyclone centroids for locations 1, 2, 3, 4, 4a, 4b, and 5 in Fig. 1b is 66.7 km (WRF) and 51.4 km (COAWST). The positional offsets range from 30.3 to 129.1 km (WRF) and 12.0 to 71.1 km (COAWST) and are smaller than those presented in previous research on, for example, cyclonic storm Ockhi (Mukherjee and Ramakrishnan, 2022), Tropical Storm Delta, Hurricane Ophelia, Hurricane Leslie, and Tropical Storm Theta (Calvo-Sancho et al., 2023). Consistent with expectations, agreement tends to degrade once the cyclone has made landfall as the system becomes less organized and more asymmetric (Zambon et al., 2014b). Modeled time series of SLP, SST, Hs, and WS exhibit some level of agreement with the NDBC buoy observations in terms of time variability (Table 3, Figs. 5 and S5–S11). As expected, due to spatial averaging and the difference in height, the maximum WSs from the lowest model level (∼ 2.6 m) are generally lower than the point observations on the buoys at 3.8 or 4.1 m. Seven of the eight values are smaller in the WRF simulation than reported by the buoys, and six of eight comparisons indicate lower values in the COAWST simulation. Maximum near-surface WSs (model minus buoy observations) differ by 3.1 to 9.0 m s−1 (WRF) and 2.9 to 7.8 m s−1 (COAWST). The mean absolute difference in minimum SLP is 3.1 hPa (WRF) and 2.6 hPa (COAWST). Hs values from COAWST are generally negatively biased with differences (model minus buoy observations) of −3.7 to 0.1 m (bias of up to 37 %). The spatial pattern of precipitation from the simulations exhibits some similarity with IMERG, although the maximum precipitation centroid is displaced westward (towards the coast of North Carolina) in IMERG by approximately 125 km (Fig. 3). The volume of precipitation vented from the hurricane exhibits relatively good agreement between the simulations and IMERG. The mean (1 h) precipitation volume within 375 km from the centroid is 5.35 × 10⁸ m3 based on IMERG combined with the NHC best track data, while the corresponding values (and percent error) are 5.82 × 10⁸ m3 (+8.7 %) and 5.83 × 10⁸ m3 (+8.9 %) for the WRF and COAWST simulations (Fig. 3). Mean R18 prior to landfall is 506 km in the WRF simulation and is larger by an average of 14 km in 119 of the 151 tracked 10 min positions in the COAWST simulation. The R18 estimates from 6 h HURDAT2 data before and after landfall are 705 and 776 km and are larger than those from the WRF and COAWST simulation due to biases in the calculation when the hurricane extends beyond the d02 boundary.
3.1.3 Synthesis
Evaluation of the WRF and COAWST simulations of Hurricane Sandy thus indicates relatively high fidelity. Nevertheless, the fidelity is lower for simulations of Hurricane Irene, and biases relative to observations provide important context for the following analyses, which focus on power production and extreme conditions at prospective offshore WT locations. Due to the presence of errors in tropical cyclone tracking in the simulations, in the following discussion of geophysical conditions we consider not only grid cells with WTs in the LAs, but also ocean-based grid cells nearby. In terms of agreement with observed precipitation, cyclone size (R18), near-surface WS, and cyclone tracking, COAWST simulations exhibit higher skill than those of WRF.
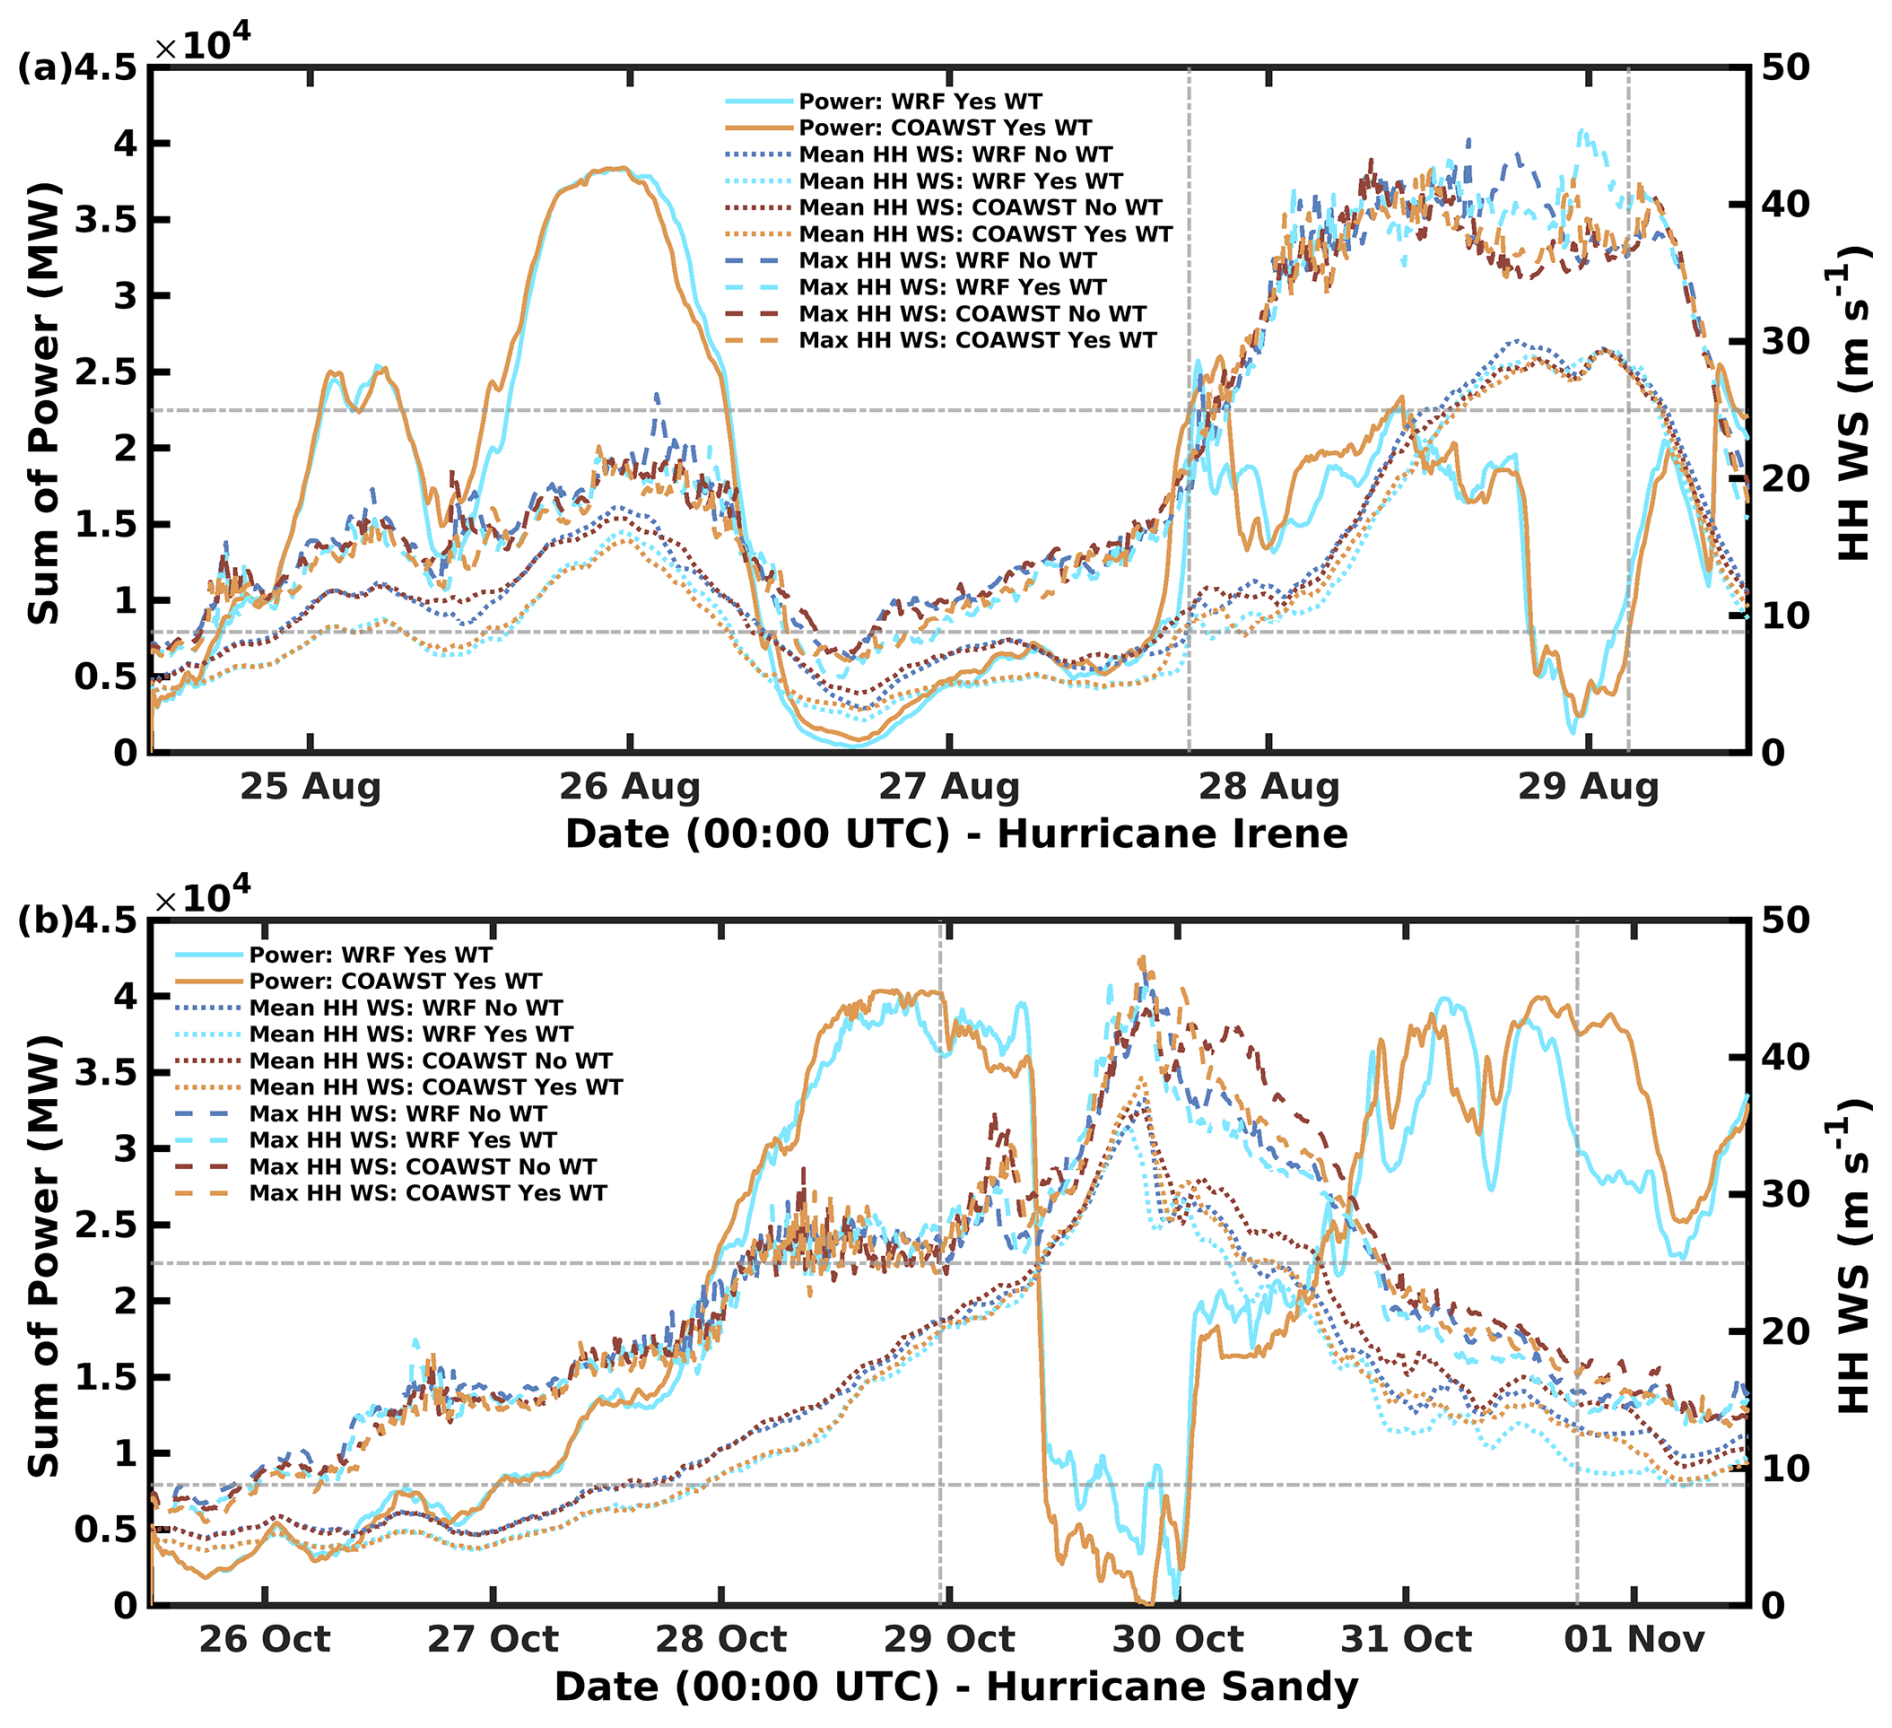
Figure 6Time series of simulated total instantaneous power production (sum of power) from all 2642 wind turbines (WTs) (left axis) and mean and maximum hub-height wind speed (HH WS) (right axis) in grid cells containing WTs for (a) Hurricane Irene and (b) Hurricane Sandy. The dashed gray vertical lines mark the start and end time of storm tracking within d02. The lower dashed gray horizontal line marks power production equivalent to a capacity factor (CF) of 0.2, and the upper dashed gray horizontal line marks HH WS = 25 m s−1.
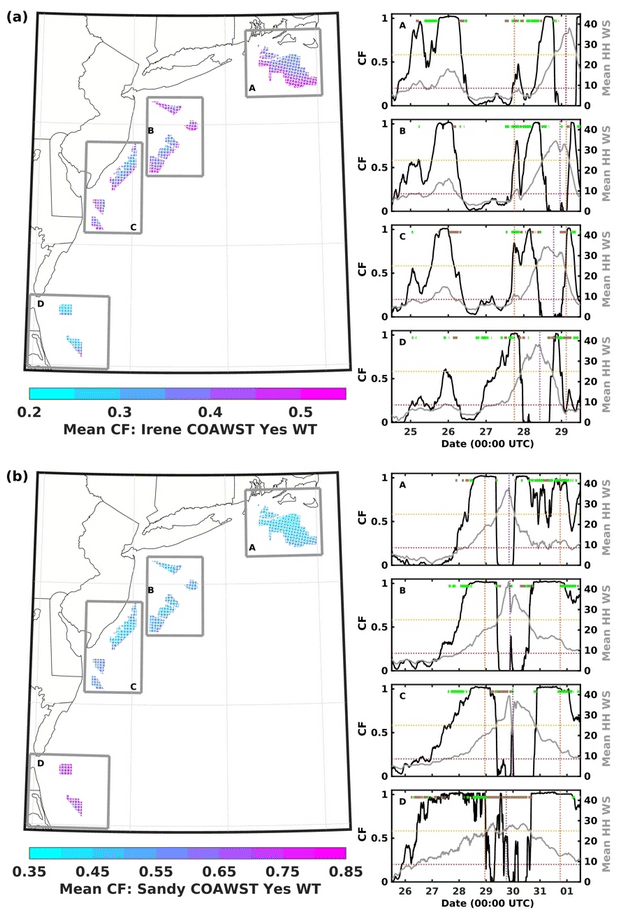
Figure 7Mean capacity factor (CF) from COAWST simulations for (a) Hurricane Irene and (b) Hurricane Sandy. Also shown are time series of CF and mean hub-height wind speed (HH WS) over the four lease area (LA) clusters. Brown (green) symbols at the top of those time series indicate times when CFs from WRF exceed (are less than) those from COAWST by more than 0.05 (see also Fig. S12). Orange dashed lines indicate the start and end time of storm tracking within d02. The purple dashed line represents the time when the minimum sea level pressure (SLP) is closest to the cluster center. The red dashed line indicates CF = 0.2, and the yellow line indicates HH WS = 25 m s−1.
3.2 Wind turbine power production and operating conditions
3.2.1 Hurricane Irene
Mean power production and CF computed for the entire Hurricane Irene simulation period using WRF and COAWST are 1.51 × 10⁴ MW (0.38) and 1.56 × 10⁴ MW (0.39), respectively. When Hurricane Irene is present in d02, equivalent CFs are 0.39 and 0.40, respectively. These values are slightly lower than previously reported climatologically representative CF estimates of 0.45 (Pryor and Barthelmie, 2024a, b) due to relatively low HH WS in the vicinity of the offshore LAs early in the simulation and to an extended period of above cut-out WSs during the hurricane passage from late on 27 August to the middle of 29 August (Figs. 6a and 7a). However, the system-wide CF only drops below 0.2 for continuous periods of 5 h 50 min (28 August at 20:00 UTC through 29 August at 01:50 UTC) in WRF and 7 h 10 min (28 August at 19:50 UTC through 29 August at 03:00 UTC) in COAWST (Fig. 6a). At no point is the projected power production zero.
Time series of power production from WRF and COAWST indicate a high degree of agreement (Fig. 6a). However, late on 27 August and early on 28 August when Hurricane Irene is south of the LAs, projected power production differs by a maximum of 1.09 × 10⁴ MW (CF difference of 0.275). Simulations with WRF and the WFP active indicate a period of 5 h 50 min with system-wide CF < 0.2 and mean HH WS in grid cells with WTs (WT grid cells) ranging from 27.6 to 29.3 m s−1. Within the LAs the maximum HH WS is 45.4 m s−1, which exceeds the 50-year RP WS at 100 m derived in earlier work using ERA5 output (Barthelmie et al., 2021), but remains below the 50 m s−1 sustained WS threshold for class I WTs and the 57 m s−1 threshold for tropical-cyclone-hardened WTs (class T) (IEC, 2019a). Analyses including all ocean-based grid cells within the four LA clusters indicate that the mean HH WS as simulated by WRF with WFP active ranges from 24.2 to 27.0 m s−1 and the maximum HH WS reaches 46.4 m s−1. During the period when the system-wide CF from COAWST is < 0.2, the mean HH WS in WT grid cells ranges from 27.2 to 29.3 m s−1 and the maximum reaches 41.8 m s−1. For all ocean-based grid cells within the four LA clusters, the mean HH WS as simulated by COAWST with the WFP active ranges from 23.1 to 27.0 m s−1 and the maximum reaches 42.1 m s−1.
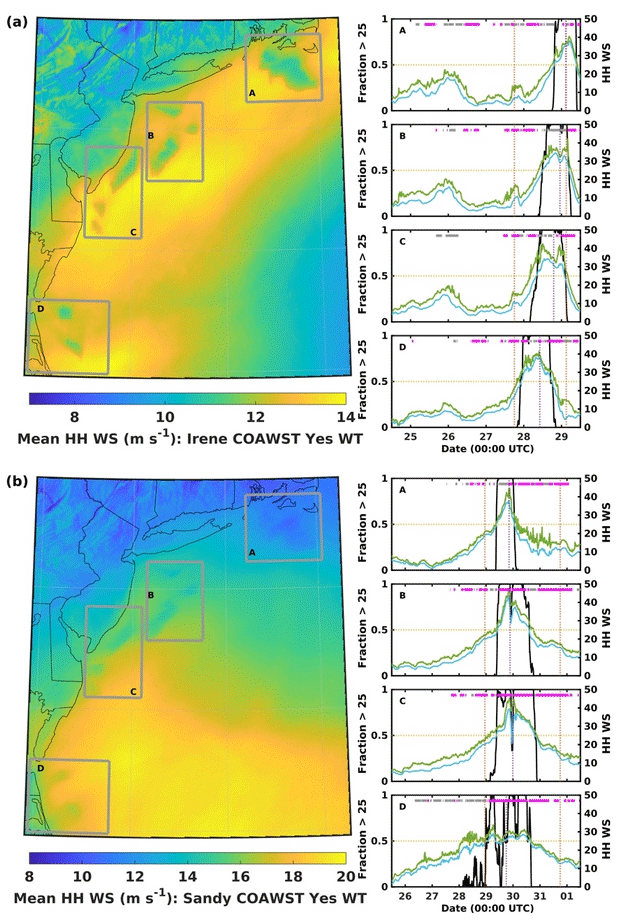
Figure 8Mean simulated hub-height wind speed (HH WS) from COAWST with the wind farm parameterization (WFP) active for (a) Hurricane Irene and (b) Hurricane Sandy. The time series show the fraction of wind turbine (WT) grid cells with HH WS > 25 m s−1 (left axis, black) plus the mean (blue) and maximum (green) HH WS in those grid cells (right axis). Gray (magenta) symbols at the top of the time series indicate times when the mean HH WS from WRF exceeds (is lower than) COAWST by > 0.5 m s−1. Orange dashed lines indicate the start and end time of storm tracking within d02. The purple dashed line represents the time when the location of the minimum sea level pressure (SLP) is closest to the lease area (LA) cluster center. The yellow line indicates HH WS = 25 m s−1. See also Figs. S13 and S14.
Mean HH WS > 25 m s−1 in WT grid cells and CF < 0.2 extend for 13.8, 13.3, and 7.2 h in the WRF simulation with the WFP active and 15.2, 12.8, and 7.3 h in the equivalent simulation with COAWST for LA clusters C, B, and A, respectively (Figs. 7 and 8). Due to slight differences in the hurricane tracking (Fig. 1a), the mean CF from COAWST exceeds that with WRF for offshore LA cluster B and in the northern part of LA cluster C, while the mean CF with WRF exceeds that with COAWST in the southern part of LA cluster C (Figs. 7a and S15). Hurricane Irene tracks very close to LA cluster D, which experiences mean HH WS in WT grid cells > 25 m s−1 and CF < 0.2 for 15.5 and 17.3 h in the WRF and COAWST simulations, respectively. According to Mood's test, the median CFs for this LA from the WRF and COAWST simulations differ at the 95 % confidence level.
Nearly two-thirds of WT grid cells and over three-quarters of ocean grid cells within the LA exhibit a higher frequency of HH WS > 25 m s−1 in the COAWST simulations when Hurricane Irene is within d02. A larger R18 value is also much more frequent (≥ 96 % of time stamps) in each COAWST simulation. Thus, consistent with the analyses of precipitation volume from Hurricane Irene given above, there is evidence that the simulations with COAWST result in a more intense and larger tropical cyclone.
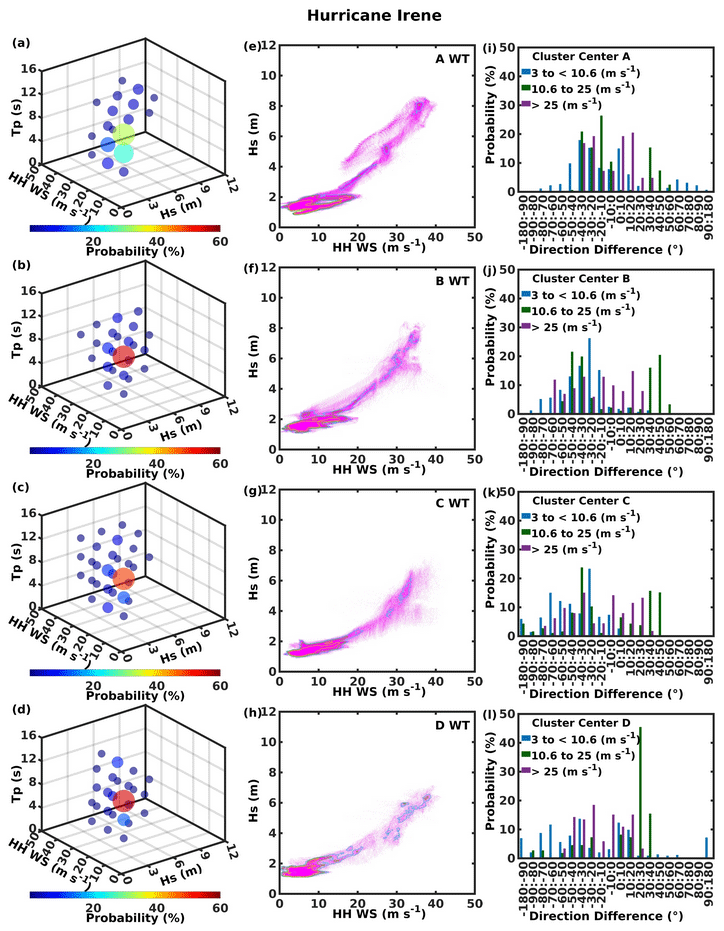
Figure 9Joint occurrence of (a–d) hub-height wind speed (HH WS), significant wave height (Hs), and peak wave period (Tp) (5 classes for each variable for a total of 125 possible classes) in COAWST simulations of Hurricane Irene with wind farm parameterization (WFP) active for wind turbine (WT) grid cells in each lease area (LA) cluster (A–D). (e–h) Joint probability distributions of HH WS and Hs where the magenta symbols denote 10 min output and the contours denote probabilities of 0.01 (blue), 0.02 (green), and 0.05 (yellow). (i–l) Directional misalignment (hub-height direction minus mean wave direction) at the center of each LA cluster for three HH WS classes: 3 to < 10.6, 10.6 to 25, and > 25 m s−1.
In the COAWST simulation with the WFP active, maximum Hs in WT grid cells within LA clusters A, B, C, and D is 8.6, 8.5, 7.6, and 7.2 m, respectively (Fig. 9), and thus all values are below the 50-year RP Hs of ∼ 11 m estimated using ERA5 (Barthelmie et al., 2021). LA cluster A exhibits the highest frequency (∼ 4 %) of joint Hs, HH WS, and Tp values (Fig. 9) that fall in the classes centered at Hs ≥ 8.4 m, HH WS ≥ 35 m s−1 (approximately equivalent to 5 m WS of 21.5 m s−1), and Tp ≥ 11.2 s that were previously reported to be associated with high mud-line bending moments based on simulations with 3D IFORM applied to the 5 MW NREL offshore reference WT (Valamanesh et al., 2015). The COAWST simulation also indicates frequent occurrence of wind–wave misalignment. In the HH WS class 10.6 to 25 m s−1, 47, 86, 74, and 32 % of the time periods have wind–wave misalignment ≥ 30° at the center of LA clusters A, B, C, and D, respectively. For HH WS > 25 m s−1, the corresponding values are 22 %, 41 %, 44 %, and 31 %, respectively.
3.2.2 Hurricane Sandy
Mean instantaneous power production and CF from WRF and COAWST for the Hurricane Sandy simulation period are 2.03 × 10⁴ MW (0.51) and 2.07 × 10⁴ MW (0.52), respectively. When Hurricane Sandy is within d02, equivalent CFs are 0.62 and 0.61, respectively. The high CFs are reflective of high, but below cut-out, HH WS prior to the passage of the hurricane over the LAs and the relatively short duration of HH WS > 25 m s−1 within the LAs (Figs. 6b and 7b). Simulated system-wide CF drops below 0.2 for 8 h (scattered during 29 October at 13:20 UTC through 30 October at 01:00 UTC) in the WRF simulation and for 15 h (29 October at 10:10 UTC through 30 October at 01:10 UTC) in the COAWST simulation (Fig. 6b). A single time step (29 October at 21:00 UTC) has zero system-wide power production in the COAWST simulation.
When the system-wide CF < 0.2 (including landfall in New Jersey), the mean HH WS in WT grid cells is > 25 m s−1 in both the WRF and COAWST simulations (Fig. 6b). During the longest continuous time when the system-wide CF from WRF remains below 0.2 (29 October from 17:10 through 20:40 UTC), the mean HH WS is 30.6 to 34.8 m s−1 in WT grid cells and 29.7 to 31.9 m s−1 in all ocean-based grid cells within the LA clusters. Equivalent values from COAWST (also with WFP active) are 26.0 to 38.5 and 25.8 to 35.0 m s−1.
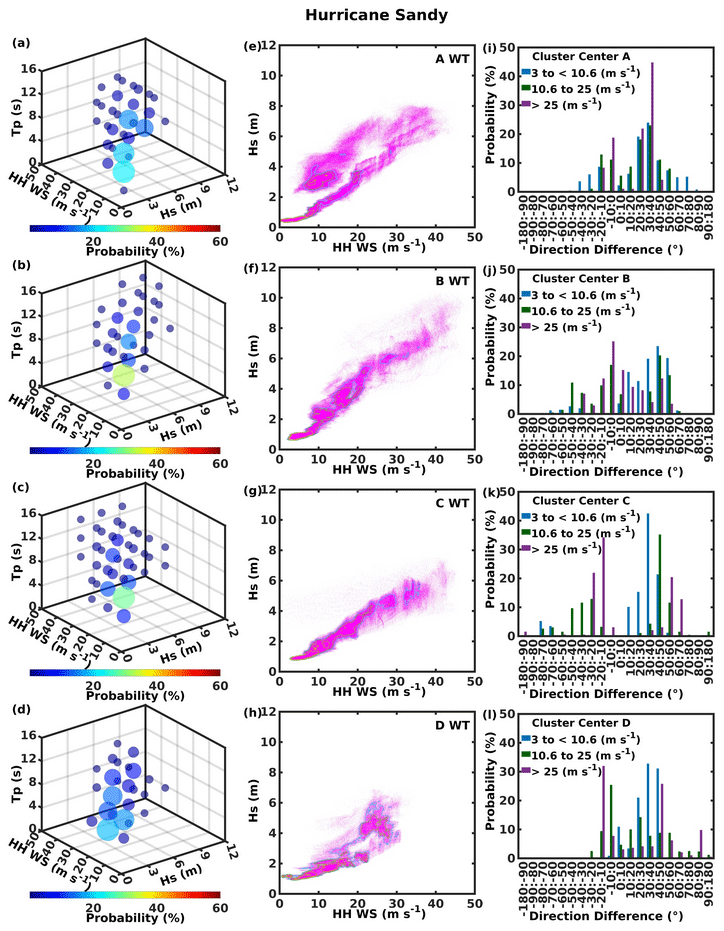
Figure 10Joint occurrence of (a–d) hub-height wind speed (HH WS), significant wave height (Hs), and peak wave period (Tp) (5 classes for each variable for a total of 125 possible classes) in COAWST simulations of Hurricane Sandy with wind farm parameterization (WFP) active for wind turbine (WT) grid cells in each lease area (LA) cluster (A–D). (e–h) Joint probability distributions of HH WS and Hs where the magenta symbols denote 10 min output and the contours denote probabilities of 0.01 (blue), 0.02 (green), and 0.05 (yellow). (i–l) Directional misalignment (hub-height direction minus mean wave direction) at the center of each LA cluster for three HH WS classes: 3 to < 10.6, 10.6 to 25, and > 25 m s−1.
HH WS > 50 m s−1 is simulated in tens of thousands of space–time sample combinations in both the WRF and COAWST simulations with the WFP active. However, none occurred within 170 km of any LA centroid. Maximum HH WS in WT grid cells and the frequency of HH WS > 25 m s−1 in WT grid cells is higher (59 % and 65 % of time stamps when Hurricane Sandy is within d02) in the COAWST simulation than in the WRF simulation with and without the WFP active (Fig. 8). In all ocean-based grid cells within the LA clusters, 63 % and 69 % of the time stamps exhibit more grid cells with HH WS > 25 m s−1 in the COAWST simulations. Maximum HH WS in ocean-based grid cells within the LA clusters is 45.1 m s−1 in WRF and 48.9 m s−1 in COAWST (Fig. 8). In the COAWST simulation with the WFP active, the maximum HH WSs in WT grid cells in LA clusters A, B, and C are 44.6, 47.7, and 45.4 m s−1, respectively (Fig. 10). They thus exceed the highest 50-year RP WS at 100 of 39.7 m s−1 computed using ERA5 output (Barthelmie et al., 2021) but are below the 50 and 57 m s−1 thresholds for class I and class T WTs (IEC, 2019a). Larger R18 values prior to landfall are also more frequent in the COAWST simulations (> 70 % of time stamps in both the simulations without and with the WFP). Thus, consistent with analyses of the simulations of Hurricane Irene, there is evidence that use of COAWST (for the configuration used herein) results in a larger and more intense hurricane.
Minor differences in the tracking (Fig. 1b) and intensity of the hurricane-induced WS (Fig. 8) cause higher mean CF from LA cluster A and parts of B and C in the simulation with COAWST than the simulation with WRF (Figs. 7 and S15). The simulations track the centroid of Hurricane Sandy close to LA clusters B and C, and accordingly, periods with CF < 0.2 are of the greatest duration for these clusters (20.0 and 23.5 h in WRF and 23.3 and 31.0 h in COAWST, respectively) (Fig. 7). The largest differences in CF are found for LA cluster D. The duration of time with CF < 0.2 is substantially longer in the COAWST simulation due to the prevalence of HH WS > 25 m s−1, and the median CF for this cluster between the two simulations differs at the 99 % confidence level according to Mood's test.
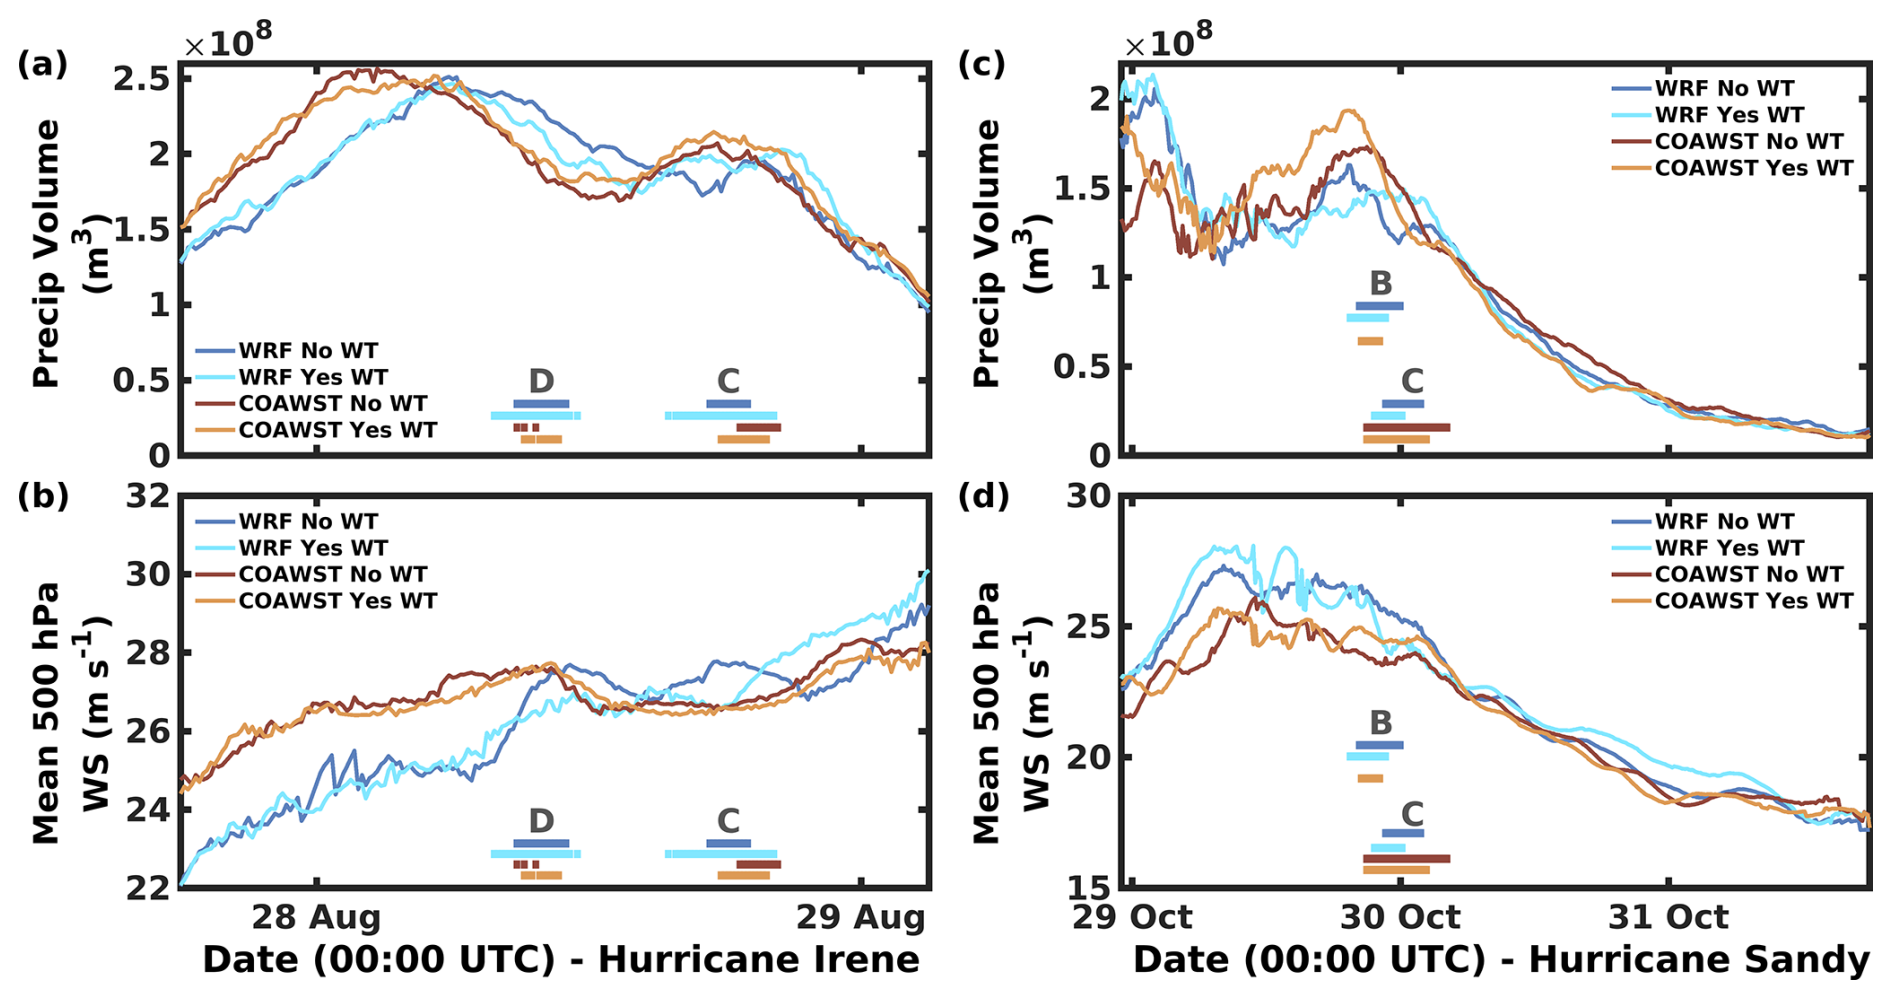
Figure 11Time series of (a, c) 10 min precipitation volume within a 375 km radius from the minimum sea level pressure (SLP) and (b, d) mean 500 hPa wind speed (WS) 50 to 375 km from the minimum SLP from simulations with WRF and COAWST of (a, b) Hurricane Irene and (c, d) Hurricane Sandy. The colored horizontal lines and labels denote times when the minimum SLP is within 100 km of the specified lease area (LA) cluster centroid. See also Fig. S16.
Maximum simulated Hs values of 8.3, 10.4, 7.5, and 6.9 m in LA clusters A, B, C, and D (Fig. 10) are higher than those for Hurricane Irene but are also below the 50-year RP values of ∼ 11 m derived from ERA5 (Barthelmie et al., 2021). LA cluster B exhibits the highest frequency (∼ 4 %) of joint Hs, HH WS, and Tp values (classes centered at Hs ≥ 8.4 m, HH WS ≥ 35 m s−1 or 5 m WS ∼ 21.5 m s−1, and Tp ≥ 11.2 s) close to those associated with a peak mud-line moment (of ∼ 120 MN−m) (Valamanesh et al., 2015). Wind–wave misalignment of ≥ 30° is common in the COAWST simulation for both HH WS classes of 10.6 to 25 and > 25 m s−1. Based on COAWST output from the centroids of LA A, B, C, and D, wind–wave misalignment ≥ 30° is found for 43 (49), 63 (27), 83 (41), and 34 (49) % of time steps (value in parentheses for WS HH > 25 m s−1).
3.3 Wind turbine impacts on hurricane properties
Consistent with expectations, removal of kinetic energy by WTs means that maximum HH WSs in WRF and COAWST simulations with the WFP active tend to be lower than those when the WTs are excluded (see Fig. 6). For example, output from the no-WT COAWST simulation of Hurricane Irene indicates HH WS in ocean-based grid cells beyond the LAs > 50 m s−1 837 times, while the corresponding number for the simulation with WTs is 333. However, simulations using both WRF and COAWST with full deployment of WTs in existing LAs indicate that for this scale of offshore WT deployment, the net impact is small except for HH WS near the LAs.
For all other metrics, the simulations with WRF or COAWST differ more than the simulations with or without the action of WTs included (Fig. 11). The 10 min mean precipitation volume within 375 km of the Hurricane Irene centroid differs (without WT versus with WFP active) by 4.7 % and 3.9 % in simulations with WRF and COAWST, respectively, but differs (WRF versus COAWST) by 11.8 % and 9.2 % in the no-WT and WT simulations, respectively. The equivalent values for Hurricane Sandy are 8.7 % for WRF and 12.9 % for COAWST (without WFP active versus with WFP active) and 13.0 % for the no-WT and 11.6 % for the WT simulations (WRF versus COAWST). Similarly, the mean 500 hPa WSs close to the hurricane centroids differ by < 2 m s−1 in simulations of Hurricanes Irene and Sandy with and without WTs with no consistent signal in terms of which simulation is higher (Fig. 11). The mean R18 values for Hurricane Irene based on WRF simulations with and without the WFP active differ by < 2 km (mean of ∼ 280 km). Mean R18 values from COAWST simulations with and without the WFP active also differ by < 2 km (mean of ∼ 300 km). Thus, while median R18 values from WRF versus COAWST are statistically different (at p < 0.01) for simulations with and without the WFP active, the use of the WFP does not yield significantly different R18 values in simulations with a given model. Simulations with WFP active produce equal or slightly more total precipitation. For Hurricane Irene, the 10 min mean (median) precipitation volumes from WRF without and with the WFP active are 1.88 × 10⁸ m3 (1.89 × 10⁸ m3) and 1.88 × 10⁸ m3 (1.93 × 10⁸ m3), while equivalent values from COAWST are 1.93 × 10⁸ m3 (1.93 × 10⁸ m3) and 1.98 × 10⁸ m3 (2.02 × 10⁸ m3), respectively. For Hurricane Sandy, the corresponding values are 8.64 × 10⁷ m3 (8.60 × 10⁷ m3) versus 8.68 × 10⁷ m3 (8.10 × 10⁷ m3) from WRF and 8.69 × 10⁷ m3 (9.19 × 10⁷ m3) versus 8.87 × 10⁷ m3 (7.79 × 10⁷ m3) from COAWST.
Analyses of simulations with WRF and COAWST of two of the most powerful hurricanes that tracked within 100 km of offshore wind energy LAs along the US East Coast during the last 25 years can be summarized as follows.
-
Many aspects of Hurricane Sandy are well reproduced in WRF and COAWST control simulations that exclude the action of WTs. Consistent with past research, simulations of Hurricane Irene exhibit lower fidelity relative to a range of observations in part due to the negative bias in translational speed. In contrast to similar simulations of Typhoon Muifa (Liu et al., 2015) but consistent with past research on intense cyclones in the North Sea (Larsén et al., 2019), COAWST simulations of both hurricanes indicate generally better agreement with observations, a slightly larger area of storm-force WS (R18) and HH WS > 25 m s−1, and higher precipitation volumes than are indicated by WRF. This coupled with the ability of COAWST to quantify additional geophysical parameters of importance to offshore structures strongly indicates the need for increasing investment in coupled simulations for the offshore wind energy industry.
-
Despite the intensity and size of these hurricanes and their proximity to the offshore wind energy LAs, simulations presented herein, that assume a 15 MW reference WT deployed with a spacing of 1.85 km, indicate only brief periods with low power production (system-wide CF < 0.2). System-wide CF < 0.2 due to widespread occurrence of HH WS > 25 m s−1 extends for only 6 to 7 h in the simulations of Hurricane Irene and 8 to 15 h for Hurricane Sandy (the longer period is based on the COAWST simulation). Further, neither hurricane is simulated to produce HH WS > 50 m s−1 in the current offshore LAs. Thus, based on these simulations of these intense hurricanes there is no evidence of a need for hurricane hardening of WTs deployed in these LAs. Also, these simulations even suggest that the projected fleet of offshore WTs will continue to supply substantial amounts of electricity to the grid even during these extreme events. However, simulations with COAWST result in wave–wind conditions that have previously been identified as being associated with high mud-line bending moments on monopile foundations and a relatively high frequency of wind–wave directional misalignment (> 30°) in these LAs.
-
There is no evidence that deployment of 2642 WTs at an ICD of 4.3 MW km−2 within existing offshore wind energy LAs along the US East Coast would have substantially weakened either of the hurricanes considered herein. Although much denser and larger deployments might have an influence on hurricanes, even for Hurricane Irene that tracked closest to these LAs, simulations with either WRF or COAWST differ more than simulations with either WFP inactive or active with respect to the volume of precipitation near the hurricane center, storm intensity, and/or extent.
Mesoscale simulations performed at convection-permitting resolution such as those presented herein allow simulation of the hurricane lifespans and associated power production over large domains and can be used as here to assess whether improved treatment of atmosphere–ocean dynamical coupling alters extreme conditions of relevance to offshore WTs. However, it is important to acknowledge that results from any numerical simulations are subject to uncertainty. For example, the highest structural loading may occur in the cyclone eye wall (Han et al., 2014), which is of a scale (Marks et al., 2008) that is not fully represented in the simulations presented here. Nevertheless, analyses of the simulations suggest that the structure of the hurricanes is reasonably represented in our modeling (Figs. 4 and S4 in the Supplement), and simulations performed at the same grid spacing were shown to represent some aspects of flow in the eye wall (Müller et al., 2024). Further, while the Fitch WFP used herein is the most widely adopted within the wind energy community, such schemes do not comprehensively treat WT wake generation (Fischereit et al., 2022). Past research has suggested that use of alternative schemes such as the explicit wake parameterization tends to lead to substantially lower wake losses in large offshore wind farms and higher power production than simulated using the Fitch scheme (Pryor and Barthelmie, 2024a). Future work employing mesoscale–microscale coupling (Wang et al., 2024) could be used to evolve further details of geophysical properties of relevance to structural loading. Further, the hurricanes simulated herein were extremely powerful and both tracked within 100 km of offshore wind energy LA cluster centers (C and D for Hurricane Irene, B and C for Hurricane Sandy). However, they do not represent a comprehensive climatology of historical or possible intense tropical/extratropical cyclones (Barthelmie et al., 2021). Undertaking comparable simulations of additional extreme cyclones and simulations with different configurations including alternative z0 parameterizations (Porchetta et al., 2019; Fu et al., 2023) and a wave boundary layer model within SWAN (Du et al., 2017) would also be useful in determining if findings presented herein are generalizable and to quantify the degree to which the meteorological and oceanic extreme conditions vary according to the precise model formulation.
COAWST software can be downloaded from https://github.com/DOI-USGS/COAWST (United States Geological Survey, 2019). NAM data can be downloaded from https://rda.ucar.edu/datasets/d609000/ (last access: 5 February 2024) and https://www.ncei.noaa.gov/products/weather-climate-models/north-american-mesoscale (last access: 5 February 2024). OSTIA-UKMO-L4-GLOB-v2.0 SST data can be downloaded from https://podaac.jpl.nasa.gov/dataset/OSTIA-UKMO-L4-GLOB-v2.0 (last access: 5 February 2024). GHSHHG data can be downloaded from https://www.ngdc.noaa.gov/mgg/shorelines/shorelines.html (last access: 5 February 2024). GEBCO data can be downloaded from https://download.gebco.net/ (last access: 5 February 2024). HYCOM GLBa0.08 expt 90.9 data can be downloaded from https://tds.hycom.org/thredds/catalog.html (last access: 5 February 2024). ADCIRC 2001v2d data can be downloaded from https://adcirc.org/products/adcirc-tidal-databases/ (last access: 5 February 2024). GFS wind forcing data can be downloaded from https://www.ncei.noaa.gov/thredds/catalog/model/gfs.html (last access: 5 February 2024). WW3 data for boundary conditions can be downloaded from https://www.ncei.noaa.gov/thredds-ocean/catalog/ncep/nww3/catalog.html (last access: 5 February 2024). NHC “best track” data can be downloaded from https://www.nhc.noaa.gov/data/tcr/index.php (last access: 25 February 2025). HURDAT2 data can be downloaded from https://www.nhc.noaa.gov/data/ (last access: 25 February 2025). IMERG V07 data can be downloaded from https://disc.gsfc.nasa.gov/datasets/GPM_3IMERGHH_07/summary?keywords=''IMERG_final'' (last access: 25 February 2025). NDBC buoy data can be downloaded from https://www.ndbc.noaa.gov/ (last access: 25 February 2025). Scientific color maps can be downloaded from https://www.fabiocrameri.ch/colourmaps/ (last access: 25 February 2025) (Crameri et al., 2020). Namelist information can be found at https://doi.org/10.5281/zenodo.14895862 (Thompson et al., 2025).
The supplement related to this article is available online at https://doi.org/10.5194/wes-10-2639-2025-supplement.
SCP and RJB obtained funding and computing support for this work. KBT performed the simulations. SCP and KBT processed data used for model evaluation, conducted the analyses with assistance from RJB, produced the figures, and drafted the initial manuscript. All authors contributed to the design of the analyses, interpretation of results, and manuscript revisions.
The contact author has declared that none of the authors has any competing interests.
Any opinions, findings, and conclusions or recommendations expressed in this material are those of the authors and do not necessarily reflect the views of the funding agencies.
Publisher's note: Copernicus Publications remains neutral with regard to jurisdictional claims made in the text, published maps, institutional affiliations, or any other geographical representation in this paper. While Copernicus Publications makes every effort to include appropriate place names, the final responsibility lies with the authors. Views expressed in the text are those of the authors and do not necessarily reflect the views of the publisher.
We thank John Warner for his help in answering COAWST-related questions and two reviewers for their thoughtful suggestions.
This research has been supported by the Cornell Atkinson Center for Sustainability (grant no. AVF-AOWE) and the US Department of Energy Office of Science (grant no. DE-SC0016605). Computing resources were provided by National Science Foundation Extreme Science and Engineering Discovery Environment (XSEDE) (grant no. TG-ATM170024) and the National Energy Research Scientific Computing Center, a DoE Office of Science User Facility supported by the Office of Science of the US Department of Energy (grant no. DE-AC02-05CH11231).
This paper was edited by Andrea Hahmann and reviewed by two anonymous referees.
Avila, L. A. and Cangialosi, J.: Tropical Cyclone Report: Hurricane Irene, 45, National Hurricane Center, https://www.nhc.noaa.gov/data/tcr/AL092011_Irene.pdf (last access: 25 February 2025), 2011.
Baldini, L. M., Baldini, J. U. L., McElwaine, J. N., Frappier, A. B., Asmerom, Y., Liu, K.-B., Prufer, K. M., Ridley, H. E., Polyak, V., Kennett, D. J., Macpherson, C. G., Aquino, V. V., Awe, J., and Breitenbach, S. F. M.: Persistent northward North Atlantic tropical cyclone track migration over the past five centuries, Scientific Reports, 6, 37522, https://doi.org/10.1038/srep37522, 2016.
Barthelmie, R. J., Dantuono, K. E., Renner, E. J., Letson, F. L., and Pryor, S. C.: Extreme Wind and Waves in US East Coast Offshore Wind Energy Lease Areas, Energies, 14, 1053, https://doi.org/10.3390/en14041053, 2021.
Blake, E. S., Kimberlain, T. B., Berg, R. J., Cangialosi, J. P., and Beven II, J. L.: Tropical Cyclone Report: Hurricane Sandy, National Hurricane Center, 157, https://www.nhc.noaa.gov/data/tcr/AL182012_Sandy.pdf (last access: 25 February 2025), 2013.
Bodini, N., Optis, M., Redfern, S., Rosencrans, D., Rybchuk, A., Lundquist, J. K., Pronk, V., Castagneri, S., Purkayastha, A., Draxl, C., Krishnamurthy, R., Young, E., Roberts, B., Rosenlieb, E., and Musial, W.: The 2023 National Offshore Wind data set (NOW-23), Earth Syst. Sci. Data, 16, 1965–2006, https://doi.org/10.5194/essd-16-1965-2024, 2024.
Booij, N., Ris, R. C., and Holthuijsen, L. H.: A third-generation wave model for coastal regions: 1. Model description and validation, Journal of Geophysical Research: Oceans, 104, 7649–7666, https://doi.org/10.1029/98JC02622, 1999.
Calvo-Sancho, C., Quitián-Hernández, L., González-Alemán, J. J., Bolgiani, P., Santos-Muñoz, D., and Martín, M. L.: Assessing the performance of the HARMONIE-AROME and WRF-ARW numerical models in North Atlantic Tropical Transitions, Atmospheric Research, 291, 106801, https://doi.org/10.1016/j.atmosres.2023.106801, 2023.
Chen, F. and Dudhia, J.: Coupling an Advanced Land Surface–Hydrology Model with the Penn State–NCAR MM5 Modeling System. Part I: Model Implementation and Sensitivity, Monthly Weather Review, 129, 569–585, https://doi.org/10.1175/1520-0493(2001)129<0569:CAALSH>2.0.CO;2, 2001a.
Chen, F. and Dudhia, J.: Coupling an Advanced Land Surface–Hydrology Model with the Penn State–NCAR MM5 Modeling System. Part II: Preliminary Model Validation, Monthly Weather Review, 129, 587–604, https://doi.org/10.1175/1520-0493(2001)129<0587:CAALSH>2.0.CO;2, 2001b.
Chen, X. and Xu, J. Z.: Structural failure analysis of wind turbines impacted by super typhoon Usagi, Engineering Failure Analysis, 60, 391–404, https://doi.org/10.1016/j.engfailanal.2015.11.028, 2016.
Chen, Y. and Yau, M. K.: Asymmetric Structures in a Simulated Landfalling Hrricane, Journal of the Atmospheric Sciences, 60, 2294–2312, https://doi.org/10.1175/1520-0469(2003)060<2294:ASIASL>2.0.CO;2, 2003.
Crameri, F., Shephard, G. E., and Heron, P. J.: The misuse of colour in science communication, Nature Communications, 11, 5444, https://doi.org/10.1038/s41467-020-19160-7, 2020.
Davis, C., Wang, W., Chen, S. S., Chen, Y., Corbosiero, K., DeMaria, M., Dudhia, J., Holland, G., Klemp, J., Michalakes, J., Reeves, H., Rotunno, R., Snyder, C., and Xiao, Q.: Prediction of Landfalling Hurricanes with the Advanced Hurricane WRF Model, Monthly Weather Review, 136, 1990–2005, https://doi.org/10.1175/2007MWR2085.1, 2008.
Drennan, W. M., Taylor, P. K., and Yelland, M. J.: Parameterizing the Sea Surface Roughness, Journal of Physical Oceanography, 35, 835–848, https://doi.org/10.1175/JPO2704.1, 2005.
Du, J., Bolaños, R., and Guo Larsén, X.: The use of a wave boundary layer model in SWAN, Journal of Geophysical Research: Oceans, 122, 42–62, https://doi.org/10.1002/2016JC012104, 2017.
Dudhia, J.: Numerical Study of Convection Observed during the Winter Monsoon Experiment Using a Mesoscale Two-Dimensional Model, Journal of the Atmospheric Sciences, 46, 3077–3107, https://doi.org/10.1175/1520-0469(1989)046<3077:NSOCOD>2.0.CO;2, 1989.
Ek, M. B., Mitchell, K. E., Lin, Y., Rogers, E., Grunmann, P., Koren, V., Gayno, G., and Tarpley, J. D.: Implementation of Noah land surface model advances in the National Centers for Environmental Prediction operational mesoscale Eta model, Journal of Geophysical Research: Atmospheres, 108, 8851, https://doi.org/10.1029/2002JD003296, 2003.
Fischer, T., Rainey, P., Bossanyi, E., and Kühn, M.: Study on Control Concepts suitable for Mitigation of Loads from Misaligned Wind and Waves on Offshore Wind Turbines supported on Monopiles, Wind Engineering, 35, 561–573, https://doi.org/10.1260/0309-524X.35.5.561, 2011.
Fischereit, J., Brown, R., Larsén, X. G., Badger, J., and Hawkes, G.: Review of Mesoscale Wind-Farm Parametrizations and Their Applications, Boundary-Layer Meteorology, 182, 175–224, https://doi.org/10.1007/s10546-021-00652-y, 2022.
Fitch, A. C., Olson, J. B., Lundquist, J. K., Dudhia, J., Gupta, A. K., Michalakes, J., and Barstad, I.: Local and Mesoscale Impacts of Wind Farms as Parameterized in a Mesoscale NWP Model, Monthly Weather Review, 140, 3017–3038, https://doi.org/10.1175/MWR-D-11-00352.1, 2012.
Foody, R., Coburn, J., Aird, J. A., Barthelmie, R. J., and Pryor, S. C.: Quantitative comparison of power production and power quality onshore and offshore: a case study from the eastern United States, Wind Energ. Sci., 9, 263–280, https://doi.org/10.5194/wes-9-263-2024, 2024.
Fu, S., Huang, W., Luo, J., Yang, Z., Fu, H., Luo, Y., and Wang, B.: Deep Learning-Based Sea Surface Roughness Parameterization Scheme Improves Sea Surface Wind Forecast, Geophysical Research Letters, 50, e2023GL106580, https://doi.org/10.1029/2023GL106580, 2023.
Gaertner, E., Rinker, J., Sethuraman, L., Zahle, F., Anderson, B., Barter, G., Abbas, N., Meng, F., Bortolotti, P., Skrzypinski, W., Scott, G., Feil, R., Bredmose, H., Dykes, K., Shields, M., Allen, C., and Viselli, A.: IEA Wind TCP Task 37: Definition of the IEA 15-Megawatt Offshore Reference Wind Turbine, National Renewable Energy Lab. (NREL), Golden, CO (United States), 54, https://www.nrel.gov/docs/fy20osti/75698.pdf (last access: 25 February 2025), 2020.
Gaudet, B. J., García Medina, G., Krishnamurthy, R., Shaw, W. J., Sheridan, L. M., Yang, Z., Newsom, R. K., and Pekour, M.: Evaluation of Coupled Wind–Wave Model Simulations of Offshore Winds in the Mid-Atlantic Bight Using Lidar-Equipped Buoys, Monthly Weather Review, 150, 1377–1395, https://doi.org/10.1175/MWR-D-21-0166.1, 2022.
GWEC: Global Wind Report 2024, Global Wind Energy Council, Brussels, Belgium, 168, https://www.gwec.net/reports/globalwindreport/2024 (last access: 25 February 2025), 2024a.
GWEC: Global Offshore Wind Report 2024, Global Wind Energy Council, Brussels, Belgium, 156, https://www.gwec.net/reports/globaloffshorewindreport/2024 (last access: 25 February 2025), 2024b.
Haidvogel, D. B., Arango, H., Budgell, W. P., Cornuelle, B. D., Curchitser, E., Di Lorenzo, E., Fennel, K., Geyer, W. R., Hermann, A. J., Lanerolle, L., Levin, J., McWilliams, J. C., Miller, A. J., Moore, A. M., Powell, T. M., Shchepetkin, A. F., Sherwood, C. R., Signell, R. P., Warner, J. C., and Wilkin, J.: Ocean forecasting in terrain-following coordinates: Formulation and skill assessment of the Regional Ocean Modeling System, Journal of Computational Physics, 227, 3595–3624, https://doi.org/10.1016/j.jcp.2007.06.016, 2008.
Hallowell, S. T., Myers, A. T., Arwade, S. R., Pang, W., Rawal, P., Hines, E. M., Hajjar, J. F., Qiao, C., Valamanesh, V., Wei, K., Carswell, W., and Fontana, C. M.: Hurricane risk assessment of offshore wind turbines, Renewable Energy, 125, 234–249, https://doi.org/10.1016/j.renene.2018.02.090, 2018.
Han, T., McCann, G., Mücke, T. A., and Freudenreich, K.: How can a wind turbine survive in tropical cyclone?, Renewable Energy, 70, 3–10, https://doi.org/10.1016/j.renene.2014.02.014, 2014.
Hansen, T. A., Wilson, E. J., Fitts, J. P., Jansen, M., Beiter, P., Steffen, B., Xu, B., Guillet, J., Münster, M., and Kitzing, L.: Five grand challenges of offshore wind financing in the United States, Energy Research & Social Science, 107, 103329, https://doi.org/10.1016/j.erss.2023.103329, 2024.
Hashemi, M. R., Kresning, B., Hashemi, J., and Ginis, I.: Assessment of hurricane generated loads on offshore wind farms; a closer look at most extreme historical hurricanes in New England, Renewable Energy, 175, 593–609, https://doi.org/10.1016/j.renene.2021.05.042, 2021.
Hettmansperger, T. P. and Malin, J. S.: A modified Mood's test for location with no shape assumptions on the underlying distributions, Biometrika, 62, 527–529, https://doi.org/10.2307/2335398, 1975.
Hong, S.-Y. and Lim, J.-O. J.: The WRF single-moment 6-class microphysics scheme (WSM6), Journal of the Korean Meteorological Society, 42, 129–151, https://www.researchgate.net/publication/331192569_Hongandlim-JKMS-2006 (last access: 25 February 2025), 2006.
Hu, G. and Franzke, C. L. E.: Evaluation of Daily Precipitation Extremes in Reanalysis and Gridded Observation-Based Data Sets Over Germany, Geophysical Research Letters, 47, e2020GL08962, https://doi.org/10.1029/2020GL089624, 2020.
Huffman, G. J., Bolvin, D. T., Joyce, R., Kelley, O. A., Nelkin, E. J., Portier, A., Stocker, E. F., Tan, J., Watters, D. C., and West, B. J.: IMERG V07 Release Notes, 17, NASA Global Precipitation Measurement Mission, https://gpm.nasa.gov/sites/default/files/2024-02/IMERG_V07_ReleaseNotes_240221.pdf (last access: 25 February 2025), 2024.
IEC (International Electrotechnical Commission): IEC 61400-3-1:2019. Wind energy generation systems. Part 3–1: Design requirements for fixed offshore wind turbines, International Electrotechnical Commission, Geneva, Switzerland, ISBN 9780580944345, 2019a.
IEC (International Electrotechnical Commission): IEC 61400-1 Edition 4.0 2019-02 Wind turbines – Part 1: Design requirements, International Electrotechnical Commission, Geneva, Switzerland, ISBN 978-2-8322-6253-5, 2019b.
Jacob, R., Larson, J., and Ong, E.: M × N Communication and Parallel Interpolation in CCSM Using the Model Coupling Toolkit, 33, Argonne National Laboratory , https://www.mcs.anl.gov/research/projects/acpi/mct/mxnP1225.pdf (last access: 25 February 2025), 2005.
Jacobson, M. Z., Archer, C. L., and Kempton, W.: Taming hurricanes with arrays of offshore wind turbines, Nature Climate Change, 4, 195–200, https://doi.org/10.1038/nclimate2120, 2014.
Jansen, M., Staffell, I., Kitzing, L., Quoilin, S., Wiggelinkhuizen, E., Bulder, B., Riepin, I., and Müsgens, F.: Offshore wind competitiveness in mature markets without subsidy, Nature Energy, 5, 614–622, https://doi.org/10.1038/s41560-020-0661-2, 2020.
Ju, S.-H., Hsu, H.-H., and Hsiao, T.-Y.: Three-dimensional wind fields of tropical cyclones for wind turbine structures, Ocean Engineering, 237, 109437, https://doi.org/10.1016/j.oceaneng.2021.109437, 2021.
Kain, J. S.: The Kain–Fritsch Convective Parameterization: An Update, Journal of Applied Meteorology, 43, 170–181, https://doi.org/10.1175/1520-0450(2004)043<0170:TKCPAU>2.0.CO;2, 2004.
Khaira, U. and Astitha, M.: Exploring the Real-Time WRF Forecast Skill for Four Tropical Storms, Isaias, Henri, Elsa and Irene, as They Impacted the Northeast United States, Remote Sensing, 15, 3219, https://doi.org/10.3390/rs15133219, 2023.
Koukoura, C., Brown, C., Natarajan, A., and Vesth, A.: Cross-wind fatigue analysis of a full scale offshore wind turbine in the case of wind–wave misalignment, Engineering Structures, 120, 147–157, https://doi.org/10.1016/j.engstruct.2016.04.027, 2016.
Kresning, B., Hashemi, M. R., and Gallucci, C.: Simulation of Hurricane Loading for Proposed Offshore Windfarms off the US Northeast Coast, Journal of Physics: Conference Series, 12 pp., https://doi.org/10.1088/1742-6596/1452/1/012026, 2020.
Kresning, B., Hashemi, M. R., Shirvani, A., and Hashemi, J.: Uncertainty of extreme wind and wave loads for marine renewable energy farms in hurricane-prone regions, Renewable Energy, 220, 119570, https://doi.org/10.1016/j.renene.2023.119570, 2024.
Lackmann, G. M.: Hurricane Sandy before 1900 and after 2100, Bulletin of the American Meteorological Society, 96, 547–560, https://doi.org/10.1175/BAMS-D-14-00123.1, 2015.
Landsea, C. W. and Franklin, J. L.: Atlantic Hurricane Database Uncertainty and Presentation of a New Database Format, Monthly Weather Review, 141, 3576–3592, https://doi.org/10.1175/MWR-D-12-00254.1, 2013.
Larsén, X. G. and Ott, S.: Adjusted spectral correction method for calculating extreme winds in tropical-cyclone-affected water areas, Wind Energ. Sci., 7, 2457–2468, https://doi.org/10.5194/wes-7-2457-2022, 2022.
Larsén, X. G., Ott, S., Badger, J., Hahmann, A. N., and Mann, J.: Recipes for Correcting the Impact of Effective Mesoscale Resolution on the Estimation of Extreme Winds, Journal of Applied Meteorology and Climatology, 51, 521–533, https://doi.org/10.1175/JAMC-D-11-090.1, 2012.
Larsén, X. G., Du, J., Bolaños, R., Imberger, M., Kelly, M. C., Badger, M., and Larsen, S.: Estimation of offshore extreme wind from wind-wave coupled modeling, Wind Energy, 22, 1043–1057, https://doi.org/10.1002/we.2339, 2019.
Larson, J., Jacob, R., and Ong, E.: The Model Coupling Toolkit: A New Fortran90 Toolkit for Building Multiphysics Parallel Coupled Models, International Journal of High Performance Computing Applications, 19, 277–292, https://doi.org/10.1177/1094342005056115, 2005.
Li, J., Li, Z., Jiang, Y., and Tang, Y.: Typhoon Resistance Analysis of Offshore Wind Turbines: A Review, Atmosphere, 13, 451, https://doi.org/10.3390/atmos13030451, 2022.
Li, S. and Chen, C.: Air-sea interaction processes during hurricane Sandy: Coupled WRF-FVCOM model simulations, Progress in Oceanography, 206, 102855, https://doi.org/10.1016/j.pocean.2022.102855, 2022.
Liu, N., Ling, T., Wang, H., Zhang, Y., Gao, Z., and Wang, Y.: Numerical Simulation of Typhoon Muifa (2011) Using a Coupled Ocean-Atmosphere-Wave-Sediment Transport (COAWST) Modeling System, Journal of Ocean University of China, 14, 199–209, https://doi.org/10.1007/s11802-015-2415-5, 2015.
Marks, F. D., Black, P. G., Montgomery, M. T., and Burpee, R. W.: Structure of the Eye and Eyewall of Hurricane Hugo (1989), Monthly Weather Review, 136, 1237–1259, https://doi.org/10.1175/2007MWR2073.1, 2008.
Martín del Campo, J. O., Pozos-Estrada, A., and Pozos-Estrada, O.: Development of fragility curves of land-based wind turbines with tuned mass dampers under cyclone and seismic loading, Wind Energy, 24, 737–753, https://doi.org/10.1002/we.2600, 2021.
Marvel, K., Kravitz, B., and Caldeira, K.: Geophysical limits to global wind power, Nature Climate Change, 3, 118–121, https://doi.org/10.1038/nclimate1683, 2013.
McElman, S., Verma, A. S., and Goupee, A.: Quantifying tropical-cyclone-generated waves in extreme-value-derived design for offshore wind, Wind Energ. Sci., 10, 1529–1550, https://doi.org/10.5194/wes-10-1529-2025, 2025.
Mlawer, E. J., Taubman, S. J., Brown, P. D., Iacono, M. J., and Clough, S. A.: Radiative transfer for inhomogeneous atmospheres: RRTM, a validated correlated-k model for the longwave, Journal of Geophysical Research: Atmospheres, 102, 16663–16682, https://doi.org/10.1029/97JD00237, 1997.
Mooney, P. A., Gill, D. O., Mulligan, F. J., and Bruyère, C. L.: Hurricane simulation using different representations of atmosphere–ocean interaction: the case of Irene (2011), Atmospheric Science Letters, 17, 415–421, https://doi.org/10.1002/asl.673, 2016.
Mooney, P. A., Mulligan, F. J., Bruyère, C. L., Parker, C. L., and Gill, D. O.: Investigating the performance of coupled WRF-ROMS simulations of Hurricane Irene (2011) in a regional climate modeling framework, Atmospheric Research, 215, 57–74, https://doi.org/10.1016/j.atmosres.2018.08.017, 2019.
Morin, G., Boudreault, M., and García-Franco, J. L.: A Global Multi-Source Tropical Cyclone Precipitation (MSTCP) Dataset, Scientific Data, 11, 609, https://doi.org/10.1038/s41597-024-03395-w, 2024.
Mudd, L. A. and Vickery, P. J.: Gulf of Mexico Hurricane Risk Assessment for Offshore Wind Energy Sites, Wind Energ. Sci. Discuss. [preprint], https://doi.org/10.5194/wes-2024-123, in review, 2024.
Mukherjee, P. and Ramakrishnan, B.: On the understanding of very severe cyclone storm Ockhi with the WRF-ARW model, Environmental Research: Climate, 1, 015002, https://doi.org/10.1088/2752-5295/ac6adb, 2022.
Müller, S., Larsén, X. G., and Verelst, D. R.: Tropical cyclone low-level wind speed, shear, and veer: sensitivity to the boundary layer parametrization in the Weather Research and Forecasting model, Wind Energ. Sci., 9, 1153–1171, https://doi.org/10.5194/wes-9-1153-2024, 2024.
Nakanishi, M. and Niino, H.: An Improved Mellor–Yamada Level-3 Model: Its Numerical Stability and Application to a Regional Prediction of Advection Fog, Boundary-Layer Meteorology, 119, 397–407, https://doi.org/10.1007/s10546-005-9030-8, 2006.
NDBC: Handbook of Automated Data Quality Control Checks and Procedures, 78, National Data Buoy Center, https://cdn.ioos.noaa.gov/media/2017/12/ndbc_handbook_automated_data_quality_control_2009.pdf (last access: 25 February 2025), 2009.
NDBC: Handbook of Automated Data Quality Control Checks and Procedures, 50, National Data Buoy Center, https://www.ndbc.noaa.gov/publications/NDBCHandbookofAutomatedDataQualityControl2023.pdf (last access: 25 February 2025), 2023.
Nie, Y. and Sun, J.: Evaluation of High-Resolution Precipitation Products over Southwest China, Journal of Hydrometeorology, 21, 2691–2712, https://doi.org/10.1175/JHM-D-20-0045.1, 2020.
Oost, W. A., Komen, G. J., Jacobs, C. M. J., and Van Oort, C.: New evidence for a relation between wind stress and wave age from measurements during ASGAMAGE, Boundary-Layer Meteorology, 103, 409–438, https://doi.org/10.1023/A:1014913624535, 2002.
Pan, Y., Yan, C., and Archer, C. L.: Precipitation reduction during Hurricane Harvey with simulated offshore wind farms, Environmental Research Letters, 13, 084007, https://doi.org/10.1088/1748-9326/aad245, 2018.
Petrović, V. and Bottasso, C. L.: Wind turbine optimal control during storms, Journal of Physics: Conference Series, 012052, https://doi.org/10.1088/1742-6596/524/1/012052, 2014.
Porchetta, S., Temel, O., Muñoz-Esparza, D., Reuder, J., Monbaliu, J., van Beeck, J., and van Lipzig, N.: A new roughness length parameterization accounting for wind–wave (mis)alignment, Atmos. Chem. Phys., 19, 6681–6700, https://doi.org/10.5194/acp-19-6681-2019, 2019.
Porchetta, S., Temel, O., Warner, J. C., Muñoz-Esparza, D., Monbaliu, J., van Beeck, J., and van Lipzig, N.: Evaluation of a roughness length parametrization accounting for wind–wave alignment in a coupled atmosphere–wave model, Quarterly Journal of the Royal Meteorological Society, 147, 825–846, https://doi.org/10.1002/qj.3948, 2020.
Porchetta, S., Muñoz-Esparza, D., Munters, W., van Beeck, J., and van Lipzig, N.: Impact of ocean waves on offshore wind farm power production, Renewable Energy, 180, 1179–1193, https://doi.org/10.1016/j.renene.2021.08.111, 2021.
Powell, M. D. and Reinhold, T. A.: Tropical Cyclone Destructive Potential by Integrated Kinetic Energy, Bulletin of the American Meteorological Society, 88, 513–526, https://doi.org/10.1175/BAMS-88-4-513 , 2007.
Pryor, S. C. and Barthelmie, R. J.: A global assessment of extreme wind speeds for wind energy applications, Nature Energy, 6, 268–276, https://doi.org/10.1038/s41560-020-00773-7, 2021.
Pryor, S. C. and Barthelmie, R. J.: Wind shadows impact planning of large offshore wind farms, Applied Energy, 359, 122755, https://doi.org/10.1016/j.apenergy.2024.122755, 2024a.
Pryor, S. C. and Barthelmie, R. J.: Power Production, Inter-and Intra-Array Wake Losses from the US East Coast Offshore Wind Energy Lease Areas, Energies, 17, 1063, https://doi.org/10.3390/en17051063, 2024b.
Pryor, S. C., Barthelmie, R. J., and Shepherd, T. J.: Wind power production from very large offshore wind farms, Joule, 5, 2663–2686, https://doi.org/10.1016/j.joule.2021.09.002, 2021.
Riehl, H. and Malkus, J.: Some Aspects of Hurricane Daisy, 1958, Tellus, 13, 181–213, https://doi.org/10.3402/tellusa.v13i2.9495, 1961.
Rose, S., Jaramillo, P., Small, M. J., Grossmann, I., and Apt, J.: Hurricane Risk to Offshore Wind Turbines Along the U. S. Coast, Carnegie Mellon University, https://www.cmu.edu/ceic/assets/docs/publications/working-papers/ceic-12-01.pdf (last access: 25 February 2025), 2012a.
Rose, S., Jaramillo, P., Small, M. J., Grossmann, I., and Apt, J.: Quantifying the hurricane risk to offshore wind turbines, Proceedings of the National Academy of Sciences USA, 109, 3247–3252, https://doi.org/10.1073/pnas.1111769109, 2012b.
Schreck III, C. J., Klotzbach, P. J., and Bell, M. M.: Optimal Climate Normals for North Atlantic Hurricane Activity, Geophysical Research Letters, 48, https://doi.org/10.1029/2021GL092864, 2021.
Shchepetkin, A. F. and McWilliams, J. C.: The regional oceanic modeling system (ROMS): a split-explicit, free-surface, topography-following-coordinate oceanic model, Ocean Modelling, 9, 347–404, https://doi.org/10.1016/j.ocemod.2004.08.002, 2005.
Shchepetkin, A. F. and McWilliams, J. C.: Correction and commentary for “Ocean forecasting in terrain-following coordinates: Formulation and skill assessment of the regional ocean modeling system” by Haidvogel et al., J. Comp. Phys. 227, pp. 3595–3624, Journal of Computational Physics, 228, 8985–9000, https://doi.org/10.1016/j.jcp.2009.09.002, 2009.
Skamarock, W. C.: Evaluating Mesoscale NWP Models Using Kinetic Energy Spectra, Monthly Weather Review, 132, 3019–3032, https://doi.org/10.1175/MWR2830.1, 2004.
Skamarock, W. C., Klemp, J. B., Dudhia, J., Gill, D. O., Liu, Z., Berner, J., Wang, W., Powers, J. G., Duda, M. G., Barker, D. M., and Huang, X.-Y.: A Description of the Advanced Research WRF Version 4, 162, National Center for Atmospheric Research, https://opensky.ucar.edu/islandora/object/technotes:576 (last access: 25 February 2025), 2019.
Stewart, G. M. and Lackner, M. A.: The impact of passive tuned mass dampers and wind–wave misalignment on offshore wind turbine loads, Engineering Structures, 73, 54–61, https://doi.org/10.1016/j.engstruct.2014.04.045, 2014.
Taft, B., Burdette, M., Riley, R., Hansen, B., Wells, W., Maxwell, D., and Mettlach, T.: Development of an NDBC standard buoy, OCEANS 2009, 1–10, https://doi.org/10.23919/OCEANS.2009.5422444, 2009.
Taylor, P. K. and Yelland, M. J.: The dependence of Sea Surface Roughness on the Height and Steepness of the Waves, Journal of Physical Oceanography, 31, 572–590, https://doi.org/10.1175/1520-0485(2001)031<0572:TDOSSR>2.0.CO;2, 2001.
Tewari, M., Chen, F., Wang, W., Dudhia, J., LeMone, M. A., Mitchell, K., Ek, M., Gayno, G., Wegiel, J., and Cuenca, R. H.: Implementation and verification of the unified Noah land surface model in the WRF model (Formerly Paper Number 17.5), Proceedings of the 20th Conference on Weather Analysis and Forecasting/16th Conference on Numerical Weather Prediction, Seattle, WA, USA, 6 pp., https://ams.confex.com/ams/84Annual/techprogram/paper_69061.htm (last access: 25 February 2025), 2004.
Thompson, K. B., Barthelmie, R. J., and Pryor, S. C.: Hurricane impacts in the U.S. East Coast offshore wind energy lease areas, Zenodo [data set], https://doi.org/10.5281/zenodo.14895862, 2025.
United States Geological Survey: COAWST, GitHub [code], https://github.com/DOI-USGS/COAWST (last access: 5 February 2024), 2019.
Valamanesh, V., Myers, A. T., Hajjar, J. F., and Arwade, S. R.: Probabilistic Modeling of Joint Hurricane-induced Wind and Wave Hazards to Offshore Wind Farms on the Atlantic Coast, International Conference on Structural Safety and Reliability (ICOSSAR), Columbia University, New York, NY, https://people.umass.edu/~arwade/owt_hurricanes/valamanesh_myers_hajjar.pdf (last access: 25 February 2025), 2013.
Valamanesh, V., Myers, A. T., and Arwade, S. R.: Multivariate analysis of extreme metocean conditions for offshore wind turbines, Structural Safety, 55, 60–69, https://doi.org/10.1016/j.strusafe.2015.03.002, 2015.
Wang, J., Hendricks, E., Rozoff, C. M., Churchfield, M., Zhu, L., Feng, S., Pringle, W. J., Biswas, M., Haupt, S. E., Deskos, G., Jung, C., Xue, P., Berg, L. K., Bryan, G., Kosovic, B., and Kotamarthi, R.: Modeling and observations of North Atlantic cyclones: Implications for US Offshore wind energy, Journal of Renewable and Sustainable Energy, 16, https://doi.org/10.1063/5.0214806, 2024.
Warner, J. C., Perlin, N., and Skyllingstad, E. D.: Using the Model Coupling Toolkit to couple earth system models, Environmental Modelling & Software, 23, 1240–1249, https://doi.org/10.1016/j.envsoft.2008.03.002, 2008.
Warner, J. C., Armstrong, B., He, R., and Zambon, J. B.: Development of a Coupled Ocean–Atmosphere–Wave–Sediment Transport (COAWST) Modeling System, Ocean Modelling, 35, 230–244, https://doi.org/10.1016/j.ocemod.2010.07.010, 2010.
Wiser, R., Rand, J., Seel, J., Beiter, P., Baker, E., Lantz, E., and Gilman, P.: Expert elicitation survey predicts 37 % to 49 % declines in wind energy costs by 2050, Nature Energy, 6, 555–565, https://doi.org/10.1038/s41560-021-00810-z, 2021.
Xie, L., Yan, T., Pietrafesa, L. J., Morrison, J. M., and Karl, T.: Climatology and Interannual Variability of North Atlantic Hurricane Tracks, Journal of Climate, 18, 5370–5381, https://doi.org/10.1175/JCLI3560.1, 2005.
Yihe, X.: 'Super typhoon' devastates wind farm on Chinese coast, RECHARGE, https://www.rechargenews.com/wind/super-typhoon-devastates-wind-farm-on-chinese-coast/2-1-1706161 (last access: 25 February 2025), 2024.
Zambon, J. B., He, R., and Warner, J. C.: Investigation of hurricane Ivan using the coupled ocean–atmosphere–wave–sediment transport (COAWST) model, Ocean Dynamics, 64, 1535–1554, https://doi.org/10.1007/s10236-014-0777-7, 2014a.
Zambon, J. B., He, R., and Warner, J. C.: Tropical to extratropical: Marine environmental changes associated with Superstorm Sandy prior to its landfall, Geophysical Research Letters, 41, 8935–8943, https://doi.org/10.1002/2014GL061357, 2014b.