the Creative Commons Attribution 4.0 License.
the Creative Commons Attribution 4.0 License.
 | 29 Jun 2026
Performance of reanalysis and mesoscale models off the coast of Hawai'i
Lindsay M. Sheridan
Raghavendra Krishnamurthy
Tien Manh Nguyen
Yi-Leng Chen
William I. Gustafson Jr.
Feng Hsiao
Rob K. Newsom
Preston Spicer
Evgueni Kassianov
Mikhail Pekour
Nicola Bodini
Mark Severy
The eastern Hawai'i coast in the United States is characterized by considerable wind resource fuelled by persistent trade winds, making it an important area for energy research. The need is strong for reanalyses and higher-resolution regional simulations where observations have been historically limited, such as Hawai'i's offshore environments. However, studies using offshore observations in other parts of the world have shown that significant errors can occur in reanalyses and wind datasets, which can lead to inaccurate estimates of wind energy generation, payback periods, and extreme weather risks at project locations. The degree of such errors is influenced by a number of factors, including spatial resolution and the handling of processes within the planetary boundary layer (PBL). In this work, we provide a wind resource characterization from year-long lidar buoy measurements off the eastern coast of O'ahu, Hawai'i, an environment previously unobserved at the rotor level, and use the characterization to evaluate the performance of two simulation datasets. The O'ahu deployment location is meteorologically unique and less complex than land-based wind resource characterizations, being strongly characterized by trade winds with minimal land–atmosphere interaction influences. Despite the unique and fairly consistent meteorological conditions, we hypothesize that distinct simulation datasets will exhibit diverse ranges of errors similar to those that have been seen for other offshore locations. We find the European Centre for Medium-Range Weather Forecasts (ECMWF) Reanalysis version 5 (ERA5) to strongly underestimate observed wind speeds at the O'ahu location (bias = −1.54 m s−1 at a height of 140 m above sea level), while a regional Weather Research and Forecasting Model (WRF) simulation produced by the University of Hawai'i (UH-WRF) provides a significantly smaller wind speed bias (−0.25 m s−1), highlighting the value of running regional, higher-resolution simulations. The large bias noted for ERA5 is driven by significant underestimation of fast wind speeds (>9 m s−1), which the study site is largely characterized by, along with discontinuities in the ERA5 diurnal cycle. We also speculate that the relative sparsity of observations for data assimilation in this remote part of the world could influence the performance of ERA5 and that challenges with characterizing island effects could impact the performance of both datasets.
- Article
(10883 KB) - Full-text XML
- BibTeX
- EndNote


This work was authored by the Pacific Northwest National Laboratory, operated for the US Department of Energy (DOE) by Battelle (contract no. DE-AC05-76RL01830), and in part by the National Laboratory of the Rockies for the US DOE under contract no. DE-AC36-08GO28308. The U.S. Government retains and the publisher, by accepting the article for publication, acknowledges that the U.S. Government retains a nonexclusive, paid-up, irrevocable, worldwide license to publish or reproduce the published form of this work, or allow others to do so, for U.S. Government purposes.
Simulated wind data, including long-term reanalysis models and higher-resolution wind datasets, are essential for assessing the marine boundary layer near Hawai'i and locations around the world due to the scarcity of wind observational coverage over the water. For marine energy infrastructures, such as wind turbines, many recent studies have assessed offshore wind energy potential using reanalysis models, in particular ERA5 (Hersbach et al., 2020) and the Modern-Era Retrospective analysis for Research and Applications version 2 (MERRA-2) (Gelaro et al., 2017), given their advantageous temporal and geographical coverages and their ease of data accessibility versus observational campaigns in challenging marine environments (Soares et al., 2020; Hayes et al., 2021; Nehzad et al., 2021; Soukissian et al., 2021; Cowin et al., 2023). At locations where offshore hub height wind measurements do exist, wind researchers can follow the methodology of the land-based wind industry in using measure–correlate–predict techniques, which are extensively reviewed by Carta et al. (2013), to extend the temporal coverage of the observations with reference reanalysis data. Reanalysis models also serve as the forcings for higher-resolution datasets developed to serve the wind energy community, such as Global Wind Atlas (Davis et al., 2023) and the 2023 National Offshore Wind dataset (NOW-23) (Bodini et al., 2024a).
Despite the wide applicability and need for simulated wind datasets, such products contain inaccuracies with respect to observations that can lead to significant errors in parameters relevant to wind energy researchers and developers, such as the annual and long-term average wind speed, seasonal and diurnal trends in wind speed, and occurrences of weather-driven events like wind ramps. Therefore, assessing and disseminating the performance of simulated datasets in previously unstudied locations are necessary for understanding the risks of wind resource estimation and enabling the adjustment of estimates as a means of improving accuracy. Due to the difficulty of collecting wind measurements over open water, validations of reanalysis models and wind resource datasets are limited for offshore environments, particularly at heights relevant to offshore wind turbine rotor layers, which on average covered heights between 32 and 216 m for turbines installed globally in 2023 (McCoy et al., 2024). However, floating lidar technology and tall meteorological towers deployed on offshore platforms have increased opportunities to validate models and datasets in areas of deep-water energy developments.
With the increasing availability (though still a relatively small sample) of offshore rotor-level observations, studies have emerged over recent years comparing the performance of multiple simulation datasets at turbine rotor heights in offshore locations with the aims of aiding analysts in selecting the optimal datasets for resource assessments and highlighting areas for accuracy improvement for dataset developers. These studies have shown significant differences in performance across simulations being validated at a single offshore location, and in some cases one simulation product can be the best performer for one error metric (bias, correlation, mean absolute error, etc.) and the worst performer for another metric. A variety of wind performance studies have evaluated ERA5 and note that the reanalysis tends to underestimate observed wind speeds (Kalverla et al., 2020, over the North Sea; Sheridan et al., 2020, off the eastern coast of the United States; Pronk et al., 2022, and Fragano and Colle, 2025, off the eastern coast of the United States; Sheridan et al., 2022, off the western coast of the United States). Several offshore studies find that higher-resolution datasets improve upon ERA5 in terms of wind speed bias (Kalverla et al., 2020, examining the Dutch Offshore Wind Atlas; Pronk et al., 2022, examining the Wind Integration National Dataset Toolkit Long-term Ensemble Dataset (WTK-LED); Fragano and Colle, 2025, examining NOW-23) but note that ERA5 outperforms the higher-resolution datasets according to other error metrics or wind field characteristics.
Variations across wind simulations for performance metrics like bias and correlation occur for a number of reasons. In their evaluation of reanalysis products, Ramon et al. (2019) found that the lowest correlations for wind speeds compared with global tall tower observations corresponded to the coarsest-resolution grids. Similarly, Kalverla et al. (2020) attributed ERA5's underestimation of observed offshore wind ramps to limitations in the model representation of the small-scale structures responsible for ramps, which are physically smaller than the ERA horizontal resolution. Sheridan et al. (2022) noted that the high correlation of the Rapid Refresh model with offshore California observations was at least partly due to the model's higher resolution and therefore better ability at resolving coastal features and phenomena that coarser models miss. Pronk et al. (2022) determined that the preliminary Weather Research and Forecast (WRF) model simulations for WTK-LED outperformed ERA5 in terms of bias at an onshore site and an offshore site in the United States but found the opposite behaviour for centred root-mean-square error (CRMSE). Pronk et al. (2022) suspected that the underperformance of WTK-LED for CRMSE is due to WTK-LED's exaggeration of the diurnal cycle of wind speeds at both study sites, especially the onshore location. Bodini et al. (2024b) tested two PBL schemes in simulations off the coast of California using lidar buoy observations and established that using the Mellor–Yamada–Nakanishi–Niino (MYNN) scheme overestimated stability compared with observations and simulations using the Yonsei University (YSU) scheme, resulting in overestimation of offshore wind speeds and the selection of YSU as the PBL scheme for the NOW-23 South Pacific region.
To address the need for wind resource characterization and model validation in offshore environments, the US Department of Energy (DOE) has collaborated with the Bureau of Ocean Energy Management (BOEM) to deploy multiple buoy-mounted research lidars in locations that had not previously been observed at relevant heights for deep-water energy development. In late 2022, one of the lidar buoys was deployed off the eastern shore of O'ahu to gather meteorological and oceanographic observations (Appendix A). The O'ahu lidar buoy deployment lasted a period of 1 year, which captured a full seasonal cycle of marine boundary layer observations. In addition to the onboard lidar, the buoy was equipped with a suite of surface meteorological and oceanic instruments to produce a more complete analysis of atmospheric and oceanic impacts on the wind resource.
With the knowledge in mind that no simulated dataset will perfectly replicate wind observations, we conjecture that some datasets will perform better than others in representing the wind resource at the previously unstudied buoy deployment location off O'ahu, leading to recommended use cases of these products for analysts in the wind energy community. While many of the previous wind validations have occurred in marine locations regularly influenced by nearby land–atmosphere interactions, like sea breezes and low-level jets, this study presents a unique look into model performance at the rotor level in a trade-wind-dominant environment. Our analysis evaluates the successes and challenges of two diverse datasets in representing the observed winds from the Hawai'i lidar buoy deployment. To set the stage for the validation, we begin in Sect. 2 with a discussion of the observed meteorological findings from the lidar buoy and then describe each wind dataset and the methods for evaluation. Section 3 provides the assessment of two datasets that temporally overlap with the lidar buoy deployment: the reanalysis ERA5 and a regional WRF simulation produced by the University of Hawai'i, UH-WRF. This section uses the concurrent observations and estimates to quantify the simulation performance for wind shear, wind speed class, and various meteorological phenomena that occurred during the deployment. Finally, Sect. 4 synthesizes the results from the wind speed evaluations to assess their implications for modelling atmospheric dynamics and boundary layer processes. The section concludes with insights into improving model accuracy and representation of complex atmospheric phenomena, offering guidance for refining simulation techniques and observational strategies in unstudied regions. The paper also provides Appendix A, which reports on the recovery, quality, and processing of the data from the Hawai'i deployment.
To set the stage for assessing the performance of reanalysis and mesoscale models using lidar buoy observations in a new offshore location, the next sections present an overview of the buoy observations, a brief characterization of the local wind resource, descriptions of the models that are validated, and the procedure for establishing model performance success.
2.1 Buoy observations
DOE owns multiple AXYS WindSentinel™ buoys, including the buoy deployed for resource assessment off the coast of O'ahu, which is outfitted with a Leosphere Windcube v2 lidar system and surface meteorological and oceanographic instruments (Fig. 1). While the DOE buoy observations during the Hawai'i deployment are discussed extensively in Appendix A, we provide the key characteristics of the lidar wind measurements to set a baseline for comparison with the wind datasets. Many of the observed characteristics are also found throughout the results to provide context for the evaluations of wind dataset performance. The DOE buoy was deployed approximately 25 km off the coast of O'ahu between 1 December 2022 and 15 December 2023 (DOE, 2025a, b, c) (Fig. 1). This study focuses on the wind data measured by the lidar aboard the buoy every 20 m between 60 and 240 m. Following the quality control performed as discussed in Appendix A, lidar data recovery for the deployment period is 98 % or higher for all heights between 60 and 240 m.
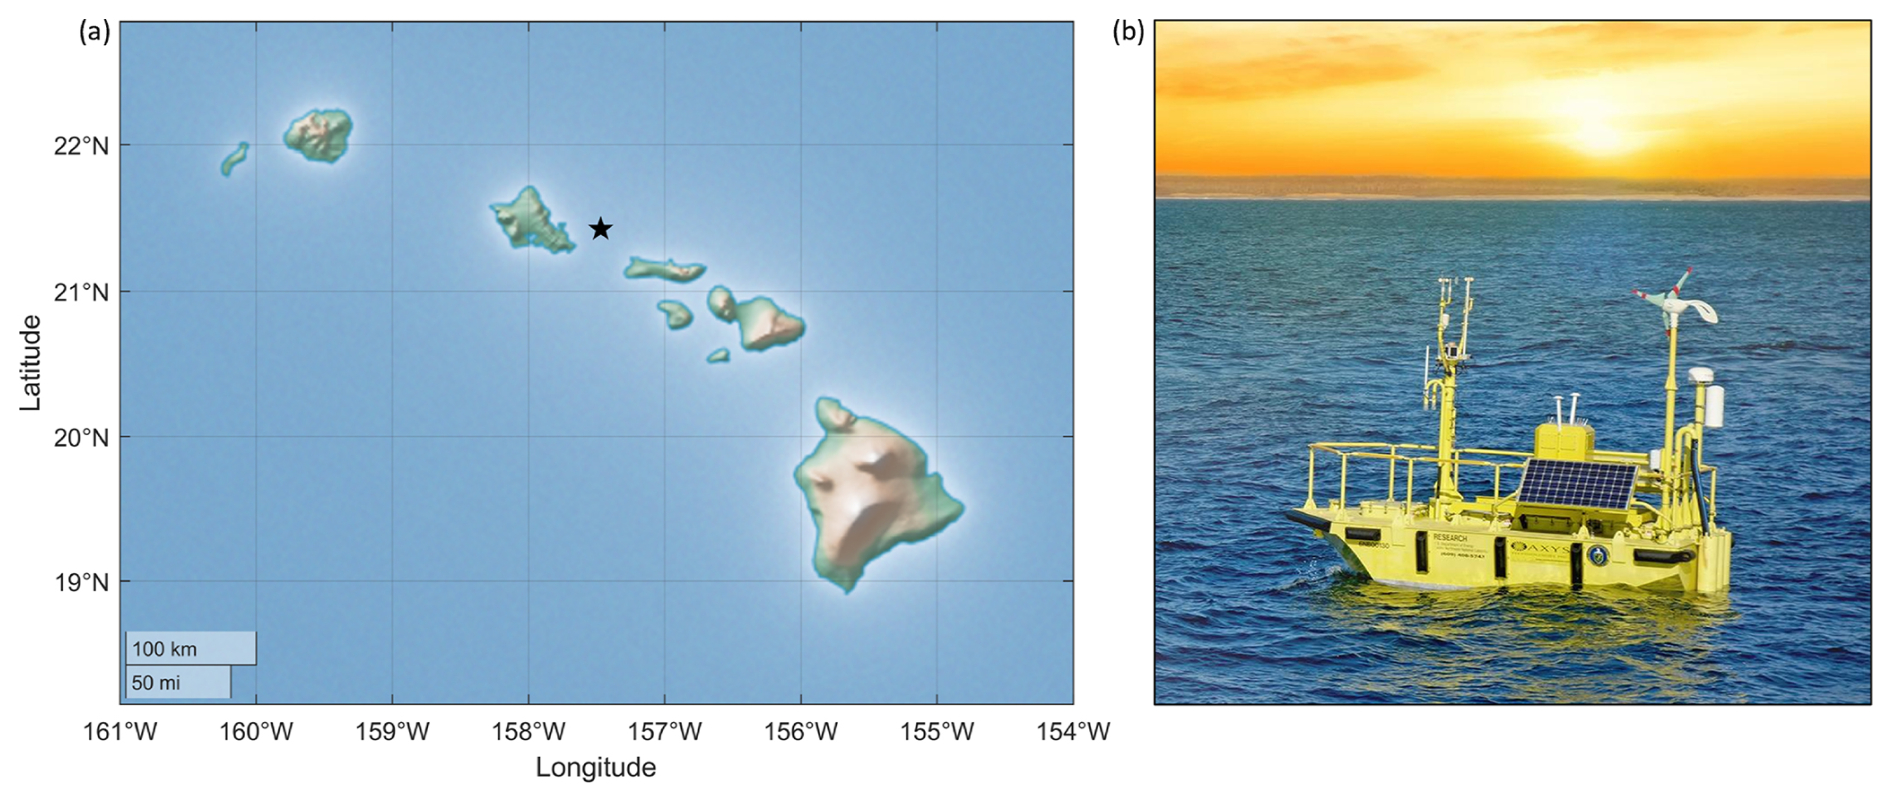
Figure 1(a) Map of location of the Hawai'i DOE lidar buoy deployment (indicated by the star). (b) Photo of one of the DOE lidar buoys by Ocean Tech Services, LLC, and the Pacific Northwest National Laboratory.
2.2 Local wind characterization
For the overlapping period covering the buoy deployment, ERA5 and UH-WRF (1 January–15 December 2023) annual average wind speeds range from 8.87 m s−1 at 60 m to 9.34 m s−1 at 240 m, with very little shear across the profile (Fig. 2a). The observed winds predominantly originate from the east-northeast, with very little veer across the profile (Fig. 2b). The observed 2023 seasonal and diurnal variations in the lidar wind speeds are presented in detail in Sect. 3.1, but briefly, significant variation is noted for the month-by-month transitions (Fig. 2c), while the diurnal wind speed cycle transitions smoothly from hour to hour (Fig. 2d).
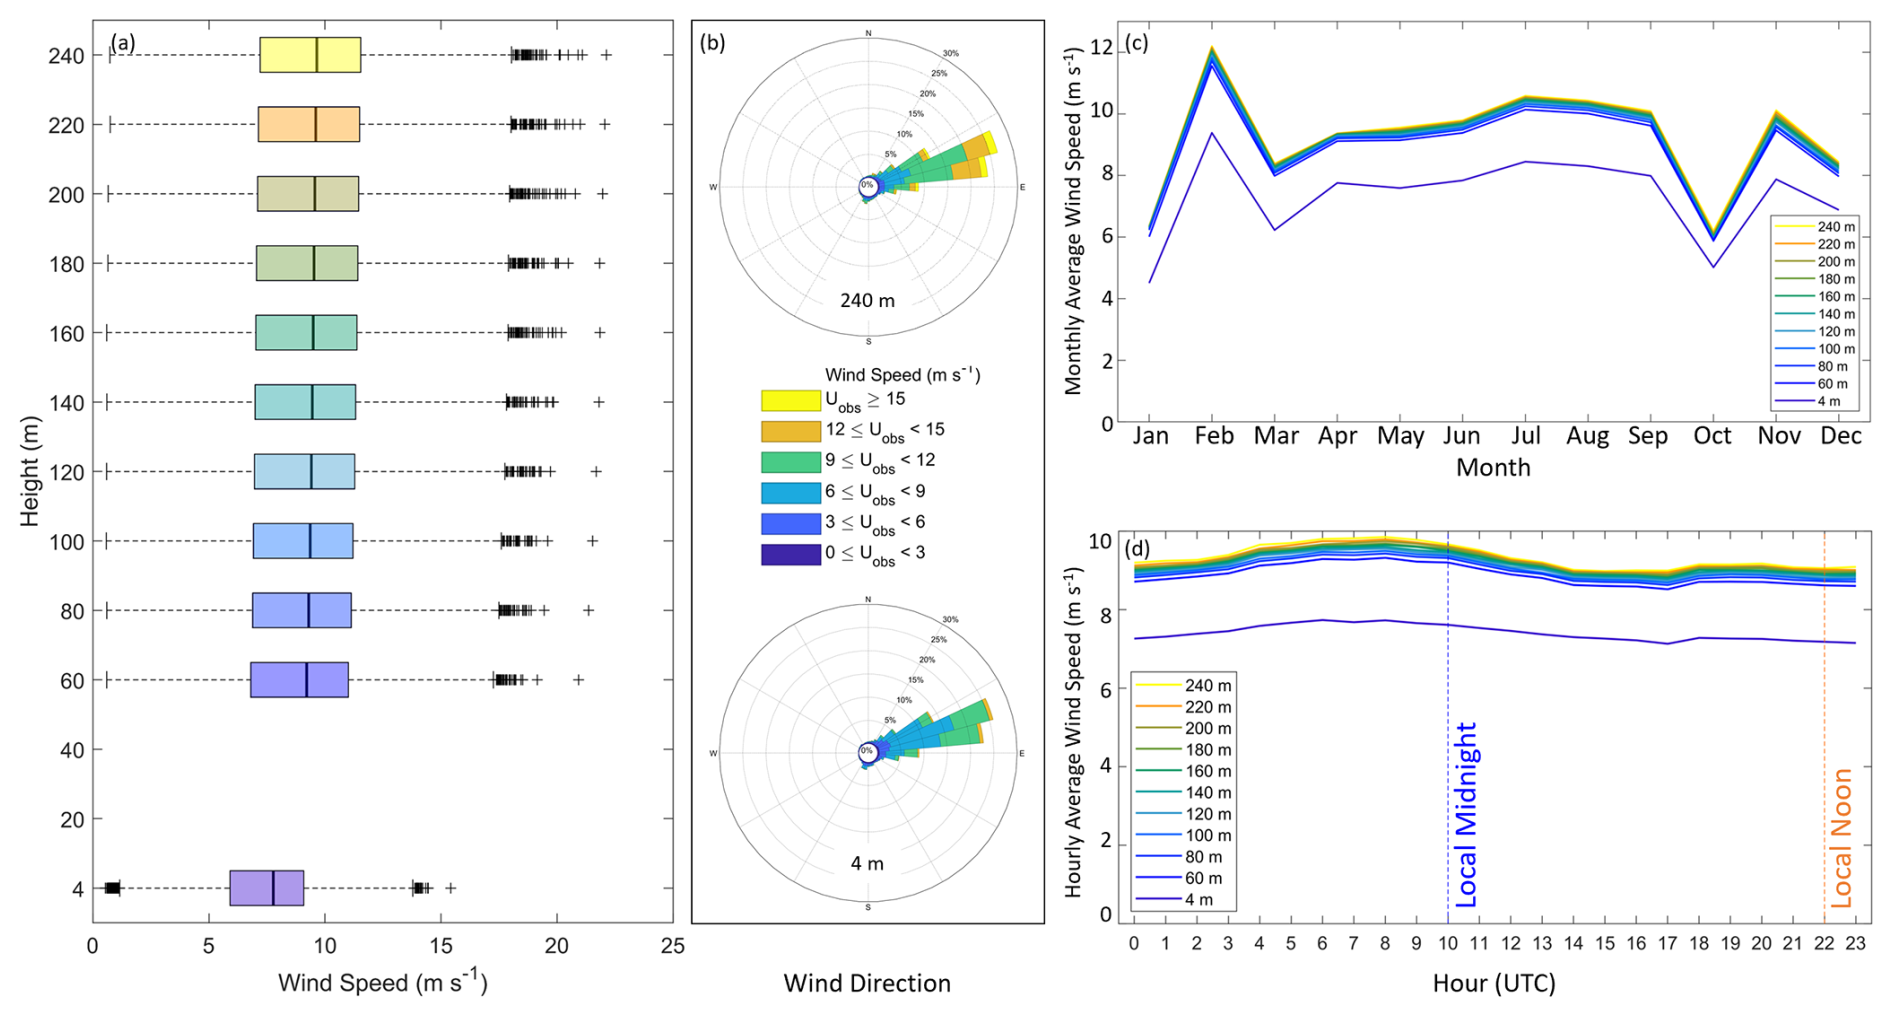
Figure 2Observed (a) wind speed, (b) wind direction, (c) monthly average wind speed, and (d) hourly average wind speed by height a.s.l. from the Hawai'i lidar buoy during 1 January 2023–15 December 2023. Measurements at 60 m and higher come from the onboard lidar system (DOE, 2025a), while measurements at 4 m come from the onboard surface meteorological station (DOE, 2025b).
2.3 Models and datasets
Reanalysis models support wind energy analysis in a variety of ways, including providing wind resource assessments and serving as the boundary conditions for higher-resolution modelling efforts. The global geographic coverage and long-term continuously updating temporal coverage of ERA5 allow for widespread use and validation (Table 1). ERA5 is developed by ECMWF, and the hourly data on the lowest 9 of 137 model levels are used in this study (CDS, 2025a). Data assimilation is performed using a 12 h 4D-Var ensemble (Hersbach et al., 2020).
Table 1Characteristics of wind assessment products evaluated in this analysis.
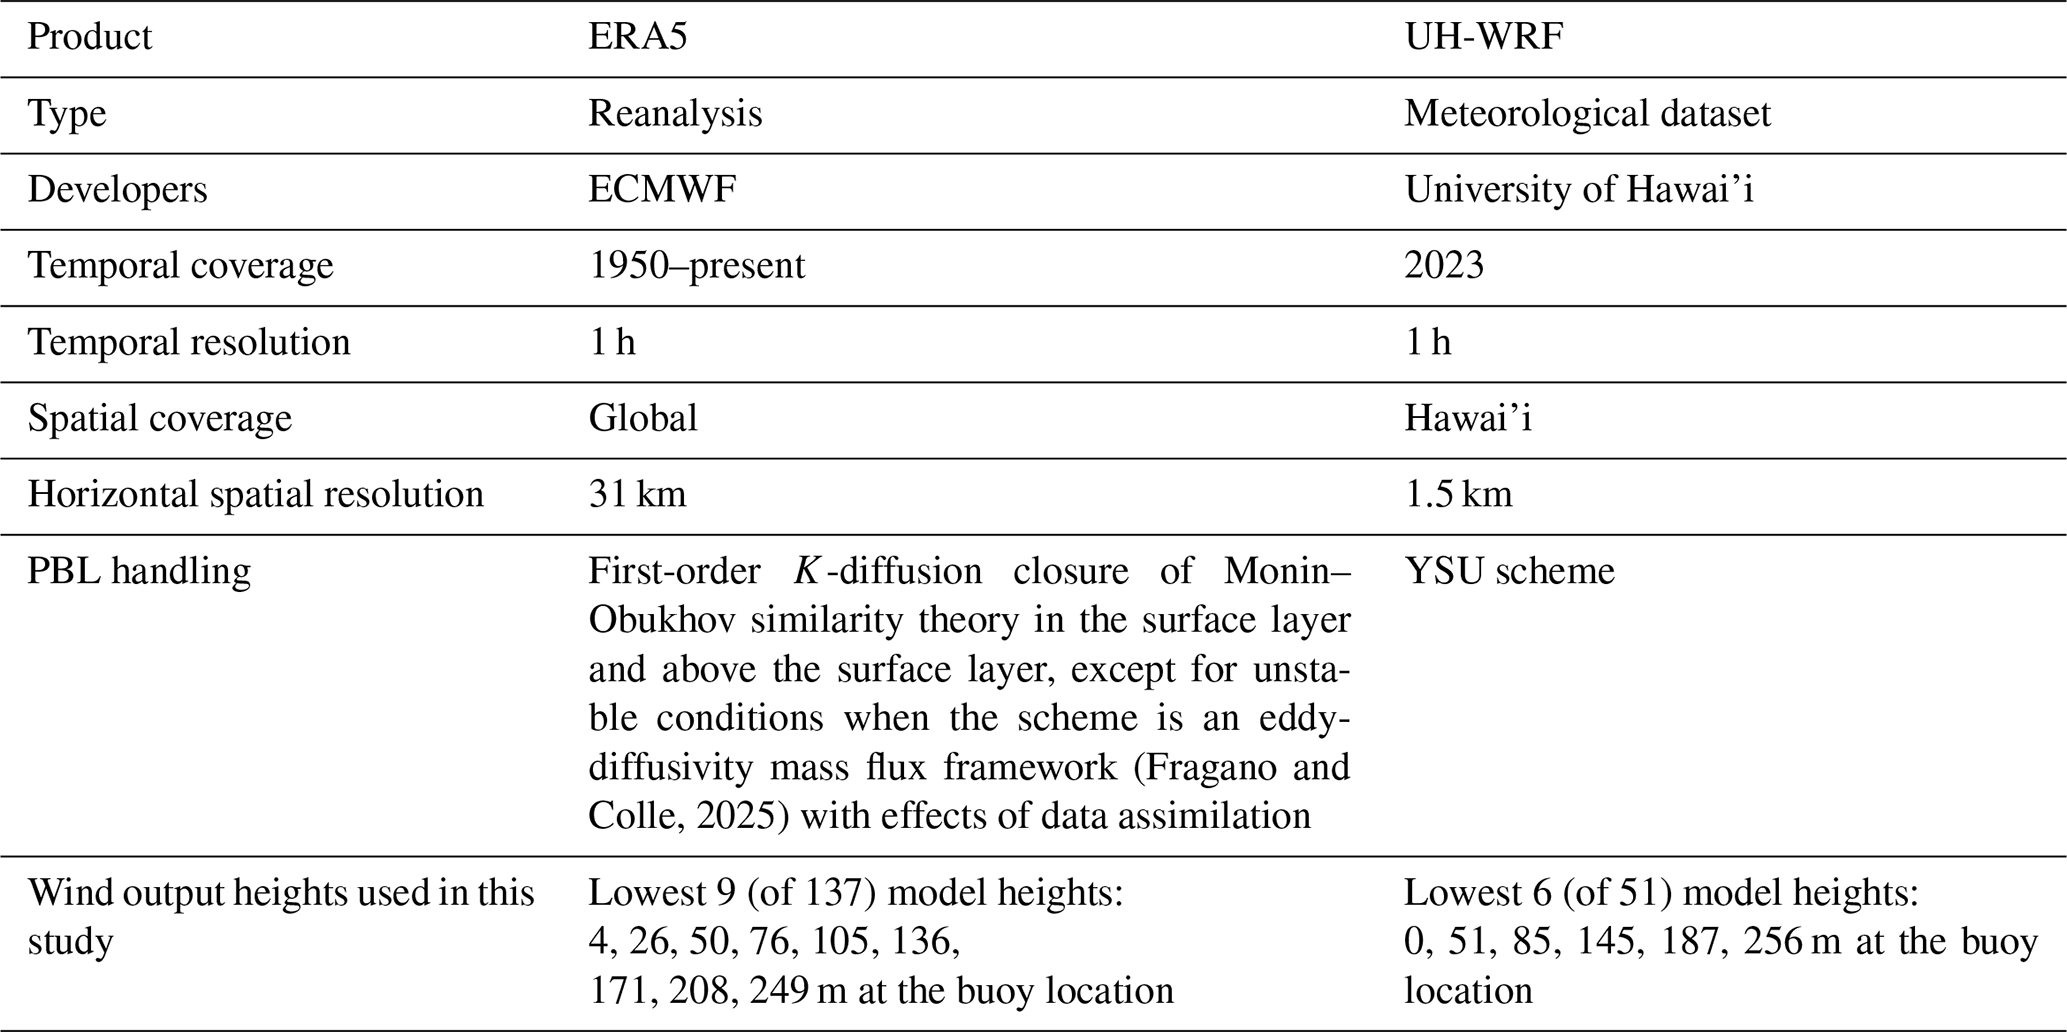
The University of Hawai'i produced a year-long (2023) WRF v4.6.0 simulation (UH-WRF), with the innermost domain covering the islands of Maui, Lanai, Moloka'i, and O'ahu (Table 1). The key configurations include the WRF single-moment six-class microphysics scheme for representing the cloud microphysical processes, the Betts–Miller–Janjic cumulus parameterization for convective processes in the regional domain, the Rapid Radiative Transfer Model for global circulation models for longwave and shortwave radiation, the Noah land-surface model, and the YSU planetary boundary layer (PBL) scheme (Hsiao et al., 2020, 2021). The lowest 6 of 51 model levels from UH-WRF are evaluated in this study at hourly resolution. UH-WRF was initialized daily using ERA5 data beginning at 00:00 UTC each day with simulation hours t=0–35. The land surface data, including terrain, soil type, ground vegetation cover, and soil moisture were updated following the procedures described by Zhang et al. (2005) and Hsiao et al. (2020). The model spinup time occurred between t=0–11. For this analysis, we build the UH-WRF time series using forecast hours t=12–35.
2.4 Validation methodology
To assess the performance of the ERA5 and UH-WRF models in representing the observed wind speeds from the lidar buoy, the bias, correlation, and CRMSE are determined for the N timestamps that the observed wind speeds (Uobs) and simulated wind speeds (Usim) from both datasets are available to ensure a consistent comparison. The wind speed bias provides a gauge of whether the models tend to overestimate (positive bias), underestimate (negative bias), or accurately represent (zero bias) the observed wind speeds. The Pearson correlation coefficient explains the degree to which the simulated and observed wind speeds are linearly related, with values near 1 indicative of a high degree of correlation. The CRMSE portrays the degree of variation in error between the simulated and observed wind speeds, with larger values indicating larger errors.
To explore the performance of the ERA5 and UH-WRF models in representing key characteristics of the marine atmospheric boundary layer at the location of the Hawai'i lidar buoy deployment, the simulation datasets must be spatially aligned with the measurements. Vertically, the model-level wind speeds are adjusted to the observed near-surface (4 m) and lidar output heights (every 20 m between 60 and 240 m), z, using the power law (Eq. 2), with the wind shear exponent α (Eq. 1) calculated at every timestamp using the surrounding model heights zlo and zhi and the associated wind speeds ulo and uhi. The performance analysis of ERA5 and UH-WRF considers the entire wind profile up to 240 m (the limit of the lidar observations) along with a focused investigation at a single height, 140 m a.s.l. The wind datasets selected for evaluation range widely in terms of horizontal spatial resolution, from 1.5 km (UH-WRF) to approximately 27 km at the location of the buoy deployment (ERA5) (Table 1). For each dataset, we perform inverse distance weighting on the atmospheric variables to localize them to the location of the lidar buoy. For reference, the nearest grid points to the buoy location are at distances of 0.9 km (UH-WRF) and 10 km (ERA5). The four surrounding UH-WRF grid points to the buoy are at distances of 21–24 km from the nearest coastline (O'ahu). The four surrounding ERA5 grid points to the buoy are at distances of 3 km (Moloka'i), 17 km (O'ahu), 24 km (O'ahu), and 31 km (Moloka'i) from the nearest coastline.
Prior to comparing the O'ahu observations, which predominantly occur in the year 2023, with atmospheric datasets, it is imperative to provide context on what kind of meteorological year 2023 is relative to the long-term interannual wind speed variability noted at the deployment location. Utilising annual averages of the Oceanic Niño Index (ONI), we find that 2023 is categorized as an El Niño year based on the Climate Prediction Center's threshold of ±0.5 °C (Fig. 3a) (NOAA, 2025). In Fig. 3b, we explore the annual average ERA5 100 m wind speeds (CDS, 2025b) between 1985 and 2024 and determine that 2022 and 2023 are tied for having the lowest annual average wind speeds over the 40-year period (annual average wind speeds normalized by the 40-year mean for both years = 0.88), while being opposingly classified as La Niña and El Niño years, respectively (Fig. 3a). According to ERA5, precipitation and 2 m temperature are above average at the buoy location for the year 2023 (Fig. 3c, d). The above-average precipitation, temperature, and weakening of the trade winds are consistent with expected El Niño characteristics (Lu et al., 2020).
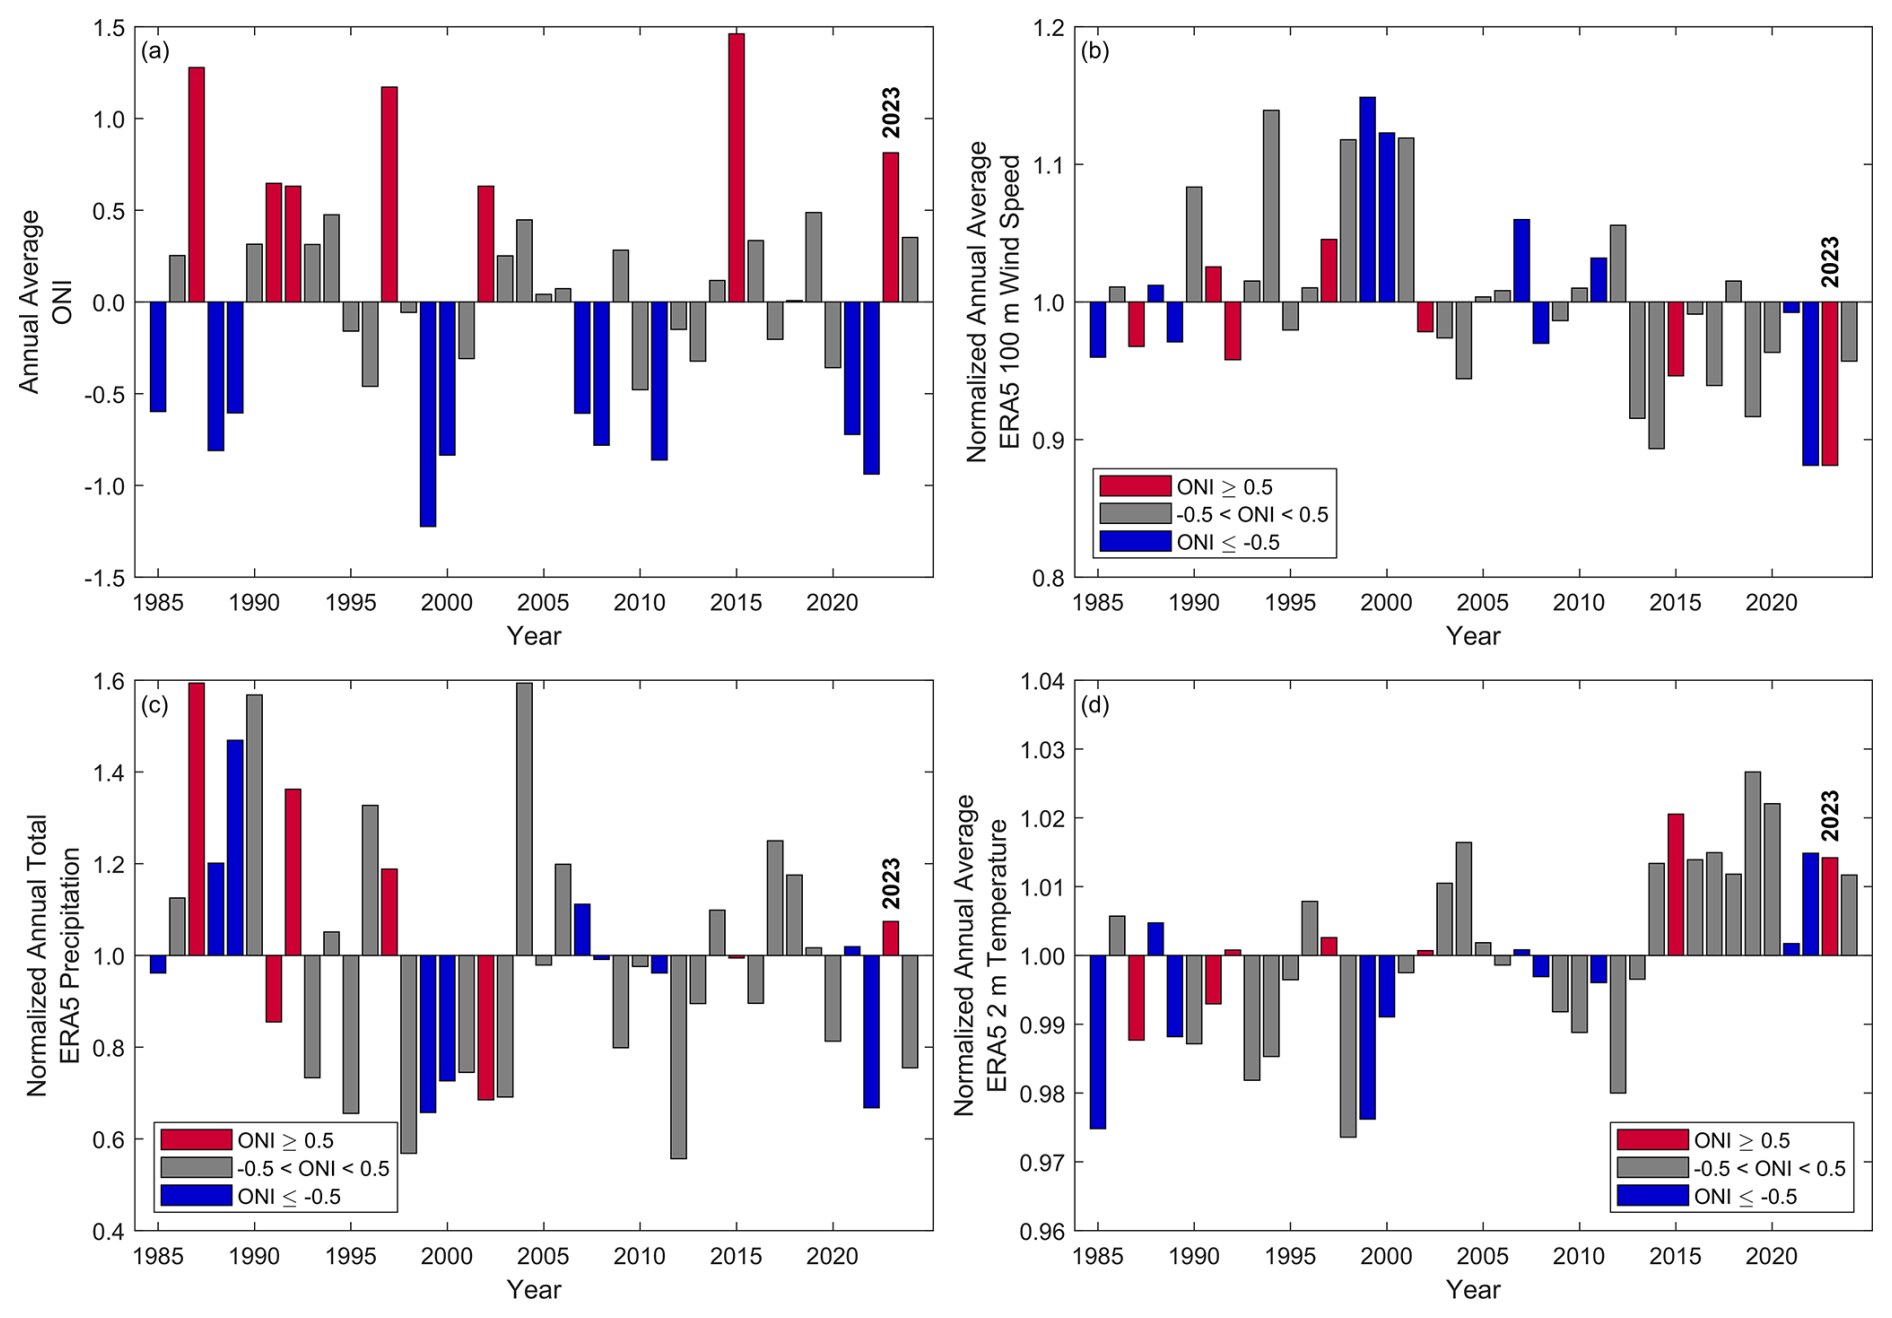
Figure 3(a) Annual average ONI, (b) normalized annual average 100 m wind speed from ERA5, (c) normalized annual total precipitation from ERA5, and (d) normalized annual average 2 m temperature from ERA5 over the 40-year period between 1985 and 2024 coloured by the annual average ONI. The annual average wind speeds are normalized by the 40-year average wind speed at the O'ahu buoy deployment location.
The following analyses focus on the performance of two simulation datasets that have concurrent temporal coverage with the 2023 observations: ERA5 and UH-WRF. Given the context of 2023 being a record-low wind resource year east of O'ahu according to the ERA5 record, it is important to note the need for long-term, continuously updating datasets like reanalyses. Purpose-built wind datasets, like NOW-23 (2000–2019) and Global Wind Atlas (2008–2017), provide numerous years for wind resource assessment but would not represent the characteristics of an atypical year like 2023.
3.1 Annual, seasonal, and diurnal performance
During the nearly year-long overlapping period of the buoy deployment with UH-WRF and ERA5 (1 January 2023–15 December 2023), ERA5 underestimates the observed wind speeds across the profile, with biases ranging from −1.52 to −1.54 m s−1 (−1.54 m s−1 at 140 m) (Fig. 4). The distribution of wind speeds shows ERA5 having consistently fewer occurrences of stronger wind speeds and more frequent slower speeds. UH-WRF underestimates the observed wind speeds across the profile as well but to a lesser degree, with biases ranging from −0.24 to −0.29 m s−1 (−0.25 m s−1 at 140 m) (Fig. 4). The wind speed distribution in this case also shows a greater likelihood of too many slow-wind-speed occurrences, but unlike ERA5, UH-WRF captures the more extreme wind speeds. The correlations for both ERA5 (0.88–0.89) and UH-WRF (0.84–0.85) suggest successful representation of the hourly fluctuations in the observed wind speeds (Fig. 4a). Previous DOE lidar buoy deployments off the northern and central coasts of California revealed similar correlations for ERA5 (0.88) (Sheridan et al., 2022). The CRMSEs during the Hawai'i buoy deployment (ERA5 = 1.59–1.62 m s−1, UH-WRF = 1.96–2.02 m s−1) (Fig. 4a) are notably lower than the ERA5-based CRMSEs found during the California deployments, which ranged between 2.3 and 2.4 m s−1.
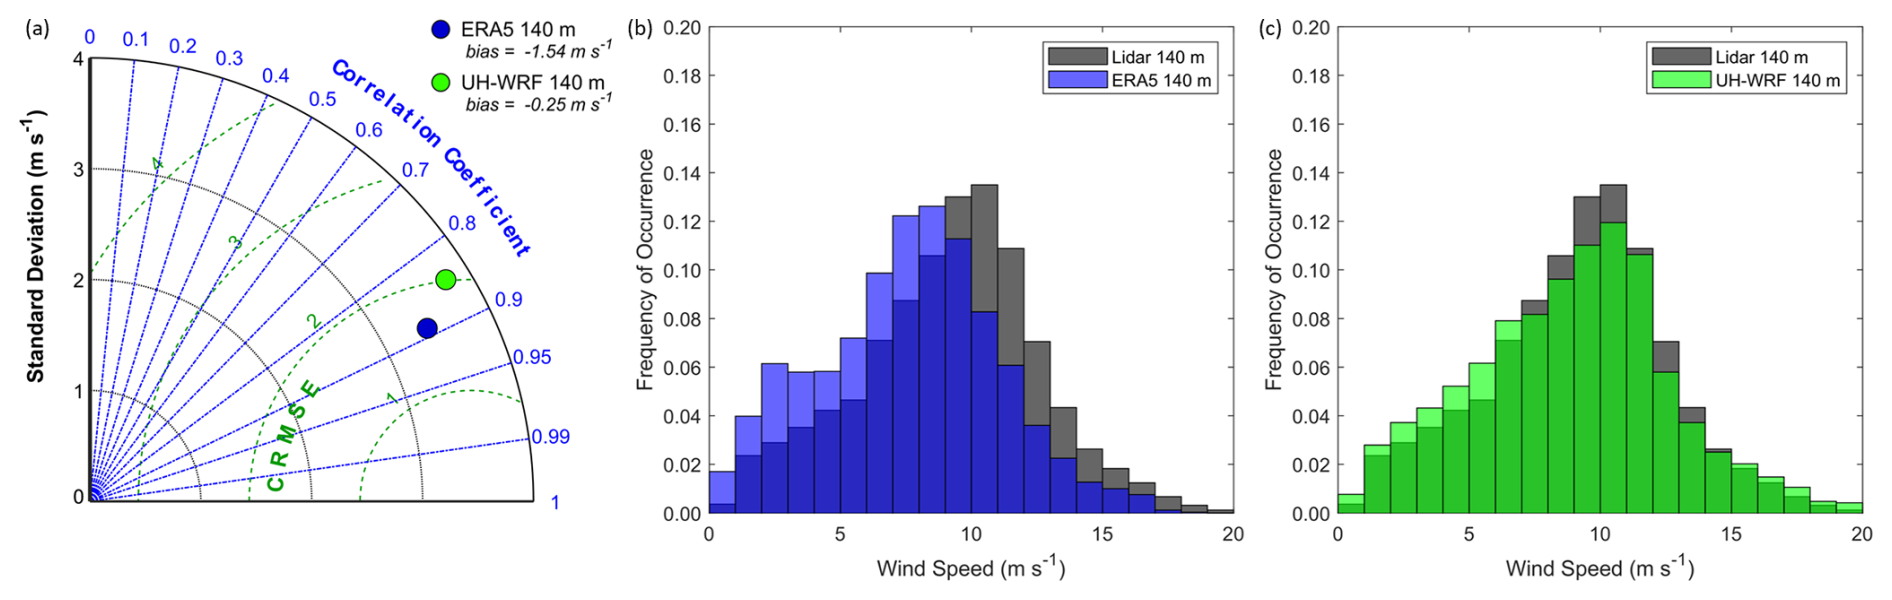
Figure 4ERA5 and UH-WRF wind speed (a) correlations, standard deviations, and CRMSEs and (b, c) distributions at the Hawai'i buoy location during the overlapping period of 1 January 2023–15 December 2023.
The model wind speed biases during the Hawai'i buoy deployment differ significantly depending on the magnitude of the observed wind speed. To evaluate the impact of such observed wind speed biases on marine energy infrastructure, such as a wind turbine, we use the National Laboratory of the Rockies (NLR) 15 MW wind reference power curve (Musial et al., 2019) to categorize the observed 140 m wind speeds according to pre-cut-in wind speeds (≤3 m s−1), wind speeds along the steep portion of the power curve (>3 and <11 m s−1), and wind speeds corresponding to maximum power production (≥11 m s−1). During the full-year deployment period, 6 %, 65 %, and 29 % of the lidar 140 m wind speeds fall into the pre-cut-in, steep-portion, and maximum power categories, respectively. No observed or modelled 10 min averaged wind speeds at any height between the surface and 240 m a.s.l. during the Hawai'i buoy deployment exceeded the cut-out wind speed denoted by the reference power curve (25 m s−1), so biases during wind speed cut-out or derate periods cannot be determined.
ERA5 and UH-WRF follow similar patterns in bias according to the observed wind speed (Fig. 5). In representing the observed pre-cut-in wind speeds at 140 m, ERA5 exhibits little bias (median = 0.15 m s−1), while UH-WRF significantly overestimates them (median bias = 0.83 m s−1). For observed wind speeds on the steep portion of the power curve, ERA5 and UH-WRF underestimate the wind speed, with median biases of −1.39 and −0.25 m s−1. The greatest ERA5 errors are determined for observed wind speeds corresponding to maximum turbine generation, at the top of the power curve. For these faster observed wind speeds, ERA5 displays significant underestimation, with a median bias of −1.74 m s−1, while UH-WRF produces a median bias of −0.30 m s−1.
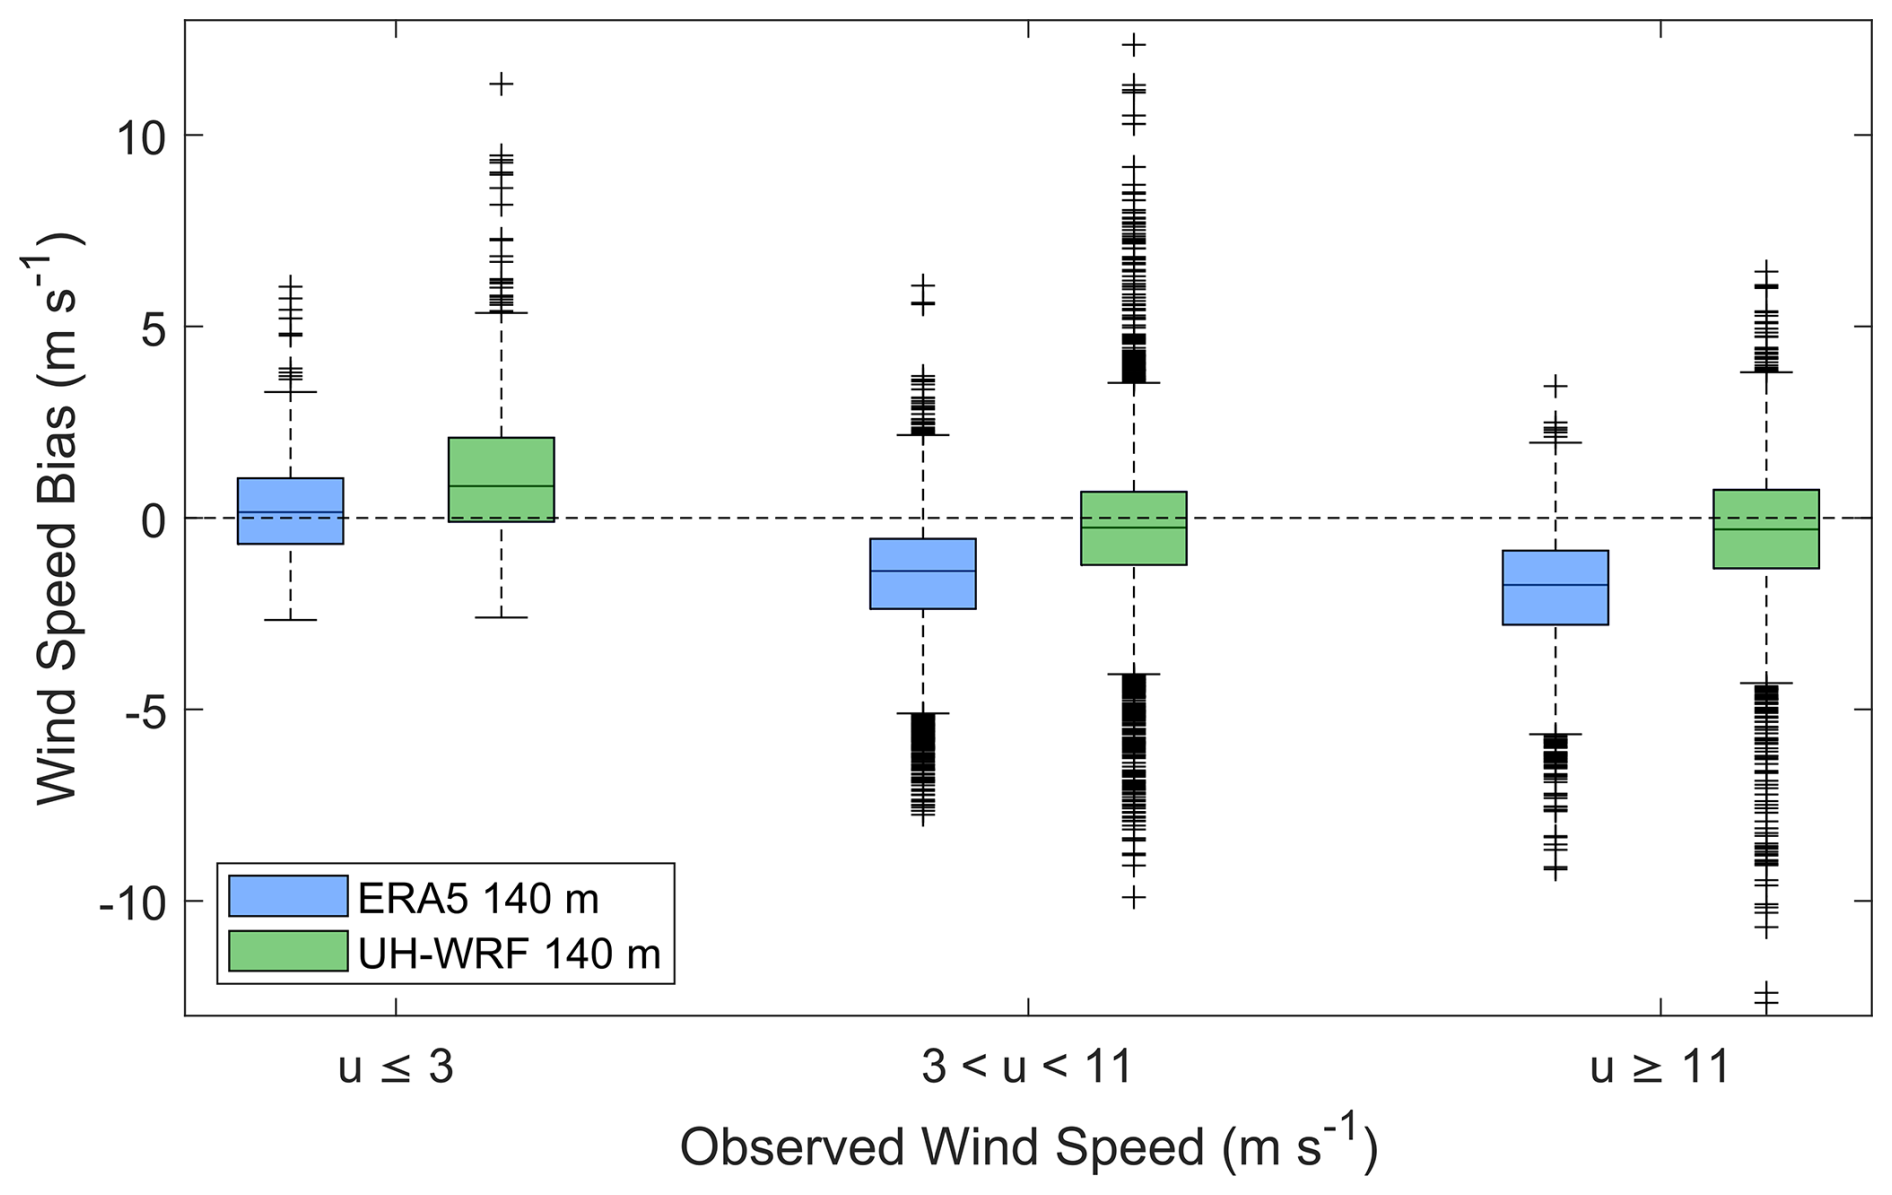
Figure 5ERA5- and UH-WRF-simulated wind speed bias versus observed wind speed during the Hawai'i buoy deployment. For this and all box plots in the paper, the line in the centre of the box indicates the median.
The seasonal wind cycle during the lidar buoy deployment is characterized by immense variability in the fall and winter and more static conditions in the spring and summer (Fig. 6). The observed monthly 140 m wind speed standard deviation is 2.31 m s−1 for fall and winter months (September–February) and 0.79 m s−1 for spring and summer months (March–August). Especially notable is the steep observed monthly 140 m wind speed increase of 5.66 m s−1 between January and February 2023 (Fig. 6a); however, it is important to explore the 2023 seasonal patterns in the context of the long-term patterns. Looking at the monthly wind speeds normalized by the annual average wind speed from the 2023 deployment observations and the simulation datasets, which show similar patterns, in the context of 40 years (1985 to 2024) of normalized monthly 100 m wind speeds from ERA5 (CDS, 2025b), the 2023 seasonal wind speed cycle is atypical relative to the long-term (Fig. 6b). While weather events can occur along the eastern shores of O'ahu that alter the typical conditions (Morrison and Businger, 2001) and potentially the temporal wind speed patterns (see Sect. 3.8), long-term ERA5-based analysis indicates that the 2023 seasonal wind speed cycle at the buoy location is driven by the prevalence of the trade winds (Fig. 6c). We find that faster (slower) monthly average wind speeds in 2023, relative to the long-term trends, follow a pattern of increased (decreased) frequency of occurrence of the trade winds (Fig. 6b, c). For example, the average wind speed at the buoy location during February 2023 is the 96th percentile of the averages for all Februaries in the 40-year ERA5 record. The frequency of occurrence of the trade winds (50–100°) during February 2023 (occurring 72 % of the time) corresponds to a high percentile relative to all Februaries in the 40-year ERA5 record: 87th. Similarly, the slowest monthly wind speeds in 2023 relative to their 40-year counterparts (January: 9th percentile, March: 18th percentile, October: 4th percentile) have lower frequencies of trade wind occurrences during 2023 (January: 29th percentile, March: 1st percentile, October: 7th percentile) (Fig. 6b, c).
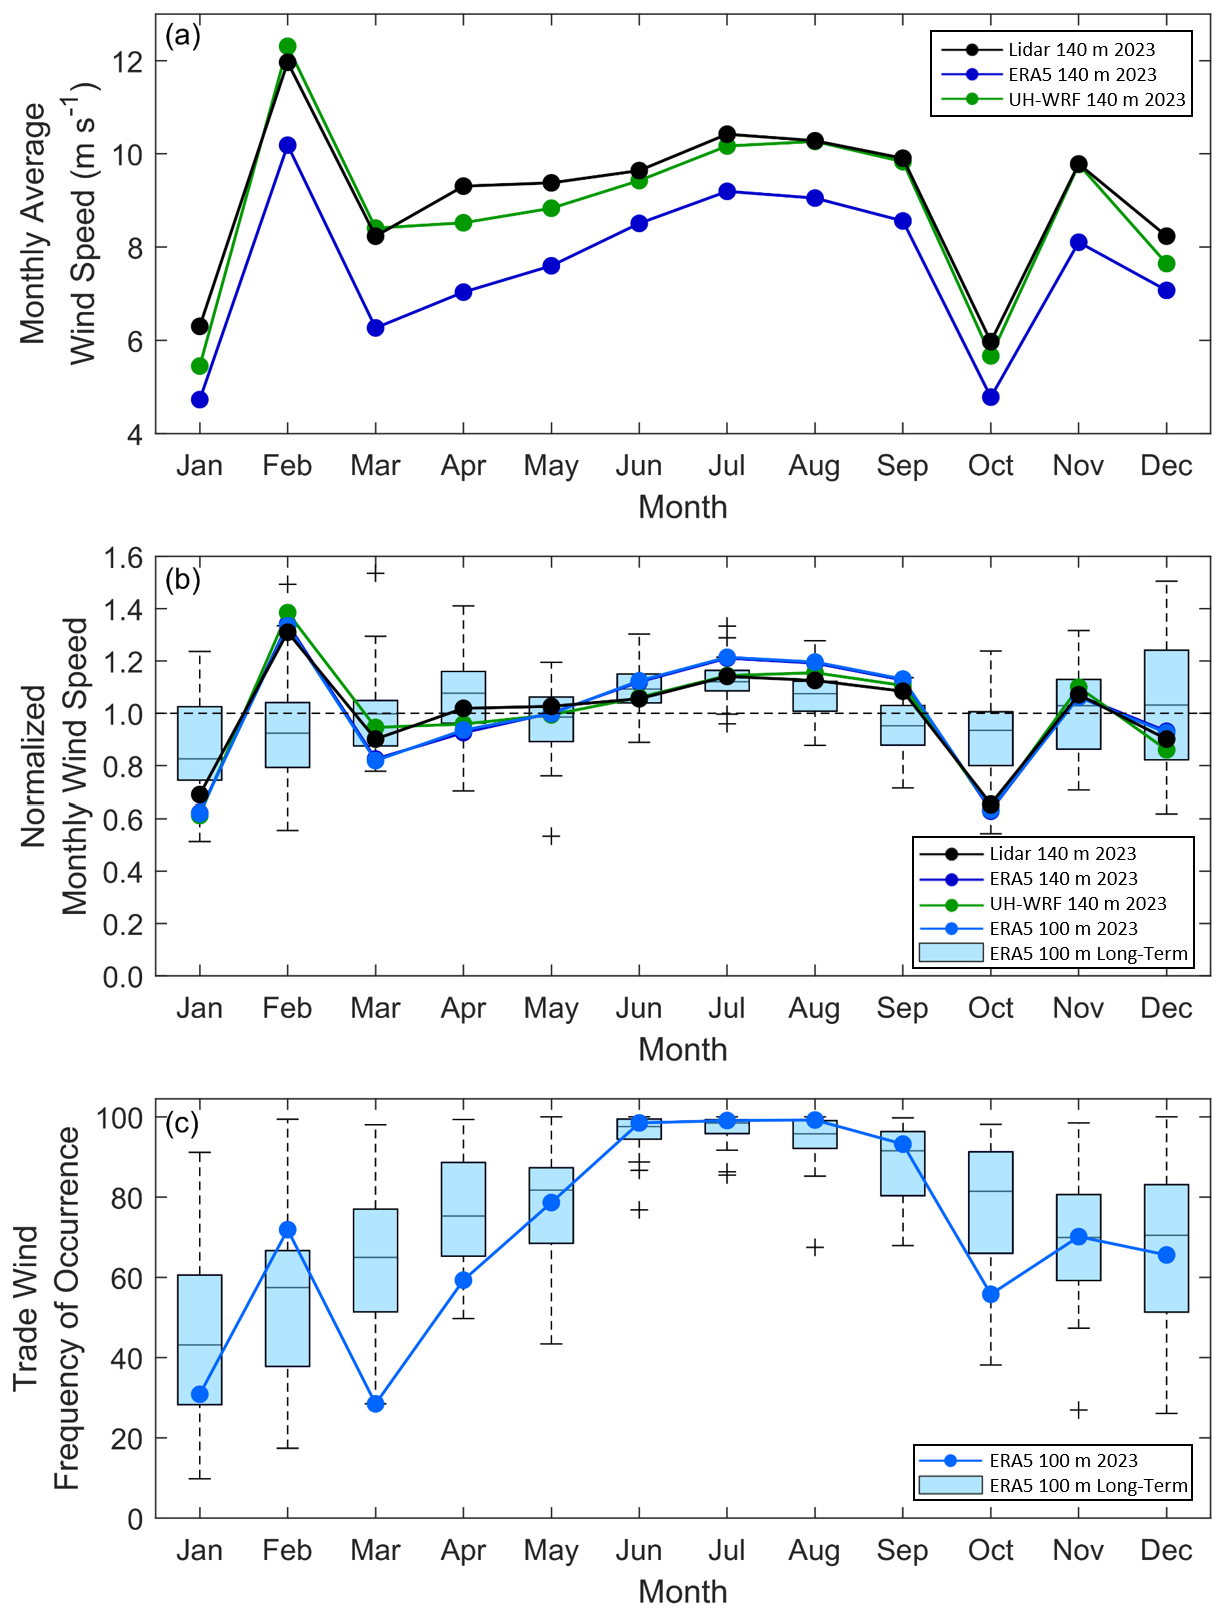
Figure 6(a) Monthly average wind speeds from the Hawai'i lidar observations, ERA5, and UH-WRF. (b) Monthly average wind speeds normalized by the annual average wind speed from the Hawai'i lidar observations, ERA5, and UH-WRF paired with ERA5 long-term normalized monthly wind speeds, which cover a 40-year period from 1985 to 2024. (c) Frequency of occurrence of winds sourcing between 50 and 100° from ERA5, both long-term and for 2023. Average observed and modelled wind speeds and trade wind frequencies for December reflect only the first half of the month, corresponding to the buoy deployment period.
Both ERA5 and UH-WRF simulations perform well in capturing the observed monthly wind speed pattern at the Hawai'i buoy location during the year 2023 (Fig. 6a, b). When comparing the observed and modelled normalized monthly wind speeds, ERA5 and UH-WRF produce correlations of 0.98 and 0.99, respectively (Fig. 6b). The standard deviation of the normalized observed monthly wind speeds is 0.19, while the standard deviations from the models are slightly larger at 0.22 each for ERA5 and UH-WRF.
The reanalysis bias varies throughout the year, with ERA5 exhibiting the largest biases in the spring (March–May 2023, average = −2.01 m s−1), followed by the winter (January, February, December 2023, average = −1.50 m s−1) and the fall (September–November 2023, average = −1.41 m s−1), and the smallest biases in the summer (June–August 2023, average = −1.20 m s−1). UH-WRF follows a similar seasonal error pattern to ERA5, with the largest to smallest biases found in spring (−0.39 m s−1), winter (−0.37 m s−1), summer (−0.16 m s−1), and fall (−0.13 m s−1).
The observed wind speeds transition smoothly across the diurnal cycle, with a standard deviation of the 140 m hourly average wind speeds of 0.28 m s−1. The fastest speeds occur during the evening and at night, while the slowest speeds are observed during the day (Fig. 7a, c). The simulated UH-WRF diurnal cycle follows that of the observations, with nearly zero bias occurring for hours between 00:00 and 11:00 UTC and underestimation occurring between 12:00 and 23:00 UTC (average hourly bias = −0.40 m s−1) (Fig. 7b). Identifying necessary improvements to better characterize diurnal mixing within boundary layer parameterizations is required. Contrary to ERA5's accurate representation of the observed seasonal wind speed cycle, the reanalysis struggles to capture the observed diurnal cycle in 2023. Trends in the ERA5 wind speeds and associated wind speed biases are tied to the start of the 12 h reanalysis assimilation windows of 09:00 and 21:00 UTC (Hersbach et al., 2020), as shown by the sharp peaks at these hours in Fig. 7. Such discontinuities in the ERA5 diurnal wind speed cycle are also noted by Kalverla et al. (2019) over the North Sea. As with the annual and seasonal wind resource, 2023 is an atypical year relative to 40 years of ERA5 diurnal cycles (Fig. 7d).
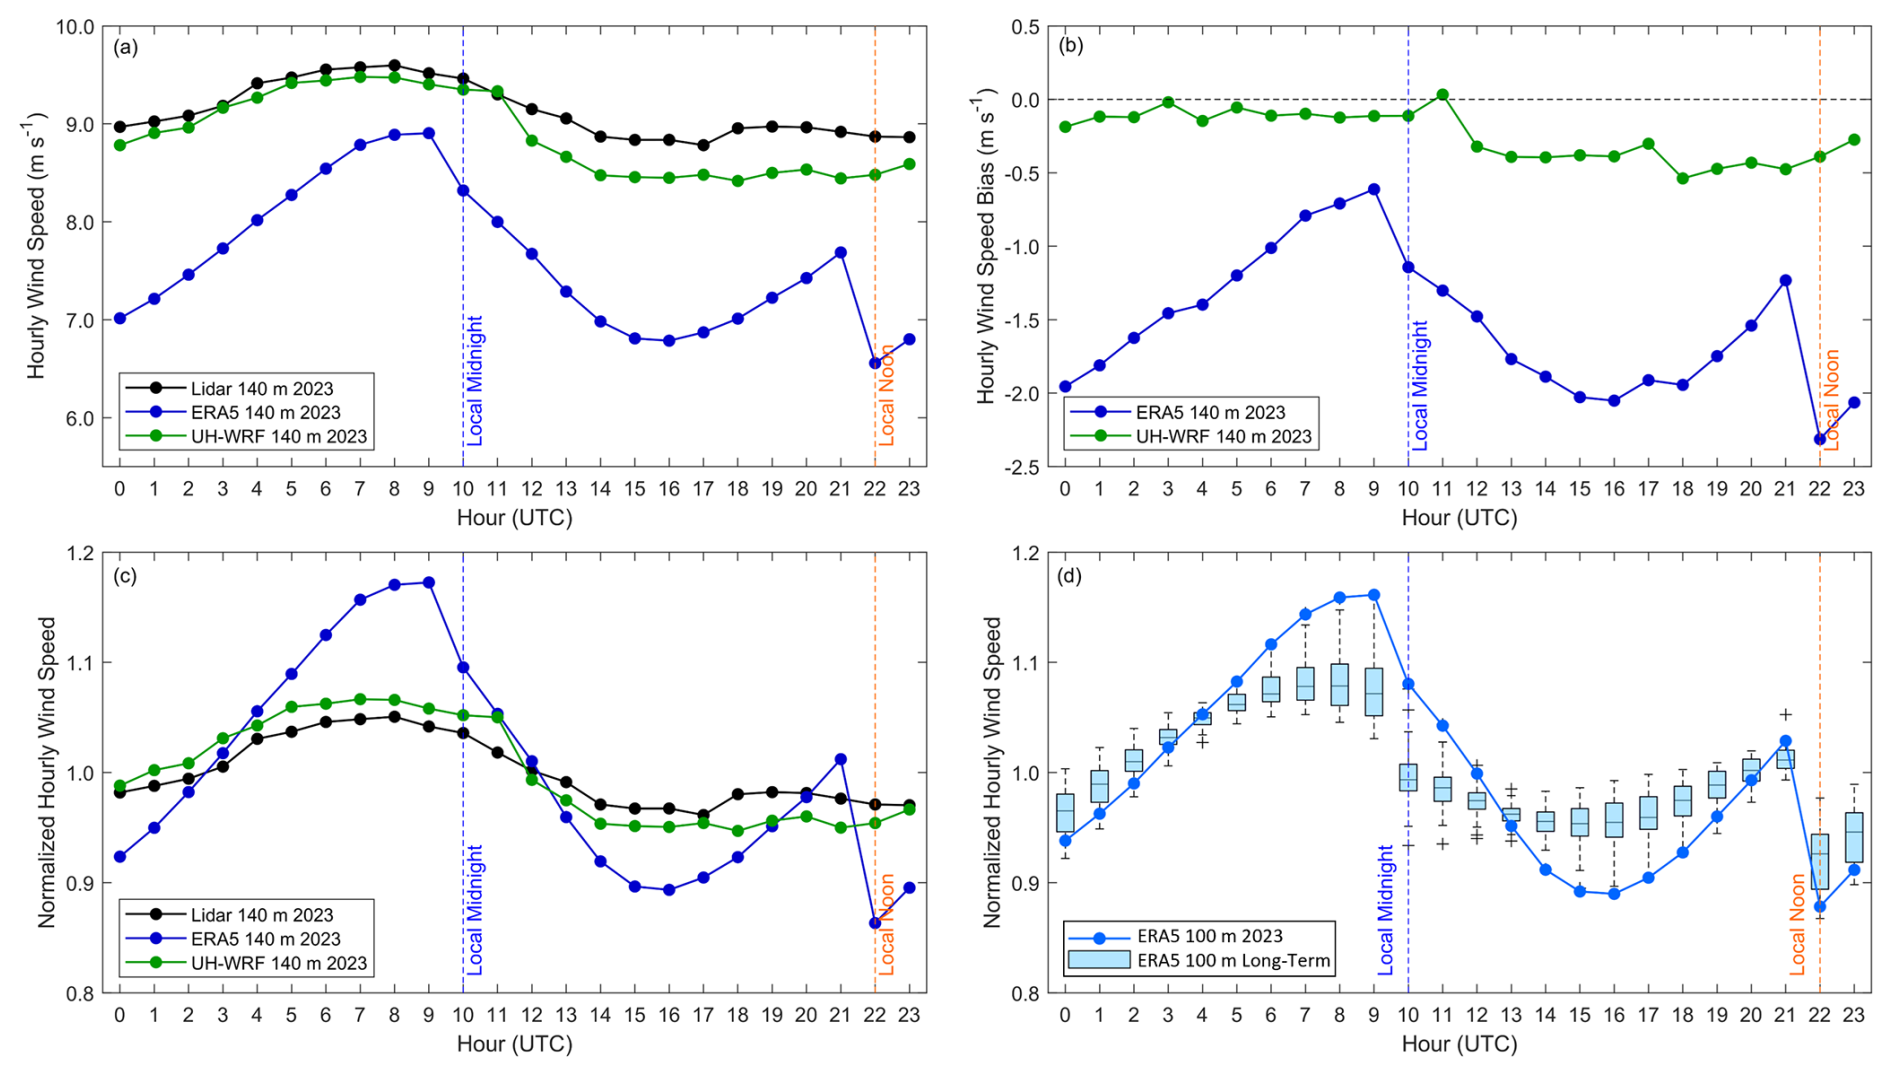
Figure 7(a) Hourly average wind speeds during 2023, (b) hourly wind speed bias during 2023, and (c) normalized hourly average wind speeds during 2023 from the Hawai'i lidar observations, ERA5, and UH-WRF. (d) Normalized 2023 and long-term (1985–2024) ERA5 100 m wind speeds at the lidar buoy location.
Given the clearly larger wind speed bias in ERA5 compared to UH-WRF, one could ask if particular conditions preferentially lead to the stronger bias or if it is consistent across meteorological conditions. As shown above, the wind speed bias does differ by time of day, with a larger amplitude of the diurnal cycle of the bias in ERA5 (Fig. 7a, b). Yet, averaging across the diurnal cycle still shows a consistently stronger negative bias for ERA5 compared to UH-WRF for every month of 2023 (Fig. 6a). The next sub-sections examine whether the bias is dependent on meteorological or ocean wave conditions. If the bias is situationally dependent, this is important to know when applying bias correction to the ERA5 and UH-WRF winds.
3.2 Wind dataset performance by wind direction
The first regime dependence examined is wind direction. The wind resource in Hawai'i is dominated by persistent northeast trade winds, with rare occurrences of wind sourcing from the south at O'ahu (Argüeso and Businger, 2018). During the overlapping period of the buoy observations and ERA5 and UH-WRF simulation coverage (1 January 2023–15 December 2023), 76 % of the observed 140 m wind at the buoy location occurs between 50 and 100° (Fig. 8a). ERA5 underestimates the observed frequency of winds occurring between 50 and 100° at 70 % (Fig. 8b), while the percentage of winds occurring between 50 and 100° according to UH-WRF is closer to the observations at 73 % (Fig. 8c). Winds originating from O'ahu (230–300°) (Fig. 8a) constitute only 1 % of the observed 2023 wind climatology at the lidar buoy location, suggesting that the buoy is situated within the wake of O'ahu island. Both ERA5 and UH-WRF slightly overestimate winds originating from the direction of O'ahu at 3 % and 2 %, respectively. Winds originating from Moloka'i (110–150°) are slightly more frequent (3 %), and ERA5 and UH-WRF similarly overestimate the rate of occurrence of Moloka'i-based winds at 5 %.
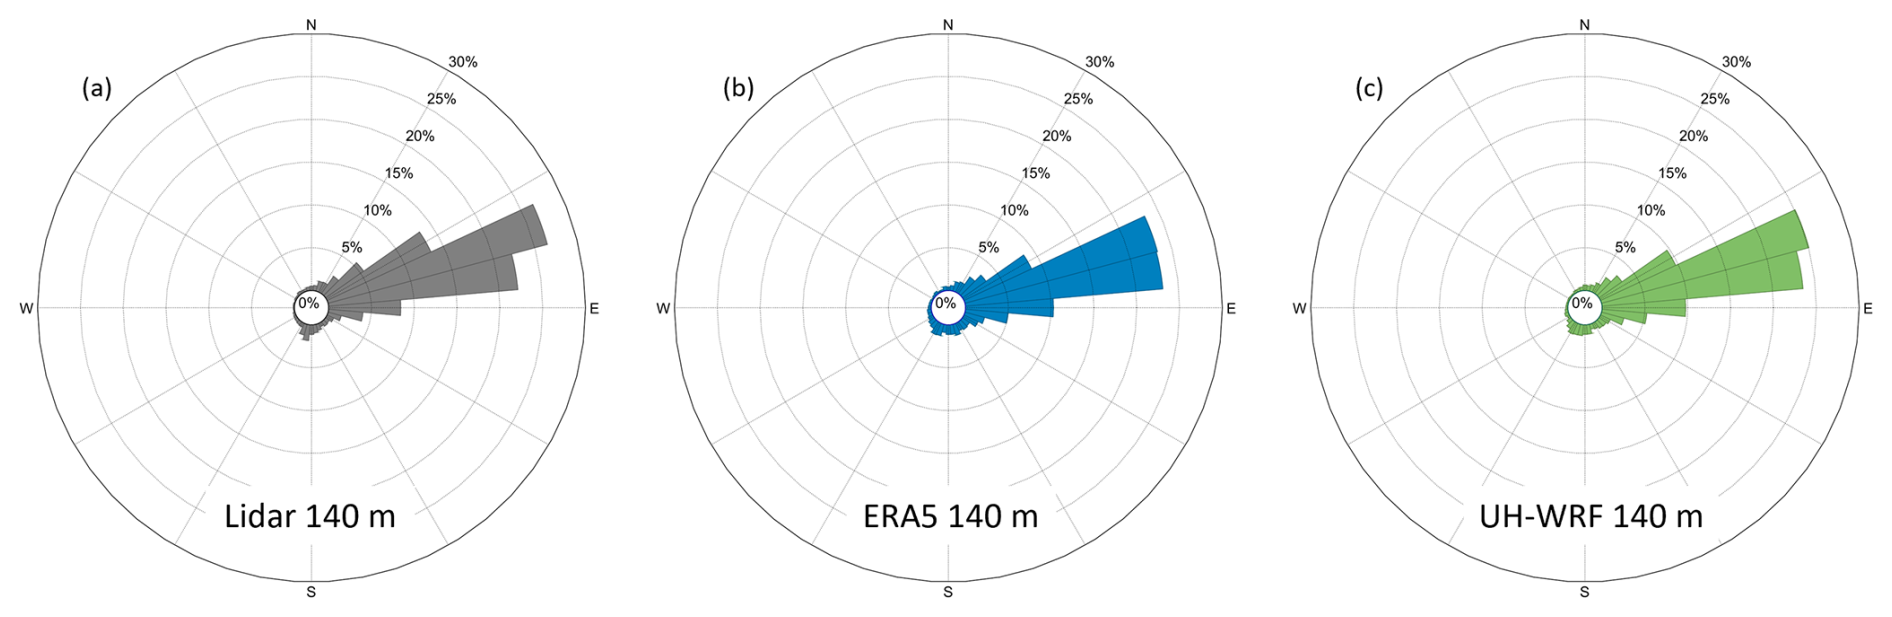
Figure 8Wind direction distributions at 140 m from (a) the O'ahu lidar buoy, (b) ERA5, and (c) UH-WRF between 1 January and 15 December 2023.
As expected given the trade wind-dominant environment, the median 140 m wind speed biases from ERA5 and UH-WRF are extremely similar whether considering the entire buoy deployment period (−1.41 m s−1 for ERA5, −0.21 m s−1 for UH-WRF) or just times when the trade winds are observed (−1.43 m s−1 for ERA5, −0.22 m s−1 for UH-WRF) (Fig. 9). While keeping in mind that the sample sizes are significantly smaller when considering island-influenced winds, Fig. 9 shows the wind speed biases becoming more positive for winds originating from the directions of Moloka'i and O'ahu. For winds originating from Moloka'i, the median ERA5 wind speed bias is −1.01 m s−1, while UH-WRF exhibits a tendency to overestimate the wind speeds with a median bias of 0.46 m s−1. In the rare event that winds at the lidar buoy location originated from O'ahu during 2023, the degree of simulation overestimation is notable, particularly when examining UH-WRF (median wind speed bias = 1.80 m s−1).
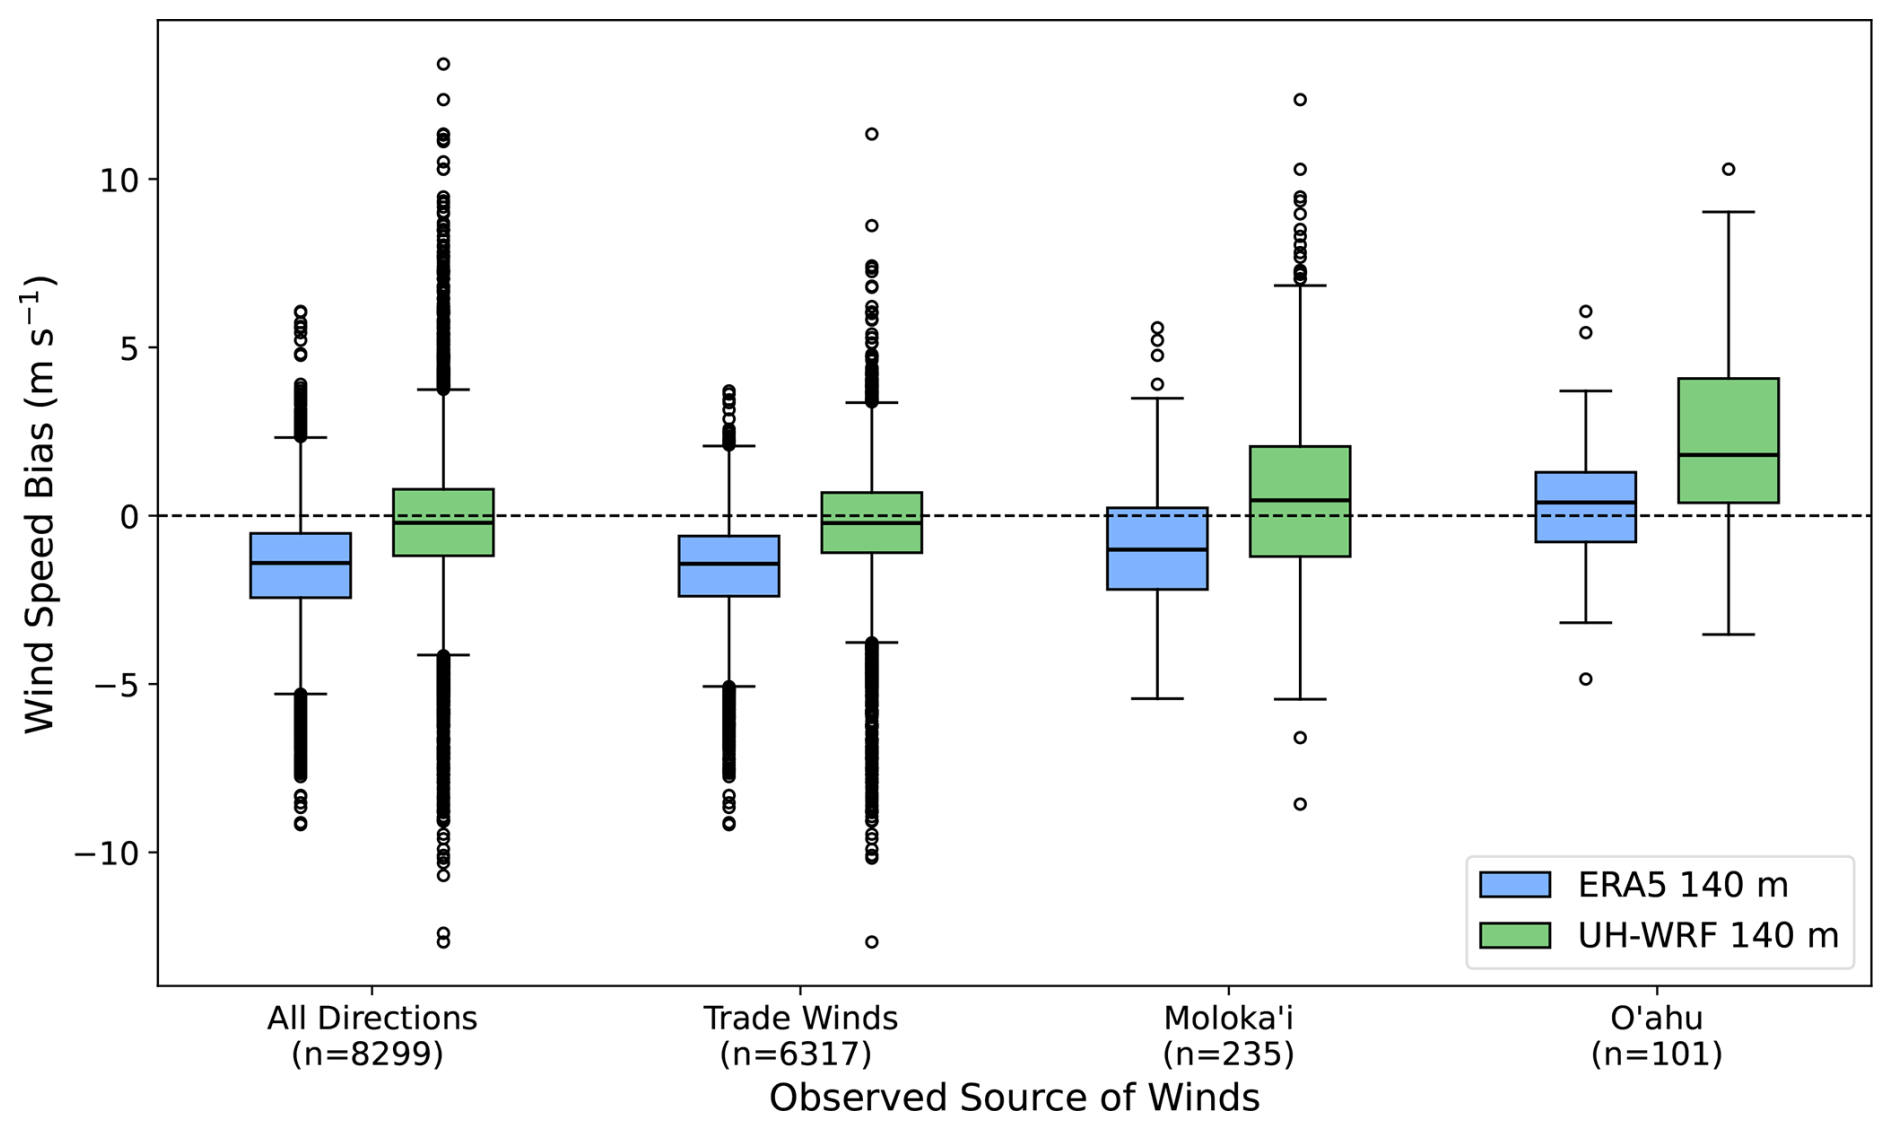
Figure 9ERA5- and UH-WRF-simulated wind speed bias versus observed 140 m wind direction. The trade winds are defined as originating between 50 and 100°, winds from Moloka'i are defined between 110 and 150°, and O'ahu winds are defined between 230 and 300°. Data counts for each source are shown below their labels.
3.3 Wind dataset performance according to turbulence intensity
Given that the wind direction is almost always from the trade winds, it cannot account for the bias differences between datasets. Therefore, we next examine more local meteorological conditions in the form of turbulence. Assessing the degree of turbulence at a location of wind energy development interest is advantageous for establishing generation expectations, particularly in a waked wind farm environment (Hansen et al., 2011). Therefore, it is important to define the baseline performance of datasets used for wind resource assessment according to different turbulent environments. Using the 1 Hz lidar buoy observations from the Hawai'i deployment (DOE, 2025c), we determine turbulence intensity (TI) at turbine hub height using the ratio of the standard deviation to the mean of the 140 m wind speeds over 10 min periods (DOE, 2025a). At the offshore O'ahu buoy location, TI values below 0.1 occur during 32 % of the deployment period, while the bulk of the measurements (60 %) show that TI during the deployment is between 0.1 and 0.2 (Fig. 10a). The sample size of TI values reaching or exceeding 0.2 is small (8 % of the deployment period). For hub height wind speeds below 5 m s−1, the observed TI at the buoy location follows an inverse relationship with the observed mean 10 min wind speeds and then hovers around 0.11 for wind speeds faster than 5 m s−1 (Fig. 10b). ERA5 and UH-WRF exhibit trends of increasingly positive wind speed bias with increasing hub height turbulence, with median ERA5 140 m wind speed biases of −1.63, −1.44, and −0.18 m s−1 and median UH-WRF 140 m wind speed biases of −0.48, −0.16, and 0.75 m s−1 for observed 140 m TI of less than 0.1, between 0.1 and 0.2, and at least 0.2, respectively (Fig. 10c, d).
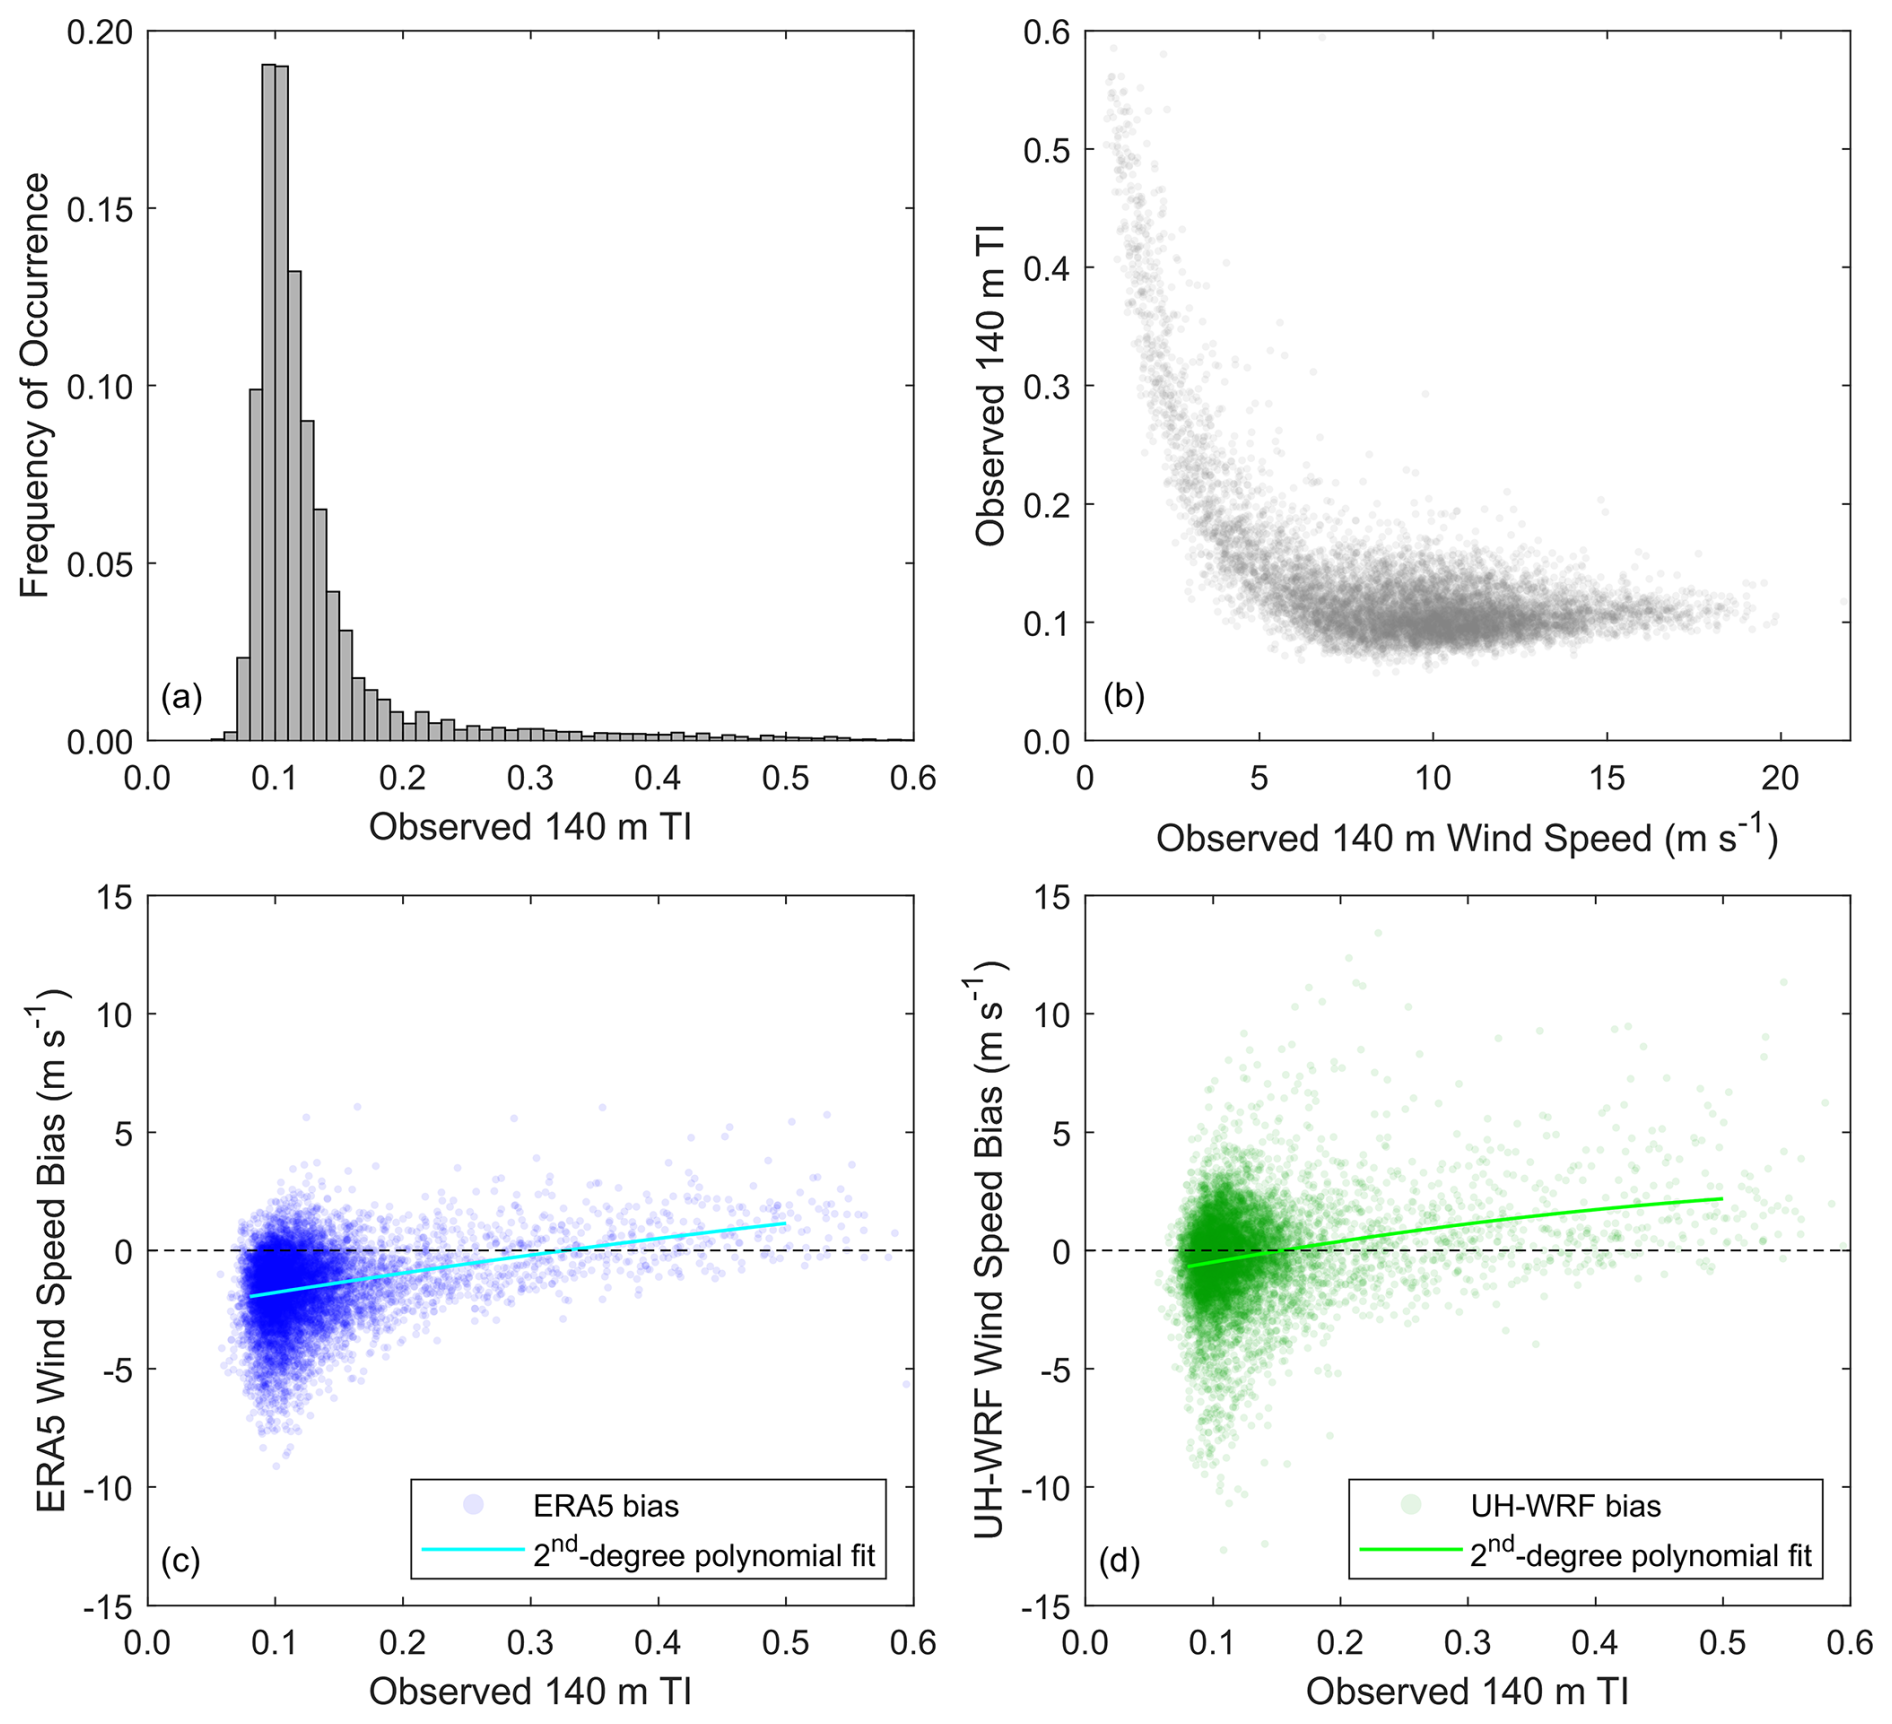
Figure 10(a) Distribution of TI at 140 m during the Hawai'i lidar buoy deployment, (b) observed TI according to observed 140 m wind speed, and (c) ERA5 and (d) UH-WRF 140 m wind speed bias according to observed TI.
3.4 Wind dataset performance according to wind shear
Related to turbulence is wind shear, which acts as a source term to turbulence. Moreover, the quantity of power that a wind turbine can produce is influenced by the amount of wind shear across the turbine rotor plane (Wharton and Lundquist, 2012). The Hawai'i buoy deployment period is characterized by very little shear across the wind profile. Using the wind shear exponent α (Eq. 1) calculated with the lidar wind speeds ulo and uhi at the output heights of zlo=60 m and zhi = 240 m as our metric, we find that 79 % of the wind shear exponents during the Hawai'i deployment fall within ±0.05 compared with 43 % of the central California deployment and only 16 % of the northern California deployment. ERA5 and UH-WRF, which similarly provide wind speed data at zlo=60 m and zhi=240 m, estimate even less wind shear across the profile. ERA5 and UH-WRF predict 84 % and 88 %, respectively, of the wind shear exponents during the Hawai'i deployment to fall within ±0.05 (Fig. 11a, b). The ERA5 and UH-WRF wind speed biases tend to be negative during periods of observed negative and near-zero wind shear and become increasingly positive with larger shear exponents (Fig. 11c). However, ERA5 consistently exhibits a more negative bias than UH-WRF across the different shear exponents.
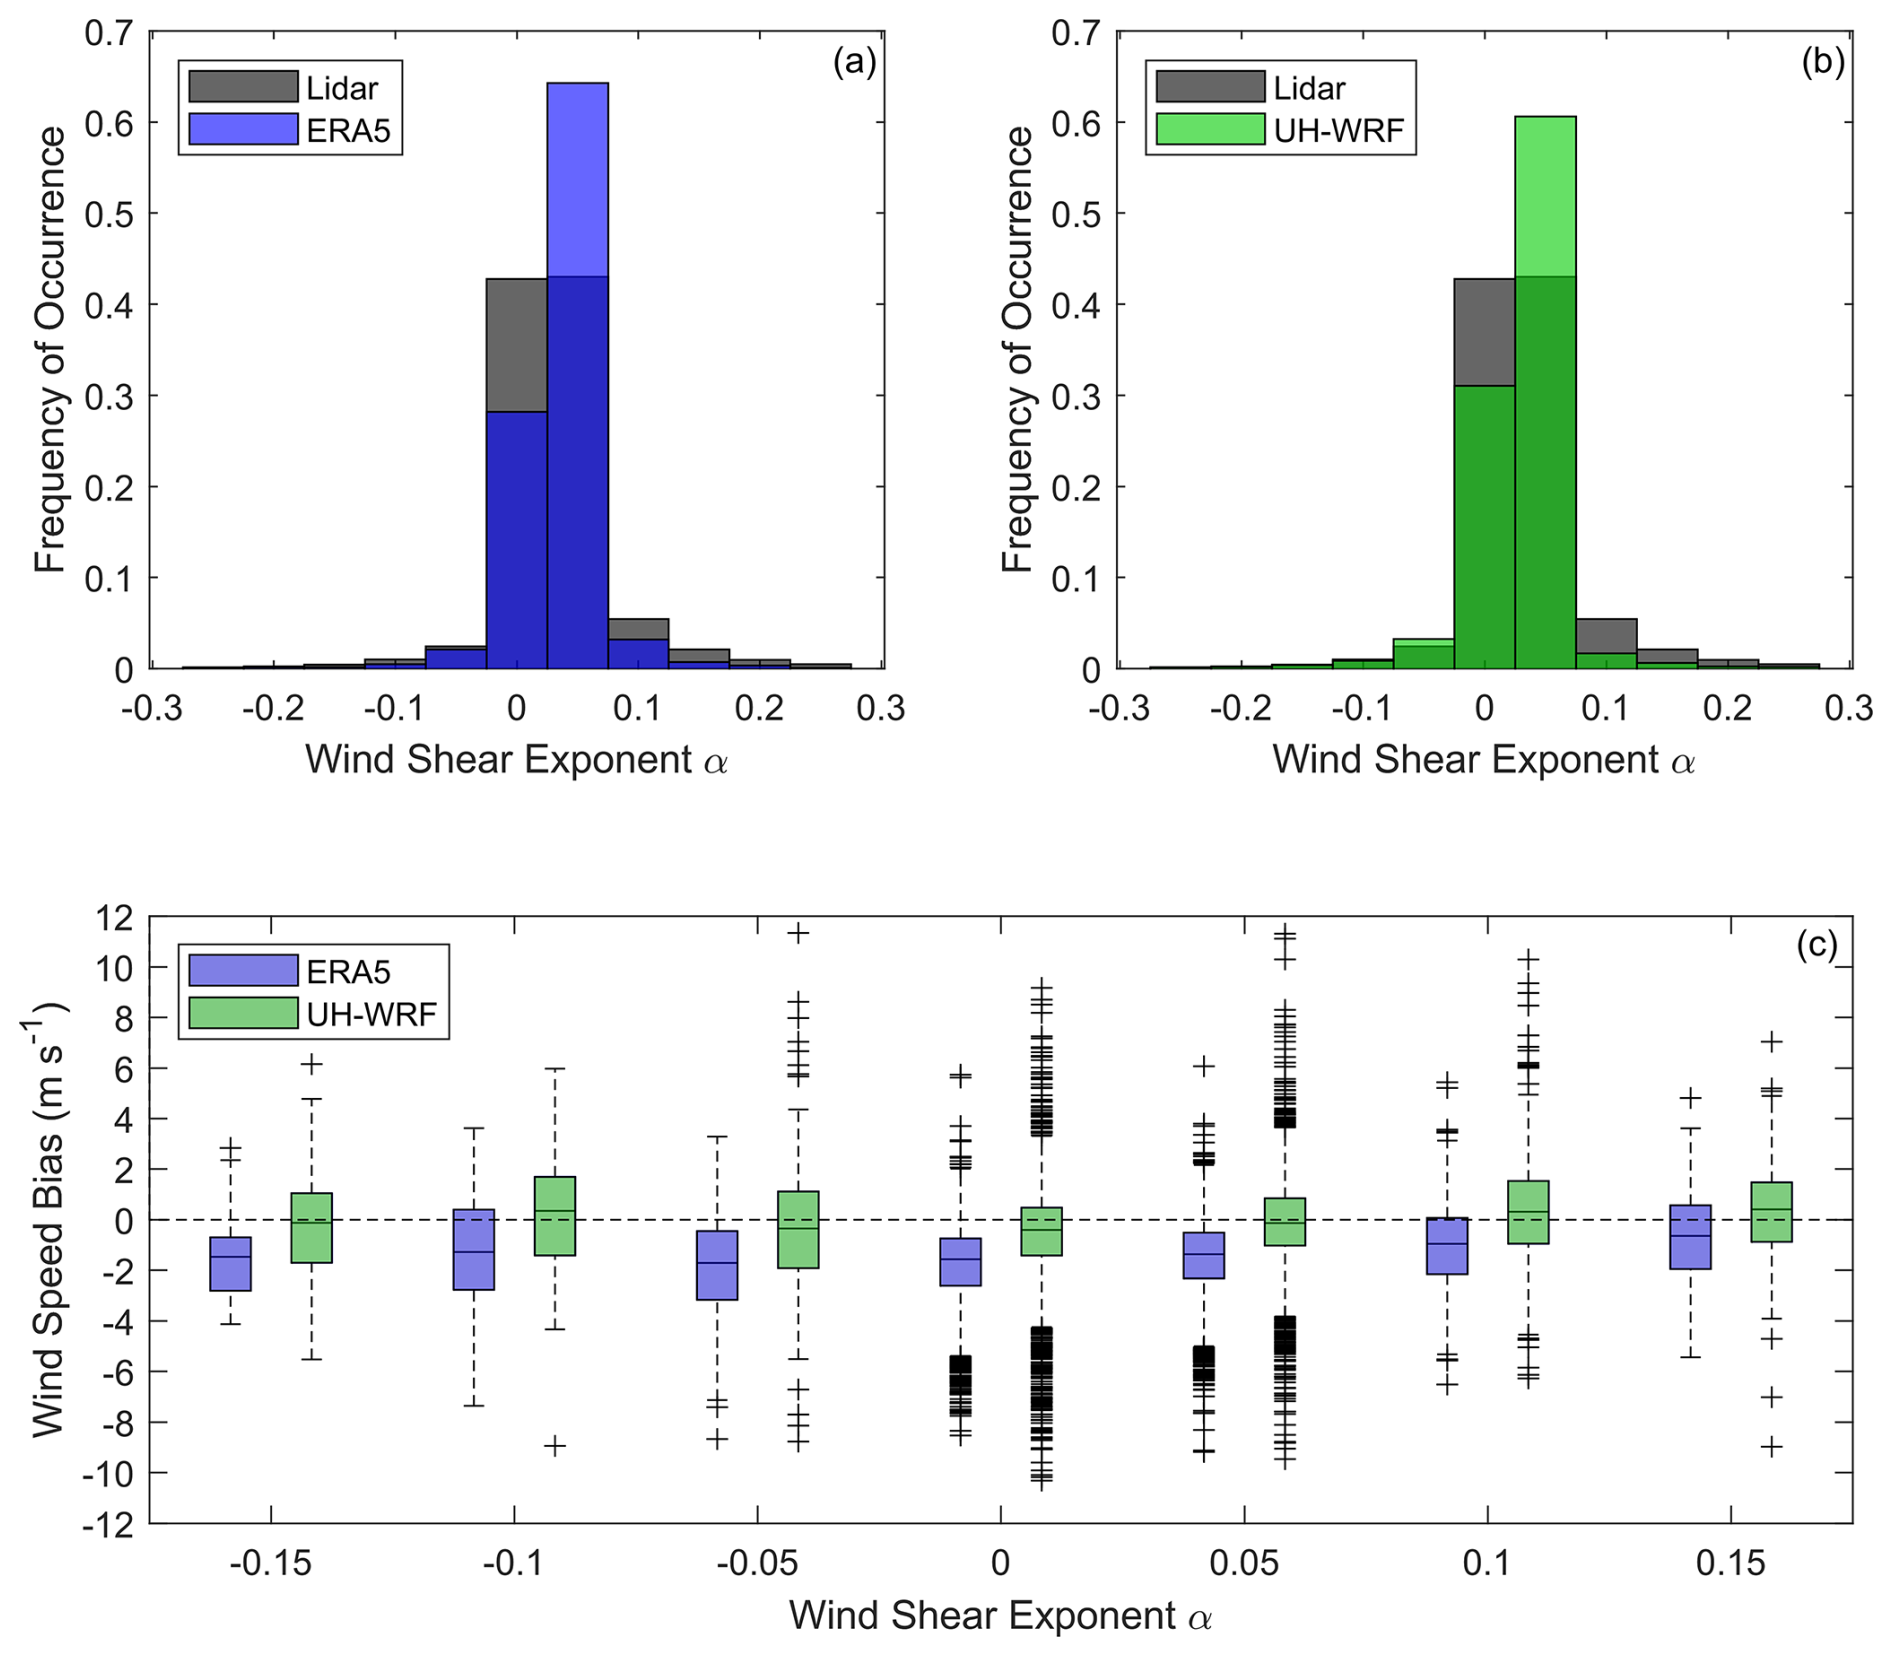
Figure 11Distribution of observed, (a) ERA5, and (b) UH-WRF wind shear between 60 m and 240 m during the Hawai'i lidar buoy deployment. (c) ERA5 and UH-WRF wind speed bias according to observed wind shear exponent.
3.5 Wind dataset performance according to cloud conditions
The presence of clouds, and the ability of simulation datasets to account for them, can impact the accuracy of wind speed estimates. For example, Lee et al. (2025) find that rotor layer wind speeds at two locations offshore of California, United States, are generally stronger under clear-sky conditions and that the High-Resolution Rapid Refresh model exhibits a smaller bias under cloudy conditions. This could be due to physical processes associated with cloud presence, or it could be due to the particular synoptic conditions that more likely lead to clouds. During the O'ahu deployment, the lidar buoy was equipped with a pyranometer that allows for estimation of the cloud mask and cloud optical thickness (Appendix A3.4) (DOE, 2025b). A pyranometer outage occurred between 10 January and 17 March 2023 (DOE, 2025b). Of the period when the wind speed and pyranometer observations, along with the ERA5 and UH-WRF simulations, are available, 42 % of the analysis period is characterized by clear-sky conditions and 58 % by cloudy conditions (Fig. 12a). When comparing clear versus cloudy periods, we find results opposite to those of Lee et al. (2025): the O'ahu 140 m observed wind speeds are generally stronger during cloudy periods (median = 9.75 m s−1) than during clear-sky periods (median = 8.57 m s−1) (Fig. 12b). This is primarily due to the presence of stratocumulus cloud conditions over California, which generally suppress turbulence and vertical mixing, reducing wind speeds, in contrast to trade wind cumulus clouds near Hawai'i, which are associated with stronger winds and increased convection. At the O'ahu location, ERA5 performs slightly worse during cloudy conditions in representing the observed 140 m wind speeds (median bias = −1.52 m s−1 for clear-sky periods versus −1.69 m s−1 for cloudy periods), whereas UH-WRF performs similarly regardless of the presence of clouds (median bias = −0.35 m s−1 for clear-sky periods versus −0.33 m s−1 for cloudy periods) (Fig. 12c, d).
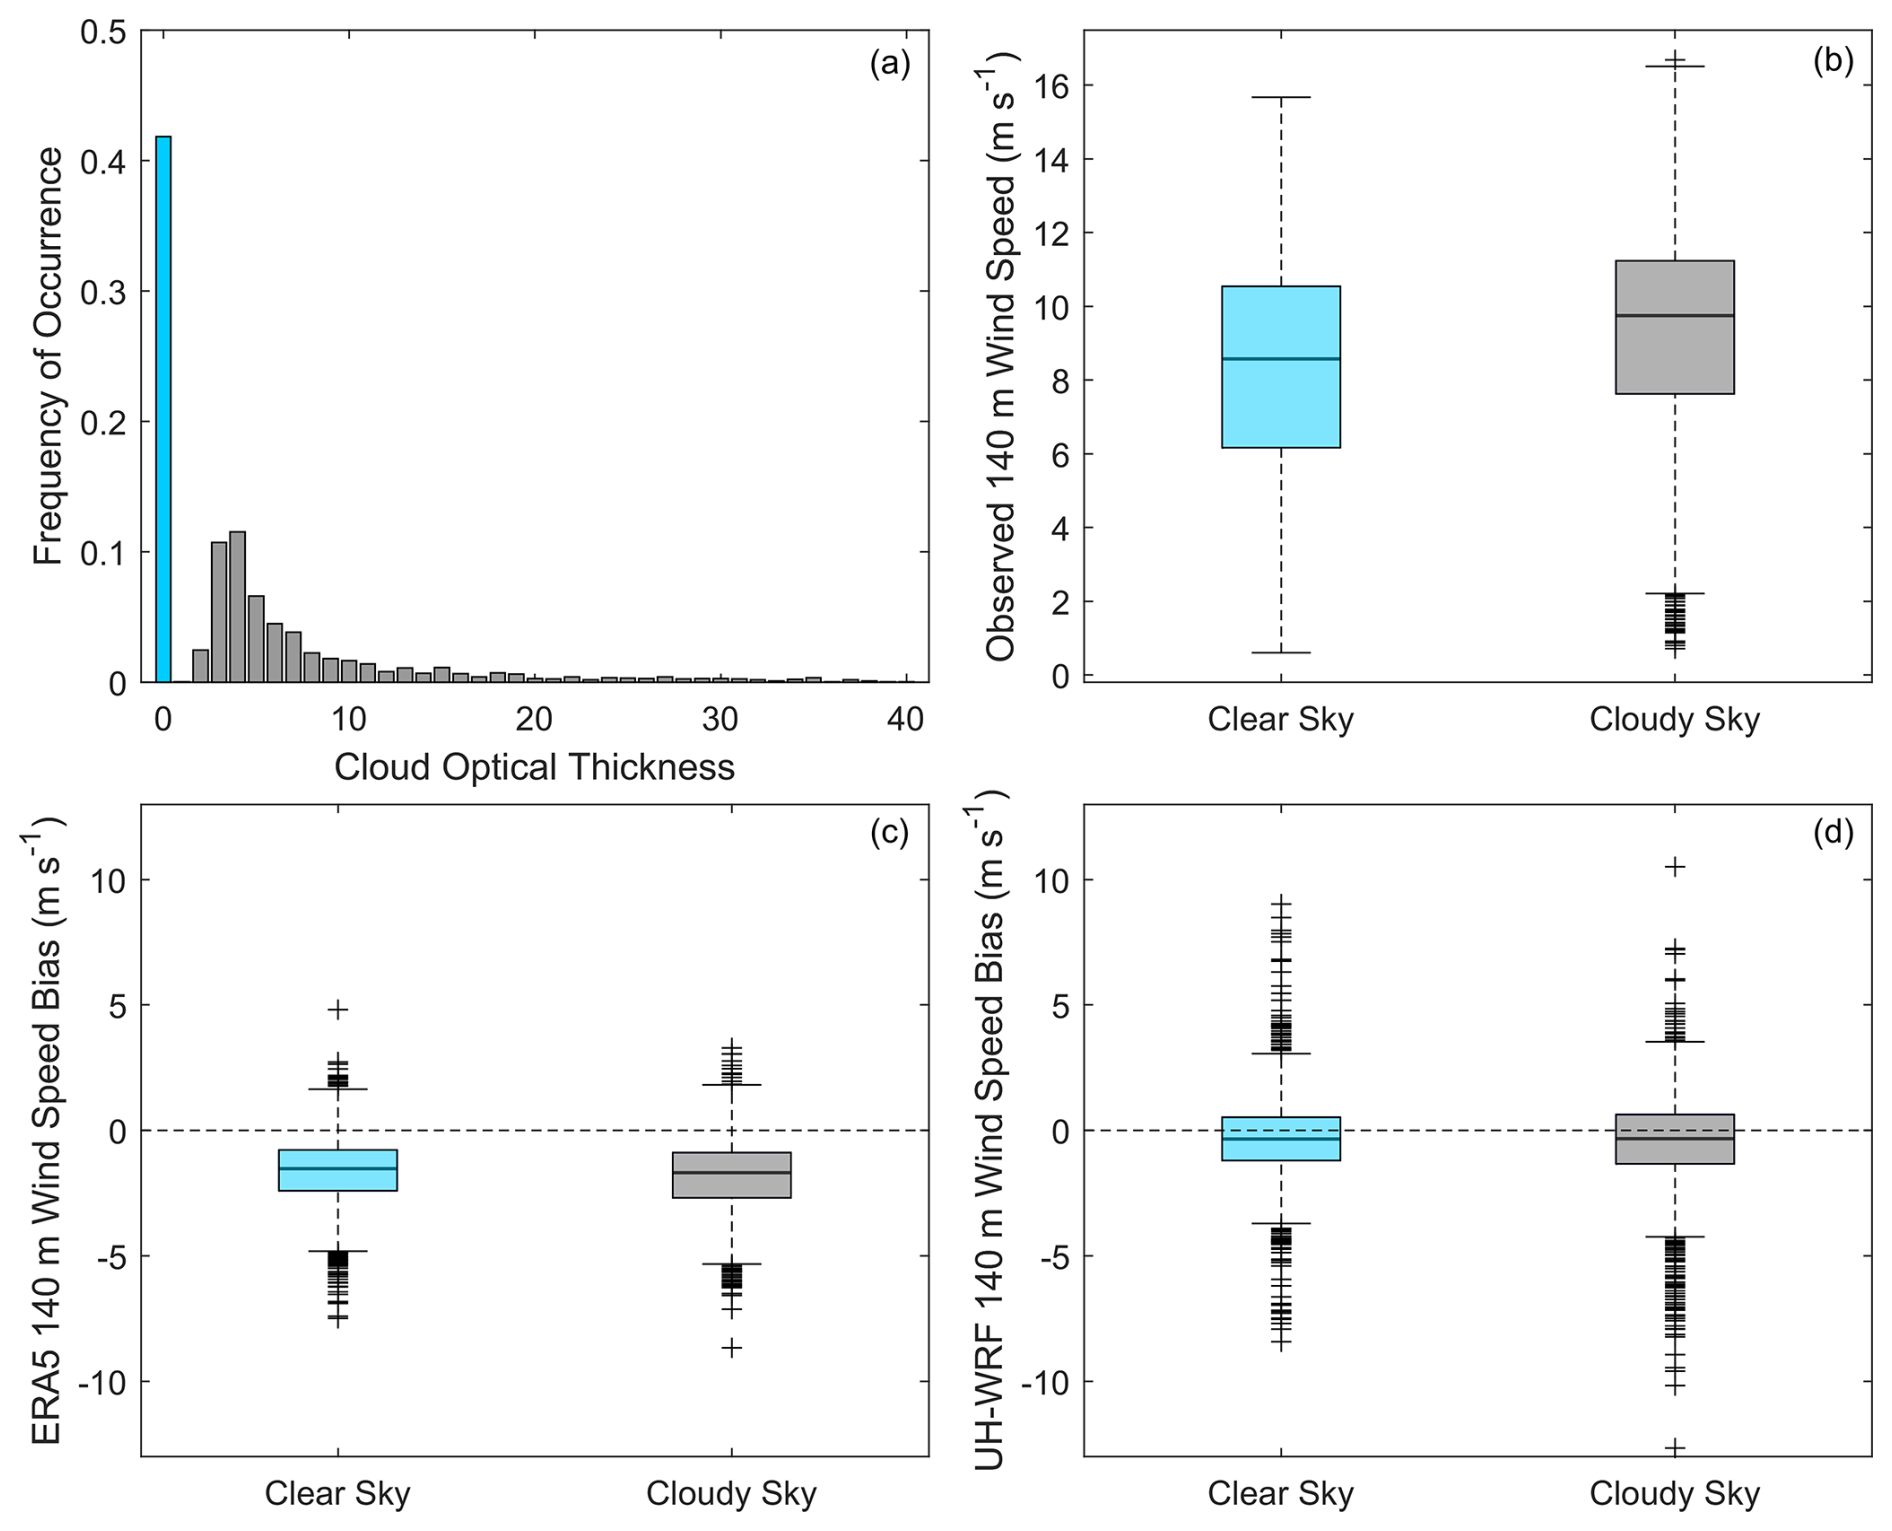
Figure 12(a) Estimated cloud optical thickness based on pyranometer measurements from the lidar buoy deployment. (b) Observed 140 m wind speed, (c) ERA5 140 m wind speed bias, and (d) UH-WRF 140 m wind speed bias according to clear- versus cloudy-sky conditions.
3.6 Wind dataset performance according to ocean conditions
The ocean wave state could also be a differentiator influencing bias differences between ERA5 and UH-WRF since the treatment of surface waves and their impact on the lower atmosphere differ in the two models. Over bodies of water, wave fields impact surface momentum fluxes and therefore wind speed profiles (Edson et al., 2013). While some exploratory research has been performed to evaluate the role of wind–wave interactions in wind profiles, most predictive models used for wind resource assessment do not predict the wave fields, instead relying on parameterizations to represent their effects (Gaudet et al., 2022, 2024). Wave measurement at the lidar buoy location begins on 17 March 2023 and continues uninterrupted through the remainder of the deployment (Appendix A3.3). During the overlapping period of the wind and wave observations and the ERA5 and UH-WRF simulations, significant wave heights between 1 and 2 m occur most frequently (63 % of the period) (Fig. 13a). A positive correlation is noted between observed significant wave height and the 140 m wind speed, though the weakest wind speeds occur when the significant wave heights meet or exceed 1 m (Fig. 13b).
Regardless of lidar measurement height, no trends in the ERA5 wind speed performance emerge according to significant wave height, with median ERA5 wind speed biases of −1.72, −1.31, −1.58, and −1.27 m s−1 at the closest lidar height to the surface (60 m), corresponding to significant wave heights of 0–1, 1–2, 2–3, and 3–4 m (Fig. 13c). At all lidar measurement heights, the UH-WRF wind speed biases become increasingly positive with increasing wave height, with median wind speed biases at 60 m of −0.49, −0.32, −0.34, and −0.02 m s−1, corresponding to significant wave heights of 0–1, 1–2, 2–3, and 3–4 m (Fig. 13d). Thus, the wave height has a slightly more consistent impact for UH-WRF, both when going from short to taller waves and when viewing the bias relative to its magnitude.
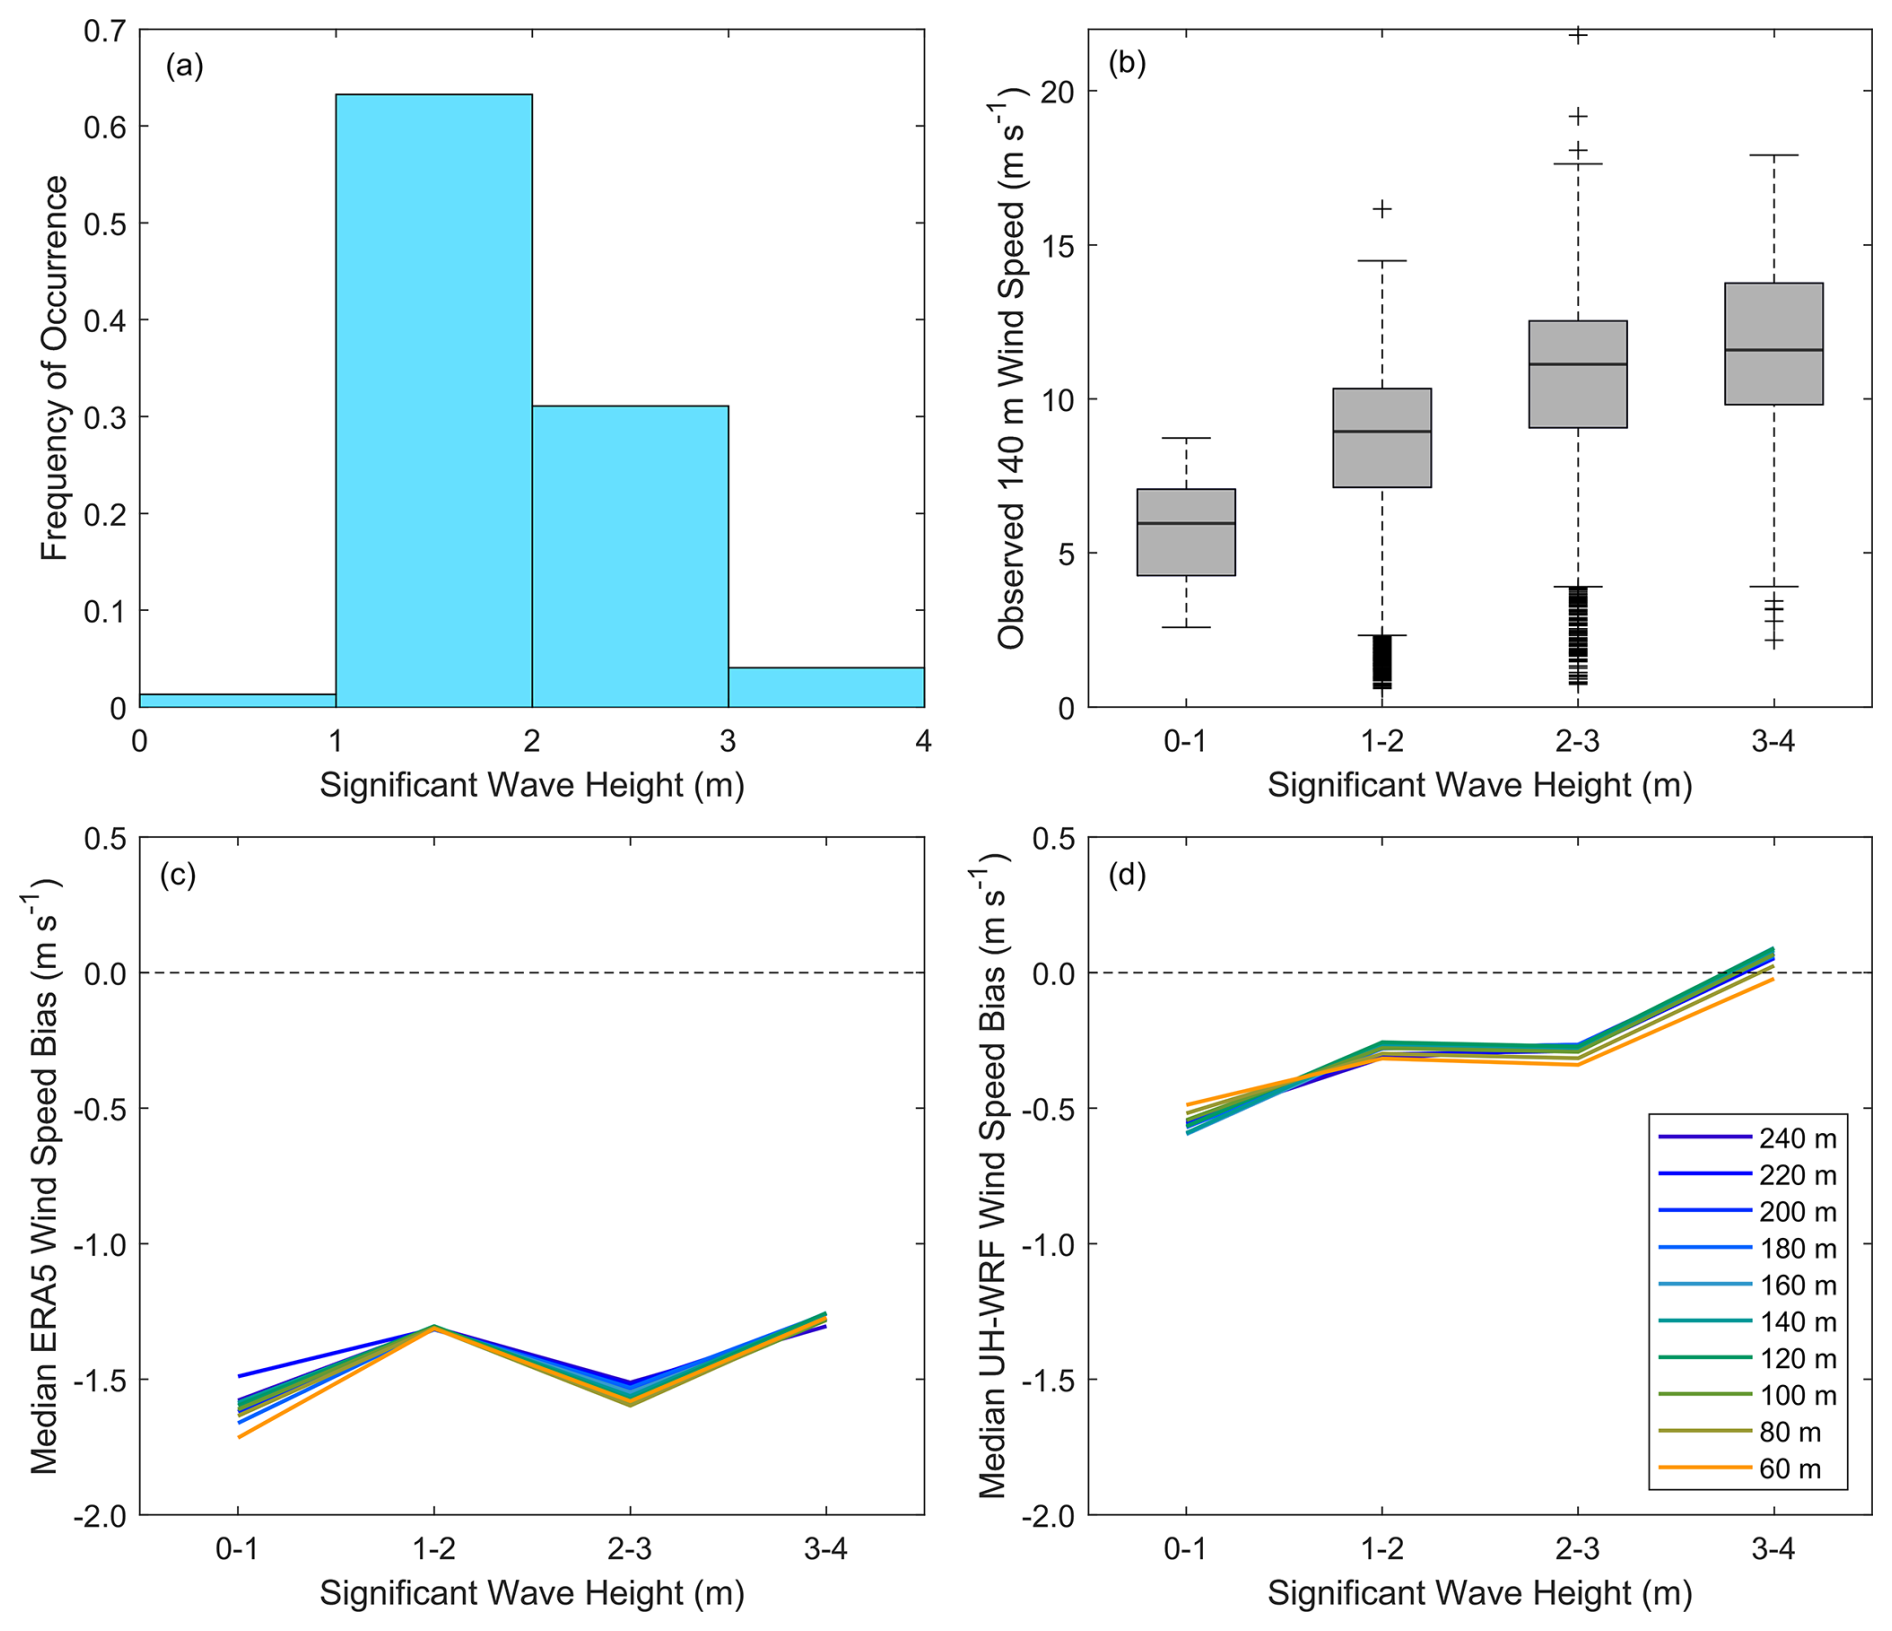
Figure 13(a) Significant wave height measurements from the lidar buoy deployment. (b) Observed 140 m wind speed, (c) median ERA5 wind speed bias from 60–240 m, and (d) median UH-WRF wind speed bias from 60–240 m according to significant wave height.
3.7 Representation of ramp events
Differences in the frequency of wind speed changes through ramp events are another way the datasets could differ. Observed wind ramp events are present at the Hawaii buoy deployment location, though not plentiful. Following the study of Bianco et al. (2025), we determine the amplitude of the change in the wind energy capacity factor, ΔCF, using the rotor equivalent wind speeds as defined by Wagner et al. (2014) from the lidar, ERA5, and UH-WRF with the NLR 15 MW offshore wind reference power curve (Musial et al., 2019), over a duration Δt. For this study, we consider ΔCF ≥ 40 percentage points over Δt=1–3 h that occur during the analysis period 1 January–15 December 2023 (Fig. 14). It is important to note that shorter ramp events with smaller values of ΔCF can also be counted as part of longer ramp events with larger values of ΔCF (e.g., a ramp with a 40-percentage point ΔCF over 1 h could be part of a ramp with a 60-percentage point ΔCF over 2 h).
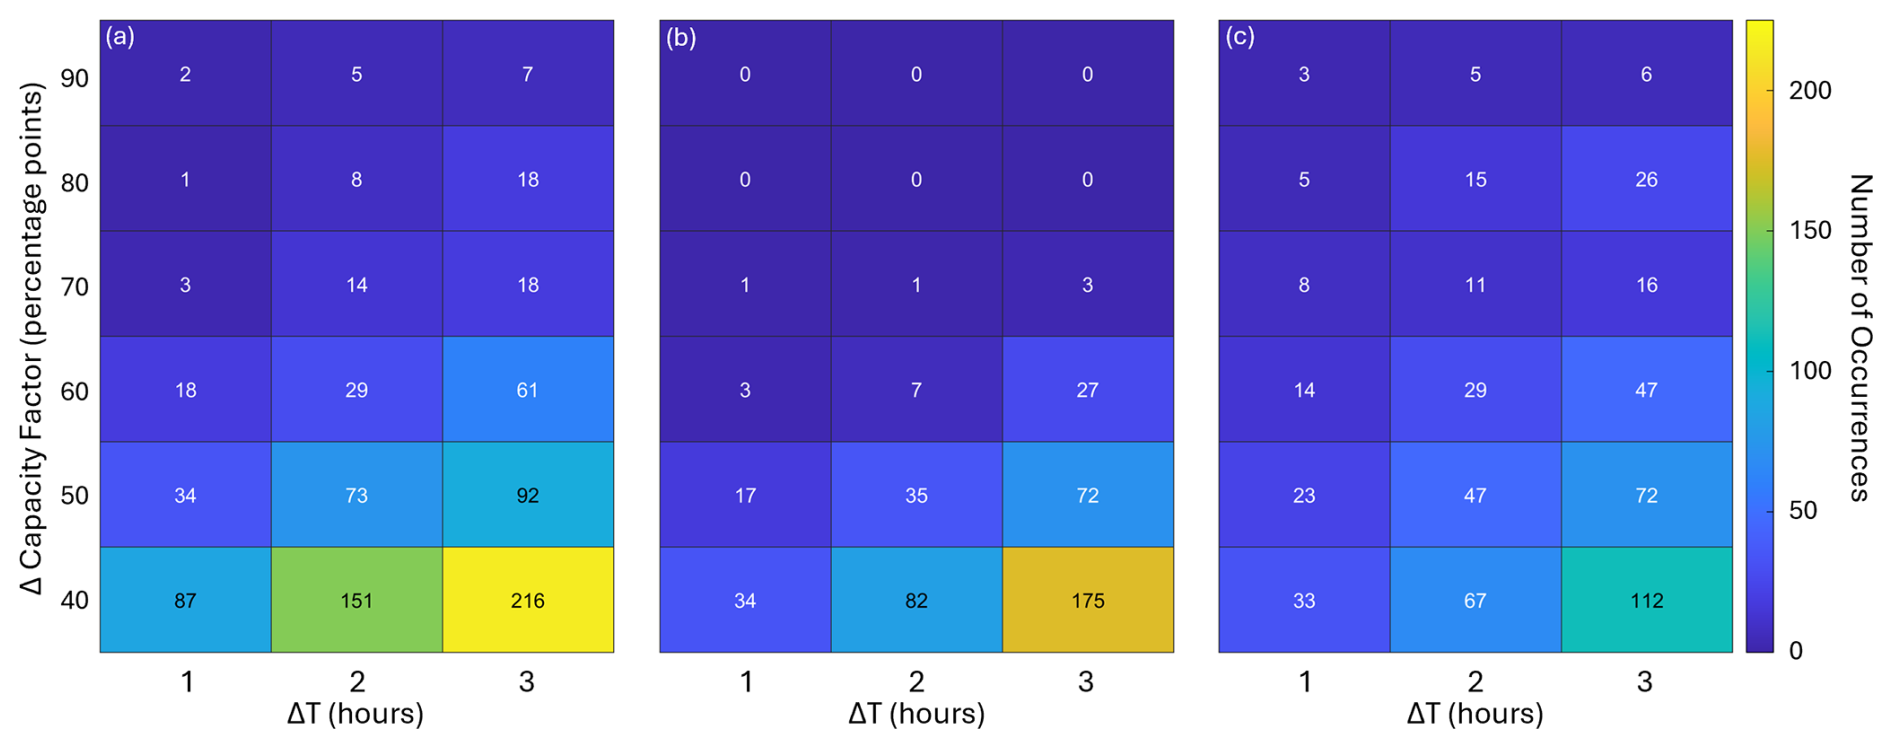
Figure 14Occurrences of (a) observed, (b) ERA5, and (c) UH-WRF wind ramps (combined up and down) defined by a change in capacity factor of at least ±40 percentage points over 1–3 h.
Over the 1-year analysis period, ramp events represent a small fraction of the observations. Ramps over 1, 2, and 3 h occur 2 %, 3 %, and 5 % of the time when the observations are available, respectively (Fig. 14a). ERA5 (Fig. 14b) and UH-WRF (Fig. 14c) perform similarly to each other in representing slightly less frequent ramp occurrences, with ramp event frequencies of 1 %, 2 %, and 3 % over 1, 2, and 3 h, respectively. Future work will explore the models' accuracy in representing ramp events in terms of timing, duration, and magnitude.
Overall, the different regime comparisons for the wind bias consistently show that ERA5 has a more negative bias that holds across the different ways of segregating the data. We did not identify a clear signal where the biases noticeably differ between datasets under the tested regimes. However, there are some dependencies that could help if one were to build predictive models to treat bias corrections, such as the relationship between increasing TI and increasing bias, as well taller waves generally leading to weaker biases (although this is not strictly linear for ERA5). We next examine several specific cases to show unique events and how they compare between the datasets.
3.8 Extreme weather events
While the eastern shores of O'ahu are dominated by persistent trade winds, extreme weather events can occur that alter the typical conditions and potentially the performance of wind simulation datasets. Several events, ranging from Kona lows to a hurricane, impacted the wind resource at the buoy location during the deployment period, allowing for analysis of the performance of ERA5 and UH-WRF in representing such events.
3.8.1 February 2023 Kona lows
Two consecutive Kona lows (Morrison and Businger, 2001) developed near the Hawaiian islands in mid-February 2023, resulting in heavy-rainfall impacts on several islands (NOAA, 2023a). The buoy observations during this period confirm the disruption of the easterly trade winds, with wind directions becoming more variable and wind speeds weakening (Longman et al., 2021). No extreme wind events are recorded by the buoy during the Kona low events; rather, the wind speeds are elevated during the trade-wind-dominant periods before and after the events (Fig. 15a).
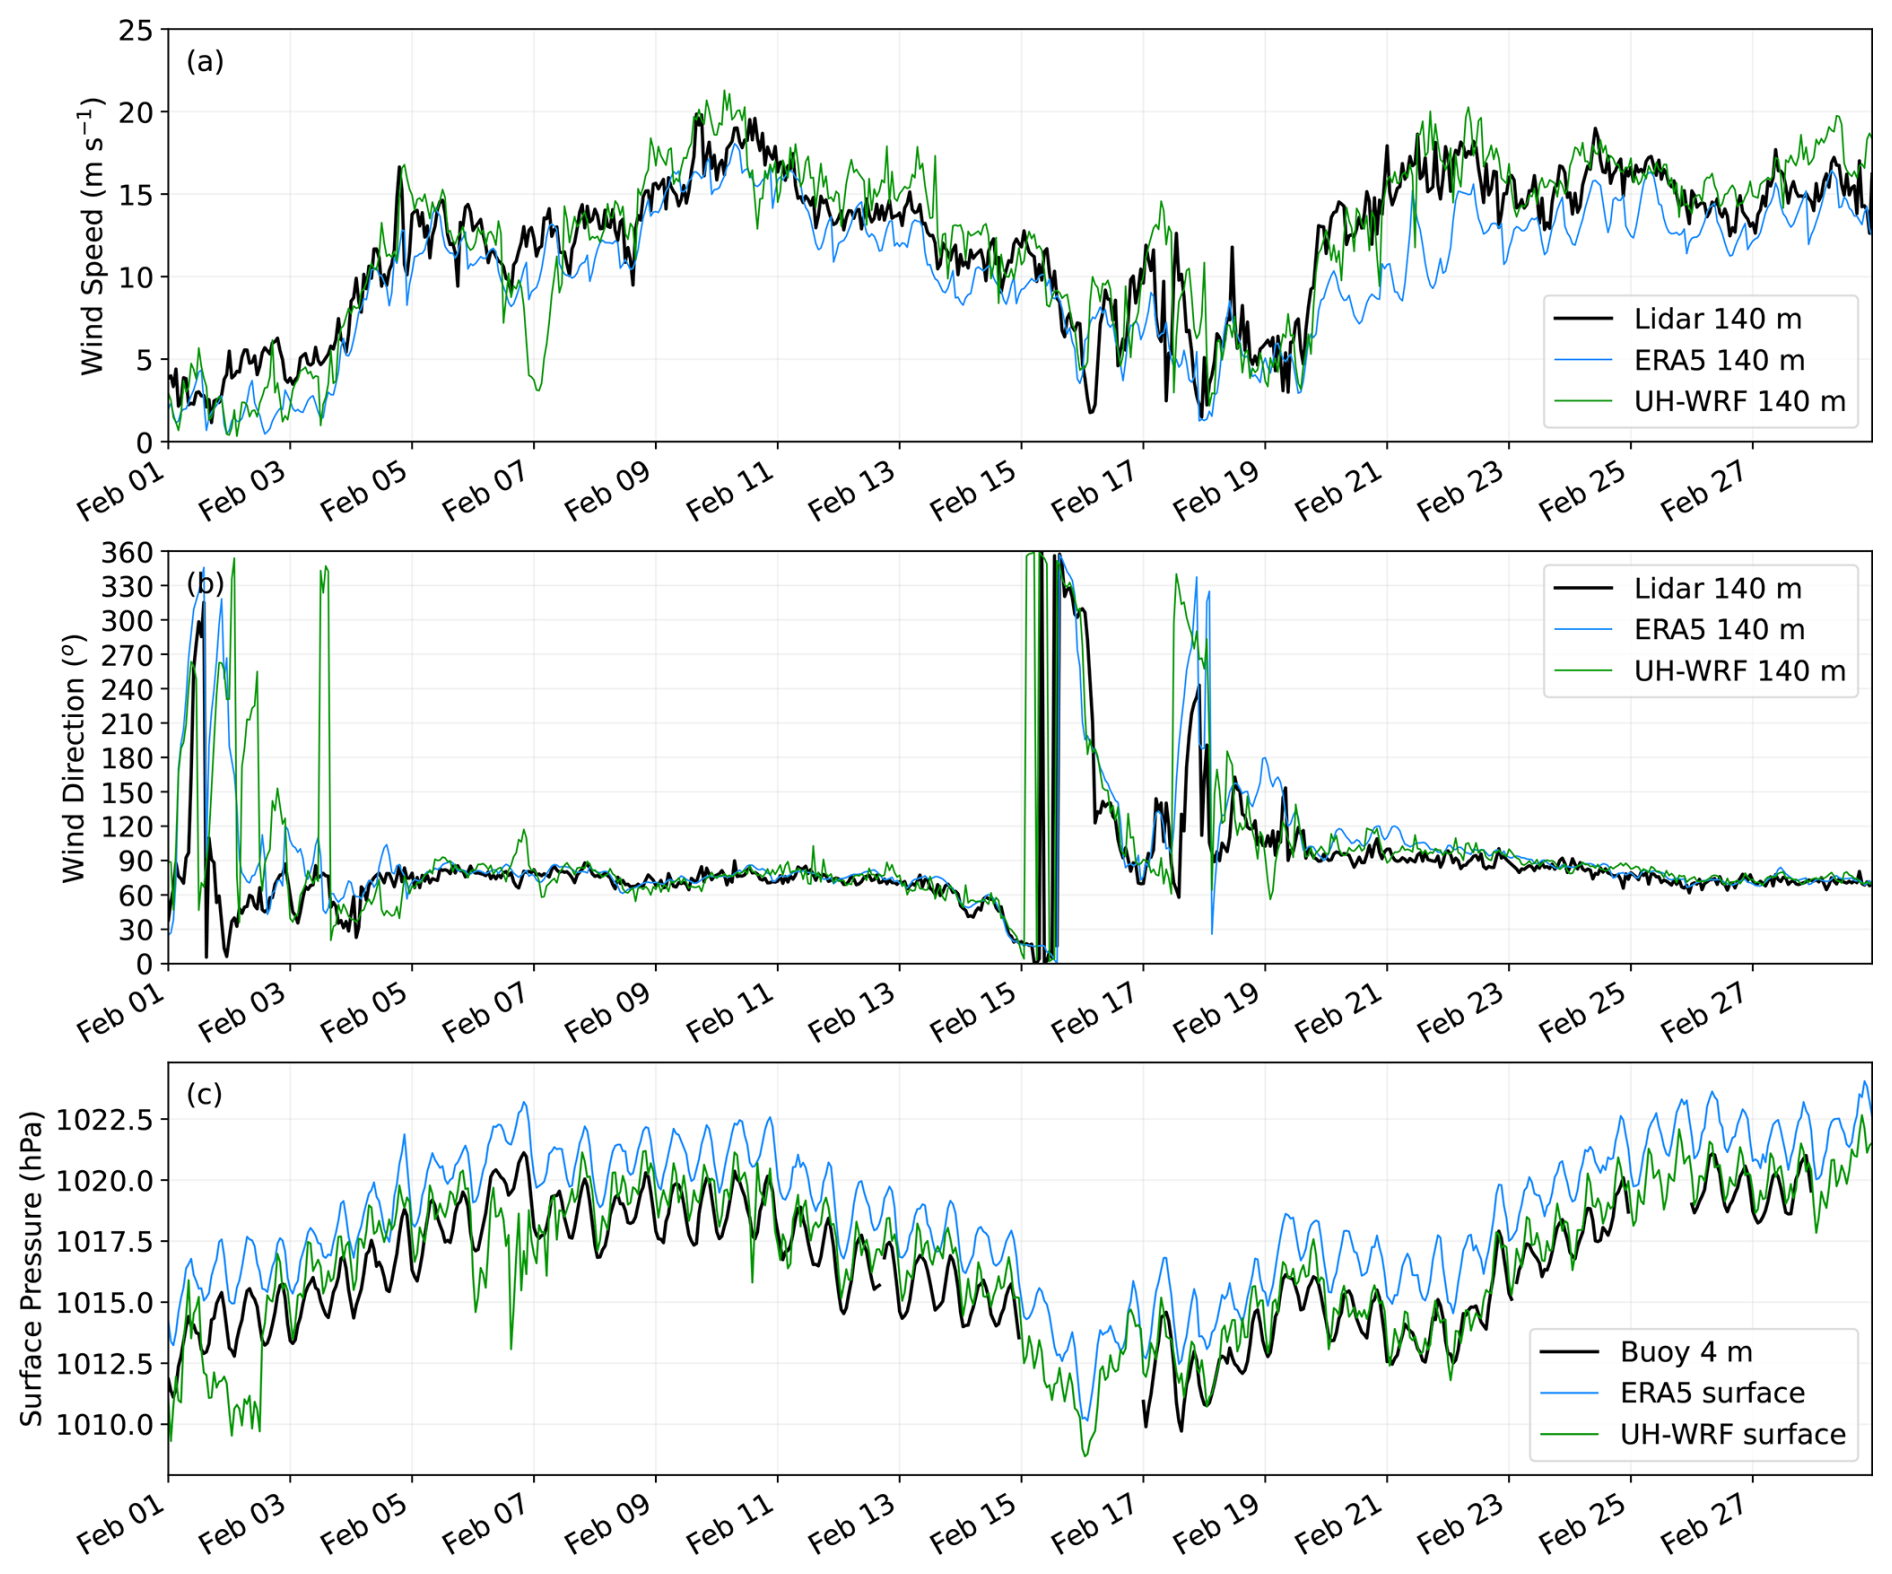
Figure 15Observed and modelled (a) wind speeds and (b) wind directions at 140 m; (c) surface air pressure at the lidar buoy location during February 2023 for buoy observation, ERA5, and UH-WRF.
While both simulation datasets capture the decrease in wind speed (Fig. 15a) and shift in wind direction from the dominant easterly pattern (Fig. 15b), they struggle with representing the temporal variations in the wind speeds during the Kona low events. ERA5 and UH-WRF simulations produce notably lower correlations during the low events between 15–19 February (0.63 and 0.46) relative to the entire deployment (0.89 and 0.85). The ERA5 wind speed biases at 140 m are smaller during the Kona low events relative to the entire deployment (−1.34 m s−1 versus −1.54 m s−1), while UH-WRF overestimates the observed wind speeds during the events at a greater magnitude than the model underestimates the observed wind speeds during the entire deployment (0.46 m s−1 versus −0.25 m s−1). Following the Kona low on 19 February, ERA5 simulates lower wind speeds for an extended period (19–25 February) compared to the observations. This could be attributed to several factors, including challenges in data assimilation after the Kona event, residual atmospheric instabilities delaying boundary layer recovery, misinterpretation of sea surface temperatures and moisture fluxes, or limitations in model physics and parameterizations. Further analysis will be addressed in upcoming work.
3.8.2 April 2023 frontal passage
The maximum 140 m wind speed recorded by the buoy is 21.8 m s−1, which occurred on 19 April 2023 and is associated with the passage of a strong cold front (NOAA, 2023b). Despite this event, which is captured by ERA5 and UH-WRF with varying degrees of success (Fig. 16), long-term ERA5 analysis indicates that the monthly average wind speed for April 2023 is within the 22nd percentile when considering all Aprils in the past 40 years (Fig. 6b), implying that the frontal passage has little impact on the overall monthly wind resource.
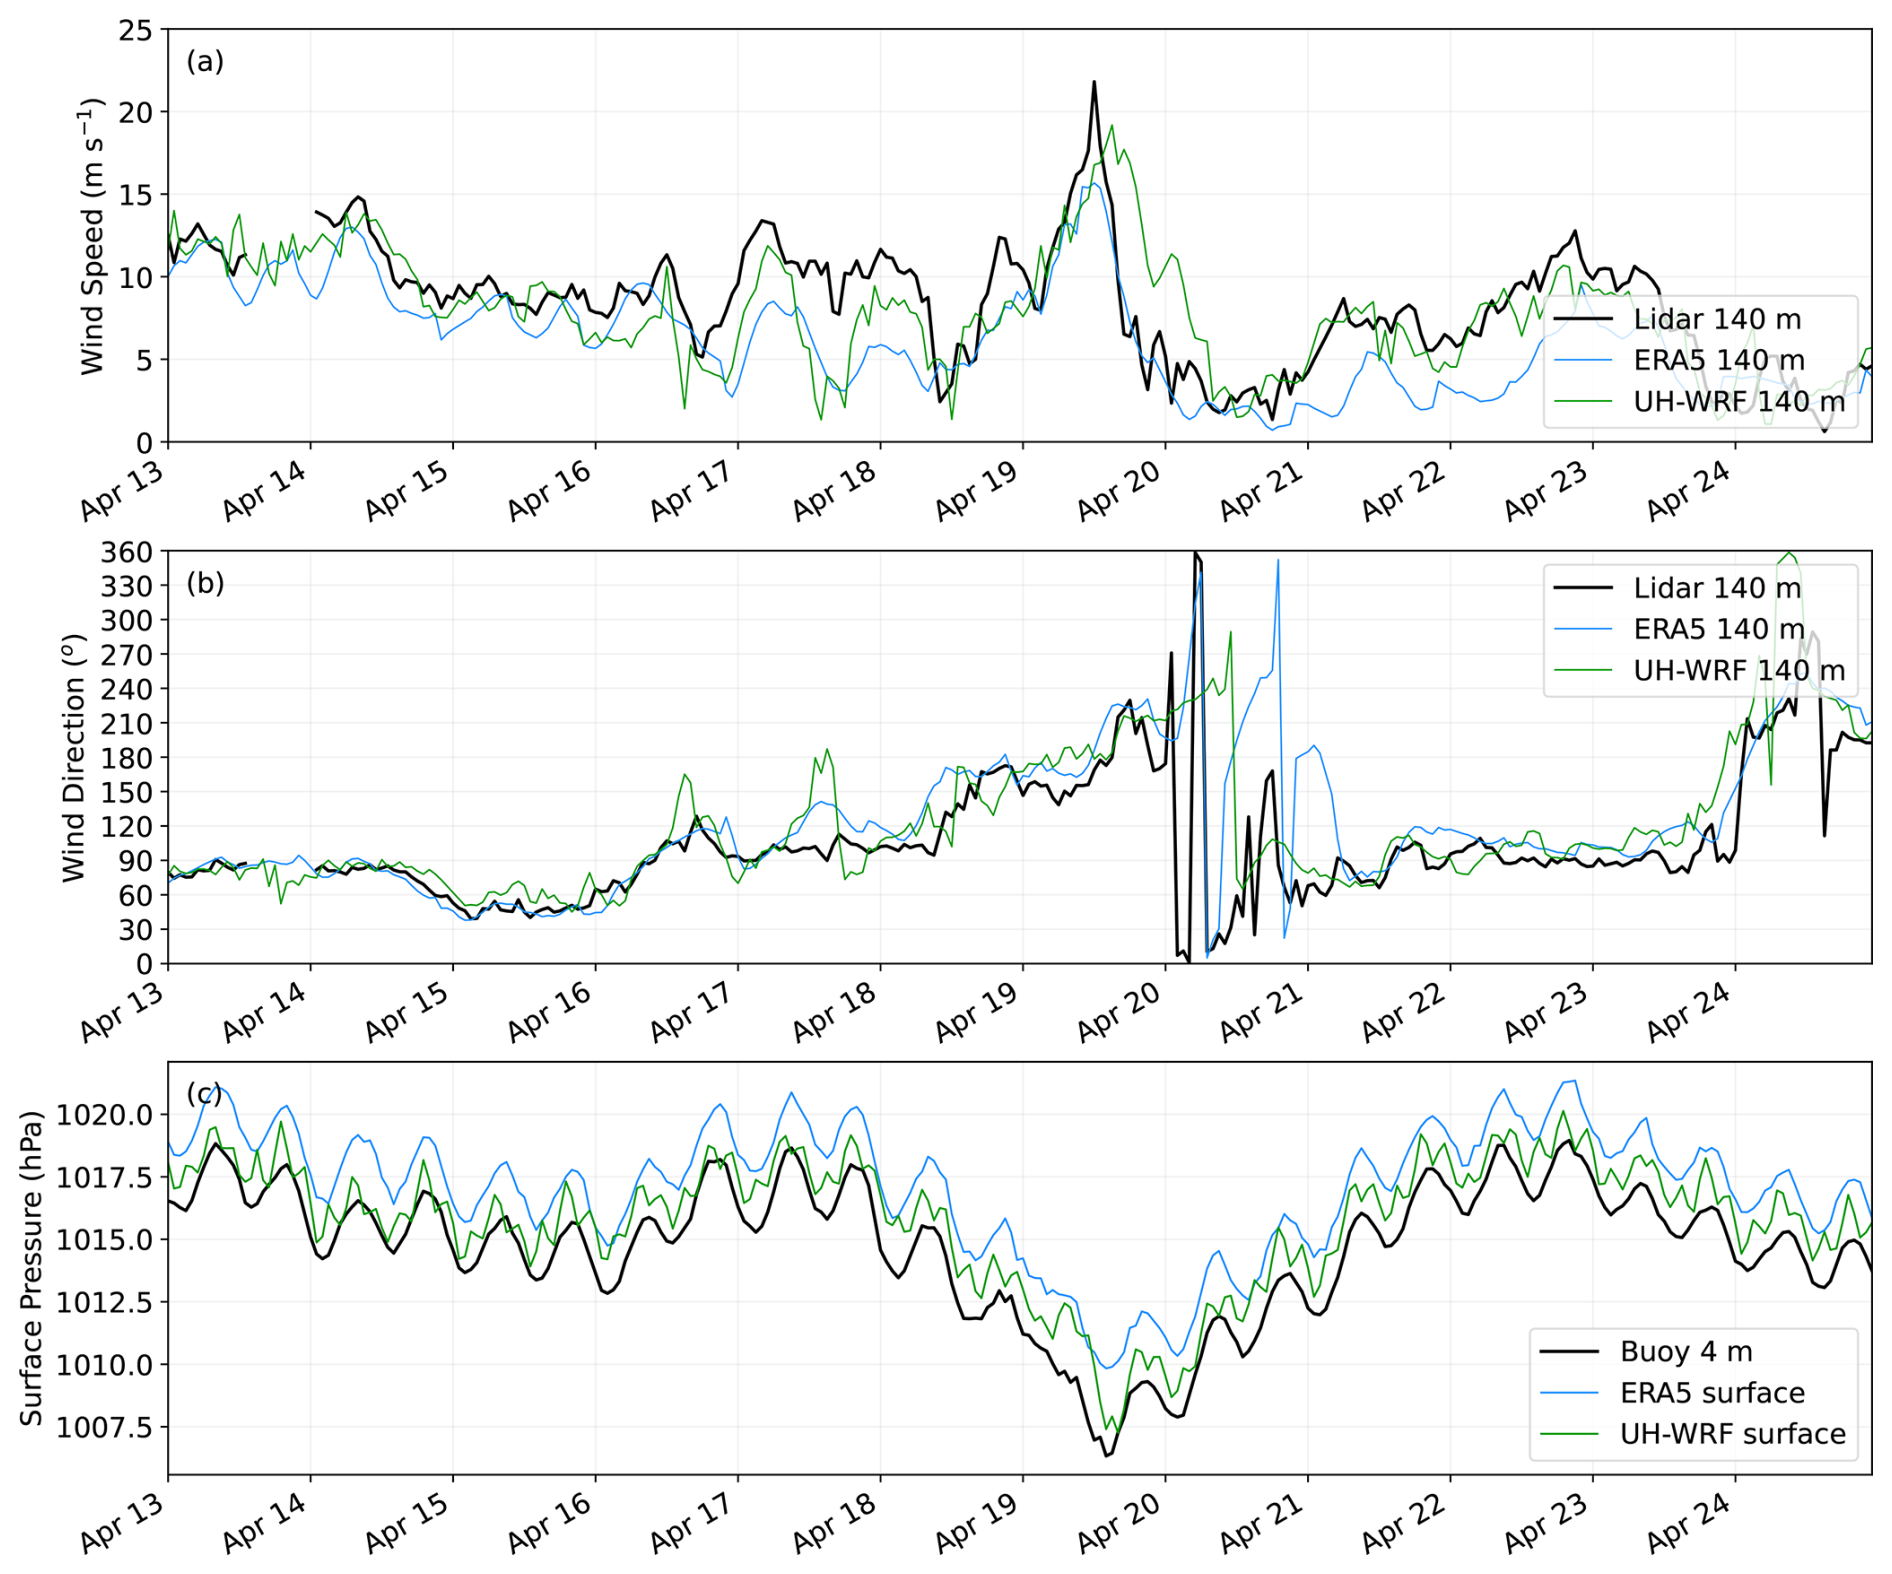
Figure 16Observed and modelled (a) wind speeds and (b) wind directions at 140 m; (c) surface air pressures at the lidar buoy location during 13–23 April 2023 for the buoy observation, ERA5, and UH-WRF.
As the pressure drops on 18 April, both ERA5 and UH-WRF miss an initial spike in the observed 140 m wind speed at 20:00 UTC that reaches 12.4 m s−1 (Fig. 16a). This discrepancy may be due to limitations in capturing rapid changes in pressure gradients that drive localized wind accelerations during the initial stages of the event. The maximum observed 140 m wind speed of 21.8 m s−1 occurs 16 h later at 19 April 12:00 UTC, likely driven by the strengthening of the pressure gradient and subsequent momentum transfer through heightened vertical mixing. While ERA5 simulates a peak at the same hour, it significantly underestimates the wind speed at 15.7 m s−1, potentially due to coarse spatial resolution and weaker representation of boundary layer turbulence and mixing processes. UH-WRF, with its finer resolution and more detailed boundary layer parameterization, captures a closer estimate of the peak wind speed at 19.2 m s−1; however, the model exhibits a 3 h delay, peaking at 15:00 UTC (Fig. 16a). This delay may result from inaccuracies in simulating the timing of mesoscale dynamics, such as propagating pressure disturbances and their interaction with local islands. Similar to the Kona low event on 19 February, ERA5 exhibits significant bias following the frontal passage, highlighting challenges with the model's representation and underlying physics.
Both ERA5 and UH-WRF exhibit a positive bias for surface pressure during this April period of 2.3 and 1.1 hPa, respectively (Fig. 16c). This compares to 2.3 and 0.4 hPa, respectively, during the February period (Fig. 15c). The consistently larger bias for ERA5 is likely related to its spectral dynamical core, which leads to ocean points near land not being exactly at sea level, combined with its coarser grid incorporating some island within the cell. The ERA5 land–sea mask for the buoy location includes 1 % land and an elevation of 15 m. The two fully ocean grid cells directly north and east of the buoy-containing cell have elevations of −8 m. Assuming a standard atmosphere density of 1.225 kg m−3, a back-of-the-envelope adjustment for 15 m elevation using the hydrostatic equilibrium equation results in a 1.8 hPa pressure change. This explains most of the difference between ERA5 and the UH-WRF and buoy data. The stated instrument uncertainty for the buoy's pressure sensor is 0.05 %. Given that pressure gradients impact the wind more than the pressure magnitude, the ability of the models to track the observed time variations is encouraging. The correlation for ERA5 is 0.994 and 0.995 for the February and April periods, with just a slightly lower correlations of 0.88 and 0.97 for UH-WRF.
3.8.3 August 2023 Hawai'i wind event and Hurricane Dora
On 8 August 2023, stronger-than-normal northeast trade winds impacted the Hawaiian islands and were a contributing factor in the fires that devastated the city of Lahaina on Maui (Mass and Ovens, 2024). On the same date, Hurricane Dora passed to the south of the islands (Bucci, 2024). The wind ramp event underscores the influence of an anomalously strong North Pacific subtropical high and resulting rare, strong easterly to northeasterly trade wind regime, which steepened the regional pressure gradient and produced anomalous wind patterns at the lidar buoy location.
East of the islands at the lidar buoy location, the observed and modelled winds shift further east–southeast from around 60 to 80° on 6 August (Fig. 17b). Beginning on 7 August at 15:00 UTC, the buoy measurements capture a ramp event when the 140 m wind speed increases by 6.63 m s−1 over the course of 5 h (Fig. 17a). The rapid increase in wind speeds can be attributed to enhanced vertical momentum transfer through turbulent mixing and boundary layer dynamics, likely exacerbated by the interaction of hurricane-induced pressure gradients and persistent trade wind surges. ERA5 simulates an increase in the 140 m wind speed starting 1 h later, with a less pronounced ramp (4.24 m s−1). The UH-WRF simulation depicts an increase in the 140 m wind speed of 3.42 m s−1 over a 4 h period starting at 15:00 UTC, followed by a stronger up-ramp later. Correlations for ERA5 and UH-WRF during the event are similar and slightly lower, respectively, compared to the entire deployment, at 0.90 and 0.81 versus 0.89 and 0.85. Wind speed biases at 140 m during the event are smaller relative to the overall deployment, with ERA5 showing a bias of −1.34 m s−1 versus −1.54 m s−1 and UH-WRF exhibiting a bias of 0.03 m s−1 versus −0.25 m s−1. While both ERA5 and UH-WRF simulations partially captured the event, discrepancies in timing and magnitude underscore limitations in turbulent mixing, boundary layer representation, and resolution, particularly when simulating mesoscale processes in complex terrain or offshore environments. Understanding the interaction between synoptic and mesoscale forces during extreme events like this provides critical insight into improving atmospheric modelling techniques for future studies.
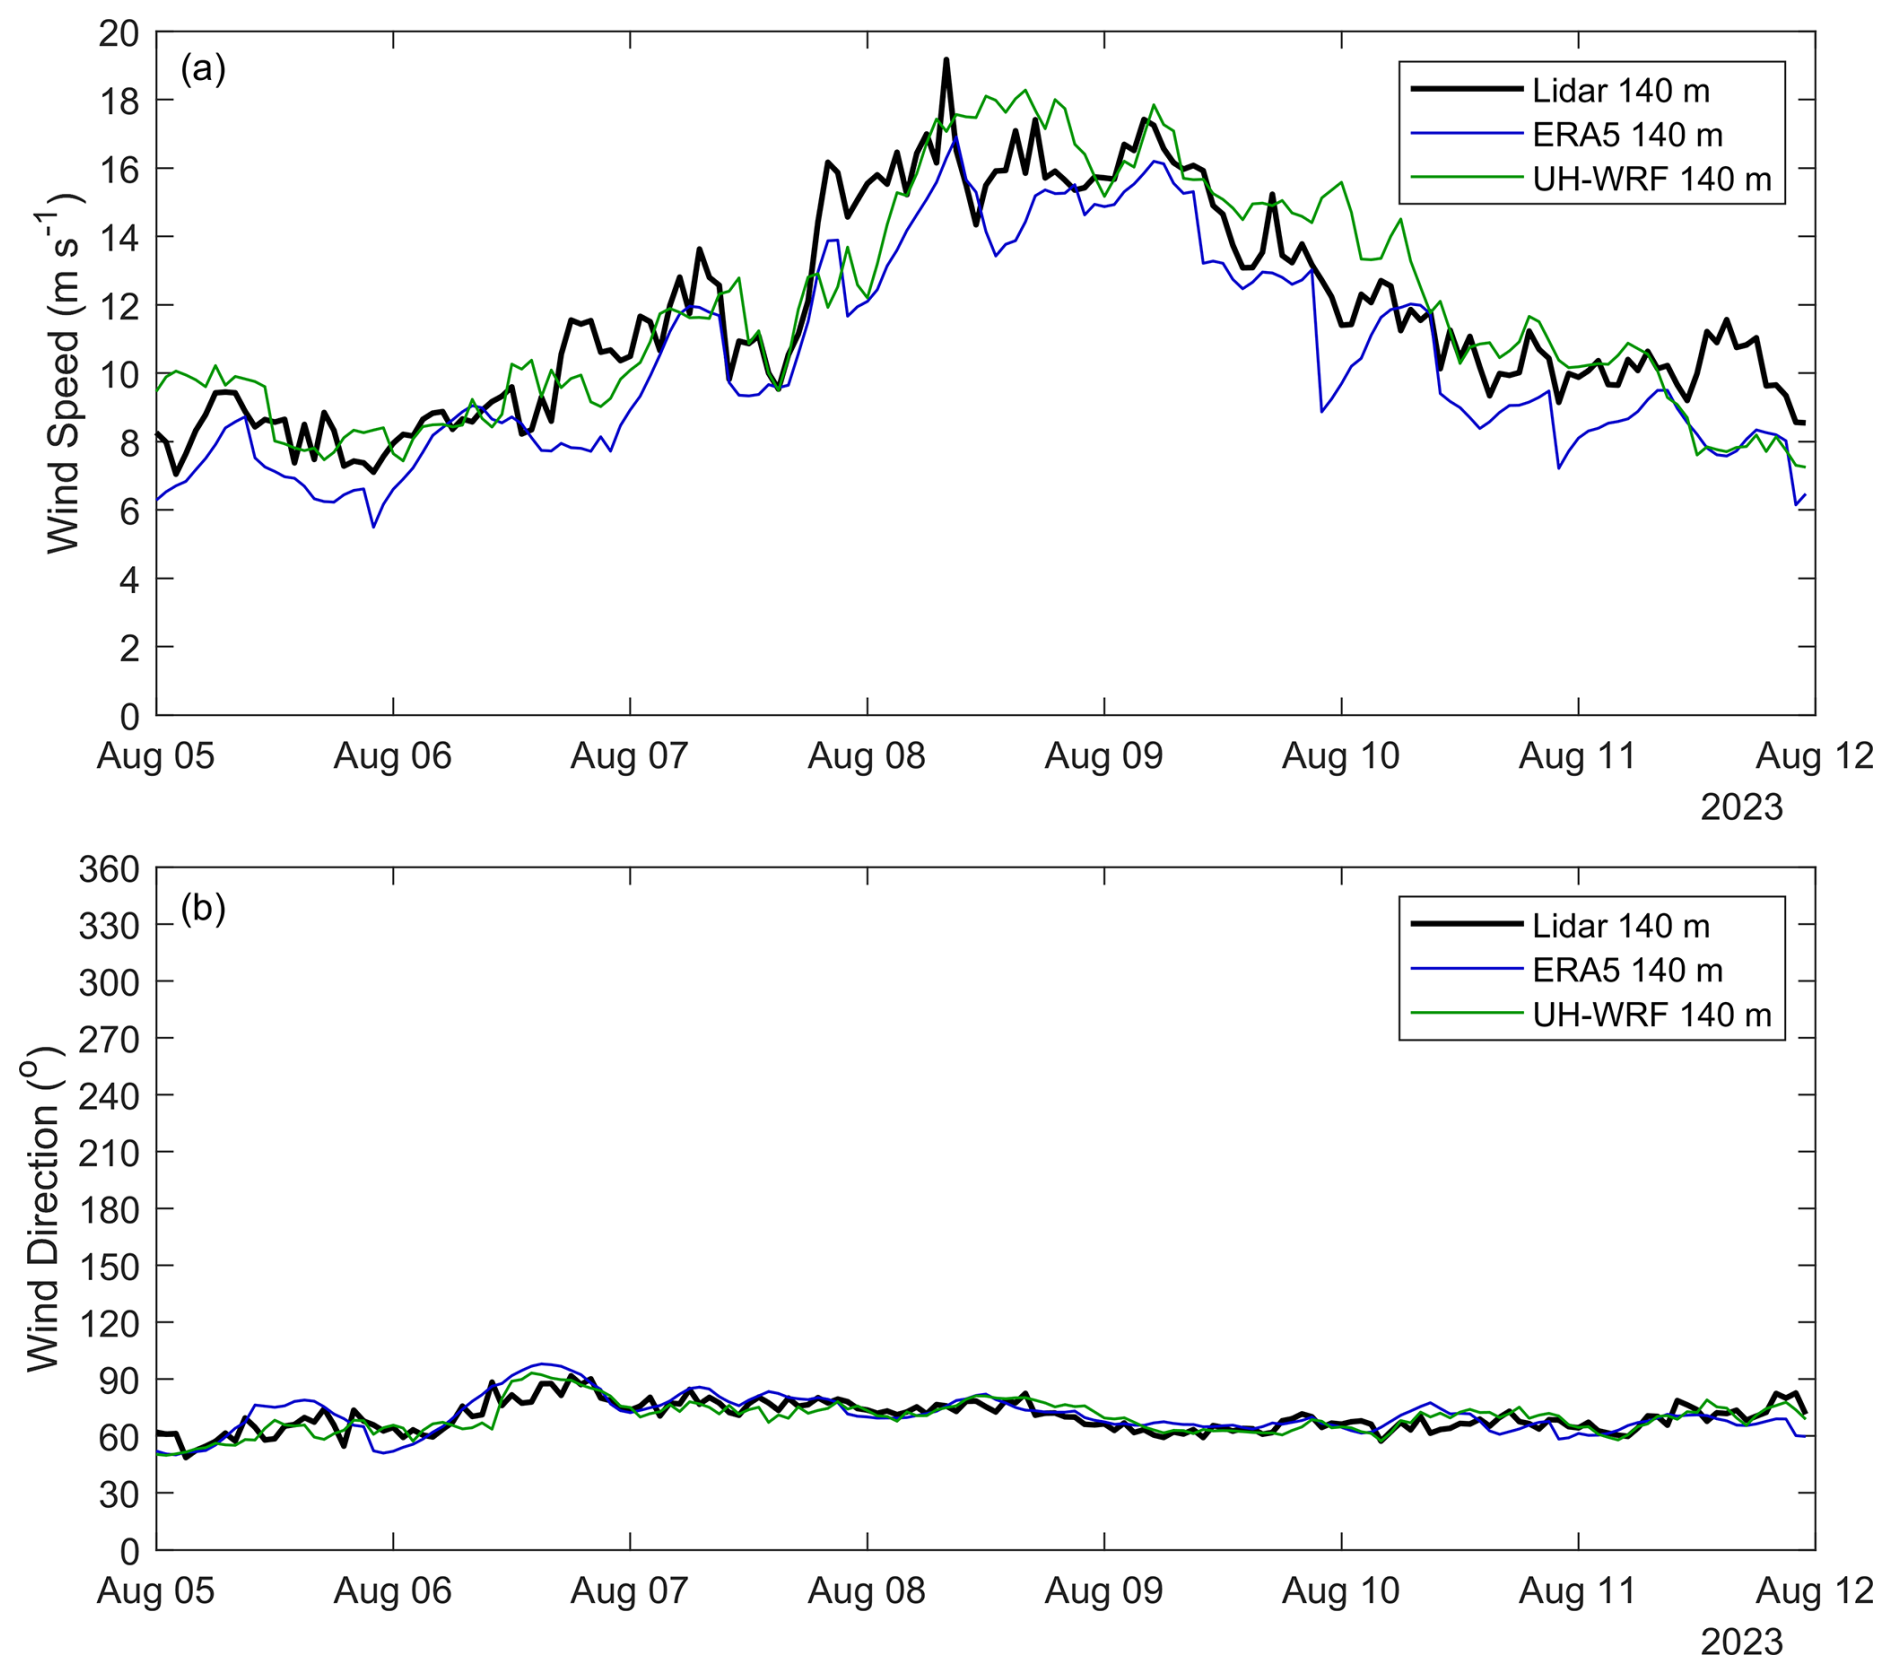
Figure 17Observed and modelled (a) wind speeds and (b) wind directions at the lidar buoy location during the August 2023 Hawai'i wind event.
In this study, we questioned and established the accuracy of a widely used reanalysis model and a regional model in the representation of the observed marine boundary layer in a previously unstudied location off the coast of O'ahu, Hawai'i, using lidar buoy measurements. The wind speed biases quantified in this validation provide important baselines for researchers and energy developers, offering insights into the performance of models and datasets when estimating the long-term wind resource in the Hawaiian region. This analysis highlights the importance of understanding wind speed bias and variability, including seasonal and diurnal wind trends, to improve characterization of the wind resource in the area.
In particular, the results of this investigation near Hawai'i corroborate previous reports of ERA5's underestimation of observed marine boundary layer winds as documented by Kalverla et al. (2020) over the North Sea; Sheridan et al. (2020) off the coasts of New Jersey and Virginia, United States; Pronk et al. (2022) and Fragano and Colle (2025) off the coast of New Jersey, United States; and Sheridan et al. (2022) off the coast of central California, United States. Given the consistent trade winds at the O'ahu deployment site, we do not attribute the large ERA5 wind speed bias (−1.54 m s−1) to the coarseness of the grid leading to mischaracterization of meteorological phenomena such as wind ramps, simply because the observations yielded so few of these events (Sect. 3.6), though such errors have been shown to be significant at other offshore sites where they are more prevalent (Kalverla et al., 2020; Sheridan et al., 2024). Rather, we note that ERA5 significantly underestimates fast wind speeds (Fig. 5), which our study site is strongly characterized by (Fig. 2). Gandoin and Garza (2024) provide evidence of ERA5's underestimation of fast wind speeds and link the results to ERA5's representation of the Charnock parameter. We also speculate that the relative sparsity of observations for data assimilation in this remote part of the world could influence the ERA5 error metrics, along with the discontinuities in the diurnal cycle noted in this work (Fig. 7) and that of Kalverla et al. (2019). We recommend that users of ERA5 in the vicinity of the O'ahu buoy deployment adjust the initial wind speed and energy generation expectations higher through bias correction (Wilczak et al., 2024) and welcome the use of our publicly available buoy observations (DOE, 2025a, b, c).
Conversely to the challenges noted for ERA5 in terms of wind speed bias, this study underscores the importance of long-term, continuously refined, and dynamically updated reanalysis models. Offshore of O'ahu, the year 2023 exhibited atypical annual average wind speeds (Fig. 3b), as well as seasonal and diurnal wind speed variations (Figs. 6, 7). Conducting a wind resource assessment based solely on observations from a single year would fail to capture interannual variability, leading to inaccurate wind energy generation estimates for regions east of O'ahu. Combining multi-year observations with simulation datasets provides a more robust and comprehensive baseline understanding of generation expectations.
The validation of the UH-WRF simulations in this study highlights the advantage of high-resolution regional models for improving accuracy in wind resource assessments when financial and computational resources permit the generation of these datasets. The UH-WRF simulations exhibit a significantly smaller bias (−0.25 m s−1) compared to ERA5 and a correlation (0.85) close to ERA5 (0.89) at the O'ahu site. Both models successfully capture the observed seasonal wind speed cycle driven by changes in large-scale pressure gradients and trade wind trends; however, UH-WRF excels in resolving the diurnal cycle (Fig. 7), which is influenced by localized boundary layer processes such as thermal stratification, land–sea breezes, and turbulent mixing. Despite the limited temporal scope of regional models like UH-WRF due to computational expense, their detailed representation of smaller-scale processes creates opportunities for researchers to refine long-term estimates by bias correcting extended-duration datasets using high-quality, short-duration simulations (Buster et al., 2024). This combined approach addresses key atmospheric dynamics and enhances confidence in wind resource characterization.
Throughout the deployment period, several extreme weather events revealed the performance of ERA5 and UH-WRF in capturing atmospheric conditions offshore of O'ahu. During the February 2023 Kona lows, trade wind disruption led to weaker wind speeds and variable directions, with both models capturing the general trends but exhibiting low correlations and notable biases, particularly UH-WRF's overestimation by 0.46 m s−1 (Fig. 15). The April 2023 cold frontal passage produced the strongest observed wind speeds (21.8 m s−1); however, ERA5 significantly underestimated the peak (15.7 m s−1) and missed an initial wind spike, while UH-WRF produced closer estimates (19.2 m s−1) but with a 3 h delay, highlighting issues in simulating mesoscale dynamics and turbulent mixing (Fig. 16). The August 2023 event with unusually strong trade winds resulted in rapid wind ramping, with ERA5 and UH-WRF capturing the overall trends but struggling with timing and magnitude (Fig. 17). These events demonstrate the models' strengths in representing general atmospheric patterns but also emphasize limitations in simulating finer-scale dynamics, boundary layer processes, and temporal variability during extreme weather conditions.
Onsite measurements spanning atmospheric layers are critical to understanding the accuracy of the models and datasets used to characterize boundary layer dynamics through resource assessment, wind trend analysis, and downscaling. Studies like this one highlight the wealth of information that can be obtained for establishing observation-based characterizations of boundary layer processes, evaluating simulation accuracies, and identifying opportunities for model correction. This work underscores the importance of conducting further observational campaigns in unstudied regions to improve understanding of boundary layer physics and strengthen model representations of atmospheric processes.
A1 Instrumentation
The Pacific Northwest National Laboratory (PNNL) operates lidar buoys that are owned by the US Department of Energy to collect atmospheric and oceanographic observations in under-studied regions. The buoys have previously collected measurements off the coast of Virginia, New Jersey, and California (Gorton and Shaw, 2020; Krishnamurthy et al., 2023). Prior to deployment off O'ahu, the lidar buoy underwent validation at the Woods Hole Oceanographic Institution's Martha's Vineyard Coastal Observatory from January to June 2020 and was subsequently deployed off the coast of Humboldt County, California, from October 2020 to December 2021. The validation at Martha's Vineyard utilised an International Electrotechnical Commission-certified reference lidar atop an offshore platform approximately 250 m from the lidar buoy. The validation produced wind speed coefficients of determination (R2) exceeding 0.98 and wind direction R2 values exceeding 0.97 up to 200 m above sea level (a.s.l.) (Gorton and Shaw, 2020). The buoy is equipped with a wind-profiling lidar capable of measuring wind speed up to 250 m above the instrument. Surface meteorological measurements, oceanographic measurements, wave spectra, and the ocean current profile were collected from the instruments installed on the buoy. A detailed discussion of the instrumentation aboard the buoy, which did not change between the California and Hawai'i deployments, is provided in Severy et al. (2021).
A2 Field deployment summary
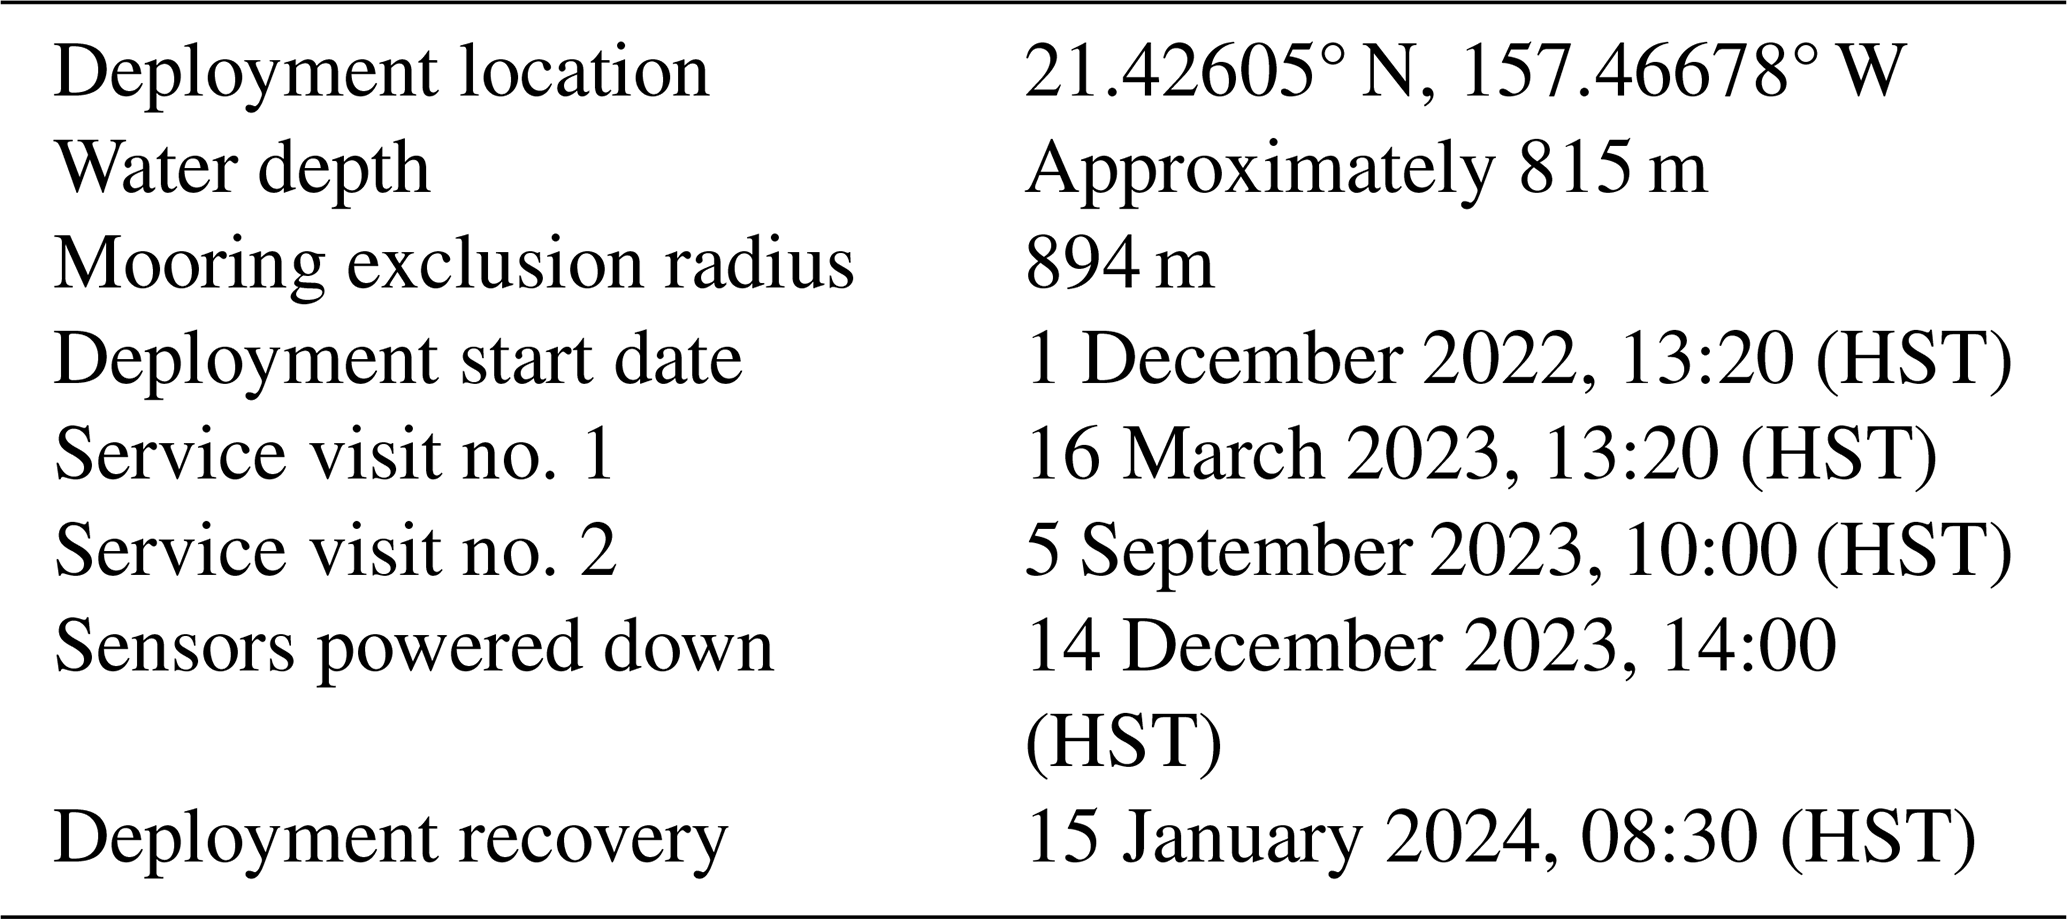
A 12-month measurement campaign of atmospheric and oceanographic conditions using an AXYS WindSentinel buoy was conducted off the eastern coast of O'ahu, Hawai'i (Fig. A1), from December 2022 through December 2023 (Table A1). Instruments on the buoy were operational throughout the field campaign, with the exception of those mentioned below. After the initial deployment, the wave sensor was observed to be not operational; a service visit was completed on 16 March 2023 at 13:20 (HST) to repair the sensor. In addition, the lowest measurement height (40 m) of the Doppler lidar was adjusted to 50 m on 28 April 2023 due to the anomalous behaviour that was observed at the 40 m range gate. Post-deployment, a thorough servicing of the lidar unit was conducted by the manufacturer, and it was determined that only the measurements from 40 to 49 m were impacted due to an issue with the lidar's master oscillator power amplifier. Therefore, we recommend that data only above 50 m be used for any future analysis. Later in the spring of 2023, the air temperature sensor produced occasionally faulty measurements; once the weather allowed, a second service visit was completed to replace the air temperature and relative humidity sensors on 5 September 2023 at 10:00 (HST). On 14 December 2023, 14:00 (HST), the sensors were powered down to conserve energy after receiving a low-fuel warning. The wave sensor and surface wind anemometer, along with the safety and navigation equipment, remained powered on to track the buoy location and monitor weather conditions to find a suitable recovery window. On 15 January 2024, at 08:30 (HST), the buoy mooring was recovered, and the buoy was towed back to shore.
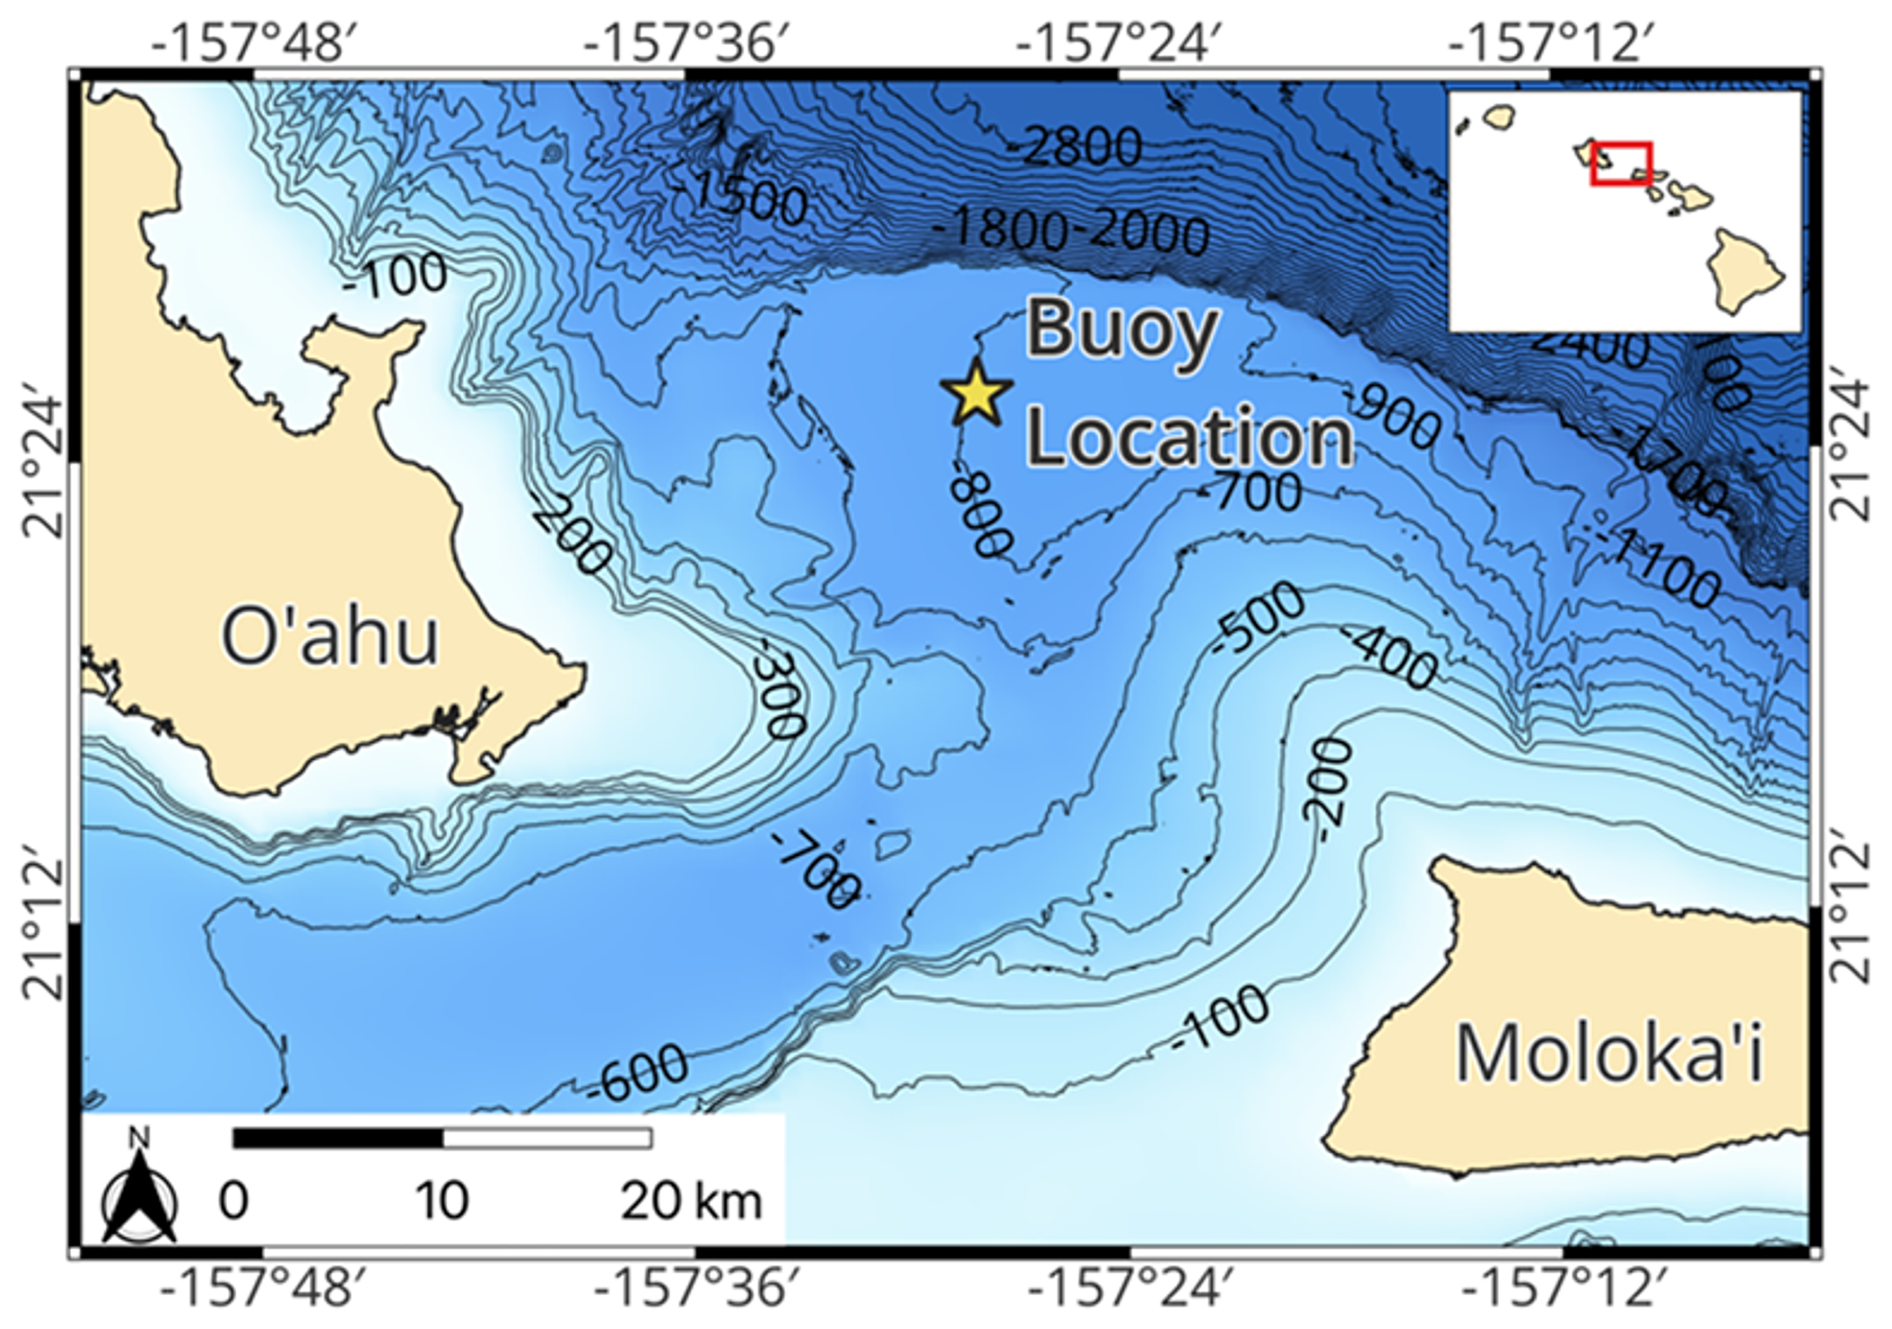
Figure A1Buoy deployment location.
A3 Data quality control
Throughout the field campaign, measurements collected from the buoy were transmitted via satellite communication to the DOE Wind Data Hub (http://a2e.energy.gov/project/buoy/data, last access: 25 November 2025). Measurements from the wind profiling lidar are contained in buoy/lidar.z07.* files, measurements from the other instruments are contained in the buoy/buoy.z07.* files, and images from the onboard cameras are contained in the buoy/camera.z07.00 files. Datasets appended with *.00 are for raw data; datasets appended with *.a0 are for data processed based on automated quality control scripts. This section described the production of the *.b0 dataset, which performs a quality control on the measurements based on post-processing and evaluation of instrument function and realistic physical phenomena. The data quality control for this field campaign was very similar to that of previous buoy deployments, with details provided in Krishnamurthy et al. (2023).
A3.1 Surface meteorology on the buoy
Each surface meteorological measurement (wind speed, wind direction, air pressure, air temperature, and relative humidity) was subjected to the quality control methodology of Krishnamurthy et al. (2023). At each 10 min timestamp, the surface measurements were evaluated and determined to be of good quality, missing (due to a power outage, communication issue, or instrument availability issue), or suspect or incorrect based on typical and physical expectations (Fig. A2).
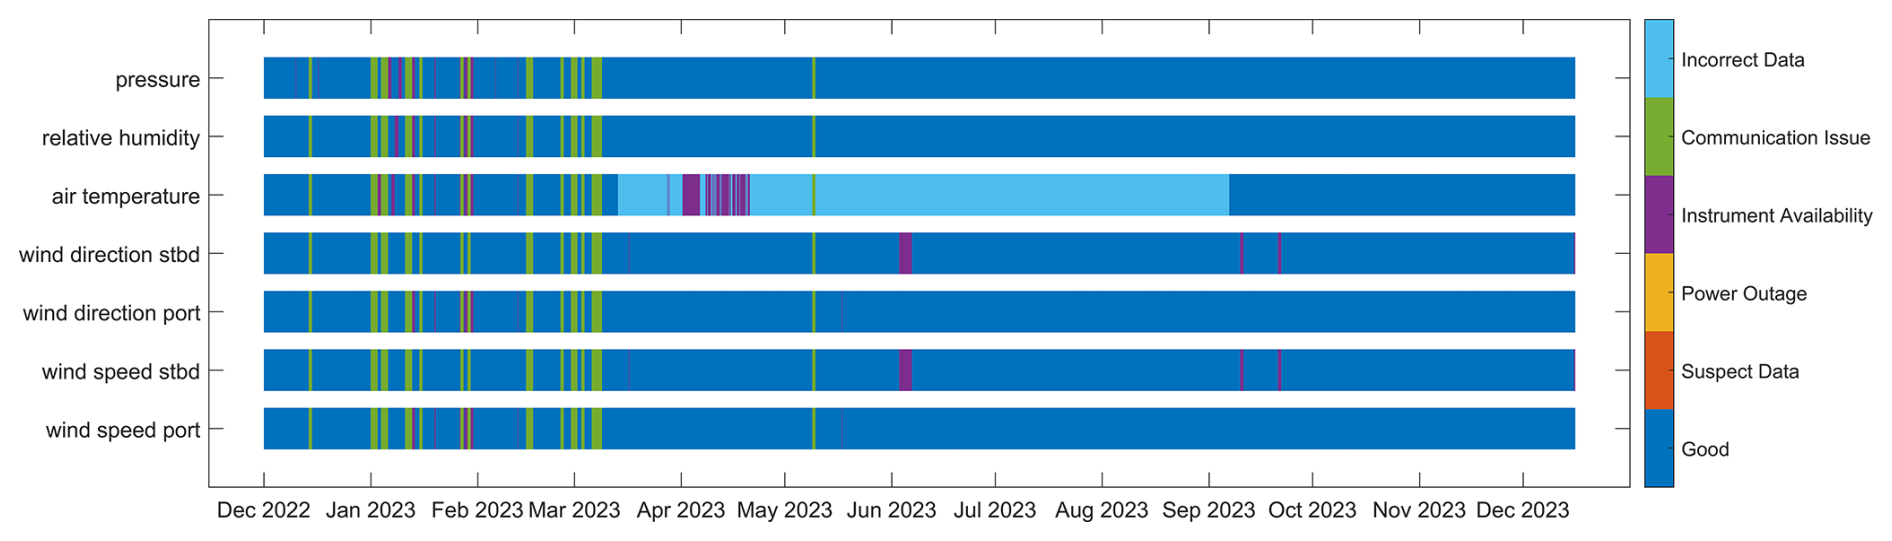
During the Hawai'i deployment, 5 % of the surface measurements (all variables) were missing due to communication issues. At no time periods were the surface measurements deemed suspect or missing due to a buoy power outage. The portside and starboard wind speeds, portside and starboard wind directions, relative humidity, and pressure were missing due to instrument availability for less than 2 % of the deployment. No instances of incorrect data were noted for the portside and starboard wind speeds, portside and starboard wind directions, and pressure, and only three instances of incorrect data (0.01 %) were determined for the relative humidity, leaving 93 %–94 % of good data availability for these surface variables (Fig. A2).
Between 13 March 2023 and 6 September 2023, much of the air temperature data were deemed unphysical, with reported temperatures ranging between −36 and 60 °C. Due to this data quality issue, 42 % of the air temperature measurements gathered during the Hawai'i deployment were classified as incorrect. An additional 5 % of the air temperature measurements were missing due to instrument availability, leaving 47 % of the data designated as good quality and available (Fig. A2).
In terms of capturing the temporal variability of the near-surface wind speeds, the port and starboard wind speed instruments aboard the buoys were in near-perfect agreement during the Hawai'i deployment, with a Pearson correlation coefficient of 0.9993. However, a small bias (0.05 m s−1) exists between the two instruments during the period of overlapping data availability, with the port wind speed measurements being slightly faster. Similarly, the portside wind directions are on average 3° greater than the starboard wind directions.
A3.2 Buoy Doppler lidar
Height-resolved measurements of wind speed, wind direction, and turbulent intensity were provided by a Windcube v2 Doppler lidar. This buoy and lidar had previously been deployed off the California coast near Humboldt Bay. For the Hawai'i deployment, the Windcube was initially configured in the same manner, with 12 measurement heights ranging every 20 m from 40 to 240 m (Krishnamurthy et al., 2023). The lowest measurement height was adjusted up to 49 m on 28 April 2023 due to suspected bias in the results at 40 m a.g.l., as mentioned previously. The heights of the other 11 measurement heights remained unchanged throughout the deployment.
The raw 1 Hz wind profiles measured by the Windcube were corrected for platform motion. For the current deployment, we use the same motion-correction procedure that was applied during a previous deployment near Humboldt Bay, California (Krishnamurthy et al., 2023). This procedure uses input from an externally mounted backup inertial measurement unit (IMU) to essentially bypass the lidar's internal IMU, which had malfunctioned. Further details about the motion-correction process are provided by Krishnamurthy et al. (2023).
Motion-corrected 1 Hz data are used to compute 10 min averages of wind speed, wind speed variance, wind direction, wind direction variance, and velocity variances and covariances. Prior to averaging, the 1 Hz data were filtered to remove poor-quality samples with carrier-to-noise ratios (CNRs) below −23 dB. Velocity variances were computed by first linearly detrending the 1 Hz data (Krishnamurthy et al., 2023). The data availability was also computed as the percentage of 1 s samples above the CNR threshold (−23 dB). We note, however, that there was a small amount of dead time associated with the IMU data. Raw 10 Hz IMU was stored in half-hourly files, which were not temporally contiguous. There was about a 30 s gap at the beginning and end of each raw IMU file. This resulted in a 1 min gap every 30 min. As a result, the data availability is ultimately limited by these short gaps in the raw IMU data.
Figure A3 shows the profile of lidar data availability (DA) during the Hawai'i deployment. The data availability represents the percentage of time that valid 1 Hz measurements are available within each 10 min averaging period. It is important to note that the DA is computed over the time for which valid data exist. As a result, the DA for the two lowest measurement heights was computed over shorter time periods than the other heights. The data availability generally degrades with altitude, particularly above about 150 m a.g.l. The height-averaged DAs were 98 %. As noted above, the DA is ultimately limited by the dead time in the raw 10 Hz IMU data.
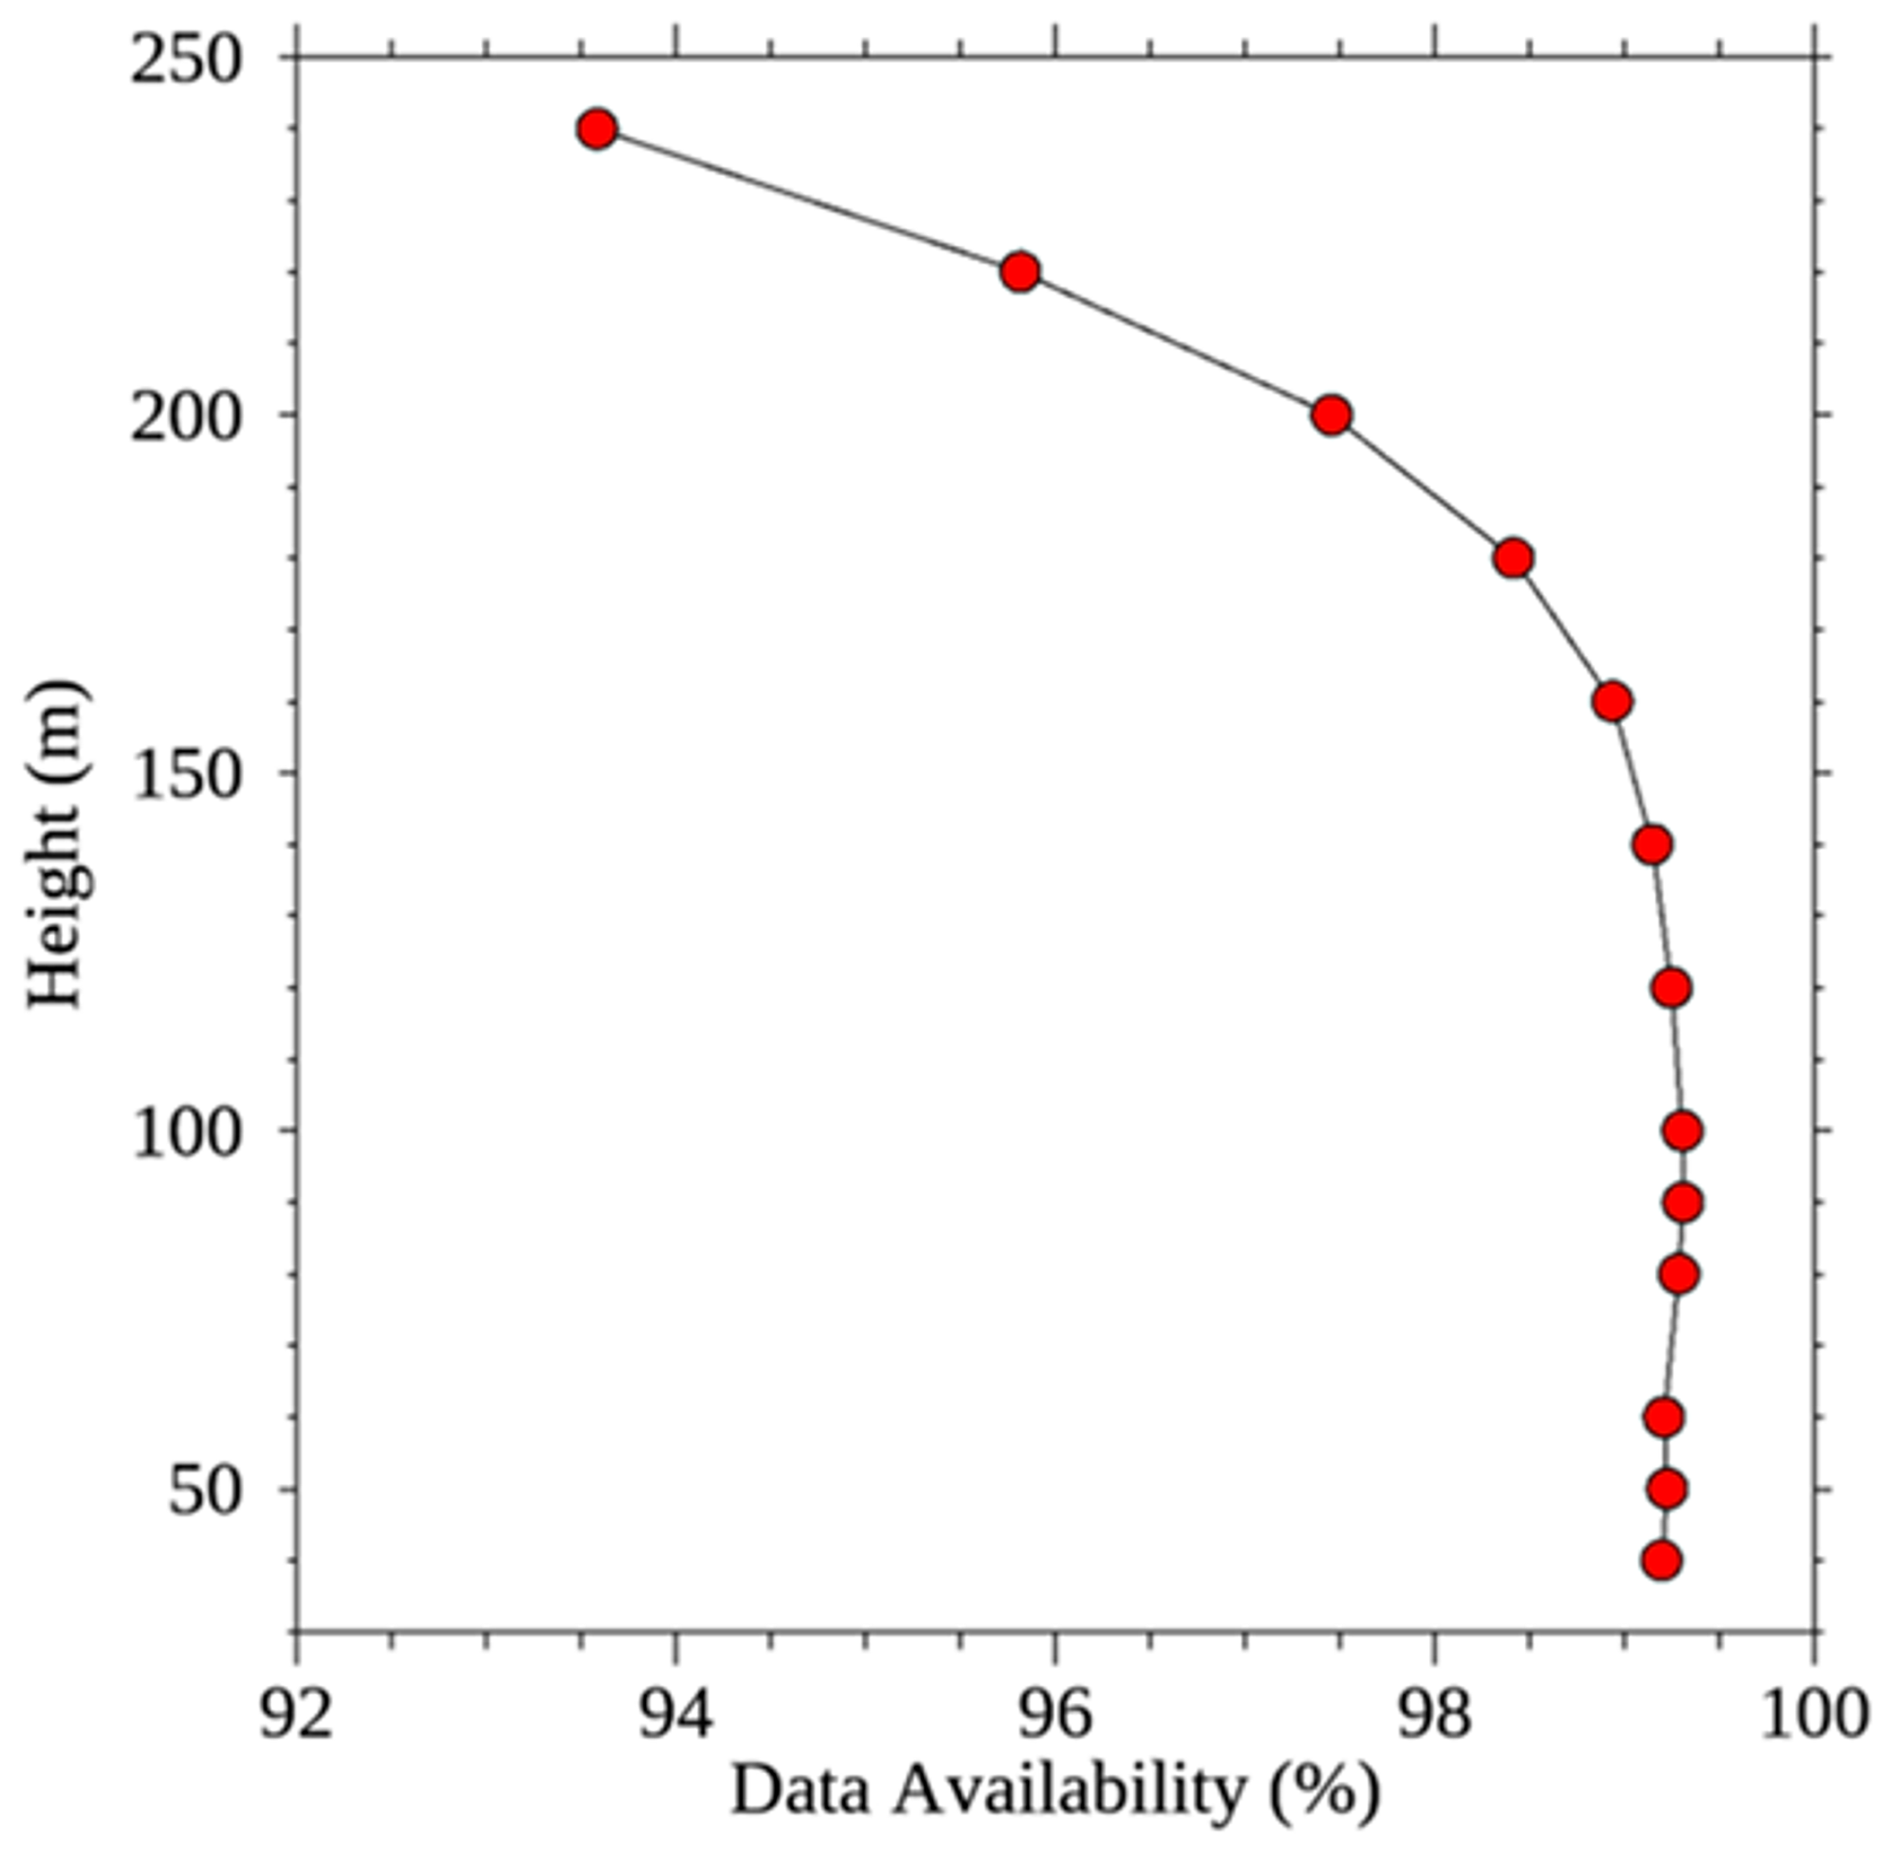
Figure A3Data availability for the lidar winds during the Hawai'i deployment. The data availability for the lowest measurement height (40 m) was computed over the period from 1 December 2022 to 28 April 2023, after which the measurement at this height was not recorded anymore due to an issue observed at this height. The data availability at 50 m was computed over the period from 29 April to 14 December 2023. The data availability at 60 m and above was computed over the period from 1 December 2022 to 14 December 2023.
The wind speed profiles shown in Fig. A4a exhibit very little shear above 50 m. At 100 m a.g.l., the median wind speeds range from about 8.5 to 9.5 m s−1, depending on the averaging period. This is significantly smaller than the wind resources observed by this same lidar off the California coast (Krishnamurthy et al., 2023). Also shown in Fig. A4a are profiles of the median wind speed during periods with positive and negative air–sea temperature differences. Here the air–sea temperature is used to indicate stable versus unstable conditions. The air–sea temperature difference was obtained from the difference between the air temperature sensor at ∼ 3 m and the CTD water temperature sensor at a water depth of ∼ 1 m. We found the air–sea temperature differences to be negative (unstable) 64 % of the time during the deployment period.
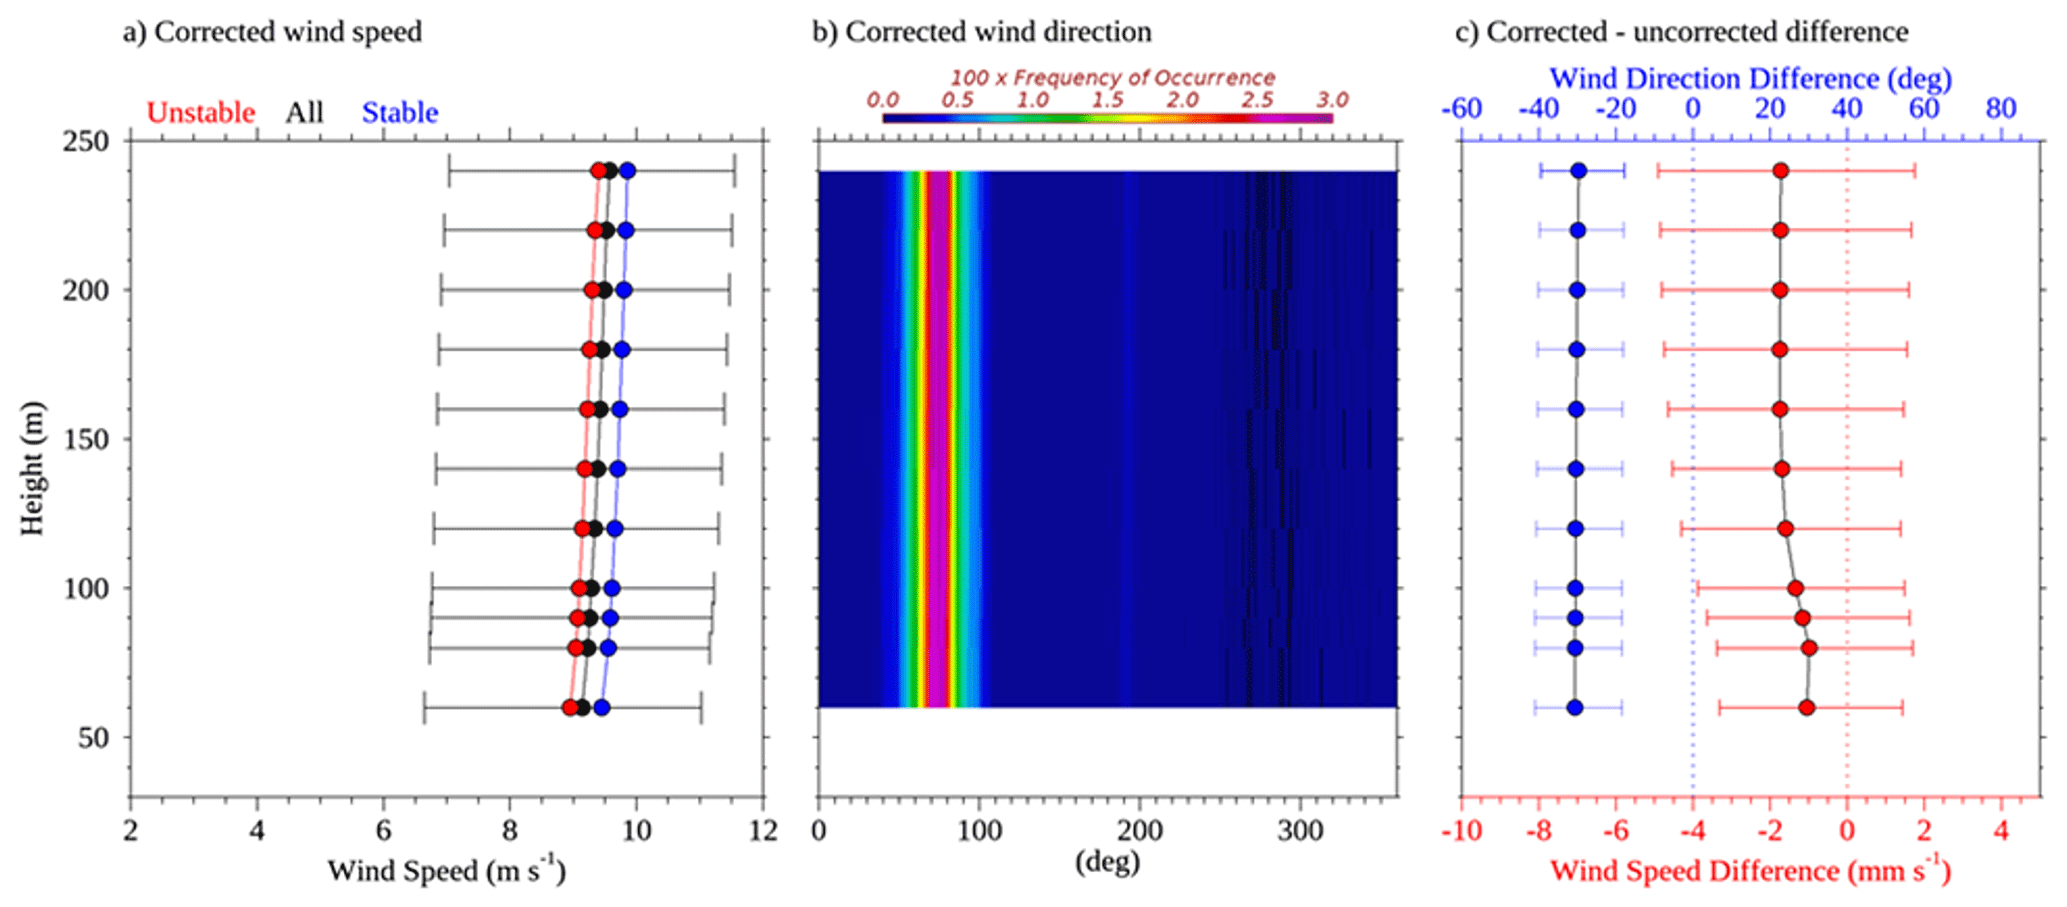
Figure A4Results from the Windcube v2 averaged from 29 April 2023 to 14 December 2023 showing (a) the median corrected wind speed profile (black), (b) the corrected wind direction distribution profile, and (c) the difference between the motion-corrected and motion-uncorrected wind speed and wind direction. Also shown in (a) are the median wind speed profiles for periods with positive (blue) and negative (red) air–sea temperature differences. Error bars show the 25th to 75th percentile range.
Figure A4c shows profiles of the difference between the motion-corrected and motion-uncorrected wind speed and wind direction. The wind speed differences are quite small, with the motion-corrected wind speeds only about 2 mm s−1 faster than the motion-uncorrected winds. By contrast, motion correction had a significant effect on the wind direction, as one would expect. The lidar wind direction profiles shown in Fig. A4 indicate a strong preference for easterly flow and no significant rotation with height within the first 250 m above the sea surface.
A3.3 Buoy oceanographic measurements
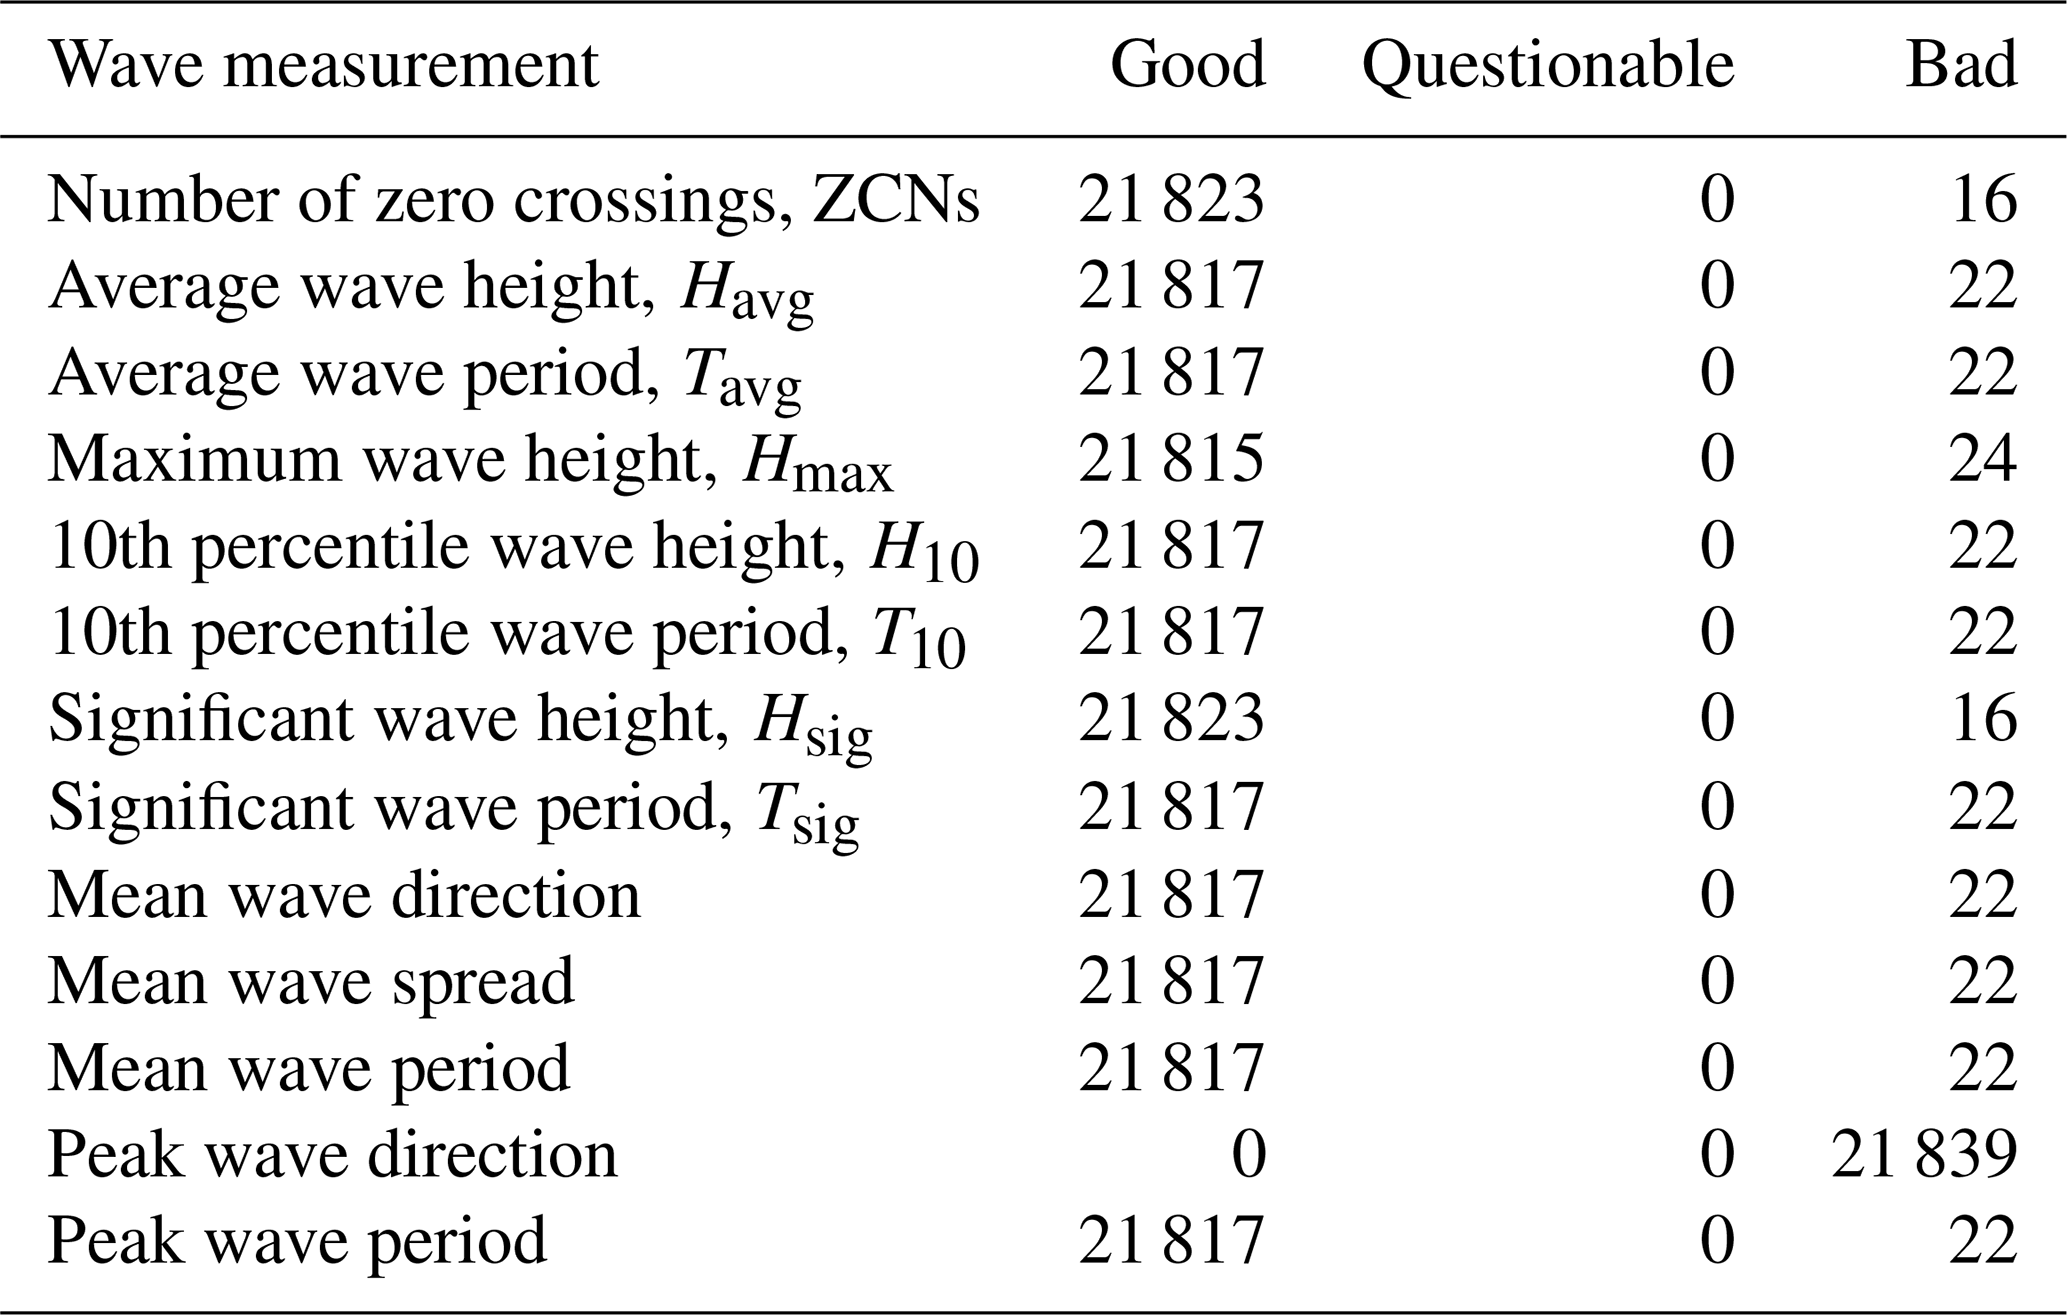
Surface gravity wave (i.e., wave) data were measured with the TRIAXYS sensor at a 20 min sampling interval, the typical standard for wave measurements in the United States (NDBC, 1996). Wave measurements began on 16 March 2023, following the first service visit, and ended with the deployment recovery on 15 January 2024. Initial quality control checks (i.e., included in *.a0 files on the Wind Data Hub) follow AXYS specifications and remove erroneous data by comparing individual measurements to temporally adjacent ones and removing all data when significant wave height reads larger than 40 m (AXYS Technologies Inc, 2012). All data measured by the TRIAXYS wave sensor are given in Table A3. The mean wave period is calculated from the zeroth and first spectral moments of the wave spectra, differing from average wave period, Tavg, which is a mean of the time series. Peak wave period and peak wave direction are also calculated from the wave spectrum and not directly measured. AXYS post-processing software (version 5.01) is used to calculate the wave spectrum, which applies the maximum entropy method (Nwogu, 1989).
Table A2TRIAXYS wave sensor measurements and number data marked good, questionable, or bad. Variable short names are provided to match those in *.b0 files, if applicable.
A nearby National Data Buoy Center (NDBC) buoy (no. 51202: Mokapu Point) was used to cross-check the lidar buoy wave measurements. Station 51202 is 21 km from and ∼ 700 m shallower (depth = 86 m) than the O'ahu lidar buoy location. The shallower depth allows some wave frequencies to transition from deep-water (i.e., , where D is depth and L is wavelength) to transitional waves (i.e., ). A comparison of significant wave heights between locations outlines largely similar wave climates, though the lidar buoy recorded wave heights slightly larger offshore than at 51202 (Fig. A5). Multiple factors could create this variability: deep-water–transitional wave transformation, as well as variability in local bathymetry and wind fields, highlighting the importance of local measurements for wave applications. The minimum significant wave height measured at 51202 for the deployment period was 0.6 m, so significant waves heights less than 0.25 m at the lidar buoy were flagged as bad. If significant wave heights were marked bad for exceeding 40 m or failing to surpass 0.25 m, the remaining variables were also marked bad, as they are derived from the same sensor.
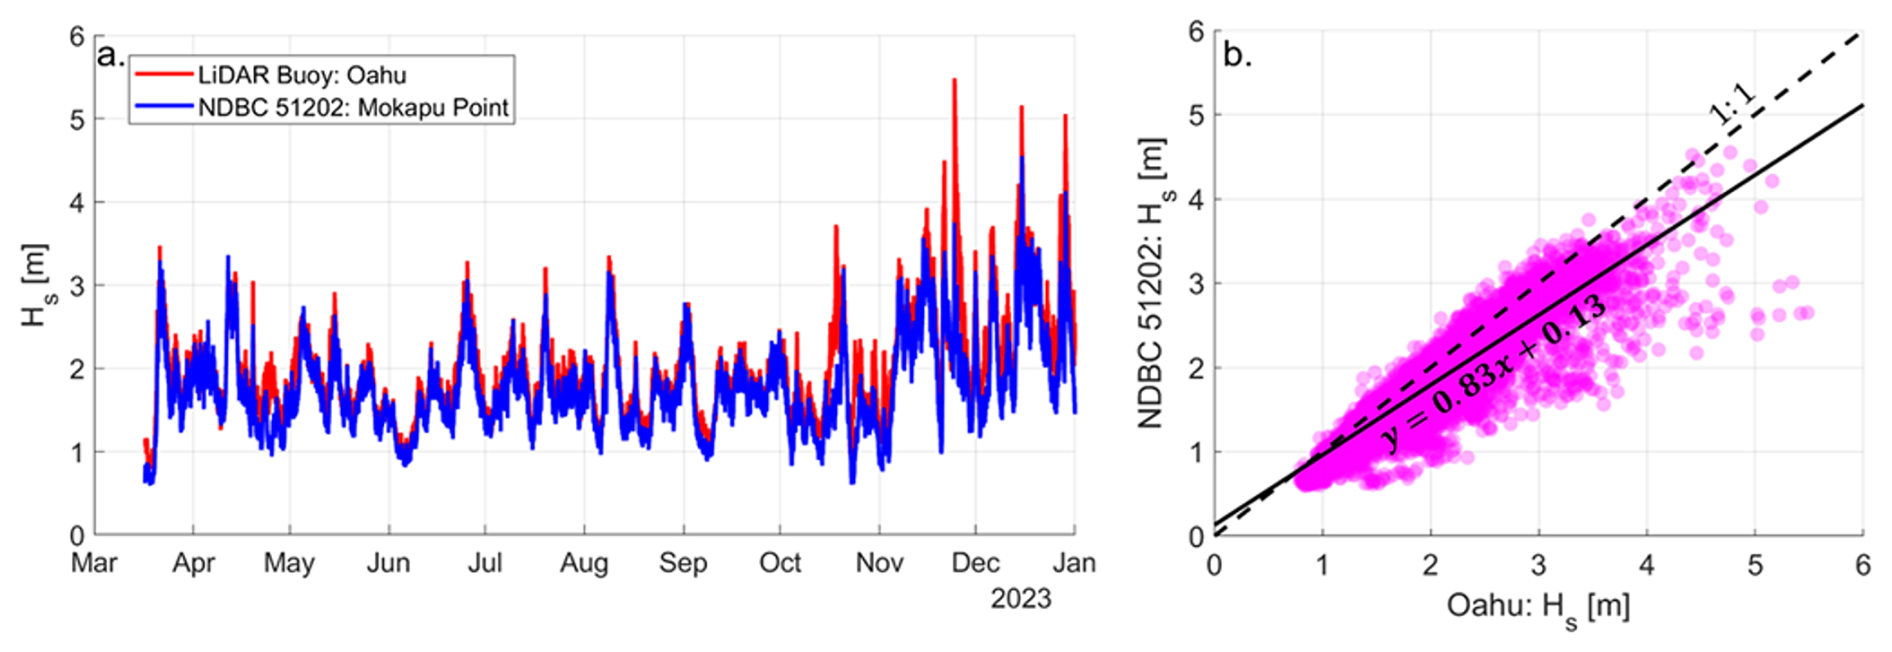
Figure A5(a) Significant wave heights measured at the lidar buoy (red) and NDBC station 51202 (blue) from 16 March 2023 to 31 December 2023. (b) Scatter comparison of significant wave heights from each station at each time step. A linear regression best fit is also shown.
An additional quality check was applied to identify possible rogue waves. A ratio of maximum wave height to significant wave height () greater than 2 is typically considered indicative of a rogue wave (e.g., Müller et al., 2005; Nikolkina and Didenkulova, 2011). Data points where rogue waves are possible would be marked as questionable, but we found no data in this deployment to exceed that criterion. Table A3 outlines the total number of good, questionable, and bad data for each measurement during the 16 March 2023 to 15 January 2024 wave sampling period. Other gaps in the wave and ocean observations were potentially due to a sensor failure and were not post-processed.
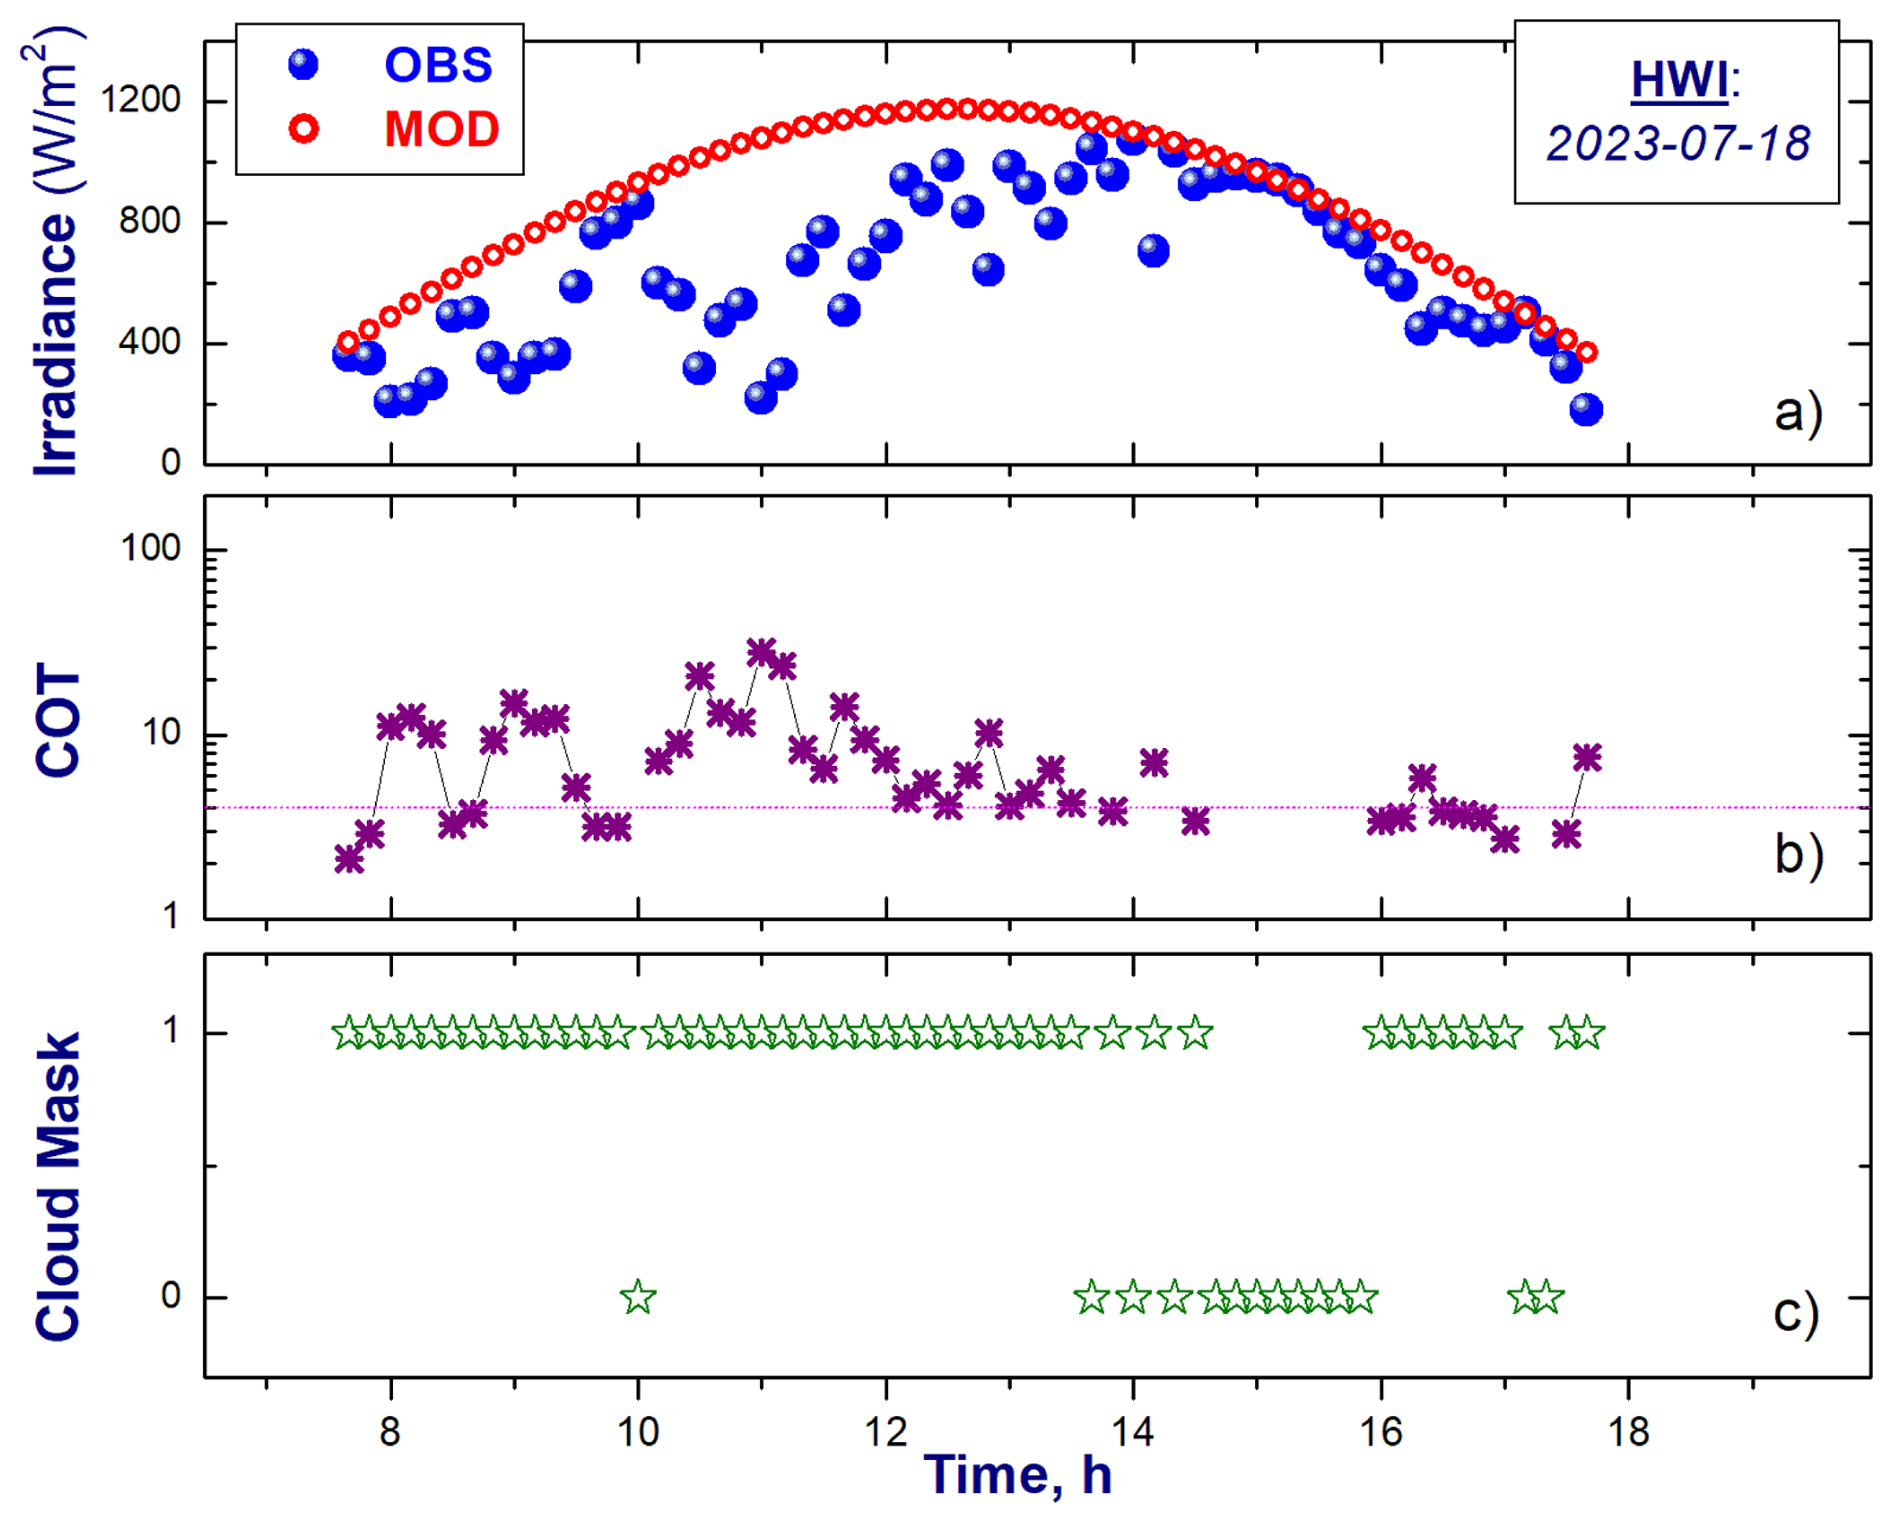
Figure A6(a) The GSR measured (OBS) for a given day (18 July 2023) and location (Hawai'i) and its estimated (or model) clear-sky (MOD) counterpart, (b) calculated COT, and (c) estimated cloud mask.
Ocean currents were measured with the Nortek Signature 250 acoustic Doppler current profiler (ADCP) using 10 min ensemble averaging. The ADCP recorded measurements from the start of the deployment on 1 December 2022 to sensor power-down on 14 December 2023. Specifically, velocity magnitude and direction were measured at 50 depth bins, vertically spaced 4 m apart. Current magnitudes and direction were marked bad if data were missing, spikes in current magnitude occurred that were spatially and temporally uncorrelated over a 10 min duration, and/or a measurement was isolated in time (i.e., at least two successful measurements before and after did not occur). Current data were marked questionable if vertical shear in current speed was larger than 0.2 m s−1 and/or a vertical measurement was isolated in space (i.e., at least two successful measurements above and below did not occur). The ADCP sampling range typically reached 100 to 120 m in depth, with the deepest measurements at 141 m. Measurements below the sampling range are considered missing data and therefore marked as bad. In total, 999 158 current measurements were marked good, 80 261 were marked questionable, and 1 511 731 were marked bad.
Conductivity was measured with the Sea-Bird CTD and sea surface temperature (SST) from both the Sea-Bird CTD and the YSI thermistor every 10 min over the same duration as the ADCP (1 December 2022 to 14 December 2023). CTD data were marked bad for either instrument if a spike in either SST or conductivity occurred which was temporally uncorrelated to surrounding data points. No “questionable” checks were applied to the CTD measurements. In total, the Sea-Bird CTD recorded 22 018 good and 29 805 bad conductivity and SST measurements. The YSI thermistor recorded 44 305 good and 7518 bad SST measurements.
A3.4 Buoy pyranometer
In Krishnamurthy et al. (2023), we discussed the acquiring of coastal cloud properties obtained from broadband global solar radiation (GSR) data using the pyranometers (PYRs) deployed on the buoy. The difference between the measured surface irradiance and its estimated clear-sky counterpart (Fig. A6a) serves as the foundation for determining cloud optical thickness (COT; Fig. A6b) and generating the corresponding cloud mask (Fig. A6c). The COT characterizes the total reduction in downwelling solar radiation due to cloud droplets and/or ice crystals, and a dense cloud with a significant COT has a visually “dark” appearance to an observer on the surface. Thus, a large difference between the measured and clear-sky irradiances typically indicates the presence of a dense cloud above a pyranometer. Conversely, small differences suggest the chance of optically thin clouds. It is noteworthy that small differences may also be attributed to dense aerosol plumes originating from various sources, such as the somewhat unique Hawaiian feature of vog or also fog. Generally, optical thickness values for both aerosol plumes and fog remain below 4. Consequently, the calculated COT values exceeding 4 provide greater confidence in cloud presence above the pyranometer, while lower values suggest otherwise (Fig. A6b). In other words, the COT can be viewed as a form of quality assurance (QA) for assessing cloud properties, such as a binary cloud mask (Fig. A6c). We also perform supplementary QA checks to identify days where the PYR-measured GSR data exhibit incomplete daytime coverage, featuring extended gaps lasting up to several hours. Cloud properties are not provided for these identified days.
The lidar buoy data utilized in this study are freely and publicly available from the US Department of Energy. The Hawai'i lidar wind dataset is available at 10 min and 1 Hz resolution at https://wdh.energy.gov/ds/buoy/lidar.z07.c0 (DOE, 2025a) and https://wdh.energy.gov/ds/buoy/lidar.z07.b0 (DOE, 2025c) and the accompanying near-surface observations at https://wdh.energy.gov/ds/buoy/buoy.z07.b0 (DOE, 2025b). ERA5 is provided via the Copernicus Climate Data Store at https://cds.climate.copernicus.eu/ (last access: 17 November 2025). UH-WRF was developed by the University of Hawai'i and shared with the Pacific Northwest National Laboratory through a research partnership (Hsiao et al., 2020, 2021).
LMS is responsible for conceptualization, data curation, formal analysis, and writing. RK contributed to conceptualization, supervision, and writing. RKN, PS, and EK contributed to data quality control and writing. TMN, YLC, FH, and NB developed some of the simulations used in this work and reviewed the manuscript. WIG and YLC assisted with data access and processing and manuscript review. WIG generated figures and addressed reviewer comments. MP and MS were critical to the success of the observational campaign that provided the measurements used in this work.
The contact author has declared that none of the authors has any competing interests.
The views expressed in the article do not necessarily represent the views of the DOE or the U.S. Government.
Publisher's note: Copernicus Publications remains neutral with regard to jurisdictional claims made in the text, published maps, institutional affiliations, or any other geographical representation in this paper. The authors bear the ultimate responsibility for providing appropriate place names. Views expressed in the text are those of the authors and do not necessarily reflect the views of the publisher.
Large-language models were used to assist with coding for some figure generation. The resulting code was fully reviewed and verified for accuracy.
PNNL would also like to thank the Wind Data Hub team, especially Kenneth Burk, Max Levin, Chitra Sivaraman, Matthew McDuff, and Sherman Beus. The team would also like to acknowledge the buoy contractor, AXYS Technologies, for their support in maintaining the buoys and for data verification during the deployment, and Raj Rai, Amy Brice, and James Marquis for reviewing the initial draft of the article.
The authors are grateful to the anonymous reviewers for their thoughtful suggestions to improve this work.
This research has been supported by the US DOE Office of Critical Minerals and Energy Innovation Integrated Energy Systems Office (grant no. DE-AC05-76RL01830) and the Pacific Islands Ocean Observing System (PacIOOS)/National Oceanic and Atmospheric Administration (NOAA) (award number NA21NOS0120091).
This paper was edited by Andrea Hahmann and reviewed by two anonymous referees.
Argüeso, D. and Businger, S.: Wind power characteristics off O'ahu, Hawai'i, Renew. Energ., 128, 324–336, https://doi.org/10.1016/j.renene.2018.05.080, 2018.
AXYS Technologies Inc: TRIAXYSTM Directional Wave Buoy User's Manual, Version 12, Sydney, British Columbia, Canada, 2012.
Bianco, L., Mendeke, R., Lindblom, J., Djalalova, I. V., Turner, D. D., and Wilczak, J. M.: Evaluating the ability of the operational High Resolution Rapid Refresh model version 3 (HRRRv3) and version 4 (HRRRv4) to forecast wind ramp events in the US Great Plains, Wind Energ. Sci., 10, 2117–2136, https://doi.org/10.5194/wes-10-2117-2025, 2025.
Bodini, N., Optis, M., Redfern, S., Rosencrans, D., Rybchuk, A., Lundquist, J. K., Pronk, V., Castagneri, S., Purkayastha, A., Draxl, C., Krishnamurthy, R., Young, E., Roberts, B., Rosenlieb, E., and Musial, W.: The 2023 National Offshore Wind data set (NOW-23), Earth Syst. Sci. Data, 16, 1965–2006, https://doi.org/10.5194/essd-16-1965-2024, 2024a.
Bodini, N., Optis, M., Liu, M. Gaudet, B., Krishnamurthy, R., Kumler, A., Rosencrans, D., Rybchuk, A., Tai, S.-L., Berg, L., Musial, W., Lundquist, J. K., Purkayastha, A., Young, A., and Draxl, C.: Causes of and Solutions to Wind Speed Bias in NREL's 2020 Offshore Wind Resource Assessment for the California Pacific Outer Continental Shelf, National Renewable Energy Laboratory (NREL), Golden, Colorado, United States, NREL/TP-5000-88215, https://docs.nlr.gov/docs/fy24osti/88215.pdf (last access: 9 September 2025), 2024b.
Bucci, L.: Hurricane Dora, National Hurricane Center Tropical Cyclone Report, EP052023, https://www.nhc.noaa.gov/data/tcr/EP052023_Dora.pdf (last access: 5 March 2024).
Buster, G., Pinchuk, P. Lavin, L., Benton, B., and Bodini, N.: Bias Correcting NOAA's High-Resolution Rapid Refresh (HRRR) Wind Resource Data for Grid Integration Applications, https://docs.nlr.gov/docs/fy25osti/91749.pdf (last access: 6 September 2025), 2024.
Carta, J. A., Velázquez, S., and Cabrera, P.: A review of measure-correlate-predict (MCP) methods used to estimate long-term wind characteristics at a target site, Renew. Sust. Energ. Rev., 27, 362–400, https://doi.org/10.1016/j.rser.2013.07.004, 2013.
CDS (Climate Data Store): Complete ERA5 global atmospheric reanalysis [data set], https://cds.climate.copernicus.eu/datasets/reanalysis-era5-complete (last access: 7 January 2025), 2025a.
CDS (Climate Data Store): ERA5 hourly data on single levels from 1940 to present [data set], https://cds.climate.copernicus.eu/datasets/reanalysis-era5-single-levels (last access: 26 November 2025), 2025b.
Cowin, E., Wang, C., and Walsh, S. D. C.: Assessing predictions of Australian Offshore Wind Energy Resources from Reanalysis Datasets, Energies, 16, 3404, https://doi.org/10.3390/en16083404, 2023.
Davis, N. N., Badger, J., Hahmann, A. N., Hansen, B. O., Mortensen, N. G., Kelly, M., Larsén, X. G., Olsen, B. T., Floors, R., Lizcano, G., Casso, P., Lacave, O., Bosch, A., Bauwens, I., Knight, O. J., Potter van Loon, A., Fox, R., Parvanyan, T., Krohn Hansen, S. B., Heathfield, D., Onninen, M., and Drummond, R.: The Global Wind Atlas: A High-Resolution Dataset of Climatologies and Associated Web-Based Application, B. Am. Meteorol. Soc., 104.8, E1507–E1525, https://doi.org/10.1175/BAMS-D-21-0075.1, 2023.
DOE (U.S. Department of Energy): 10 min Lidar Winds/Derived Data, Wind Data Hub [data set], https://wdh.energy.gov/ds/buoy/lidar.z07.c0 (last access: 6 January 2025), 2025a.
DOE (U.S. Department of Energy): Hawai'i – Wind Sentinel (120), Oahu, Hawai'i/Reviewed Data, Wind Data Hub [data set], https://wdh.energy.gov/ds/buoy/buoy.z07.b0 (last access: 6 January 2025), 2025b.
DOE (U.S. Department of Energy): 1 Hz Lidar Winds/Reviewed Data, Wind Data Hub [data set], https://wdh.energy.gov/ds/buoy/lidar.z07.b0 (last access: 24 November 2025), 2025c.
Edson, J. B., Jampana, V., Weller, R. A., Bigorre, S. P., Plueddemann, A. J., Fairall, C. W., Miller, S. D., Mahrt, L., Vickers, D., and Hersbach, H.: On the Exchange of Momentum over the Open Ocean, J. Phys. Oceanogr., 43, 1589–1610, https://doi.org/10.1175/JPO-D-12-0173.1, 2013.
Fragano, C. G. and Colle, B. A.: Validation of Offshore Winds in the ERA5 Reanalysis and NREL NOW-23 WRF Analysis Using Two Floating Lidars in the New York Bight, Weather Forecast., 1307–1323, https://doi.org/10.1175/WAF-D-24-0155.1, 2025.
Gandoin, R. and Garza, J.: Underestimation of strong wind speeds offshore in ERA5: evidence, discussion and correction, Wind Energ. Sci., 9, 1727–1745, https://doi.org/10.5194/wes-9-1727-2024, 2024.
Gaudet, B. J., García Medina, G., Krishnamurthy, R., Shaw, W. J., Sheridan, L. M., Yang, Z., Newsom, R. K., and Pekour, M.: Evaluation of Coupled Wind-Wave Model Simulations of Offshore Winds in the Mid-Atlantic Bight Using Lidar-Equipped Buoys, Mon. Weather Rev., 150, 1377–1395, https://doi.org/10.1175/MWR-D-21-0166.1, 2022.
Gaudet, B. J., García Medina, G., Krishnamurthy, R., Sheridan, L. M., Yang, Z., Newsom, R. K., Pekour, M., Gustafson Jr., W. I., and Liu, J.: Assessing Impacts of Waves on Hub-Height Winds off the U.S. West Coast Using Lidar Buoys and Coupled Modeling Approaches, Pacific Northwest National Laboratory, Richland, WA, United States, PNNL-35856, https://doi.org/10.2172/2337529, 2024.
Gelaro, R., McCarty, W., Suárez, M. J., Todling, R., Molod, A., Takacs, L., Randles, C. A., Darmenov, A., Bosilovich, M. G., Reichle, R., Wargan, K., Coy, L., Cullather, R., Draper, C., Akella, S., Buchard, V., Conaty, A., da Silva, A. M., Gu, W., Kim, G.-K., Koster, R., Lucchesi, R., Merkova, D., Nielsen, J. E., Partyka, G., Pawson, S., Putnam, W., Rienecker, M., Schubert, S. D., Sienkiewicz, M., and Zhao, B.: The Modern-Era Retrospective Analysis for Research and Applications, Version 2 (MERRA-2), J. Climate, 30, 5419–5454, https://doi.org/10.1175/JCLI-D-16-0758.1, 2017.
Gorton, A. M. and Shaw, W. J.: Advancing offshore wind resource characterization using buoy-based observations, Mar. Technol. Soc. J., 54, 37–43, https://doi.org/10.4031/MTSJ.54.6.5, 2020.
Hansen, K. S., Barthelmie, R. J., Jensen, L. E., and Sommer, A.: The impact of turbulence intensity and atmospheric stability on power deficits due to wind turbine wakes at Horns Rev wind farm, Wind Energy, 15, 183–196, https://doi.org/10.1002/we.512, 2011.
Hayes, L., Stocks, M., and Blakers, A.: Accurate long-term power generation model for offshore wind farms in Europe using ERA5 reanalysis, Energy, 229, 120603, https://doi.org/10.1016/j.energy.2021.120603, 2021.
Hersbach, H., Bell, B., Berrisford, P., Hirahara, S., Horányi, A., Muñoz-Sabater, J., Nicolas, J., Peubey, C., Radu, R., Schepers, D., Simmons, A., Soci, C., Abdalla, S., Abellan, X., Balsamo, G., Bechtold, P., Biavati, G., Bidlot, J., Bonavita, M., De Chiara, G., Dahlgren, P., Dee, D., Diamantakis, M., Dragani, R., Flemming, J., Forbes, R., Fuentes, M., Geer, A., Haimberger, L., Healy, S., Hogan, R. J., Hólm, E., Janisková, M., Keeley, S., Laloyaux, P., Lopez, P., Lupu, C., Radnoti, G., de Rosnay, P., Rozum, I., Vamborg, F., Villaume, S., and Thépaut, J.-N.: The ERA5 Global Reanalysis, Q. J. Roy. Meteor. Soc., 146, 1999–2049, https://doi.org/10.1002/qj.3803, 2020.
Hsiao, F., Chen, Y.-L., and Hitzl, D. E.: Heavy rainfall events over central O'ahu under weak wind conditions during seasonal transitions, Mon. Weather Rev., 148, 4117–4141, https://doi.org/10.1175/MWR-D-19-0358.1, 2020.
Hsiao, F., Chen, Y.-L., Nguyen, H. P., Hitzl, D. E., and Ballard, R.: Effects of Trade Wind Strength on Airflow and Cloudiness over O'ahu, Mon. Weather Rev., 149, 3037–3062, https://doi.org/10.1175/MWR-D-20-0399.1, 2021.
Kalverla, P. C., Duncan Jr., J. B., Steeneveld, G.-J., and Holtslag, A. A. M.: Low-level jets over the North Sea based on ERA5 and observations: together they do better, Wind Energ. Sci., 4, 193–209, https://doi.org/10.5194/wes-4-193-2019, 2019.
Kalverla, P. C., Holtslag, A. A. M., Ronda, R. J., and Steeneveld, G.-J.: Quality of wind characteristics in recent wind atlases over the North Sea, Q. J. Roy. Meteor. Soc., 146, 1498–1515, https://doi.org/10.1002/qj.3748, 2020.
Krishnamurthy, R., García Medina, G., Gaudet, B., Gustafson Jr., W. I., Kassianov, E. I., Liu, J., Newsom, R. K., Sheridan, L. M., and Mahon, A. M.: Year-long buoy-based observations of the air–sea transition zone off the US west coast, Earth Syst. Sci. Data, 15, 5667–5699, https://doi.org/10.5194/essd-15-5667-2023, 2023.
Lee, J., Ghate, V. P., Mitra, A., Miller, L. M., Krishnamurthy, R., and Egerer, U.: Characterization of HRRR-simulated rotor layer wind speeds and clouds along the coast of California, Wind Energ. Sci., 10, 2755–2769, https://doi.org/10.5194/wes-10-2755-2025, 2025.
Longman, R. J., Elison Timm, O., Giambelluca, T. W., and Kaiser, L.: A 20-Year Analysis of Disturbance-Driven Rainfall on O`ahu, Hawai`i, Mon. Weather Rev., 149, 1767–1783, https://doi.org/10.1175/MWR-D-20-0287.1, 2021.
Lu, B.-Y., Chu, P.-S., Kim, S.-H., and Karamperidou, C.: Hawaiian Regional Climate Variability during Two Types of El Niño, J. Climate, 33, 9929–9943, https://doi.org/10.1175/JCLI-D-19-0985.1, 2020.
Mass, C. and Ovens, D.: The Meteorology of the August 2023 Maui Wildfire, Weather Forecast., 39, 1097–1115, https://doi.org/10.1175/WAF-D-23-0210.1, 2024.
McCoy, A., Musial, W., Hammond, R., Mulas Hernando, D., Duffy, P., Beiter, P., Pérez, P., Baranowski, R., Reber, G., and Spitsen, P.: Offshore Wind Market Report: 2024 Edition, National Renewable Energy Laboratory, Golden, CO, United States, NREL/TP-5000-90525, https://www.nlr.gov/docs/fy24osti/90525.pdf (last access: 25 May 2025), 2024.
Morrison, I. and Businger, S.: Synoptic Structure and Evolution of a Kona Low, Weather Forecast., 16, 81–98, https://doi.org/10.1175/1520-0434(2001)016<0081:SSAEOA>2.0.CO;2, 2001.
Müller, P., Garrett, C., and Osborne, A.: Rogue waves, Oceanogr., 18, 66–75, https://doi.org/10.5670/oceanog.2005.30, 2005.
Musial, W., Beiter, P., Nunemaker, J., Heimiller, D., Ahmann, J., and Busch, J.: Oregon Offshore Wind Site Feasibility and Cost Study, National Renewable Energy Laboratory, Golden, CO, United States, NREL/TP-5000-74597, https://doi.org/10.2172/1570430, 2019.
NDBC (National Data Buoy Center): Nondirectional and Directional Wave Data Analysis Procedures, NDBC Technical Document 96–01, Stennis Space Center, Slidell, Louisiana, USA, https://www.ndbc.noaa.gov/wavemeas.pdf (last access: 12 March 2024), 1996.
NOAA (National Oceanic and Atmospheric Administration): Kona Lows Produce Two Rounds of Flooding – February 2023, https://www.weather.gov/hfo/KonaLowFeb2023 (last access: 18 November 2025), 2023a.
NOAA (National Oceanic and Atmospheric Administration): Cold Front Brings Winds and Rain to Hawai'i – April 2023, https://www.weather.gov/hfo/coldfront_apr2023 (last access:18 November 2025), 2023b.
NOAA (National Oceanic and Atmospheric Administration): Climate Variability: Oceanic Niño Index, https://www.climate.gov/news-features/understanding-climate/climate-variability-oceanic-nino-index (last updated: 25 June 2025), 2025.
Nehzad, M., Neshat, M., Groppi, D., Marzialetti, P., Heydari, A., Sylaios, G., and Astiaso Garcia, D.: A primary offshore wind farm site assessment using reanalysis data: a case study for Samothraki island, Renew. Energ., 172, 667–679, https://doi.org/10.1016/j.renene.2021.03.045, 2021.
Nikolkina, I. and Didenkulova, I.: Rogue waves in 2006–2010, Nat. Hazards Earth Syst. Sci., 11, 2913–2924, https://doi.org/10.5194/nhess-11-2913-2011, 2011.
Nwogu, O.: Maximum entropy estimation of directional wave spectra from an array of wave probes, Appl. Ocean Res., 11, 176–182, 1989.
Pronk, V., Bodini, N., Optis, M., Lundquist, J. K., Moriarty, P., Draxl, C., Purkayastha, A., and Young, E.: Can reanalysis products outperform mesoscale numerical weather prediction models in modeling the wind resource in simple terrain?, Wind Energ. Sci., 7, 487–504, https://doi.org/10.5194/wes-7-487-2022, 2022.
Ramon, J., Lledó, L., Torralba, V., Soret, A., and Doblas-Reyes, F. J.: Which global reanalysis best represents near-surface winds?, Q. J. Roy. Meteor. Soc., 145, 3236–3251, https://doi.org/10.1002/qj.3616, 2019.
Severy, M., Gorton, A. M., Krishnamurthy, R., and Levin, M. S.: Lidar Buoy Data Dictionary: For the 2020–2021 California Deployments, Pacific Northwest National Laboratory (PNNL), Richland, WA, USA, PNNL-30947, https://doi.org/10.2172/1987710, 2021.
Sheridan, L. M., Krishnamurthy, R., Gorton, A. M., Shaw, W. J., and Newsom, R. K.: Validation of Reanalysis-Based Offshore Wind Resource Characterization Using Lidar Buoy Observation, Mar. Technol. Soc. J., 54, 44–61, https://doi.org/10.4031/MTSJ.54.6.13, 2020.
Sheridan, L. M., Krishnamurthy, R., García Medina, G., Gaudet, B. J., Gustafson Jr., W. I., Mahon, A. M., Shaw, W. J., Newsom, R. K., Pekour, M., and Yang, Z.: Offshore reanalysis wind speed assessment across the wind turbine rotor layer off the United States Pacific coast, Wind Energ. Sci., 7, 2059–2084, https://doi.org/10.5194/wes-7-2059-2022, 2022.
Sheridan, L. M., Krishnamurthy, R., Gustafson Jr., W. I., Liu, Y., Gaudet, B. J., Bodini, N., Newsom, R. K., and Pekour, M.: Offshore low-level jet observations and model representation using lidar buoy data off the California coast, Wind Energ. Sci., 9, 741–758, https://doi.org/10.5194/wes-9-741-2024, 2024.
Soares, P. M. M., Lima, D. C. A., and Nogueira, M.: Global offshore wind energy resources using the new ERA-5 reanalysis, Environ. Res. Lett., 15, 1040a2, https://doi.org/10.1088/1748-9326/abb10d, 2020.
Soukissian, T. H., Karathanaski, F. E., and Zaragkas, D. K.: Exploiting offshore wind and solar resources in the Mediterranean using ERA5 reanalysis data, Energ. Convers. Manage., 237, 114092, https://doi.org/10.1016/j.enconman.2021.114092, 2021.
Wagner, R., Cañadillas, B., Clifton, A., Feeney, S., Nygaard, N., Poodt, M., St. Martin, C. Tüxen, E., and Wagenaar, J. W.: Rotor equivalent wind speed for power curve measurement – comparative exercise for IEA Wind Annex 32, J. Phys.: Conf. Ser., 524, 012108, https://doi.org/10.1088/1742-6596/524/1/012108, 2014.
Wharton, S. and Lundquist, J. K.: Atmospheric stability affects wind turbine power collection, Environ. Res. Lett., 7, 014005, https://doi.org/10.1088/1748-9326/7/1/014005, 2012.
Wilczak, J. M., Akish, E., Capotondi, A., and Compo, G. P.: Evaluation and bias correction of the ERA5 reanalysis over the United States for wind and solar energy applications, Energies, 17, 1667, https://doi.org/10.3390/en17071667, 2024.
Zhang, Y., Chen, Y.-L., Hong, S.-Y., Juang, H.-M. H., and Kodama, K.: Validation of the coupled NCEP Meso-scale Spectral Model and an advanced land surface model over the Hawaiian Islands. Part I: Summer trade wind conditions and a heavy rainfall event, Weather Forecast., 20, 847–872, https://doi.org/10.1175/WAF891.1, 2005.
- Abstract
- Copyright statement
- Introduction
- Data and methodology
- Year-long model validation
- Conclusions
- Appendix A: Summary of Hawai'i buoy observations and post-processing
- Data availability
- Author contributions
- Competing interests
- Disclaimer
- Acknowledgements
- Financial support
- Review statement
- References