the Creative Commons Attribution 4.0 License.
the Creative Commons Attribution 4.0 License.
 | 01 Oct 2020
Comparison of electrical collection topologies for multi-rotor wind turbines
Paul Pirrie
David Campos-Gaona
Olimpo Anaya-Lara
Multi-rotor wind turbines (MRWTs) have been suggested in the literature as a solution to achieving wind turbine systems with capacities greater than 10 MW. MRWTs utilize a large number of small rotors connected to one support structure instead of one large rotor with the aim of circumventing the square cube law. Potential benefits of MRWTs include cost and material savings, standardization of parts, increased control possibilities, and improved logistics for assembly and maintenance. Almost all previous work has focused on mechanical and aerodynamic feasibility, with almost no attention being paid to the electrical systems. In this research eight different topologies of the electrical collection network for MRWTs are analysed to assess which are the most economically and practically viable options. AC and DC collection networks are presented in radial, star, cluster and DC series topologies. Mass, capital cost and losses are estimated based on scaling relationships from the academic literature and up-to-date commercial data. The focus of this study is the assessment of the type of electrical collector topology, so component type and voltage level are kept consistent between topology designs in order to facilitate a fair comparison. Topologies are compared in terms of four main criteria: capital cost, cost effectiveness, total mass and reliability. A comparison table is presented to summarize the findings of the research in a convenient way. It is found that the most cost-effective solutions are the AC radial and AC star topologies, with the least cost-effective being the DC series–parallel and DC cluster topologies. This is due to the high cost of DC–DC converters and DC switchgear along with the lower efficiency of DC converters. Radial designs perform best in terms of efficiency and annual energy capture. DC systems achieve a slightly lower nacelle mass compared to their equivalent AC systems. DC topologies are generally found to be more expensive when compared to their AC counterparts due to the high cost of DC–DC converters and DC switchgear. Star topologies are considered to have the best reliability due to having no shared equipment. The most suitable collection topology for MRWTs is shown to be of the star type, in which each turbine is connected to the step-up transformer via its own cable.
- Article
(1549 KB) - Full-text XML
- BibTeX
- EndNote


As the wind industry tries to continue reducing the cost of energy, it is desirable to have as much rated capacity on one support structure as possible, particularly offshore. The substructure of a wind turbine is typically a large portion of the capital cost, so increasing the size and power rating of the turbines is an obvious way to reduce the cost of energy (Manwell et al., 2014). Additionally, there are fewer sites to be maintained, which can drastically reduce the O & M costs of a wind farm, particularly in offshore environments when access can be difficult. This has led the industry to develop very large wind turbines like the GE Haliade-X, with a rotor diameter of 220 m and a power rating of 12 MW. However, there are physical and economical limits as to how large single-rotor wind turbines can become. It is shown in Sieros et al. (2012) that as the radius of a wind turbine rotor increases, the loads due to self-weight that are encountered in the blades and tower increase at a faster rate. This implies that more and better material and hence higher capital costs are required to manufacture blades and towers as rotors increase in diameter. There are additional practical limits as to how large wind turbine components can become. For onshore wind turbines, the size of components has already reached a practical limit due to difficulties involved in transportation of large components. Larger components are possible when installed offshore, but there are still significant issues involved with transporting and installing large components. Large components require large vessels to transport and install, which comes at a significant cost to installers.
Multi-rotor wind turbines (MRWTs) offer an alternative solution to achieving wind turbine systems with large-scale power capacity. The idea is to have a large number of small turbines on one support structure instead of one very large rotor, circumventing the square cube law and achieving significant savings on material costs for blades and drivetrain components. It is shown in Jamieson and Branney (2012) that the blades and major drivetrain components in an MRWT have times the mass of an equivalent single-rotor system, where n is the number of rotors, implying significant savings in material costs for MRWTs.
Various studies within the literature have shown that the MRWT concept has potential and should be investigated further. An initial investigation of support structures required for MRWTs is conducted in Manwell et al. (2014). Although the total mass of the MRWT is shown to be higher than that of an equivalently sized single-rotor turbine, the cost of the MRWT is approximately 22 % lower. This is due to a reduction in expensive materials required for blade and drivetrain components. Various loading scenarios were investigated in the Innwind study (Jamieson et al., 2015). It was shown that MRWTs benefit from reduced loading in all scenarios compared to that of an equivalently sized single rotor. A load-averaging effect is also demonstrated, which could result in increased fatigue life. Larger load variations lead to more fatigue damage, and this must be accounted for when designing the support structure. Loading is generally highest at rated wind speed, just before blades start to pitch. It is highly unlikely that all individual rotors in an MRWT system will be operating at rated wind speed at the same time due to the nature of wind. This results in a load averaging effect over the MRWT support structure, meaning that loading over time is smoother and has less variation. Support structure elements will be subjected to smaller variations in loading over the lifetime of the structure, which will lead to less degradation in the structural components and an increased fatigue life. Various studies performed at Kyushu University in Japan (Goeltenbott et al., 2015; Göltenbott et al., 2017; Ohya et al., 2017) have shown that clustering turbines together can result in an increase in the coefficient of power, CP, which can lead to increases in annual energy capture. All of these studies show that clustering conventional turbines results in modest gains in CP, whereas clustering wind lens turbines can produce a significant increase in CP. This was also shown through simulations in the Innwind project, where an MRWT consisting of 45 turbines is expected to have an increase in power of 8 %. Operation, maintenance and installation costs are also expected to be reduced using the MRWT concept as components would be small enough to use small vessels without specialist equipment required. It is proposed in the Innwind project that each MRWT platform would be equipped with an on-platform crane capable of removing and replacing an entire rotor assembly with no additional lifting equipment required. MRWTs would also benefit significantly from an increased redundancy. If one small rotor fails only a small portion of the total power is lost and can be replaced at the next regular service interval without significant loss of revenue. The Innwind project also compares the levelized cost of energy (LCOE) of the conceptual 20 MW 45-rotor MRWT with two 10 MW reference wind turbines (RWTs) and estimates that the MRWT would have a reduction in LCOE of 15 %. Some disadvantages of the MRWT concept are more complex support structure design and increased component count.
Although some work has been done to provide insight into the feasibility of MRWTs, the electrical system has been largely neglected. The aim of this study is to assess various electrical collection topologies that could be used in an MRWT in order to determine the most suitable option. There are several areas that must be considered when identifying possible electrical collection topologies for MRWTs. The cost of the system should be minimized so as to not outweigh the savings in material costs. Mass distribution must be optimized in order to avoid unnecessary reinforcement of the support structure. The ability to vary rotational speed of individual rotors is an important aspect of power maximization and load alleviation, so the independent operation of individual rotors is an important consideration. It is desirable to maximize the built-in redundancy within an MRWT system so reliability of components and redundancy within the electrical system are important considerations.
This study performs an initial analysis of eight different electrical collection topologies that could be used within a 45-rotor MRWT system. Section 2 describes the methodology used; Sect. 3 describes the system outline; Sect. 4 discusses the design constraints of the system; Sect. 5 outlines the proposed electrical collection topologies; Sect. 6 describes how the mass, cost and losses of each component have been estimated; Sect. 7 describes how the cost effectiveness of each system is compared; Sect. 8 presents the results of the analysis; and conclusions are made in Sect. 9.
In this initial analysis of different electrical systems, the emphasis is placed on determining the most suitable type of system so no detailed design work for each component is conducted within this study. Instead, various AC and DC electrical topologies are designed using realistic components that are trusted and understood by the wind industry. If the benefits of the MRWT concept can be shown to be true while still using known and well-understood components, it is more likely to be accepted as a viable alternative to the single-rotor wind turbine. Mass, cost and losses are estimated for each component using information from industry data sheets where possible.
A number of steps were carried out in this study:
-
Design constraints were established.
-
Eight collection topologies were designed. Both AC and DC topologies are included. The focus of the study is to analyse the type of collection topology so component type, voltage level, and number of turbines in strings and clusters are kept consistent across all designs where possible.
-
Capital cost and mass of each collection topology were estimated using a combination of scaling relationships and up-to-date commercial information.
-
Loss profiles of each component were used to estimate the total losses of each collection topology over the entire operating range of wind speeds.
-
Cost effectiveness of each collection topology was assessed based on the capital cost and total losses over a 20-year lifetime of the project.
An MRWT system consisting of 45 rotors is considered in this study. Figure 1 shows a simple representation of the physical layout of such a system, with each circle representing a single wind turbine rotor. The MRWT concept as described in Jamieson et al. (2015) includes a small platform situated at the bottom of the turbine array with enough space to accommodate a large step-up transformer, which is required to step up the output voltage to a suitable level for connection to a wider collection network. For DC systems, a DC-to-AC power converter is also situated on the platform. Each wind turbine unit includes a nacelle, which contains all the power train components (gearbox, generator, power converters, brake system) much like a standard three-bladed variable-speed wind turbine. A steel, tubular lattice-style space frame is used to support the 45 turbine units. Various concepts regarding the support structure and yaw system are outlined in the Innwind report (Jamieson et al., 2015), including floating systems and systems with a fixed base. How the space frame connects to a floating platform or traditional tower is beyond the scope of this paper as the work focuses on the electrical system connecting the individual turbines. The reader is directed to the Innwind report (Jamieson et al., 2015) for a detailed description of various possible design solutions.
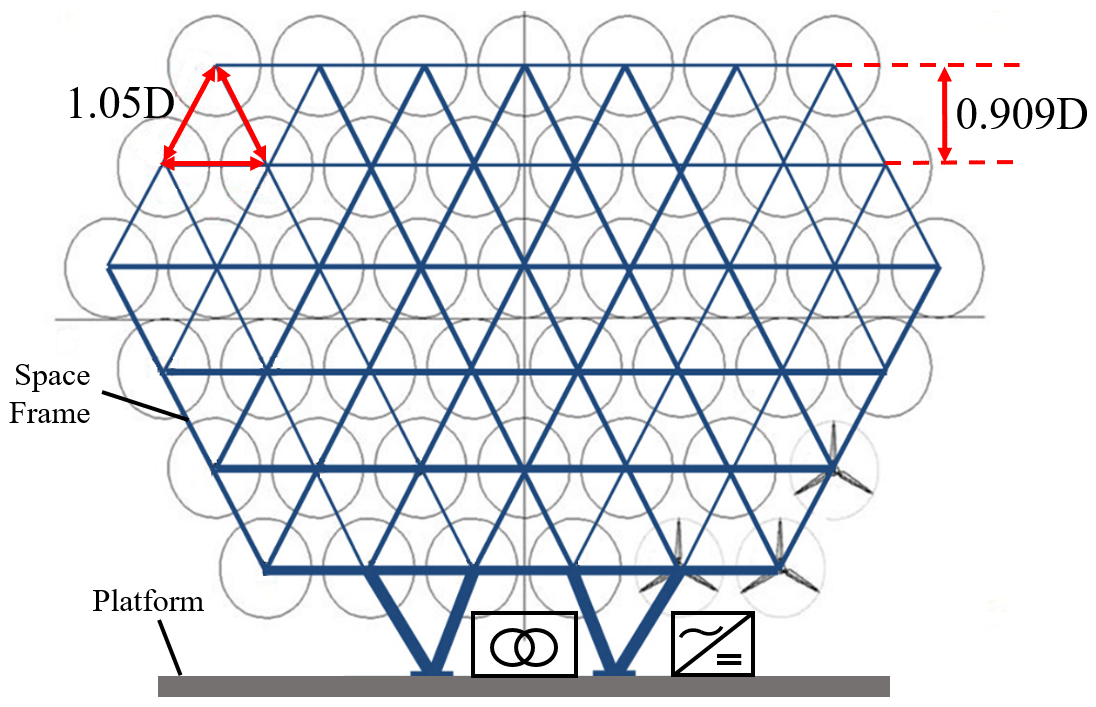
Figure 1Proposed layout of a 45-rotor MRWT system. Adapted from Jamieson et al. (2015).
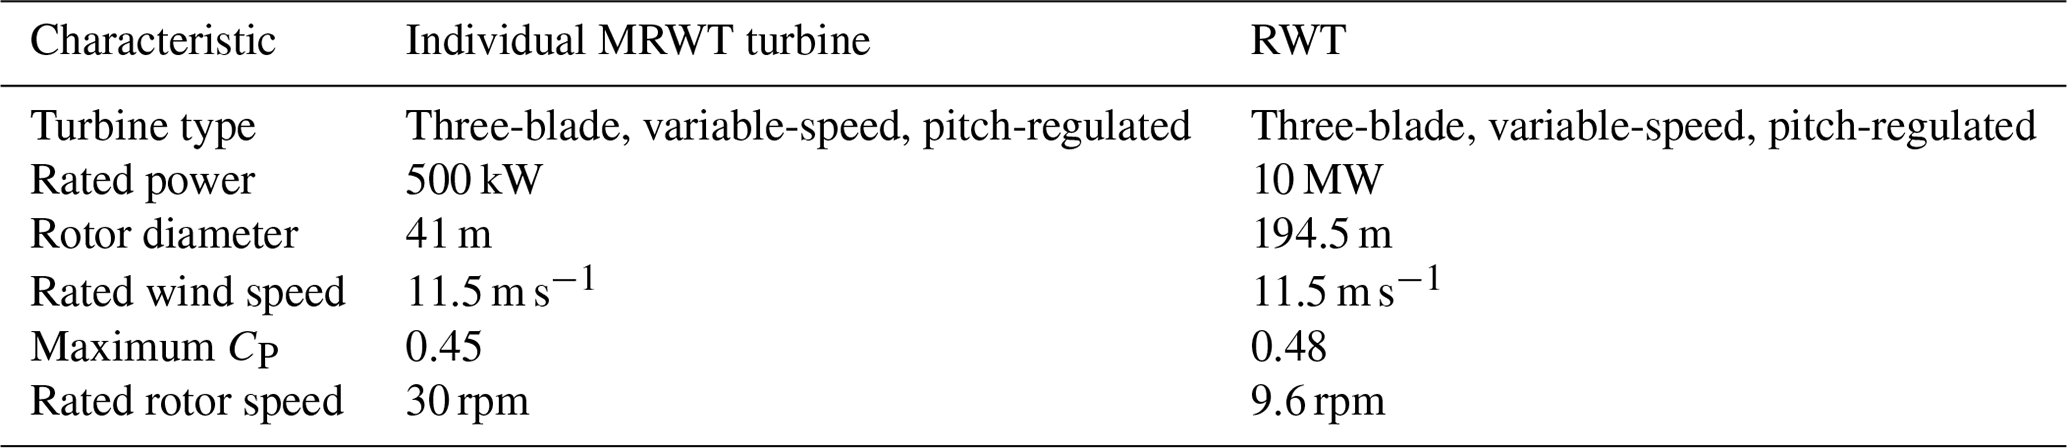
This number of rotors allows a balanced and compact design and is used in various studies such as Jamieson and Branney (2012) and Jamieson et al. (2015). The Innwind study provides a conceptual design for such a system and also makes comparisons to an equivalent system consisting of two 10 MW RWTs from the Technical University of Denmark (DTU) to highlight the reduction in LCOE that could be realized by the MRWT concept. It is therefore desirable to use a similar system in this study to allow for easy comparison to both systems. Each rotor has a diameter of 41 m, which results in the same total swept area as the two 10 MW RWTs. Although the Innwind project uses 444 kW turbines, commercial examples of turbines with similar swept area are capable of producing 500 kW rated power. Examples are the Enercon E40 turbine, with a rated power of 500 kW and a diameter of 40.3 m (Wind Turbine Models, 2020a), and the Vestas V39 turbine, with a rated power of 500 kW and a rotor diameter of 39 m (Wind Turbine Models, 2020b). In order to give a fair representation of the energy capture possible with such an MRWT system, a representative rated power of 500 kW was selected for each turbine in this study. The characteristics of each turbine unit are shown in Table 1 along with the characteristics of the 10 MW RWT used for comparison (Bak et al., 2013). The diameter of the DTU RWT is scaled up to 194.5 m in the Innwind report (along with the associated capital costs) in order to match swept areas of the two systems; this upscaled diameter is used for comparison in this paper.
Table 1Characteristics of each individual turbine unit used in the MRWT system and the 10 MW RWT.
The following design constraints have been used to design the electrical topologies:
-
The system in question must have 45 rotors to facilitate fair comparison with results in the Innwind project.
-
Each turbine has the characteristics shown in Table 1; these values have been selected as representative values from available wind turbines of this scale used within the industry.
-
Each turbine must have independent speed control; this is required in order to maximize energy capture and minimize loading on blades and drivetrain components.
-
It is assumed that each turbine operates in a maximum CP tracking mode below rated wind speed, and then power is held constant at rated power above rated wind speed via pitch control.
-
Each topology must connect to an AC collection network at 33 kV, which is a common voltage level used within the wind industry for collection networks; DC collection networks have been discussed in the literature, but there are still no real world applications.
-
It is assumed that there is a platform as shown in Fig. 1 large enough to support a step-up transformer and/or converter as described in the Innwind report (Jamieson et al., 2015).
A total of eight topologies were designed, and each is described in this section. Each topology is based on commonly discussed collection network topologies for offshore wind farms as they are analogous to the electrical system required for MRWTs. Both have the purpose of collecting power from a number of turbines and exporting it to a wider electrical network at one single point of connection.
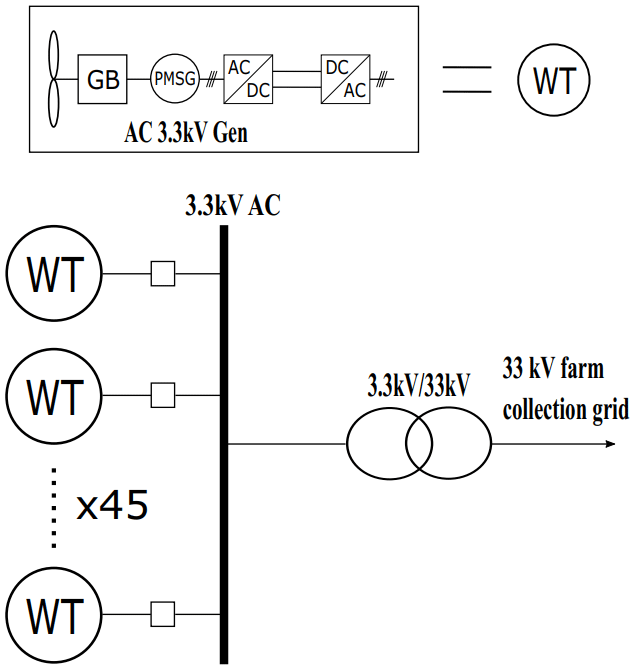
The AC star and DC star topologies are shown in Figs. 2 and 3, respectively. In both the AC and DC star topologies, each turbine is connected via its own cable to the converter or transformer situated on the platform shown in Fig. 1. The AC star uses a 3.3 kV permanent magnet synchronous generator (PMSG) with a fully rated back-to-back insulated-gate bipolar transistor (IGBT)-based voltage source converter (VSC). The DC star uses a 1.5 kV PMSG with a controlled IGBT-based VSC. Various types of DC output wind turbines have been suggested in the literature, with some utilizing diode rectifiers to reduce weight and cost and others utilizing controlled IGBT-based rectifiers. The advantage of using an IGBT-based VSC is that it is able to easily control both the torque of the generator and the reactive power to the generator. This allows for independent speed control of each turbine while maintaining a constant DC output voltage and also allows the use of any type of generator. A controlled rectifier has been selected for these reasons for each DC topology in this study. To allow for a fair comparison between topologies, all use a PMSG. The DC star topology uses a lower-rated generator in order to have the DC cable voltage directly comparable to the AC star topology, which facilitates a fair comparison between the two and keeps the emphasis on the type of system rather than system voltage. Medium-voltage (MV) generators are required to avoid high conduction losses in low-voltage (LV) cables and also to remove the need for a transformer within the nacelle. The star topologies benefit from excellent redundancy as a fault in any one component within the array only results in the loss of 1∕45th the total rated power. The disadvantage is that there is a large total cable distance, but cables with a smaller cross-sectional area (CSA) can be used compared to other topologies. The DC star topology may also benefit from greater efficiency and lower mass due to fewer conversion steps and the use of DC cables (DC cables are known to be lighter and smaller compared to AC cables; Lakshmanan et al., 2015).

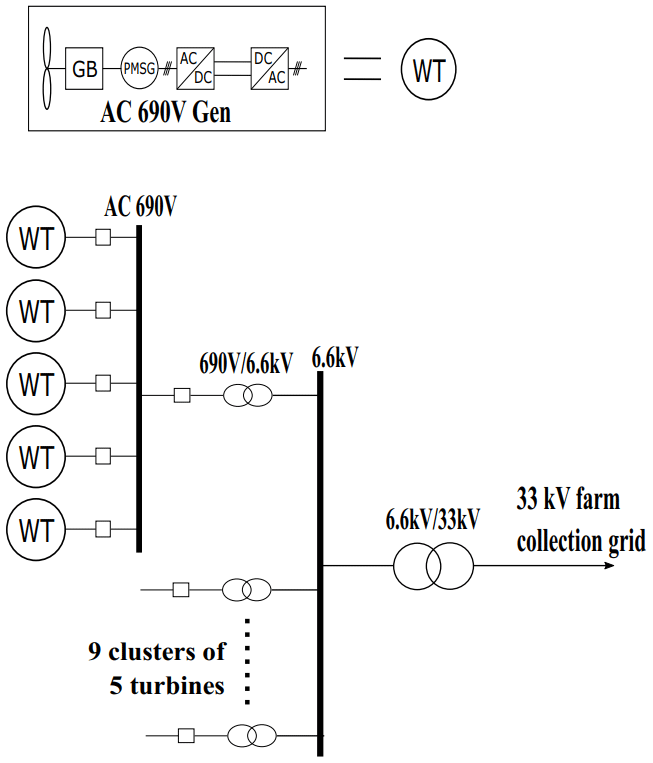
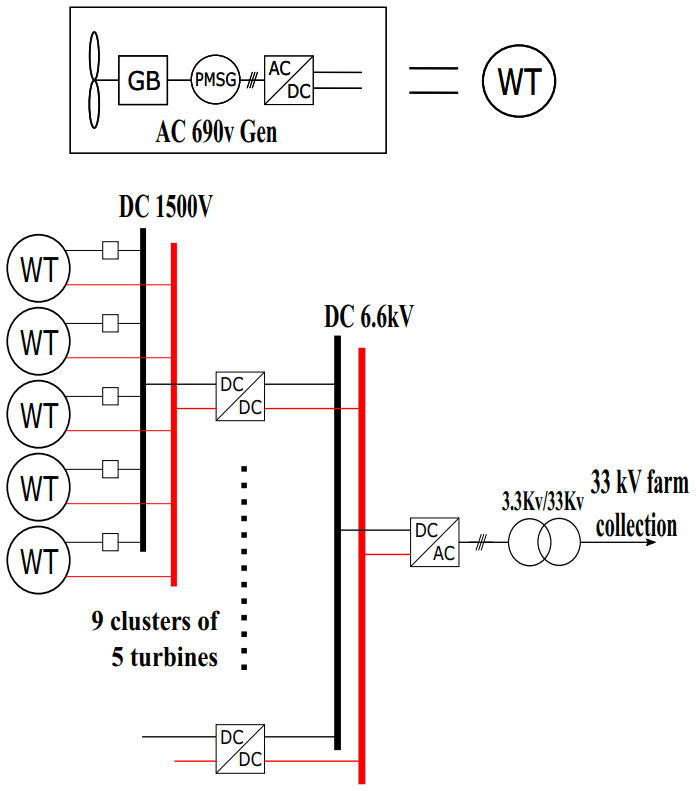
The AC and DC cluster topologies are shown in Figs. 4 and 5, respectively. The cluster topologies gather power from a number of rotors, step up the voltage using either an AC transformer or a DC–DC converter, and then transmit the power to the converter or transformer situated on the platform. This allows for the use of industry-standard 690 V generators as the cable distance between each rotor and the transformer or DC–DC converter is very small. Cluster topologies use much smaller cable distances compared to the star topologies but require cables with a larger CSA to handle higher currents. DC–DC converters are used in the DC topology, and a 50∕60 Hz transformer is used in the AC topology. DC–DC converters are smaller and lighter compared to AC transformers (Lakshmanan et al., 2015) but are also significantly more expensive, so the DC cluster topology is expected to be more expensive but lighter than the AC cluster topology. The main disadvantage of the cluster topologies is that the failure of the cluster transformer or DC–DC converter would result in the loss of the entire cluster of turbines.

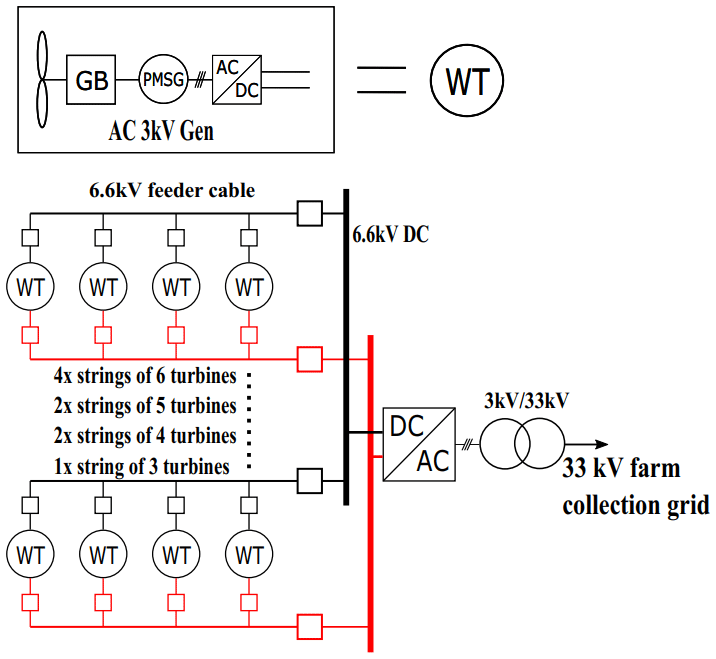
The AC and DC radial topologies are shown in Figs. 6 and 7, respectively. These are based on the most common type of offshore collection network: the AC radial collection network (Bahirat et al., 2012). As it is the most common configuration, the AC radial topology is used as the base topology throughout this study. In the radial topologies, a number of turbines are connected to a feeder cable, which transmits the power to the transformer or converter at the base of the support structure. The number of turbines connected to a feeder cable is determined by the current-carrying capacity of the cable and the power output of the turbines. For simplicity, both AC and DC radial topologies use non-tapered cables in each string. A 3.3 kV feeder cable was originally used in the DC radial design, but after initial assessment it was deemed unrealistic due to the large CSA of cables required, so the next standard voltage level of 6.6 kV was selected. Radial designs benefit from short cable distances, simple design and operational experience. The main drawback is poor reliability as a fault in a feeder cable would result in the loss of the entire string. It should be noted that failure rates for cables are significantly lower than those of power electronic converters or generators.
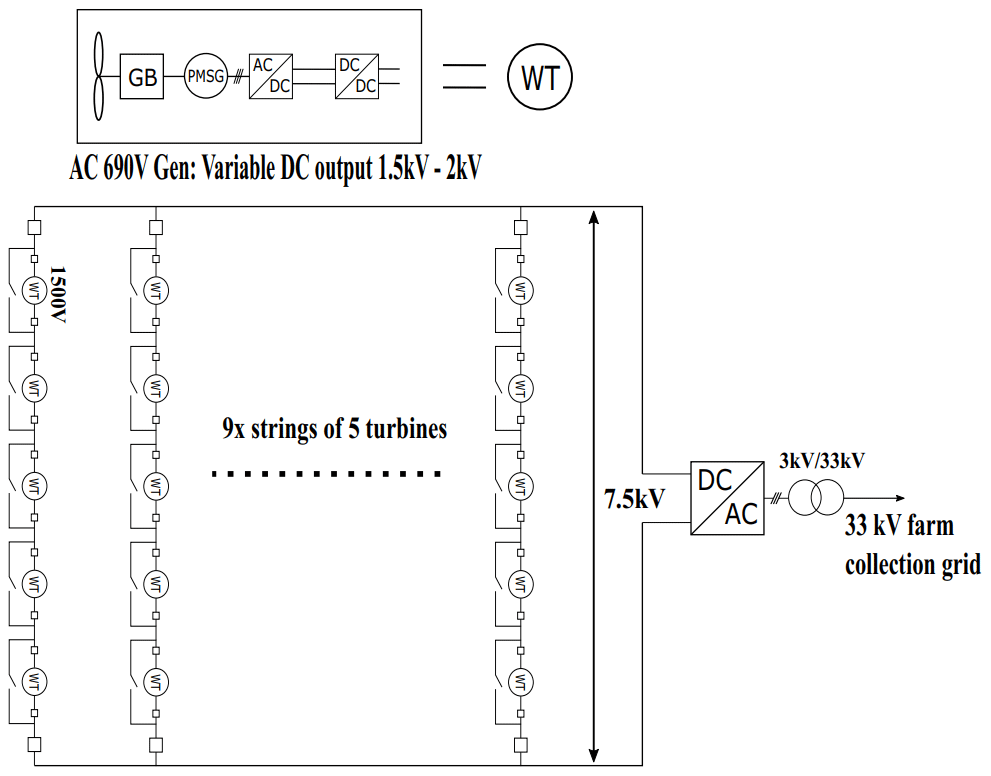
DC series and DC series–parallel connected wind farm collection networks have been discussed in the literature and show enough promise to be included in this study (Bahirat et al., 2012; Ng and Ran, 2016; Lundberg, 2003). The main idea behind the DC series topology is to connect DC output turbines together in series to increase the voltage of the string without the use of AC transformers or large DC–DC converters, resulting in a very lightweight system. Figure 8 shows the DC series topology, and Fig. 9 shows the DC series–parallel topology. In the DC series topology, a standard 690 V AC PMSG is used with a controlled rectifier to produce a DC output of 1.5 kV. Each string contains five turbines connected in series to produce a string voltage of 7.5 kV. Generator torque control is performed by the controlled rectifier, and the string DC–DC converter maintains the DC voltage of the string. A fault in one turbine can be isolated by using a circuit breaker that operates in short circuit, maintaining a path for the DC current within the string. In the case of a fault within the string, the DC–DC converter at the end of the sting can vary its duty ratio to maintain the 11 kV bus voltage. This system should have a low mass due to the small number of converters used but may be expensive due to the use of DC–DC converters and more expensive DC protection devices. There may also be issues regarding insulation as some components will require an insulation level high enough to withstand the whole string voltage to ground. This will be explored further if the topology shows promise.

The DC series–parallel topology is similar to the DC series topology in that it utilizes DC output turbines connected in series to produce a high voltage within strings. It utilizes a variable-voltage output DC wind turbine where the generator is connected to a controlled rectifier and a DC–DC converter. As multiple strings of DC series turbines are connected together in parallel, the voltage of each string must be kept the same as the others. This is achieved by the use of the DC–DC converter at the turbine level. If one turbine within a string fails, the voltage is maintained by the other turbines in the string increasing their output voltage. This topology is designed to reduce the cable distance but will undoubtedly require heavier and more expensive cables to utilize. Disadvantages of this topology are similar to those of the DC series topology.
The cost, mass and loss performance of each component used in the proposed topologies must be estimated in order to determine each topology's suitability. A variety of academic literature and commercial information has been used to accurately estimate the properties of each component used. Information regarding cost and mass of components is rarely available in the public domain for the exact power rating and size of components required. It is therefore necessary to rely on scaling relationships from the academic literature that estimate the cost and mass of generic components based on parameters like component power rating, P, or torque rating. Within this study, these scaling relationships have been adapted where possible to include the most up-to-date commercial information in order to reflect realistic components used within the wind industry. A summary of the relationships used to estimate the mass and cost of components in this study is presented in Table 2 along with the valid range in which these relationships are applicable. The cost of components can often be difficult to estimate as component producers will vary prices depending on market pressures, location of projects, availability of materials etc. It is therefore necessary to rely on the academic literature in order to estimate the price of each component. Although the estimated prices may not be exact, they are sufficient to compare the cost effectiveness of each topology. All cost estimates used within this study are presented in GBP as of 2019.
Table 2Summary of mass and cost estimations of each component for variable-speed, pitch-regulated wind turbines.
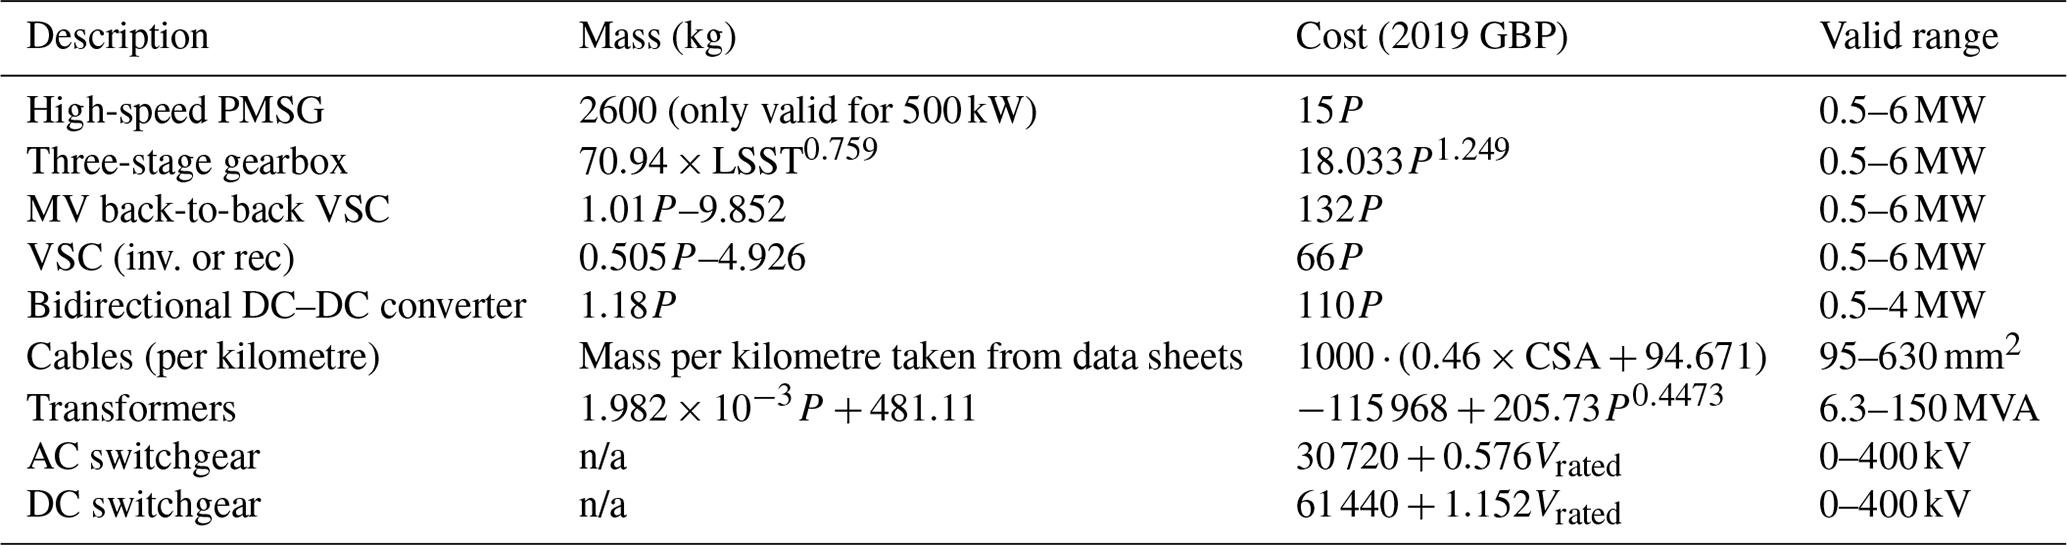
The abbreviation “n/a” stands for not applicable.
6.1 Generators
The cost scaling relationship for high-speed PMSGs used in this study is developed from a National Renewable Energy Laboratory (NREL) study (Fingersh et al., 2006) in which a scaling relationship is presented for medium-speed PMSGs and the relationship in cost between medium-speed and high-speed PMSGs, which is presented in Hart et al. (2014). The NREL study provides a cost scaling relationship for medium-speed PMSGs used with a one-stage gearbox, which is dependant on the power rating of the generator in kilowatts. This relationship is valid for turbines with a rotor radius between 25 and 70 m, which equates to an approximate power rating range between 0.5 and 6 MW. The Hart study shows a detailed comparison in cost between various PMSGs and gearbox combinations. Comparing the cost of a medium-speed PMSG (used with a one-stage gearbox) and a high-speed PMSG (used with a three-stage gearbox), it is shown that the high-speed generator is around 25 % the cost of the medium-speed one. Combining these two relationships results in the scaling relationship for the cost of a high-speed PMSG that is presented in Table 2. The cost estimations from this relationship match the costs presented in Carroll et al. (2015), which are developed from data provided from real offshore wind turbines from an unnamed industry parter. This study also shows the same relationship between costs of medium-speed and high-speed PMSGs, further improving the confidence of the scaling relationship developed for this study. Mass of the high-speed PMSG can be taken directly from a data sheet available from The Switch, which lists the mass of a 500 kW high-speed PMSG at 2600 kg (The Switch, 2019).
6.2 Gearboxes
All generators in this study are assumed to be used in connection with a three-stage gearbox. This assumption is based on a typical rated speed of a high-speed PMSG of 1500 rpm and rated speed of the wind turbine rotors. This results in a required gearbox ratio of 1:50, which is easily achievable with a three-stage gearbox. The cost and mass estimation relationship for a three-stage gearbox is taken from the same NREL study as the generator relationships. The torque density of gearboxes may have increased since the time of the publication, but all topologies use the same gearbox, so this mass estimation is sufficient for comparison between the different systems. The mass of the gearbox is calculated based on the low-speed shaft torque (LSST) in kilonewton-metres, and the cost is based on the rated power of the gearbox in kilowatts.
6.3 Power electronic converters
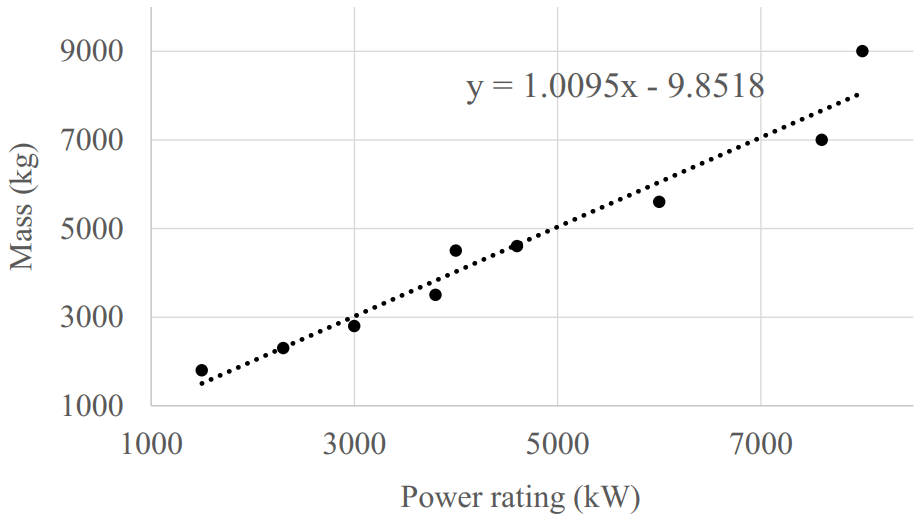
The mass of low-voltage (690 V AC), IGBT-based back-to-back VSCs designed specifically for wind turbines is given for units of different power ratings in a data sheet provided by ABB (ABB, 2018). The mass is given for complete units and includes the converters, filters, circuit breakers, casings, cooling systems and any other auxiliary systems that are required for the converters to operate. This information has been plotted, and a linear approximation has been used to develop a scaling relationship that can estimate the mass of the back-to-back converter with the power rating required for the MRWT system. Figure 10 shows that the linear approximation achieves a reasonable estimation of converter mass, particularly at lower power ratings. Some topologies also use medium-voltage converters, but little information is available on the mass of commercially available MV converters, particularly at low power ratings. Wind turbines have traditionally used LV generators of 690 V until recently, when power ratings of wind turbines have increased significantly, and it became more appropriate to use MV machines. It can be assumed that the same relationship holds for both low- and medium-voltage back-to-back converters. Comparing the mass of LV and MV back-to-back converter units of similar power ratings, both produced by ABB, it is seen that the MV converter mass is lower compared to its LV counterpart (ABB, 2019), suggesting that the mass estimation for low-power medium-voltage converters may be conservative. Mass for controlled rectifiers or inverters are taken as half of the back-to-back converter mass.
Due to the variety of designs present in the literature and the lack of commercially available high-power DC–DC converters, estimates of mass are tricky. Mass estimates of various converter types are given in Chen et al. (2013), who show a mass of around 800 kg for a buck–boost IGBT-based 5 MW converter. The problem here is that this mass is solely based on the switches and passive elements in the DC–DC converter. When a commercially produced converter is available, the mass of the unit is likely to be considerably higher due to cooling and other auxiliary systems that are required. This lower estimate in mass could cause an unfair comparison between AC and DC topologies. Solar PV applications utilize DC–DC converters on the same scale as is required for the MRWT topologies. Dynapower provides some information about a commercially available bidirectional DC–DC converter in Dynapower (2019), which lists a mass of a 500 kW unit as 590 kg. Comparing this to the estimated mass of 800 kg given in Chen et al. (2013) for a 5 MW unit highlights the difference between academic mass estimation and commercially available units. The Dynapower DC–DC converter can be used in a modular fashion to produce higher-power DC–DC converters, so the mass of this unit is used to estimate the mass of DC–DC converters required for this study. Mass of all power electronic devices in this study is estimated based on the rated power of the devices in kilowatts.
Costs used in two recent studies (Parker and Anaya-Lara, 2013; Lakshmanan et al., 2015) have been converted to 2019 GBP to give a cost of a back-to-back converter (regardless of type) of GBP 132 per kilovolt-ampere and a controlled rectifier of GBP 66 per kilovolt-ampere. DC–DC converter price estimates vary significantly in the literature due to the lack of commercially available converters for wind applications and the variety of designs suggested. It is therefore most appropriate to take a range of prices available in the literature for suitable DC–DC converters and take an average of these prices. The studies used for this are Lakshmanan et al. (2015), Fingersh et al. (2006), Max (2007), Lundberg (2003), and Georgios and Wheeler (2010). This gives an average cost of GBP 110 per kilovolt-ampere.
6.4 Cables
Mass of cables can be easily assessed using mass-per-kilometre values given in data sheets of cables from a variety of cable manufacturers.
Cable costs are estimated from Dicorato et al. (2011), who provide a cost function for a kilometre of cable based on the CSA of the cables in square millimetres. The study uses available costs from numerous sources and averages them for each CSA then uses a least-square linear regression to produce the relationship. The paper states that this relationship is valid for medium-voltage, copper-conductor, XLPE-insulated cables. Although not stated, most offshore installations use three-core cable, so it is assumed that this is the cost for three-core cable. Suitable cables have been selected for each topology based on the required current-carrying capacity of the cables. Cable distances have been estimated for each topology based on realistic cable layout designs that follow the triangular lattice support structure beams as closely as possible to avoid loose-hanging cables within the structure.
6.5 Transformers
Mass of transformers has been estimated by using information given in Declercq (2003) regarding the “SLIM” range of transformers for wind turbines manufactured by Pauwels International (now “CG”). The mass of transformers from different power ratings was plotted, and a linear approximation for how the mass varies with power rating was developed. Additional information from Islam et al. (2014) was used to develop the relationship shown in Table 2, which estimates the given masses of transformers very well. It also generally agrees with other information from data sheets for ABB distribution step-down transformers. The mass of transformers is estimated based on the power rating of the transformer in volt-amperes.
Lundberg (2003) provides a formula for estimating the cost of MV and high-voltage (HV) transformers rated between 6.3 and 150 MVA, with a low side voltage rating between 10.5 and 77 kV and high side rating between 47 and 140 kV. The transformers required in this study do not quite fall into this category but is assumed to follow this cost model. This cost model provides the base for many cost estimates of transformers in the literature, with Parker and Anaya-Lara (2013), Dicorato et al. (2011), and Lakshmanan et al. (2015) all using this relationship and scaling it to present-day value in the currency of the paper. The cost estimates for transformers in this study are based on the rated power of the transformer in volt-amperes.
6.6 Switchgear
Lundberg (2003) also provides a cost model for AC switchgear based on the voltage rating in volts, which is commonly used within the academic literature. The cost of DC switchgear is also required for this study, which is more difficult to estimate due to the lack of commercially available DC switchgear. It is suggested in Lakshmanan et al. (2015) that the cost of DC switchgear could be as much as 4 times that of AC switchgear, but this figure is based on a study from 2007. Since then, advancements in DC switchgear have been made, so a relationship of 2 times the cost of AC switchgear is used here to reflect advancements in technology. The mass of switchgear is assumed to be negligible in this study as the VSC mass estimations includes some switchgear masses.
6.7 Losses
Losses of each individual component were estimated at each 0.5 m s−1 wind speed increment between cut-in and cut-out wind speed. Mechanical power is calculated as follows:
where Pmech is the mechanical power produced by the turbine, ρ is the density of air, A is the swept area, v is the wind speed, and CP is the coefficient of performance. Loss profiles that describe the losses of each component over the entire operating range of wind speeds were used in order to account for varying efficiencies of components when operating at part load. For each topology, the mechanical power was calculated using Eq. (1) and losses for each component subtracted at each wind speed. The output power of each component was used as the input power of the next component. For example, the input power of the generator is the mechanical power produced by the turbine minus the gearbox losses. MATLAB scripts were created to calculate the total losses at each wind speed of each collection topology.
An equation is presented for gearbox efficiency in Jamieson (2011), which was developed by GL Garrad Hassan. It comprises a loss that varies in proportion to the operating power level and a constant loss that is related to the rated power and number of stages:
where Lgear is the losses in the gearbox in kilowatts, N is the number of stages, Pr is the rated power of the gearbox in kilowatts (constant), and Pi is the input power of the gearbox in kilowatts (variable). This equation is used to estimate losses of gearboxes in this study.
Losses for generators, power converters and DC–DC converters were estimated by using a combination of data presented in a Lundberg study (Lundberg, 2003) and various data sheets from commercial suppliers. The Lundberg study presents losses of various components as a percentage of rated power over a full range of wind speeds, so it can be applied to a variety of different power ratings, while the commercial data are used to ensure up-to-date losses at the rated power of the different components used. This allows for a simple method suitable for early-stage analysis while allowing the loss characteristics of different components at part load to be included. Loss data for each component were produced based on the Lundberg study and reconfigured to reflect commercial rated efficiencies and a different rated wind speed while maintaining the below-rated characteristics of the components.
High-speed PMSG efficiency at rated power is listed as over 98 % by ABB (ABB, 2012). This is available on the ABB website and is presented as their currently used technology. Back-to-back converter efficiency at rated power for an LV converter unit is given as 97 % in ABB (2018). Back-to-back converter efficiency at rated power for an MV converter unit is given as 98 % in ABB (2019). These efficiencies include back-to-back converters, filtering, cooling systems etc. and are used in this study. For controlled rectifiers, an efficiency at rated power of 99 % for MV and 98.5 % for LV has been be used.
There are a huge number of DC–DC converters proposed and studied in the literature in recent years. The advancement of power electronic devices and the increasing need to minimize mass in offshore applications have led to an increased interest in DC–DC converter topologies that are suitable for use in offshore wind farms. In Parastar et al. (2015) a multilevel modular DC–DC converter for high-voltage DC wind farms is suggested and reports efficiencies of around 97 % at rated power for a small-scale prototype. In Chen et al. (2013) various types of converters are compared in terms of mass, number of components, efficiency and volume. The two best candidates are a buck–boost converter based on IGBTs with a rated efficiency of 97.5 % and a resonant switched capacitor converter with a very high efficiency of over 99 %. In Max and Lundberg (2008) three converter types are analysed and compared, with the author concluding that the most suited type of converter for use in a DC wind farm is a full-bridge converter based on IGBT switches. The study presents efficiencies of both a turbine-level and group-level converter as 97.08 % and 97.97 %, respectively. Finally, various topologies of DC turbine configurations are also shown in Lundberg's comprehensive study from 2003, which all are at approximately 97 % efficiency (Lundberg, 2003). The conclusion reached is that a rated efficiency of 97 % is used for the DC–DC converters in this study, with below-rated efficiencies capturing the characteristics of the converters presented in Lundberg (2003). This provides a realistic and slightly conservative estimate of losses within a DC–DC converter suitable for the MRWT application.
Losses in cables can be approximated by
where Lcable_3Φ is the losses in the three-phase AC cables in watts, IRMS is the rms AC current in each phase in amperes, RAC is the resistance of the AC cable in ohms, Lcable_DC is the losses in the DC cable in watts, IDC is the DC current in amperes, and RDC is the resistance of the DC cable in ohms (Starke et al., 2008). Resistances of the cables can be calculated by considering the total length of cables within the topology and the given resistance per length for the cables' CSA.
Transformer efficiencies are estimated using a combination of the loss profile presented by Lundberg in Lundberg (2003) and full load efficiencies presented in Islam et al. (2014). Losses in switchgear are considered negligible.
In order to analyse the cost effectiveness of each topology, a simplified cost-of-energy (COE) calculation was performed that considered the capital cost of the drivetrain and electrical components and the total electricity produced by each topology over a 20-year lifetime of the project in net present value (NPV). Equation (5) was used to calculate the simplified COE, and the NPV of electricity produced was calculated according to Eq. (6), where AEC is the annual energy capture; i is the discount rate, which is equal to 10 %; and n is the lifetime of the project in years. No costs associated with operations and maintenance or loss of power due to failures were included in this calculation.
The wind speed is assumed to follow a Weibull distribution, with an average wind speed of 10 m s−1, and values of k=2 and C=9.5 are used. Total energy capture was calculated by multiplying the output power at each wind speed by the number of hours per year the wind will be at that speed and summing the results together.
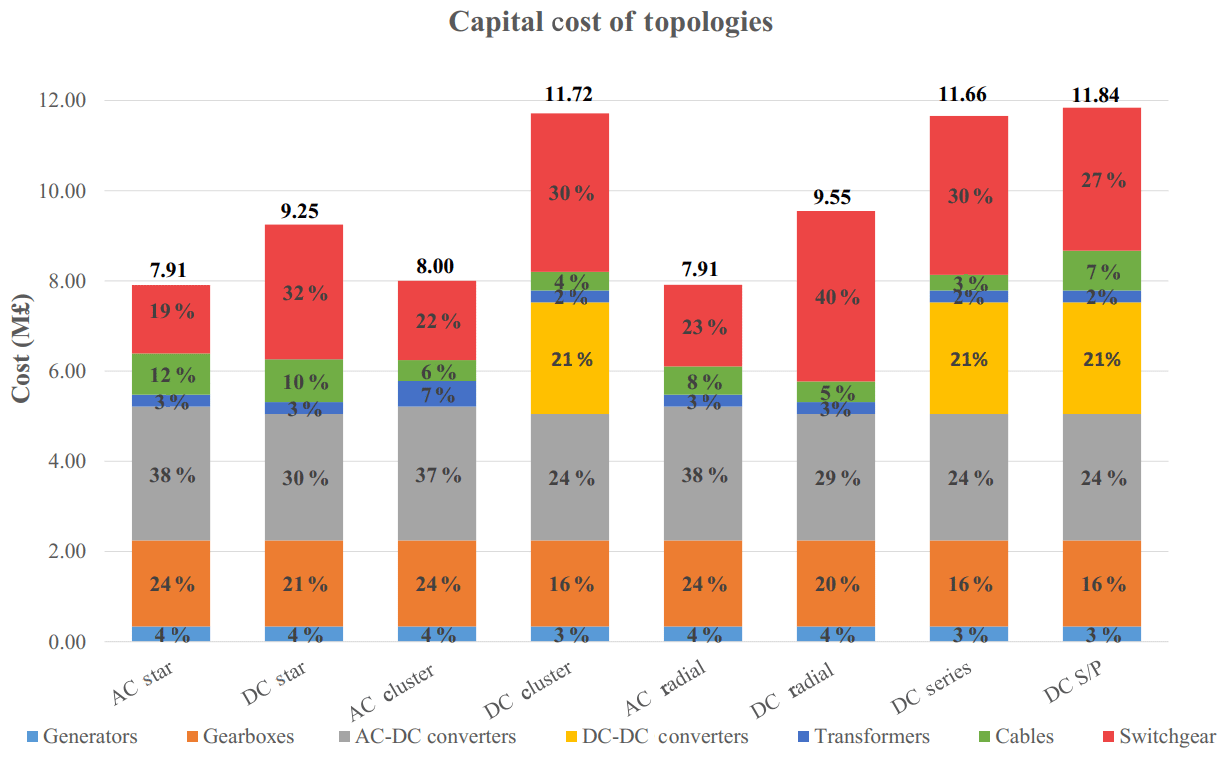
Figure 11Total capital cost of electrical topologies with breakdown by component. Total capital cost is shown above each bar. Percentage of total capital cost is also shown for each component. Taking AC star as an example, the total capital cost is GBP 7.91 million, with the generators accounting for 4 % of the total cost, gearboxes accounting for 24 % and so on.
The total capital cost of each electrical topology is shown in Fig. 11. It is clear that DC topologies will incur a significantly higher capital cost compared to AC topologies. This is due to the increased cost of DC–DC converters and DC switchgear. The AC star and radial topologies have the lowest capital cost of topologies analysed, while the most expensive are the DC series–parallel and DC cluster topologies.
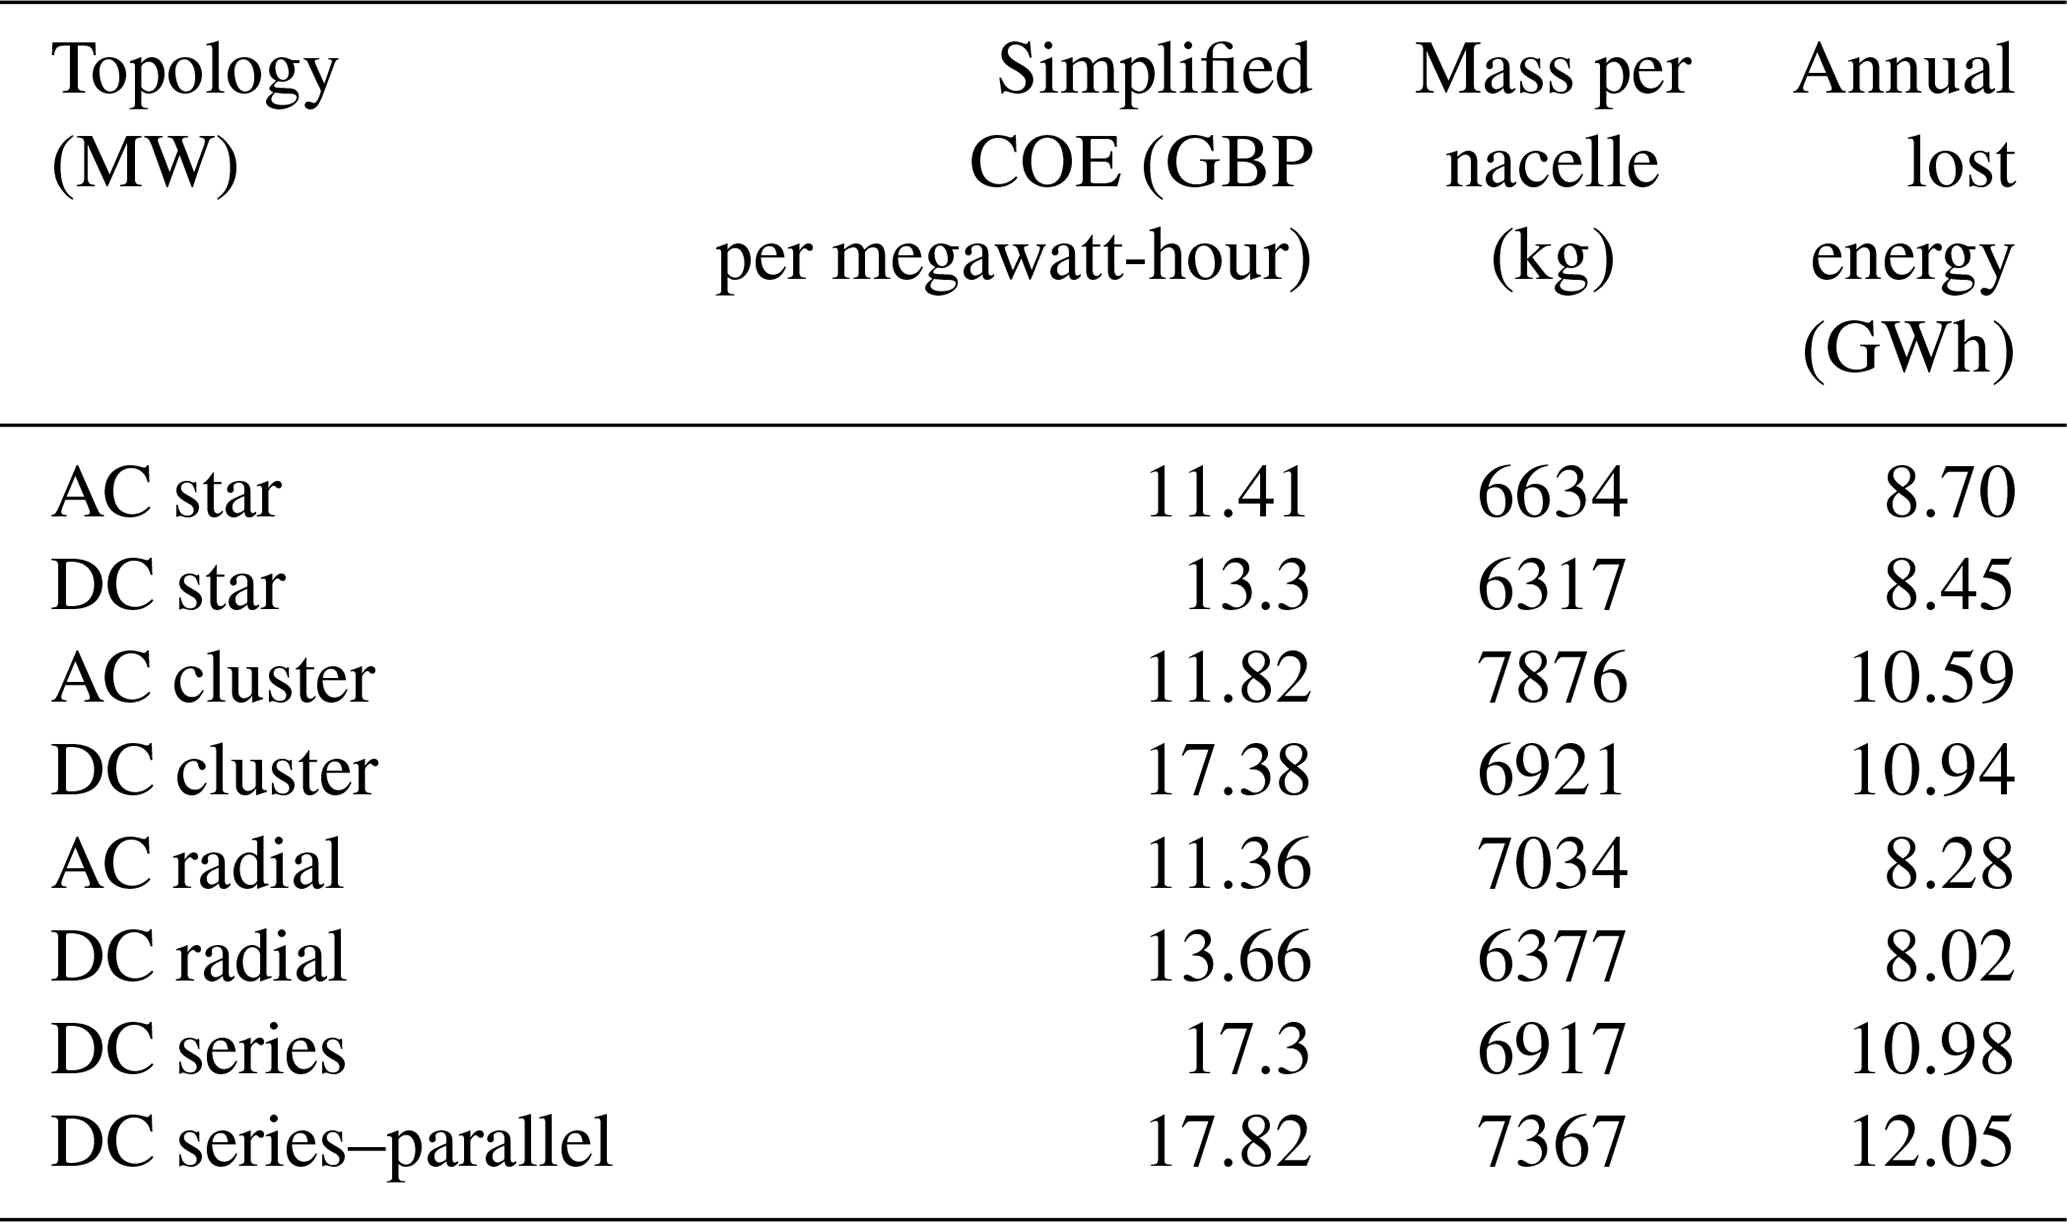
The total mass and breakdown of component mass are shown for each topology in Fig. 12. Although some topologies are lighter than others, the difference in total weight is not significant. The system with the highest mass is the AC cluster topology, with its high mass due to the use of AC transformers within the system. The lightest is the DC star topology, with DC radial and AC star very close behind. Gearbox and generator mass is a significant portion of total mass, accounting for 68 %–81 % of the total mass in each case. This mass can be reduced by considering different generator and gearbox combinations but has not been considered in this study so as to make a fair comparison of the type of electrical systems. As the large transformer and/or inverter are situated on the built-in platform of the MRWT, the mass per nacelle is a more appropriate measure of how the mass of each system will effect the design of the support structure. This is shown in Table 3 and includes all components housed within the nacelle as well as a share of the cable mass and shared components. The DC star and DC radial topologies perform well in this category due to their low component count. The DC star achieves a 10 % reduction in mass of each nacelle compared to the base case of the AC radial.
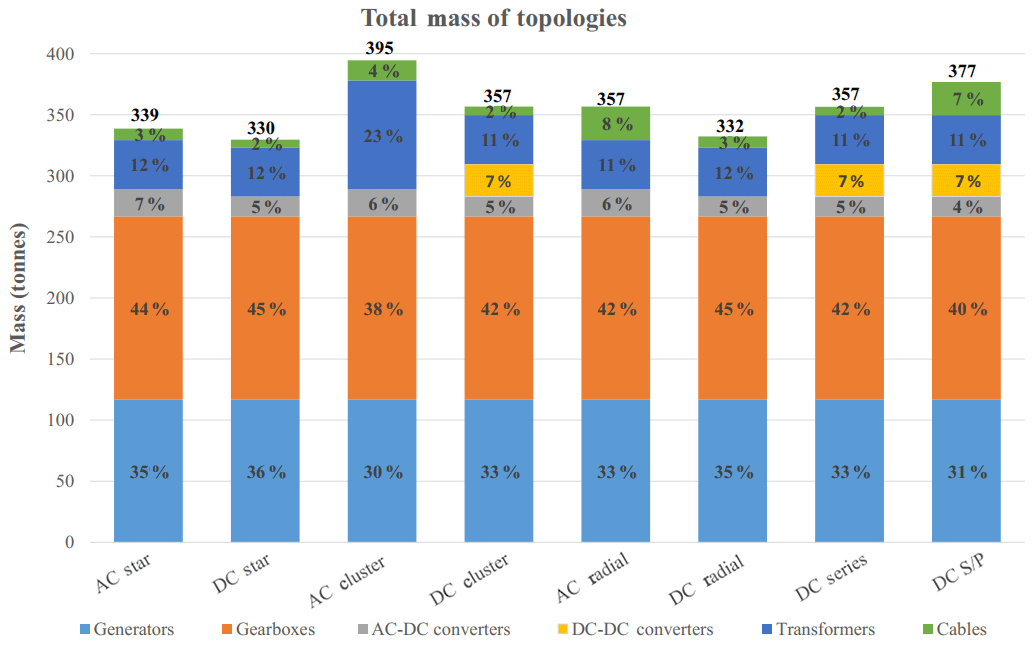
Table 3Comparison of characteristics of each electrical topology.
Losses at rated power of each topology are shown in Fig. 13, with the most efficient topologies being the DC radial and AC radial designs. The DC radial design is slightly more efficient than the AC radial due to lower losses in the DC cables. This is due to the higher voltage level and the reduced conduction losses in DC cables. The DC cluster topology has higher losses compared to the AC cluster topology due to the much reduced efficiency of the DC–DC converters compared to AC transformers.
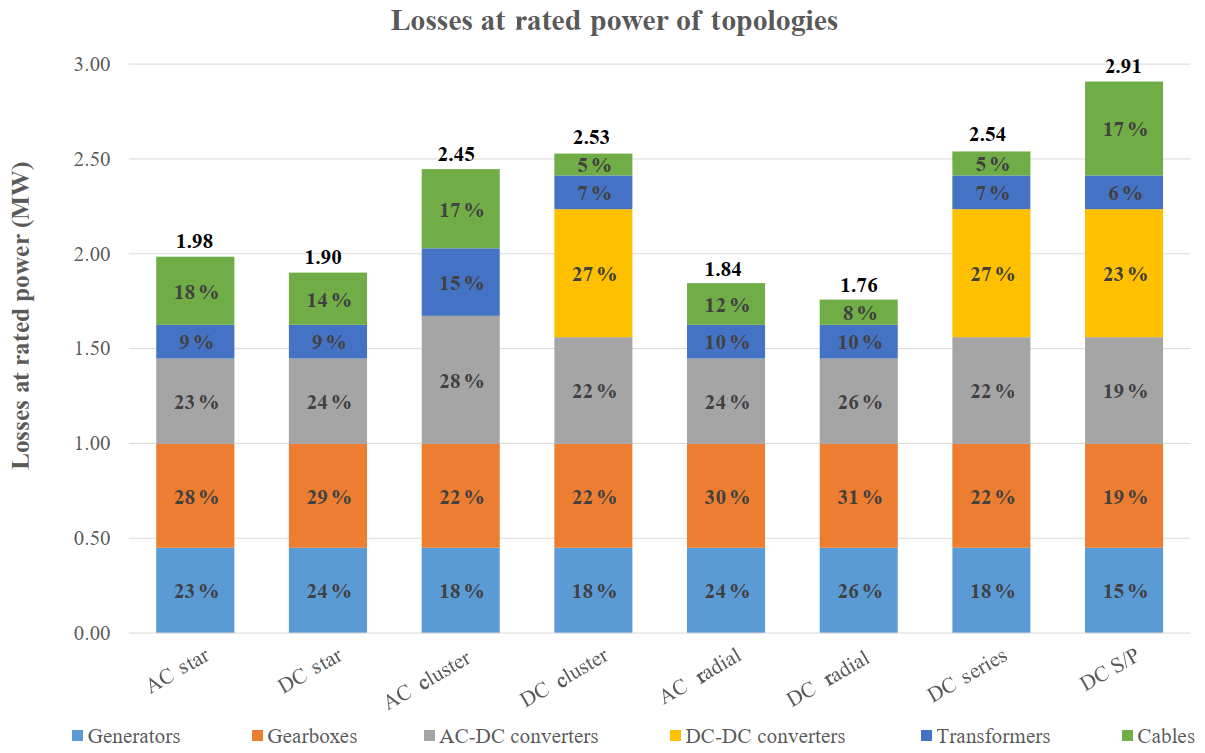
Comparing AC systems to their equivalent DC systems, the DC systems always have a higher cost due to the high cost of DC–DC converters and switchgear, with the mass of DC systems being marginally lower and the losses between AC and DC systems being very similar. This shows that the lower losses in DC cables at this power range and cable lengths are not large enough to make a significant difference in the overall efficiency of the systems. Comparing the AC and DC star topology efficiencies shows this well. Cables do not significantly contribute to the total mass, with the lightest system simply being the one with the fewest components.
The simplified COE of the electrical system and gearbox of each topology is shown in Table 3. Low capital cost and losses in the AC systems result in low simplified COE for the AC star, AC cluster and AC radial topologies. High capital cost and losses result in high simplified COE for the DC series, DC series–parallel and DC cluster topologies. AC topologies have a lower capital cost and lower simplified COE compared to the DC systems analysed, showing that the proposed benefits of DC systems in offshore collection networks do not cross over to collection systems for MRWTs.
A comparison of each topology can be seen in Table 4. The AC radial is considered the base topology as it is the most commonly used collection network in offshore wind farms. Base levels are marked with “O” in Table 4, with “+” symbols used to indicate an improvement in the specified category compared to the base case and “−” symbols used to indicate a decrease in performance in that category compared to the base case. Component count includes gearbox, generator, converters, transformers and switchgear units for each topology. The reliability category is considered as a combination of component count and amount of shared equipment. As an example, the DC cluster topology performs badly in this category as a fault in the shared DC–DC converter would result in a loss of five turbines, and the DC star topology performs excellently in this category due to having no shared equipment and a low component count. This category is seen as an important characteristic of each topology as it highlights one of the key benefits of an MRWT system. Failure of components in a large single-rotor turbine will likely result in the loss of 100 % of the power from that turbine, whereas an MRWT can still produce a high percentage of power after the failure of components. Further work should be conducted in order to quantify monetary value of this characteristic for each topology, but a first-pass attempt has been made here to at least indicate which topologies will benefit the most from this characteristic. Although cable failure rates are significantly lower than other components used in wind turbines, cable failures have still been included in this analysis.
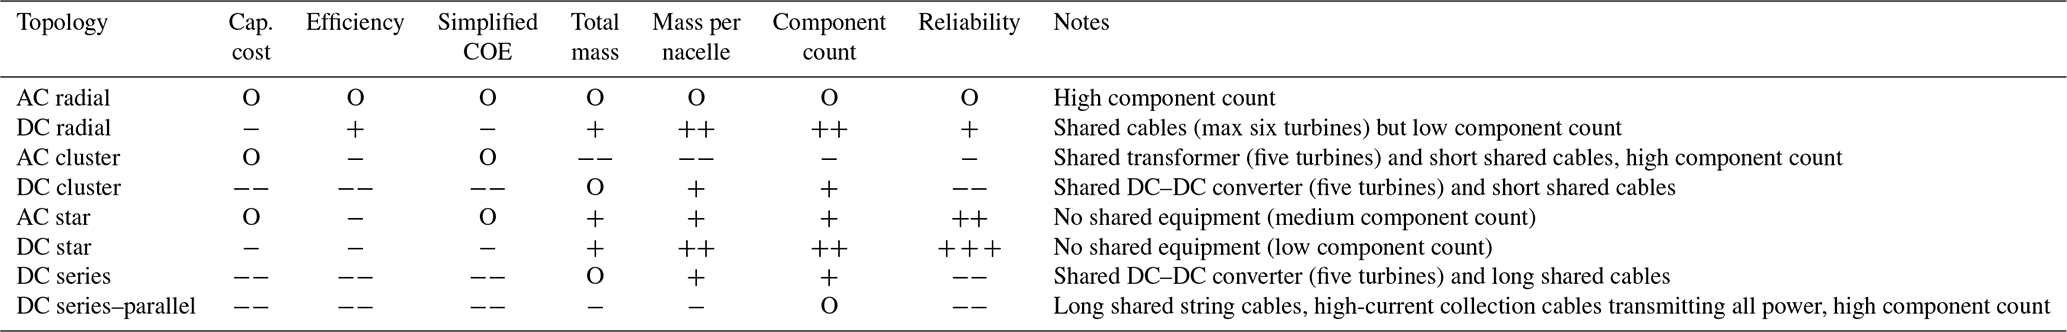
The AC star topology is the best solution overall as it only performs slightly worse than the base case in the category of efficiency and performs very well in each of the other categories, specifically reliability and mass per nacelle. The DC star topology also performs well overall and could see an improvement in reliability compared to the AC star topology due to its lower component count. It is recommended that more detailed design and analysis work is carried out for these two topologies.
The basic cost estimation of electrical components made in the Innwind project (Jamieson et al., 2015) totals to GBP 4.6 million. This cost estimation was lacking detail and significantly underestimated the cost of electrical systems required for an MRWT, with this study showing the cheapest system to cost in the region of GBP 7.9 million. The capital cost of electrical components (as well as gearbox cost) in the Innwind project is 13.3 % of the capital cost of the entire system, and the simplified COE of the electrical system and gearbox is estimated to be GBP 10.65 per megawatt-hour. Although lower than the simplified COE of each topology in this study, it is reflective of the level of detail between the two studies. Using the same methodology, the simplified COE of the electrical system of two DTU RWTs (including gearbox) is GBP 36.85 per megawatt-hour, showing that even the most expensive topologies are significantly cheaper compared to a large single-rotor turbine. Combined with the savings in material costs for blades, improvements in O & M costs, reduced installation and transport costs, and power increases due to clustering of turbines, it is still expected that the MRWT concept will achieve a much improved overall LCOE regardless of the increase in cost of electrical components.
The cost estimates presented here are highly sensitive to the cost of DC–DC converters and DC switchgear. Although these costs may fall in the future, the reductions would have to be significant for the DC systems to be comparable in price to the AC systems in the context of MRWT electrical systems. DC systems may be more attractive if the MRWT would connect to a DC collection network; however, there are currently no DC collection networks in operation, and the feasibility of their existence within the near future is still low. DC systems could also reduce cost and mass significantly by using diode rectifiers in place of controlled rectifiers, but this would jeopardize the controllability of the entire system and in most cases lose the ability to control the speed of the turbines individually.
Future work is recommended on further optimization of topologies to see the effects of varying voltage level, number of turbines in clusters and strings, different generator types, different power train configurations, and different rated power levels of turbines used within the MRWT system.
Eight different electrical topologies have been proposed and analysed in terms of mass, cost effectiveness, component count and reliability. There are several key findings from this study. AC topologies consistently have the lowest simplified COE of the electrical system, ranging between GBP 11.36 and 11.82 per megawatt-hour. DC systems have higher simplified COE of the electrical system between GBP 13.3 and 17.8 per megawatt-hour. The increased cost is attributed to the high cost of DC–DC converters and DC switchgear. AC systems have lower capital cost and lower simplified COE compared to the equivalent DC systems. The lowest simplified COE is seen in the AC radial system, very closely followed by the AC star and AC cluster topologies. The topologies with the highest simplified COE are the DC series–parallel, followed by the DC cluster and DC series. The radial topologies have the highest efficiency at rated power and the lowest annual energy loss. The difference in total mass between the systems is not significant, but DC systems do see a reduction in mass per nacelle. It is unclear at this point how much the mass of each nacelle will effect the cost and complexity of the support structure required for an MRWT. Both star topologies are considered to have the highest reliability due to having no shared equipment. Lower losses in DC cables do not result in a significant reduction in total system losses. Reduced cost of DC cables does not outweigh the increased cost due to DC–DC converters and DC switchgear.
DC–DC converters and DC switchgear are still commercially unavailable, and it is therefore hard to estimate the cost of such equipment. Due to this, the results are very sensitive to the cost of DC–DC converters and switchgear. Systems that lose only a small portion of rated power due to the failure of one component are clearly more desirable than systems that will lose a higher portion of rated power. Further work is recommended on this topic to investigate the monetary value of this characteristic of MRWTs.
From the systems analysed, the most promising type of system is the AC star topology; it performs well in a large range of categories and has very good reliability compared to other systems. The high reliability is due to the design of the system, which has no shared equipment between turbines. The DC star topology also performs well overall and could have even higher reliability than the AC star topology due to its lower component count. Both topologies should be considered for more detailed design and analysis in future work.
No data sets were used in this article.
PP carried out all design and analysis work under the supervision and guidance from DCG and OAL.
The authors declare that they have no conflict of interest.
This article is part of the special issue “Wind Energy Science Conference 2019”. It is a result of the Wind Energy Science Conference 2019, Cork, Ireland, 17–20 June 2019.
This research has been supported by the EPSRC-funded Wind and Marine Energy Systems Centre for Doctoral Training (grant no. EP/L016680/1).
This paper was edited by Joachim Peinke and reviewed by Peter Dalhoff and one anonymous referee.
ABB: Product note 9AKK105293 Rev B.: High speed PM generator series for full converter concept from 1.5 MW upwards, available at: https://new.abb.com/motors-generators/generators/generators-for-wind-turbines (last access: 10 August 2020), 2012. a
ABB: 3AUA0000231755 Rev A: ABB wind turbine converters – ACS880, 800 kW to 8 MW, available at: https://new.abb.com/power-converters-inverters/wind-turbines (last access: 10 August 2020), 2018. a, b
ABB: 3BHS351272E01 Rev C: ABB wind turbine converters PCS6000, available at: https://new.abb.com/power-converters-inverters/wind-turbines (last access: 10 August 2020), 2019. a, b
Bahirat, H. J., Mork, B. A., and Hoidalen, H. K.: Comparison of wind farm topologies for offshore applications, in: 2012 IEEE Power and Energy Society General Meeting, San Diego, CA, 1–8, https://doi.org/10.1109/PESGM.2012.6344689, 2012. a, b
Bak, C., Zahle, F., Bitsche, R., Kim, T., Yde, A., Henriksen, L. C., Natarajan, A., and Hansen, M.: Description of the DTU 10 MW Reference Wind Turbine, DTU Wind Energy Report-I-0092, DTU Wind Energy, 2013. a
Carroll, J., McDonald, A., McMillan, D., Stehly, T., Mone, C., and Maples, B.: Cost of energy for offshore wind turbines with different drive train types, in: Eur. Wind Energy Assoc. Annu. Conf. Exhib. 2015, EWEA 2015 – Sci. Proc., available at: https://www.scopus.com/inward/record.uri?eid=2-s2.0-85034228558&partnerID=40&md5=d448b6a80cd201e2da47be7e1d739cbd (last access: 10 August 2020), 2015. a
Chen, W., Huang, A. Q., Li, C., Wang, G., and Gu, W.: Analysis and comparison of medium voltage high power DC/DC converters for offshore wind energy systems, IEEE Trans. Power Electron., 28, 2014–2023, https://doi.org/10.1109/TPEL.2012.2215054, 2013. a, b, c
Declercq, J.: Transformers for wind turbines - need for new design of business as usual, in: 17th Int. Conf. Electr. Distrib., 12–15 May 2003, Barcelona, 2003. a
Dicorato, M., Forte, G., Pisani, M., and Trovato, M.: Guidelines for assessment of investment cost for offshore wind generation, Renew. Energy, 36, 2043–2051, https://doi.org/10.1016/j.renene.2011.01.003, 2011. a, b
Dynapower: DPS-500 500 kW bidirectional DC to DC converter for utility scale solar plus storage, available at: https://www.dynapower.com/products/energy-storage-solutions/dc-coupled-utility-scale-solar-plus-storage/dps-500/#1484175014994-ffbe8ee5-5162148423311391314842436644, last access: 10 May 2019. a
Fingersh, L., Hand, M., and Laxson, A.: Wind Turbine Design Cost and Scaling Model, Tech. rep., NREL – National Renewable Energy Laboratory, Golden, CO, https://doi.org/10.2172/897434, 2006. a, b
Georgios, S. and Wheeler, P.: Techno-Economical Analysis of DC Collection Grid for Offshore Wind Parks, MS thesis, University of Nottingham, Nottingham, https://doi.org/10.13140/RG.2.1.1902.6649, 2010. a
Goeltenbott, U., Ohya, Y., Karasudani, T., and Jamieson, P.: Aerodynamics of Clustered Wind Lens Turbines, in: ICOPE 2015 – Int. Conf. Power Eng., Japan Society of Mechanical Engineers, 26–31 July 2015, Seoul, Korea, V01AT28A002, https://doi.org/10.1115/AJKFluids2015-28601, 2015. a
Göltenbott, U., Ohya, Y., Yoshida, S., and Jamieson, P.: Aerodynamic interaction of diffuser augmented wind turbines in multi-rotor systems, Renew. Energ., 112, 25–34, https://doi.org/10.1016/j.renene.2017.05.014, 2017. a
Hart, K., McDonald, A., Polinder, H., Corr, E. J., and Carroll, J.: Improved cost energy comparison of permanent magnet generators for large offshore wind turbines, in: Eur. Wind Energy Assoc. 2014 Annu. Conf., available at: http://strathprints.strath.ac.uk/id/eprint/48099 (last access: 10 August 2020), 2014. a
Islam, M. R., Guo, Y., and Zhu, J.: A review of offshore wind turbine nacelle: Technical challenges, and research and developmental trends, Renew. Sustain. Energ. Rev., 33, 161–176, https://doi.org/10.1016/j.rser.2014.01.085, 2014. a, b
Jamieson, P.: Innovation in Wind Turbine Design, John Wiley & Sons, Ltd, Chichester, UK, ISBN 9781119975441, 2011. a
Jamieson, P. and Branney, M.: Multi-Rotors; A Solution to 20 MW and Beyond?, Enrgy. Proced., 24, 52–59, https://doi.org/10.1016/J.EGYPRO.2012.06.086, 2012. a, b
Jamieson, P., Branney, M., Hart, K., Chaviaropoulos, P., Sieros, G., Voutsinas, S., Chasapogiannid, P., and Prospathopoulos, J. M.: INNWIND Deliverable 1.3 3: Innovative Turbine Concepts – Multi-Rotor System, Tech. Rep., available at: http://www.innwind.eu/publications/deliverable-reports (last access: 7 March 2019), 2015. a, b, c, d, e, f, g, h
Lakshmanan, P., Liang, J., and Jenkins, N.: Assessment of collection systems for HVDC connected offshore wind farms, Electr. Pow. Syst. Res., 129, 75–82, https://doi.org/10.1016/j.epsr.2015.07.015, 2015. a, b, c, d, e, f
Lundberg, S.: Performance comparison of wind park configurations, Tech. rep., Department of Electric Power Engineering, Chalmers University of Technology, Goteborg, 2003. a, b, c, d, e, f, g, h
Manwell, J. F., McGowan, J. G., Brena, S., and Verma, P.: A Comparative Study of a Three Rotor and a Single Rotor 5 MW Wind Turbine Based on Economic and Structural Considerations, Wind Eng., 38, 643–657, https://doi.org/10.1260/0309-524X.38.6.643, 2014. a, b
Max, L.: Energy Evaluation for DC/DC Converters in DC-Based Wind Farms, Technical Report, Department of Energy and Environment, Chalmers University of Technology, Göteborg, Sweden, 2007. a
Max, L. and Lundberg, S.: System efficiency of a DC/DC converter-based wind farm, Wind Energy, 11, 109–120, https://doi.org/10.1002/we.259, 2008. a
Ng, C. and Ran, L. (Eds.): Offshore Wind Farms: Technologies, Design and Operation, in: vol. 3, Elsevier, Woodhead Publishing, Cambridge, UK, 654 pp., ISBN 978-0-08-100779-2, https://doi.org/10.1016/C2014-0-00763-0, 2016. a
Ohya, Y., Miyazaki, J., Göltenbott, U., and Watanabe, K.: Power Augmentation of Shrouded Wind Turbines in a Multirotor System, J. Energ. Resour. Technol., 139, 051202, https://doi.org/10.1115/1.4035754, 2017. a
Parastar, A., Kang, Y. C., and Seok, J. K.: Multilevel Modular DC/DC Power Converter for High-Voltage DC-Connected Offshore Wind Energy Applications, IEEE Trans. Ind. Electron., 62, 2879–2890, https://doi.org/10.1109/TIE.2014.2363818, 2015. a
Parker, M. A. and Anaya-Lara, O.: Cost and losses associated with offshore wind farm collection networks which centralise the turbine power electronic converters, IET Renew. Power Gen., 7, 390–400, https://doi.org/10.1049/iet-rpg.2012.0262, 2013. a, b
Sieros, G., Chaviaropoulos, P., Sørensen, J. D., Bulder, B. H., and Jamieson, P.: Upscaling wind turbines: theoretical and practical aspects and their impact on the cost of energy, Wind Energy, 15, 3–17, https://doi.org/10.1002/we.527, 2012. a
Starke, M., Tolbert, L. M., and Ozpineci, B.: AC vs. DC distribution: A loss comparison, in: vol. 22, 2008 IEEE/PES Transm. Distrib. Conf. Expo., 21–24 April 2008, Chicago, IL, USA, 1–7, https://doi.org/10.1109/TDC.2008.4517256, 2008. a
The Switch: The Switch high-speed PMGs, available at: https://theswitch.com/download-center/data-sheets/wind/ (last access: 4 August 2020), 1–2, 2019. a
Wind Turbine Models: Enercon E-40/5.40, available at: https://en.wind-turbine-models.com/turbines/67-enercon-e-40-5.40 (last access: 10 August 2020), 2020a. a
Wind Turbine Models: Vestas V39, available at: https://en.wind-turbine-models.com/turbines/383-vestas-v39 (last access: 10 August 2020), 2020b. a
- Abstract
- Introduction
- Methodology
- System outline
- Design constraints
- Proposed electrical topology designs
- Cost, mass and loss estimation
- Cost effectiveness
- Results and discussion
- Conclusions
- Data availability
- Author contributions
- Competing interests
- Special issue statement
- Financial support
- Review statement
- References