the Creative Commons Attribution 4.0 License.
the Creative Commons Attribution 4.0 License.
 | 21 Jan 2021
Computational analysis of high-lift-generating airfoils for diffuser-augmented wind turbines
Aniruddha Deepak Paranjape
Anhad Singh Bajaj
Shaheen Thimmaiah Palanganda
Radha Parikh
Raahil Nayak
Jayakrishnan Radhakrishnan
The impetus towards sustainable energy production and energy access has led to considerable research and development on decentralized generators, in particular diffuser-augmented wind turbines. This paper aims to characterize the performance of diffuser-augmented wind turbines (DAWTs) using high-lift airfoils employing a three-step computational analysis. The study is based on computational fluid dynamics, and the analysis is carried out by solving the unsteady Reynolds-averaged Navier–Stokes (URANS) equations in two dimensions. The rotor blades are modeled as an actuator disk, across which a pressure drop is imposed analogous to a three-dimensional rotor. We study the change in performance of the enclosed turbine with varying diffuser cross-sectional geometry. In particular, this paper characterizes the effect of a flange on the flow augmentation provided by the diffuser. We conclude that at the end of the three-step analysis, Eppler 423 showed the maximum velocity augmentation.
- Article
(2453 KB) - Full-text XML
- BibTeX
- EndNote


Global energy demand is expected to more than double by 2050 due to the growth in population and development of economies (Gielen et al., 2019). Wind energy is emerging as an alternative renewable source for energy production. Presently, wind turbines are typically installed away from populated areas because of visual and noise regulations (Pedersen and Persson Waye, 2004). This necessitates the transfer of electricity via grids over more considerable distances, increasing the levelized cost of electricity. While large wind turbines are placed where the wind topology is optimum, smaller wind turbines are locally built to supply power to meet the local energy demands.
A simplified modeling approach for the wind turbines is carried out, where the conventional horizontal-axis wind turbine (HAWT) is modeled as an actuator disk (AD). The HAWTs can extract 59.3 % of power available in the wind, in accordance with the Betz limit. Diffuser-augmented wind turbines (DAWTs) have the ability to increase the power extracted by the wind turbine by virtue of increased mass flow rate through the rotor plane, improved wake mixing with the external flow, and lastly, improved performance even in cases where the flow may not be purely axial in nature.
The idea of a DAWT, also commonly referred to as a ducted wind turbine or shrouded turbine, was first explored by Lilley and Rainbird (1956). Since the early studies, ample research based on empirical, computational, and experimental approaches has been conducted to investigate and optimize the efficiency of DAWT through various means (Alquraishi et al., 2019). By enclosing a diffuser around the turbine, the wake of the turbine blades is allowed to expand, resulting in a subsequent rapid drop in pressure aft of the diffuser. This, in turn, leads to an increase in the mass flow rate of the incoming free-stream air, thereby increasing the efficiency of the system beyond the Betz limit. Through wind tunnel testing, Igra (1981) found that the power coefficient could be improved by 80 % of that of a conventional wind turbine just by placing a diffuser over it. This phenomenon is termed as velocity augmentation. Ohya et al. (2008) varied the diffuser open angle by adding a flange around the diffuser exit. The study showed that flanged diffusers, that is, an additional geometric modification to the shroud, can cause a larger wake expansion due to unsteady flow-separated regions generated by the flange periphery. The mass flow rate is thus further increased by this geometric feature. Although there is a significant amount of literature employing high-fidelity numerical modeling techniques applied to DAWTs, there is no preliminary analysis that may help potential manufacturers design diffusers with commonly available airfoil geometries.
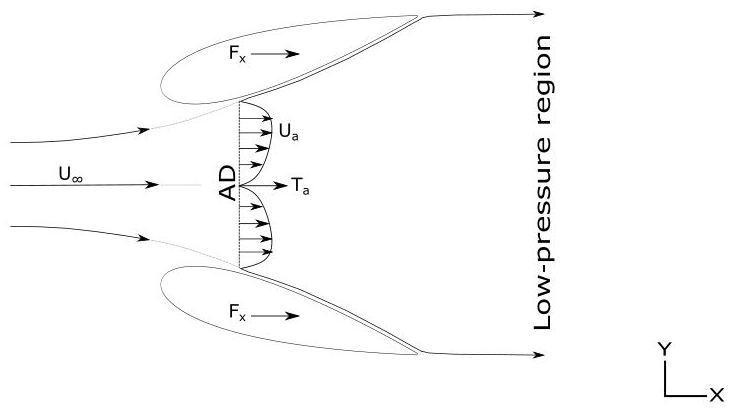
The present study uses high-lift airfoils to highlight a simplified simulation pipeline that may assist designers in assessing the suitability of a pool of airfoils while designing DAWTs or other decentralized wind energy generators. The use of high-lift airfoils in wind energy applications has been documented extensively in the literature. High-lift airfoils improve the aerodynamic efficiency (CL∕CD), i.e., lift-to-drag ratio, at low Reynolds number by virtue of a high-lift coefficient with minimum drag penalties. In this study, we consider a two-dimensional flow field for the analysis following studies conducted by Dighe et al. (2018a). The turbine is modeled as a two-dimensional AD, and the separation effects and flow losses from the tips are assumed to be negligible. The study investigates the effect of camber, thickness, and a flange of a high-lift airfoil on a DAWT and characterizes their performance. The numerical analysis has been carried out by using the commercially available computational fluid dynamics (CFD) solver ANSYS Fluent®. A general schematic of a diffuser-augmented wind turbine is shown in Fig. 1.
The remainder of this paper is organized as follows: Sect. 2 describes the AD modeling and presents the mathematical model used in the study. Section 3 discusses the simulation methodology and the validation of the computational study. Section 4 discusses the results of the study, while Sect. 5 summarizes the important results of the study. Figure 2 highlights the final geometry of the diffuser shape along with the various parameters that define the design geometry.
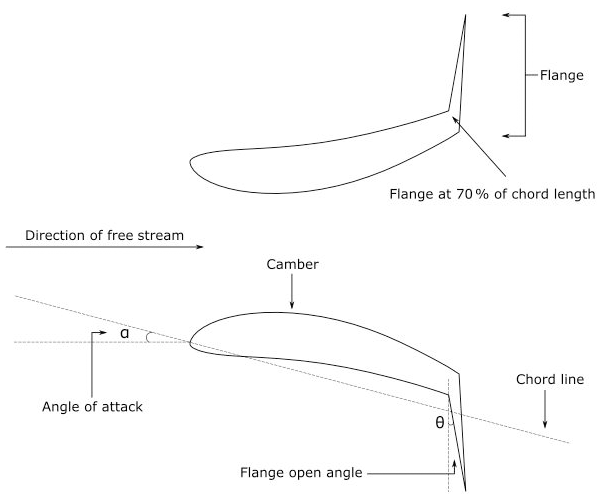
Figure 2A schematic of the final geometry of the diffuser shape with all the parameters highlighted.
The AD uses the mass and momentum conservation principles to balance the applied forces compared to the axial- and tangential-momentum equations that balance the applied forces on the real rotor blades. Although a two-dimensional simplification may not account for three-dimensional effects such as wake rotation and lateral flow, several studies have validated this approach.
The AD is considered to have an infinitesimal width, which exerts a constant thrust TAD per unit surface. The turbine or AD coefficient is given by
where ρ is the fluid density, U∞ is the free-stream velocity, and SAD is the surface area of the AD.
The thrust force TAD can be written as
where Δp is the pressure drop across the AD; δp and ultimately are input for the simulations as a constant, derived from experimental investigations conducted by Tang et al. (2018). The current experimental configuration involves the consideration of an additional force created by the diffuser, TDuct. Thus we can define as
The duct force FDuct creates a mass flow across the AD plane:
Although a constant coefficient of thrust is assumed, the velocity across the AD is not uniform. The average AD velocity can be found by integrating the free-stream velocity over the defined surface area of the AD:
Using the above results we can define a power coefficient for the diffuser geometry with an AD of surface area Sa:
Therefore the total thrust force can be represented as a vectorial sum of the AD force TAD and duct force TDuct, given by
Thus the total thrust coefficient is given by
3.1 Simulation domain
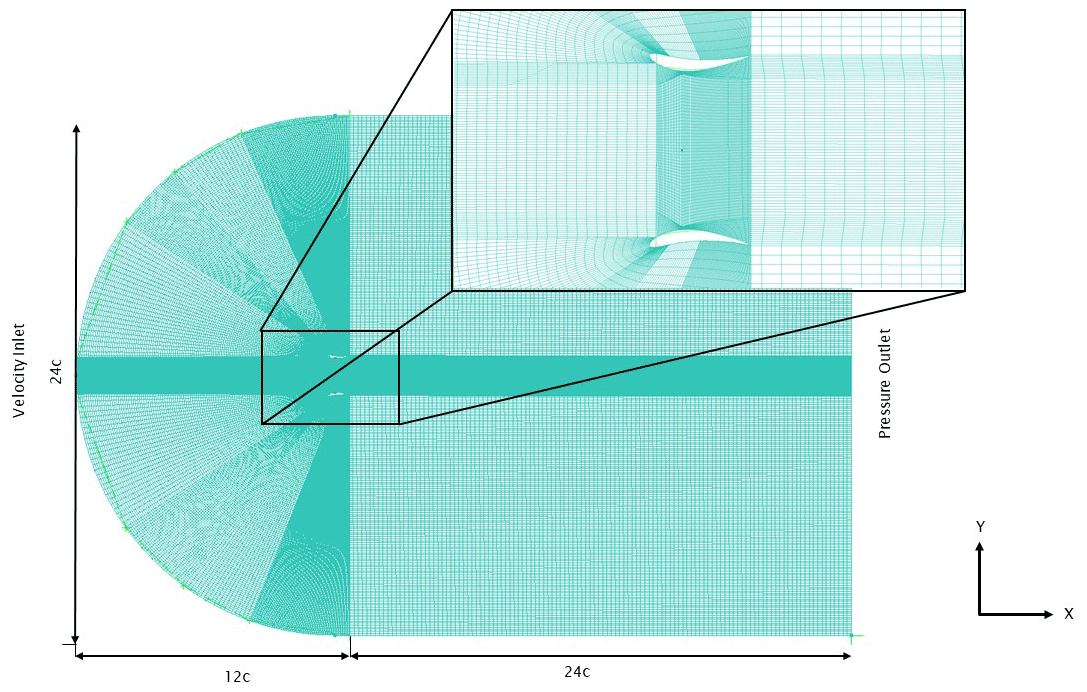
To conduct the present study, ANSYS® and its constituent modules were used to generate, simulate, visualize, and process the results. ICEM CFD®, ANSYS Inc., was used to generate the required mesh due to its significant control and flexibility over the grid generation process. A C-type topography was chosen as the computational domain, as highlighted in Fig. 3, due to its easy generation and minimal skewness of the mesh in the near-wall condition. It also can accurately simulate the flow at various angles of attack. The geometry consists of two-dimensional planar airfoils symmetrically placed about the central axis along with a rotor modeled as an AD. Following the work of Dighe et al. (2019), the tip clearance has been fixed at 2.5 %. The free-stream velocity is set as 6 m s−1 for the present study, and the flow is considered to be steady, uniform, and incompressible for the airfoil chord length. While the simulated conditions are two-dimensional, the conditions are sufficient to gain enough insights due to the axisymmetric nature of the flow. For the given Reynolds number (Re=400 000), the Y+ was maintained at a value less than 1 in order to calculate the wall spacing, therefore assisting the meshing process.
To properly model the viscous flows over the various diffuser configurations at turbulent Reynolds numbers, the Navier–Stokes equations are selected in the Cartesian coordinate system. Boundary conditions considered are uniform velocity at the inlet, zero-gauge static pressure at the outlet, and no-slip walls for duct surfaces. The turbulence model used is the k-ω shear stress transport (SST). The k-ω SST, which was developed by Menter (1994), is a two-equation robust model for turbulence growth and is one of the most widely used turbulence models. This is because the SST combines the use of k-ω in near-wall flow and k-ϵ in free-shear flow. This allows for a faster yet more accurate convergence of the solution.
ANSYS Fluent® was used as the flow solver, while CFD Post® and GNU Octave® were used to process the results.
3.2 Simulation methodology
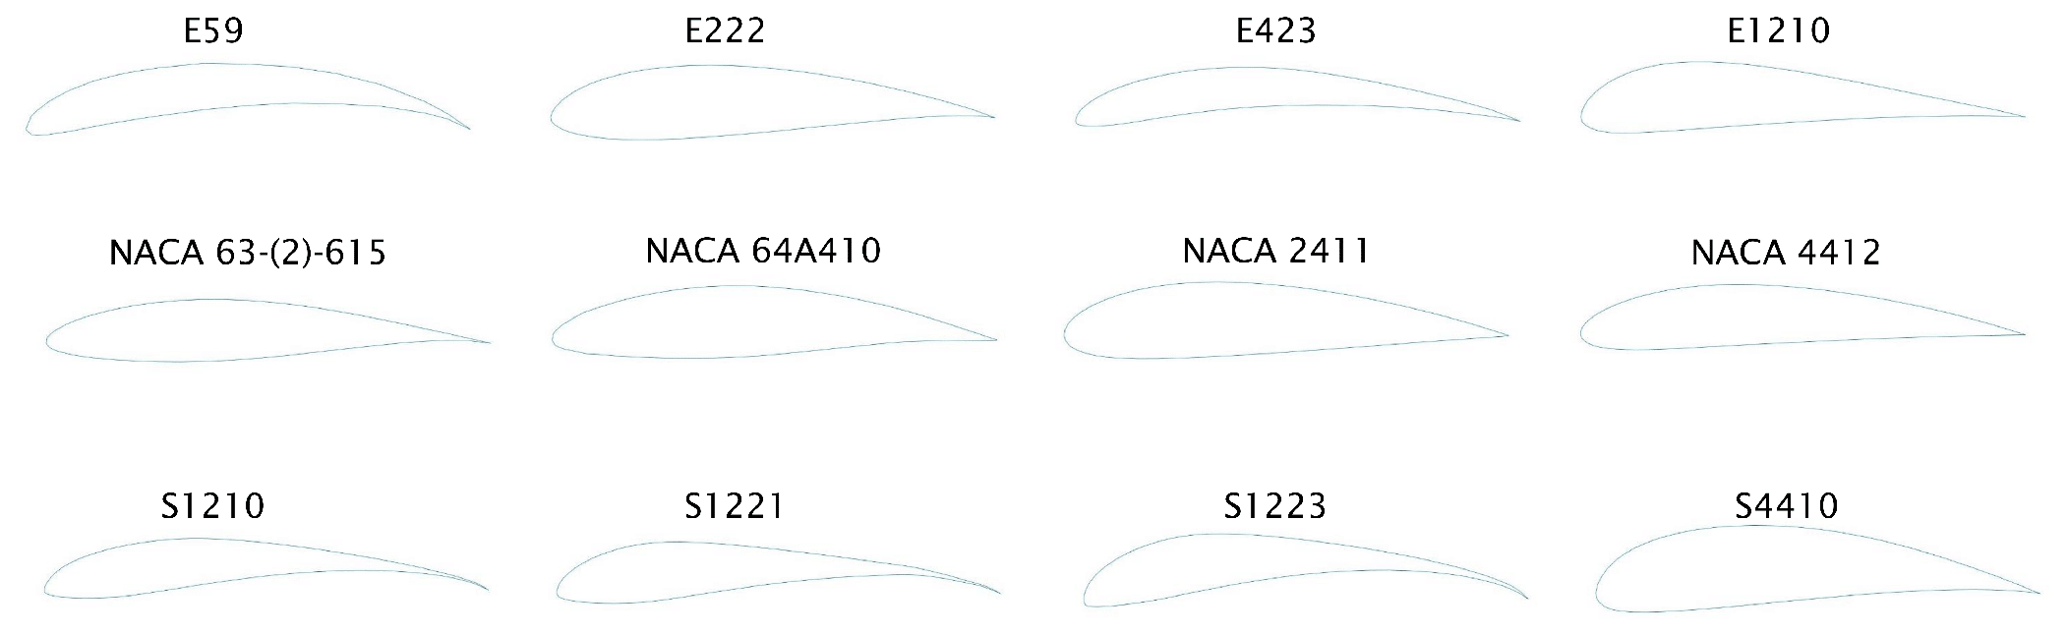
The present study assess the basic aerodynamic performance of high-lift airfoils when applied to a DAWT geometry. Figure 4 highlights 12 airfoils chosen from three different airfoil families: Eppler, NACA, and Selig. The airfoils were selected based on their lift–drag ratio for the chosen Reynolds number. Formally, the technique is called the “brute-force method” (Dighe et al., 2018b).
The study was conducted in three stages. In the first stage, all airfoils were fixed at a constant angle of attack of α=0∘ with respect to the horizontal. The angle of attack here corresponds to the area ratio. The area ratio is defined as the ratio of the diffuser exit area to the area of the AD (SE∕SAD). The results obtained for each case were compared to the NACA 0012 test case. RANS (Reynolds-averaged Navier–Stokes) equations were used in this analysis for maximum simplicity. Based on the results of the first stage of simulations, one airfoil was eliminated from each of the families on the basis of its velocity augmentation (Igra, 1981).
In the second stage, the angle of attack of the airfoils corresponding to their area ratios was varied, and the end result was an optimized angle of attack for each of the families. After concluding simulations of the second phase, one airfoil from each family was eliminated based on its velocity augmentation again, leaving the two best-performing airfoils from each family. In the third stage, the six final airfoils were then analyzed at their optimum angles of attack and added with a 15∘ flange at the trailing edge at 70 % of the chord to generate an unsteady low-pressure region at the trailing edge, which in turn increases the mass flow rate at the AD.
A constant diffuser thrust coefficient of CT=0.767 (Dighe et al., 2018b) is maintained by keeping a constant pressure difference across the AD. The effects of varying the tip clearances on the duct performance are beyond the scope of this study.
3.3 Grid validation and independence studies
A grid validation was conducted to verify the accuracy of the mesh, while a grid convergence study was conducted to determine the optimum mesh configuration without sacrificing the accuracy of the result.
The experimental wind tunnel setup of Igra (1981) was replicated in the numerical domain to validate the generated mesh. Igra carried out numerous experiments during his research on diffuser-augmented wind turbines. Of these, his work on the experimental setup of the “circular wing shrouds” was considered a reference to validate our study. Analogous to the experimental setup, the numerical domain uses the NACA 4412 airfoil, simulated in a planar diffuser configuration. The angle of attack of the airfoils was fixed at 2∘, and the area ratio was maintained at 1.84 for this configuration. Wall blockages and interference were ignored for the experimental setup to avoid elaborate wind tunnel corrections. The inflow velocity was maintained at 6 m s−1. The results were analyzed against experimental pressure distributions and forces (Dighe et al., 2018a). The final mesh generated using the ICEM CFD tool was akin to Igra's experimental results, thus proving the validity of the mesh.
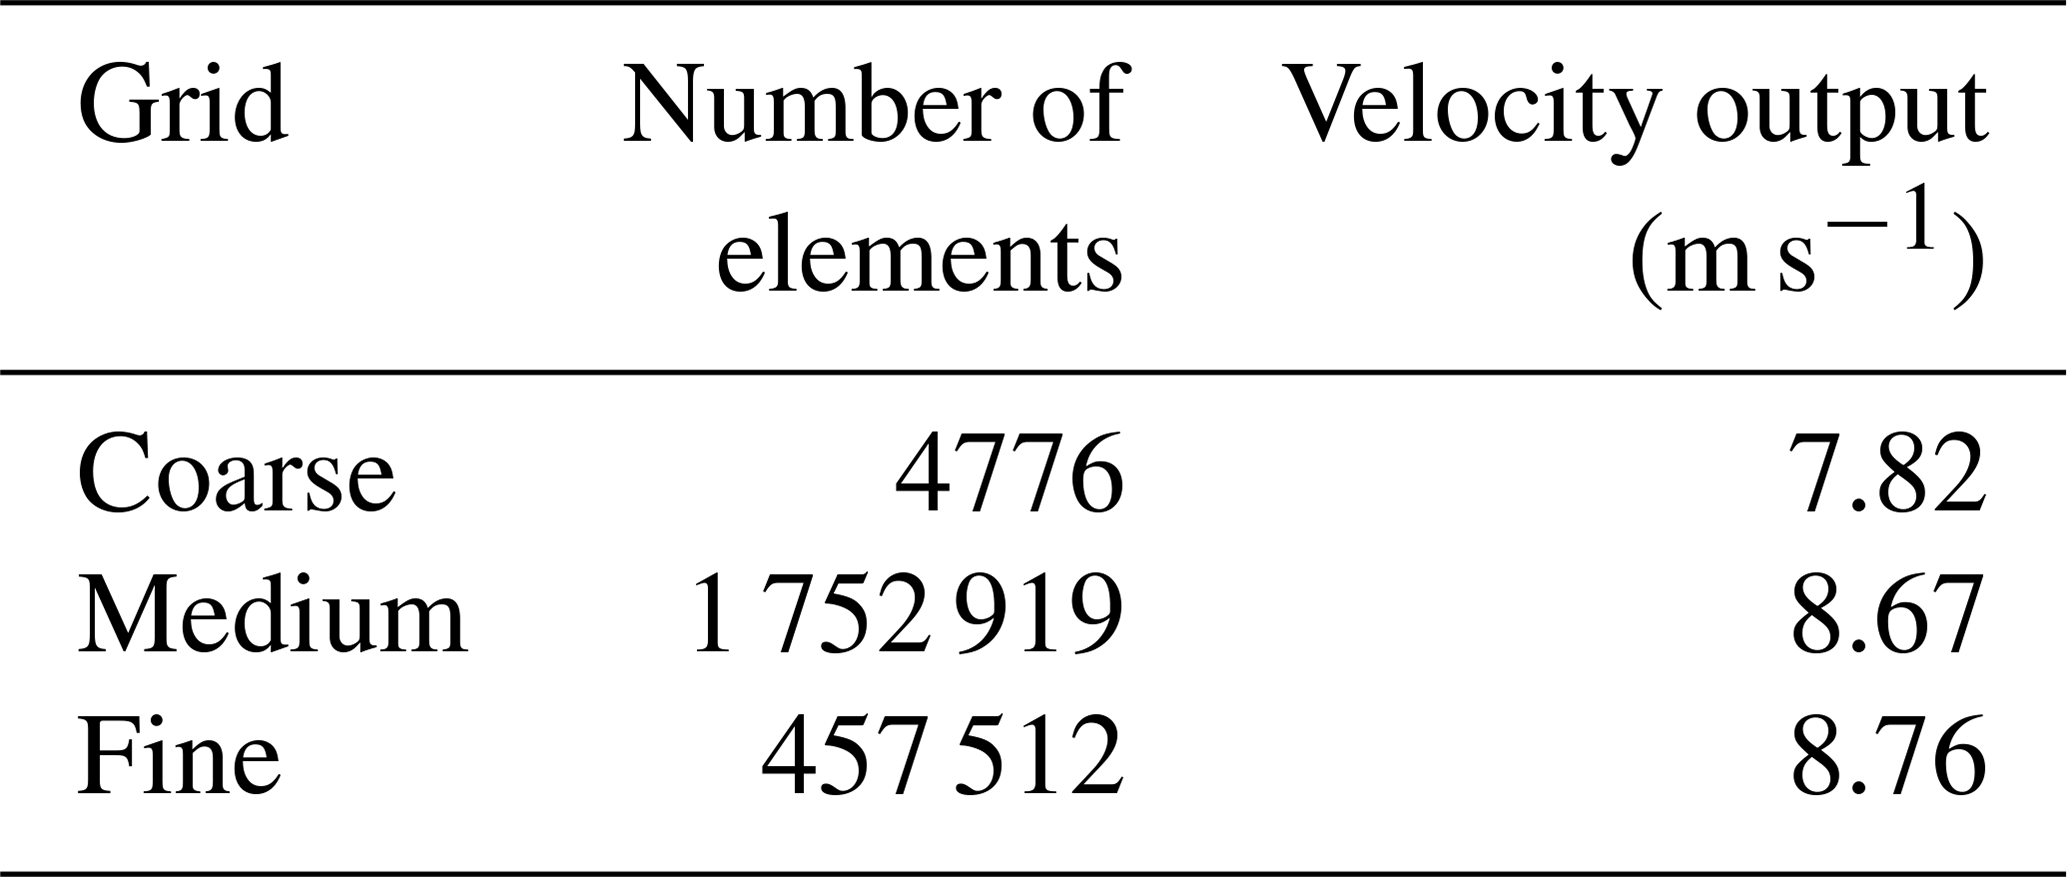
Three meshes were used with a different number of nodes and elements in order to optimize the mesh in terms of simulation time. All the meshes had NACA 4412 as the airfoil and were simulated under similar conditions with an inlet velocity of 6 m s−1.
The first mesh was coarse, with roughly 4627 nodes and 4776 elements in total, and took 2 min to converge. The coarse mesh produced an inferior result with a velocity of 7.82 m s−1 at the AD. The second mesh was a fine mesh with a total of 174 246 nodes and 175 291 elements. This mesh took about 10 min for the solution to converge and produced a better and more accurate result with a velocity of 8.67 m s−1 at the AD. The third mesh was even finer, with a total of 456 031 nodes and 457 512 mesh elements. This mesh took 22 min for the solution to converge and produced a velocity of 8.76 m s−1 at the AD. Table 1 shows the results obtained from the grid convergence study. The finest mesh differed by 0.98 % from the medium-quality mesh. Thus the medium-quality mesh with 174 246 nodes and 175 291 elements was chosen as it was accurate with an added advantage of reduced computational time and power. The simulations were performed on a multi-core workstation desktop computer.
The following sections highlight the results of all the stages pertaining to the analysis. The airfoils were tested for different geometrical modifications as well as their aerodynamic performances. The underperforming airfoils were removed from the analysis after each stage. The airfoils were evaluated at a constant diffuser thrust coefficient value CT=0.767. A flowchart containing the simulation methodology and processes for the experiment is presented in Fig. 5.

4.1 Stage 1: constant α
All the simulations for the first stage were performed with an angle of attack α=0∘ to assess the basic aerodynamic performance of the airfoils. Figure 6 expresses the variations in the camber, thickness, and diffuser velocities for the various airfoils maintained at α=0∘. The camber (mc) and thickness (t) are represented as ratios, while the velocity at the AD has been normalized with respect to the free-stream velocity of 6 m s−1. The camber ratio is defined as the maximum camber percentage to the maximum camber location on the chord expressed as a percentage. The thickness ratio is defined as the maximum thickness percentage of the airfoil to the position on the chord at which the thickness is maximum. To assess the graph, the velocity has been presented with an iso chart. The colors represent the performance of the airfoils compared to the base case. From the results of the graph, three underperforming airfoils, one from each family, were eliminated. The airfoils eliminated were the Selig S1221 with mc=0.0997, t=0.555, and a normalized velocity of 0.8863; Eppler E222 with mc=0.0379, t=0.3279, and a normalized velocity of 0.7616; and lastly NACA 63(2)-615 with mc=0.1, t=0.4, and a normalized velocity of 0.7885. Looking at Fig. 6, it is clear that camber plays a crucial role in velocity augmentation, even among high-lift airfoils, while the effect of thickness is not so pronounced. This can be attributed to the effect of curvature of the airfoil on the boundary layer. The boundary layer is subject to both a curvature and a mean pressure gradient due to the convex and concave upper and lower surface of a cambered airfoil. For the convex surface of the curvature, the angular momentum of the flow increases with an increase in curvature. As per the Rayleigh criterion (Rayleigh, 1916), the increase in angular momentum causes a stabilizing effect on the flow, resulting in lower skin friction coefficient. Thus the direct effect of camber can be seen in higher velocity augmentation at the AD, resulting in a higher CP as per the classical definition of the power coefficient. This also highlights the strong correlation between the camber and the velocity augmentation at the AD, similar to previous studies done in DAWT.
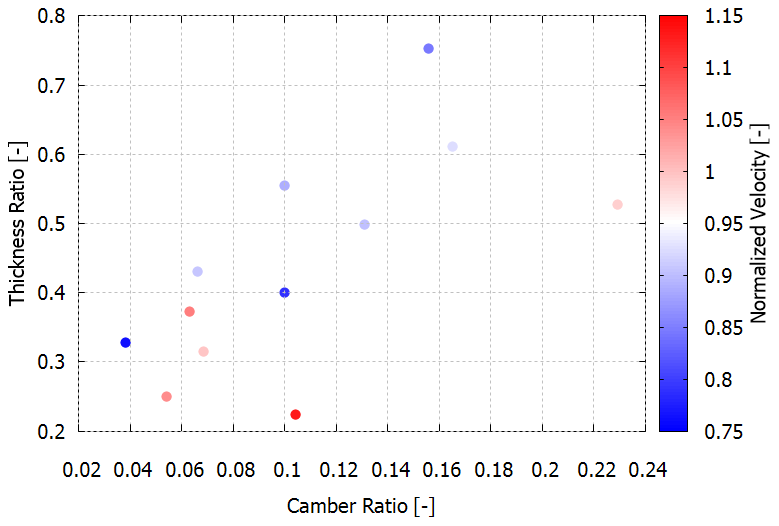
Figure 6Effect of camber and thickness of the diffuser on the normalized velocity at the actuator disk.
4.2 Stage 2: varying α to find the optimum angle for maximum velocity augmentation
For the second-stage analysis, the best-performing airfoils were taken from the results of stage 1, which were based on the velocity augmentation at the AD. The angles of attack of the airfoil were varied, wherein the area ratios associated with them also changed, while the CT was maintained at 0.767. Here the angles of attack were varied from α=0∘ to α=12∘ in steps of 4∘ and subsequently by 1∘ until α=20∘. For the initial variations of up to 12∘, the flow remained attached to the surface of the airfoil. As the angle of attack was increased, an upward trend was noted in the velocity at the AD. This is a consequence of an increase in the mass flux of the wind as a result of the changing area ratios. Beyond a certain angle of attack and area ratio, a flow separation was observed on the pressure side of the airfoil, which was found to be detrimental to the velocity augmentation of the airfoil. Thus, there was an optimum angle of attack and area ratio where there was maximum velocity augmentation. Based on the results of the simulation, the optimum angle for Eppler, NACA, and Selig was found to be α=15∘, α=14∘, and α=18∘, respectively. Based on the criteria of velocity augmentation at the AD, the study was taken forward by eliminating the NACA 64A410, S1221, and E1210 airfoils which registered the least velocity augmentation in stage 2.
4.3 Stage 3: effects of a flange
A third and final stage was conducted by adding a flange at 70 % of the airfoil chord at an open angle of 15∘, as per the study conducted by El-Zahaby et al. (2017). Figure 2 highlights the final geometry of the diffuser shape along with the various parameters that define the design geometry. It was observed that there was a significant increase in the velocity at the AD after the addition of the flanges. This velocity increase can be attributed to a region of separated flow that is generated due to the presence of the flange. The separated flow produces a region of unsteady low pressure, which increases the mass flux of wind at the AD. Figure 7 consists of the velocity contours of the final set of airfoils (a) NACA 2411, (b) NACA 4412, (c) Eppler 59, (d) Eppler 423, (e) Selig 1210, and (f) Selig 1223. The vortices are easily visualized in Fig. 7 along with the flow separation due to flange.

Figure 7Velocity contours of the streamwise normalized velocity. The results depict performance of the stage 3 airfoils at CT=0.767.
According to the classical definition of the power coefficient, the CP is affected by the velocity of the flow at the AD. The power coefficient is an important parameter that is used to determine the diffuser performance. Figure 8 is used to visualize the effect of the thickness ratio and camber ratio on the CP in a 3D space. To assess the graph, the CP has been presented with a color chart. NACA4412, S1223, and E423 are the best-performing airfoils from each of the respective families in terms of velocity augmentation and CP, with a velocity output of 9.21, 9.41, and 9.43 m s−1, respectively. Overall, Eppler 423 showed the maximum velocity augmentation and CP among all the 12 airfoil geometries that were considered.

Figure 8Effect of camber and thickness of the diffuser on the CP for the airfoils in the third stage.
For the best-performing airfoil, the thrust coefficient CT was varied, and the resulting velocity at the AD was normalized with the free-stream velocity. Figure 9 shows an almost linear relation between the parameters. Increasing the CT results in a reduction in the velocity augmentation; this phenomenon can be compared to increasing the blockage to the flow by virtue of an increase in resistance. This is in agreement with other work performed in DAWT and DAWT theories. The current simulations are performed with a moderate value of CT. The exact effects of the CT and tip clearance are out of the present scope of the study but can be the subject matter of another study.
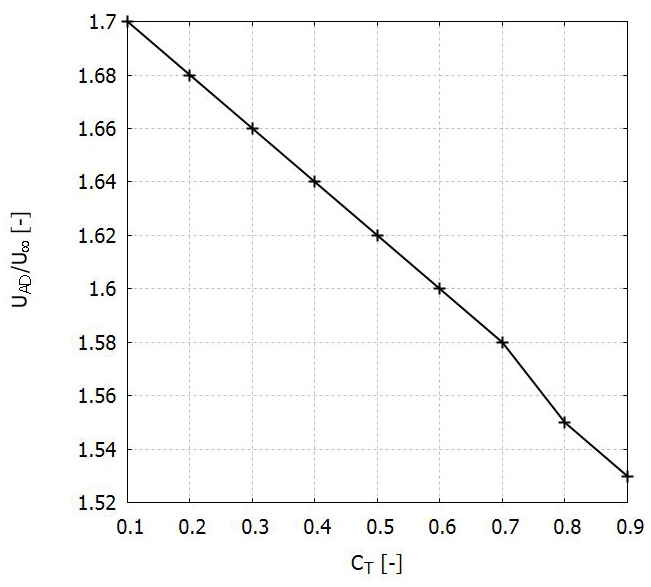
Figure 9The result depicts the effect of varying the CT on the normalized velocity at the actuator disk.
The present study uses high-lift airfoils to highlight a simplified simulation pipeline that may assist designers in assessing the suitability of a pool of airfoils while designing DAWTs or other decentralized wind energy generators. The use of high-lift airfoils in wind energy applications has been documented extensively in the literature. High-lift airfoils improve the aerodynamic efficiency (CL∕CD), i.e., lift-to-drag ratio, at low Reynolds number by virtue of a high-lift coefficient with minimum drag penalties. The diffusers, made up of the 12 high-lift airfoils, were subject to evaluation in three different stages. In the first stage, the area ratio was kept constant by maintaining the α=0∘. Based on the velocity augmentation, the best-performing airfoils were tested by varying their area ratios and their corresponding angles of attack in stage 2. An optimum angle of attack with maximum velocity augmentation was found at the end of stage 2. A final, third stage was performed by adding a flange of 15∘ to the airfoils. Based on the results of velocity augmentation and CP, it was concluded that E423 was the best-performing airfoil. The detailed effects of tip clearance and CT on the effects of diffuser performance can be a subject of a future study.
| c | Diffuser chord length (m) |
| Thrust coefficient of the duct (–) | |
| CP | Power coefficient of the AD (–) |
| Thrust coefficient of the AD (–) | |
| CT | Total thrust coefficient of the AD model (–) |
| TDuct | Thrust force on the diffuser (N) |
| T | Total thrust force of the diffuser (N) |
| SAD | Reference area of the AD (m2) |
| TAD | Thrust force on the AD (N) |
| UAD | Velocity at the AD plane (m s−1) |
| U∞ | Free-stream velocity (m s−1) |
| UAVG | Average velocity at the AD plane (m s−1) |
| x | Variable-value vector parallel to the free-stream direction (–) |
| y | Variable-value vector normal to the free-stream direction (–) |
| α | Angle of attack of the airfoil (∘) |
| ρ | Density of air (kg m−3) |
| AD | Actuator disk |
| DAWT | Diffuser-augmented wind turbine |
| HAWT | Horizontal-axis wind turbine |
| mc | Camber ratio (–) |
| t | Thickness ratio (–) |
| SE | Area of the exit of the diffuser (m2) |
Unfortunately only the data for phase 2 of the simulations are available. The final stages of the simulations were done on personal computers. The initial stages of simulations were done on the university computers as there were a lot of simulations that had to be carried out. To reduce the time taken to complete the research, multiple computers of the aeronautical department labs were used. As the university is at a far location and due to the labs currently being shut due to Covid, the data from the simulations cannot be retrieved. We have uploaded the data which is present with us at the moment: https://drive.google.com/drive/folders/1VMdbV8mzzd3patj6zzhbbhpI2Favz5A2?usp=sharing (last access: 30 October 2019).
ADP wrote the bulk of the paper, performed the CFD simulations, and post-processed the results. ASB performed CFD simulations and contributed to writing and reviewing the paper. STP modeled the geometries and contributed significantly in writing the paper. RP modeled the geometries. RN performed CFD simulations and helped set up the CFD simulations. JR helped formulate ideas through group discussions.
The authors declare that they have no conflict of interest.
This article is part of the special issue “Wind Energy Science Conference 2019”. It is a result of the Wind Energy Science Conference 2019, Cork, Ireland, 17–20 June 2019.
This paper was edited by Jens Nørkær Sørensen and reviewed by Peter Jamieson, Gerard J. W. van Bussel, and one anonymous referee.
Alquraishi, B. A., Asmuin, N. Z., Mohd, S., Abd Al-Wahid, W. A., and Mohammed, A. N.: Review on Diffuser Augmented Wind Turbine (DAWT), International Journal of Integrated Engineering, 11, 178–206, https://doi.org/10.30880/ijie.2019.11.01.021, 2019. a
Dighe, V., De Oliveira, G., Avallone, F., and Van Bussel, G.: Towards improving the aerodynamic performance of a ducted wind turbine: A numerical study, J. Phys. Conf. Ser., 1037, 022016, https://doi.org/10.1088/1742-6596/1037/2/022016, 2018a. a, b
Dighe, V. V., de Oliveira, G., Avallone, F., and Van Bussel, G.: On the effects of the shape of the duct for ducted wind turbines, in: 2018 Wind energy symposium, 8–12 January 2018, Kissimmee, Florida, USA, p. 0997, 2018b. a, b
Dighe, V., Suri, D., Avallone, F., and van Bussel, G.: Ducted wind turbines in yawed flow: A numerical study, Wind Energ. Sci. Discuss., https://doi.org/10.5194/wes-2019-62, in review, 2019. a
El-Zahaby, A. M., Kabeel, A., Elsayed, S., and Obiaa, M.: CFD analysis of flow fields for shrouded wind turbine’s diffuser model with different flange angles, Alexandria Engineering Journal, 56, 171–179, 2017. a
Gielen, D., Boshell, F., Saygin, D., Bazilian, M. D., Wagner, N., and Gorini, R.: The role of renewable energy in the global energy transformation, Energy Strateg. Rev., 24, 38–50, 2019. a
Igra, O.: Research and development for shrouded wind turbines, Energ. Conver. Manage., 21, 13–48, 1981. a, b, c
Lilley, G. and Rainbird, W.: A preliminary report on the design and performance of ducted windmills, Report No. 102, College of Aeronautics, Cranfield, UK, 1956. a
Menter, F. R.: Two-equation eddy-viscosity turbulence models for engineering applications, AIAA J., 32, 1598–1605, 1994. a
Ohya, Y., Karasudani, T., Sakurai, A., Abe, K.-I., and Inoue, M.: Development of a shrouded wind turbine with a flanged diffuser, J. Wind Eng. Ind. Aerod., 96, 524–539, 2008. a
Pedersen, E. and Persson Waye, K.: Perception and annoyance due to wind turbine noise – a dose–response relationship, J. Acoust. Soc. Am., 116, 3460–3470, 2004. a
Rayleigh, L.: LIX. On convection currents in a horizontal layer of fluid, when the higher temperature is on the under side, The London, Edinburgh, and Dublin Philosophical Magazine and Journal of Science, 32, 529–546, 1916. a
Tang, J., Avallone, F., Bontempo, R., van Bussel, G., and Manna, M.: Experimental investigation on the effect of the duct geometrical parameters on the performance of a ducted wind turbine, J. Phys. Conf. Ser., 1037, 022034, https://doi.org/10.1088/1742-6596/1037/2/022034, 2018. a