the Creative Commons Attribution 4.0 License.
the Creative Commons Attribution 4.0 License.
 | 08 Jun 2021
Response of the International Energy Agency (IEA) Wind 15 MW WindCrete and Activefloat floating wind turbines to wind and second-order waves
Mohammad Youssef Mahfouz
Climent Molins
Pau Trubat
Sergio Hernández
Fernando Vigara
Antonio Pegalajar-Jurado
Henrik Bredmose
Mohammad Salari
The EU Horizon 2020 project COREWIND (COst REduction and increase performance of floating WIND technology) has developed two floating platforms for the new International Energy Agency (IEA) Wind 15 MW reference wind turbine. One design – “WindCrete” – is a spar floater, and the other – “Activefloat” – is a semi-submersible floater; both designs are made of concrete. In this work the design of the floaters is introduced with their aero–hydro–servo-elastic numerical models, and the responses of both floaters in both static and dynamic simulations are investigated. The static displacements and natural frequencies are simulated and discussed. Additionally, the effects of the mean wave drift forces and second-order difference-frequency wave forces on the systems' responses are presented. The increase in the turbine's power capacity to 15 MW in IEA Wind model leads to an increase in inertial forces and aerodynamic thrust force when compared to similar floating platforms coupled to the Technical University of Denmark (DTU) 10 MW reference model. The goal of this work is to investigate the floaters' responses for different load cases. The results in this paper suggest that at mild wave loads the motion responses of the 15 MW floating offshore wind turbines (FOWTs) are dominated by low-frequency forces. Therefore, motions are dominated by the wind forces and second-order wave forces rather than the first-order wave forces. After assessing and understanding the models' responses, the two 15 MW FOWT numerical reference models are publicly available to be used in the research and development of floating wind energy.
- Article
(4705 KB) - Full-text XML
- BibTeX
- EndNote


Floating offshore wind turbines (FOWTs) will play a key role in the transition towards renewable and sustainable energy systems. In Europe, 80 % of the offshore wind energy resources lies in deep-water regions (Hundleby and Freeman, 2017). The economical feasibility of offshore wind energy is increased by the present development of wind turbines in the 15 MW class. There is thus a need for reference floaters for turbines of this size that can be used for academic research and innovation in the field of FOWTs. Specifically, there is a need for aero–servo–hydro-elastic models of the coupled floater and wind turbine.
COREWIND (COst REduction and increase performance of floating WIND technology) is a Horizon 2020 project aiming to decrease the levelized cost of energy (LCOE) of FOWTs by 15 % compared to the current bottom fixed offshore wind state of the art, through the optimization of the mooring lines and the power cable. Two FOWT conceptual designs are used to validate the innovations presented in COREWIND for mooring and cable design and optimization. Moreover, wave tank tests as well as wind tunnel tests will be used to validate the models introduced throughout the project period of 42 months. The project includes 13 participants from both industry and academics fields.
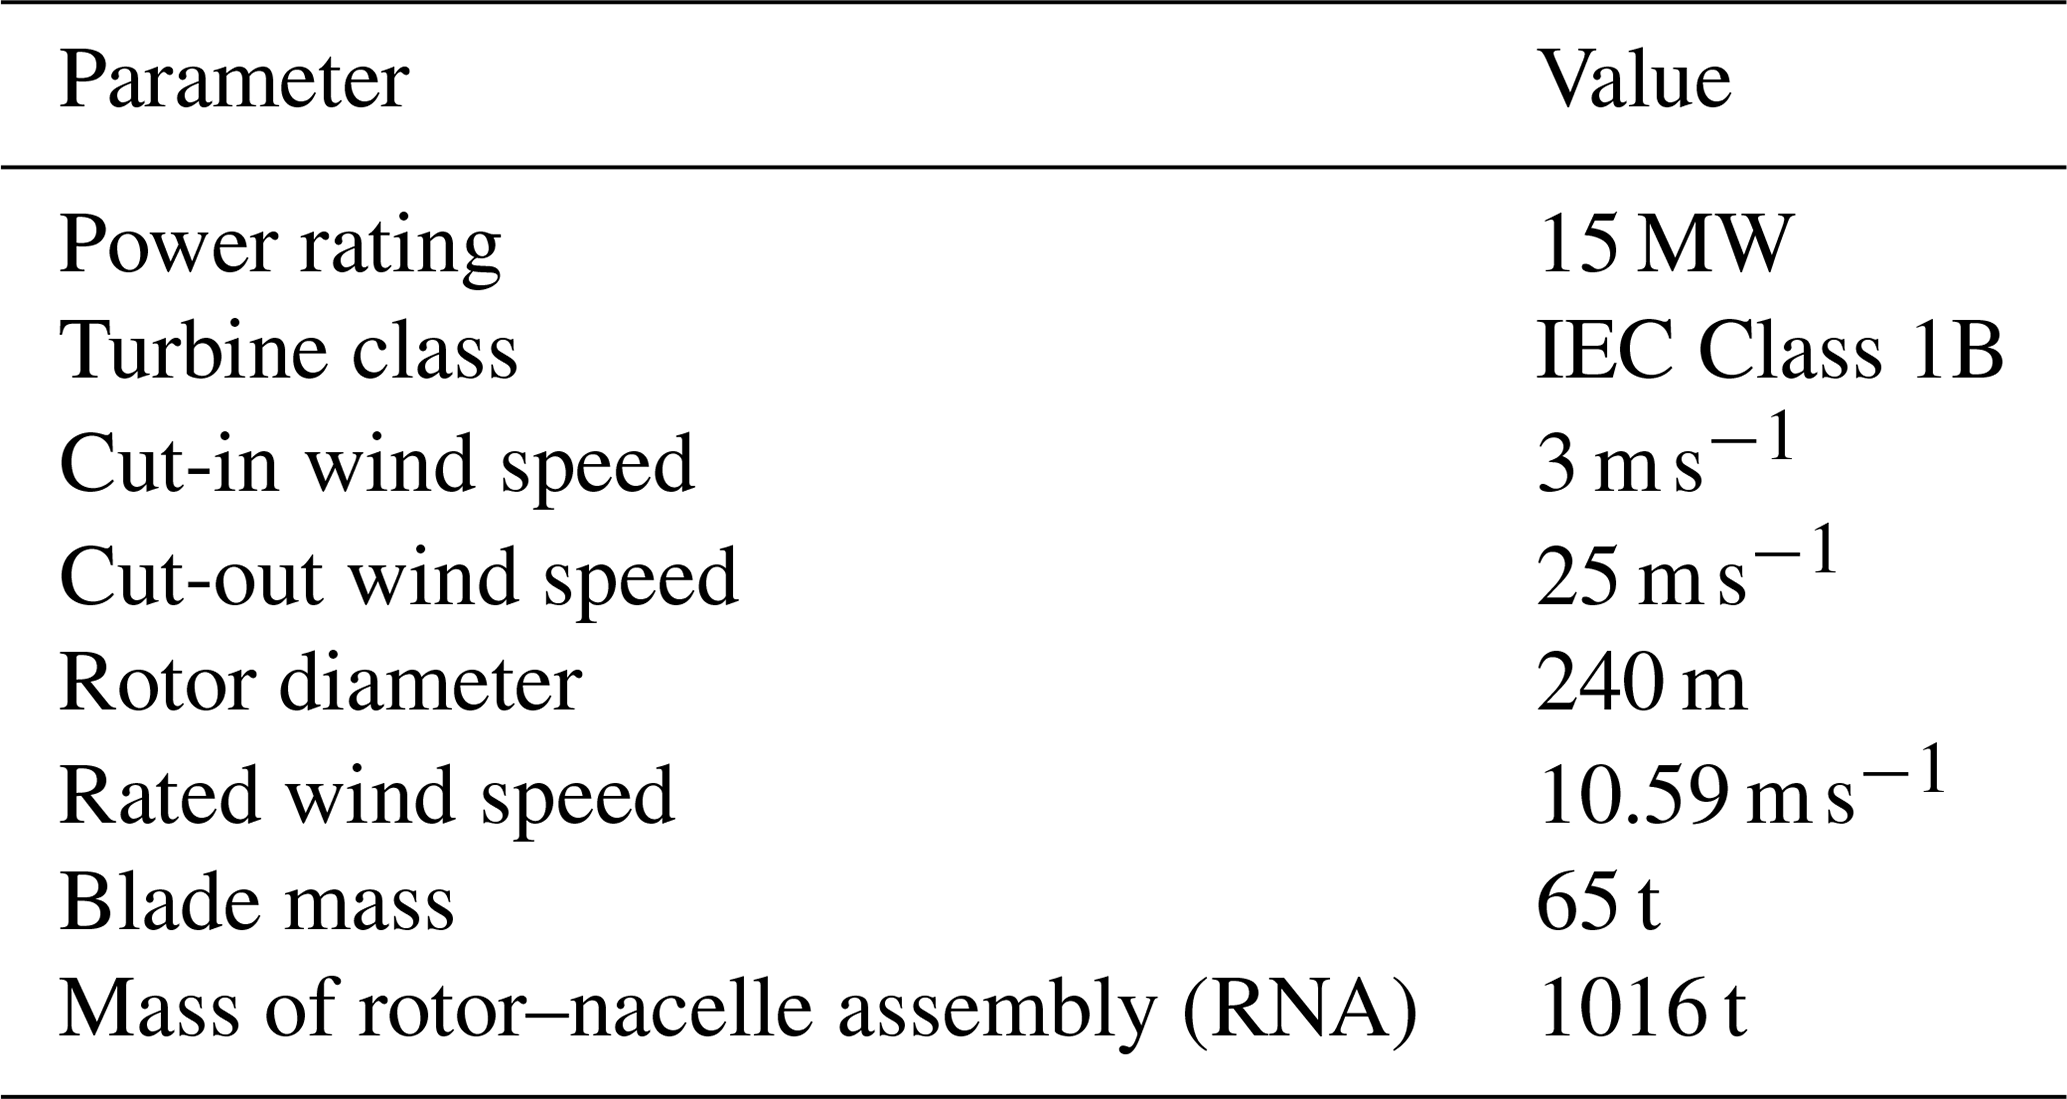
COREWIND is designing two conceptual floaters for the International Energy Agency (IEA) Wind 15 MW reference turbine model (Gaertner et al., 2020); “WindCrete” is a spar concept floater with a concrete tower, while “Activefloat” is a semi-submersible floater and a steel tower. They were developed in parallel with the reference steel semi-submersible floater by the University of Maine (Allen et al., 2020) and thus supplement this reference floater. OpenFAST v2.1 (NREL, 2019) is used to model the 15 MW FOWT concepts. The main parameters of the 15 MW IEA Wind reference model are shown in Table 1. The tower design and the hub height are adapted for each floater separately; therefore they are left out of Table 1. The NREL Reference Open Source Controller (ROSCO) is used for the 15 MW IEA Wind reference model (NREL, 2020). ROSCO is a baseline bladed style controller interface to be used for research purposes. This controller is tuned in order to be adapted to FOWTs.
The main goals of this work are to present the floaters to the research community and to analyse and assess the floaters' performance at different load cases with an emphasis on the second-order wave force effects. The increase in the power capacity of the turbines to 15 MW means an increase in the mass and inertia of both the turbine and the floater. For the turbine's rotor–nacelle assembly (RNA), the 15 MW RNA has a 50 % increase in mass when compared to the Danish Technical University (DTU) 10 MW RNA. For the floaters, the WindCrete concrete floater has a 170 % increase in mass compared to the 10 MW steel spar floater introduced in Hegseth and Bachynski (2019). Moreover, for the IEA Wind 15 MW model the rated thrust is increased by 87 % compared to the DTU 10 MW reference model. The effects of the increase in aerodynamic thrust force and the increase in mass and inertia of the FOWT on the floater's response are shown in this paper.
A short introduction to the controller, hydrodynamics, and mooring numerical models in OpenFAST is given in Sect. 2. In Sects. 3 and 4, the design parameters of both FOWT designs are presented, with an emphasis on the changes done in the OpenFAST model to transform the 15 MW fixed-bottom offshore model (Gaertner et al., 2020) into an FOWT model. The floaters are designed to fulfil the design limits presented in Vigara et al. (2020). Load cases used to assess the models' implementation in OpenFAST and to show the effects of wind and second-order wave forces on the system's response are introduced in Sect. 5. Afterwards, the responses of both models are presented in Sect. 6 along with the natural frequencies and the static equilibrium of the floaters. Additionally, the tuned controller's performance is initially checked using step wind tests, in the absence of waves. Moreover, the effect of the increase in the FOWT mass and inertia can be clearly seen in regular-wave simulations in the absence of wind. Second-order wave effects are shown using irregular-wave simulations. Finally, the dynamic system's response to turbulent wind and irregular waves is shown along with the system's response to an extreme 50 years of wind and waves. The assessment procedure focuses on the platforms' responses to different excitation forces, analysing which forces dominate the platforms' motions in different degrees of freedom (DOFs).
OpenFAST is an aero–hydro–servo-elastic tool, developed by NREL to model offshore (fixed bottom and floating) as well as onshore wind turbines (Jonkman, 2007). The tool uses a combination of modal and multibody dynamics formulation. OpenFAST models the blades and the tower as elastic beams, while the platform is modelled as a rigid body. The coordinate system used throughout this paper is identical to the reference coordinate system defined in OpenFAST. The right-handed coordinate system has a positive x axis pointing downwind, while the positive z axis is pointing upwards and the global reference frame origin is at the mean sea level. The aerodynamic forces are modelled using blade element momentum (BEM) theory with AeroDyn. The hydrodynamic forces are calculated using both potential flow theory and strip theory with HydroDyn (Jonkman et al., 2015). Mooring lines forces are calculated through MoorDyn (Hall, 2017). The forces from the AeroDyn, HydroDyn, and MoorDyn modules are coupled to the ElastoDyn module of OpenFAST where the equations of motions of the coupled system are solved.
2.1 Controller design
The ROSCO controller is adopted and re-tuned for the two floaters. Below rated wind speed, the ROSCO controller includes a proportional integral (PI) controller for generator torque control. The below-rated PI controller adjusts the generator torque to follow the optimal tip : speed ratio for harvesting the maximum electrical power. In our models, this controller is used with minor re-tuning. For above-rated wind speeds the ROSCO controller uses a PI collective pitch controller to regulate the generator speed at its rated value while the generator torque is kept constant at rated value (Mulders and Van Wingerden, 2018). Major tuning is done to the above-rated wind speed controller due to the unfavourable couplings between tower motion and blade pitch controller. This coupling arises when the wind turbine is installed on a floating platform. This is mainly because the lowest natural frequencies in FOWT, which are for surge and pitch motions of the platform, are much smaller than those of fixed-bottom platforms, which are usually for tower fore–aft and lateral bending. These low natural frequencies put some limitations on the bandwidth of the pitch controller. For example in Larsen and Hanson (2007), it has been shown that applying a controller, which has been tuned for a wind turbine installed onshore, on the same turbine installed on a floating platform can lead to instability. A straightforward approach to deal with this challenge is to de-tune the controller to not let the undesired coupling between tower motion and pitch controller lead to instability; this approach is followed here too.
The PI collective pitch controller for above-rated wind speed has been designed using the Ziegler–Nichols approach (Ziegler et al., 1942). For a specific above-rated wind speed, the PI gains are calculated, and the proportion between original ROSCO PI parameters and the calculated ones through Ziegler–Nichols for this specific wind speed are then used to scale the controller parameters for all above-rated wind speeds. This re-tuning of the controller has been carried out for the WindCrete FOWT and has been successfully applied to the Activefloat case without the need to update the parameters. The tuning process is described in more detail in Mahfouz et al. (2020b). Step wind simulations are carried out to ensure the controller performs as expected, and they can be seen later in Fig. 5.
2.2 Modelling of hydrodynamics
Hydrodynamic forces are modelled in HydroDyn using potential flow theory and strip theory. The potential flow theory forces act on the rigid floater at mean sea level. The potential flow solver ANSYS-AQWA (ANSYS, 2015) is used to solve the linear and second-order potential flow theory and provide the added mass A(ω) and the radiation damping B(ω), which are functions of the wave frequency (ω). First-order wave forces X(ω) and second-order difference-frequency wave forces are calculated using the potential flow solver and are functions of wave direction as well as wave frequency. Frequencies between 0.016 and 0.385 Hz, with a step of 0.003 Hz, are considered while solving the potential flow model. The frequency domain representation of the hydrodynamic loading is shown in Eq. (1), where C is the hydrostatic stiffness, x is the vector of the six DOFs of the platform, and F is the first- and second-order wave forces acting on the platform. OpenFAST uses the Cummins equation (Cummins, 1962) to couple the frequency-dependent hydrodynamic properties to the time–domain solution (Jonkman, 2009).
The second-order wave loads are proportional to the square of the wave amplitude, and they have frequencies of the sum and difference frequencies of the linear wave spectrum. Although second-order forces have lower amplitudes than the first-order ones, they can excite the natural frequencies of the floater, especially the lower ones such as the surge natural frequencies. This can lead to higher fatigue loads in the FOWT system (Duarte et al., 2014). The summation of the diagonal components of the quadratic transfer function (QTF) represents the mean drift force acting on the platform. Throughout this paper, the second-order forces are applied to the floaters using the difference QTF. While the sum QTF may be able to excite the first coupled tower frequency, this is expectedly by a small amplitude, since wave-driven excitation of the tower will have to happen through motion-excitation of the floater, which is modelled as a rigid structure. This is supported by the findings of Gueydon et al. (2014).
2.3 Modelling mooring lines
MoorDyn is used to model the mooring lines in OpenFAST (Hall, 2017). MoorDyn is a dynamic lumped mass model. The position and the velocity of the platform are provided to MoorDyn at every coupling time step. MoorDyn calculates the overall forces acting on the platform in the six DOFs and provides a force vector back to OpenFAST. In both models, catenary mooring systems are used for station keeping. The mooring designs, presented in Sects. 3.3 and 4.3, are preliminary designs and are not verified against ultimate limit state (ULS), accidental limit state (ALS), and fatigue limit state (FLS). Optimized mooring designs for the floaters will be created later on during the COREWIND project.
The WindCrete (Campos et al., 2016) concept by Universitat Politècnica de Catalunya (UPC) is a monolithic spar design, with a draft of 155 m. The wind turbine tower and the spar are one member made of concrete with no connecting joints between them. This increases the durability of WindCrete by removing weak points in the structure. A ballast is added at the bottom of the floater (coloured area in Fig. 1) to increase the hydrostatic stiffness in the pitch direction. The submerged spar section is made of three parts:
-
a semi-sphere at the bottom to distribute the hydrostatic pressure over its surface; however, this comes with the drawback of reducing the heave axial damping, but this does not represent a significant problem because spar platforms have low wave excitation forces in the heave degree of freedom (DOF) due to their deep draft;
-
a straight cylinder which provides the buoyancy required as well as carrying the ballast mass;
-
a truncated cone section, which connects the tower to the floater.
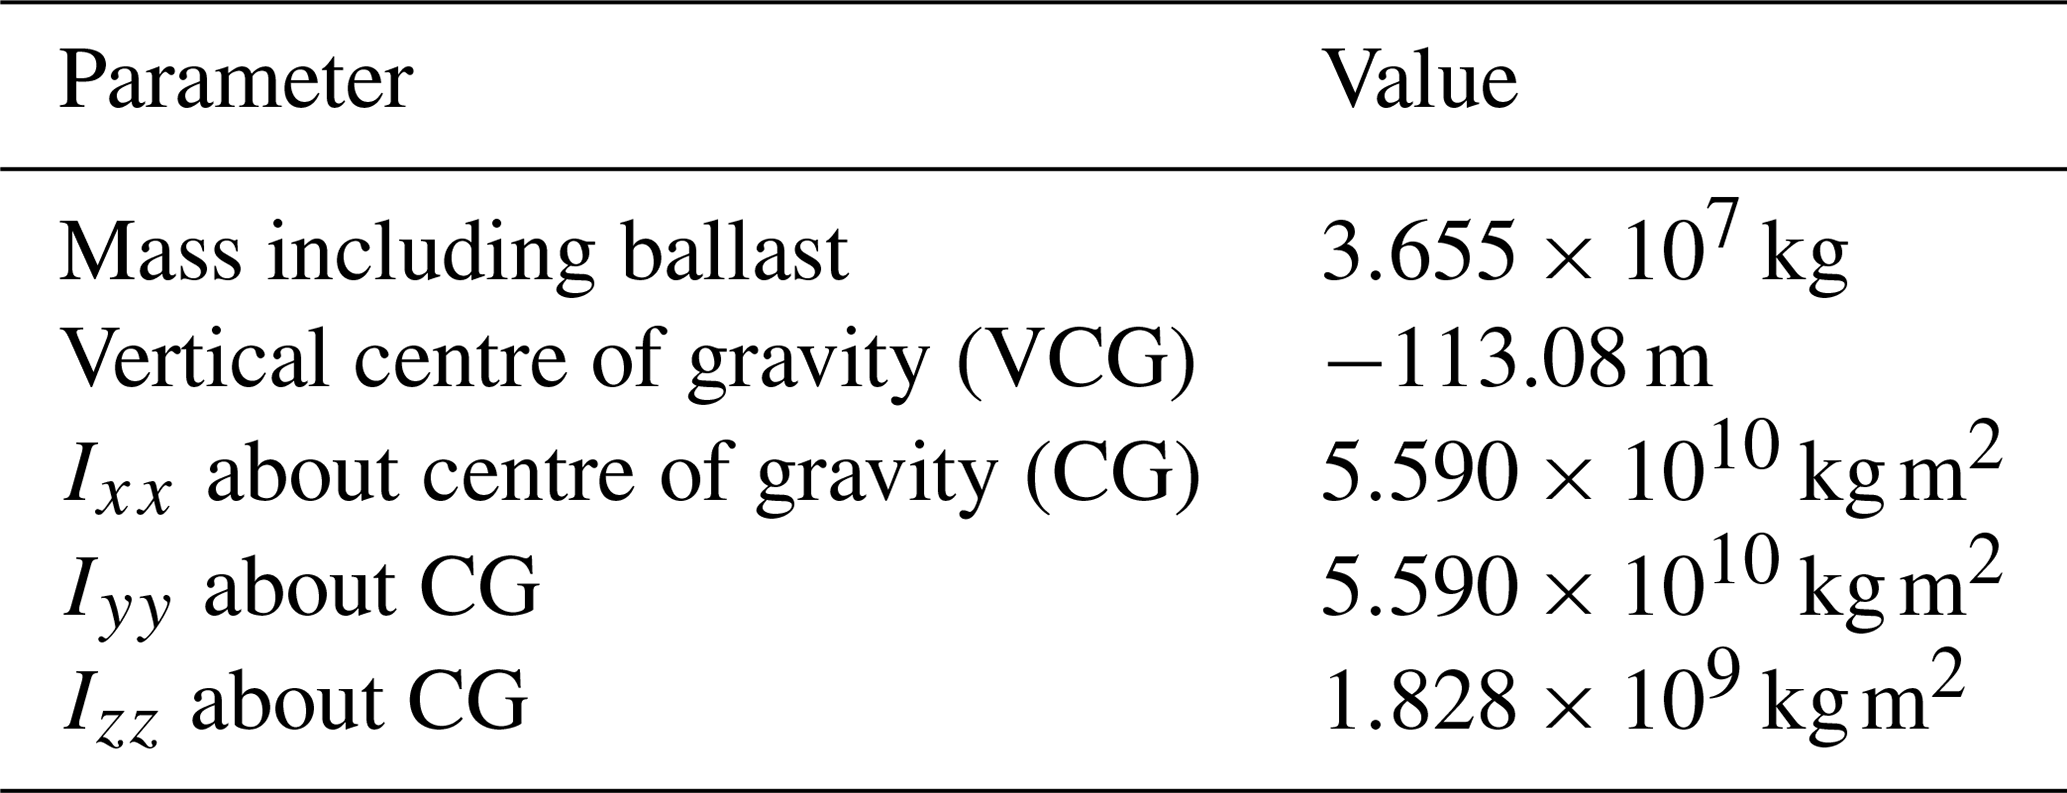
The tower is conically shaped, with a base diameter larger than the fixed-bottom offshore reference model, to withstand the higher tower base moments produced by the tower top masses due to the pitch and roll motions of the floater. The hub height of the model is 135 m above mean sea level, which is 15 m lower than the IEA Wind reference wind turbine. The lower hub height decreases the arm of the moment generated from the aerodynamic thrust force acting on the rotor. Therefore, the required counteracting moment needed to achieve the design limits of the platform's pitch angle decreases. The decrease in the required counteracting moment means a decrease in either the draft of the platform or the mass of the ballast. The mass and inertia parameters of the submerged substructure including the ballast are shown in Table 2.

3.1 Hydrostatics of WindCrete 15 MW
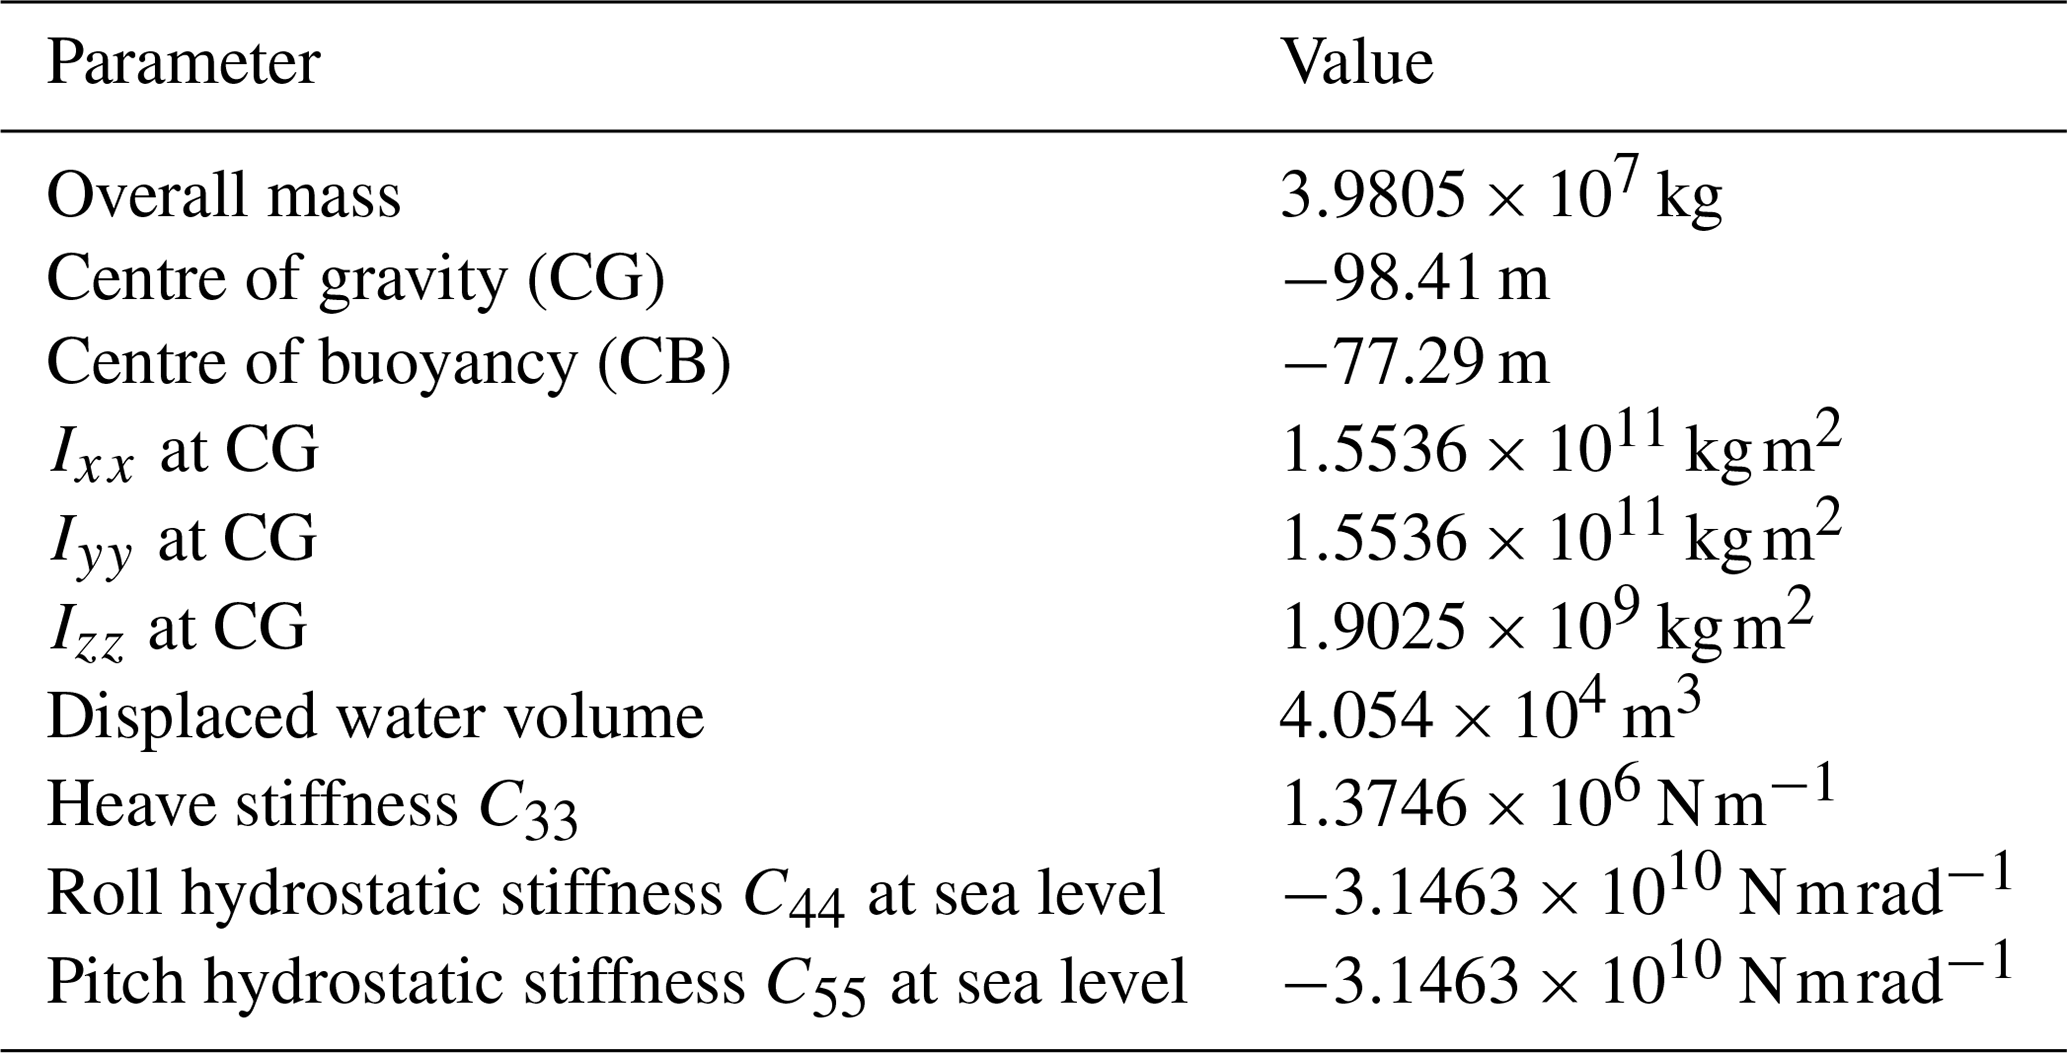
WindCrete was designed following the approach presented in Matha et al. (2015), such that the static mean pitch angle at rated thrust is equal to 3.2∘ and that the tower base can withstand the fatigue and ultimate loads due to the pitch and roll motions. The hydrostatic parameters of the overall system (WindCrete + RNA) can be found in Table 3. The roll and pitch hydrostatic stiffnesses in Table 3 are purely hydrostatic, and they become positive when the contribution of the centre of gravity is added.
3.2 Hydrodynamics of WindCrete 15 MW
The detailed potential flow solution for the added mass, radiation damping, and first- and second-order wave excitation forces of WindCrete is presented in Mahfouz et al. (2020b). In order to include viscous effects to the model, the strip theory in HydroDyn applies the Morison equation to the elements defined in the model. In the WindCrete model, two drag coefficients are defined for the transverse and the axial direction. The transverse drag is equal all over the submerged section of WindCrete with a value of 0.7 (Campos et al., 2015). The axial drag is applied to the hemisphere geometry at the bottom of WindCrete. The axial drag coefficient is equal to 0.2 following Hoerner (1965). The effects of marine growth are not considered in this work.
3.3 Mooring lines
Three catenary delta-shaped mooring lines are used for station keeping of the WindCrete floater. The mooring lines provide stiffness for surge, sway, and yaw DOFs. The yaw stiffness is a critical parameter for spar floaters and needs to be big enough to ensure that the yaw natural frequency is much smaller than the roll natural frequency in order to avoid aerodynamic yaw–roll coupling (Haslum et al., 2020).
Table 4WindCrete mooring system's fairlead and anchor positions.

The mooring line system consists of three symmetric catenary mooring lines. Each line is composed of a single chain with a length of 565 m, connected to a delta-shaped connection with a length of 50 m. The three mooring lines are made of one type chain with a diameter of 160 mm, dry weight of 561.25 kg m−1, and axial stiffness of 2.304×10⁹ N. The geometry of the lines is presented in Table 4.
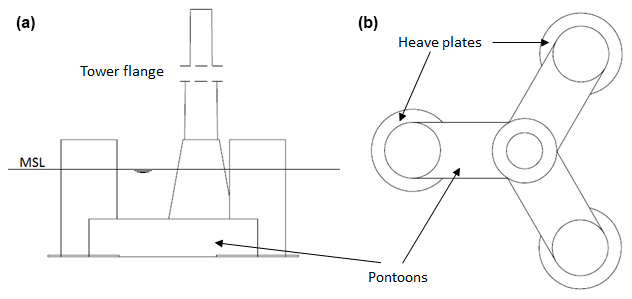
The Activefloat design developed for this paper by Esteyco is a semi-submersible floater concept made of concrete. The structure of the floater consists of three external columns, a central column, and three pontoons connecting the external columns to the central one. The tower is a steel structure connected to the floater at the central column. The draft of the platform is 26.5 m. An active ballast system keeps the static mean pitch at 0∘ for all operational wind speeds. The main parameters of the floater, shown in Fig. 2, can be described as follows:
-
Three external columns form an equilateral triangle. These columns provide the pitch and roll stability for the platform. At the bottom of each column lies a heave plate to damp the heave motion of the platform. The external columns are hollow and partially filled with water; the water level in each column is controlled by the active ballast system.
-
The central column has a conical shape, and the tower is connected to the platform through the central column. The central column is left totally dry to contain the machinery required, for example for the active ballast system.
-
The pontoons connect the three external columns to the central one, and they are fully filled with water all the time.
The tower is a conical shape steel tower, similar to WindCrete, the hub height is at 135 m above sea level.
4.1 Hydrostatics of Activefloat 15 MW
The mass and inertia properties of the Activefloat floater without the tower and the RNA are shown in Table 5. In the OpenFAST model, 100 t are added to the platform mass to account for all the machinery included inside the tower. The 100 t of extra mass are assumed to be at the tower's centre of gravity (CG); the total mass of the platform and its CG are adjusted accordingly.The active ballast is controlled by a pump arrangement exchanging water between the external columns according to the mean thrust force acting on the wind turbine's rotor. The ballast mass is equally divided between the three external columns whenever the active ballast is deactivated. In this work the active ballast is deactivated during idling or parked conditions. The active ballast system's schedule for the normal turbulence model (NTM) and the extreme turbulence wind model (ETM) is presented in Table 6. When the active ballast system is active, the CG of the Activefloat floater in the numerical model is changed according to the wind speed of the load case before the simulation starts.
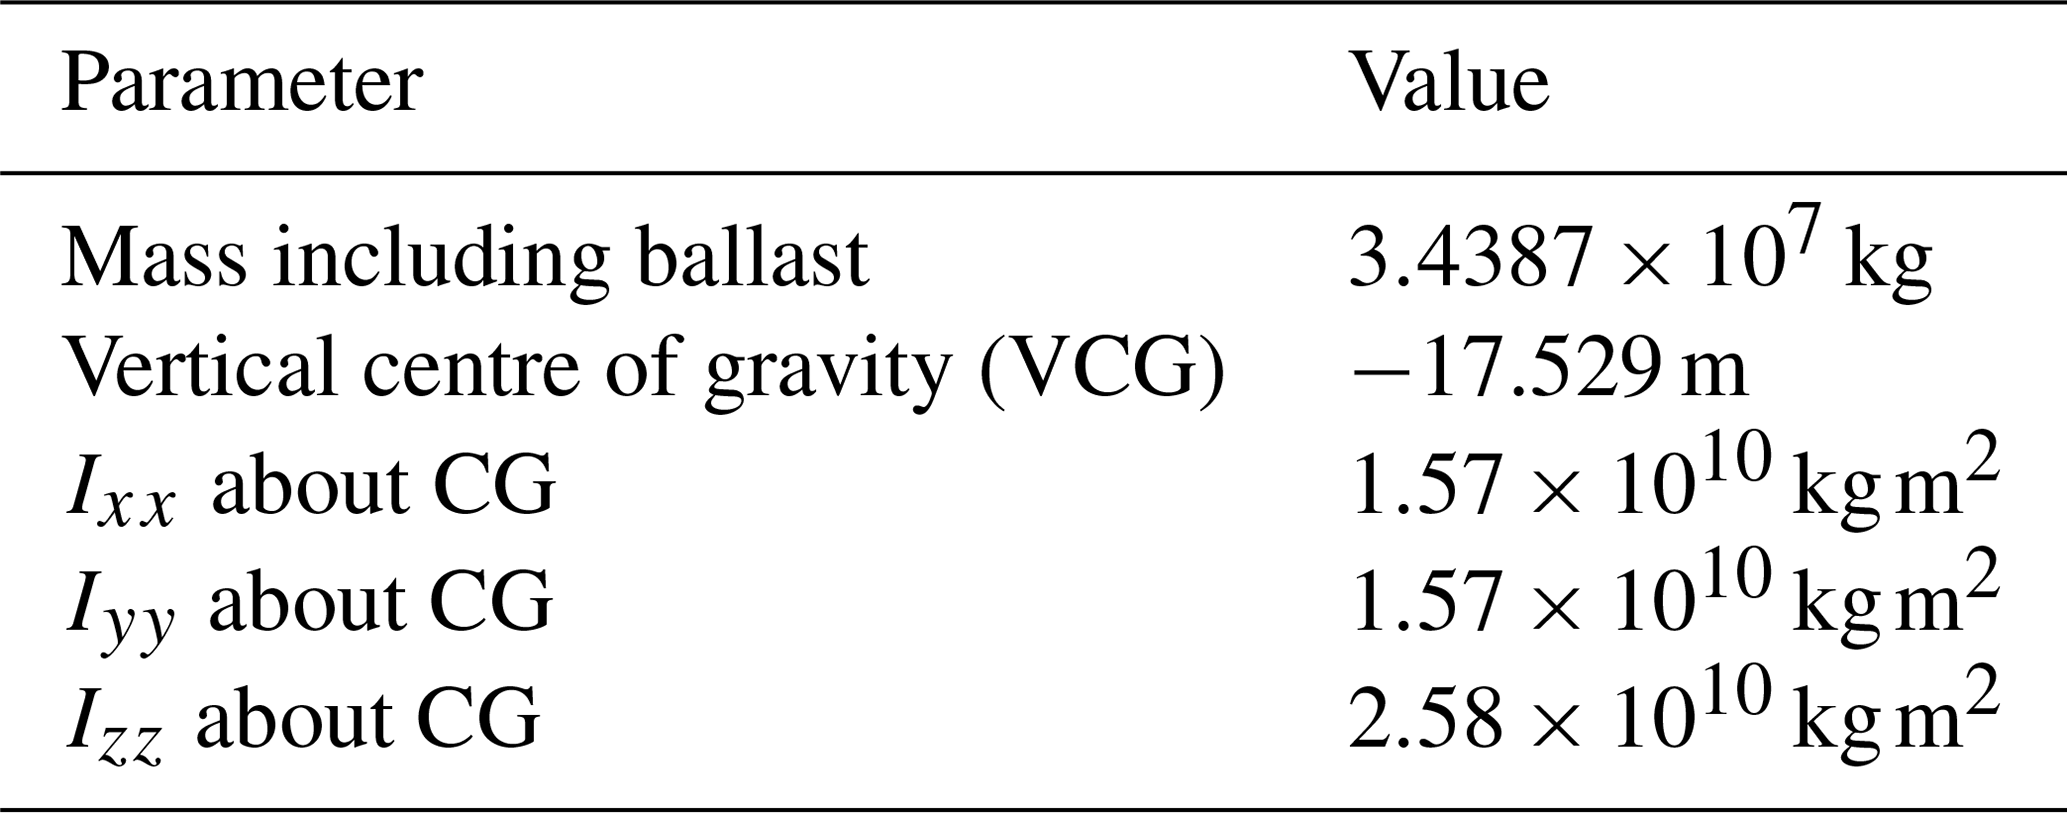

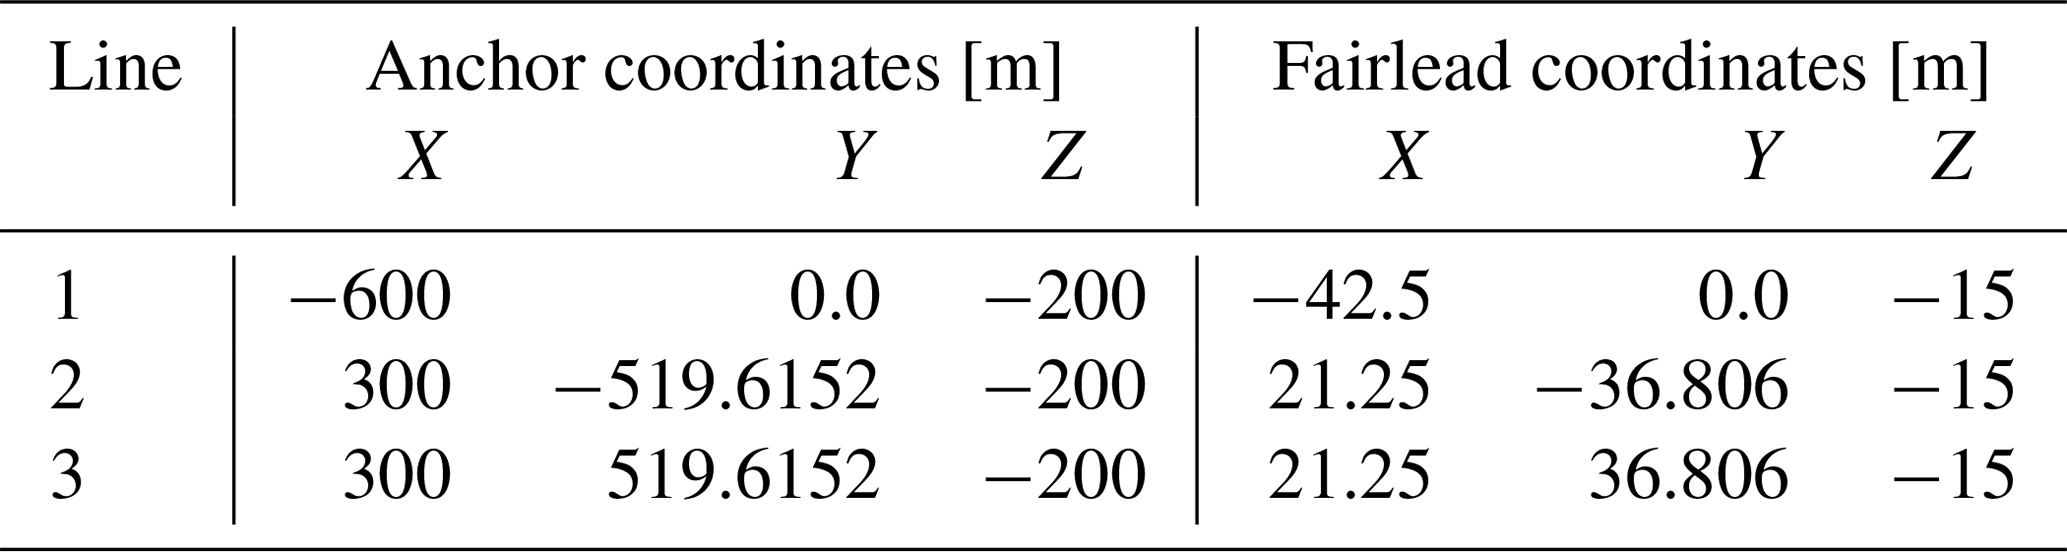
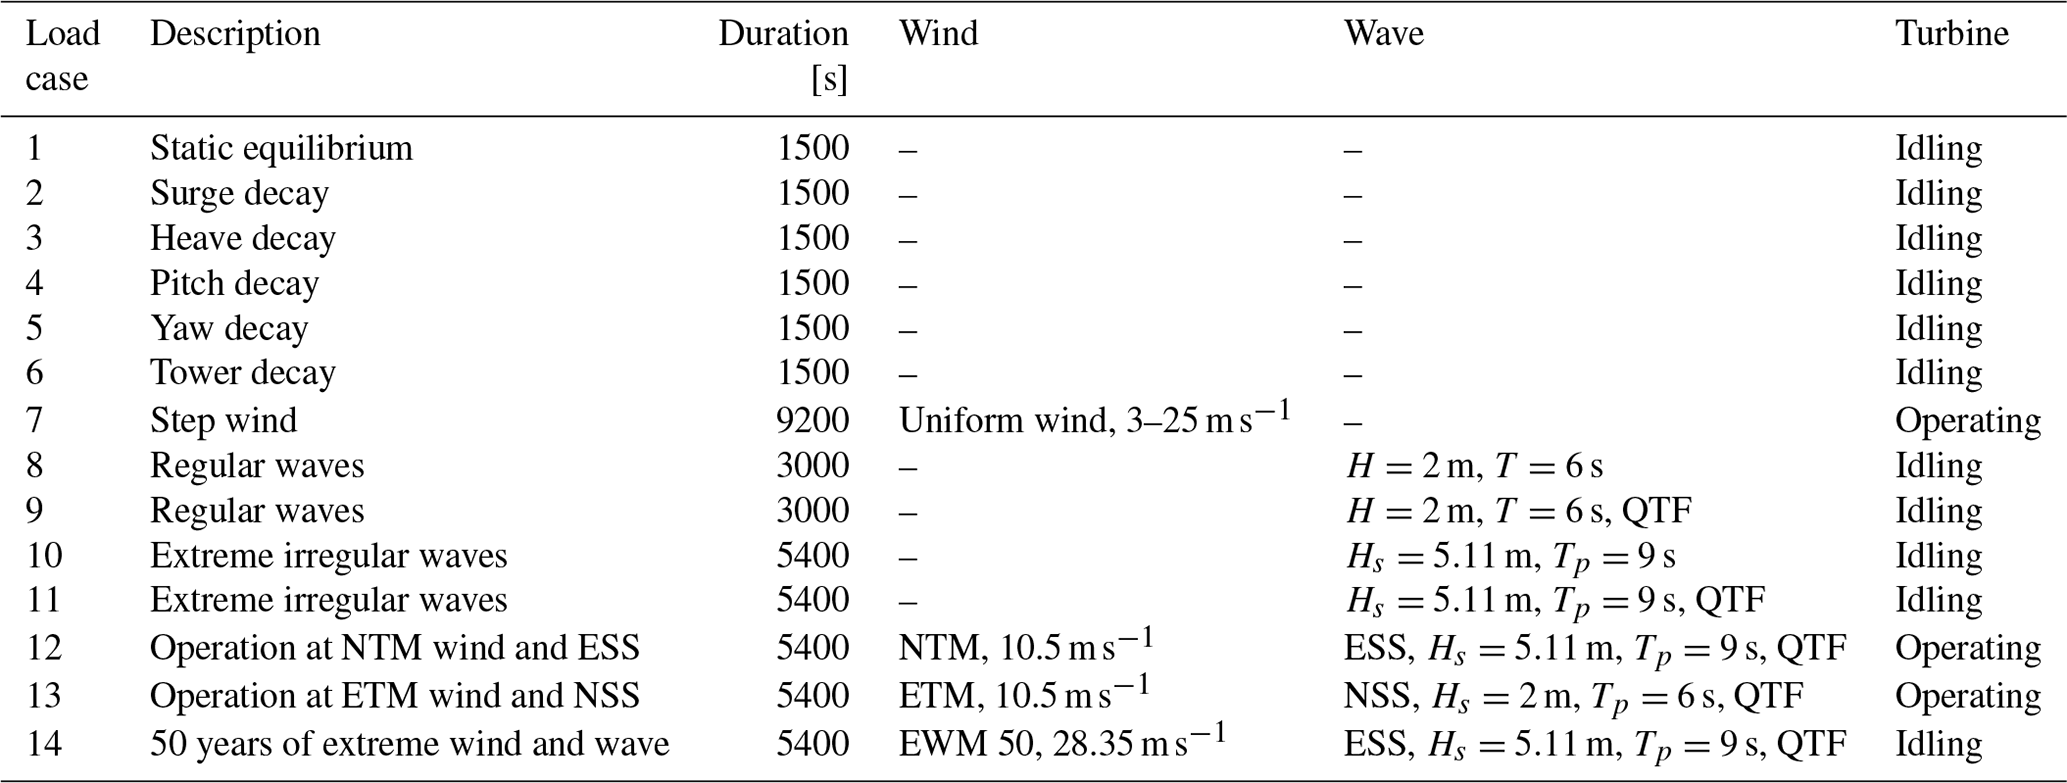
Table 8Load cases used in OpenFAST for the assessment of the models.
4.2 Hydrodynamics of Activefloat 15 MW
The detailed potential flow solution for the added mass, radiation damping, and first- and second-order excitation forces of Activefloat is presented in Mahfouz et al. (2020b). In order to include the viscous effects, Activefloat is modelled in HydroDyn as a number of Morison elements. However, HydroDyn only allows modelling of cylindrical elements as Morison elements. Hence, Activefloat pontoons cannot be directly modelled in HydroDyn with their rectangular faces. To overcome this limitation the approach presented in Pegalajar-Jurado et al. (2018) is adopted. A detailed description of the Morison elements implemented in HydroDyn can be found in Mahfouz et al. (2020b). The effects of marine growth are not included in this work.
4.3 Mooring lines
The mooring system used for station keeping of Activefloat is made of three symmetric catenary mooring lines, where a line is attached to each platform arm. The lines are made of chains with a weight of 561.25 kg m−1, an axial stiffness of 2.304×10⁹ N, a diameter of 0.16 m, and a length of 614 m. The mooring lines' design ensure only horizontal loading on the anchors and that the maximum excursion in surge at rated thrust value is below 20 m. The geometry of the lines is presented in Table 7.
A summary of the load cases used to validate the models in OpenFAST is presented in Table 8. The load cases were selected to identify the main response characteristics of the FOWTs under static and dynamic loads and to find out the effects of the second-order wave forces and the increase in mass of the system compared to the DTU 10 MW reference wind turbine. First, the static equilibrium of the floaters in the absence of wind and wave forces is calculated. Afterwards, the natural frequencies are calculated using free decay tests. The natural frequencies of the tower in fore–aft and side to side motions also calculated for both platforms to ensure that the new tower designs' natural frequencies lie outside the 3P frequency region of the rotor. The controller response is checked using step wind simulation load case 7 in Table 8. The wind is increased from 3 to 25 m s−1 with a 1 m s−1 step and then decreased again to 3 m s−1. The step time is 200 s for every wind speed.
In order to check the effect of second-order wave excitation forces, the response of the platform to first- and second-order excitation forces of regular and irregular waves is checked in load cases 8, 9, 10, and 11. Moreover, the dynamic responses of the FOWTs during operation and extreme conditions are investigated by a number of simulations with turbulent wind fields and irregular waves. Operation of the turbine in a wind field with the Extreme turbulence model (ETM) and normal sea state (NSS) with second-order wave forces is checked in load case 13 in Table 8. Also simulations with a normal turbulence model (NTM) wind field at rated wind speed and extreme sea state (ESS) are carried out. Finally, the responses of the FOWTs to a 50-year extreme wind model (EWM) and ESS waves are checked. All simulations are carried out with wind and waves aligned to each other. The environmental conditions of the Gran Canaria Island site presented in Vigara et al. (2020) are used in all of the load cases shown in Table 8. The Pierson–Moskowitz spectrum is used for irregular-wave generation, and turbulence class C is used for the turbulent wind field creation. The turbulent wind fields are created using the Kaimal turbulence model following the International Electrotechnical Commission (IEC) standard for offshore wind turbines (IEC, 2019). For load cases 10, 11, 12, 13, and 14 in Table 8, the simulations were run for 5400 s but the first 1800 s were neglected to remove any transient effects.
In this section, the investigation of the floaters' responses to the load cases, introduced in Table 8, is presented. In all load cases the waves come from a 0∘ heading; therefore we focus on the platforms' responses in surge, heave, and pitch DOFs. We focus on the response of the spar and the semi-submersible floaters to second-order difference-frequency QTF and how the responses are different for the spar and semi-submersible. The spar floater is known to have smaller responses in heave than the semi-submersible floater. On the other hand, it is reported to be more sensitive to the pitch, roll, and yaw motions due to its small waterplane area (Roddier et al., 2010). The effect of the larger mass, inertia, and aerodynamic thrust force is investigated using coupled wind and wave simulations. The effect of the second-order mean drift forces is determined through regular-wave simulations with and without second-order forcing in the absence of wind. The effect of the second-order forcing at low frequencies is shown by simulating irregular waves with and without second-order difference-frequency wave excitation forces.
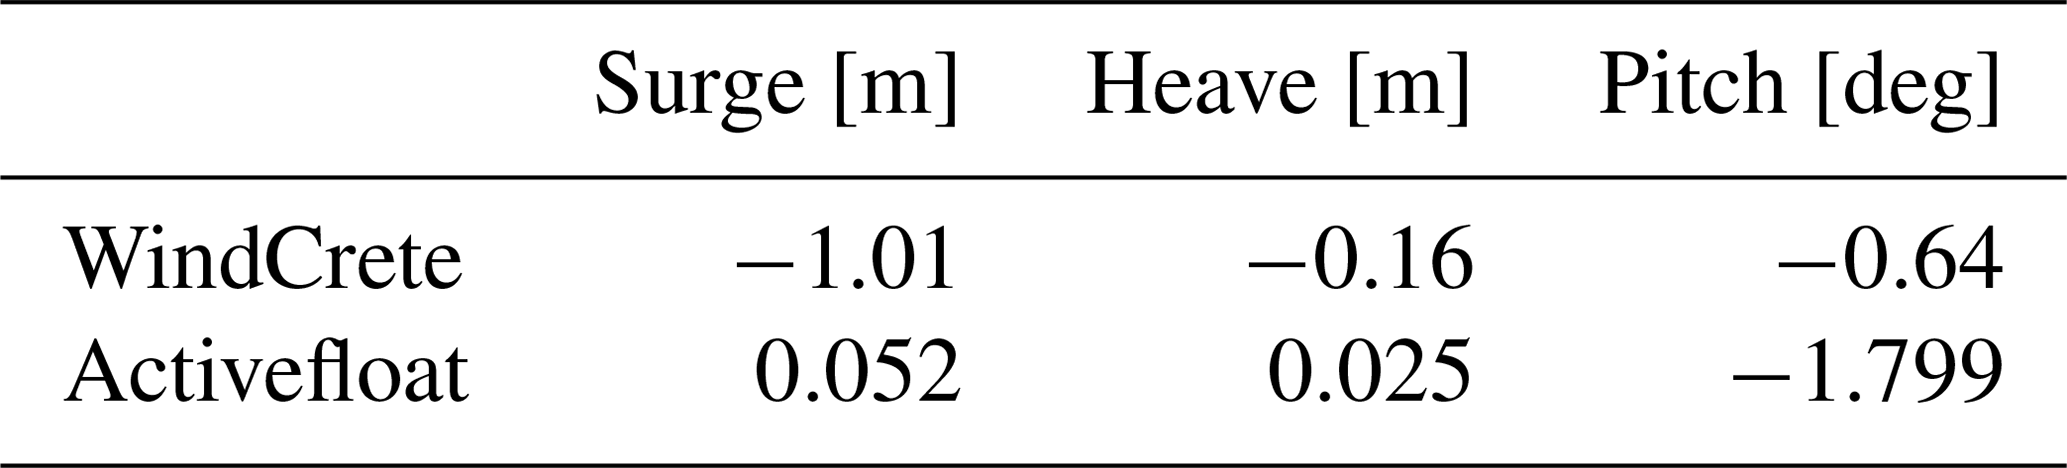
6.1 Static equilibrium
Table 9 shows the static position of both floaters to check the balance between the hydrostatic forces, the mooring forces, and the gravitational forces in the absence of wind and waves. The negative pitch comes from the big overhang distance of the RNA, where the CG of the RNA is located −7.01925 m in the x direction. In Activefloat, the pitch angle is higher due to the asymmetric mass distribution of the mooring lines masses around the y axis. The surge offset from the zero position comes from the mooring line tensions in the x direction in both floaters. In the absence of wind and waves, the surge motion is only affected by the mooring line forces. In Activefloat, having a positive surge means that the mooring lines are pulling the platform in the positive x direction, while a negative surge for WindCrete means the mooring lines are pulling the platform in the negative x direction.


6.2 Free decay tests
In order to calculate the natural frequency of the FOWTs at a specific DOF, the FOWT was offset in this DOF and left to oscillate freely. For heave, roll, and pitch the natural frequency depends on the mass of the overall system and the hydrostatic stiffness. For surge, sway, and yaw, the hydrostatic stiffness is zero and the mooring lines provide stiffness for the system. Therefore, for surge, sway, and yaw, the natural frequencies of the system depend on the mooring line design. For spar floaters, to avoid roll–yaw coupling, the natural frequency in yaw must be much higher than the roll natural frequency (Haslum et al., 2020). This constraint was taken into account while designing the mooring lines for WindCrete.
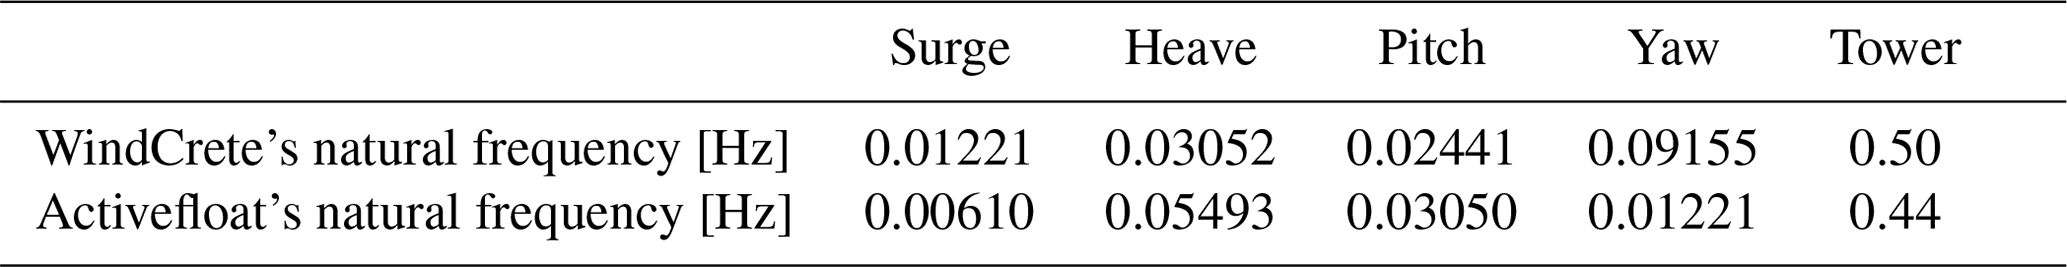
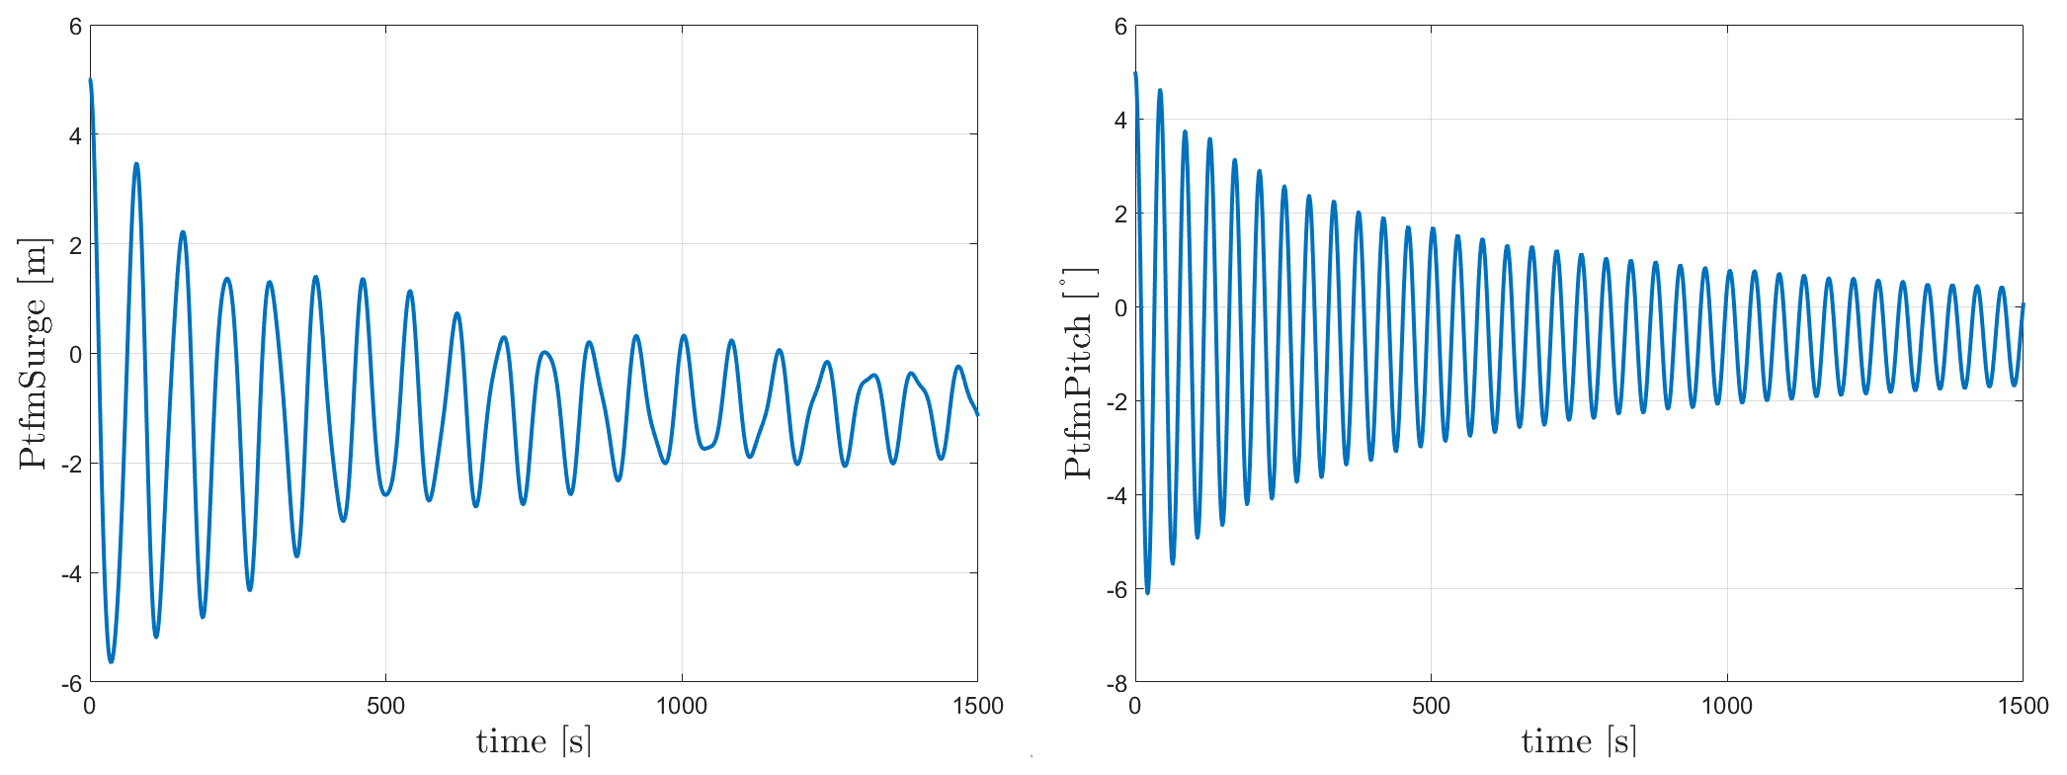
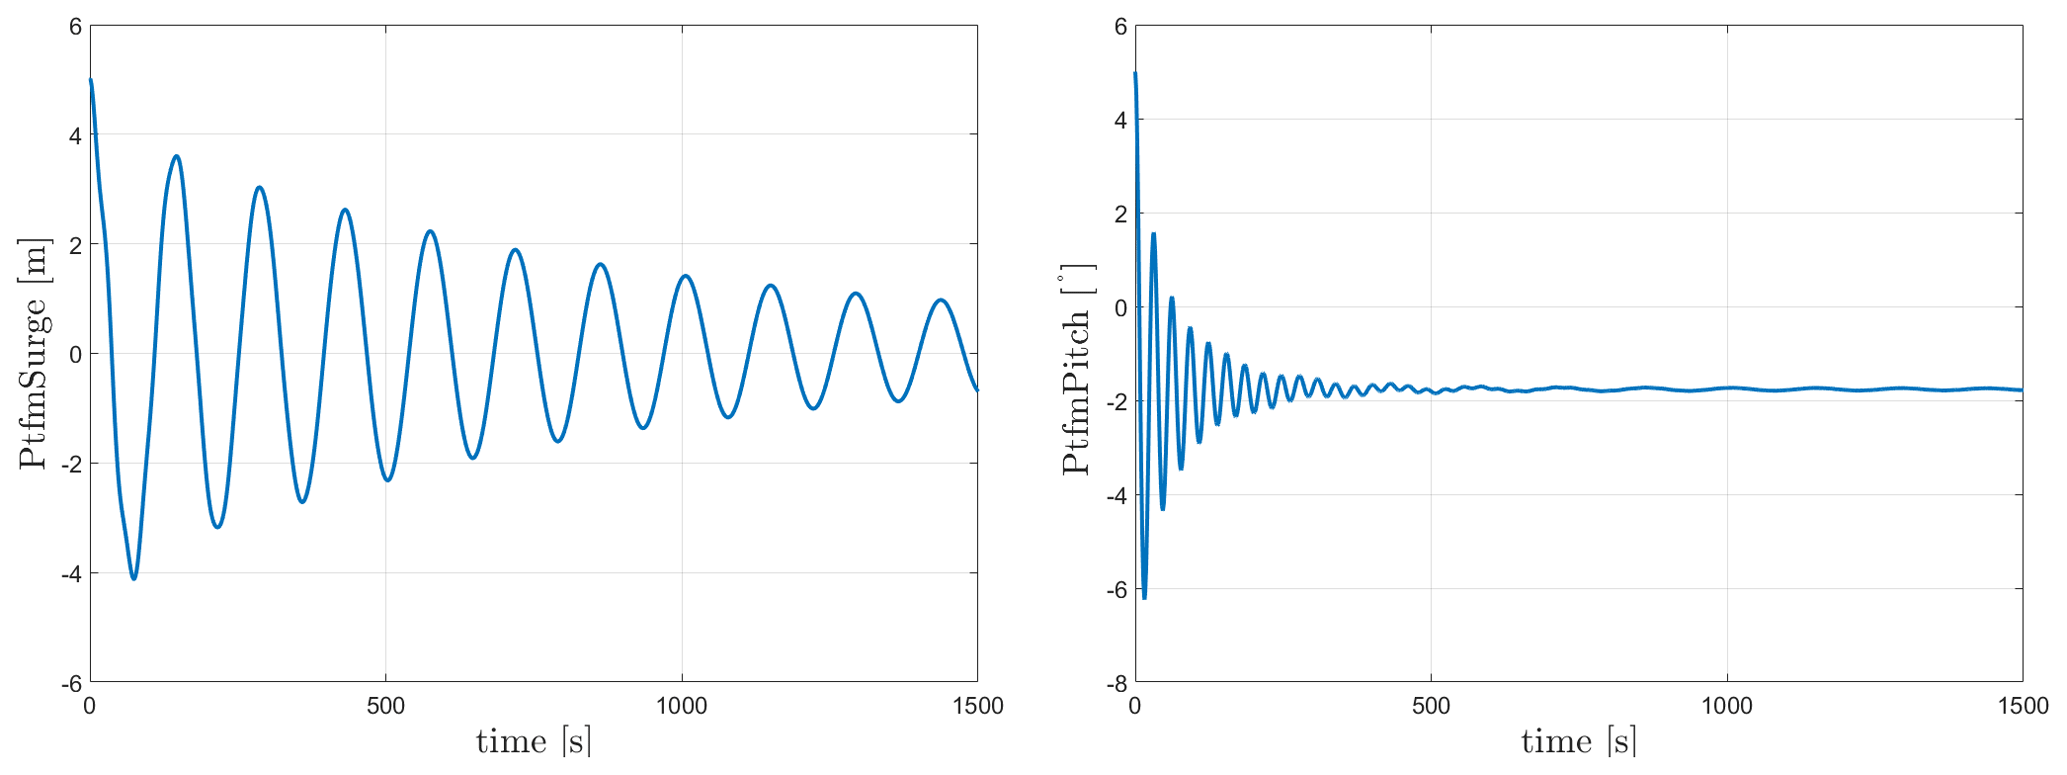
The natural frequencies of both floaters can be seen in Table 10. For WindCrete, the surge and pitch free decay time series can be seen in Fig. 3. As seen in Fig. 3, the surge decay includes not only one frequency but a combination of surge and pitch natural frequencies because it is measured at the mean sea level and not at the CG of the FOWT system. Activefloat's surge and pitch free decay time series can be seen in Fig. 4. In Fig. 4, the pitch decay also includes not only one frequency but a combination surge and pitch natural frequencies because it is measured at the mean sea level and not at the CG of the FOWT system. The towers' fore–aft and side to side natural frequencies (see Table 10) are always higher than the rotor 3P frequencies (between 0.25 and 0.38 Hz) calculated in Gaertner et al. (2020).
6.3 Step wind
In order to check the controller's performance, step wind simulation load case 7 in Table 8 was done on both FOWTs, and the responses are checked. The steady wind field used increases from 3 to 25 m s−1 and then decreases back to 3 m s−1 with a step duration of 200 s. The responses for WindCrete, shown in Fig. 5, and Activefloat, shown in Appendix A, Fig. A1, demonstrate that the baseline controller behaves as expected for below-rated, rated, and above-rated conditions. After checking the response of the floaters to the step wind load case and to all load cases with turbulent wind fields, we conclude that the controller does not introduce negative damping, and there is no platform pitch instability. For the WindCrete spar platform, there are higher fluctuations in the heave direction due to the low heave damping for the small heave amplitude fluctuation. Moreover, the change in the floaters' pitch angle causes a change in the vertical forces acting on the FOWT. The 200 s between each steady wind step is not enough for the platforms' motions to be completely damped.
6.4 Regular waves
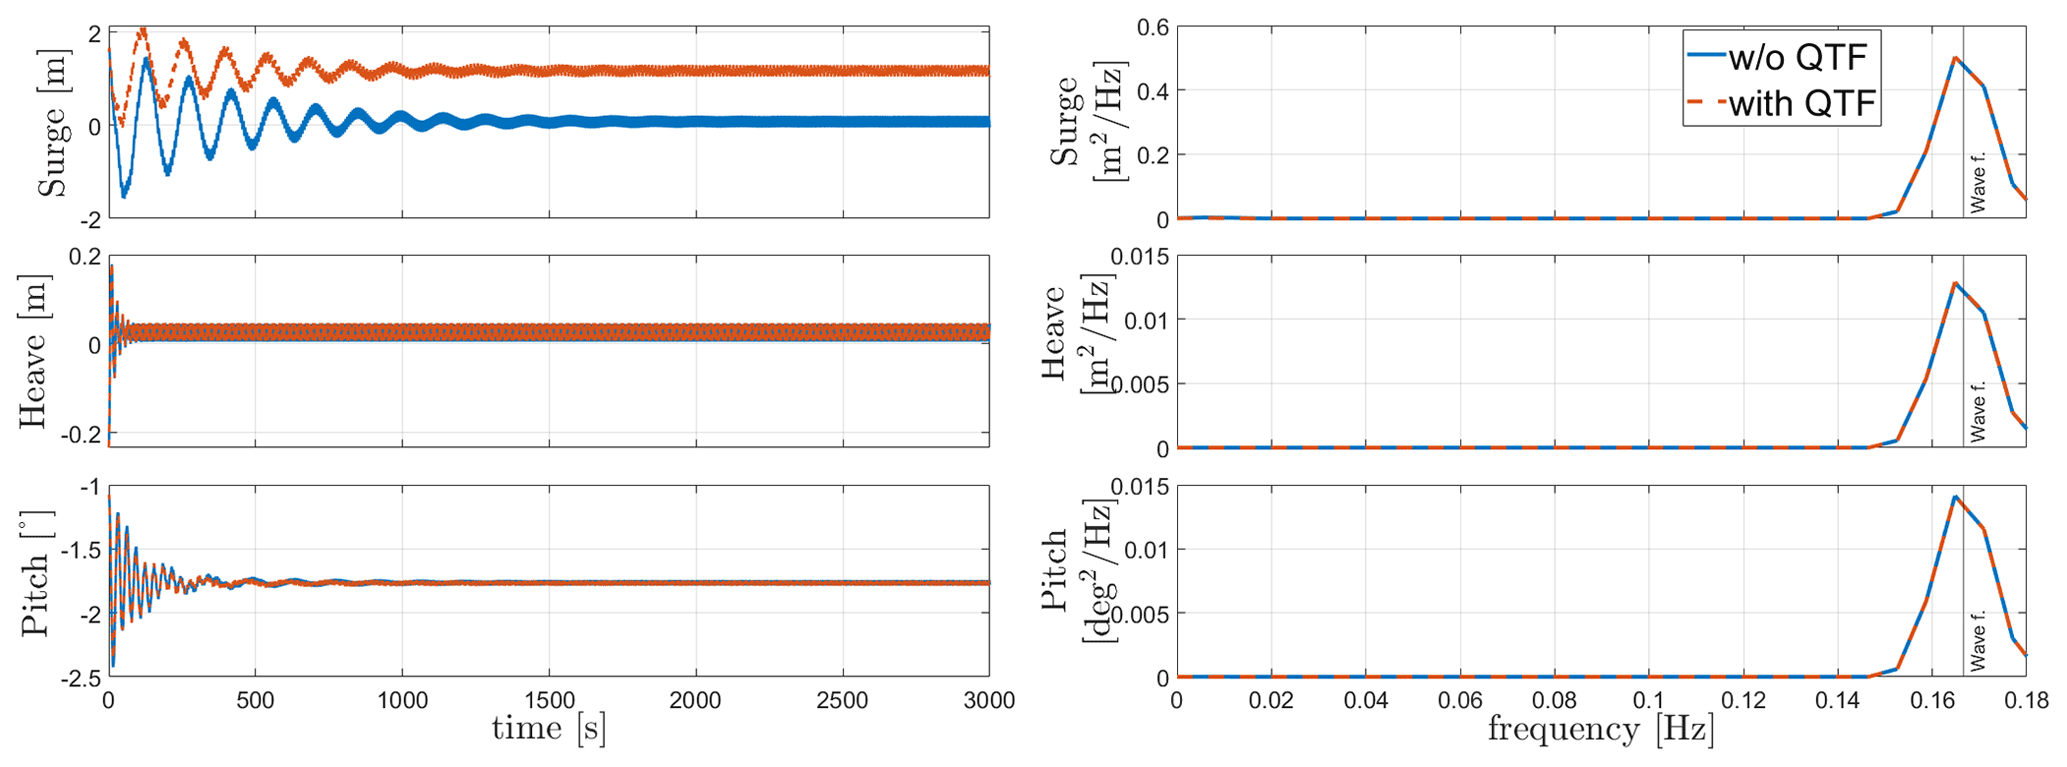
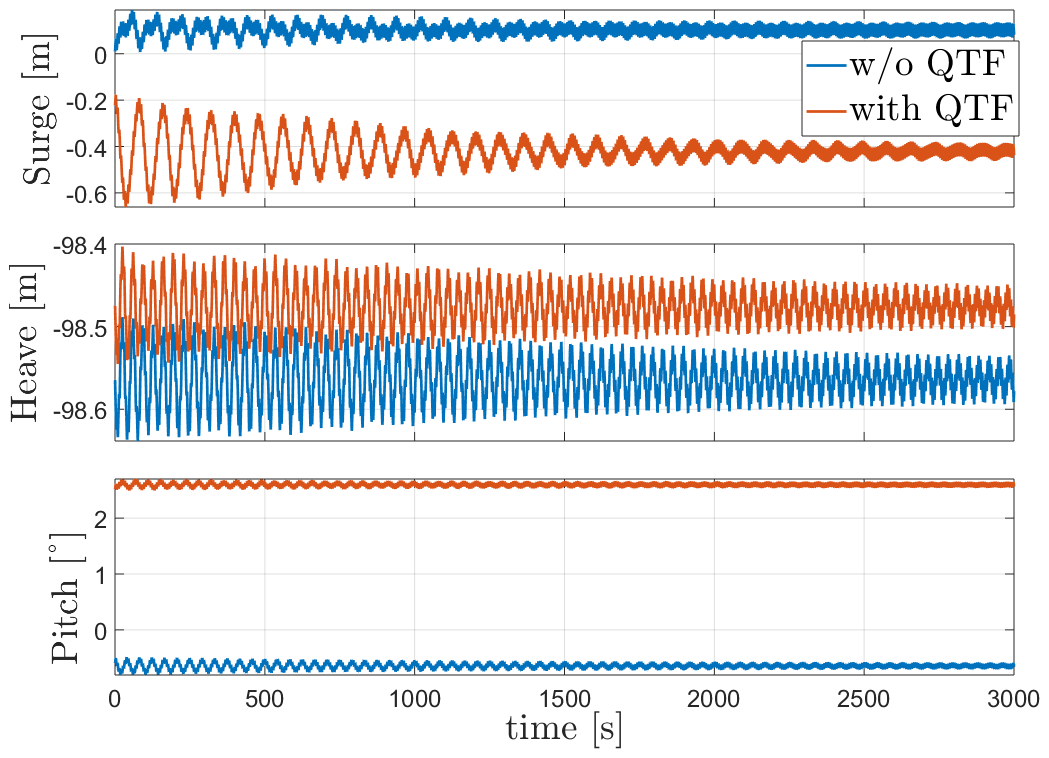
Regular-wave load cases 8 and 9 in Table 8 are shown in Figs. 6 and 7. The figures show the response of WindCrete and Activefloat to regular waves (H=2 m, T=6 s) with and without including the second-order difference-frequency wave forcing. For regular-wave simulations, the second-order difference-frequency wave forces represent only the mean wave drift force, which is a constant force over time (Pereyra et al., 2016). The effect of the mean drift forces on the floaters is checked in the absence of wind forces. In Figs. 6 and 7, the frequency response shown only considers the last 1500 s to exclude the transient effects. However, the frequency response of WindCrete at the natural frequency of the floater shows that the transient response is still seen after 3000 s. The limited effect of the wave forces on the floaters' response is due to the high inertia of the system as well as the mild waves at the Gran Canaria site.


In the absence of mean drift forces, the floaters' mean static response is equal to the static equilibrium positions shown in Table 9. For Activefloat, the drift forces change the static mean surge from 0.2 to 1.3 m, while the pitch and heave responses are not affected. While adding mean drift forces changes the mean static response in surge and pitch for WindCrete, it has no effect in heave. In WindCrete, the mean drift moment around the y axis is equal to 1.8 MN m, causing the change in mean static pitch from −0.64 to 2.6∘ shown in Fig. 6. Since the results presented in Fig. 6 are shown at mean sea level, the increase in static mean surge can be due to the mean drift forces or due to the increase in the static mean pitch of the platform. In order to clarify that the surge DOF is not highly affected by the second-order wave forces, the surge response at the CG of −98.41 m can be seen in Fig. 8. The surge response in Fig. 8 is not affected significantly by the second-order mean drift force in surge. This proves that mean surge is high in Fig. 6 because the surge response is measured at sea level and has a component coming from the high excitation of the pitch DOF and not because of the second-order mean drift forces.
6.5 Irregular waves
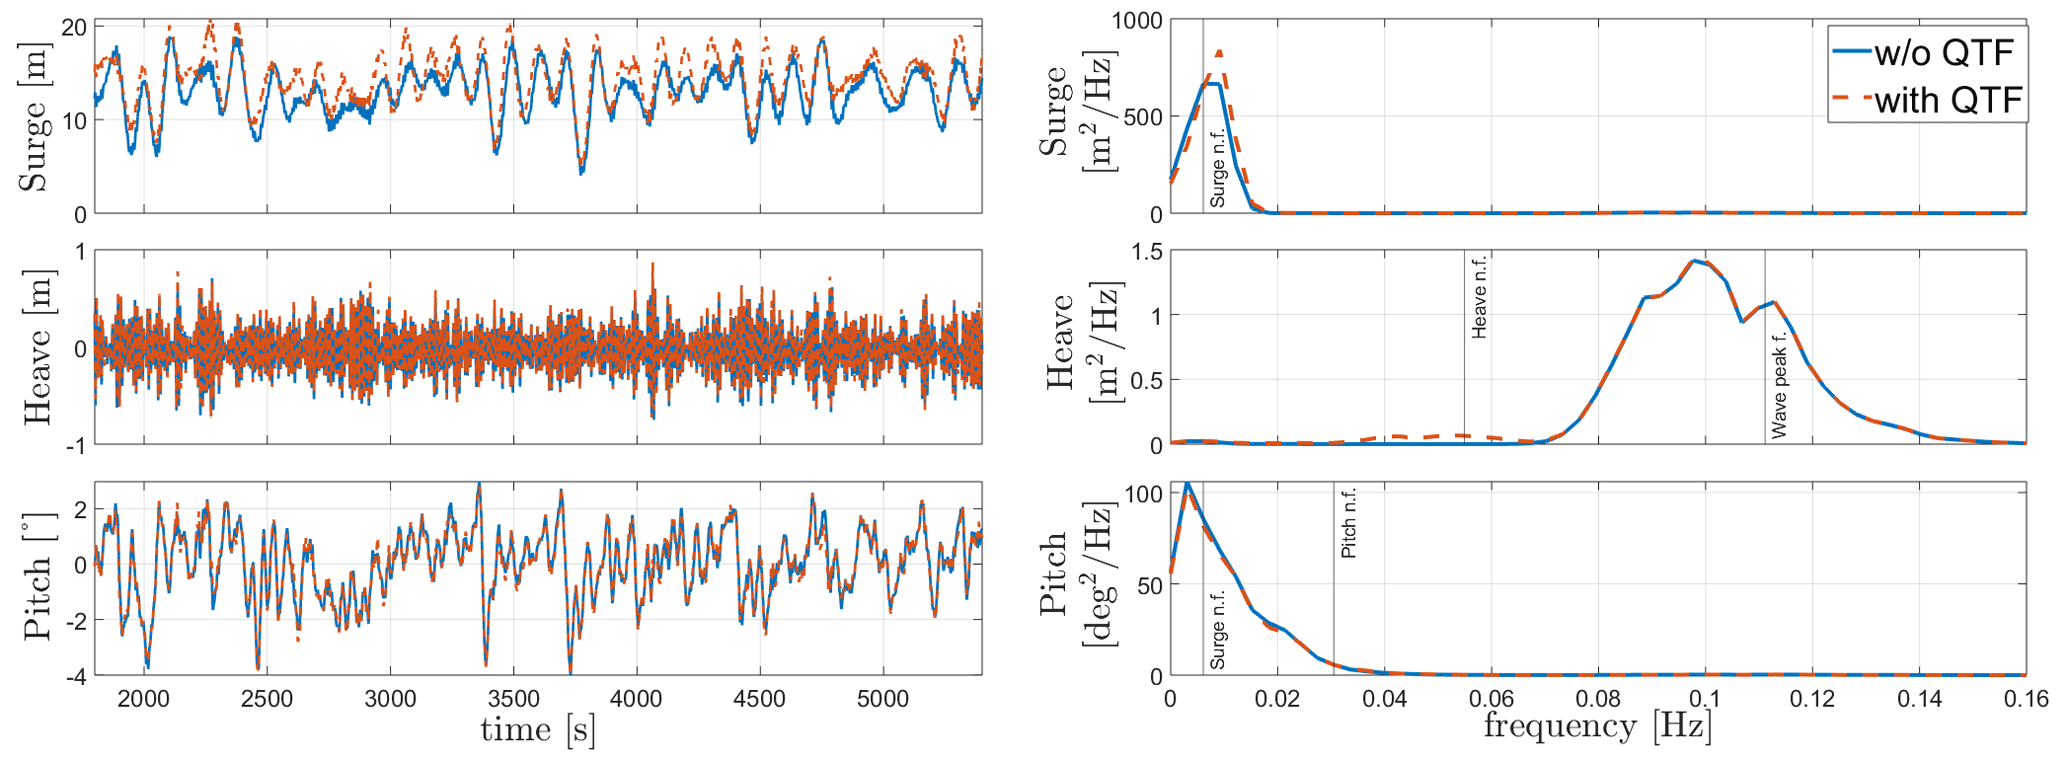
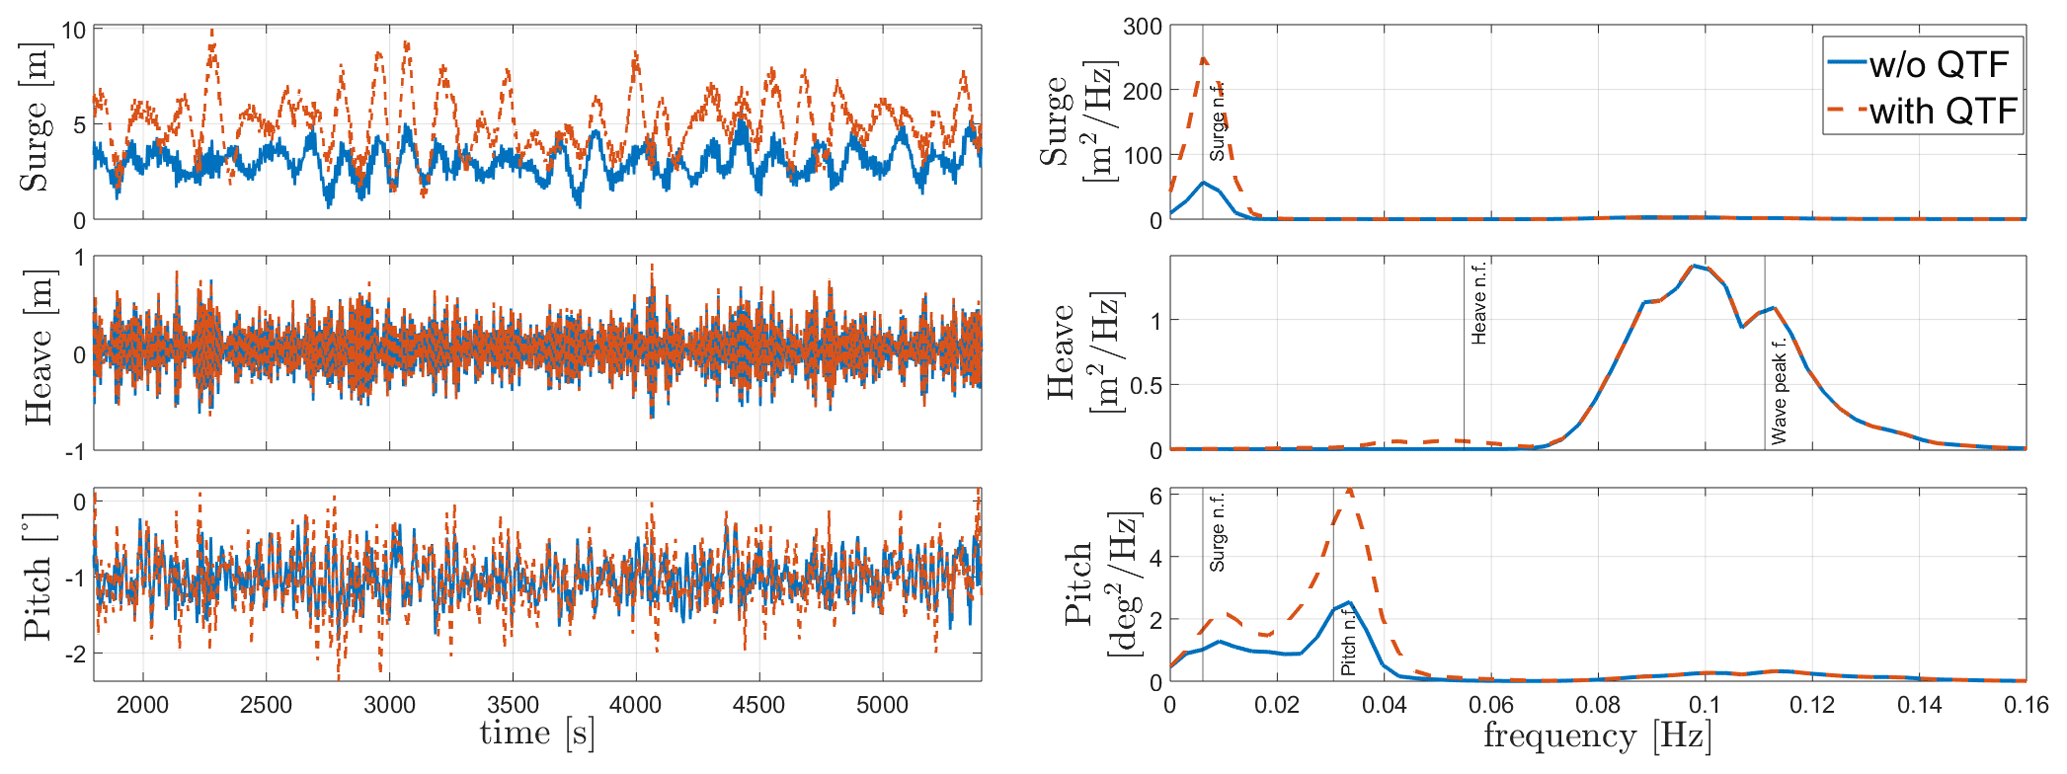
Extreme irregular-wave simulations (Hs=5.11 m, Tp=11 s) from load cases 10 and 11 in Table 8 are shown in Figs. 9 and 10. The second-order wave forcing is applied using the difference-frequency QTF matrix. The simulation was done for 5400 s, and the first 1800 s were eliminated to make sure that all the transient responses do not affect the responses shown in our results. The results show significant resonance effects at low frequencies due to the second-order wave loads. However, the Morison drag coefficient model applied in HydroDyn (Mahfouz et al., 2020a) also has a significant effect on the floater's response at low frequencies. The resonance due to second-order wave forces is seen for both platforms except for the heave DOF in Activefloat as the heave motion for semi-submersible floaters is mostly dominated by linear wave forces due to their small draft and since the natural frequency lies close to the wave excitation region.
6.6 Operation at NTM wind and ESS
Load case 12 in Table 8 is similar to load cases 10 and 11 except that now an NTM wind field of 10.5 m s−1 is added to the simulation inputs. Moreover, the Activefloat active ballast system is now activated to keep the mean static pitch of the platform around zero. The results of load case 12 with and without second-order wave forces are shown in Figs. 11 and 12 for both WindCrete and Activefloat. The figures show that including the second-order forces in the presence of wind has a very limited effect on the floaters' response, similar to what was shown by Coulling et al. (2013). For WindCrete, the response of surge, heave, and pitch DOFs is dominated by their own natural frequencies. The responses at low frequencies are due to the wind forces, while wave forces have a very small effect on the response. In Fig. 11, the frequency response shows a surge–pitch coupling, as the pitch DOF is excited at both the surge and the pitch natural frequencies.
In Figs. 12 and 10 the Activefloat response in heave DOF is almost identical with and without the NTM wind field. The heave response for Activefloat is dominated by the wave forces due to the small draft of the semi-submersible floater. The frequency responses in surge and pitch shown in Fig. 12 are at low frequencies around the platform's natural frequencies and dominated by wind forces.
6.7 Operation at ETM and NSS
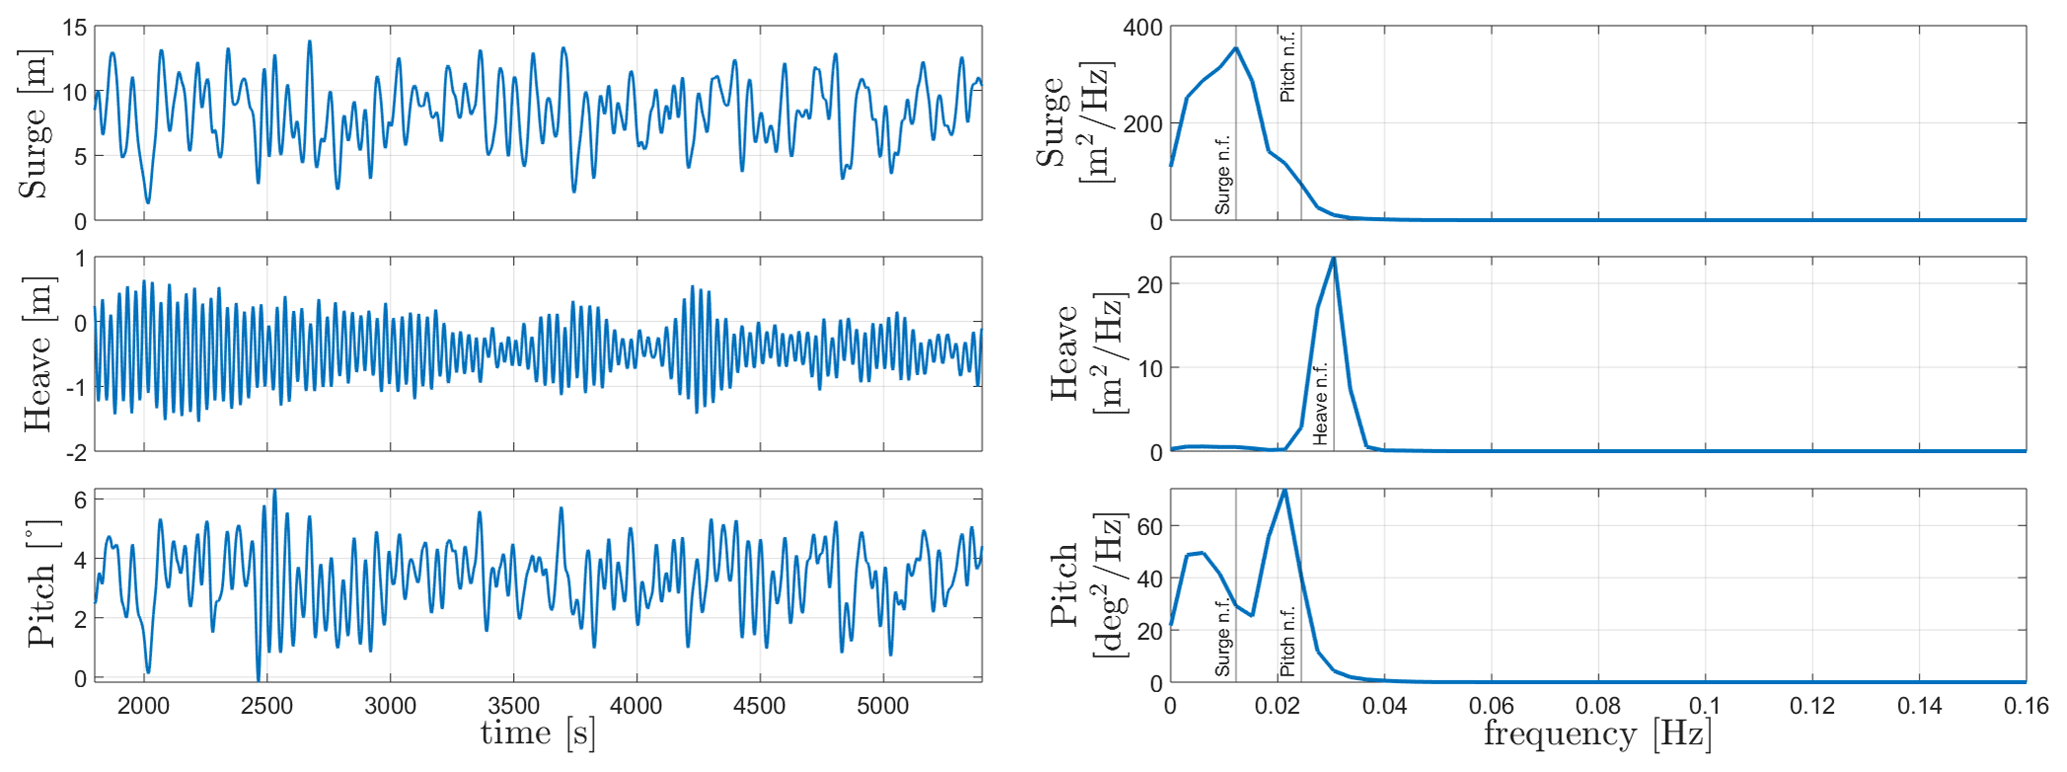
The FOWTs responses to the ETM wind field at 10.5 m s−1 and NSS (irregular waves with Hs=2 m and Tp=6 s) are shown in Figs. 13 and 14. The simulations were done for 5400 s and the first 1800 s were removed to remove transient effects. The response of WindCrete is dominated by the surge, heave, and pitch natural frequencies mostly excited by the wind forces, while the wave forcing has a minimal effect on the spar's response. Similarly, the response of Activefloat is dominated by low-frequency forcing, mainly excited by the wind. In the heave response, the wave forcing can be seen as a small peak around the wave frequency. The mean platform pitch is kept around zero by the active ballast system. The Activefloat's heave response is no longer dominated by the wave forcing for the NSS because of the mild conditions for our site. However, the heave excitation due to wave forces can still be seen in the frequency response of the system.

6.8 Operation at EWM for 50 years and ESS
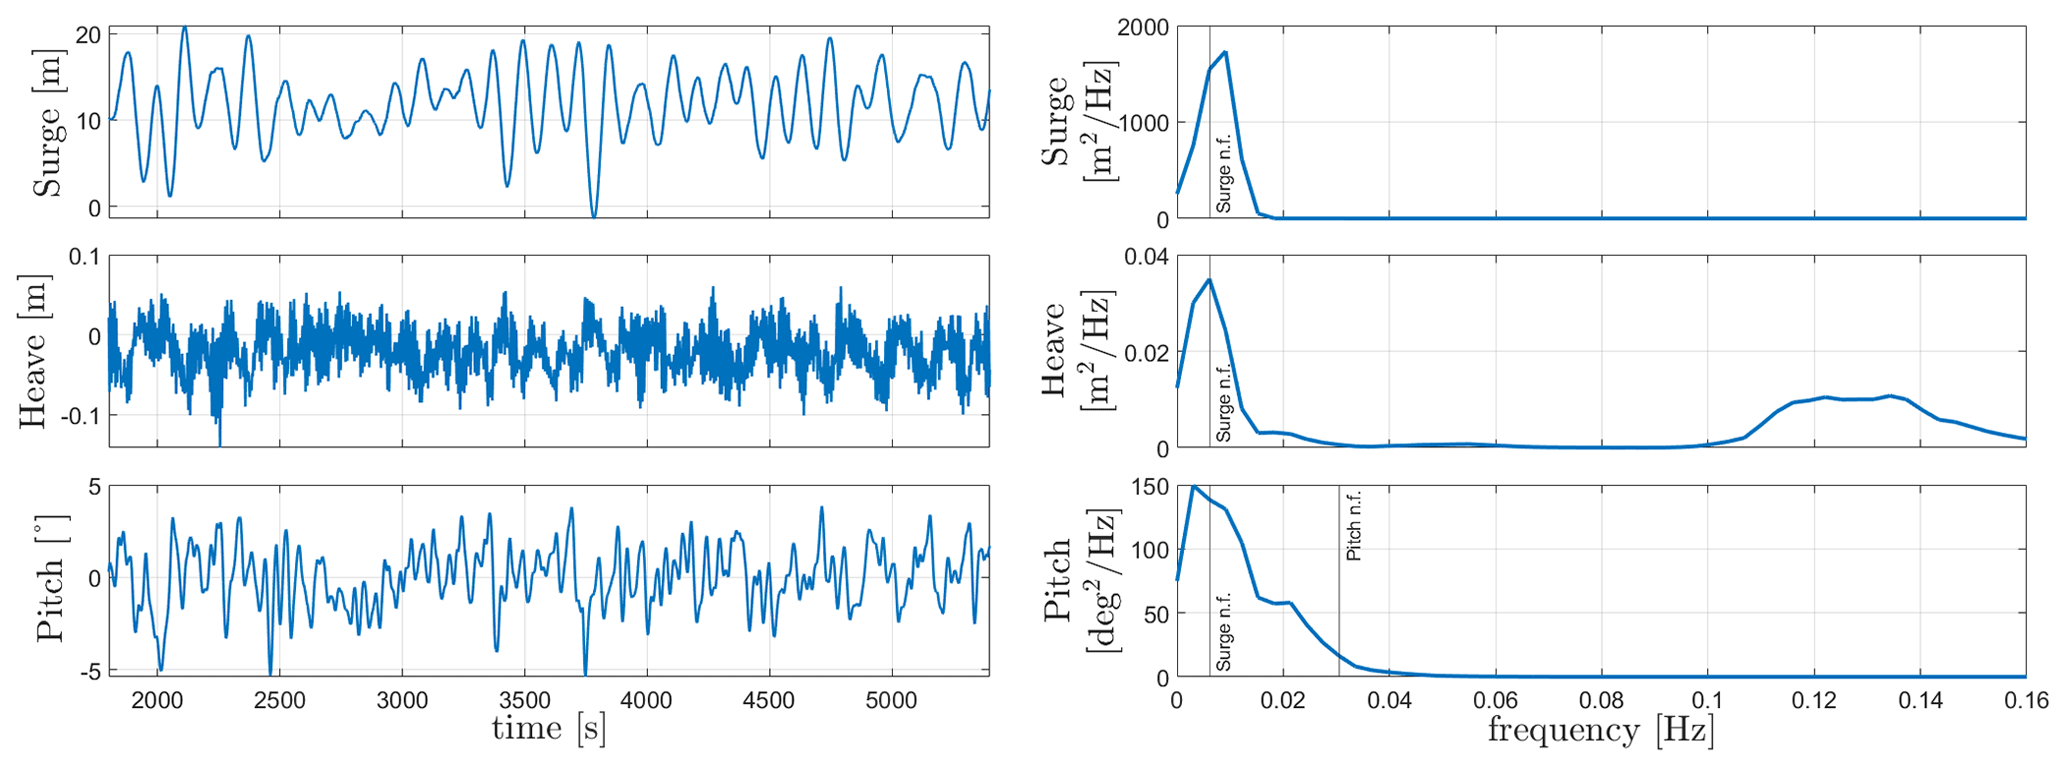
The FOWTs' responses to the site-specific EWM for 50 years of 28.35 m s−1 and ESS of Hs=5.11 m and Tp=11 s are shown in Figs. 15 and 16. The turbine is idling with the blades pitched to 90∘ during both simulations. The WindCrete response is dominated by the natural frequency of the floater in surge, heave, and pitch. Similarly for Activefloat, the surge and pitch motions are dominated by their natural frequencies. However, the heave response is dominated by the wave forcing frequency. The surge–pitch coupling can be seen for both floaters. The low-frequency response is caused by the second-order wave forces, which are more dominant due to the small thrust forces acting on the rotor as the blades are pitched out of the wind. The drift force effects can be clearly seen in WindCrete's response (Fig. 15), where the platform pitch is excited by the drift forces.
This paper presents the WindCrete spar OpenFAST model and the Activefloat semi-submersible OpenFAST model. The floaters were designed within the Horizon 2020 project COREWIND and were coupled to the IEA Wind 15 MW reference wind turbine. The paper introduced the design parameters of the FOWT models with an emphasis on the changes required to couple the fixed-bottom offshore OpenFAST model of 15 MW to the floating platforms. First, the tower was redesigned in order to withstand the higher loads at the tower's base. Then, the controller was tuned to avoid negative damping and hence prevent platform pitch instability. Additionally, the hydrodynamic models in HydroDyn using the potential flow solution and the strip theory solution to include viscous drag were implemented. Finally, the mooring line design for each floater was introduced, with an emphasis on the design limits.
A preliminary assessment of the FOWT model responses, was done and the results were shown in Sect. 6. We started by determining the static offset along with the natural frequencies. Afterwards, the controller's performance was tested using step wind simulations. Then, the effect of mean drift forces from second-order waves was shown using regular-wave simulations. Next we showed the effect of the overall second-order difference-frequency wave forcing using irregular-wave simulations. Finally, the dynamic response of the models were presented using different load cases with turbulent wind and irregular waves. Through the entire assessment we paid close attention to the response level of the floaters, contributed from waves and wind, to understand the forces which dominate the motions' response.
For the Gran Canaria site with mild wave loads, the motion responses were dominated by low-frequency forces, at the natural frequencies of the floaters. In the absence of wind forces, the regular and irregular-wave simulations' results showed that the second-order waves played a significant role in the floater's rigid body motion responses. However, we emphasize that the low-frequency resonance caused by the second-order waves is highly affected by the damping introduced in the hydrodynamic models. The damping currently introduced in the models came from the literature. Experimental data are to be applied for tuning from wave tank tests. Afterwards, when the NTM wind field was simulated with the ESS irregular waves in Figs. 11 and 12, the effect of the second-order wave forces on the motions' frequency response became very small compared to the effect of the wind forces. Finally, in all load cases with the turbine operating, the motions' responses were always dominated by the low-frequency forcing. Therefore we conclude that the models' responses for the Gran Canaria site are mostly dominated by wind forces. The second-order wave forces play a role in the motions' responses especially in surge, while the linear wave forces do not have a significant impact on the response of the system. This is due to the large size of the turbine and the mild wave climate at the site. The large turbine size increases the overall inertia of the system and leads to relatively large rotor loads. Future work includes the design of optimized mooring systems, damping calibration through wake tank tests, and incorporation of improved control strategies.

The OpenFAST models of WindCrete and Activefloat are open access and can be found at https://doi.org/10.5281/zenodo.4322446 (Molins et al., 2020) and https://doi.org/10.5281/zenodo.4322585 (Duran et al., 2020). The results and data used to create all figures throughout the paper can be obtained by contacting the first author.
MYM coupled Activefloat to the 15 MW OpenFAST model, created the potential flow model for WindCrete in ANSYS-AQWA, and was responsible for all the simulations done. CM and PT designed the WindCrete floater and coupled it to OpenFAST. SH and FV designed the Activefloat floater. APJ and HB provided guidance and help in coupling the floaters to the OpenFAST models. MS re-tuned the ROSCO controller to use it for the floating platforms.
The authors declare that they have no conflict of interest.
The research leading to these results has received partial funding from the European Union's Horizon 2020 research and innovation programme under grant agreement no. 815083(COREWIND). Mohammad Youssef Mahfouz would like to thank their colleagues at Stuttgart Wind Energy (SWE) for reviewing this work prior to submission.
This research, including the open-access publication, has been supported by Horizon 2020 (grant no. COREWIND (815083)).
This open-access publication was funded by the University of Stuttgart.
This paper was edited by Alessandro Bianchini and reviewed by Joseph Saverin and two anonymous referees.
Allen, C., Viselli, A., Dagher, H., Goupee, A., Gaertner, E., Abbas, N., Hall, M., and Barter, G.: Definition of the UMaine VolturnUS-S Reference Platform Developed for the IEA Wind 15-Megawatt Offshore Reference Wind Turbine, Tech. rep., National Renewable Energy Laboratory, available at: https://www.nrel.gov/docs/fy20osti/76773.pdf (last access: 16 April 2021), 2020. a
ANSYS: Aqwa Theory Manual, Ansys, available at: https://ansyshelp.ansys.com/account/secured?returnurl=/Views/Secured/prod_page.html?pn=Aqwa&pid=Aqwa&lang=en (last access: 20 December 2020), 2015. a
Campos, A., Molins, C., Gironella, X., Trubat, P., and Alarcón, D.: Experimental RAO's analysis of a monolithic concrete spar structure for offshore floating wind turbines, in: Vol. 1: Offshore Technology, Offshore Geotechnics, Proceedings of the ASME 2015 34th International Conference on Ocean, Offshore and Arctic Engineering, 31 May–5 June 2015, St. John's, Newfoundland, Canada, V001T01A016, https://doi.org/10.1115/OMAE2015-41891, 2015. a
Campos, A., Molins, C., Gironella, X., and Trubat, P.: Spar concrete monolithic design for offshore wind turbines, P. I. Civil Eng.-Mar. En., 169, 49–63, https://doi.org/10.1680/jmaen.2014.24, 2016. a
Coulling, A. J., Goupee, A. J., Robertson, A. N., and Jonkman, J. M.: Importance of Second-Order Difference-Frequency Wave-Diffraction Forces in the Validation of a FAST Semi-Submersible Floating Wind Turbine Model, in: Vol. 8: Ocean Renewable Energy, Proceedings of the ASME 2013 32nd International Conference on Ocean, Offshore and Arctic Engineering. 9–14 June 2013, Nantes, France, V008T09A019, https://doi.org/10.1115/OMAE2013-10308, 2013. a
Cummins, W. E.: The impulse response function and ship motions, available at: https://dome.mit.edu/bitstream/handle/1721.3/49049/DTMB_1962_1661.pdf?sequence=1&isAllowed=y (last access: 14 January 2021), 1962. a
Duarte, T. M., Sarmento, A. J., and Jonkman, J.: Effects of second-order hydrodynamic forces on floating offshore wind turbines, in: 32nd ASME Wind Energy Symposium, 13–17 January 2014, National Harbor, Maryland, https://doi.org/10.2514/6.2014-0361, 2014. a
Duran, R., Hernandez, S., Vigara, F., and Mahfouz, M. Y.: COREWIND – ACTIVEFLOAT OpenFAST model 15 MW FOWT Grand Canary Island site, Zenodo, https://doi.org/10.5281/zenodo.4322585, 2020. a
Gaertner, E., Rinker, J., Sethuraman, L., Zahle, F., Anderson, B., Barter, G., Abbas, N., Meng, F., Bortolotti, P., Skrzypinski, W., Scott, G., Feil, R., Bredmose, H., Dykes, K., Sheilds, M., Allen, C., and Viselli, A.: Definition of the IEA 15-Megawatt Offshore Reference Wind Turbine, Tech. rep., International Energy Agency, available at: https://www.nrel.gov/docs/fy20osti/75698.pdf, last access: 31 December 2020. a, b, c
Gueydon, S., Duarte, T., and Jonkman, J.: Comparison of Second-Order Loads on a Semisubmersible Floating Wind Turbine, in: Vol. 9: Ocean Renewable Energy, Proceedings of the ASME 2020 39th International Conference on Ocean, Offshore and Arctic Engineering, 3–7 August 2020, Virtual, Online, V009T09A049, https://doi.org/10.1115/OMAE2014-23398, 2014. a
Hall, M.: MoorDyn User ' s Guide, Tech. rep., Matt Hall wind and marine renewable energy, available at: http://www.matt-hall.ca/files/MoorDyn-Users-Guide-2017-08-16.pdf (last access: 31 December 2020), 2017. a, b
Haslum, H., Marley, M., Skaare, B., and Andersen, H.: Aerodynamic Roll-Yaw Instabilities of Floating Offshore Wind Turbines, in: Vol, 9: Ocean Renewable Energy, Proceedings of the ASME 2020 39th International Conference on Ocean, Offshore and Arctic Engineering, 3–7 August 2020, Virtual, Online, V009T09A049, https://doi.org/10.1115/OMAE2020-18273, 2020. a, b
Hegseth, J. M. and Bachynski, E. E.: A semi-analytical frequency domain model for efficient design evaluation of spar floating wind turbines, Mar. Struct., 64, 186–210, https://doi.org/10.1016/j.marstruc.2018.10.015, 2019. a
Hoerner, S.: Hoerner, published by author, https://doi.org/10.1093/benz/9780199773787.article.b00088376, 1965. a
Hundleby, G. and Freeman, K.: Unleashing Europe's offshore wind potential, Tech. Rep. June, Wind Europe, available at: https://windeurope.org/wp-content/uploads/files/about-wind/reports/Unleashing-Europes-offshore-wind-potential.pdf (last access: 31 December 2020), 2017. a
IEC: International Standard IEC61400-3-1: Wind energy generation systems – Part 3-1: Design requirements for fixed offshore wind turbines, First; 2019, Standard, IEC, Geneva, Switzerland, 2019. a
Jonkman, J. M.: Dynamics modeling and loads analysis of an offshore floating wind turbine, Tech. rep., NREL – National Renewable Energy Laboratory, Colorado, USA, 2007. a
Jonkman, J. M.: Dynamics of offshore floating wind turbines-model development and verification, Wind Energy, 12, 459–492, https://doi.org/10.1002/we.347, 2009. a
Jonkman, J. M., Robertson, A. N., and Hayman, G. J.: HydroDyn User's Guide and Theory Manual, Tech. rep., NREL – National Renewable Energy Laboratory, Colorado, USA, 2015. a
Larsen, T. J. and Hanson, T. D.: A method to avoid negative damped low frequent tower vibrations for a floating, pitch controlled wind turbine, J. Phys. Conf. Ser., 75, 012073, https://doi.org/10.1088/1742-6596/75/1/012073, 2007. a
Mahfouz, M. Y., Faerron-Guzmán, R., Müller, K., Lemmer, F., and Cheng, P. W.: Validation of drift motions for a semi-submersible floating wind turbine and associated challenges, J. Phys. Conf. Ser., 1669, 012011, https://doi.org/10.1088/1742-6596/1669/1/012011, 2020a. a
Mahfouz, M. Y., Salari, M., Vigara, F., Hernandez, S., Molins, C., Trubat, P., Bredmose, H., and Pegalajar-Jurado, A.: D1.3. Public design and FAST models of the two 15 MW floater-turbine concepts, Zenodo, https://doi.org/10.5281/zenodo.4385727, 2020b. a, b, c, d
Matha, D., Sandner, F., Molins, C., Campos, A., and Cheng, P. W.: Efficient preliminary floating offshore wind turbine design and testing methodologies and application to a concrete spar design, Philos. T. R. Soc. A, 373, 20140350, https://doi.org/10.1098/rsta.2014.0350, 2015. a
Molins, C., Trubat, P., and Mahfouz, M. Y.: UPC – WINDCRETE OpenFAST model 15 MW FOWT – Grand Canary Island, Zenodo, https://doi.org/10.5281/zenodo.4322446, 2020. a
Mulders, S. P. and Van Wingerden, J. W.: Delft Research Controller: An open-source and community-driven wind turbine baseline controller, J. Phys. Conf. Ser., 1037, 032009, https://doi.org/10.1088/1742-6596/1037/3/032009, 2018. a
NREL: OpenFAST, Version 2.1.0, available at: https://github.com/OpenFAST/openfast (last access: 1 February 2021), 2019. a
NREL: ROSCO, Version 1.0.0, available at: https://github.com/NREL/rosco (last access: 1 February 2021), 2020. a
Pegalajar-Jurado, A., Bredmose, H., Borg, M., Straume, J. G., Landbø, T., Andersen, H. S., Yu, W., Müller, K., and Lemmer, F.: State-of-the-art model for the LIFES50+ OO-Star Wind Floater Semi 10MW floating wind turbine, J. Phys. Conf. Ser., 1104, 012024, https://doi.org/10.1088/1742-6596/1104/1/012024, 2018. a
Pereyra, B., Wendt, F., Robertson, A., and Jonkman, J.: Assessment of first- and second-order wave-excitation load models for cylindrical substructures, in: International Society of Offshore and Polar Engineers Conference (ISOPE 2016), 26 June–2 July 2016, Rhodes, Greece, 214–218, 2016. a
Roddier, D., Cermelli, C., Aubault, A., and Weinstein, A.: WindFloat: A floating foundation for offshore wind turbines, J. Renew. Sustain. Ener., 2, 033104, https://doi.org/10.1063/1.3435339, 2010. a
Vigara, F., Cerdán, L., Durán, R., Muñoz, S., Lynch, M., Doole, S., Molins, C., Trubat, P., and Gunache, R.: Design Basis, Zenodo, https://doi.org/10.5281/zenodo.4056779, 2020. a, b
Ziegler, J. G., Nichols, N. B., and Rochester, N. Y.: Optimum settings for automatic controllers, J. Dyn. Syst.-T. ASME, 115, 220–222, https://doi.org/10.1115/1.2899060, 1942. a
- Abstract
- Introduction
- Numerical modelling using OpenFAST
- WindCrete
- Activefloat
- Load cases
- Floater responses
- Conclusions
- Appendix A: Activefloat response to step wind in the absence of waves
- Code and data availability
- Author contributions
- Competing interests
- Acknowledgements
- Financial support
- Review statement
- References