the Creative Commons Attribution 4.0 License.
the Creative Commons Attribution 4.0 License.
 | 08 Nov 2022
Research challenges and needs for the deployment of wind energy in hilly and mountainous regions
Andrew Clifton
Sarah Barber
Alexander Stökl
Helmut Frank
Timo Karlsson
The continuing transition to renewable energy will require more wind turbines to be installed and operated on land and offshore. On land, wind turbines will increasingly be deployed in hilly or mountainous regions, which are often described together as “complex terrain” in the wind energy industry. These areas can experience complex flows that are hard to model, as well as cold climate conditions that lead to instrument and blade icing and can further impact wind turbine operation. This paper – a collaboration between several International Energy Agency (IEA) Wind Tasks and research groups based in mountainous countries – sets out the research and development needed to improve the financial competitiveness and ease of integration of wind energy in hilly or mountainous regions. The focus of the paper is on the interaction between the atmosphere, terrain, land cover, and wind turbines, during all stages of a project life cycle. The key needs include collaborative research and development facilities, improved wind and weather models that can cope with mountainous terrain, frameworks for sharing data, and a common, quantitative definition of site complexity. Addressing these needs will be essential for the affordable and reliable large-scale deployment of wind energy in many countries across the globe. Because of the widespread nature of complex flow and icing conditions, addressing these challenges will have positive impacts on the risk and cost of energy from wind energy globally.
- Article
(2121 KB) - Full-text XML
- BibTeX
- EndNote


Until the early 2000s, wind energy development generally took place at sites in flat and windy terrain (e.g. Denmark, northern Germany, parts of California, the wind corridor in the Midwestern United States and Canada, and the plains of China). These areas were popular for the early deployment of wind energy for many reasons including strong wind resources and the relative ease of transportation, installation, and planning.
1.1 The importance of mountainous and hilly sites
As the demand for low-emission energy has grown, the installed generating capacity of wind turbines has increased by more than 10 % year-on-year for the last decade. Of the 743 GW of installed wind energy capacity at the end of 2020, around 95 % is on land, while the rest is offshore (Lee et al., 2021). Not all of these turbines have been built in flat locations; some developers have built turbines in hilly or mountainous terrain, which is often known in the wind energy industry as “complex terrain”. Although sites in hilly or mountainous locations might also have good wind resources due to localised speed up over ridges or escarpments (e.g. Mickle et al., 1988; Berg et al., 2011) or through passes (e.g. Clifton et al., 2014), they bring extra challenges in understanding the wind conditions in such locations (sometimes called “complex flow”) and may be prone to extreme weather conditions such as storms, snow, or ice formation. These characteristics can increase the cost and uncertainty of measurements, are difficult to predict, may lead to high variability between nearby locations (Lange et al., 2017), and can lead to increased wind turbine costs and reduced lifetime. Even the perception of risk may result in increased financing costs, adding to the overall project costs. As a result of these challenges, these types of sites are sometimes avoided by wind energy developers.
The global transition to low-carbon energy sources means that wind energy now needs to be deployed in all regions and not just in historically preferred locations. In Europe, scenarios suggest that between 500 and 1300 GW of new wind energy capacity will be needed by the year 2050, which is 2 to 4 times the existing capacity; about one-third of this new capacity will be installed offshore, while the balance will be installed on land (European Commission, 2018). This requires installing new wind capacity on land at 2 to 5 times the average rate for the period 2015 to 2020 (Komusanac et al., 2022). Many national and regional governments have policies that encourage distributed development rather than focusing on areas with the most favourable conditions. This distribution reduces the risk of transmission congestion and provides geographical variability that improves the reliability of energy from weather-driven renewable energy (e.g. Tong et al., 2021).
Together, these trends mean that more wind turbines will need to be built in mountainous and hilly locations that can experience complex flow or cold climates, or both. Research and development will be required to support this deployment.

Figure 1Around 30 % of the global land surface can be considered to be mountainous. Data are plotted by the authors from the Global Mountain K3 data files (Karagulle et al., 2017). The definition of mountainous terrain used for this figure is provided in Appendix A. An interactive version of the map is available at https://rmgsc.cr.usgs.gov/gme/gme.shtml (last access: 1 October 2022).
1.2 Qualitative definitions
Understanding how important these different aspects of complexity are to the deployment of wind energy first requires some qualitative definitions:
-
Hilly and mountainous terrain is characterised by steep slopes and significant changes in elevation over small distances. This could take the form of mountain ranges or hills but could also include escarpments, ridges, valleys, and gorges. Such terrain is found over large parts of the earth's surface; according to the definitions used by Sayre et al. (2018), at least 30 % of the earth's land surface can be considered to be mountainous. The definition used is provided in Appendix A. These regions are plotted in Fig. 1.
-
Hilly and mountainous terrain is one type of complex terrain. Complex terrain is a catch-all label used in the wind energy community that has different meanings depending on the application (see Sect. 7.1).
-
Complex flow refers to wind conditions that cannot be described by simple heuristic wind models such as logarithmic or power law profiles with sufficient accuracy for wind energy applications. Complex flow is not well described by simple heuristic wind models because it exhibits unusual profiles or curvature or is inclined. Complex flows also usually show modified turbulence intensity and spectra compared to winds over flat terrain. These flow characteristics may be caused by winds flowing over or through hilly or mountainous terrain because of effects such as deflection, detached or separated flows, compression, and channelling. As a result, they are likely at any time in hilly or mountainous terrain.
Complex flows may also form in flat terrain or offshore because of variations in surface roughness or because of atmospheric stability. This can lead to the development of internal boundary layers and low-level jets, which have been found over flat terrain in Iowa (Vanderwende et al., 2015) and northern Germany (Emeis, 2014) and over the North Sea (Wagner et al., 2019). As atmospheric stability is partially driven by diurnal or seasonal temperature differentials between the boundary layer and ground or water, these phenomena may come and go over timescales from hours to months. As well as this, complex flow can be found in the form of wakes behind obstacles such as wind turbines, buildings, islands, or mountains. The location and presence of such wakes is dependent on mesoscale and local conditions.
-
Cold climate locations experience weather and climate phenomena associated with air temperatures near or below freezing. Here we define cold climates using the criteria set out by International Energy Agency (IEA) Wind Task 19 in Lehtomäki (2016), whereby a cold climate can be an icing climate and/or a low-temperature climate:
-
Icing climates (ICs) have instrumental icing during more than 1 % of the year (88 h) or meteorological icing during more than 0.5 % of the year (44 h). Icing can be caused by rime or glaze ice at temperatures at or below 0 ∘C but may also be associated with wet snow accretion at temperatures from 0 to +3 ∘C.
-
Low-temperature climates (LTCs) have air temperatures less than −9 ∘C on more than 9 d yr−1 or annual average air temperature less than 0 ∘C.
In the mid-latitudes such conditions might occur at all elevations during winter or year-round in hilly or mountainous regions, while in the high latitudes they may occur anywhere year-round. Many wind turbines have been built in cold climates. A recent IEA Wind Task 19 expert group market forecast estimated that around 22% of wind energy development sites are in cold climate locations (Karlsson, 2021). That corresponds to more than 150 GW of capacity in 2020 or 78 000 turbines. Of this, around 119 GW was in an icing climate (Fig. 2), while 74 GW was in low-temperature climate locations; some regions may experience both low temperatures and icing.
-
-
In this paper, we define wind energy development locations in hilly or mountainous terrain that may experience complex flow or cold climates as complex locations.
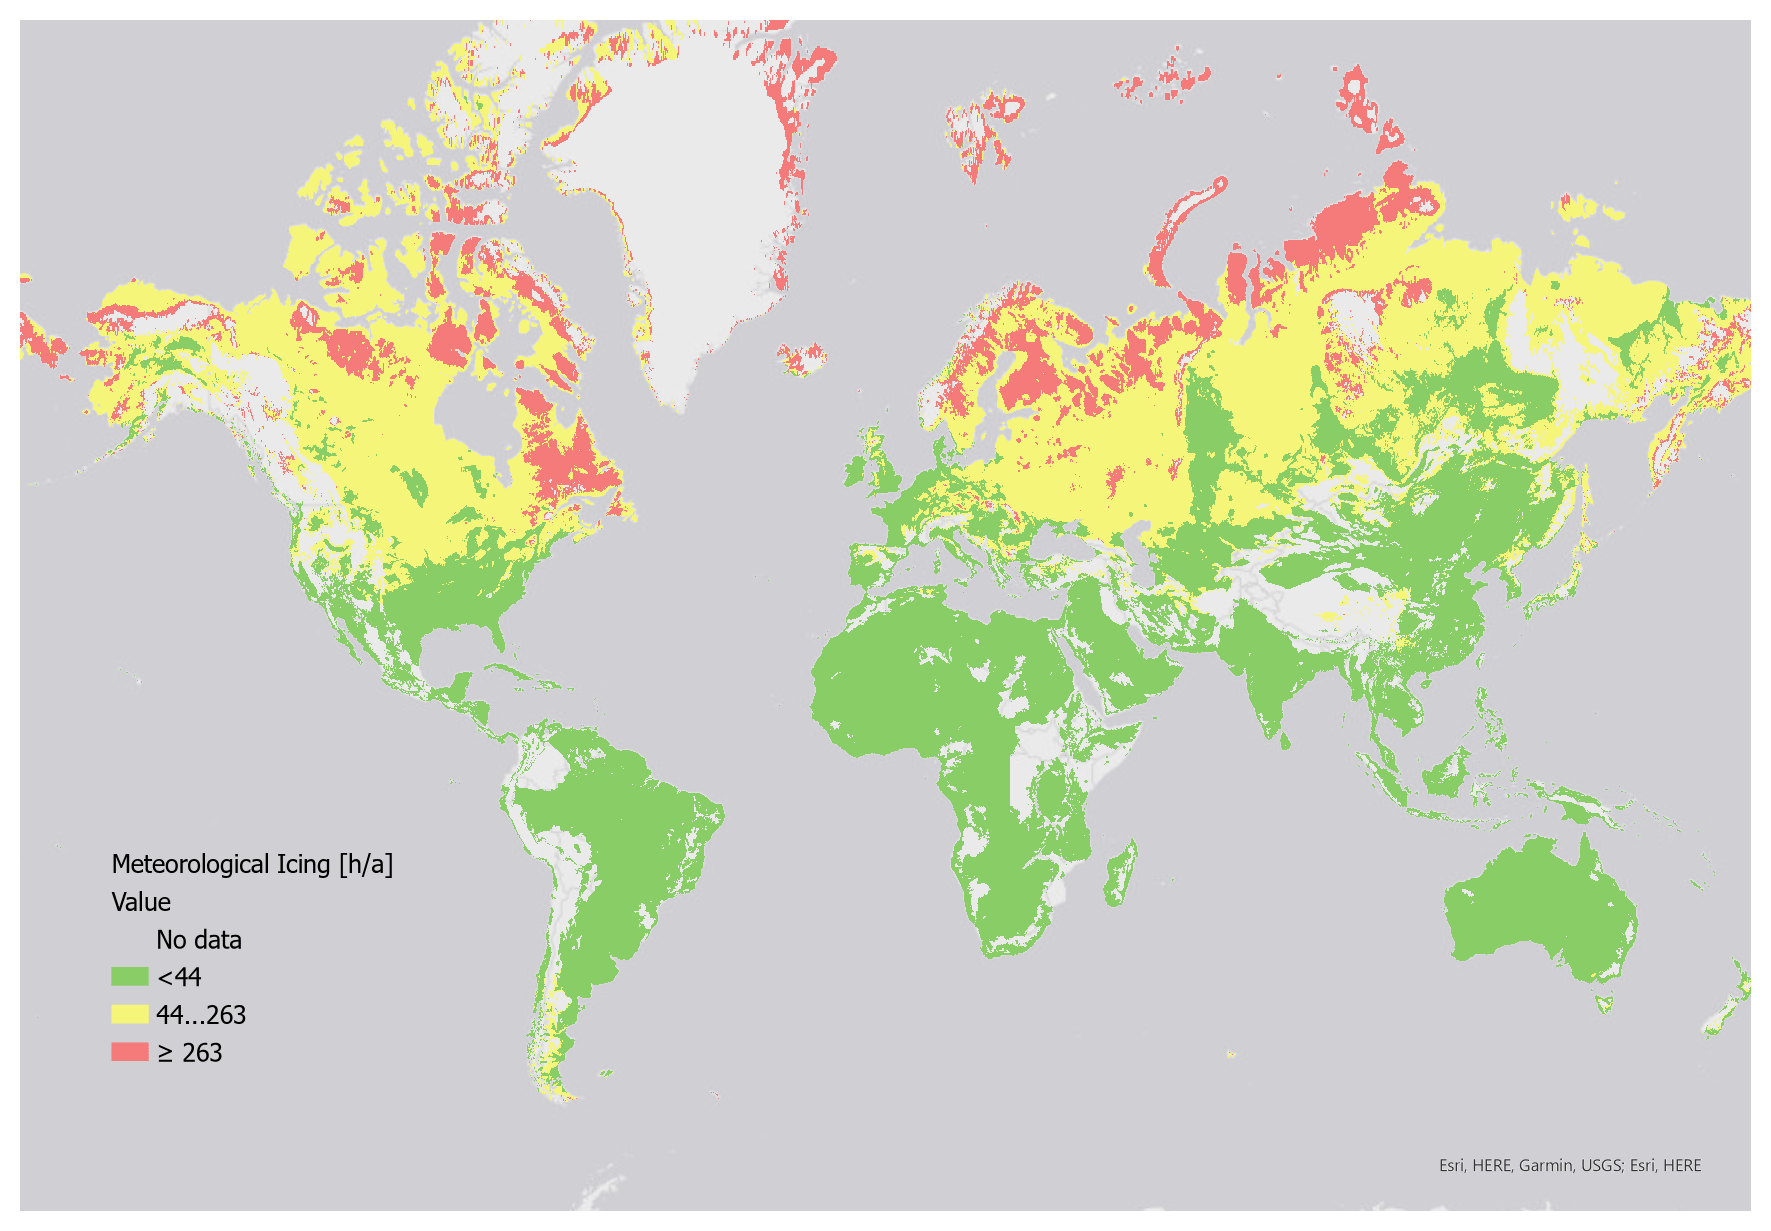
Figure 2The Technical Research Centre of Finland (VTT) Wind Power Icing Atlas (WIceAtlas), showing the number of hours per year of meteorological icing. IEA Wind Task 19 considers areas with more than 44 h of meteorological icing to be in an icing climate, which is a subset of cold climate. An interactive version of the map is available at http://virtual.vtt.fi/virtual/wiceatla/ (last access: 1 October 2022).
1.3 Research and development needs
In recent years the wind energy industry has taken stock of the research and development (R&D) challenges that it faces. In 2016 van Kuik et al. (2016) proposed a curiosity-driven research agenda for wind energy (van Kuik et al., 2016), while in 2019 Veers et al. (2019) identified three “grand challenges” in the science of wind energy that needed to be addressed (Veers et al., 2019). These papers have been useful in raising awareness of significant challenges and in helping set research strategies for wind energy. In this paper, we continue in that vein by identifying the challenges specifically facing wind energy in hilly and mountainous terrain and identifying the R&D required to overcome them. We anticipate that this paper will be particularly relevant for researchers and funding agencies in countries with significant areas of hilly or mountainous terrain.
This paper considers the challenges at each stage in the life cycle of a wind energy project, focusing on the interaction of terrain, wind turbine, wind farm and atmosphere. Pre-construction issues are explored in Sects. 2 to 5; Sect. 2 looks at the challenges in site prospecting, Sect. 3 at the challenges for resource assessment, Sect. 4 at the challenges for project planning, and Sect. 5 at the challenges for wind turbine design. Section 6 looks at the challenges for operational wind plants. General challenges facing wind energy in complex locations are discussed in Sect. 7. The associated research needs are discussed for each challenge. We also consider the potential impact that addressing the R&D need would have on a wind energy project's negative risks and the potential impact (either positive or negative) on the ultimate levelised cost of energy of wind energy development. These are documented in tables at the end of each section, together with an estimate of the relevance of the research for wind plant developments in complex locations. The information about impact and relevance allow the various stakeholders in the deployment of wind energy to identify their own priorities for, for example, further research or research funding allocation or product development. The paper's conclusions are presented in Sect. 8.
Because of the widespread prevalence of hilly or mountainous terrain and icing, addressing these challenges will be essential for a successful transition towards sustainable energy in many countries.
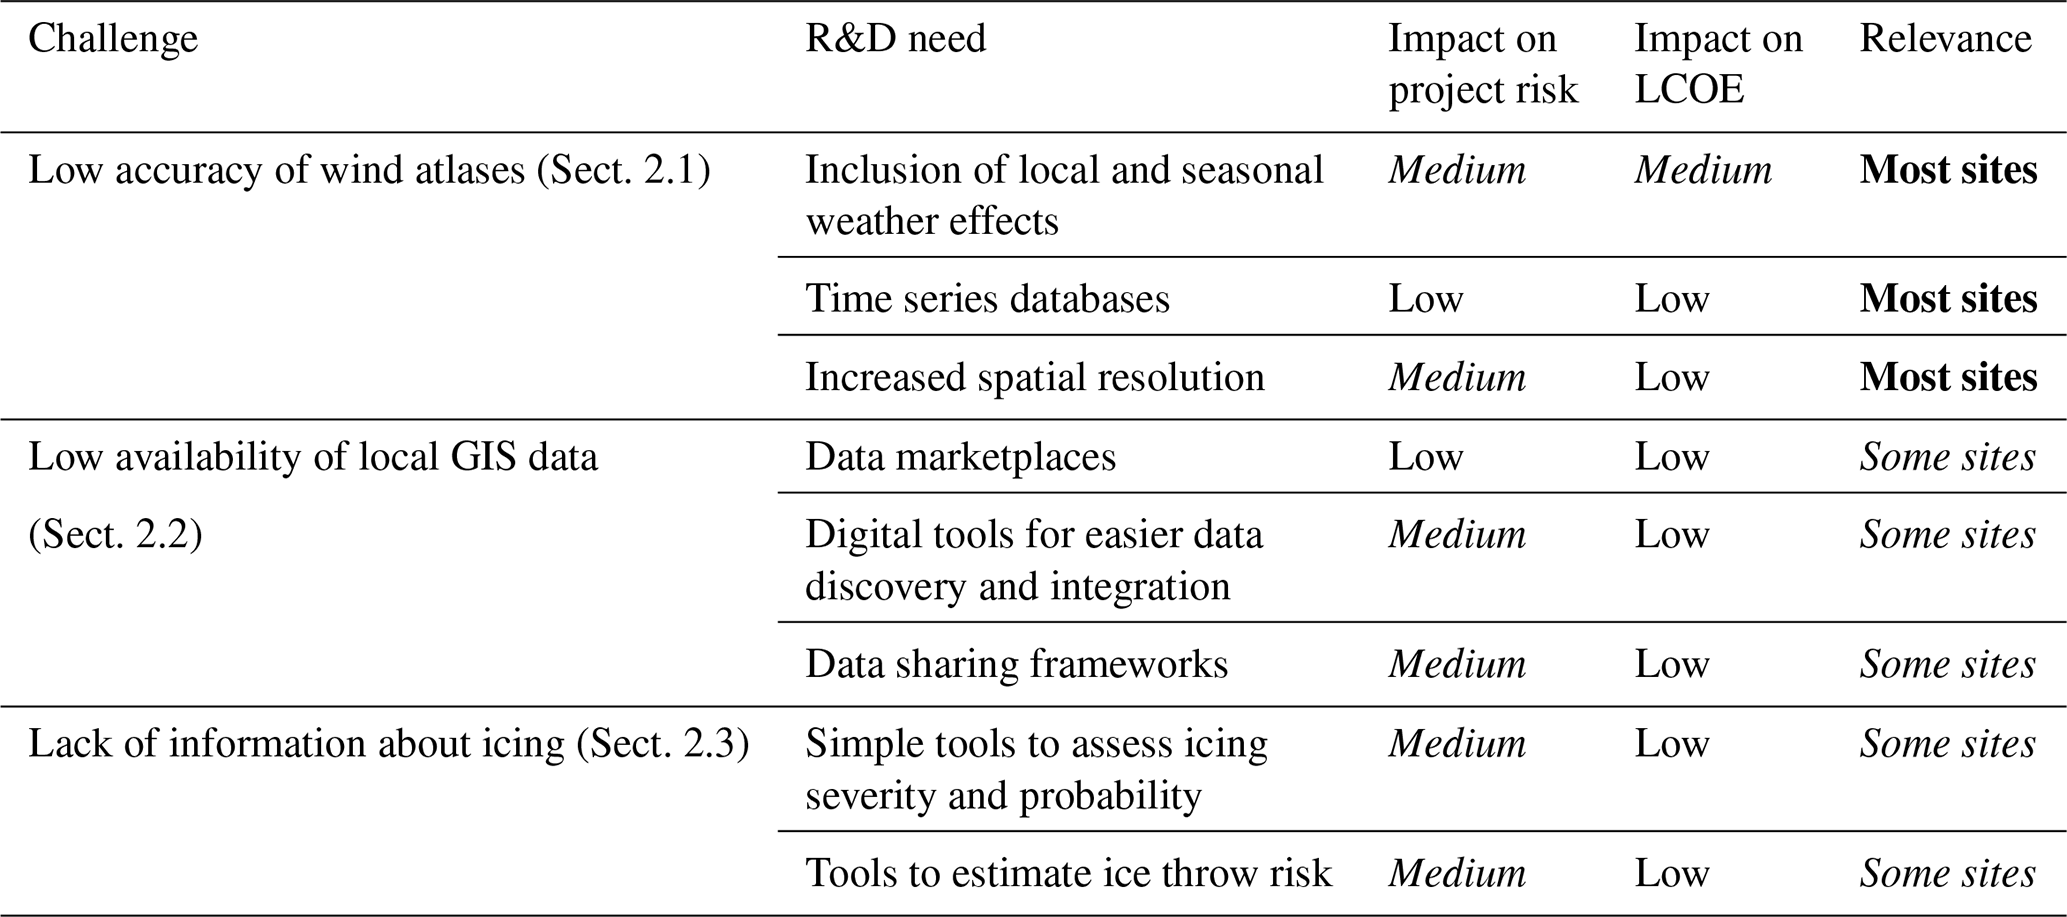
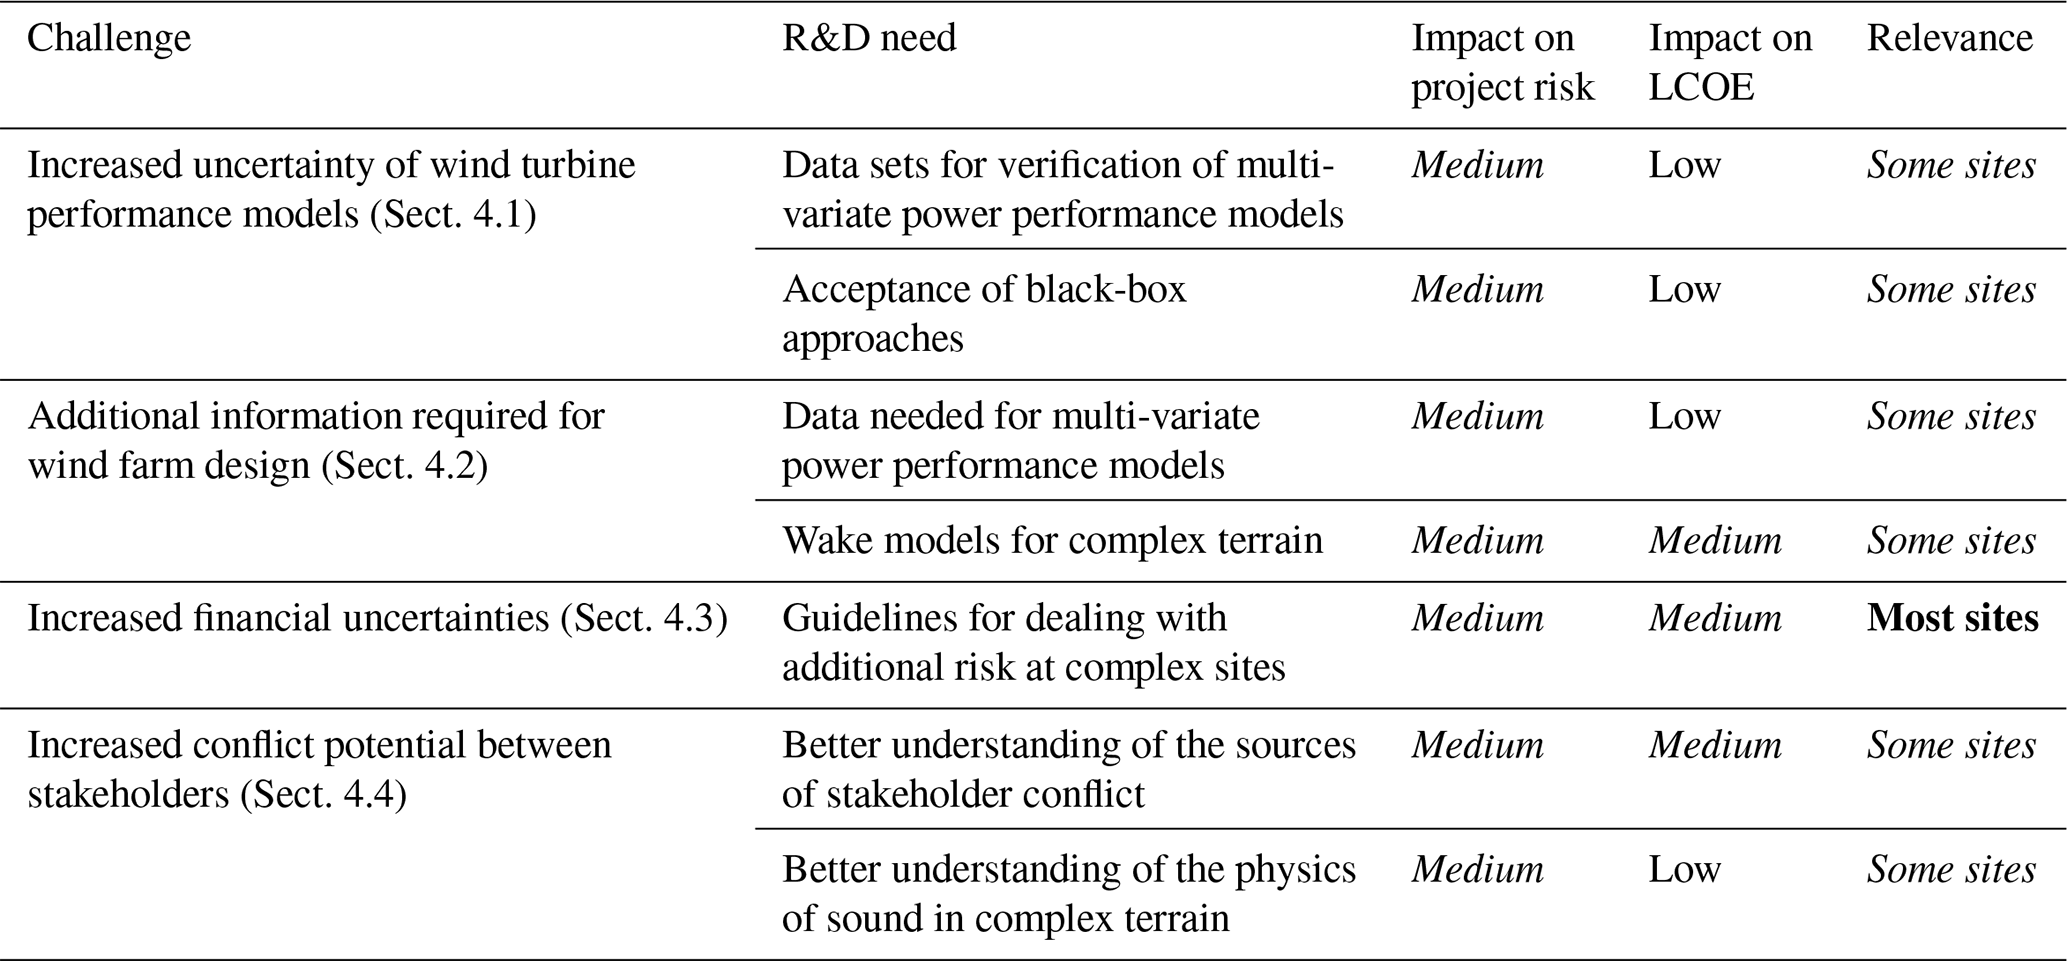
Site prospecting is the process of identifying sites that might be suitable for a wind energy project. It usually uses existing sources of information, such as wind resources, electrical transmission, and infrastructure, to assess a large number of candidate areas rapidly and cheaply before moving on to wind resource measurements on the most promising sites (next section). The associated challenges and the resulting research needs are discussed in this section and summarised in Table 1.
Table 1Challenges and R&D needs for site prospecting for wind energy in complex locations. Each need is associated with a qualitative estimate of the impact on project risk (high, medium, or low), including performance risk; the impact on the project's LCOE (high, medium, or low); and the relevance, which is the approximate proportion of complex locations for which this would be applicable (all sites, most sites, some sites, few sites). Different fonts are used for easier overview. Bold fonts indicate high impact or highest frequency, italic fonts indicate medium risk or moderate frequency, and normal fonts indicate the least impact or lowest frequency. Situations where these are not applicable are indicated with “–”.
2.1 Low accuracy of global or national wind data sets
Site prospecting typically starts by using wind data from global or national data sets to identify sites with attractive wind conditions. These data sets are often known as wind atlases and include the Global Wind Atlas (https://globalwindatlas.info/en, last access: 1 October 2022), New European Wind Atlas (NEWA) (https://map.neweuropeanwindatlas.eu/, last access: 1 October 2022), the Swiss Wind Atlas (SWA) (https://www.uvek-gis.admin.ch/BFE/storymaps/EE_Windatlas/, last access: 1 October 2022), and others (see review in Clifton et al., 2018). There are also a wide range of commercial products available. Because each country is at different stages in the national or regional deployment of wind energy and thus has different needs from an atlas, nationally sponsored atlases can differ significantly. For example, it was common in the early days of wind energy deployment to simply plot the annual average wind speed as a map and use this for prospecting (see, for example, Elliott et al., 1986). Such maps are still useful to communicate the opportunity for wind energy to the public or non-expert audiences. In regions where wind might be a significant contribution to the energy supply, there often is a need for wind atlases to include time-resolved data to enable grid integration studies. These time-resolved data sets can be created using numerical weather prediction (NWP) models (see, for example, the WIND Toolkit, described in Draxl et al., 2015). Particularly in hilly or mountainous regions, higher spatial resolution and increased representation of physical processes such as buoyancy-driven flows are required to capture local effects. Without these measures, atlases can under- or overestimate wind resources or hide potentially beneficial regional or seasonal correlations, and opportunities for wind energy might be missed.
However, the use of NWP tools to create wind atlases can be prohibitively expensive. There may be opportunities to learn from other applications, in which methods for maintaining the high accuracy of simulations but reducing the computational costs have included the lattice Boltzmann method (LBM) and machine learning approaches. LBM is a suitable model class for massively parallel simulations of such types of flows (turbulent, thermal, hilly or mountainous terrain, weakly compressible) with real-time potential (e.g. Onodera et al., 2021). The separation of scales of participating phenomena also allows a partitioned approach if necessary (Feng et al., 2021). Some initial studies on applying LBM to wind flow modelling have been done recently (Schubiger et al., 2020); however, there are still a number of difficulties to overcome before it can be used effectively (including high Reynolds number and wall function challenges). Machine learning methods are being used increasingly for extrapolating wind fields (e.g. Foresti et al., 2011), for post-processing weather forecasts (Rasp and Lerch, 2018), and for downscaling weather data (see, for example, the analog ensemble approach of Frediani et al., 2017) but not yet for efficiently generalising the flow simulation results and projecting the key simulated flow features to all terrain.
Therefore, new methods for the extremely computationally efficient prediction of local weather effects at complex sites are required in order to significantly increase the accuracy of wind energy potential estimations.
2.2 Low availability of local GIS data
Site prospecting relies heavily on geographical information systems (GIS) to identify suitable sites. Data on land cover, land use zoning, the grid connection, and slope steepness are combined with wind data sets to identify suitable sites and estimate annual energy production (AEP). Because these characteristics can change rapidly over small distances in hilly or mountainous terrain, it is important to have these data at high spatial resolution. These data can be hard to find and difficult to use.
The low availability of local GIS data can be addressed by developing data marketplaces to help find data, as well as digital tools that allow easier and standardised access. These solutions should apply the new framework discussed in Sect. 7.3.
2.3 Lack of local information about wind turbine icing
Ice formation on wind turbine blades or measurement instruments can reduce turbine availability or reduce the energy produced by an operating turbine. This can reduce the attractiveness of a potential development site but may also unfairly penalise sites during the prospecting stage if an overly conservative prediction is used. It is therefore important to have accurate but low-cost icing models during the site prospecting phase to correctly account for the potential effects of icing on the wind turbines themselves. The Technical Research Centre of Finland's (VTT) icing map (Fig. 2) is one example of how these data can be condensed and made accessible for developers.
Other tools are still needed to assess the risk of icing during the site prospecting phase. These should be able to detect and quantify icing conditions from existing measurements and determine the existence of ice throw risk when the icing conditions and potential turbine locations are known. These tools need to be accessible and simple to use without the need for complex and detailed simulations.
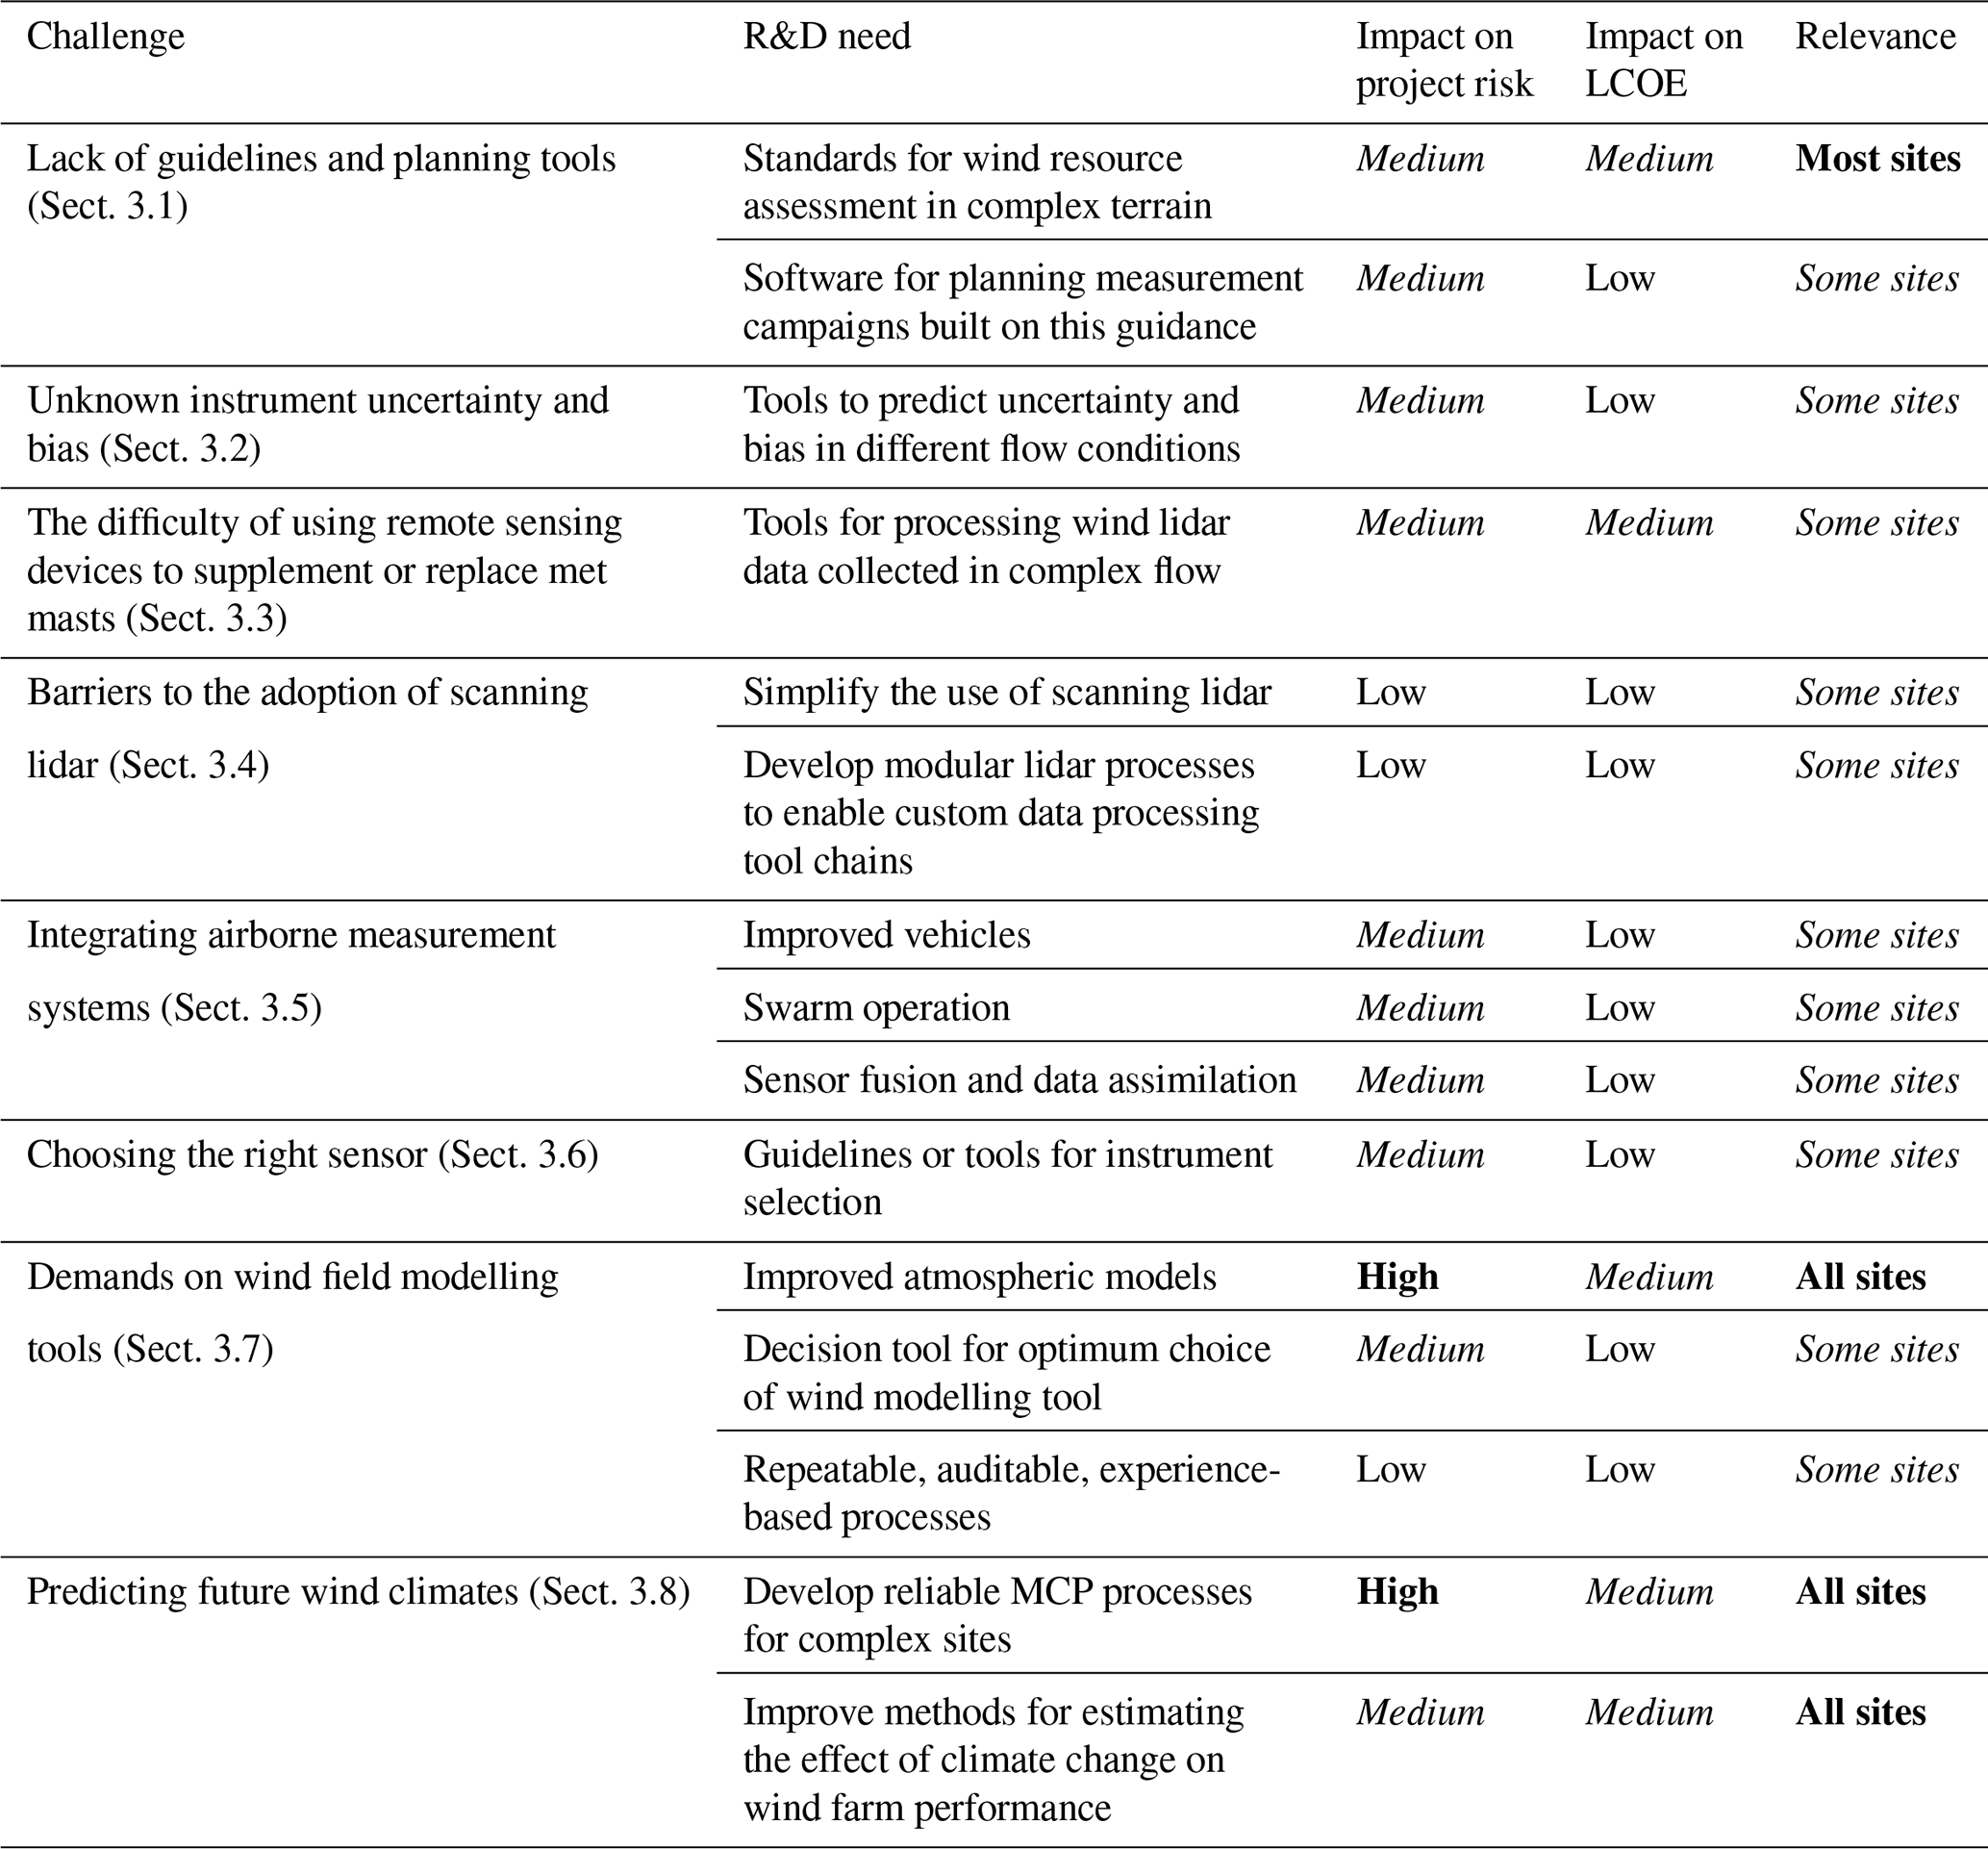
After the wind project site has been chosen in the site prospecting phase, the wind resource has to be assessed in more detail. This involves measuring the wind potential, extrapolating it to cover the entire planned site, and extrapolating it to cover the planned operating period (usually 20 to 25 years). The associated challenges and the resulting R&D needs are discussed in this section and summarised in Table 2.
Table 2Challenges and R&D needs for wind resource assessment in complex locations. The table follows the format of Table 1.
3.1 Lack of guidelines and planning tools
Accurate and reliable on-site wind measurements are the basis for any wind energy development. They are required to assess the wind resources and ensure the suitability of wind turbine models. When not available from previous experience, it is therefore necessary to gather this information through on-site measurements. The wind energy industry has gained most of its experience with wind measurements in simple terrain, and this has been captured in industry guidelines such as the Fördergesellschaft Windenergie's (FGW) Technical guidelines for determination of wind potential and energy yields (TG 6). These and other documents make it relatively easy to design and execute a resource assessment campaign. They also reduce the time taken to plan and initiate a measurement campaign, as well as increase confidence in the results. However, there is a relative paucity of applicable, open knowledge about wind measurements for wind farms in hilly or mountainous terrain, as well as no applicable standards or guidelines.
Guidelines and experience can be embedded in planning software so that the campaign can be optimised to reduce cost and uncertainty or meet some other goal. Some progress has been made towards this for wind lidar deployments with the Campaign Planning Tool (Vasiljević et al., 2020b), but this is limited to measurements using scanning wind lidar. There is therefore a clear need first for guidelines and standards for resource assessment in hilly or mountainous terrain that can then be used as the basis for other campaign planning tools.
3.2 Unknown instrument uncertainty and bias
The response of measurement instruments can be different in complex flow conditions compared to simple flow. For example, cup anemometers are by far the most commonly used devices for measuring wind speed. However, they suffer from increased uncertainty in inclined or highly turbulent flows (Papadopoulos et al., 2001), and so standards have long limited their use to a narrow range of inflow angles (e.g. Friis Pedersen, 2003). Three-dimensional sonic anemometers are designed to work with such complex flows, but historically it has been harder to analyse the data coming from these devices, and they tend to be more expensive than cup anemometers. They are also less reliable in rain or freezing conditions but can be modified to work effectively. Similarly, remote sensing devices may need to use data processing approaches that can account for flow heterogeneity (Bradley et al., 2015). Furthermore, almost all measurement devices can become coated with ice, which can modify their readings or prevent them from working at all (Swytink-Binnema et al., 2019). These factors can increase the uncertainty of the measurements themselves, as well as the uncertainty of the uncertainty predictions and bias estimates used to estimate project risks.
There is a need for tools to reliably predict the measurement uncertainty and biases. These should ideally build upon the methods used for optimising the measurement campaign but apply on-site measurements, as well as expected wind roses and data from GIS systems. Such tools could also leverage the tools used for wind modelling (see following).
3.3 The difficulty of using remote sensing devices to supplement or replace met masts
Meteorological towers can be used to measure wind speed, direction, and turbulence, as well as profiles of temperature, pressure, humidity, and other meteorological variables.
Remote sensing devices estimate the wind speed and direction by measuring the line-of-sight wind speed at different azimuth and elevation angles from the sensor. These data are then fit to a wind field model using a process called wind field reconstruction. This process often assumes a homogeneous wind field.
Remote sensing of wind speed and direction using vertically profiling wind lidar or sodar is well established for wind resource measurements, power performance testing, and site monitoring in simple terrain and offshore. Experience so far suggests that wind lidar can be used with confidence for such applications (Clifton et al., 2018).
The flexibility and ease of use of vertically profiling wind lidar, as well as the relatively small size of the equipment itself, make it ideal for use in complex locations as well. However, in complex flow conditions the flow might not be homogeneous. This could introduce errors in the wind field reconstruction process if not accounted for (see, for example, Bingöl et al., 2009; Klaas and Emeis, 2022) and could also cause differences between wind data from co-located remote sensing devices and anemometers. Processes have therefore been developed and tested to equate wind speed and direction data from vertically profiling wind lidar to measurements made by meteorological towers, and experience suggests that these are reliable in flat terrain and hilly or mountainous terrain locations, within limits defined by the manufacturer (see, for example, Black et al., 2020). However, future wind energy developments may take place in terrain or flow conditions that are outside of the manufacturer's guidelines. Research is therefore ongoing into the use of vertical-profiling wind lidar in complex flows and hilly and mountainous regions (see, for example, Clifton et al., 2015; Klaas and Emeis, 2022)
To be able to replace a meteorological mast, wind lidar data would have to be able to be processed to provide wind turbulence information that is comparable to a cup anemometer. At this time there is no clear consensus about the steps that should be taken to equate wind lidar turbulence to the turbulence derived from a cup anemometer (see, for example, Sathe et al., 2011; Newman and Clifton, 2017; Hofsäß et al., 2018). Although there are many possibilities to post-process wind lidar data to retrieve turbulence information, the lack of open data sets prevents these from being tested. There is therefore a need for a collection of open data sets consisting of co-located wind lidar and anemometers in well-described locations that could be used to validate data processing methods.
3.4 Barriers to the adoption of scanning wind lidar
Scanning wind lidars have been seen to be useful for measuring wind conditions in hilly or mountainous terrain in research projects (Vasiljević et al., 2017; Menke et al., 2020). The experience reported there and elsewhere suggests that scanning wind lidar require extensive monitoring and post-processing to obtain usable data and so are currently mostly suited for research. This is unfortunate given their tremendous measurement capabilities compared to fixed masts. Research is therefore needed into ways to simplify the use of scanning lidar, as well as to process the results. Lidar manufacturers may also need to reduce the cost, weight, and power requirements of their devices to make them easier to deploy.
A multiple, overlapping scanning wind lidar (often known as multi-lidar or dual-Doppler wind lidar) might be capable of solving challenges with wind field reconstruction and delivering turbulence information in complex flows, potentially without the need for synchronised sampling (see, for example, Stawiarski et al., 2013; Bell et al., 2020). However multi-lidar systems are expensive and difficult to use and so are usually only used for academic research.
It is unlikely that one type of lidar and one processing approach will work for all sites. But customised solutions are expensive. Instead we expect to see the development of flexible, digital, modular processes that allow appropriate solutions at each step of the process. These should leverage available data frameworks such as the e-WindLidar data format (Vasiljevic et al., 2018) to build ad hoc modular processes. This trend to the modularisation of processes – enabled by common data formats – has been seen elsewhere in the wind energy industry and is part of the trend towards greater digitalisation of the wind energy industry.
Further research is needed to show the value added by single or multiple scanning wind lidar, as well as product development to reduce costs and improve ease of use. Research is needed into how to benefit from the digitalisation of wind lidar.
3.5 Integrating airborne measurement systems
Although wind lidars partially mitigate the challenges of using meteorological masts in hilly or mountainous terrain, they can also be challenging to deploy. They are also only able to measure wind data, meaning that other weather data might be missing. In contrast, meteorological measurement systems can be mounted on unpiloted aerial vehicles (UAVs) including fixed-wing aircraft (Rautenberg et al., 2019), helicopters (Hofsäß et al., 2019), and multi-rotor drones (Molter and Cheng, 2020). This allows UAVs to be used to measure wind vectors and turbulence, as well as other parameters such as air pressure, temperature, and humidity. However, such systems can usually only measure for short periods of time (up to a few hours at most), and measurements can only be made locally to the UAV. It would therefore be advantageous in future to improve vehicles so that they can fly further or for longer or carry more sensors. UAVs can be moved to sample other locations, but this leads to a patchy data set. Multiple drones can be flown simultaneously to cover multiple points or a larger area, but this adds complexity and requires more pilots. It may also be possible to combine the flexibility and access offered by drones with the remote wind sensing capability of lidar (Vasiljević et al., 2020a).
Research is needed into ways to fly multiple systems simultaneously and autonomously (sometimes known as “swarms”) and to combine the data from these airborne systems with other data sources. This process, known as “sensor fusion”, “data fusion”, or “data assimilation” (when used as an input to models), is frequently used in weather forecasting but has not been an active area of research for wind resource assessment. However, given the known high spatial variability of winds in hilly or mountainous terrain UAVs combined with sensor fusion may be a beneficial tool and could reduce the uncertainty of wind resource estimates.
3.6 Choosing the right measurement instrument
The choice of optimal wind measurement device, as well as its location and the measurement time period, is a critical part of a wind resource assessment and site operations and is especially challenging for complex sites due to the increased uncertainties as described above. There is currently no existing guideline, standard, or tool available to project planners for doing this. These would be required to address this challenge.
3.7 Demands on wind field modelling tools
Wind fields across planned wind farm sites are typically generated using a combination of on-site measurements with some form of flow model. The models are used to extrapolate from on-site data from a few locations that might only extend to a limited height above ground to the tip of the potential wind turbines across the whole site. Accurate wind resource assessment is therefore strongly dependent upon the capability of the wind modelling tools.
As was noted in the introduction, hilly or mountainous regions are associated with steep and changing slopes. They can also have forestry, patchy ground cover, and seasonal variation in ground cover. This can lead to highly localised complex flows with strong seasonal and diurnal cycles. These can be considered to be “extra” physical processes compared to the flows found in flatter, more uniform lowland sites. It is well established in the wind energy industry that neglecting these physical processes can lead to poor wind modelling, which has led to efforts to include buoyancy or forest canopy effects in models (see Sanz Rodrigo et al., 2017, for a review of ongoing research in this areas). More work is required to develop and test these and other physics models.
Increased vertical and horizontal resolution can be helpful to capture the effect of land cover and terrain features, but this increases the computational requirement of a simulation. Similarly, some modelling approaches might require a time-resolved simulation, instead of assuming steady-state conditions. This further increases the computational cost, which increases the cost to the customer and can slow the process down. Research is needed into ways to make such high-resolution and time-resolved simulations both cheaper and faster.
More complex flow models usually need realistic boundary conditions to deliver accurate results. These may include pressure gradients, surface temperature and moisture conditions, solar radiation or surface heat fluxes, upwind wind profiles, forestry parameters, and other data (Bechmann, 2017). Often these models have many “tuning” parameters, and it is not clear if one set which was successfully used in one case study is equally good for all weather situations at a different place. Different available topographical data might require different tuning parameters for some parameterisations of the model. As a result, complex models are harder to use than simpler models, both in terms of the data required and the knowledge required to assess the results.
Additionally, there is often no clear evaluation data available for such models, and therefore it is difficult for wind resource engineers to decide on the most effective model for a given site. Although software developers often provide site-specific case studies, the lack of a clear definition of complexity and an applicable, relevant comparison metric means that it is difficult to transfer experience from one site to another.
The high-resolution time-resolved flow models used for wind resource assessment are often derived from forecasting models. Therefore, improvements to forecasting models would benefit wind energy directly. As an illustration of the potential for improvement in atmospheric models, Fig. 3 shows the root mean square error (RMSE) of 10 m wind speed of the numerical weather prediction model ICON-D2 in March 2021 for sites below 100 m a.s.l. (above sea level), i.e. for rather flat terrain, and for sites above 800 m a.s.l., i.e. in hilly and mountainous terrain. The wind speed at the higher-elevation sites is less well predicted than sites at lower elevation.
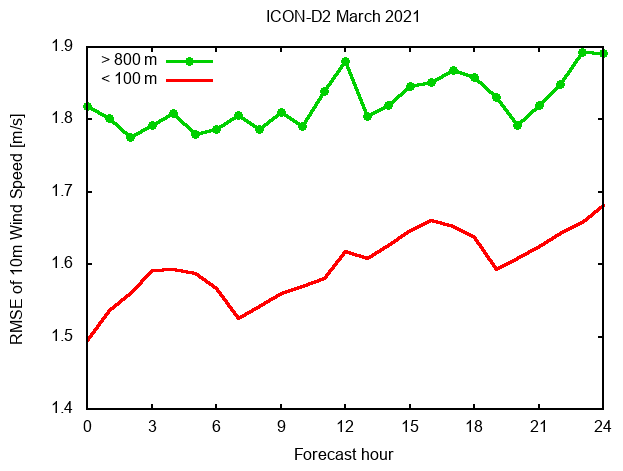
Figure 3RMSE of 10 m wind speed from the numerical weather prediction model ICON-D2 in March 2021 compared to observations at sites below 100 m (red) and above 800 m a.s.l. (green). The ICON-D2 domain covers central Europe including most of France to Poland and from northern Italy to Denmark, and thus locations above 800 m are typically in hilly or mountainous terrain. For details of the ICON-D2 model, see Reinert et al. (2021).
Several research challenges for atmospheric models are clear:
-
Major improvements for wind energy modelling can be expected from better boundary layer schemes and turbulence models. Schemes for the surface layer are often based on Monin–Obukhov theory, which is strictly valid only for homogeneous sites. Also, in turbulence schemes for atmospheric models, horizontal gradients of fluxes and other second-order moments are usually neglected compared to vertical gradients. It is not clear at which resolution in hilly or mountainous terrain this simplification is no longer valid.
-
All models have tuning constants with values obtained comparing model results to experiments. However, care must be taken not to deteriorate model results when changing them (Sandu et al., 2013). Especially for weather prediction models there can be conflicting interests. One quantity might improve, but another one might deteriorate. Hence, even though it might be beneficial in hilly or mountainous terrain, changing established values must be done carefully.
-
Even at mesh sizes of only 2 or 3 km, the subgrid-scale orographic drag must still be parameterised (Olson et al., 2019). The tuning constants of a subgrid-scale scheme depend on the ratio of resolved to unresolved orography which depends on the resolution of the original data used to produce input fields for a subgrid-scale scheme. This can be critical for the simulation of winds at typical hub heights.
-
Accurate numerical schemes are always critical in hilly or mountainous terrain. Especially the calculation of horizontal pressure gradients should not yield spurious circulations in terrain-following coordinates (Zängl, 2012).
Despite the potential for more accurate flow modelling, the required skill upgrade, cost of data, and the lack of evaluation data all act as barriers to the adoption of more advanced wind modelling tools. Research is therefore needed in ways to help people choose and use appropriate wind models. This could take the form of software or services that apply rules to set up and run such models, hiding the complexity and thus making it easier for users to adopt them (see, for example, WindNinja; Wagenbrenner et al., 2016; or WAsP computational fluid dynamics (CFD); Bechmann, 2017). Furthermore, rules- or process-based modelling would give data consumers confidence that the tools have been used appropriately. Research has started into a decision tool for the optimal choice of wind resource assessment (WRA) tool for a given project at complex sites (Barber et al., 2020a, b, 2021). However, in order to fully develop an effective decision tool, a much larger set of data related to different site complexities, model set-ups and costs is required.
Finally, wind modelling needs to follow repeatable, auditable processes that provide the end user with confidence that the results are trustworthy and based on experience gathered at other sites rather than each site being an independent study. This will require the wind energy industry to develop software and services to consistently set up wind flow models. This can be combined with the data sharing framework discussed in Sect. 7.3.
3.8 Predicting future wind climates
An important part of a wind resource assessment is predicting the future wind climates. This estimate may need to extend up to 30 years in the future. It is typically carried out by comparing site data to some kind of long-term reference weather data, such as observations from a nearby automated weather station or reanalysis models, and using this to predict the future wind resource. This process is known as measure–correlate–predict (MCP) and takes many forms.
Errors depend mainly on the length of the measurements and the correspondence to the long time series at the reference site. Both sites must have a similar wind climate; e.g. a coastal station with frequent sea breezes can hardly be correlated with an inland mountain site.
Such extrapolations depend upon the regional climate in the future being comparable to the past. However, it is not clear if this will be true as climate change occurs. Sites in mountainous regions or that depend on thermal winds may experience marked changes in wind regimes if long-term or seasonal snow cover is reduced. Climate change may also result in changes to the frequency and intensity of storm systems and icing and extreme weather events. While many of the effects of climate change are negative, some may also have positive consequences for wind energy; it is, for example, possible that turbines at higher elevations might experience less icing in future than previously, raising their energy production.
Although some attempts have been made to predict the effects of climate change on wind climates, results suggest that these effects may be strongly localised and site-specific and as such cannot be captured using today’s relatively coarse global climate models (Pryor et al., 2020). Although regional climate models offer higher spatial resolution, they may be out of reach of developers and the wind industry because of the specialist knowledge required to use them.
The first research need related to improving the prediction of future wind climates at complex sites is affordable MCP processes that can account for the complex wind situations and climates found at complex sites. They need to be reasonably easy to use so that they can be applied quickly to different locations as part of the site design process. They also need to be validated using existing sites.
Furthermore, it will be important to develop MCP processes that include the effect of climate change on complex sites. Because the effects of climate change in mountainous regions are potentially highly localised and site-specific (Pryor et al., 2020), this is often provided as expert opinions that tend to be expensive and time consuming. Longer term, the EU's Copernicus Climate Change Service (C3S) project – which aims “to develop authoritative, quality-assured information about the past, current and future states of the climate in Europe and worldwide” (ECMWF, 2020) – may make it easier for developers to access relevant data and tools. However, currently there are no industry-standard approaches to assessing the impact of climate change on wind energy developments. Research is therefore needed into methods for estimating the effect of climate change on wind farm performance.
Following the resource assessment, an energy yield assessment is carried out by firstly using the results of the resource assessment to choose turbines’ locations and then estimating AEP. This information is then used for financial and risk estimations. Finally, public acceptance for the project has to be gained for it to proceed. These challenges are discussed in this section and summarised in Table 3.
Table 3Challenges and R&D needs for project planning in complex locations. The table follows the format of Table 1.
4.1 Increased uncertainty of wind turbine performance models
The power produced by a wind turbine is a function of wind speed, air density, turbulence intensity, shear, veer, and many other factors. Although it is common to apply a site density correction to the power curve following the process set out in the International Electrotechnical Commission (IEC) 61400-12-1:2017 standard (IEC 61400-12-1:2017, 2017), the other factors are difficult to account for and therefore less frequently considered. Studies have shown that such atmospheric conditions can affect the turbine output by 10 % or more at the same wind speed, leading to a significant uncertainty in power prediction even if the wind speed and density are known (e.g. Antoniou et al., 2009; Hedevang, 2014; Vanderwende and Lundquist, 2012; Wagner et al., 2011; Wharton and Lundquist, 2012; Clifton et al., 2014; Barber and Nordborg, 2020).
Tools that can predict performance at specific sites are therefore required. As well as wind speed, these need to take into account other atmospheric conditions at a turbine's location – such as shear, veer, and turbulence intensity – to estimate the power output at that location. They could be based on experience and leverage data sets from existing power performance tests to generate binned statistics (as explored by the Power Curve Working Group in Lee et al., 2020) or use physics-based approaches as in the IEC 61400-12-1:2017 standard (IEC 61400-12-1:2017, 2017). Physics-based approaches have the advantage of being repeatable and easily understood by people but may not make the best use of the large amount of data available to the wind energy industry.
In contrast, machine learning has the potential to account for the effects of unknown or hard-to-model physics by using power performance data sets to train turbine performance models. These trained models can be used in place of power curves or physics-based models. Studies suggest that power predictions by machine learning tools trained on wind speed, turbulence, and other atmospheric parameters can reduce the error compared to simple power curves (Clifton et al., 2013; Barber and Nordborg, 2020). The application of machine learning methods to real measurement data is on-going (see, for example, Barber et al., 2022). It may be possible to leverage data from power performance tests across a fleet to make more accurate machine learning models. However, machine learning approaches suffer from being “black boxes” in that it is often impossible for a person to understand what they contain. This can make it hard to include them in a turbine supply agreement or a warranty, for example.
Collaboration between research and industry is required to develop and test more complex power performance prediction tools that use multiple parameters or machine learning and to mitigate the barriers to their adoption.
4.2 Additional information required for wind farm design
Wind farms are usually designed with the goal of minimising the long-term cost of energy from the site, usually termed the levelised cost of electricity (LCOE). This is done through an optimisation process to minimise the ratio of project cost to lifetime income (Clifton et al., 2016). Accurate wind field models (Sect. 3.7) and long-term wind climate data (Sect. 3.8) are therefore foundational for this step.
Wind turbine energy production at a site is a function of the energy that can be harvested by a turbine and the losses from that turbine. Wind resource data can be used to predict the energy available from a turbine using power curves (with and without adjustment for turbulence, shear, and veer) or aeroelastic models (e.g. NREL's FAST and others), while other models are required to predict the wakes from those turbines and their impact on downwind machines. It is also important to account for losses due to environmental effects such as blade soiling, as well as the formation of ice on the turbine blades or instrumentation. Knock-on effects such as turbine shutdowns to minimise ice throw or slower maintenance in challenging weather should also be included in the plant energy yield assessment process.
Current wind turbine performance models are designed around inflow angles, shear, and turbulence that lie within standard ranges (defined in, for example, the IEC 61400-12-1:2017 standard). Although there has been some effort to develop power curves that cover a wider range of conditions, these have not been widely adopted or tested openly for complex sites (Sect. 5.3). Wakes from turbines have been extensively measured in simple terrain on land and offshore. However, there are much fewer wake measurements from more hilly or mountainous terrain, where it is possible that increased turbulence and inclined flows may lead to faster dissipation (Menke et al., 2018).
The challenge is therefore to provide wind farm designers with the information that they need to optimise a wind plant at a complex site. This includes appropriate wind fields and an icing climatology for the location, turbine performance models that can account for non-standard operating conditions, and wake models that capture the effect of complex flow and terrain on wakes.
Many different wake models exist, and many have been validated for use in simple terrain. However, it is not clear how well these models perform in hilly or mountainous terrain or in complex weather situations. Validated wake models would allow increased confidence in energy yield analysis carried out in hilly or mountainous terrain locations. Wake models could be validated through field measurements, for example, by combining data from met masts, wind lidars, and wind turbines (Menke et al., 2018). These data would also allow the creation of new wake models. These improved wake models could be used to give better predictions of the wind resources available to downwind turbines.
4.3 Increased financial uncertainties
All of the previous factors lead to uncertainty in the potential income from a planned wind energy project.
Electricity from wind energy is usually sold through long-term energy supply contracts with a customer. If the contracts are too expensive, the wind farm owner risks being underbid by another supplier. Therefore, the developer is under pressure to drive the cost of energy as low as possible. However, if these contracts are too cheap (i.e. energy is sold at less than the cost to produce it), the owner risks losing money. To protect against such risks, the project financiers can increase the interest rates on any loans, which in turn increases the project cost and the LCOE.
Project developers typically mitigate these risks by carrying out extensive and detailed pre-construction studies. While these may be more expensive at complex sites than would be required in simple terrain, they can reduce the uncertainty enough to reduce the overall project costs and thus justify the extra expense, especially if the site has a high-capacity factor. However, there are no guidelines or standards for doing this.
In order to approach the challenge of planning and financing with uncertainties, a guideline for dealing with additional risk related to complex sites is recommended. This would allow project developers to mitigate the risks by carrying out extensive and detailed pre-construction studies in a standardised and agreed-upon way.
4.4 Increased conflict potential between stakeholders
Developing and operating wind energy projects involve a large number of stakeholders. As well as those directly involved with the development, they affect local residents, visitors, and people further away through visual impact, shadow flicker, sound, traffic, and other mechanisms.
The acceptance of wind farms by stakeholders is one of the major barriers to the adoption of wind energy. Acceptance must be considered for all wind farm developments, both on land and offshore. Experience suggests that wind farm acceptance can be increased through appropriate and sympathetic wind farm visual and acoustic design (Hübner et al., 2019), coupled with positive stakeholder engagement (Pohl et al., 2018). These challenges may become harder at complex sites because hilly or mountainous regions may be important for tourism or recreation, wildlife, or other uses, leading to potential conflict between stakeholders (see, for example, Straka et al., 2020).
Also, it is possible that the physical processes linked to social acceptance may be harder to predict in hilly or mountainous terrain. Sound propagation from wind turbines is fairly well understood over flat and uniform terrain in uniform wind conditions and can be modelled with some accuracy. In contrast the physical effects of terrain or patchy land cover on sound propagation are less well understood, and sound reflection by terrain or damping by forestry have only recently started to be explored (see review in Hansen and Hansen, 2020).
Securing public acceptance is thus one of the main challenges that the development of wind energy has to face in the next decades. This is part of the growing need to obtain public acceptance – and even more important support – for the far-reaching technological changes connected to the transformation to carbon-neutral energy generation and the associated social and economic impact. Developing wind energy in hilly or mountainous terrain is just one focus point where, for example, the prominent and highly visible siting of wind turbines on peaks and ridges in mountainous regions may evoke concerns about landscape conservation and touristic and recreational uses. Technical measures such as reducing and managing the wind turbine's sound and light emissions or changes in turbine design and wind park layout may contribute to a certain degree to the alleviation of these concerns. However, social acceptance of wind energy in hilly or mountainous terrain might also grow from ongoing social transformations through policy making, fostering of the public understanding of the need for renewables, and the personal participation and benefit from renewable energy projects. One of the initiatives on this interface between technology and social research is the IEA Users TCP (Technology Collaboration Programme), which also has a big focus on the social acceptance of clean energy technologies.
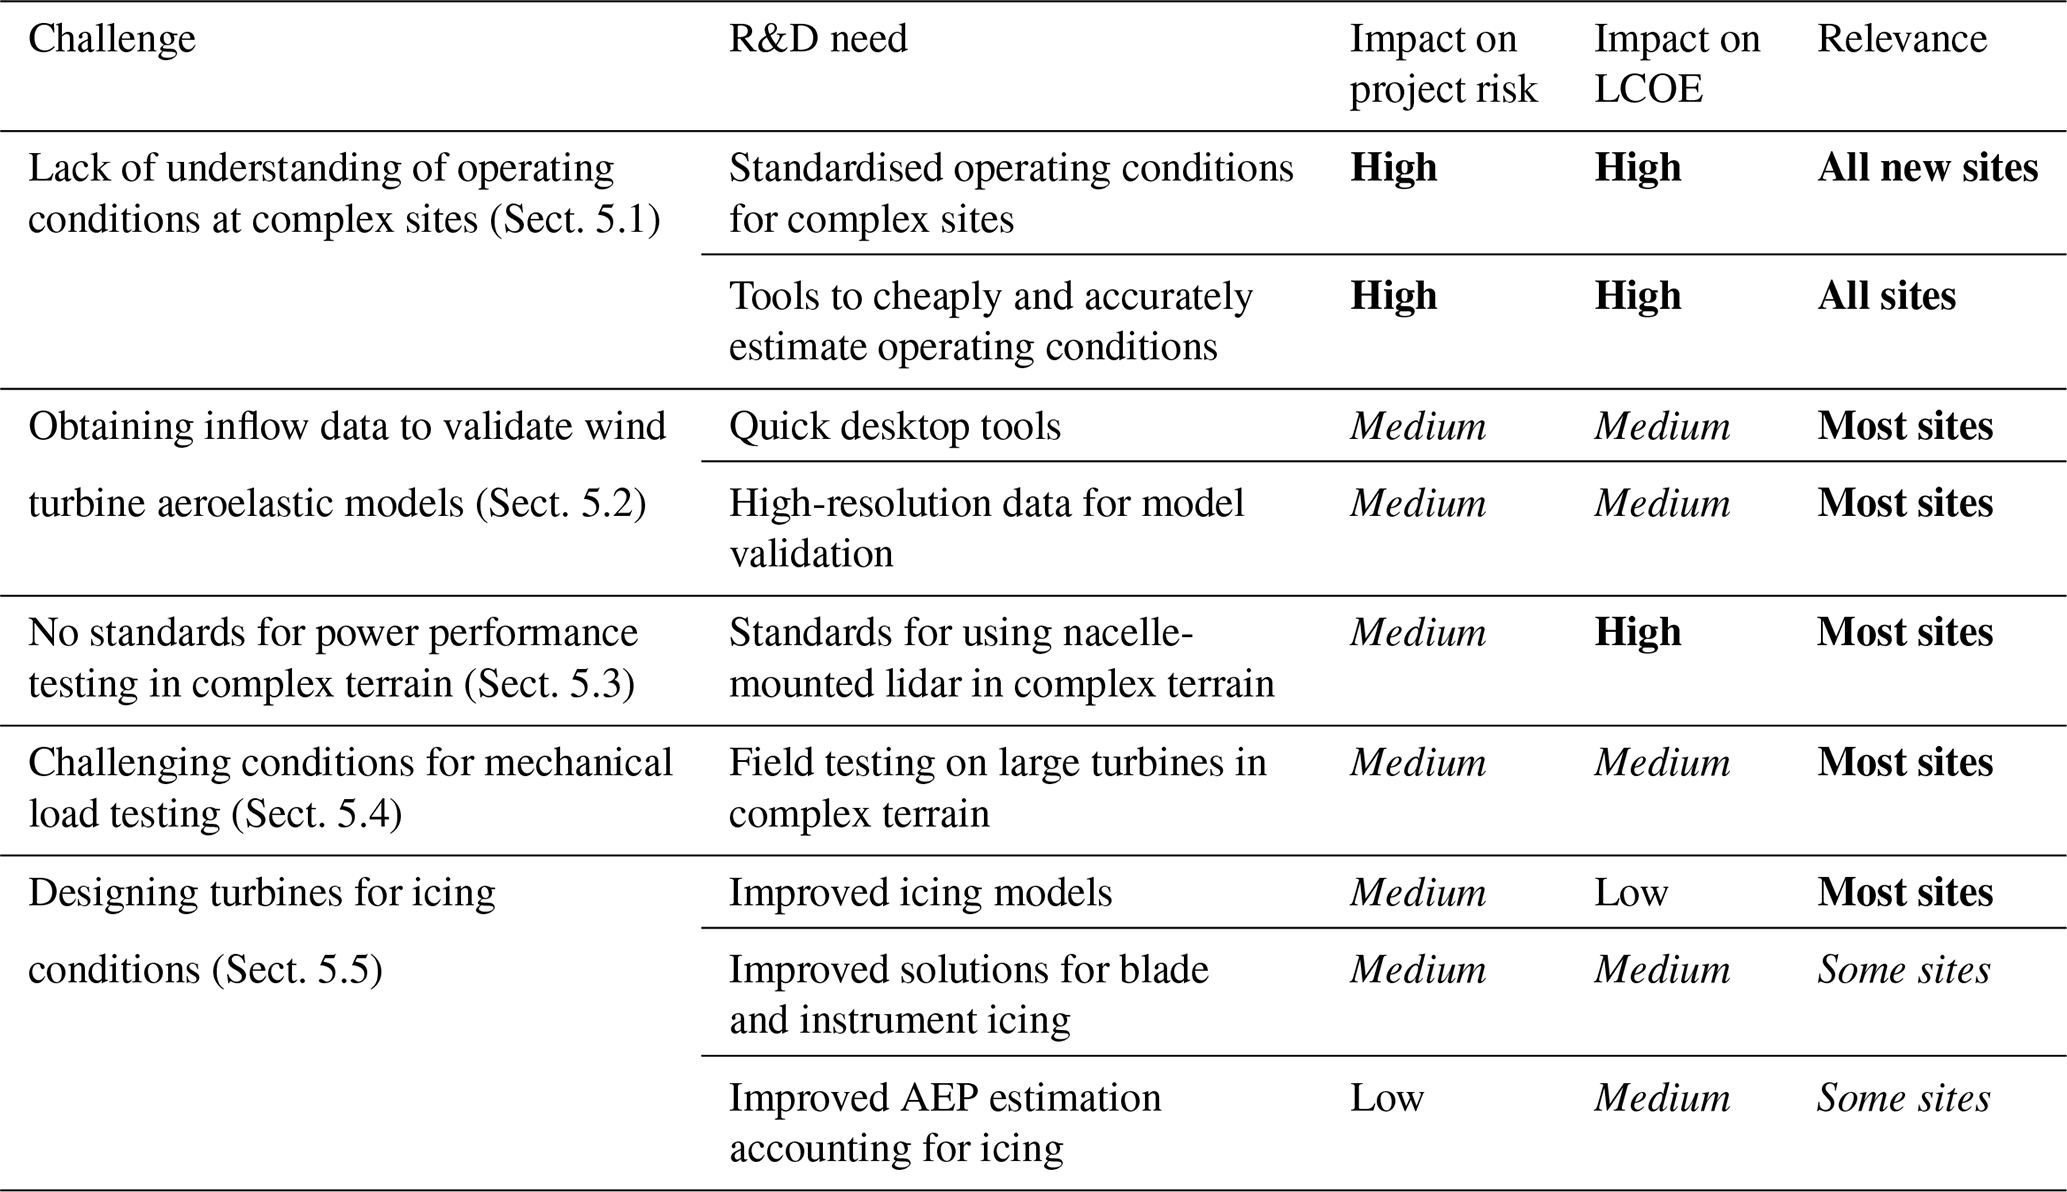
After a wind resource assessment has been completed, a suitable wind turbine needs to be selected. Wind turbines are designed to operate safely and predictably on the basis of expected operating conditions at a site. The complex flows and cold climates associated with hilly or mountainous terrain create a range of challenges for this process. These challenges and the resulting R&D needs are discussed in this section and summarised in Table 4.
Table 4Challenges and R&D needs for the design of turbines for use in complex locations. The table follows the format of Table 1.
5.1 Lack of understanding of operating conditions at complex sites
Historically wind energy standards focused on the operating conditions found in early development areas such as northern Europe or the American midwest, giving rise to a few standard operating envelopes that are captured in turbine classes. Small deviations from the standard operating conditions – such as those found in hilly or mountainous terrain or cold climates – are given special classes. The design conditions for each special class usually have to be determined on a case-by-case basis.
Hilly and mountainous regions may also experience other challenging weather and climate phenomena. These may include events associated with convective (thunder) storms, for example, heavy rain, hail (Letson et al., 2020), or lightning. All of these can lead to blade damage, affect electrical systems, or prevent people from moving around on site. Standards exist for lightning protection (IEC 61400-24:2019, 2019b), but information about the geographical spread or frequency of potentially damaging events is limited (see, for example, Macdonald et al., 2016).
There have been efforts to develop guidelines or standards for wind energy developments in cold climates (Bredesen et al., 2017), but in general the trend has been to require local measurements of operating conditions, as well as extrapolation to the plant life cycle.
Extra measurements or modelling at a potential wind farm development location raises costs and slows the development process, compared to a simple site in temperate climate. The lack of understanding of the operating conditions at complex locations results in a combination of mechanically conservative designs (i.e. with larger safety factors) but may also result in unexpected component failures.
Research is therefore needed to develop tools that can cheaply, accurately, and quickly define the operating conditions over hilly or mountainous terrain. These tools also need to account for the effect of forestry and be capable of predicting the complex flows and weather associated with the site. This could include realistic time series or spectra of wind resources and weather, akin to the standard operating conditions defined in the IEC 61400 family of standards.
5.2 Obtaining inflow data to validate wind turbine aeroelastic models
Validating wind turbine aeroelastic modelling for the design process requires accurate, high-resolution information about the inflow to a test turbine, coupled with data from loads and electrical sensors. These simulations are particularly challenging to set up and carry out for turbines at complex sites due to non-standard turbulence intensity, shear, veer, temporally varying temperature gradients, and extreme changes in wind speed and wind direction. In the absence of standards, a wind turbine manufacturer could try to use site measurements. However, meteorological towers that are tall enough to measure the wind conditions across the turbine rotor disc are hard to build and operate, while assumptions need to be made about the structure of atmospheric turbulence. Ground-based wind lidar can be used to provide wind data, but their ability to provide turbulence data that can be used in turbine design is a subject of ongoing research (e.g. Sathe et al., 2011; Clifton et al., 2018; Kelberlau and Mann, 2020).
5.3 No standards for power performance testing
Power performance testing relates the power produced by a wind turbine to the free-stream wind conditions. Power performance testing is done as part of the certification process of a new wind turbine type.
Power performance testing in simple, flat terrain using upwind masts or vertically profiling remote sensing devices is covered by the IEC 61400-12-1 standard (IEC 61400-12-1:2017, 2017). This standard specifically excludes winds from directions where there are steep slopes or obstacles from the power performance database. This is because these conditions make it extremely challenging to identify an appropriate free-stream wind speed, as there may be terrain-induced speed-up or slow-down effects on the flow. As a result, there is no widely recognised way to perform a power performance test in hilly or mountainous terrain.
Investigations suggest that it may be possible to fit wind speed measurements made by a nacelle- or spinner-mounted wind lidar looking forward into the turbine’s induction zone to a model of the induction and use this model to estimate the free-stream wind speed (Borraccino et al., 2017). This approach would allow a power curve of power versus free-stream wind speed but has not been widely tested or standardised.
The recently published IEC 61400-50-3 standard (IEC 61400-50-3:2019, 2019c) for the use of nacelle-mounted lidar for power performance testing describes the use of wind lidar to measure the turbine inflow wind speed. The wind is required to be measured at more than 2 D (diameters) upwind of the turbine. Modern wind turbines can have rotors with diameters of more than 150 m, and so this could require wind measurements at well over 300 m upwind. However, complex flow conditions could introduce significant flow variation between the measurement point and the turbine, and so it is not clear that the method can be reliably used in hilly or mountainous terrain.
5.4 Challenging conditions for mechanical loads testing
The certification process of a new wind turbine type requires mechanical load measurements. These are carried out according to IEC 61400-13 (IEC 61400-13:2015, 2015). The wind measurements required for this testing are covered by the IEC 61400-12 standard discussed above, and therefore the same challenges apply. Additional challenges to mechanical load testing at complex sites relate to the complex behaviour of the loads on the rotor blades due to effects such as shear and veer.
In order to help solve the challenges related to power performance testing and mechanical load testing at complex sites, field measurements on large wind turbines situated at complex sites are required. This would allow an improved understanding of the actual behaviour of operating wind turbines in the field, enabling original equipment manufacturers (OEMs) and researchers to improve their design tools and thus optimise design.
5.5 Designing turbines for icing conditions
Icing impacts the turbine in several ways, and these effects should also be taken into account in turbine design. IEC 61400-1:2019 (IEC 61400-1:2019, 2019a) outlines a number of issues caused by icing that need to be taken into account in turbine design. These include reduced turbine performance due to blade icing, unequal ice distribution on wind turbine blades leading to unequal loads and increased vibrations, ice shedding from blades, icing effects on wind measurements, increased sound levels, and prolonged standstills.
These conditions cause issues for turbine control due to ice accretion altering the blade aerodynamics. Turbine control during icing events can have different and competing goals, depending on operator objectives and local regulations; for example, the priority might be to maximise production, to minimise risks, or to minimise additional loads on turbine components. Additionally, icing conditions might require extra instrumentation or changes in materials. Active icing mitigation systems such as blade heating will often require changes in turbine design.
An important requirement when designing a turbine to operate in icing conditions is to understand and quantify how ice builds up on the turbine blades and how this will affect the turbine aerodynamics. This would need to be taken into account when doing simulations during turbine design.
There are existing solutions for these issues. For example, icing on the blades can be mitigated by a blade heating system, anemometers are available on the market that function better in icing conditions, and the risks caused by ice shedding and the issues with increased noise levels can be taken into account when planning the site; see Lehtomäki (2016) for an overview of solutions. A 2019 IEA Wind TCP Task 19 survey on experiences with blade heating and other cold climate solutions found that many people working in the field still feel that there is room for improvement in the maturity and reliability of these solutions (Godreau and Tete, 2020).
Many of the solutions for icing need to be designed for wind turbines and wind plants. For example, safe operation in icing conditions and optimal blade heating control will require reliable ice detection. Any ice detection method should be able to react quickly to icing conditions and also be able to tell when icing conditions and active ice accretion end in order to optimise turbine and blade heating control. In addition, if ice detection is done for safety reasons, it is important to be able to tell when blades are ice free.
More detailed icing models are being constantly developed. These models are mainly being validated against wind tunnel measurements (Son and Kim, 2020). Measurements of water droplets during icing events would be very useful. Actual measurements of ice shapes from an operating turbine are required to validate these models.
There is a large uncertainty related to icing conditions and the icing of turbine air foils. The year-over-year variation of icing conditions can be large and will introduce a large uncertainty in operations. The impact of icing on turbine production also has a large variation that further introduces uncertainty in any estimates on production in an icing climate site. More research is needed to reduce the margin of error in forecasting and modelling production losses (Strauss et al., 2020).
In order to determine the need for icing mitigation, the existence of icing conditions at the site needs to be determined early during site prospecting. The methods for converting these pre-construction measurements into estimates on production losses still have room for improvement. Also, icing conditions need to be known before construction starts in order to determine the need for a blade heating system and the specific operating envelope of a blade heating system (Roberge et al., 2019).
While some of this research and development can be done by wind turbine OEMs or by specialist service providers, there is still a need for independent validation on full-scale turbines. This is part of the rationale behind founding and operating the Nergica test centre in Canada (see, for example, Arbez et al., 2016) and the Research Institutes of Sweden (RISE) cold climate test centre in Sweden (RISE, 2020).
Table 5Challenges and R&D needs for operational wind plants in complex locations. The table follows the format of Table 1.
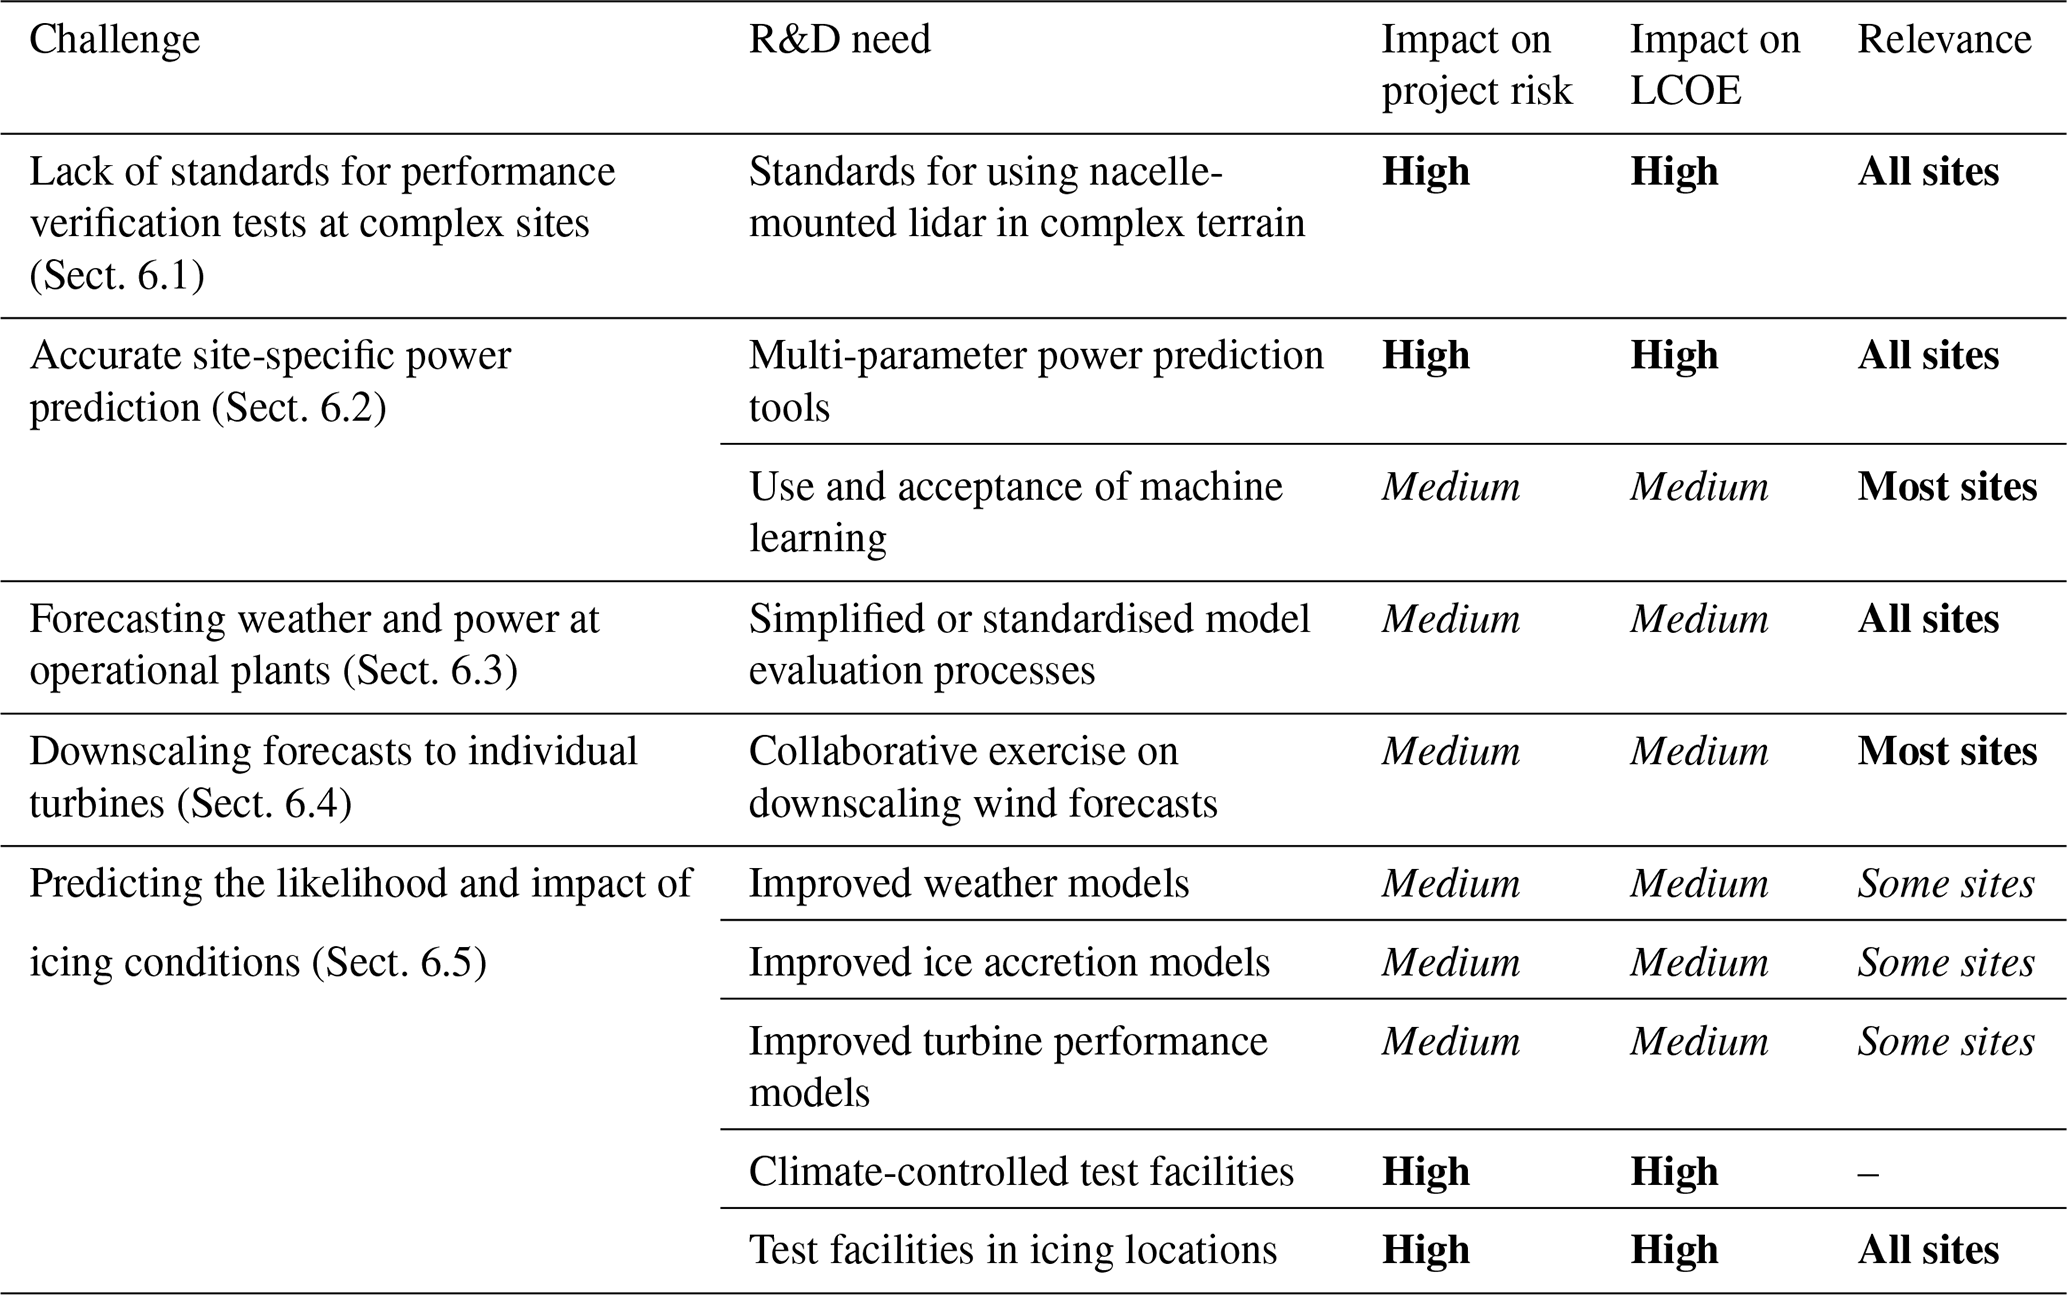
Once a wind energy facility has been built, it is essential that the turbines operate as expected and in a predictable, safe fashion. The related challenges and the resulting R&D needs are discussed in this section and summarised in Table 5.
6.1 Lack of standards for performance verification tests at complex sites
Power performance measurements (see Sect. 5.3) are also frequently carried out on newly commissioned wind turbines or on wind turbines that have been operating for a long period of time. These performance verification tests can reveal problems with the turbine yaw alignment or the turbine control system that can result in several percentage points of lost energy compared to the optimal set-up. However, as with power performance testing during the turbine design phase, the lack of standards for doing this at complex sites makes it very difficult to interpret the results from such tests.
A coordinated research effort and parametric studies on the effect of complex sites on power performance are required. This could involve carrying out a coordinated set of parametric studies using a combination of wind tunnel tests, CFD simulations, and field tests at a range of sites with varying complexity and exposed to a range of different complex flow conditions.
6.2 Accurate site-specific power prediction
Accurate wind turbine power curves are important for wind farm operation. They can be used for performance monitoring, calculating compensation for forced curtailment, and for making short-term power forecasts for optimising revenues.
There is therefore a need for site-specific power curves that predict power based on the atmospheric conditions expected at a turbine's location, such as shear, veer, and turbulence intensity. The challenges and needs associated with this are discussed in detail in Sect. 4.1.
6.3 Forecasting weather and power at operational plants
Weather and power forecasting can both increase the income from a wind plant and reduce expenses. Income can be increased by scheduling maintenance to ensure turbine operation during forecasted high-wind-speed periods or by supporting energy trading, while expenses can be reduced by scheduling maintenance for good weather periods and avoiding market penalties. Forecasts can also enable the integration of wind energy into a regional or national electricity system. As such, effective forecasting is an essential capability for operational wind farms at complex sites.
The ability to forecast conditions at a wind farm several days ahead is essential for forecasting power production, safe operations, and scheduling maintenance. Wind forecasts over shorter horizons can also be used to support plant control decisions, and in future such insights will be essential for the effective operation of hybrid plants where wind, solar energy, and storage are co-located.
These plant-scale forecasts rely upon understanding the weather in a region up to 1000 km around the point of interest – i.e. the mesoscale – and predicting it on scales of around 1 km or less (the microscale) around the wind farm. These data can then be used directly or further processed, leveraging site observations.
Current generations of mesoscale models are routinely used by commercial and national weather forecasting services at complex sites. However, crucial for a forecast is the model and the initial state or analysis. The analysis is made by a complicated data assimilation process combining short range forecasts and observations. In mountainous terrains the analysis is more difficult because of greater differences in the height of the model orography and the real terrain. Then, simple questions like the observation height become complicated: should an observation be assimilated at the same height above ground or at the same height above mean sea level as in nature? Probably, there is no clear answer, and it must be tested for the assimilation system.
Additional forecast errors stem from the non-linear basic equations of the models. This uncertainty is estimated by calculating an ensemble of forecasts. Hilly or mountainous terrain can increase or decrease the uncertainty of wind forecasts by channelling the wind in a few preferred directions (see, for example, Clifton et al., 2013). This makes the forecast more stable for a wider range of weather regimes. However, near the tipping point from one regime to the other, errors can strongly increase.
Another problem of numerical weather prediction models can be conflicting interests for model improvement. For example, Sandu et al. (2013) showed that reducing turbulent mixing in the ECMWF's Integrated Forecasting System (IFS) model would improve hub-height wind speeds but worsen near-surface temperature and the large-scale circulation.
There are many ways to forecast the amount and timing of energy produced by a wind turbine or wind plant with minute-scale resolution up to a week ahead (see Würth et al., 2019, for a review of approaches). However, every wind plant operator has to go through an evaluation process for their own site when selecting a provider. Although evaluation criteria exist (Möhrlen et al., 2022), this process is time consuming and requires specialist skills, and the cost of the selection process could be high compared to the savings from the improved forecast.
Simplified and even standardised evaluation processes would help the assessment and adoption of operational forecasts. Further, sharing anonymised results would help the community and service providers understand where model improvements are required. The challenge is to overcome the wind energy industry's traditional reluctance to share such information. Objective characterising metrics are also required so that experience can be exchanged (see Sect. 7.1).
6.4 Downscaling forecasts to individual turbines
Some applications require weather data at individual turbines’ locations. This downscaling process can take place using physical models or by leveraging site observations and applying model output statistics, machine learning, or other methods. Model-based approaches require an understanding of the physics and descriptive equations, while statistical and machine learning tools can be trained on historical data sets. Therefore, the model-based approaches can work better in unusual weather events, but machine learning solutions tend to be faster and more precise if well trained. However, major changes in the weather prediction model require new training of the statistical model. Otherwise an improvement of the weather prediction model can result in a degradation of the forecast for the site.
Downscaling – whether by physical models or using statistical approaches – is harder in hilly or mountainous terrain as there is usually more subgrid-scale variation in this terrain. As all the subgrid scale has to be parameterised this introduces greater uncertainty to the predicted flow. Also, the wind variation is more sensitive to the exact location in hilly or mountainous terrain. Although there are many studies about downscaling mesoscale data to, for example, automated weather station locations, it is not clear how well such downscaling processes work for wind energy applications and what the major contributors to uncertainty are. Because of the scale of the work involved, this may suit a collaborative assessment similar to the comparison of yield and energy prediction for wind energy carried out regularly since 2011 (known as “CREYAP” and described in Mortensen et al., 2015).
6.5 Predicting the likelihood and impact of icing conditions
In icing conditions an icing forecast can also be required in addition to wind forecasts. This icing forecast can be made by combining a weather forecast model with a wind turbine model to predict ice accretion on the wind turbine blades or on the monitoring instruments.
An operational icing forecast can have several different use cases. The more common one is to improve production forecasts. Icing can cause a sudden reduction in wind farm energy production. In some electricity markets this will force the wind farm operator to pay a penalty for missed production. These financial penalties can be avoided if icing is included in the normal production forecast. Some operators might be concerned about operational safety and ice throw risk, and forecasts can help identify times when there is an elevated ice throw risk.
An operational icing forecast model usually consists of three components: the numerical weather model, a model for blade ice growth, and an iced turbine model (see examples in Molinder et al., 2020; Kilpatrick et al., 2020). The icing model needs to take into account not only how the ice builds on the blade but also how and when ice is removed from the blade.
The ice accretion rate will depend on temperature, wind speed, and droplet size of water droplets in air, as well as information about the turbine, such as the blade shape and the turbine's size. Accurate prediction of the appropriate meteorological parameters and modelling ice accretion continue to be problematic, but improving them would benefit many different activities in ice-prone regions (Thompson, 2019).
Wind turbine behaviour in icing conditions is specific to a turbine model. Many current models of ice accretion or ice shedding require detailed information about the turbine, such as the controller design or airfoil shape. Wind turbine OEMs are often unwilling to share this intellectual property, which in turn prevents the development of operational models. Therefore, operation models are required that use less sensitive information.
Wind farm operators are typically concerned about the magnitude and duration of icing events. An icing forecast therefore requires not only an assessment of the meteorological conditions when ice builds on the blades but also an estimate of how long ice will remain on the blades and impact turbine performance. The latter is much harder problem to solve as ice can be removed from turbine blades via mechanical shedding, melting, or a combination of both. The ice shedding will have implications on the production forecasts and also on safety around the wind turbines (Krenn et al., 2018).
As with other issues discussed in this paper, new or improved models of cloud formation, ice accretion, and shedding would in turn require validation from lab or field tests. It is possible that making multi-scale test data open would allow multiple different models to be tested and thus accelerate innovation in this field.
In preparing this review, we have identified several challenges that arise repeatedly during the life cycle of a wind plant in hilly or mountainous terrain or are linked to the ability of the wind energy community to collaborate effectively. These are described below. The challenges and the resulting R&D needs are discussed in this section and summarised in Table 6.
Table 6General challenges and R&D needs for wind energy plants in complex locations. The table follows the format of Table 1.

7.1 No agreed-upon definition of “complex terrain”
As discussed in the introduction of this paper, the wind energy industry often uses the catch-all phrase “complex terrain” to describe hilly or mountainous sites and other locations where the terrain modifies flow such that it is outside of the body of standards. But “complex terrain” is used interchangeably for different applications, including the following examples:
-
The software package WAsP is often used in the wind energy industry to model winds at a potential site. WAsP's ruggedness index (RIX) value is a measure of the slope angle around a location and has some predictive value for the uncertainty of the linear wind model used in WAsP (Bowen and Mortensen, 1996). Experience shows that WAsP cannot be used confidently when . The widespread availability of WAsP and the simplicity of the RIX metric mean that has become the de facto definition for “complex terrain”.
-
Similarly, terrain slope angles are used to assess complexity for power performance testing according to the International Electrotechnical Committee (IEC) 61400-12-1 standard (IEC 61400-12-1:2017, 2017). Terrain that exceeds certain angles is said to be “complex”.
-
The IEC 61400-1 standard (IEC 61400-1:2019, 2019a) contains a somewhat different scheme that evaluates slope angles and terrain variance and categorises locations into low, medium, and high terrain complexity.
WAsP and the IEC 61400 standards use different definitions for complex terrain. Terrain complexity impacts different aspects of the development and operation of wind energy facilities in different ways. Furthermore, studies have shown that different flow modelling tools have varying sensitivity to terrain (e.g. Tabas et al., 2019). As a result, it only makes sense to use an absolute value of RIX as a division between “complex” and “not complex” terrain when using WAsP but not as a general metric for all flow modelling tools or for other applications. So, the criteria used to assess complexity for flow modelling using WAsP or power performance testing are not interchangeable and should not be used for other applications.
Also, a binary definition of “complex” or “not complex” terrain is difficult to translate into project uncertainties (which are usually assessed on an continuous scale) or risks (typically at least three to four different categories). The binary definition is also difficult to translate into “go” or “no-go” decisions or to use for deciding which tool or workflow to use for a particular project.
Research efforts are therefore needed to develop definitions of terrain complexity that have meaning for some or all of the processes involved in developing a wind plant. This would simplify information exchange between stakeholders, make it easier to transfer experience from one site to another, and allow an informed choice of optimal measurement instruments, wind models, and analysis methods.
7.2 Interrelated physical processes
The wind energy industry leverages knowledge from many different scientific disciplines to design, build, and operate a wind farm. Knowledge is transferred between wind energy projects in the form of computer models that approximate the many different physical processes taking place and their interaction. This is particularly challenging for complex sites due to the additional complexity of the flow and its interaction with the wind turbines. For example, predicting the energy that might be produced over the course of a year requires information about the wind resource, the ability of the wind turbine to capture that energy, and losses due to icing, soiling, wakes, and other effects. This might be implemented as a complex computer model. The performance of each individual model in this system can be verified by conducting experiments that isolate specific effects (e.g. the effect of atmospheric stability on wakes, described in Bodini et al., 2017). The performance of the whole modelling system can be verified against field experiments that simultaneously resolve physical processes acting at different scales and in different parts of the system and their effects on wind turbines. Some experiments have already been carried out, for example, the US Wind Forecasting Improvement Projects WFIP1 (Wilczak et al., 2015) and WFIP2 (Shaw et al., 2019) and the New European Wind Atlas (Mann et al., 2017). These complex and expensive field studies have all required significant inter-organisation cooperation and many years of preparation. Although they have provided very useful information, further research is needed to extract more understanding from the data sets they generated. As wind turbines' dimensions increase and their rated power increases, or wind plants increase in size and wake effects become more important, these field studies may need to be repeated.
7.3 Few frameworks for sharing data
There are a number of desktop tools available for supporting wind energy site development, which can be used to estimate resources, carry out coarse energy yield assessments, and identify other challenges in advance of significant effort on site. Some tools additionally allow resource estimates based on downscaled mesoscale weather models or reanalysis data that can then be coupled with simple turbine production models.
At this time, there is no framework we know of for bringing together data to rapidly analyse the opportunities and challenges of a potential wind energy development site. This data exchange may be enabled by the ongoing digitalisation of the wind energy industry. For example, in 2021 IEA Wind Task 43 (digitalisation) produced a data structure to allow simplified data sharing for wind resource assessments (Holleran et al., 2021), and there are many other proposals for ways to share turbine design information (Bortolotti et al., 2019) and other data. Further research is needed into ways to collect, combine, and act upon these myriad data.
7.4 A lack of test facilities in complex locations
Technological progress requires that potential solutions to the challenges faced by wind energy in complex locations be tested on real turbines. To date several wind turbines have been erected in part or entirely for research purposes in hilly or mountainous terrain, including the Gütsch site in Switzerland and the CENER Alaiz experimental wind farm in Spain, or in complex flow conditions such as those found at times at the US National Wind Technology Center (NWTC) near Boulder, Colorado, or in the complex weather and climate found at the Nergica facility in the Gaspé region of Canada. A further wind energy research facility is in development by the southern German wind energy research cluster WindForS in the Swabian Alb. These facilities individually cover different parts of the spectrum of terrain, flow, and weather complexity and include a range of turbines, from 600 kW machines at Gütsch to multi-megawatt turbines at Alaiz and the NWTC.
Despite the ongoing trend towards taller wind turbines with larger rotors and higher rated power, so far there are no research turbines of greater than 100 m hub height or more than 5 MW rated power in hilly or mountainous terrain that also periodically experience cold temperatures or icing. This lack of available research turbines makes it difficult for the international wind energy community to identify and test solutions to the issues identified in this paper. A turbine of this scale would potentially cost EUR 10–20 million to procure and construct – although operations could be self-funding through the income from power sales – and so might require an international consortium to realise it.
Wind turbines have been successfully deployed from the Arctic to Antarctic and at up to 4000 m a.s.l. Many of these turbines are in the hilly and mountainous regions that cover almost one-third of the earth's land surface. These locations can have markedly increased wind resources compared to other locations, making them potentially significant contributions to energy supplies in many regions.
However, deploying wind turbines in these locations is not easy. The interaction between terrain, weather, and climate leads to bigger turbine- and wind-farm-scale variability than is usually found at traditional deployment locations. Conditions – particularly in cold climates that experience low temperatures or icing – can be more extreme than at lowland locations, thus reducing energy production and raising costs, but it can be hard to obtain realistic or representative data about the conditions from measurements or models. Together these lead to costly uncertainty that can make it difficult to finance a new wind energy project. Operating wind farms in such conditions is not easy, either; weather conditions may make it hard to work, forecasts are often less precise than in flat terrain, and there may be conflicts with other stakeholders.
Focused R&D is therefore required to maintain the competitiveness of wind energy at complex locations. While some of the outcomes of this R&D will be able to be applied to existing wind farms, larger benefits can be obtained by designing new wind farms from the outset with the site's complexity in mind. The development of appropriate metrics to characterise terrain and flow, as well as the performance of the tools and processes used in such terrain, will be a key enabler for this R&D. It will allow the exchange of experience across developments and help investors understand the applicability of different tools. Then, frameworks are required to allow stakeholders to collect and share their data. Dedicated test facilities are required so that new technologies can be tested at scale, helping the process of technology transfer and adoption.
In this article we have shown how sites at hilly or mountainous sites – a type of complex terrain – may have different challenges compared to simple, lowland sites. Many of the challenges to deploying wind energy at these sites can occur in simple terrain, such as complex flow or cold climate conditions. As a result, research and development for wind energy at complex sites can benefit the entire wind energy industry.
Figure 1 shows regions of low and high mountains. This map is created from GIS data downloaded from the United States Geological Survey (USGS). These data include a pre-processed data layer that characterises each grid point as belonging to one of the K3 mountain classes (Sayre et al., 2018), in which the K3 data set is a 250 m spatial resolution digital elevation model (Karagulle et al., 2017).
The K3 mountain characterisation uses three parameters to characterise the terrain in a 3 km moving neighbourhood analysis window (NAW). These are slope, relative relief (the absolute value of the difference between the maximum and minimum elevations in a NAW), and the profile parameter, which is the percentage of area of high slope (≥8 %) in a 6 km NAW. This is further divided into upland pixels (higher than the midpoint of the elevation range in the NAW) or lowland pixels (lower than the midpoint of the elevation range in the NAW). The classes are described in Table A1.
Table A1The K3 mountain characterisation (Sayre et al., 2018) uses three parameters to characterise the terrain in a 3 km moving neighbourhood analysis window (NAW).

The data used for Fig. 1 are available through the USGS Global Mountain Explorer at https://rmgsc.cr.usgs.gov/gme/gme. shtml (USGS, 2022) (last access: 1 October 2022).
This paper was initiated and led by AC. SB contributed general materials and led the section on wind turbine design. AS, HF, and TK contributed materials on resource assessment, forecasting, and icing respectively.
Andrew Clifton, Alexander Stökl, and Timo Karlsson provide consultancy on the deployment of wind energy in complex terrain. All authors except Helmut Frank receive grant funding for research into aspects of wind energy in complex locations.
Publisher's note: Copernicus Publications remains neutral with regard to jurisdictional claims in published maps and institutional affiliations.
Andrew Clifton was supported by the Ministerium für Wissenschaft, Forschung und Kunst Baden-Württemberg (WindForS Geschäftstelle).
This open-access publication was funded by the University of Stuttgart.
This paper was edited by Jakob Mann and reviewed by two anonymous referees.
Antoniou, I., Pedersen, S. M., and Enevoldsen, P. B.: Wind shear and uncertainties in power curve measurement and wind resources, Wind Eng., 33, 449–468, 2009. a
Arbez, C., Clément, M., Godreau, C., Swytink-Binnema, N., Tete, K., and Wadham-Gagnon, M.: Development and Validation of an Ice Prediction Model for Wind Farms, Tech. rep., TechnoCenter éolien, https://nergica.com/en/development-and-validation-of-an-ice-prediction-model-for-wind (last access: 1 October 2022), 2016. a
Barber, S. and Nordborg, H.: Improving site-dependent power curve prediction accuracy using regression trees, J. Phys.: Conf. Ser., 1618, 062003, https://doi.org/10.1088/1742-6596/1618/6/062003, 2020. a, b
Barber, S., Buehler, M., and Nordborg, H.: IEA Wind Task 31: Design of a new comparison metrics simulation challenge for wind resource assessment in complex terrain Stage 1, J. Phys.: Conf. Ser., 1618, 062013, https://doi.org/10.1088/1742-6596/1618/6/062013, 2020a. a
Barber, S., Schubiger, A., Koller, S., Rumpf, A., Knaus, H., and Nordborg, H.: Actual Total Cost reduction of commercial CFD modelling tools for Wind Resource Assessment in complex terrain, J. Phys.: Conf. Ser., 1618, 062012, https://doi.org/10.1088/1742-6596/1618/6/062012, 2020b. a
Barber, S., Schubiger, A., Koller, S., Rumpf, A., and Knaus, H.: The Pragmatic Choice of Wind Model in Complex Terrain – Decision Tool Development, Zenodo [code], https://doi.org/10.5281/zenodo.4876982, 2021. a
Barber, S., Hammer, F., and Tica, A.: Tools for predicting site-specific performance, ASME J. Risk Uncertain., 8, 021102, https://doi.org/10.1115/1.4053513, 2022. a
Bechmann, A.: Data Requirements for WAsP, CFD & WRF, DTU Wind Energy E, DTU Wind Energy, Denmark, ISBN 978-87-93549-23-4, https://backend.orbit.dtu.dk/ws/portalfiles/portal/145895783/Bechmann_D21_2018.pdf (last access: 1 October 2022), 2017. a, b
Bell, T. M., Klein, P., Wildmann, N., and Menke, R.: Analysis of flow in complex terrain using multi-Doppler lidar retrievals, Atmos. Meas. Tech., 13, 1357–1371, https://doi.org/10.5194/amt-13-1357-2020, 2020. a
Berg, J., Mann, J., Bechmann, A., Courtney, M. S., and Jørgensen, H. E.: The Bolund Experiment, Part I: Flow Over a Steep, Three-Dimensional Hill, Bound.-Lay. Meteorol., 141, 219, https://doi.org/10.1007/s10546-011-9636-y, 2011. a
Bingöl, F., Mann, J., and Foussekis, D.: Conically scanning lidar error in complex terrain, Meteorol. Z., 18, 189–195, https://doi.org/10.1127/0941-2948/2009/0368, 2009. a
Black, A., Mazoyer, P., Wylie, S., Debnath, M., Lammers, A., Spalding, T., and Schultz, R.: Survey of Correction Techniques for Remote Sensing Devices in Complex Flow, Zenodo [data set], https://doi.org/10.5281/zenodo.4302363, 2020. a
Bodini, N., Zardi, D., and Lundquist, J. K.: Three-dimensional structure of wind turbine wakes as measured by scanning lidar, Atmos. Meas. Tech., 10, 2881–2896, https://doi.org/10.5194/amt-10-2881-2017, 2017. a
Borraccino, A., Schlipf, D., Haizmann, F., and Wagner, R.: Wind field reconstruction from nacelle-mounted lidar short-range measurements, Wind Energ. Sci., 2, 269–283, https://doi.org/10.5194/wes-2-269-2017, 2017. a
Bortolotti, P., Tarres, H. C., Dykes, K. L., Merz, K., Sethuraman, L., Verelst, D., and Zahle, F.: IEA Wind TCP Task 37: Systems Engineering in Wind Energy – WP2.1 Reference Wind Turbines, Tech. Rep. NREL/TP-5000-73492, National Renewable Energy Laboratory, Golden, CO, https://doi.org/10.2172/1529216, 2019. a
Bowen, A. J. and Mortensen, N. G.: Exploring the limits of WAsP: the Wind Atlas Analysis and Application Program, in: Proceedings of the 1996 European Union Wind Energy Conference, 20–24 May 1996, Göteborg, Sweden, 584–587, Paper O15.2, https://backend.orbit.dtu.dk/ws/portalfiles/portal/116681565/Exploring_the_limits.pdf (last access: 1 October 2022), 1996. a
Bradley, S., Strehz, A., and Emeis, S.: Remote sensing winds in complex terrain – a review, Meteorol. Z., 24, 547–555, https://doi.org/10.1127/metz/2015/0640, 2015. a
Bredesen, R. E., Cattin, R., Clausen, N.-E., Davis, N., Jordaens, P. J., Khadiri-Yazami, Z., Klintström, R., Krenn, A., Lehtomäki, V., Ronsten, G., Wadham-Gagnon, M., and Wickman, H.: IEA Wind TCP Recommended Practice 13 2nd Edition: Wind Energy in Cold Climates, Tech. rep., IEA Wind Task 19, https://iea-wind.org/task19/t19-publications/ (last access: 1 October 2022), 2017. a
Clifton, A., Kilcher, L., Lundquist, J. K., and Fleming, P.: Using machine learning to predict wind turbine power output, Environ. Res. Lett., 8, 024009, https://doi.org/10.1088/1748-9326/8/2/024009, 2013. a, b
Clifton, A., Daniels, M. H., and Lehning, M.: Effect of winds in a mountain pass on turbine performance, Wind Energy, 17, 1543–1562, https://doi.org/10.1002/we.1650, 2014. a, b
Clifton, A., Boquet, M., Burin Des Roziers, E., Westerhellweg, A., Hofsass, M., Klaas, T., Vogstad, K., Clive, P., Harris, M., Wylie, S., Osler, E., Banta, B., Choukulkar, A., Lundquist, J., and Aitken, M.: Remote Sensing of Complex Flows by Doppler Wind Lidar: Issues and Preliminary Recommendations, Tech. Rep. NREL/TP-5000-64634, National Renewable Energy Laboratory, Golden, CO, USA, https://doi.org/10.2172/1351595, 2015. a
Clifton, A., Smith, A., and Fields, M.: Wind Plant Preconstruction Energy Estimates. Current Practice and Opportunities, Tech. Rep. NREL/TP-5000-64735, National Renewable Energy Laboratory, Golden, CO, USA, https://doi.org/10.2172/1248798, 2016. a
Clifton, A., Hodge, B.-M., Draxl, C., Badger, J., and Habte, A.: Wind and solar resource data sets, WIREs Energ. Environ., 7, e276, https://doi.org/10.1002/wene.276, 2018. a, b, c
Draxl, C., Clifton, A., Hodge, B.-M., and McCaa, J.: The Wind Integration National Dataset (WIND) Toolkit, Appl. Energy, 151, 355–366, 2015. a
ECMWF: C3S Copernicus Climate Change Service, https://cds.climate.copernicus.eu/about-c3s (last access: 31 May 2022), 2020. a
Elliott, D., Holladay, C., Barchet, W., Foote, H., and Sandusky, W.: Wind Energy Resource Atlas of the United States, Technical Report DOE/CH 10093-4, Pacific Northwest National Laboratory, https://www.nrc.gov/docs/ML0609/ML060940383.pdf (last access: 1 October 2022), 1986. a
Emeis, S.: Wind speed and shear associated with low-level jets over Northern Germany, Meteorol. Z., 23, 295–304, https://doi.org/10.1127/0941-2948/2014/0551, 2014. a
European Commission: In-Depth Analysis In Support Of The Commission Communication COM(2018) 773 A Clean Planet for all: A European long-term strategic vision for a prosperous, modern, competitive and climate neutral economy, Tech. rep., European Commission, https://ec.europa.eu/clima/system/files/2018-11/com_2018_733_analysis_in_support_en.pdf (last access: 1 October 2022), 2018. a
Feng, Y., Miranda-Fuentes, J., Guo, S., Jacob, J., and Sagaut, P.: ProLB: A Lattice Boltzmann Solver of Large-Eddy Simulation for Atmospheric Boundary Layer Flows, J. Adv. Model.Earth Syst., 13, e2020MS002107, https://doi.org/10.1029/2020MS002107, 2021. a
Foresti, L., Tuia, D., and Kanevski, M.: Learning wind fields with multiple kernels, Stoch. Environ. Res. Risk A., 25, 51–66, https://doi.org/10.1007/s00477-010-0405-0, 2011. a
Frediani, M. E. B., Hopson, T. M., Hacker, J. P., Anagnostou, E. N., Monache, L. D., and Vandenberghe, F.: Object-Based Analog Forecasts for Surface Wind Speed, Mon. Weather Rev., 145, 5083–5102, https://doi.org/10.1175/MWR-D-17-0012.1, 2017. a
Friis Pedersen, T.: Development of a Classification System for Cup Anemometers-CLASSCUP, Tech. Rep. 1348(EN), Risø National Laboratory, Roskilde, ISBN 87-550-3076-9, https://backend.orbit.dtu.dk/ws/portalfiles/portal/7711662/ris_r_1348.pdf (last access: 1 October 2022), 2003. a
Godreau, C. and Tete, K.: Ice protection systems and retrofits: Performance and experiences, Winterwind 2020, https://windren.se/WW2020/13_4_39_Godreau_Ice_protection_systems_and_retrofits_Performance_and_experiences_Pub.pdf (last access: 1 October 2022), 2020. a
Hansen, C. and Hansen, K.: Recent Advances in Wind Turbine Noise Research, Acoustics, 2, 171–206, https://doi.org/10.3390/acoustics2010013, 2020. a
Hedevang, E.: Wind turbine power curves incorporating turbulence intensity, Wind Energy, 17, 173–195, 2014. a
Hofsäß, M., Clifton, A., and Cheng, P. W.: Reducing the Uncertainty of Lidar Measurements in Complex Terrain Using a Linear Model Approach, Remote Sens., 10, 1465, https://doi.org/10.3390/rs10091465, 2018. a
Hofsäß, M., Bergmann, D., Denzel, J., and Cheng, P. W.: Flying UltraSonic – A new way to measure the wind, Wind Energ. Sci. Discuss. [preprint], https://doi.org/10.5194/wes-2019-81, 2019. a
Holleran, S., Roscheck, F., Fields, J., Kersting, G., Bohara, A., Purdue, M., and Lee, J.: IEA-Task-43/digital_wra_data_standard: 0.1.1-2021.04, Zenodo [code], https://doi.org/10.5281/zenodo.4710169, 2021. a
Hübner, G., Pohl, J., Hoen, B., Firestone, J., Rand, J., Elliott, D., and Haac, R.: Monitoring annoyance and stress effects of wind turbines on nearby residents: A comparison of U.S. and European samples, Environ. Int., 132, 105090, https://doi.org/10.1016/j.envint.2019.105090, 2019. a
IEC 61400-13:2015: Wind energy generation systems – Part 13: Measurement of mechanical loads, https://webstore.iec.ch/publication/72669 (last access: 1 October 2022), 2015. a
IEC 61400-12-1:2017: Wind energy generation systems – Part 12-1: Power performance measurements of electricity producing wind turbines, https://webstore.iec.ch/publication/26603 (last access: 1 October 2022), 2017. a, b, c, d
IEC 61400-1:2019: Wind energy generation systems – Part 1: Design requirements, https://webstore.iec.ch/publication/26423 (last access: 1 October 2022), 2019a. a, b
IEC 61400-24:2019: Wind energy generation systems – Part 24: Lightning Protection, https://webstore.iec.ch/publication/32050 (last access: 1 October 2022), 2019b. a
IEC 61400-50-3:2019: Wind energy generation systems – Part 50-3: Use of nacelle mounted lidars for wind measurements, https://webstore.iec.ch/publication/59587 (last access: 1 October 2022), 2019c. a
Karagulle, D., Frye, C., Sayre, R., Breyer, S., Aniello, P., Vaughan, R., and Wright, D.: Modeling global Hammond landform regions from 250-m elevation data, T. GIS, 21, 1040–1060, https://doi.org/10.1111/tgis.12265, 2017. a, b
Karlsson, T.: Cold climate wind market study 2020–2025, Winterwind 2021, https://windren.se/WW2021/14_2_21_Karlsson_IEA_Wind_Task_19_Cold_climate_wind_market_study_Public.pdf (last access: 1 October 2022), 2021. a
Kelberlau, F. and Mann, J.: Cross-contamination effect on turbulence spectra from Doppler beam swinging wind lidar, Wind Energ. Sci., 5, 519–541, https://doi.org/10.5194/wes-5-519-2020, 2020. a
Kilpatrick, R. J., Hildebrandt, S., Swytink-Binnema, N., and Clément, M.: Advances in wind power forecasting and power loss mitigation for cold climate operation, J. Phys.: Conf. Ser., 1452, 012079, https://doi.org/10.1088/1742-6596/1452/1/012079, 2020. a
Klaas-Witt, T. and Emeis, S.: The five main influencing factors for lidar errors in complex terrain, Wind Energ. Sci., 7, 413–431, https://doi.org/10.5194/wes-7-413-2022, 2022. a, b
Komusanac, I., Brindley, G., Fraile, D., and Ramirez, L.: Wind energy in Europe: 2021 Statistics and the outlook for 2022–2026, Tech. rep., WindEurope, https://windeurope.org/intelligence-platform/product/wind-energy-in-europe-2021-statistics-and-the-outlook-for, last access: 1 October 2022. a
Krenn, A., Stökl, A., Weber, N., Barup, S., Weidl, T., Hoffmann, A., Bredesen, R. E., Lannic, M., Müller, S., Stoffels, N., Hahm, T., Storck, F., and Lautenschlager, F.: International Recommendations for Ice Fall and Ice Throw Risk Assessments, https://iea-wind.org/task19/t19-publications/ (last access: 1 October 2022), 2018. a
Lange, J., Mann, J., Berg, J., Parvu, D., Kilpatrick, R., Costache, A., Jubayer, C., Siddiqui, K., and Hangan, H.: For wind turbines in complex terrain, the devil is in the detail, Environ. Res. Lett., 12, 094020, https://doi.org/10.1088/1748-9326/aa81db, 2017. a
Lee, J., Zhao, F., Dutton, A., Backwell, B., Fiestas, R., Qiao, L., Balachandran, N., Lim, S., Liang, W., Clarke, E., Lathigara, A., and Younger, D. R.: Global Wind Report 2021, Tech. rep., Global Wind Energy Council, https://gwec.net/global-wind-report-2021/ (last access: 1 October 2022), 2021. a
Lee, J. C. Y., Stuart, P., Clifton, A., Fields, M. J., Perr-Sauer, J., Williams, L., Cameron, L., Geer, T., and Housley, P.: The Power Curve Working Group's assessment of wind turbine power performance prediction methods, Wind Energ. Sci., 5, 199–223, https://doi.org/10.5194/wes-5-199-2020, 2020. a
Lehtomäki, V.: Available Technologies for Wind Energy in Cold Climates, Tech. rep., 2nd Edn., IEA Wind TCP, https://iea-wind.org/task19/t19-publications/ (lLast access: 1 October 2022), 2016. a, b
Letson, F., Shepherd, T. J., Barthelmie, R. J., and Pryor, S. C.: Modelling Hail and Convective storms with WRF for Wind Energy Applications, J. Phys.: Conf. Ser., 1452, 012051, https://doi.org/10.1088/1742-6596/1452/1/012051, 2020. a
Macdonald, H., Infield, D., Nash, D. H., and Stack, M. M.: Mapping hail meteorological observations for prediction of erosion in wind turbines, Wind Energy, 19, 777–784, https://doi.org/10.1002/we.1854, 2016. a
Mann, J., Angelou, N., Arnqvist, J., Callies, D., Cantero, E., Arroyo, R. C., Courtney, M., Cuxart, J., Dellwik, E., Gottschall, J., Ivanell, S., Kühn, P., Lea, G., Matos, J. C., Palma, J. M. L. M., Pauscher, L., Peña, A., Rodrigo, J. S., Söderberg, S., Vasiljevic, N., and Rodrigues, C. V.: Complex terrain experiments in the New European Wind Atlas, Philos. T. Roy. Soc. Lond. A, 375, 20160101, https://doi.org/10.1098/rsta.2016.0101, 2017. a
Menke, R., Vasiljević, N., Hansen, K. S., Hahmann, A. N., and Mann, J.: Does the wind turbine wake follow the topography? A multi-lidar study in complex terrain, Wind Energy Science, 3, 681–691, https://doi.org/10.5194/wes-3-681-2018, 2018. a, b
Menke, R., Vasiljević, N., Wagner, J., Oncley, S. P., and Mann, J.: Multi-lidar wind resource mapping in complex terrain, Wind Energ. Sci., 5, 1059–1073, https://doi.org/10.5194/wes-5-1059-2020, 2020. a
Mickle, R. E., Cook, N. J., Hoff, A. M., Jensen, N., Salmon, J. R., Taylor, P. A., Tetzlaff, G., and Teunissen, H.: The Askervein Hill Project: Vertical profiles of wind and turbulence, Bound.-Lay. Meteorol., 43, 143–169, 1988. a
Möhrlen, C., Zack, J., and Giebel, G.: IEA Wind Recommended Practice for the Implementation of Renewable Energy Forecasting Solutions, Elsevier Academic Press, 270 pp., ISBN 9780443186813, https://www.elsevier.com/books/iea-wind-recommended-practice-for-the-implementation-of, last access: 1 October 2022. a
Molinder, J., Scher, S., Nilsson, E., Körnich, H., Bergström, H., and Sjöblom, A.: Probabilistic Forecasting of Wind Turbine Icing Related Production Losses Using Quantile Regression Forests, Energies, 14, 158, https://doi.org/10.3390/EN14010158, 2020. a
Molter, C. and Cheng, P. W.: ANDroMeDA – A Novel Flying Wind Measurement System, J. Phys.: Conf. Ser., 1618, 032049, https://doi.org/10.1088/1742-6596/1618/3/032049, 2020. a
Mortensen, N., Nielsen, M., and Ejsing Jørgensen, H.: Comparison of Resource and Energy Yield Assessment Procedures 2011–2015: What have we learned and what needs to be done?, in: Proceedings of the EWEA Annual Event and Exhibition 2015, EWEA – European Wind Energy Association, https://backend.orbit.dtu.dk/ws/portalfiles/portal/118434032/Comparison_of_Resource_and_Energy_Yield_paper.pdf (last access: 1 October 2022), 2015. a
Newman, J. F. and Clifton, A.: An error reduction algorithm to improve lidar turbulence estimates for wind energy, Wind Energ. Sci., 2, 77–95, https://doi.org/10.5194/wes-2-77-2017, 2017. a
Olson, J. B., Kenyon, J. S., Djalalova, I., Bianco, L., Turner, D. D., Pichugina, Y., Choukulkar, A., Toy, M. D., Brown, J. M., Angevine, W. M., Akish, E., Bao, J.-W., Jimenez, P., Kosovic, B., Lundquist, K. A., Draxl, C., Lundquist, J. K., McCaa, J., McCaffrey, K., Lantz, K., Long, C., Wilczak, J., Banta, R., Marquis, M., Redfern, S., Berg, L. K., Shaw, W., and Cline, J.: The Second Wind Forecast Improvement Project (WFIP2): General Overview, B. Am. Meteorol. Soc., 100, 2201–2220, https://doi.org/10.1175/BAMS-D-18-0040.1, 2019. a
Onodera, N., Idomura, Y., and Hasegawa, Y.: Real-Time Tracer Dispersion Simulations in Oklahoma City Using the Locally Mesh-Refined Lattice Boltzmann Method, Bound.-Lay. Meteorol., 179, 187–208, https://doi.org/10.1007/s10546-020-00594-x, 2021. a
Papadopoulos, K. H., Stefantos, N. C., Paulsen, U. S., and Morfiadakis, E.: Effects of Turbulence and Flow Inclination on the Performance of Cup Anemometers in the Field, Bound.-Lay. Meteorol., 101, 77–107, https://doi.org/10.1023/A:1019254020039, 2001. a
Pohl, J., Gabriel, J., and Hübner, G.: Understanding stress effects of wind turbine noise – The integrated approach, Energy Policy, 112, 119–128, https://doi.org/10.1016/j.enpol.2017.10.007, 2018. a
Pryor, S. C., Barthelmie, R. J., Bukovsky, M. S., Leung, L. R., and Sakaguchi, K.: Climate change impacts on wind power generation, Nat. Rev. Earth Environ., 1, 627–643, https://doi.org/10.1038/s43017-020-0101-7, 2020. a, b
Rasp, S. and Lerch, S.: Neural Networks for Postprocessing Ensemble Weather Forecasts, Mon. Weather Rev., 146, 3885–3900, https://doi.org/10.1175/MWR-D-18-0187.1, 2018. a
Rautenberg, A., Schön, M., zum Berge, K., Mauz, M., Manz, P., Platis, A., van Kesteren, B., Suomi, I., Kral, S. T., and Bange, J.: The Multi-Purpose Airborne Sensor Carrier MASC-3 for Wind and Turbulence Measurements in the Atmospheric Boundary Layer, Sensors, 19, 2292, https://doi.org/10.3390/s19102292, 2019. a
Reinert, D., Prill, F., Frank, H., Denhard, M., Baldauf, M., Schraff, C., Gebhardt, C., Marsigli, C., and Zängl, G.: DWD Database Reference for the Global and Regional ICON and ICON-EPS Forecasting System, Tech. rep., Deutscher Wetterdienst, Offenbach am Main, Germany, https://www.dwd.de/SharedDocs/downloads/DE/modelldokumentationen/nwv/icon/icon_dbbeschr_aktuell.pdf (last access: 1 October 2022), 2021. a
RISE: Wind power in cold climates, https://www.ri.se/en/press/wind-power-in-cold-climates (last access: 19 April 2022), 2020. a
Roberge, P., Lemay, J., Ruel, J., and Bégin-Drolet, A.: Field analysis, modeling and characterization of wind turbine hot air ice protection systems, Cold Reg. Sci. Technol., 163, 19–26, https://doi.org/10.1016/j.coldregions.2019.04.001, 2019. a
Sandu, I., Beljaars, A., Bechtold, P., Mauritsen, T., and Balsamo, G.: Why is it so difficult to represent stably stratified conditions in numerical weather prediction (NWP) models?, J. Adv. Model. Earth Syst., 5, 117–133, https://doi.org/10.1002/jame.20013, 2013. a, b
Sanz Rodrigo, J., Chávez Arroyo, R. A., Moriarty, P., Churchfield, M., Kosović, B., Réthoré, P.-E., Hansen, K. S., Hahmann, A., Mirocha, J. D., and Rife, D.: Mesoscale to microscale wind farm flow modeling and evaluation, WIREs Energ. Environ., 6, e214, https://doi.org/10.1002/wene.214, 2017. a
Sathe, A., Mann, J., Gottschall, J., and Courtney, M. S.: Can Wind Lidars Measure Turbulence?, J. Atmos. Ocean. Tech., 28, 853–868, https://doi.org/10.1175/JTECH-D-10-05004.1, 2011. a, b
Sayre, R., Frye, C., Karagulle, D., Krauer, J., Breyer, S., Aniello, P., Wright, D. J., Payne, D., Adler, C., Warner, H., VanSistine, D. P., and Cress, J.: A New High-Resolution Map of World Mountains and an Online Tool for Visualizing and Comparing Characterizations of Global Mountain Distributions, Mount. Res. Dev., 38, 240–249, https://doi.org/10.1659/MRD-JOURNAL-D-17-00107.1, 2018. a, b, c
Schubiger, A., Barber, S., and Nordborg, H.: Evaluation of the lattice Boltzmann method for wind modelling in complex terrain, Wind Energ. Sci., 5, 1507–1519, https://doi.org/10.5194/wes-5-1507-2020, 2020. a
Shaw, W. J., Berg, L. K., Cline, J., Draxl, C., Djalalova, I., Grimit, E. P., Lundquist, J. K., Marquis, M., McCaa, J., Olson, J. B., Sivaraman, C., Sharp, J., and Wilczak, J. M.: The Second Wind Forecast Improvement Project (WFIP2): General Overview, B. Am. Meteorol. Soc., 100, 1687–1699, https://doi.org/10.1175/BAMS-D-18-0036.1, 2019. a
Son, C. and Kim, T.: Development of an icing simulation code for rotating wind turbines, J. Wind Eng. Indust. Aerodynam., 203, 104239, https://doi.org/10.1016/j.jweia.2020.104239, 2020. a
Stawiarski, C., Träumner, K., Knigge, C., and Calhoun, R.: Scopes and Challenges of Dual-Doppler Lidar Wind Measurements – An Error Analysis, J. Atmos. Ocean. Tech., 30, 2044–2062, https://doi.org/10.1175/JTECH-D-12-00244.1, 2013. a
Straka, T. M., Fritze, M., and Voigt, C. C.: The human dimensions of a green–green-dilemma: Lessons learned from the wind energy – wildlife conflict in Germany, Energ. Rep., 6, 1768–1777, https://doi.org/10.1016/j.egyr.2020.06.028, 2020. a
Strauss, L., Serafin, S., and Dorninger, M.: Skill and Potential Economic Value of Forecasts of Ice Accretion on Wind Turbines, J. Appl. Meteorol. Clim., 59, 1845–1864, https://doi.org/10.1175/JAMC-D-20-0025.1, 2020. a
Swytink-Binnema, N., Godreau, C., and Arbez, C.: Detecting instrumental icing using automated double anemometry, Wind Energy, 22, 80–88, https://doi.org/10.1002/we.2271, 2019. a
Tabas, D., Fang, J., and Porté-Agel, F.: Wind Energy Prediction in Highly Complex Terrain by Computational Fluid Dynamics, Energies, 12, 1311, https://doi.org/10.3390/en12071311, 2019. a
Thompson, G.: High Resolution Numerical Weather Model Forecasts of Icing at the Ground and in the Air, in: Proc. of the Int. Workshop on Atmospheric Icing of Structures, IWAIS 2019, https://iwais2019.is/images/Papers/042_iwais_thompson.pdf (last access: 1 October 2022), 2019. a
Tong, D., Farnham, D. J., Duan, L., Zhang, Q., Lewis, N. S., Caldeira, K., and Davis, S. J.: Geophysical constraints on the reliability of solar and wind power worldwide, Nat. Commun., 12, 6146, https://doi.org/10.1038/s41467-021-26355-z, 2021. a
USGS: Geosciences and Environmental Change Science Center, https://rmgsc.cr.usgs.gov/gme/gme. shtml, last access: 1 October 2022. a
Vanderwende, B. J. and Lundquist, J. K.: The modification of wind turbine performance by statistically distinct atmospheric regimes, Environ. Res. Lett., 7, 034035, https://doi.org/10.1088/1748-9326/7/3/034035, 2012. a
Vanderwende, B. J., Lundquist, J. K., Rhodes, M. E., Takle, E. S., and Irvin, S. L.: Observing and Simulating the Summertime Low-Level Jet in Central Iowa, Mon. Weather Rev., 143, 2319–2336, https://doi.org/10.1175/MWR-D-14-00325.1, 2015. a
van Kuik, G. A. M., Peinke, J., Nijssen, R., Lekou, D., Mann, J., Sørensen, J. N., Ferreira, C., van Wingerden, J. W., Schlipf, D., Gebraad, P., Polinder, H., Abrahamsen, A., van Bussel, G. J. W., Sørensen, J. D., Tavner, P., Bottasso, C. L., Muskulus, M., Matha, D., Lindeboom, H. J., Degraer, S., Kramer, O., Lehnhoff, S., Sonnenschein, M., Sørensen, P. E., Künneke, R. W., Morthorst, P. E., and Skytte, K.: Long-term research challenges in wind energy – a research agenda by the European Academy of Wind Energy, Wind Energ. Sci., 1, 1–39, https://doi.org/10.5194/wes-1-1-2016, 2016. a, b
Vasiljević, N., L. M. Palma, J. M., Angelou, N., Carlos Matos, J., Menke, R., Lea, G., Mann, J., Courtney, M., Frölen Ribeiro, L., and M. G. C. Gomes, V. M.: Perdigão 2015: methodology for atmospheric multi-Doppler lidar experiments, Atmos. Meas. Tech., 10, 3463–3483, https://doi.org/10.5194/amt-10-3463-2017, 2017. a
Vasiljevic, N., Klaas, T., Pauscher, L., Lopes, J. C., Gomes, D. F., Abreuand, R., and Bardal, L. M.: e-WindLidar: making wind lidar data FAIR, Zenodo [data set], https://doi.org/10.5281/zenodo.2478051, 2018. a
Vasiljević, N., Harris, M., Tegtmeier Pedersen, A., Rolighed Thorsen, G., Pitter, M., Harris, J., Bajpai, K., and Courtney, M.: Wind sensing with drone-mounted wind lidars: proof of concept, Atmos. Meas. Tech., 13, 521–536, https://doi.org/10.5194/amt-13-521-2020, 2020a. a
Vasiljević, N., Vignaroli, A., Bechmann, A., and Wagner, R.: Digitalization of scanning lidar measurement campaign planning, Wind Energ. Sci., 5, 73–87, https://doi.org/10.5194/wes-5-73-2020, 2020b. a
Veers, P., Dykes, K., Lantz, E., Barth, S., Bottasso, C. L., Carlson, O., Clifton, A., Green, J., Green, P., Holttinen, H., Laird, D., Lehtomäki, V., Lundquist, J. K., Manwell, J., Marquis, M., Meneveau, C., Moriarty, P., Munduate, X., Muskulus, M., Naughton, J., Pao, L., Paquette, J., Peinke, J., Robertson, A., Rodrigo, J. S., Sempreviva, A. M., Smith, J. C., Tuohy, A., and Wiser, R.: Grand challenges in the science of wind energy, Science, 366, 6464, https://doi.org/10.1126/science.aau2027, 2019. a, b
Wagenbrenner, N. S., Forthofer, J. M., Lamb, B. K., Shannon, K. S., and Butler, B. W.: Downscaling surface wind predictions from numerical weather prediction models in complex terrain with WindNinja, Atmos. Chem. Phys., 16, 5229–5241, https://doi.org/10.5194/acp-16-5229-2016, 2016. a
Wagner, D., Steinfeld, G., Witha, B., Wurps, H., and Reuder, J.: Low Level Jets over the Southern North Sea, Meteorol. Z., 28, 389–415, https://doi.org/10.1127/metz/2019/0948, 2019. a
Wagner, R., Courtney, M., Gottschall, J., and Lindelow-Marsden, P.: Accounting for the speed shear in wind turbine power performance measurement, Wind Energy, 14, 993–1004, https://doi.org/10.1002/we.509, 2011. a
Wharton, S. and Lundquist, J. K.: Atmospheric stability affects wind turbine power collection, Environ. Res. Lett., 7, 014005, https://doi.org/10.1088/1748-9326/7/1/014005, 2012. a
Wilczak, J., Finley, C., Freedman, J., Cline, J., Bianco, L., Olson, J., Djalalova, I., Sheridan, L., Ahlstrom, M., Manobianco, J., Zack, J., Carley, J. R., Benjamin, S., Coulter, R., Berg, L. K., Mirocha, J., Clawson, K., Natenberg, E., and Marquis, M.: The Wind Forecast Improvement Project (WFIP): A Public-Private Partnership Addressing Wind Energy Forecast Needs, B. Am. Meteorol. Soc., 96, 1699–1718, https://doi.org/10.1175/BAMS-D-14-00107.1, 2015. a
Würth, I., Valldecabres, L., Simon, E., Möhrlen, C., Uzunoğlu, B., Gilbert, C., Giebel, G., Schlipf, D., and Kaifel, A.: Minute-Scale Forecasting of Wind Power – Results from the Collaborative Workshop of IEA Wind Task 32 and 36, Energies, 12, 712, https://doi.org/10.3390/en12040712, 2019. a
Zängl, G.: Extending the Numerical Stability Limit of Terrain-Following Coordinate Models over Steep Slopes, Mon. Weather Rev., 140, 3722–3733, https://doi.org/10.1175/MWR-D-12-00049.1, 2012. a
- Abstract
- Introduction
- Site prospecting
- Wind resource assessment
- Project planning
- Wind turbine design
- Operational wind plants
- General challenges
- Conclusions
- Appendix A: Definition of mountainous terrain
- Data availability
- Author contributions
- Competing interests
- Disclaimer
- Financial support
- Review statement
- References
complexand are hard to develop. This paper sets out the research and development (R&D) needed to make it easier and cheaper to harness wind energy there. This includes collaborative R&D facilities, improved wind and weather models, frameworks for sharing data, and a clear definition of site complexity.
- Abstract
- Introduction
- Site prospecting
- Wind resource assessment
- Project planning
- Wind turbine design
- Operational wind plants
- General challenges
- Conclusions
- Appendix A: Definition of mountainous terrain
- Data availability
- Author contributions
- Competing interests
- Disclaimer
- Financial support
- Review statement
- References