the Creative Commons Attribution 4.0 License.
the Creative Commons Attribution 4.0 License.
 | 12 Sep 2023
Towards smart blades for vertical axis wind turbines: different airfoil shapes and tip speed ratios
Mohammad Rasoul Tirandaz
Abdolrahim Rezaeiha
Daniel Micallef
Future wind turbines will benefit from state-of-the-art technologies that allow them to not only operate efficiently in any environmental condition but also maximise the power output and cut the cost of energy production. Smart technology, based on morphing blades, is one of the promising tools that could make this possible. The present study serves as a first step towards designing morphing blades as functions of azimuthal angle and tip speed ratio for vertical axis wind turbines. The focus of this work is on individual and combined quasi-static analysis of three airfoil shape-defining parameters, namely the maximum thickness and its chordwise position as well as the leading-edge radius index I. A total of 126 airfoils are generated for a single-blade H-type Darrieus turbine with a fixed blade and spoke connection point at . The analysis is based on 630 high-fidelity transient 2D computational fluid dynamics (CFD) simulations previously validated with experiments. The results show that with increasing tip speed ratio the optimal maximum thickness decreases from 24 %c (percent of the airfoil chord length in metres) to 10 %c, its chordwise position shifts from 35 %c to 22.5 %c, while the corresponding leading-edge radius index remains at 4.5. The results show an average relative improvement of 0.46 and an average increase of nearly 0.06 in CP for all the values of tip speed ratio.
- Article
(15062 KB) - Full-text XML
- BibTeX
- EndNote


1.1 State of the art
Morphing technology has the potential to improve the performance of flying bodies by adapting their shape to different operational conditions. This can result in improved aerodynamic efficiency and the release of unwanted stresses (Debiasi et al., 2011; Wang et al., 2014). Nature has given birds the capability of continuous morphing to generate enough lift for various flight manoeuvers. These bio-inspirational sources served as models for possible morphing vehicles and provided the pioneering researchers with a new method of improving aerodynamic efficiency (Wlezien et al., 1998). However, because of the technological limitations of the day, it was not possible to reach the level of smooth shape-changing capabilities as seen in birds (Barbarino et al., 2011). This led to the development of shape changing by using ailerons, slats, flaps or variable sweep (Debiasi et al., 2011). Nowadays, advances in smart technologies have enabled such needs to be satisfied. Wing morphing is used in the aerospace industry to improve the aerodynamic efficiency and adaptability of aircraft (Ajaj et al., 2021; Yan et al., 2019), helicopters (Riemenschneider et al., 2019; Sal, 2020), micro air vehicles (Siddall et al., 2017) and unmanned air vehicles (Mir et al., 2018; Thangeswaran et al., 2019).
The blades of a wind turbine operate at relatively low wind speeds with a low level of risk. Nevertheless, morphing technology can still be of benefit for wind turbine purposes without the challenges that must be overcome in aerospace applications (e.g. additional flight control system and law to handle the complex and large-scale changes in aerodynamic surfaces at both low-speed and high-speed flight conditions) (Beyene and Peffley, 2007). The impacts of morphing blades have been extensively studied for horizontal axis wind turbines (HAWTs). For example, the effects of morphed trailing edge were studied by Daynes and Weaver (2012); in another work, morphing twist was found to reduce the fatigue life of turbine blades (Lachenal et al., 2013); in a work by MacPhee and Beyene (2015), morphing blade pitch was discovered to improve the performance of HAWTs; and the effects of morphed trailing-edge flap on the aerodynamic load control were investigated by Zhuang et al. (2020).
The angle of attack α of a vertical axis wind turbine (VAWT) blade varies periodically between positive and negative values. Through this quasi-sinusoidal variation, the angle of attack α often exceeds the static stall angle αss, and the blade undergoes unsteady separation, resulting in the occurrence of dynamic stall and hysteresis effects on aerodynamic loads (Hand et al., 2017; Mulleners and Raffel, 2012; Rezaeiha et al., 2019a). When a turbine is operating at low λ, it benefits from the early stages of the dynamic stall, that is, the performance of the blade increases due to an overshoot in lift coefficient Cl; however, the overall power output is affected negatively by the consequential sudden drop in Cl (Amet et al., 2009; Tirandaz and Rezaeiha, 2021). These complex aerodynamics make the development of a single optimal airfoil for VAWTs a challenging process.
To date, the performance of VAWTs, which very often use airfoils used in the helicopter industry (Rezaeiha et al., 2020b; Sahebzadeh et al., 2020), has been studied for airfoil parameters such as thickness-to-chord ratio and camber C as proposed in Song et al. (2020); Mazarbhuiya et al. (2020); Nguyen and Tran (2015); Jain and Saha (2020); and Bianchini et al. (2015). More recently, a few studies have been conducted to improve the performance of VAWTs via optimising the airfoil shape-defining parameters (e.g. maximum thickness , chordwise position of maximum thickness , leading-edge radius rLE and camber C) (Bedon et al., 2016; Ma et al., 2018; Ismail and Vijayaraghavan, 2015). Briefly summarised, these studies reveal that the airfoil shape strongly influences the torque characteristics and pressure distribution of the rotor; the type of stall mechanism; the aerodynamic load coefficients, namely lift and drag coefficients (Cl and Cd); the self-starting capability; and the power coefficient of VAWTs. However, the majority of these studies, which include a few test cases, have addressed the impacts of a single parameter and keeping the others fixed. This is while it has been shown that the airfoil shape-defining parameters have combined impacts on VAWT performance (Tirandaz and Rezaeiha, 2021). Therefore, such analysis might be misleading by not presenting the global picture. The proven dependency of VAWT performance on airfoil shape means that the design of morphing blades, which can adapt their shapes to variables such as azimuthal angle θ and tip speed ratio λ, is worth pursuing. In a smart rotor, as the blade profile morphs into a new geometry due to changes in azimuthal position or wind speed, the separation point will move to an optimal coordinate. As a result, flow detachment can be reduced or delayed to higher α, and severe dynamic stall characteristics can be controlled or even avoided in the case of unsteady separation at low λ, resulting in improved turbine performance (Tan and Paraschivoiu, 2017; Tirandaz and Rezaeiha, 2021).
Detailed analysis of the literature on morphing airfoils shows that the majority of studies focused on morphing trailing edges. For example, in an experimental study by Pechlivanoglou et al. (2010), positive flap deflection was found to significantly increase lift force, while negative flap deflection results in lift reduction, which is effective in rotor deceleration. A numerical study by Wolff et al. (2014) has shown that morphing trailing edges, specifically the deflection angles and increasing length of the morphing trailing edge, have significant impact on lift force and, thus, the stall characteristics of the blade. In another work by Minetto and Paraschivoiu (2020), a deformable trailing edge was discovered to alleviate the dynamic stall characteristics and improve the power output of VAWTs. Tan and Paraschivoiu (2017) showed that morphing the blade aileron to have the optimal shape for upwind and downwind quartiles can improve the aerodynamic performance of VAWTs. In addition, in a numerical study, it was found that changing the airfoil shape-defining parameters has a substantial impact on the power performance of VAWT operating in the dynamic stall regime (Tirandaz and Rezaeiha, 2021).
Despite the existence of this reported literature, several shape-defining parameters have received much less attention. Such parameters are hypothesised to have an influence on boundary layer events and the resultant aerodynamic loads. Therefore, a parametric analysis of these variables, with their potential to morph, would provide fundamental knowledge towards designing morphing blades for smart VAWTs.
1.2 Objectives
The present work follows the objectives below:
- i.
to pave the road towards smart blades for VAWTs, having the capability of adaptation to different operational conditions;
- ii.
to provide a set of generalisable conclusions from 630 transient simulations for 126 unique airfoils, generated with different values of maximum thickness , chordwise position of maximum thickness and leading-edge radius index I at five different values of λ and, thus, understand the impact of different morphed-airfoil scenarios on the turbine power performance CP as well as the thrust performance CT;
- iii.
to prove the usefulness of the morphing technique as a promising tool to improve the power performance of VAWTs.
The reference airfoil is chosen from the symmetric modified NACA four-digit series. The modified airfoils are generated through changing the combination of the three aforementioned parameters. An unsteady Reynolds-averaged Navier–Stokes (URANS) approach, previously validated with experimental data, will be used for the analysis. The results will provide a set of optimal airfoils at each λ, as well as each azimuth angle, and thus make a conceptual step towards designing morphing blades for VAWTs.
1.3 Paper outline
The paper is organised as follows: Sect. 2 presents the computational settings and parameters for the simulations. The solution verification and validation studies are also included. Section 3 introduces the generated airfoil shapes. In Sect. 4, the results are presented in two scenarios. Sections 5, 6 and 7 are devoted to the discussion, research limitations and conclusions, respectively.
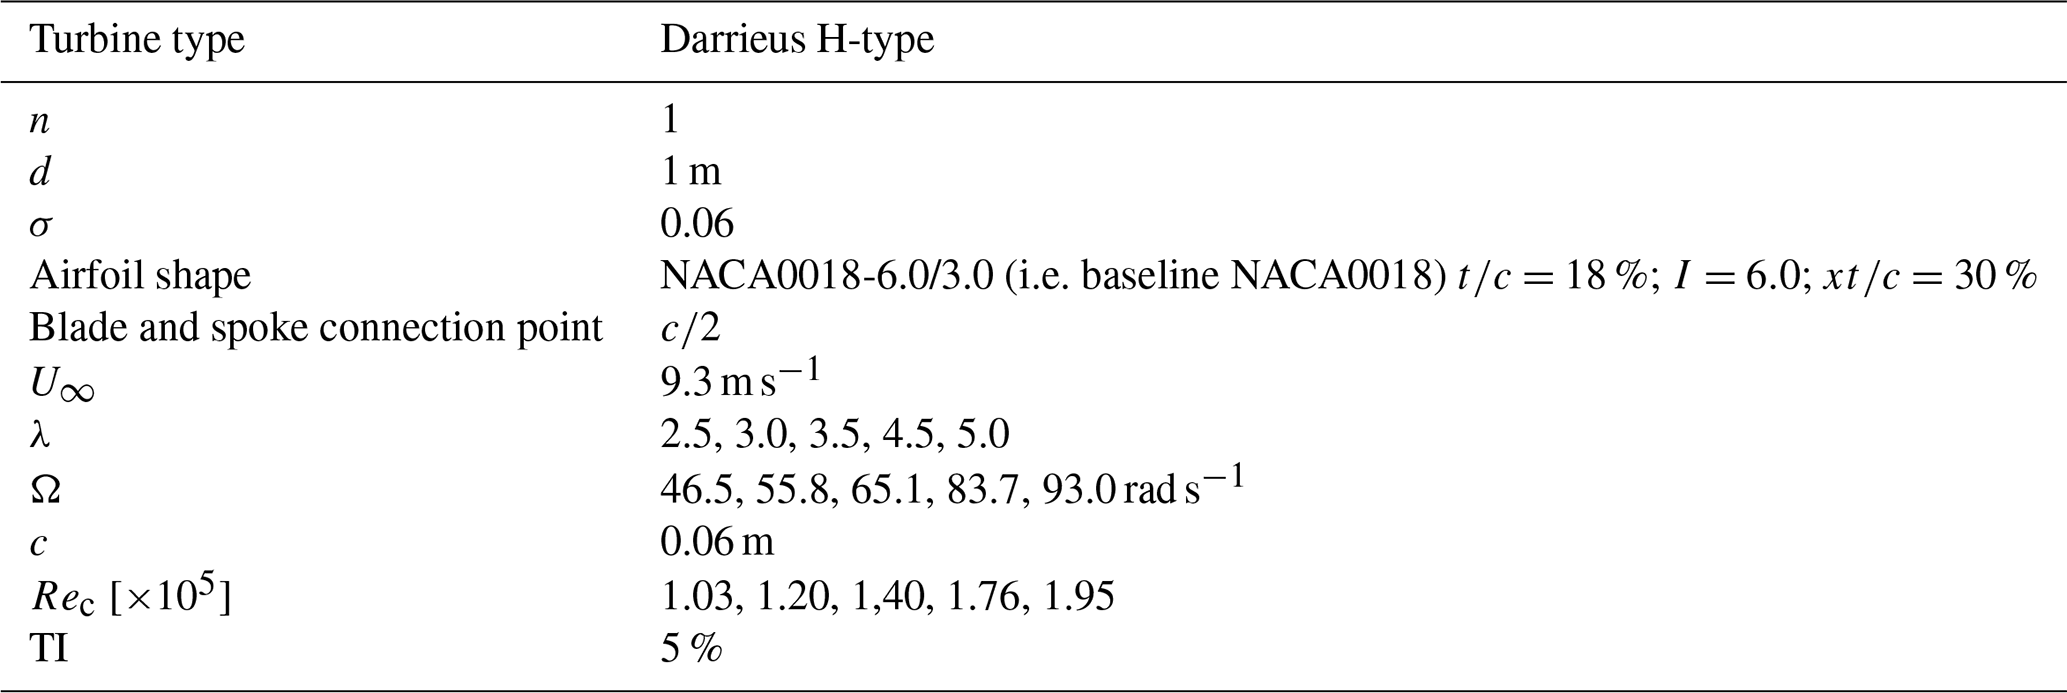
2.1 Reference turbine characteristics
A single-bladed Darrieus H-type VAWT was chosen as the reference case for this study (see Fig. 1 and Table 1). The turbine is a simplified representation of the original one used by Tescione et al. (2014). That is, the turbine shaft and spokes are removed and there is only one blade. Note that the conclusions are not significantly affected by these components. The reader is referred to our earlier works (Rezaeiha et al., 2017b, 2018a), where it is shown that for low-solidity VAWTs the power performance is almost independent of the shaft and number of blades. Therefore, such a simplified turbine model can effectively reduce the computational costs of the huge number of simulations (i.e. 630 transient simulations) for the present work and, at the same time, provide reliable results. Rezaeiha et al. (2018a, b) are used to select the rest of the geometrical and operational characteristics of the reference turbine.
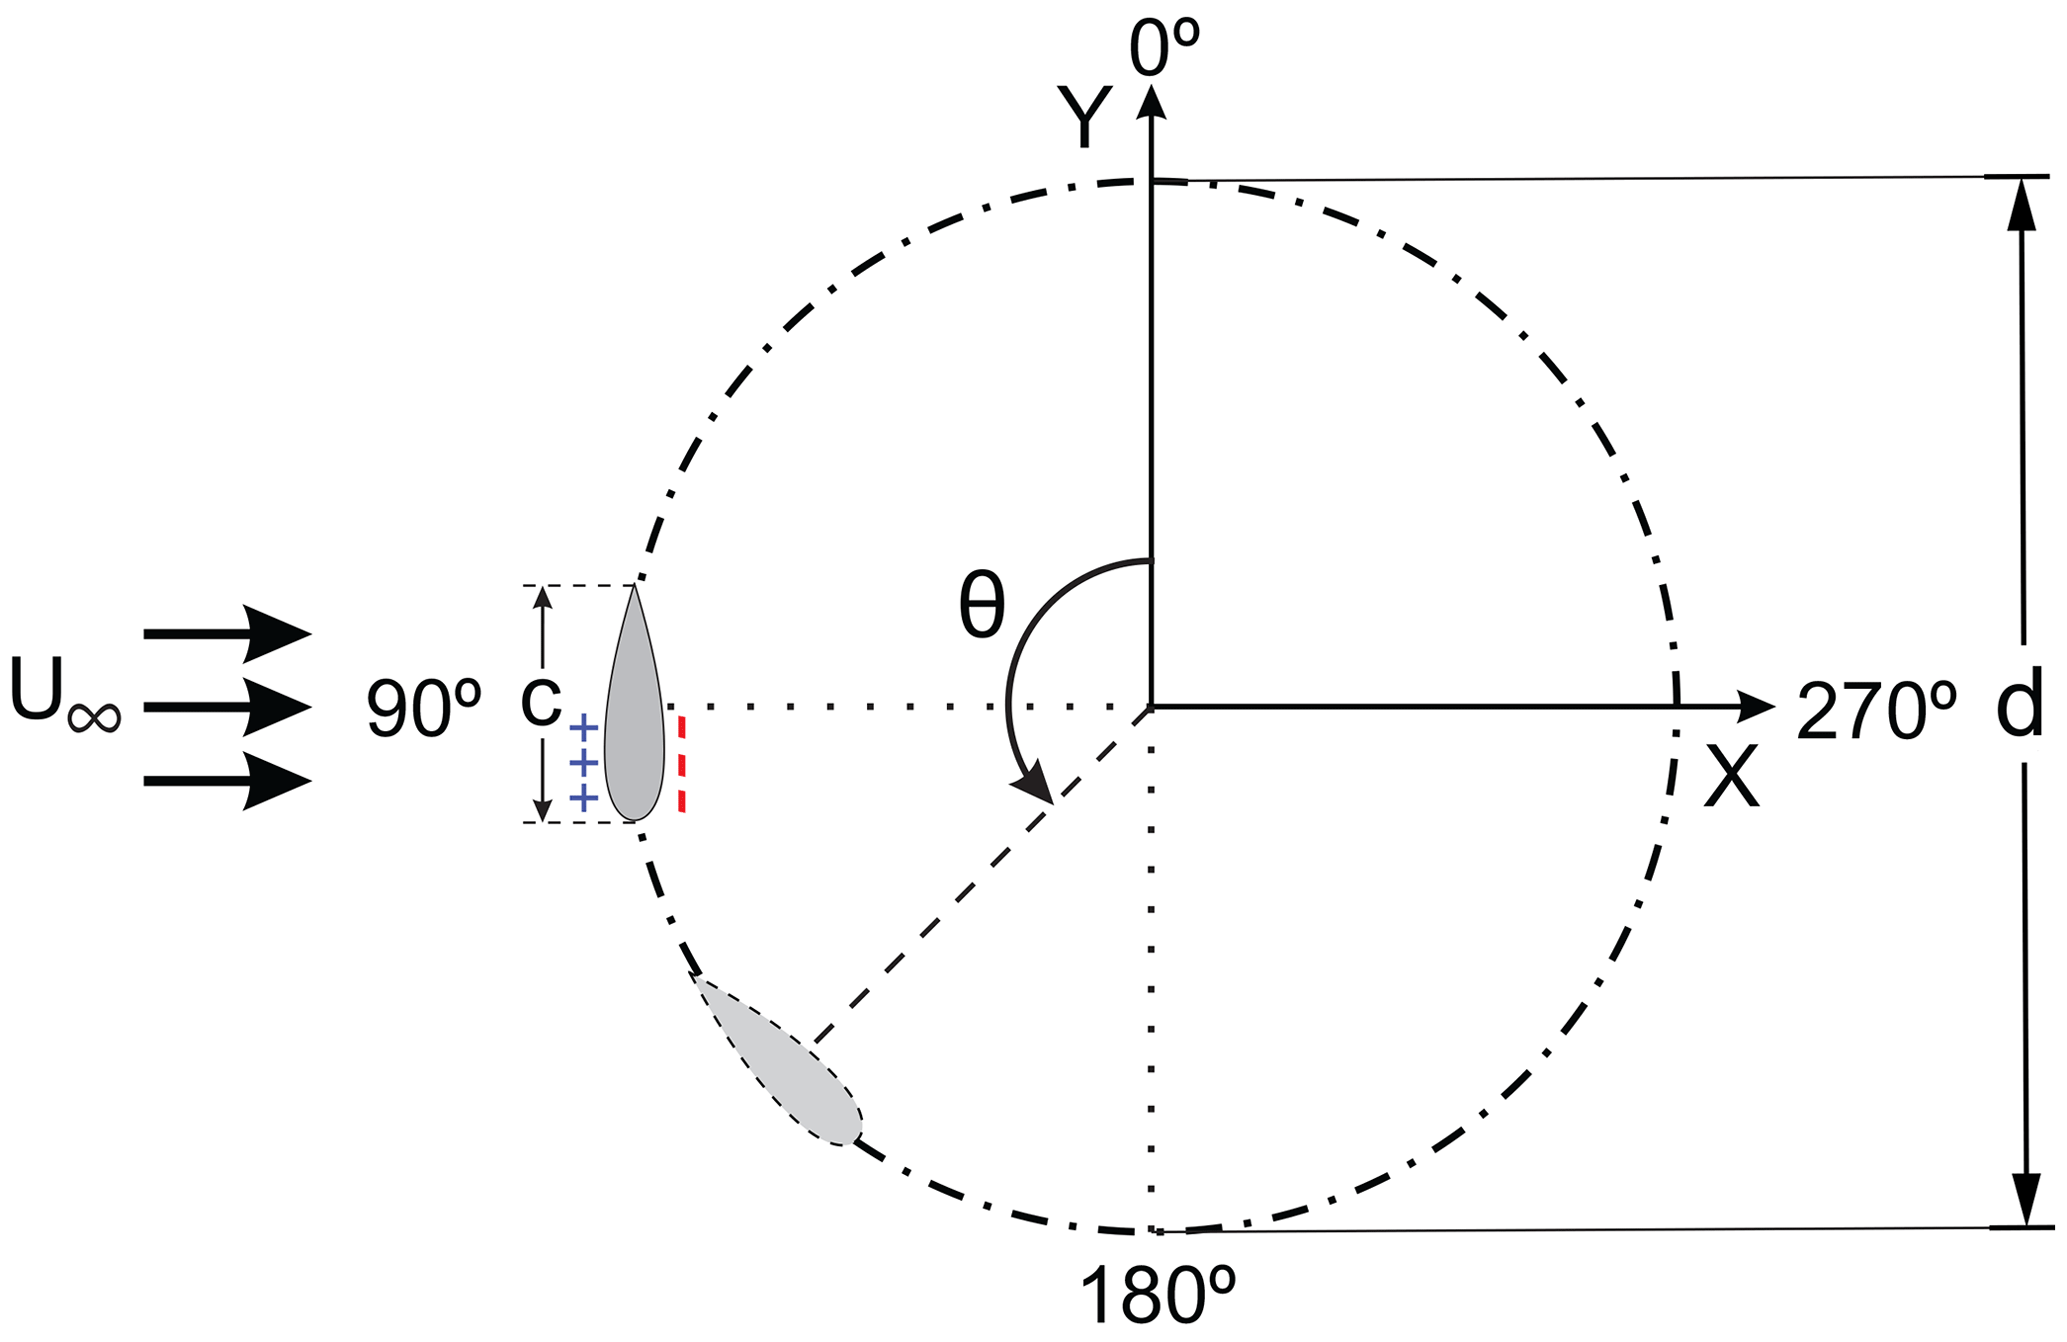
Figure 1The reference turbine (not to scale). The plus symbol (+) indicates the airfoil pressure side and the minus (−) the suction side for .
2.2 Computational settings
The commercial flow solver ANSYS Fluent v2019R2 is employed for the 2D incompressible URANS simulations coupled with the four-equation transition shear stress transport (SST) turbulence model. The simulations are solved using second-order spatial and temporal discretisation and the SIMPLE pressure–velocity coupling scheme. The computational domain, grid and boundary conditions are summarised in Table 2. The schematic of the computational domain and the computational grid and its subregions are shown in Fig. 2.
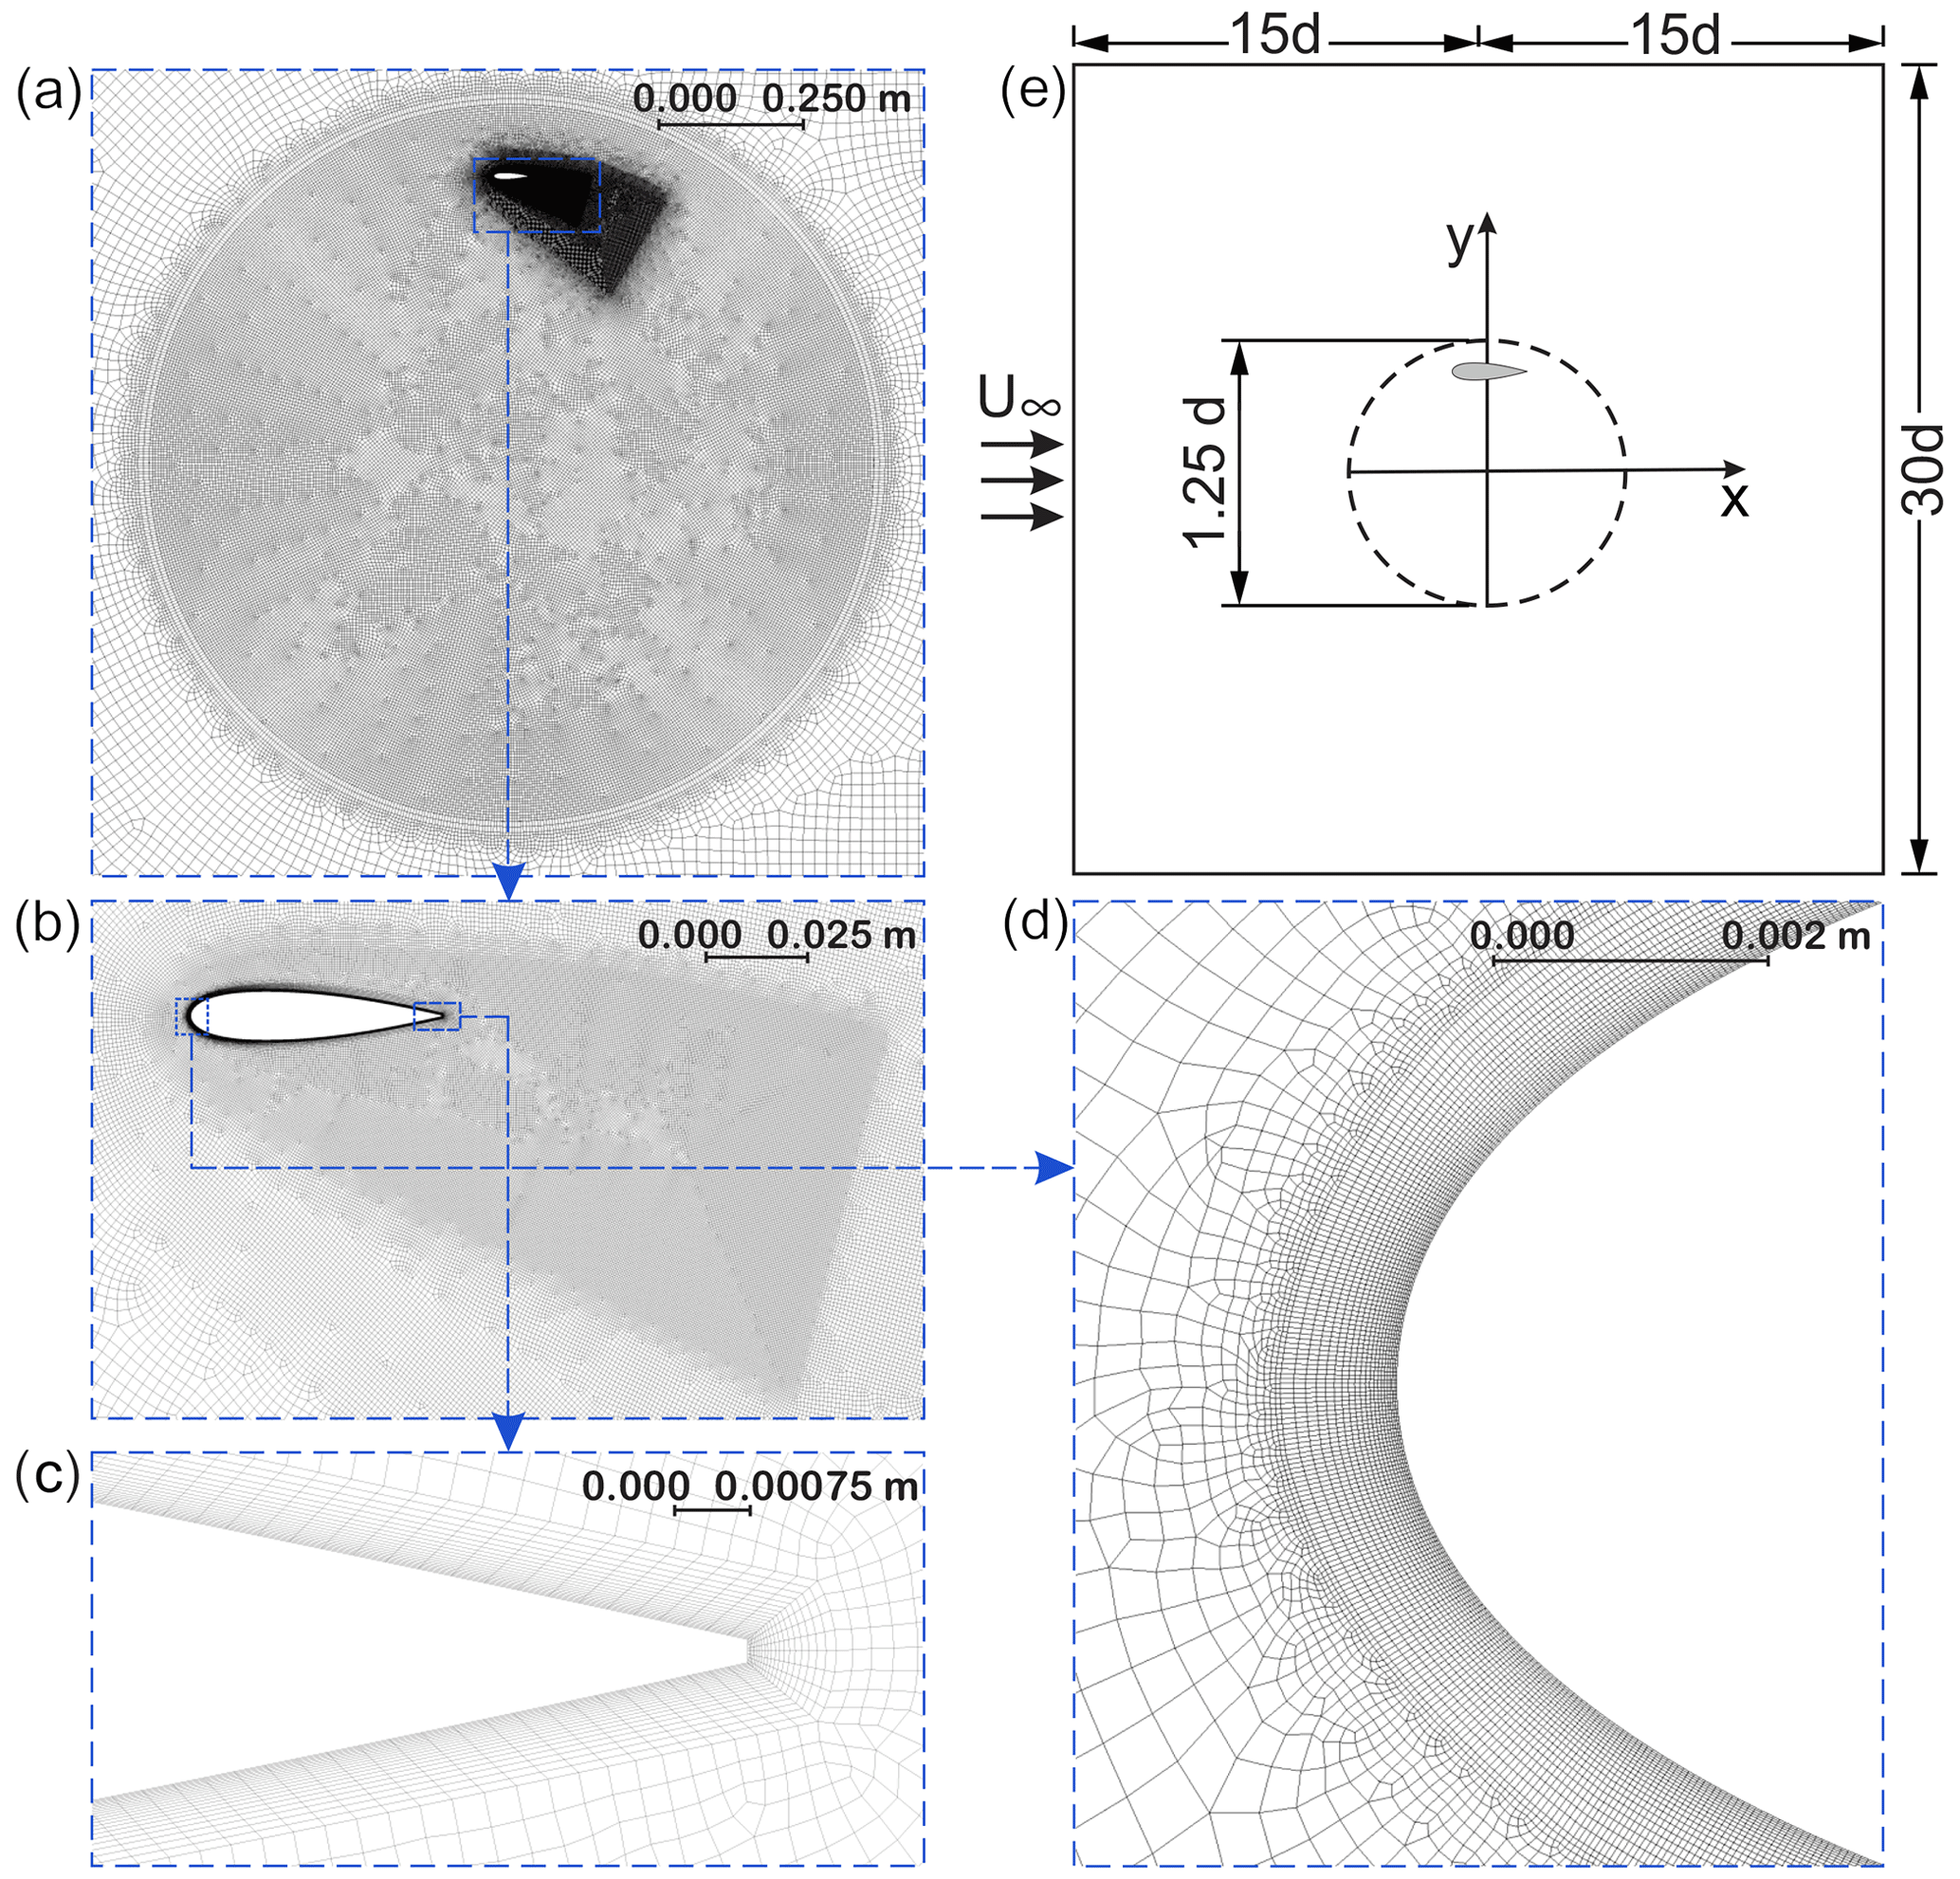
Table 2Details of computational domain, grid and boundary conditions.
Some attempts have been made to identify the proper computational settings for the simulation of the H-type Darrieus turbine (Balduzzi et al., 2016a, b). However, in this work, the turbulence model is selected based on our previous findings (Rezaeiha et al., 2019b, 2020a). Best-practice guidelines for the computational fluid dynamics (CFD) simulations of VAWTs are used to select the domain size, the azimuthal increment and the convergence criterion (Rezaeiha et al., 2018c). The corresponding absolute time-step values are , , , and s for λ=2.5, 3.0, 3.5, 4.5 and 5.5, respectively. With the selected dθ=0.1, 3600 time steps per turbine revolution are achieved. A total of 20 revolutions, i.e. 72 000 time steps, are simulated before the results of the present study are obtained at the 21st turbine revolution. Under these conditions, the statistical convergence of the transient simulations is ensured. In each case, a number of 20 iterations per time step is performed so that the scaled residuals stay .
2.3 Solution verification and validation
The domain type is selected based on our earlier studies, where the difference between 2D and 2.5D URANS simulations was found to be insignificant (Rezaeiha et al., 2017a). A grid convergence analysis using uniformly doubled grids has been performed and documented in Rezaeiha et al. (2019c), which for brevity is not repeated here. Three experimental studies with different test conditions previously were used to validate the CFD simulations. The different geometrical and operational characteristics of the turbines used in the experiments led to dissimilar conclusions (Tescione et al., 2014; Ferreira et al., 2009; Castelli et al., 2011), ensuring a high level of confidence in the accuracy of the CFD simulations. However, the reader is referred to Rezaeiha et al. (2019b) for more detailed descriptions of the validation studies.
Figure 3 shows a schematic drawing of the symmetric modified NACA four-digit airfoil and the selected shape-defining parameters for this study. These parameters are modified within their most common regimes as follows:
- i.
relative maximum thickness (): 10 %, 12 %, 15 %, 18 %, 21 % and 24 %;
- ii.
relative chordwise position of maximum thickness (): 20 %, 22.4 %, 25 %, 27.5 %, 30 %, 35 % and 40 %;
- iii.
index of leading-edge radius (I): 4.5, 6.0 and 7.5.
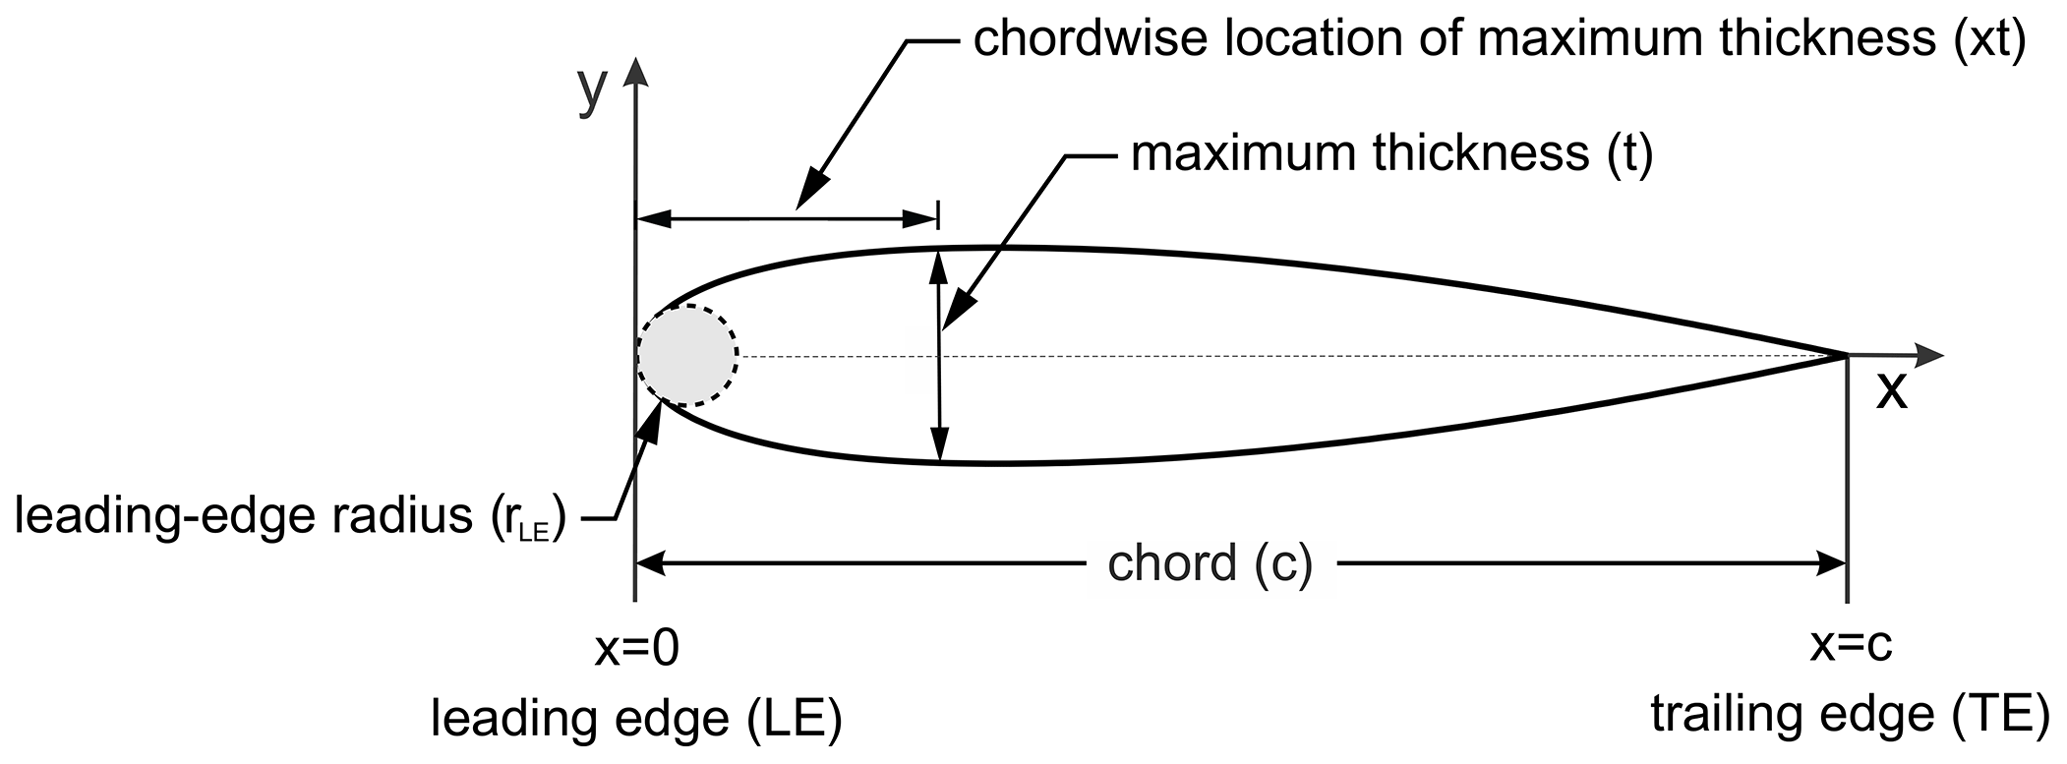
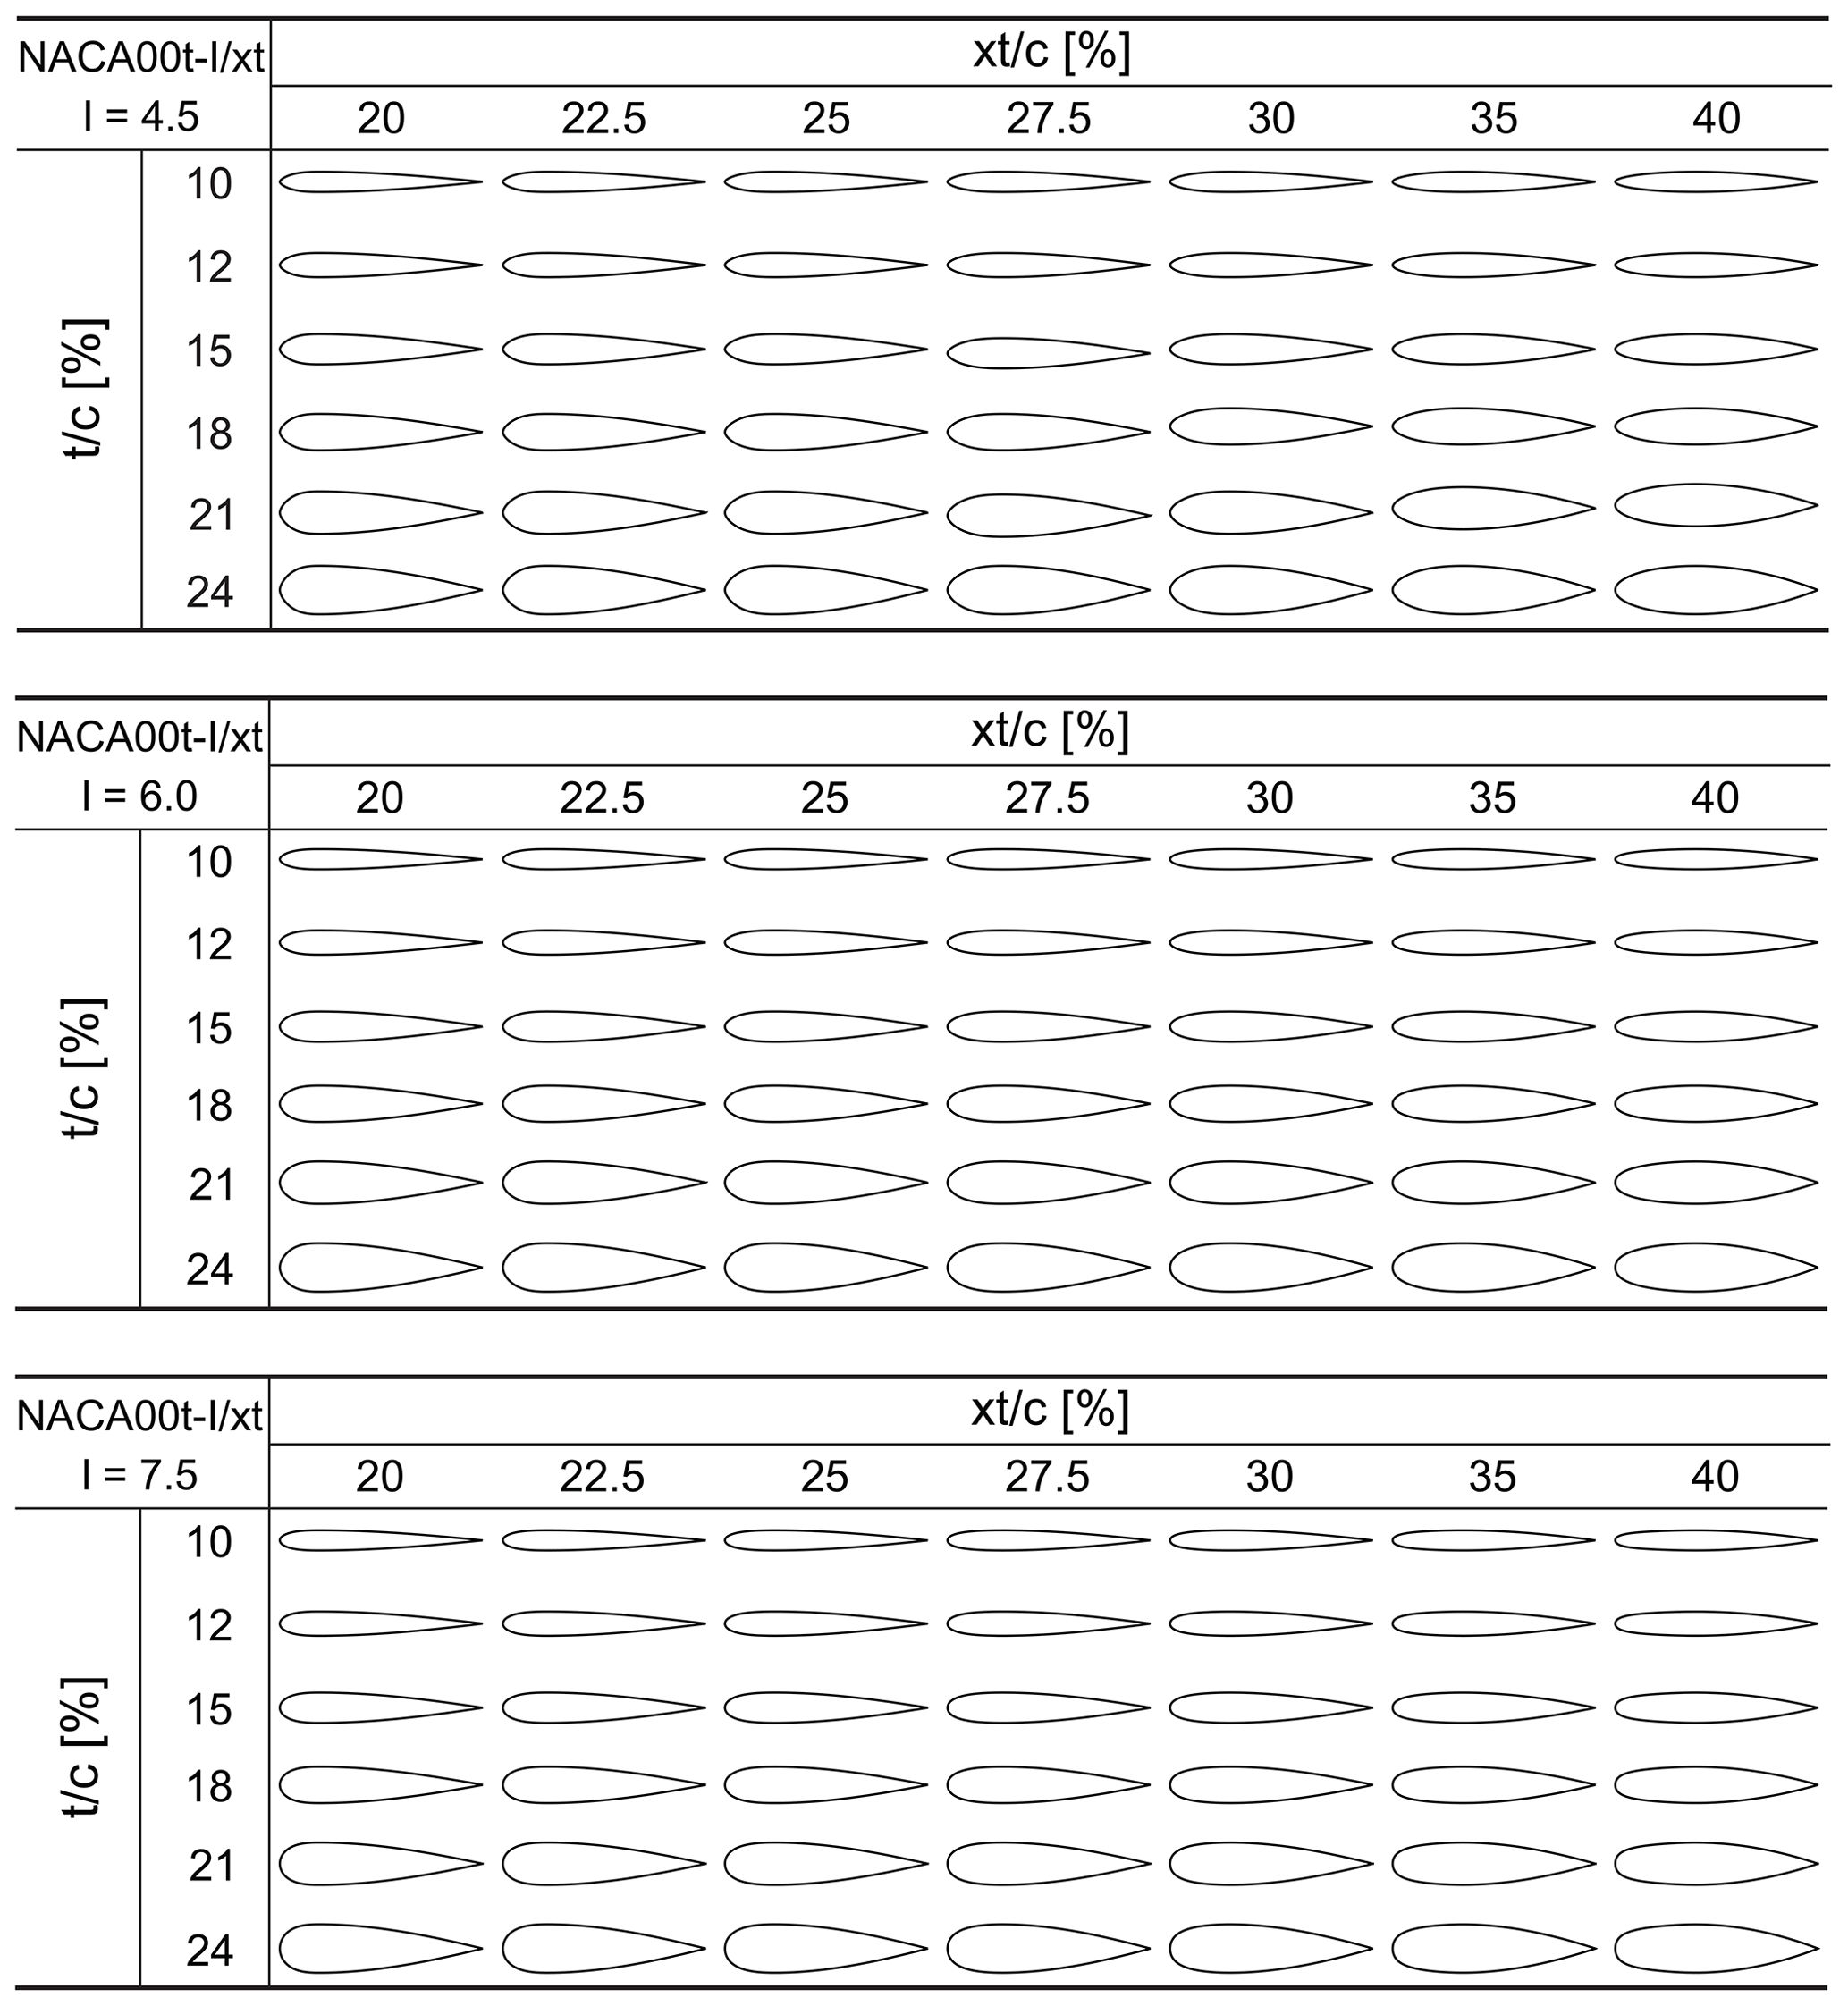
Note that any value of I out of the selected range results in a too-sharp or too-blunt leading edge. The analysis is based on 126 airfoil shapes (see Fig. 4). The modification of the airfoil coordinates and the related equations are documented in Tirandaz and Rezaeiha (2021). The focus of this study is on symmetric airfoils with zero camber. The modified airfoils are designated as the NACA00–. The first symbol from left to right, i.e. , represents the maximum thickness in percent of the airfoil chord length in metres (%c); the second one, I, shows the index of leading-edge radius (with one decimal precision); and the third one, , is the chordwise position of the maximum thickness in a 10th of the chord with two-decimal precision. For example, the NACA0024-4.5/3.50 has a maximum thickness of %, located at %, and a leading-edge radius index of I=4.5.
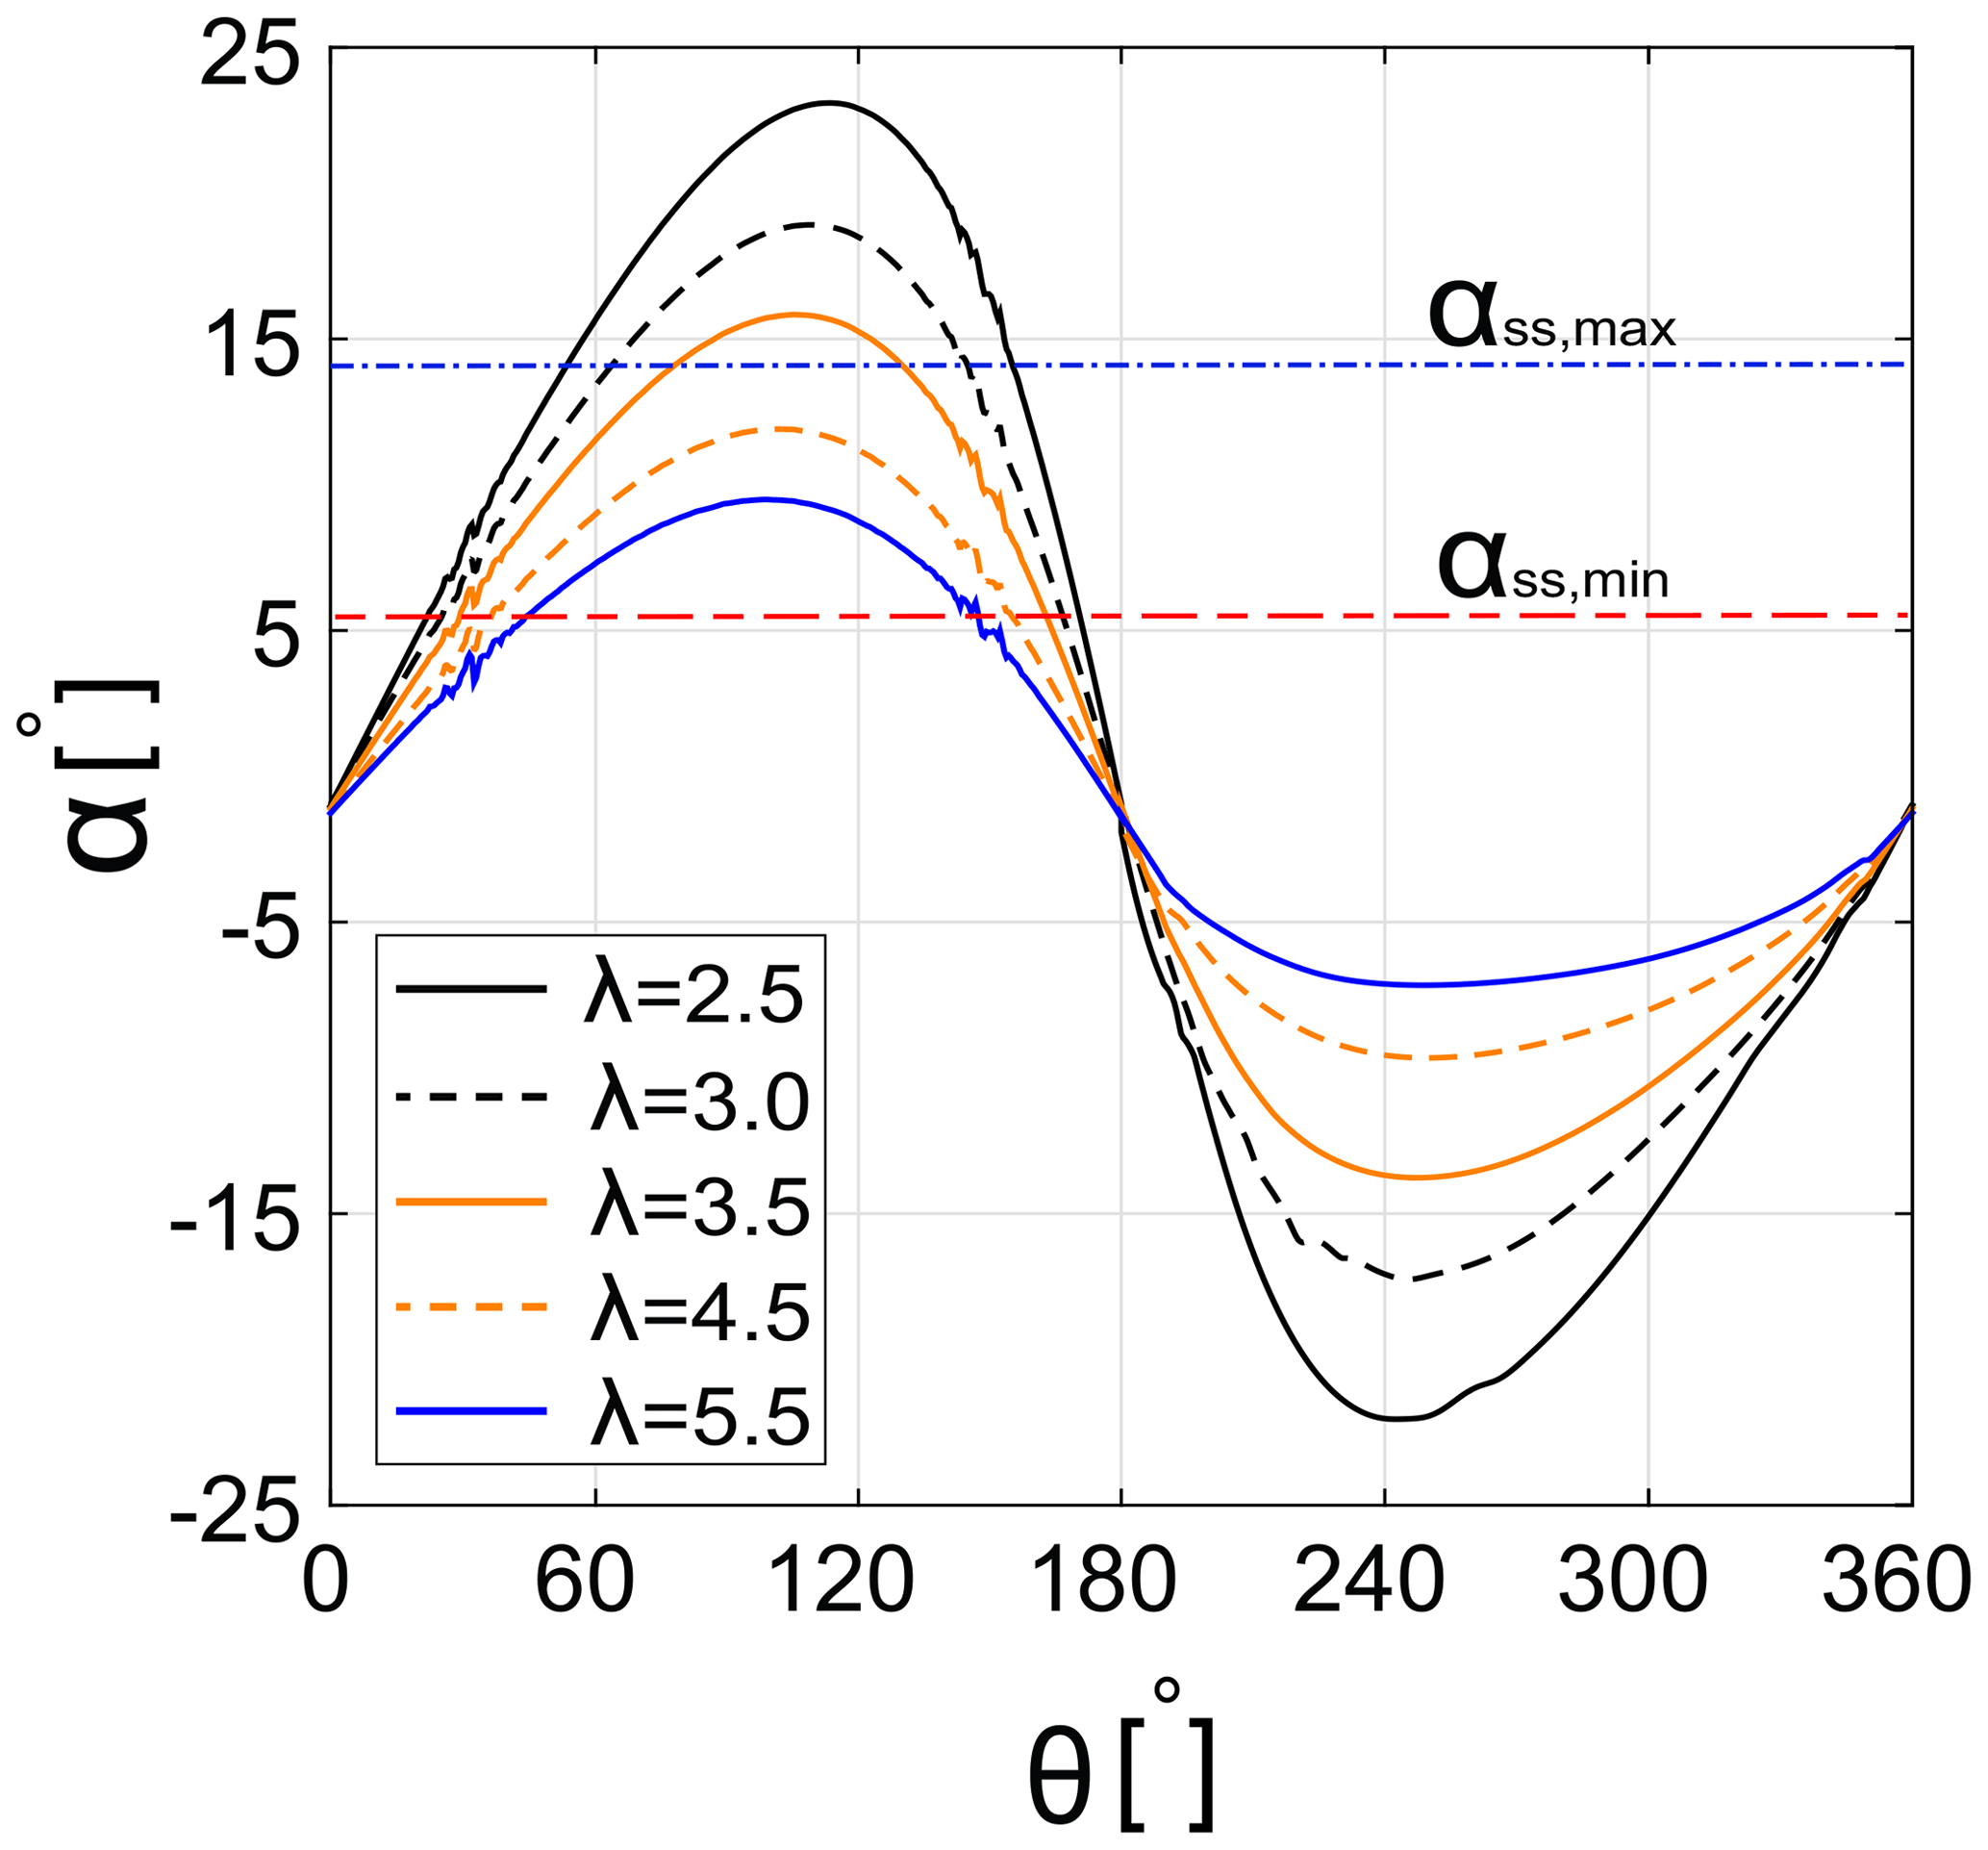
The results are presented in two scenarios, namely, optimal airfoils as functions of λ (Sect. 4.1) and dθ (Sect. 4.2). In Sect. 4.3 the performance of the optimal airfoils from the first scenario are compared with that of the reference airfoil. A coupled analysis is performed at different λ of 2.5, 3.0, 3.5, 4.5 and 5.5. Figure 5 depicts the variations of α as the turbine passes through its last revolution. Note that the higher the value of λ is, the more limited the variations of α are. For λ=2.5, 3.0 and 3.5, the variations of α exceeds the αss for all the studied airfoils, while at higher λ=4.5 and 5.5, this behaviour is not observed for all of the studied airfoils. The reader is referred to Rezaeiha et al. (2018b), where the method of calculating the α from the CFD results is provided in detail. However, in a recent study by Melani et al. (2020) an ad hoc inverse verification procedure was developed to compare the accuracy of three selected methods in calculating the angle of attack from the CFD flow field, including the 3-points, line average and trajectory approaches.
4.1 Modification of the airfoil shape-defining parameters
To derive the optimal airfoil for each λ, the combination of the , and Iopt corresponding to the turbine CP,max is determined. Sections 4.1.1 to 4.1.3 are devoted to the discussions on individual modification, and Sect. 4.1.4 presents an overall view on the combined modification of the aforementioned parameters.
4.1.1 Modification of the maximum thickness ()
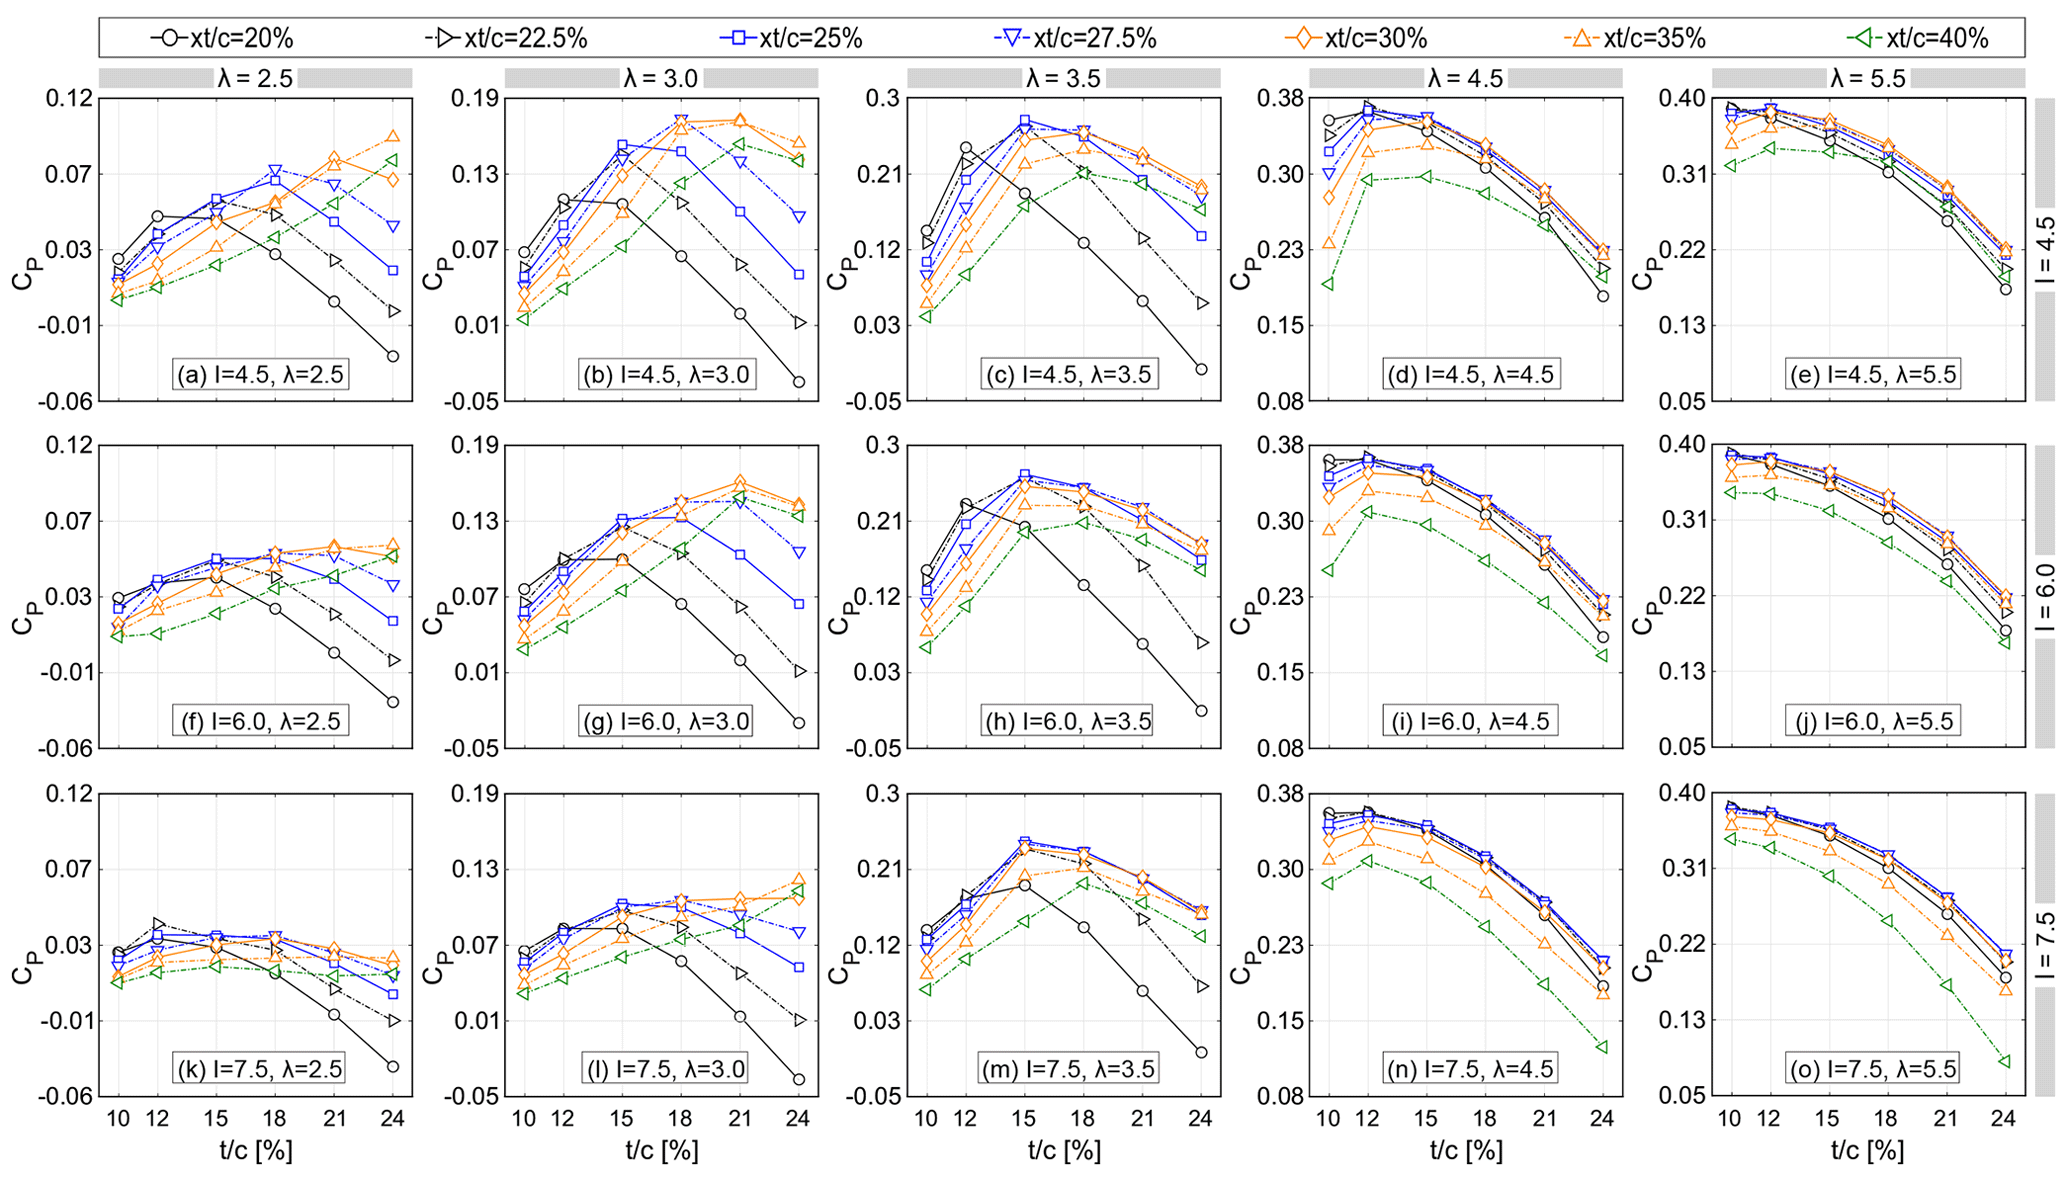
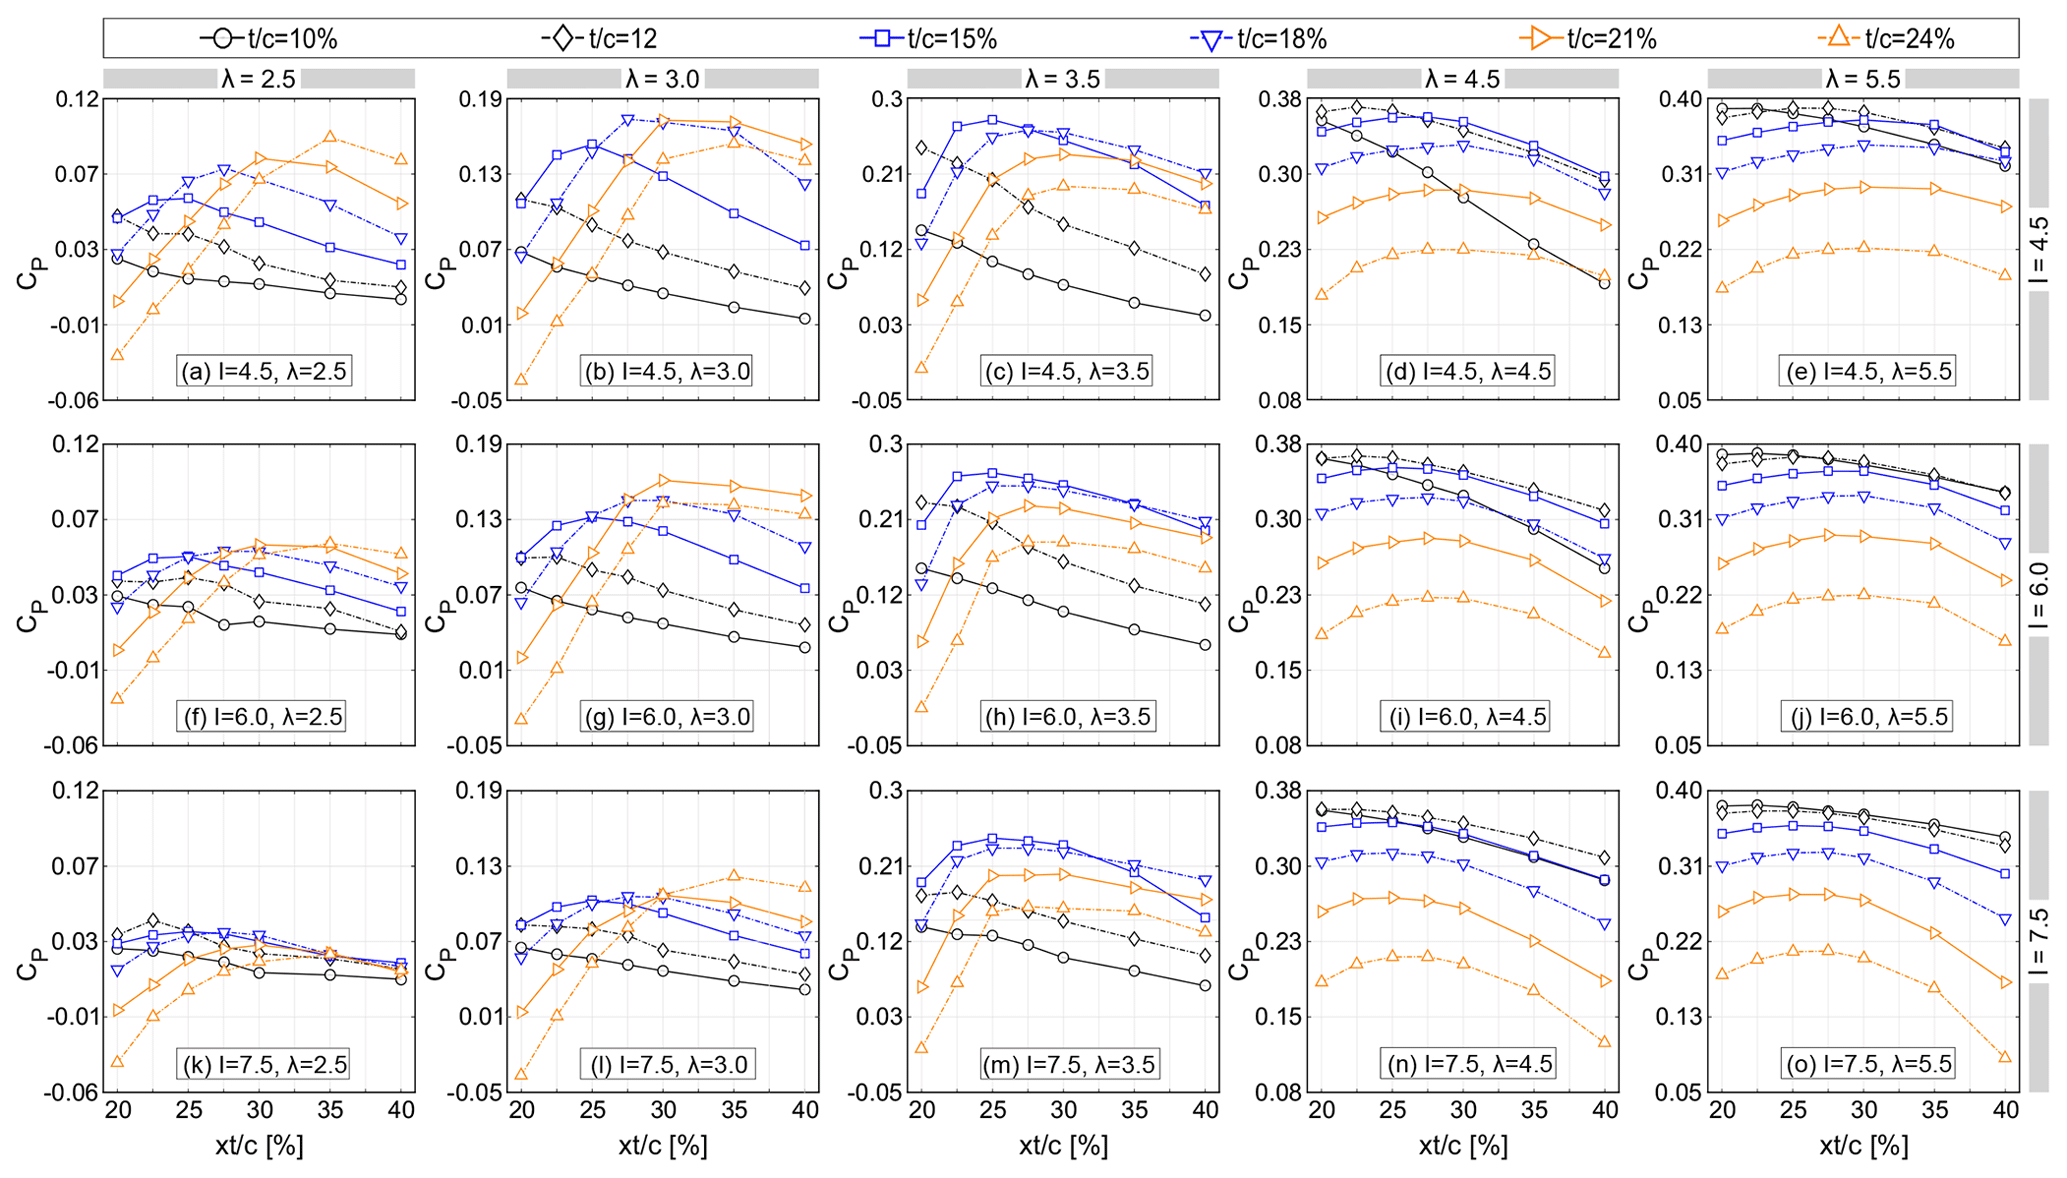
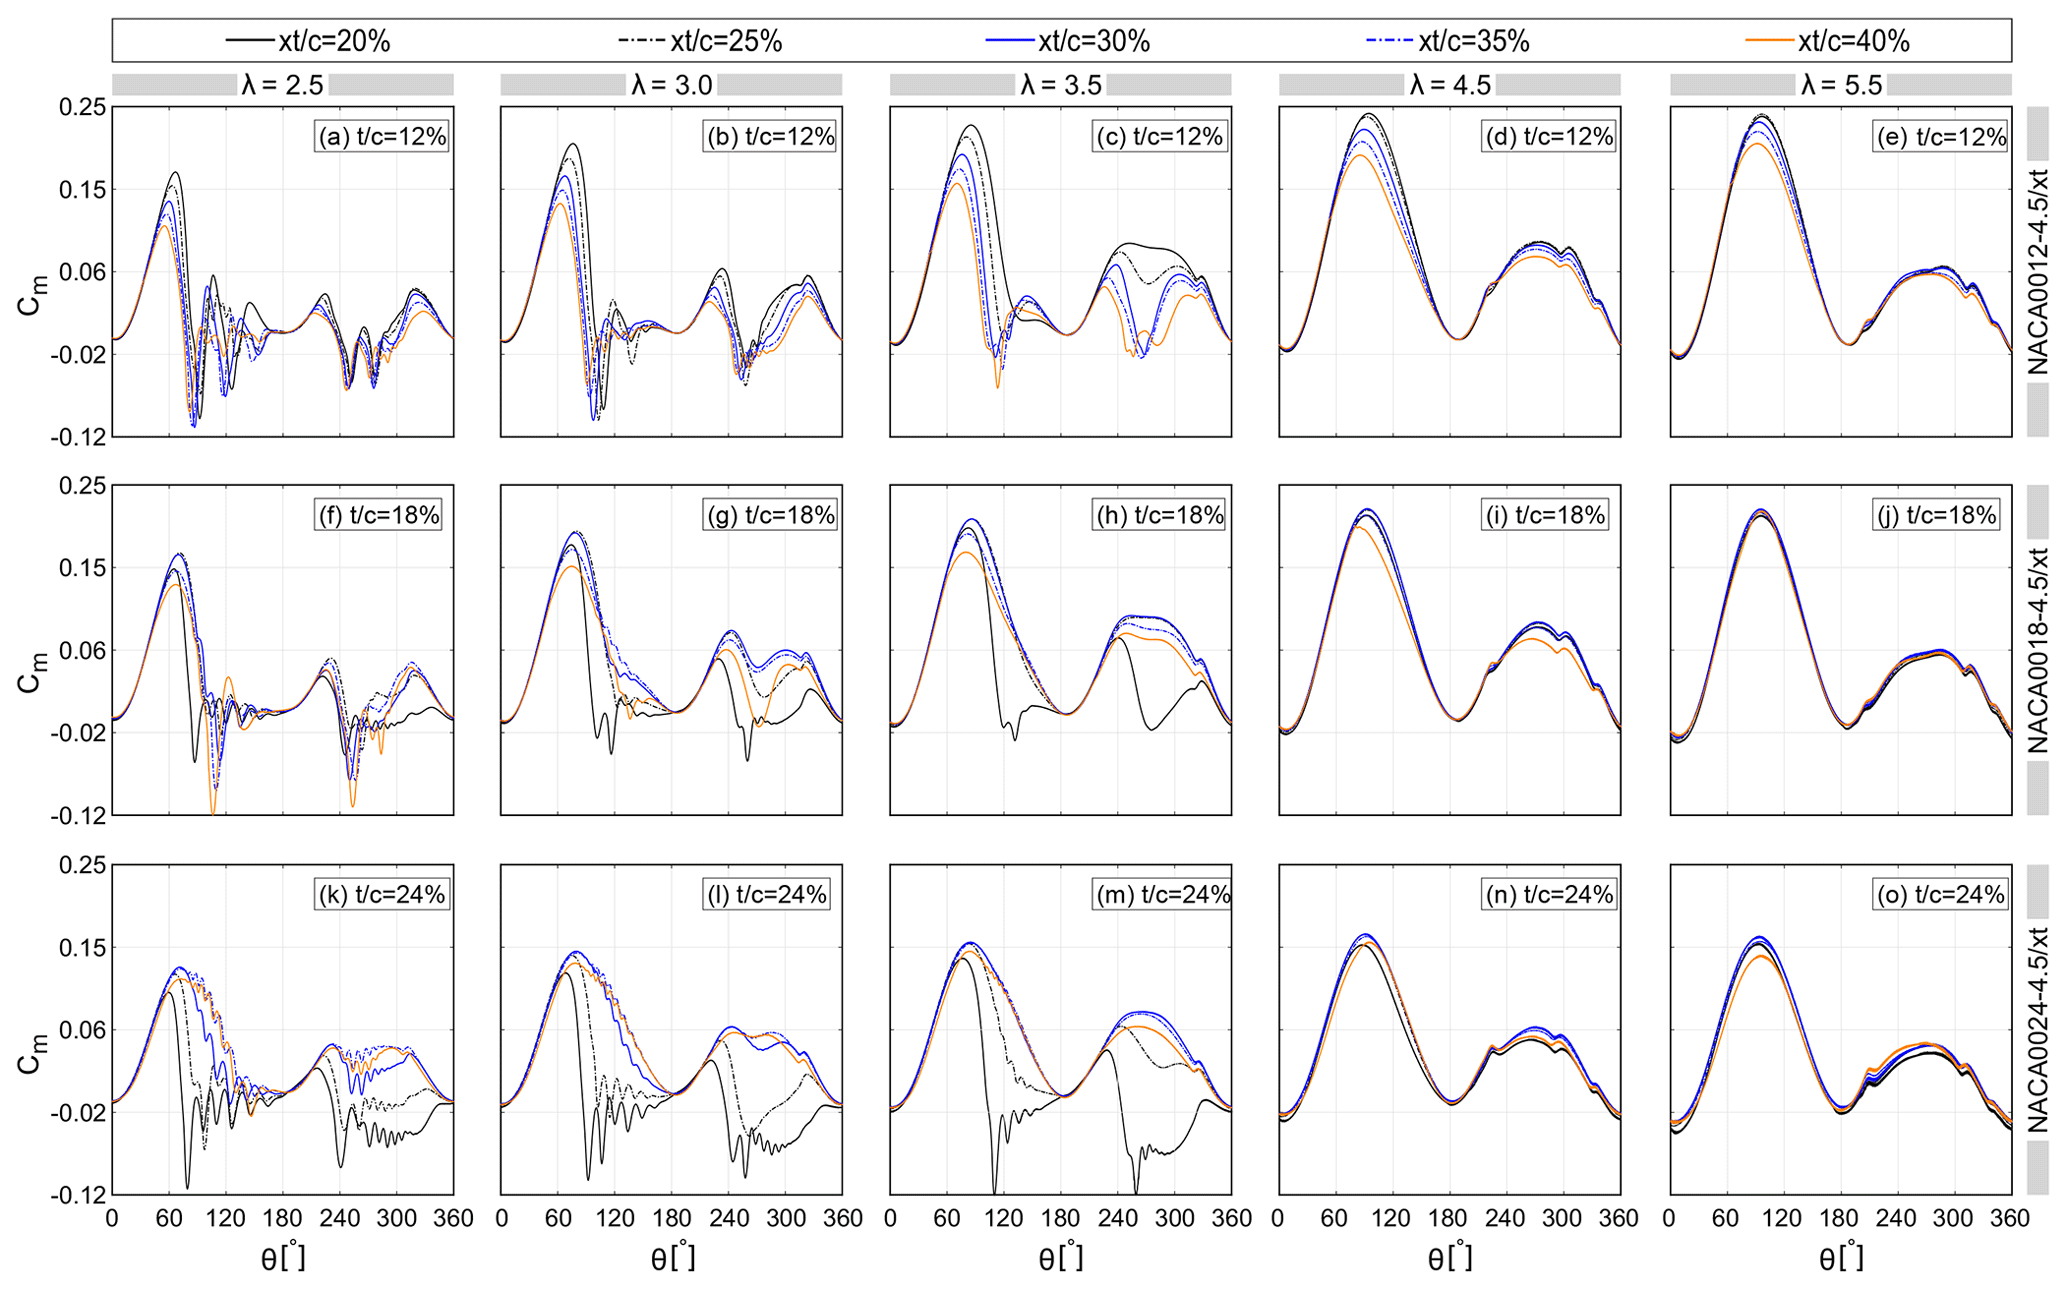
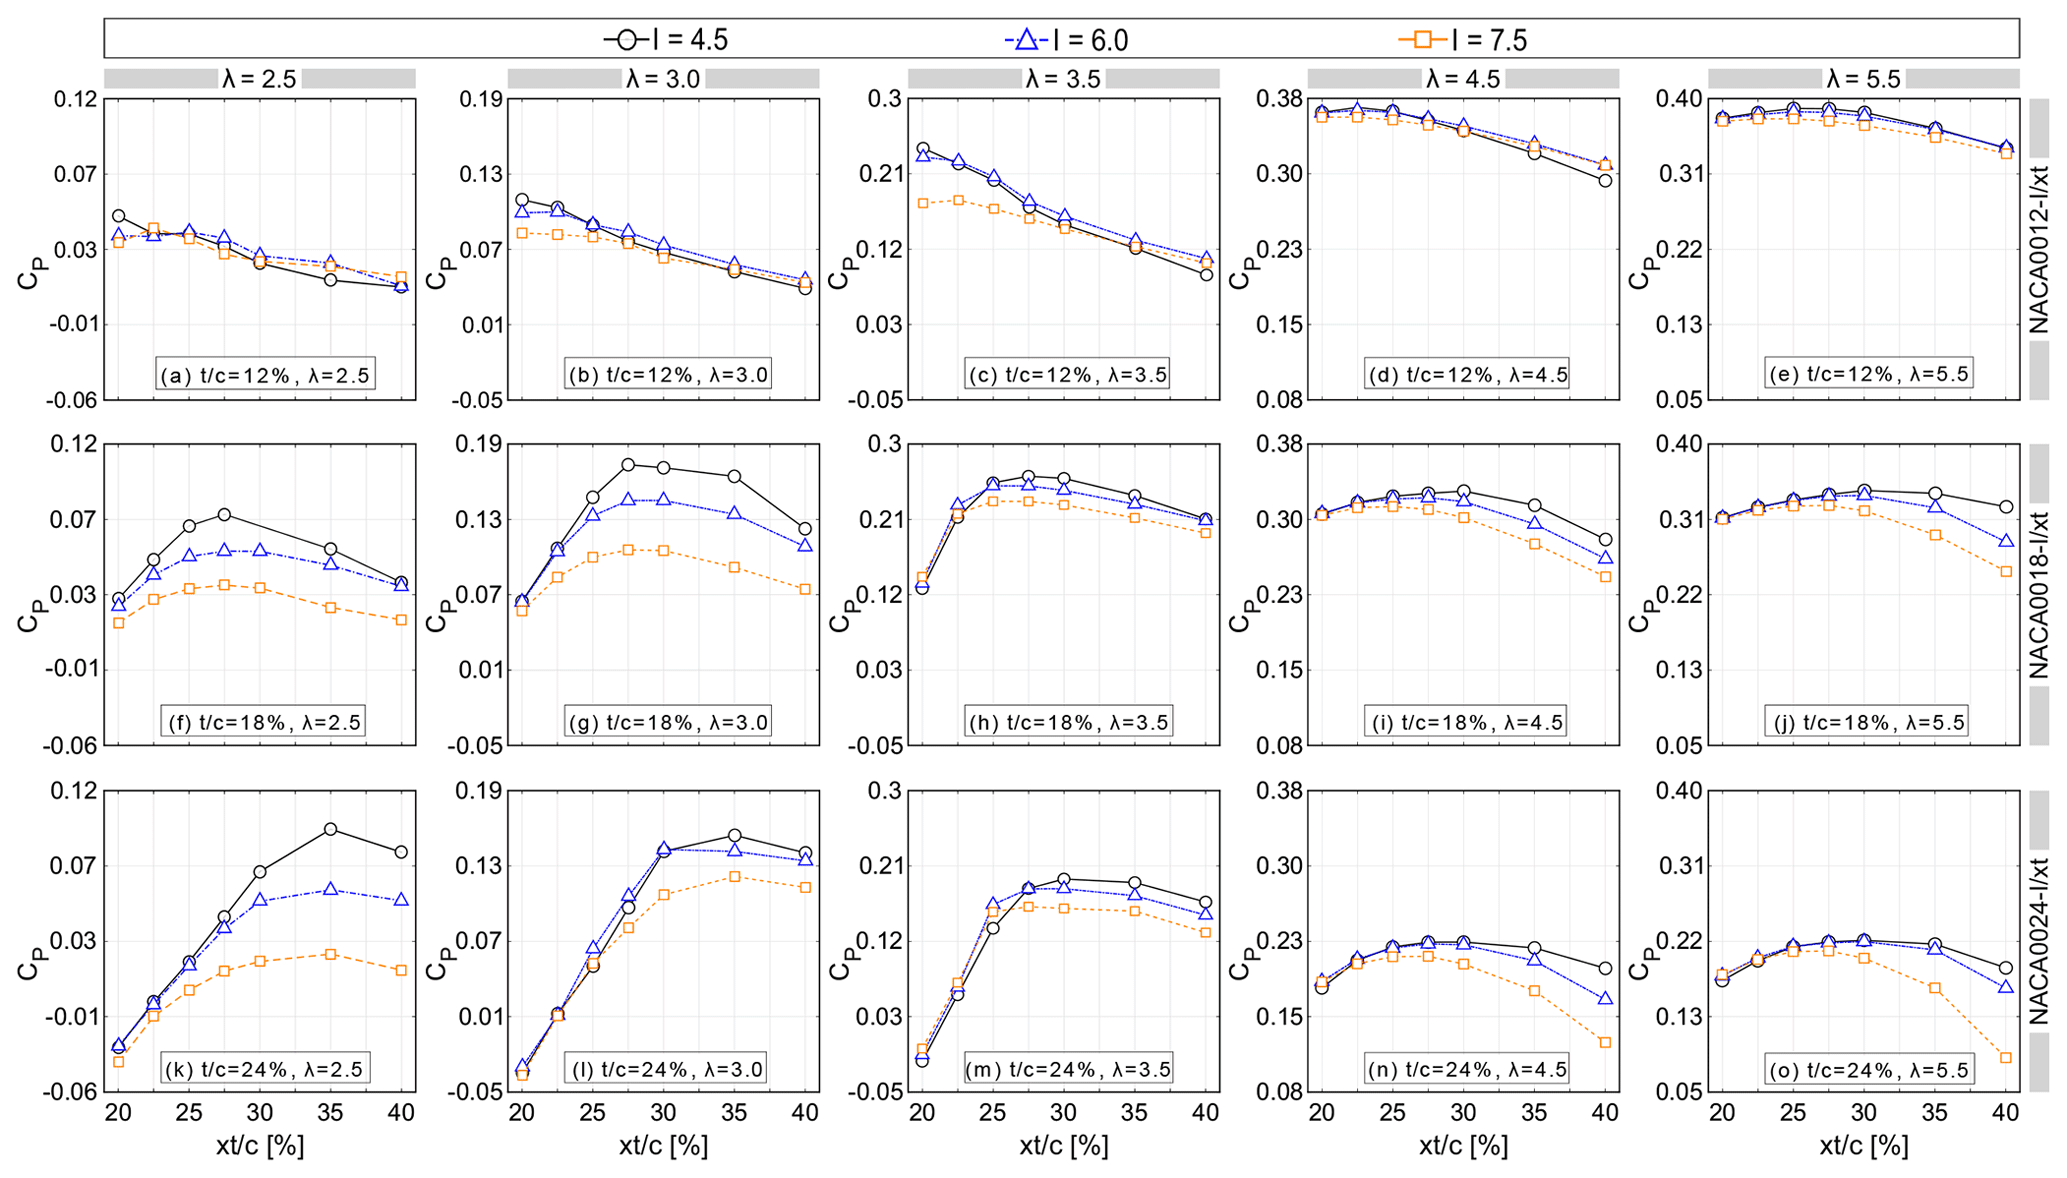
Figure 6 shows the impact of changing on the turbine CP for the studied range of , I and λ. Figure 7 shows the instantaneous moment coefficient Cm versus θ for selected and . The following can be observed:
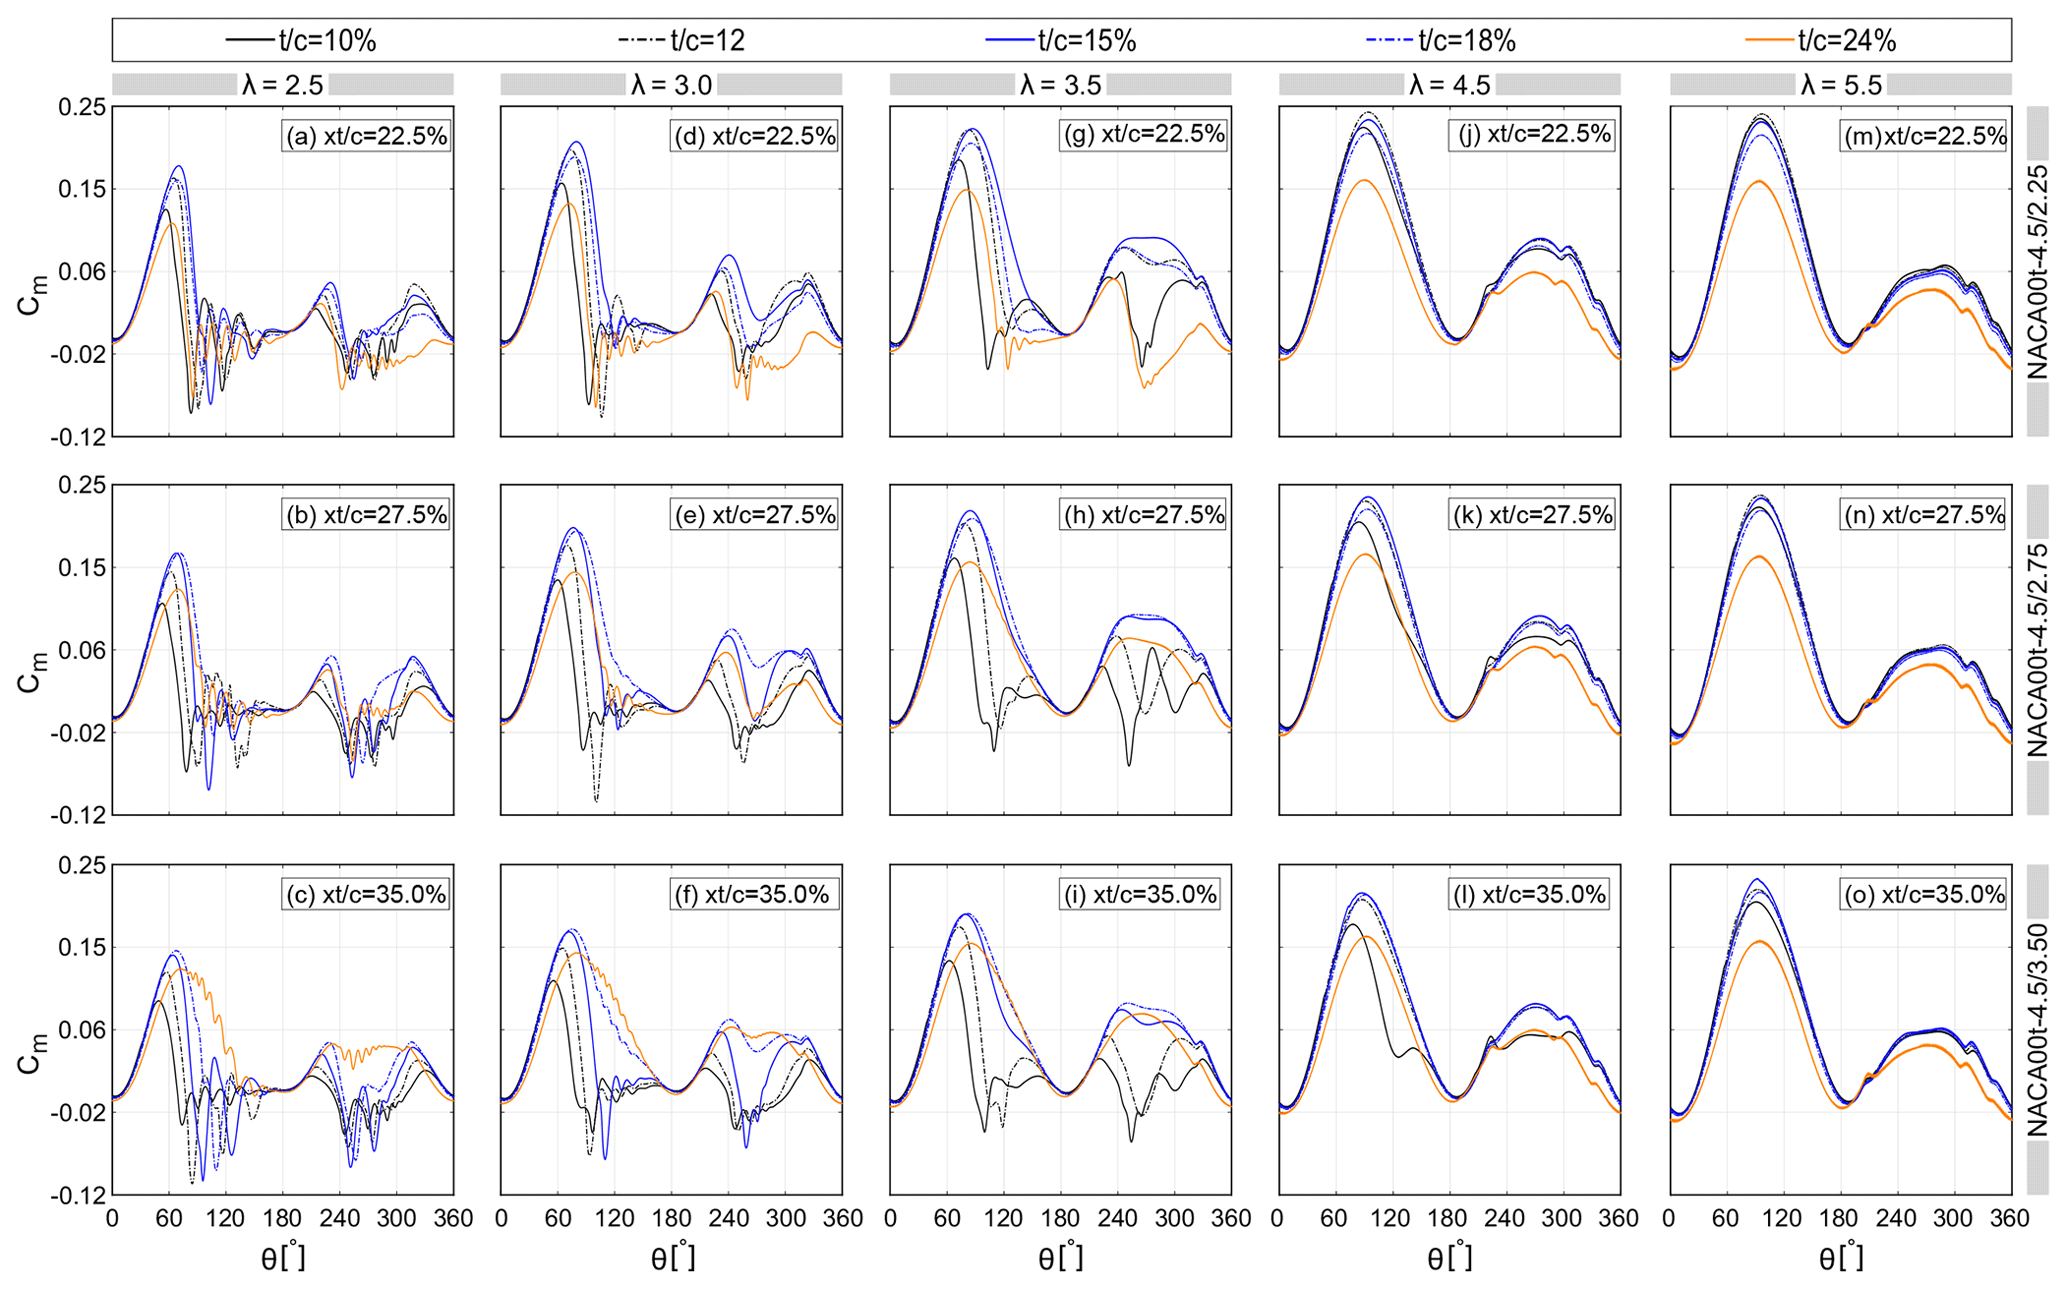
regarding the lowest value of I=4.5 (see Figs. 6a–e and 7), generally speaking, the trend of CP– for different λ is similar, except for some noticeable differences. That is, by increasing λ, the CP shows higher sensitivity to . This is reflected as higher and can be explained by the following: by changing , the pressure gradient changes over the airfoil; therefore, the transition point, the separation and stall characteristics, and eventually the resultant aerodynamic loads also change. However, when the flow is fully separated in the post-stall regime, changing no longer has a significant impact on CP. By increasing λ, and thus a more limited variation of α, the blade passes over a range of fewer azimuth angles in the post-stall regime (see Fig. 5). Due to this, changing the is influential within a wider range of effective θ. This can be recognised by the improved CP for higher λ. At λ=2.5, the CP follows a non-monotonic trend for % and a monotonic upward trend for %. Nevertheless, with the exception of % at λ=5.5 where the CP monotonically decreases by increasing , the trend remains non-monotonic for different values of at the studied range of λ. That is, by changing the to higher values, the CP experiences an initial growth to its maximum value at , followed by a reduction for . This can be recognised from the Cm plots, where by changing to its optimal value at , the sudden drop in Cm,max, which indicates the instant of moment stall, is observed at higher θ; the consequent fluctuation is alleviated, and the mean value of Cm increases, thus making consistency with the highest CP at for a fixed (see Fig. 7a–i for selected ). This can be attributed to the following observations from the skin-friction, lift and drag coefficients (Cf, Cl and Cd): when the turbine is operating at low values of λ≤3.5, increasing from 10 % to changes the stall type from mixed stall for % to trailing-edge stall for thicker airfoils; an earlier formation of laminar separation bubble (LSB) and trailing-edge separation (TES) is observed; TES–LSB merging (i.e. full-flow separation) is discovered to occur at a higher azimuth, indicating a more extended favourable pressure gradient for (see, for example, Fig. 8 for % at λ=2.5); and a lighter dynamic stall is observed, that is, lift and drag jump, which indicate the onset of dynamic stall, reduce and shift to a higher azimuth, and the consequent post-stall load fluctuations are alleviated (see, for example, Fig. 9 for % at λ=2.5). However, an earlier stall is found to occur for due to more pronounced earlier merging of TES–LSB. This is reflected by lower CP and Cm,max for (see Figs. 6a–c and 7a–i). Note that the monotonic growth in for % at λ=2.5 can also be explained with the aforementioned reasoning, yielding the CP,max at the highest thickness of % (see Fig. 6a).
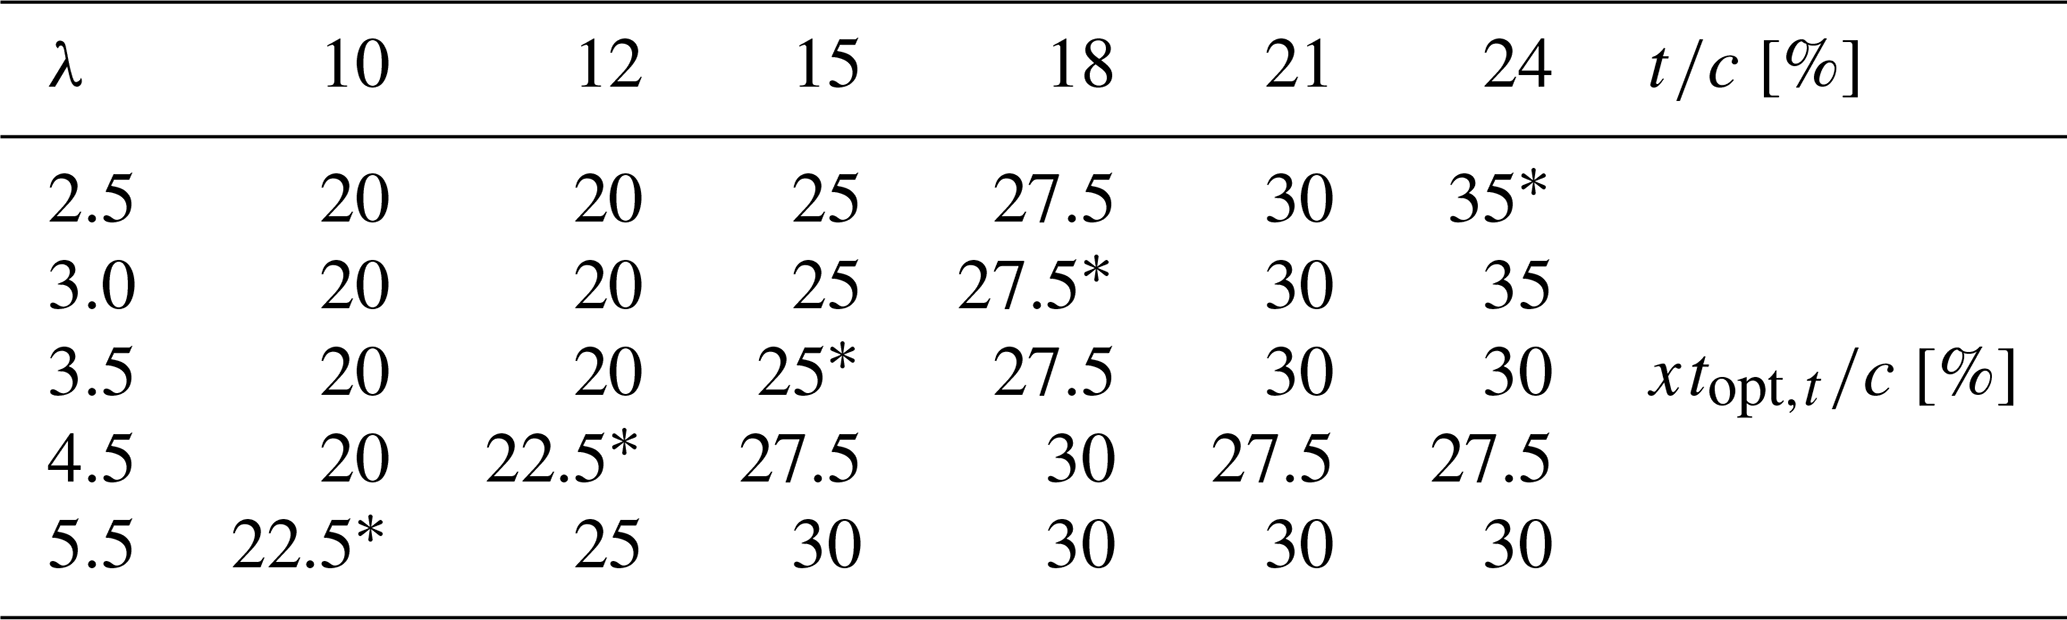
Table 3 for different values of and λ (I=4.5).
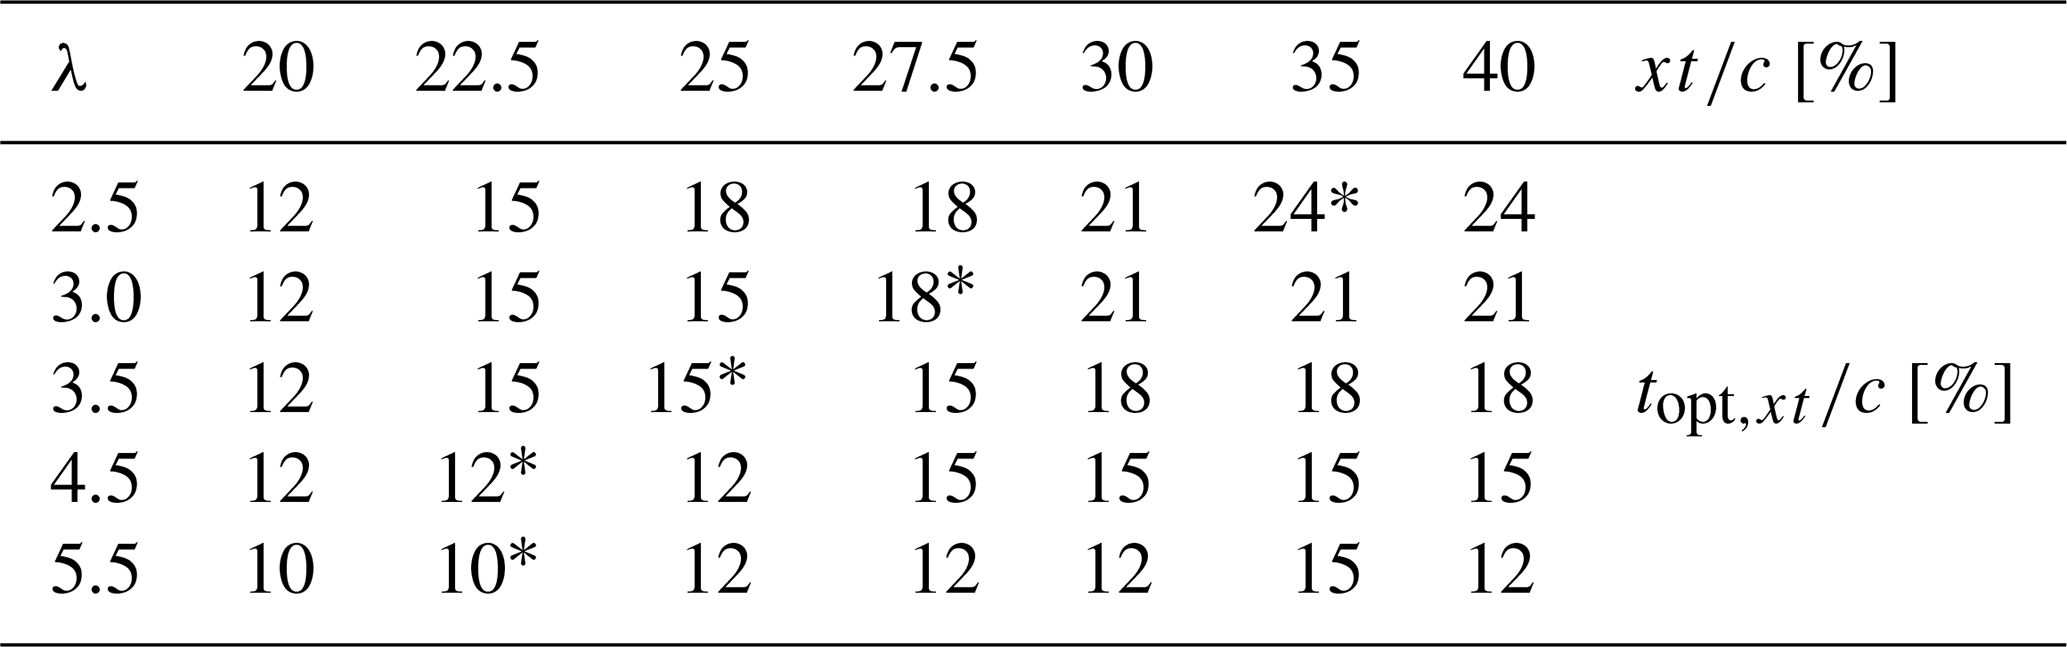
* at the corresponding λ.
Table 3 shows the corresponding to each (i.e. ) at different λ. The corresponding to each λ is indicated by a star sign. It can be seen that by increasing , which means a longer favourable pressure gradient on the blade, a higher thickness is needed for the airfoil to be optimal. Note that increasing λ influences the shape of the optimal airfoil by decreasing its thickness. In other words, the higher λ is, the thinner the optimal airfoil is. This is consistent with the findings documented in Healy (1978) and Subramanian et al. (2017), where it shows the superior performance of thick airfoils at low λ. This may be attributed to the turbine operational regime as follows: when the turbine goes into regimes with higher λ and more pronounced reduction in the variation of α, higher values of Cl at lower α have the most impact on the turbine CP. Therefore, thinner airfoils with a higher lift curve slope outperform the thicker ones with a lower slope of the Cl−α. Eventually, this results in less pronounced sensitivity of the to and shifting the peak in (i.e. towards the lowest % and 12 % in the non-dynamic stall regime with λ≥4.5 (see Table 3). The analysis also shows a drag increment for thicker airfoils at λ=4.5 and 5.5, which is a result of the earlier formation of LSB and TES. This is consistent with the reduction in CP and Cm,max for (see Figs. 6d, e and 7j–o). Note that for % at λ=5.5 the same reasoning results in a monotonic decrease of CP, yielding the CP,max at the lowest thickness of %.
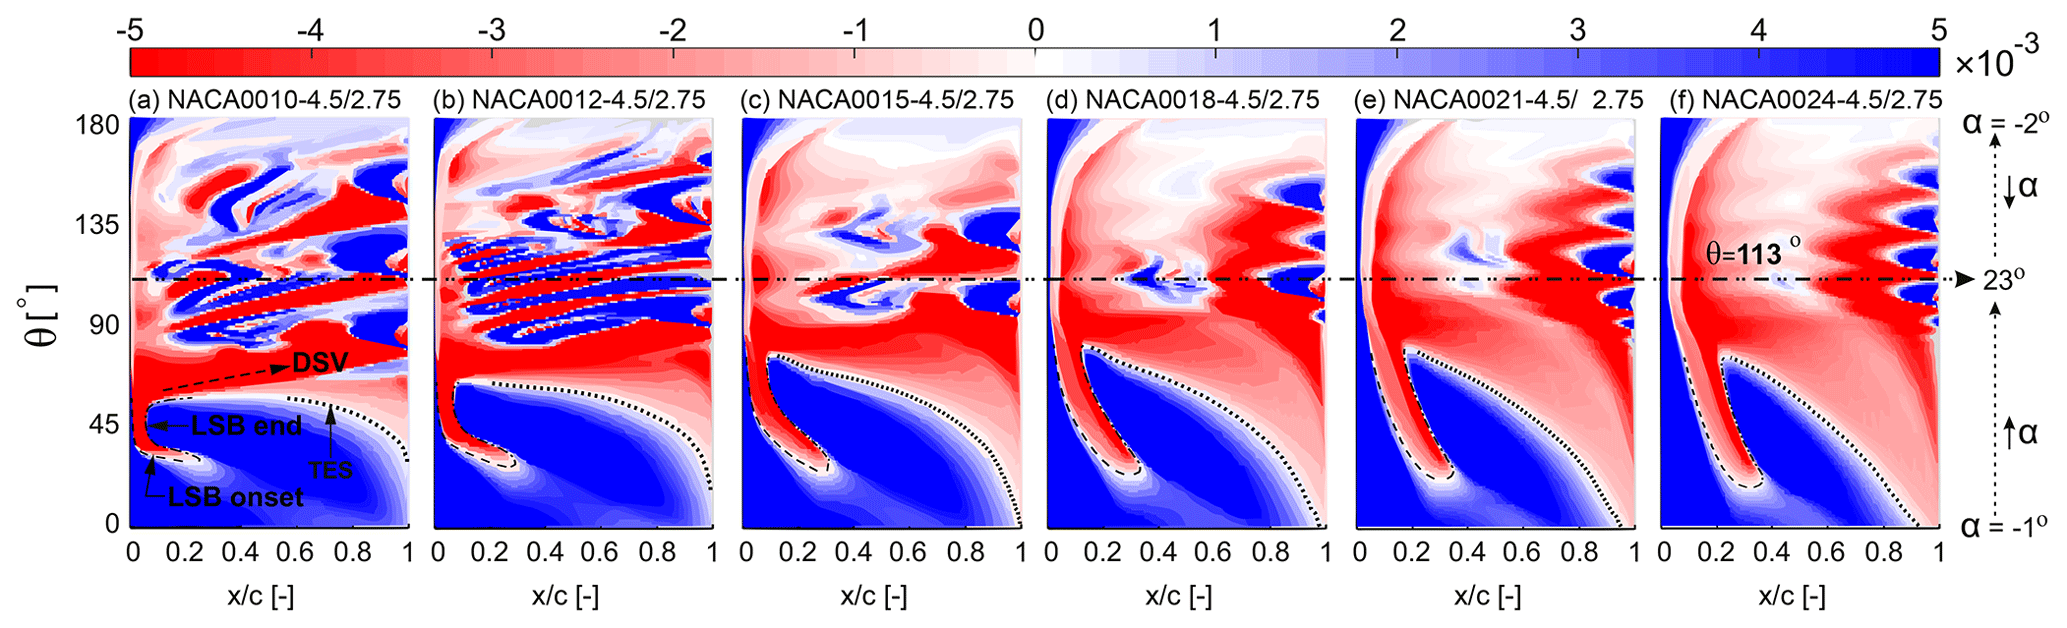
Figure 8Spatiotemporal contour plots of Cf along the suction side of the blade during the first half of the last revolution for the NACA00t-4.5/27.5 at λ=2.5. Note that the x axis is along the chord line and θ=113∘ corresponds to the blade's αmax=23∘.
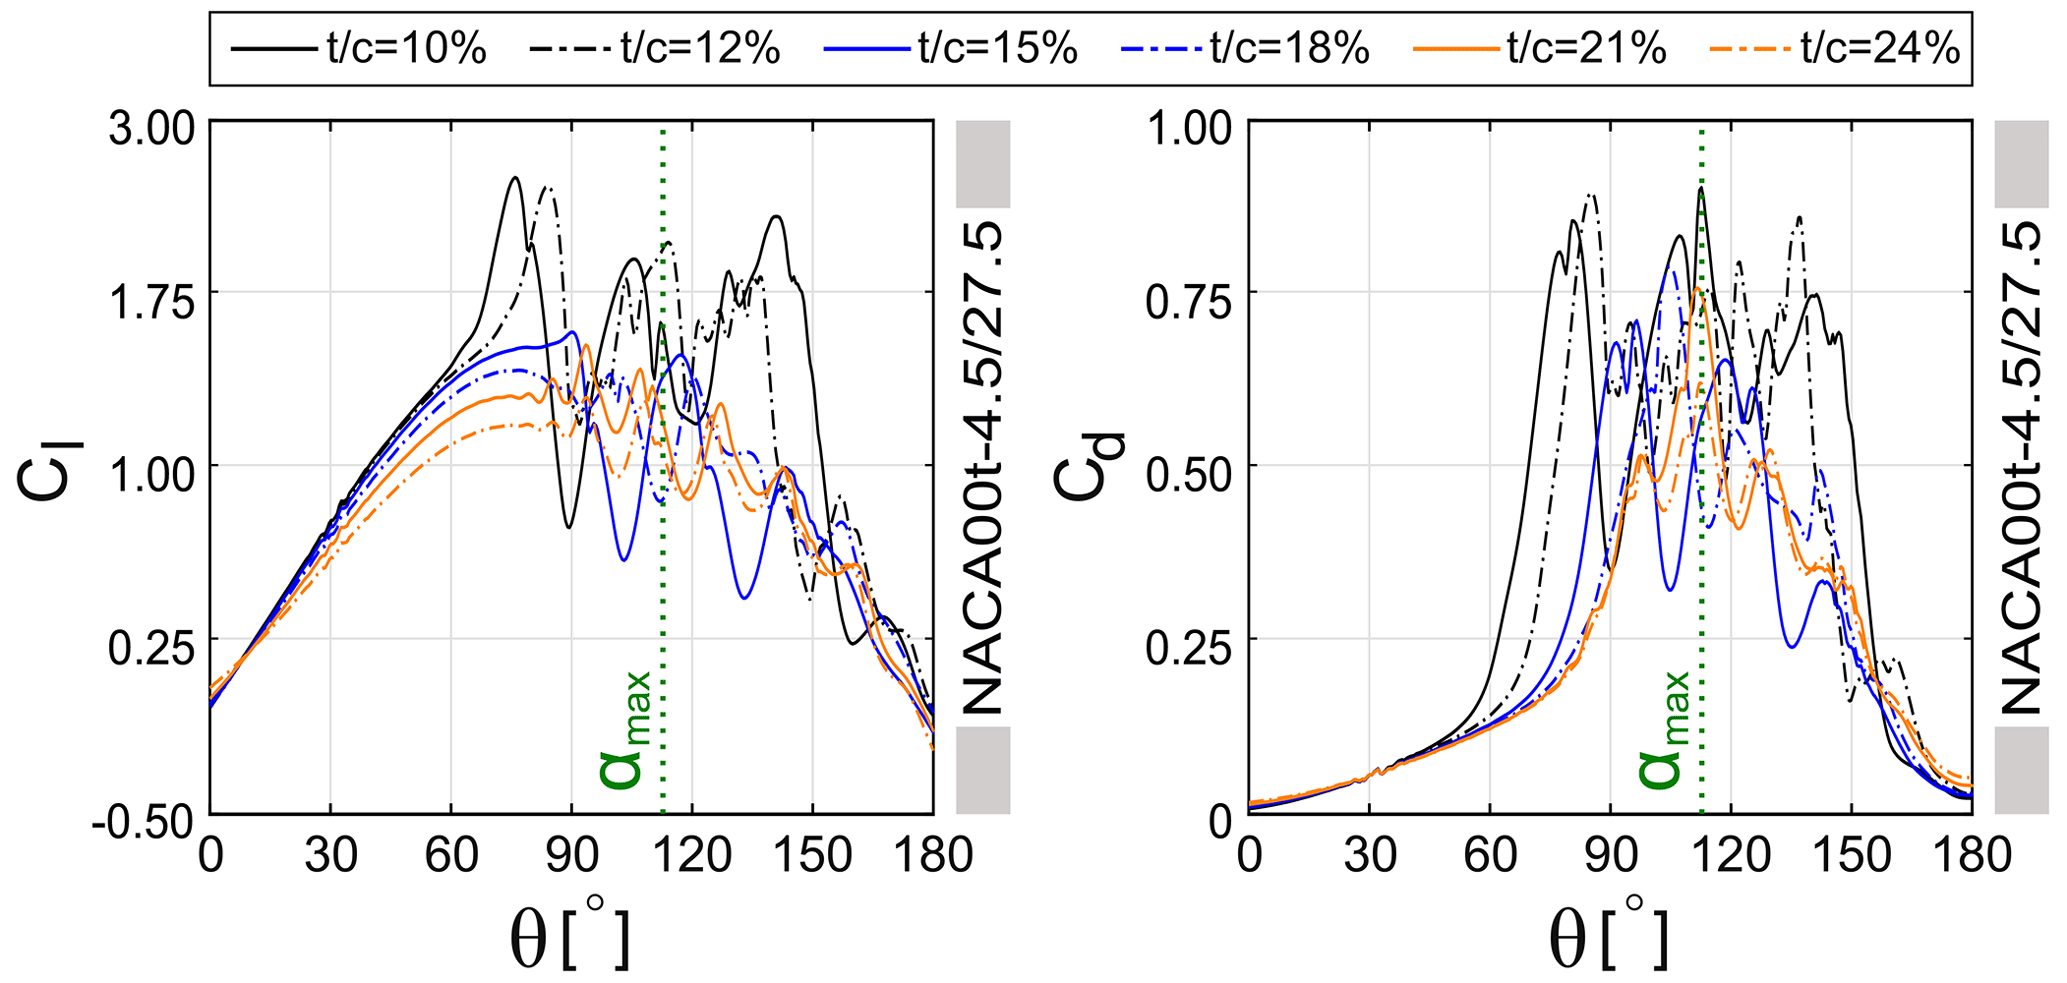
Figure 9Impact of on variations of Cl and Cd versus θ during the first half of the last turbine revolution for % and I=4.5 at λ=2.5.
The effect of flow curvature on aerodynamic loading is another important physical phenomenon to take into account in predicting the performance of VAWTs. Because of the angular velocity of the turbine rotor blades, the relative flow direction continuously varies along the airfoil chord, and thus the blades experience curved streamlines. As a result of this, a symmetrical airfoil with zero pitch angle in the circular path of a VAWT rotor behaves as if it is a cambered airfoil with a non-zero pitch angle in a straight flow (Migliore et al., 1980; Rainbird et al., 2015). The flow curvature effects become less pronounced on a curved airfoil (Coiro et al., 2005). In addition, a blade hinge located at 50 % chord length significantly alleviates the flow curvature effects. However, among all the parameters, the ratio of blade chord to turbine rotor radius () has the greatest impact on flow curvature effects (Migliore et al., 1980). For low values of (i.e. low solidity), the blade surface pressure distribution shows negligible differences with respect to that of the no-lift condition (Coiro et al., 2005), indicating less pronounced effects of flow curvature on the performance of low-solidity turbines (Rainbird et al., 2015). In this study, due to the low value of (i.e. low σ), the contribution of flow curvature effects is considered small.
Regarding the moderate and highest values of I=6.0 and 7.5 (see Fig. 6f–j and k–o), the overall trend for CP is very similar to that of the lowest I=4.5; however, it shows comparatively lower values of ), especially for λ≤3.5. The impact of changing the rLE on the turbine CP is separately discussed in detail in Sect. 4.1.3; therefore, it is not included here.
4.1.2 Modification of the chordwise position of maximum thickness ()
Figure 10 shows the variation of the turbine CP versus at the studied range of , I and λ. Figure 11 shows the instantaneous moment coefficient Cm versus azimuth for selected and . The following can be seen:
regarding the lowest value of I=4.5 (see Fig. 10a–e), the overall trend of for different λ is very similar, except for the following differences. By increasing λ, the turbine CP shows higher . This is due to the similar reasoning discussed earlier in Sect. 4.1.1 and summarised as follows: changing the results in changing the boundary layer and stall characteristics. On the other hand, increasing λ is associated with a lower variation of α, i.e. a more limited azimuthal range of the post-stall regime. As a result, the impact of changing the becomes significant over a wider range of θ, resulting in improved CP.
For % in the dynamic stall regime with λ≤3.5, the CP monotonically decreases by increasing the , yielding the CP,max with the lowest of 20 % (see Fig. 10a–c). However, apart from % at λ=4.5, where CP monotonically decreases, the trend for thin airfoils changes to non-monotonic at λ≥4.5 (see Fig. 10d and e). In other words, by increasing the from 20 % to 40 %, the CP grows to its maximum value at , before decreasing for . The monotonic behaviour of CP for thin airfoils at low λ can be explained based on the observations of the skin-friction coefficient Cf as follows: the dynamic stall for % is preceded by either (i) gradual extension of the LSB towards the trailing edge (thin-airfoil stall) or (ii) a sudden upstream propagation of the TES (leading-edge stall). Changing the to higher values results in either an earlier downstream extension of the LSB or an earlier formation and abrupt upstream propagation of the TES and, consequently, an advanced stall on the blade. This is evident from the Cm plots for % (see Fig. 11a–c), where the abrupt drop in Cm,max occurs at a lower θ, indicating an earlier moment stall due to increasing the . The overall lower values of Cm for higher justify the monotonic reduction in CP. For brevity, the Cf plots are not presented here.
On the other hand, the non-monotonic trend of CP for thin airfoils at λ≥4.5 (i.e. non-dynamic stall regime) can be recognised from the Cm plots. For example, by changing the from 20 % to % for % λ=5.5, the Cm,max slightly increases before decreasing for % (see Fig. 10e). This can be explained by the skin-friction coefficient Cf, where it shows an earlier formation and upstream propagation of the TES and, thus, a promoted TES for (see Fig. 12). Note that, when the adverse effects of dynamic stall are suppressed at λ≥4.5, increasing shows a marginal positive impact on the CP for thin airfoils, reflecting a non-monotonic trend of CP versus . However, the value of for thin airfoils plays a more crucial role in this regime. This can be observed from the sharp downward trend of for % at λ=4.5, while it changes to a non-monotonic trend for %. This may be attributed to the more pronounced formation and propagation of TES and, thus, an earlier stall due to increasing for %. However, the trend of for of 10 % remains non-monotonic at λ=5.5, showing less sensitivity to TES at higher λ.
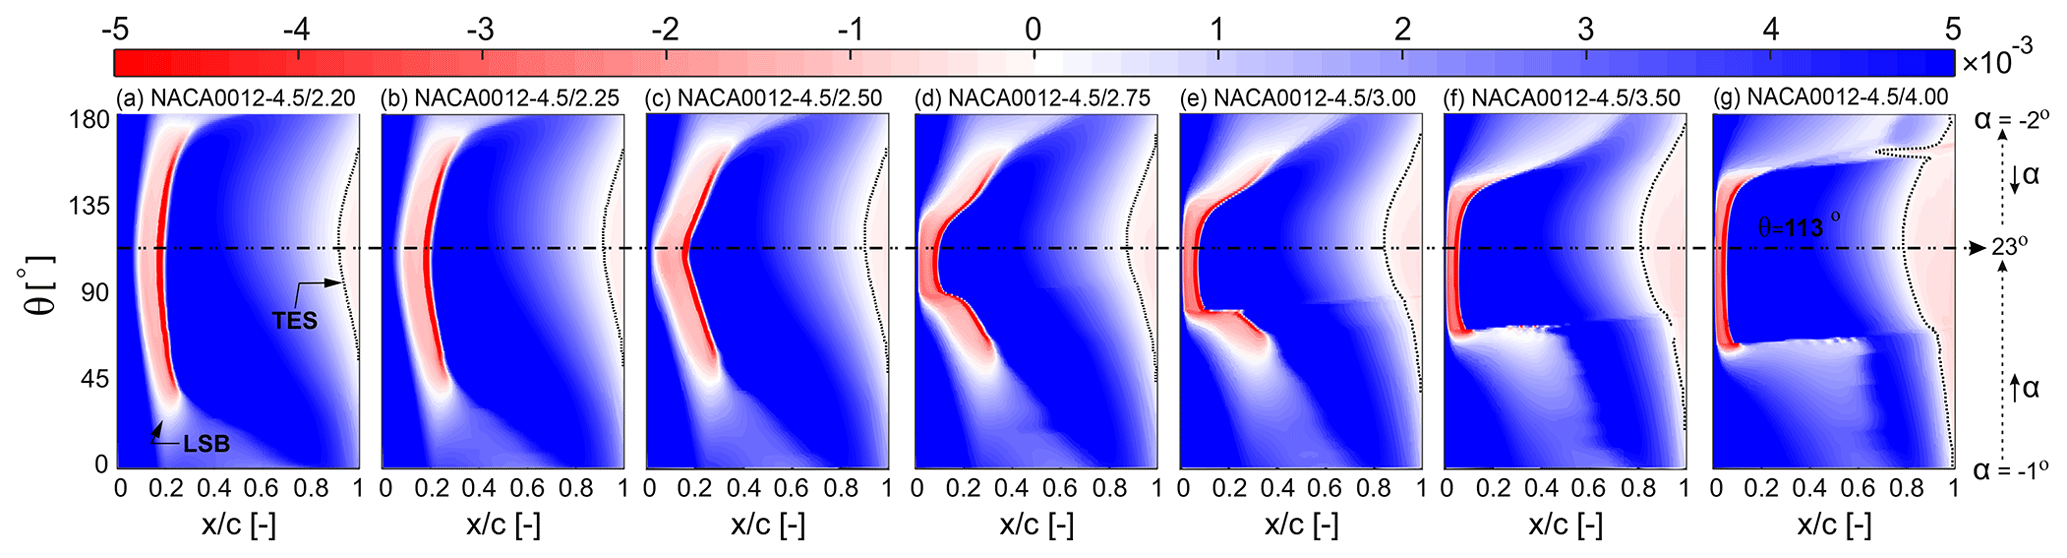
Figure 12Spatiotemporal contour plots of Cf along the suction side of the turbine blade during the first half of the last revolution of the NACA0012-4.5/xt at λ=5.5. Note that the x axis is along the chord line, and θ=113∘ corresponds to the blade's αmax=23∘.
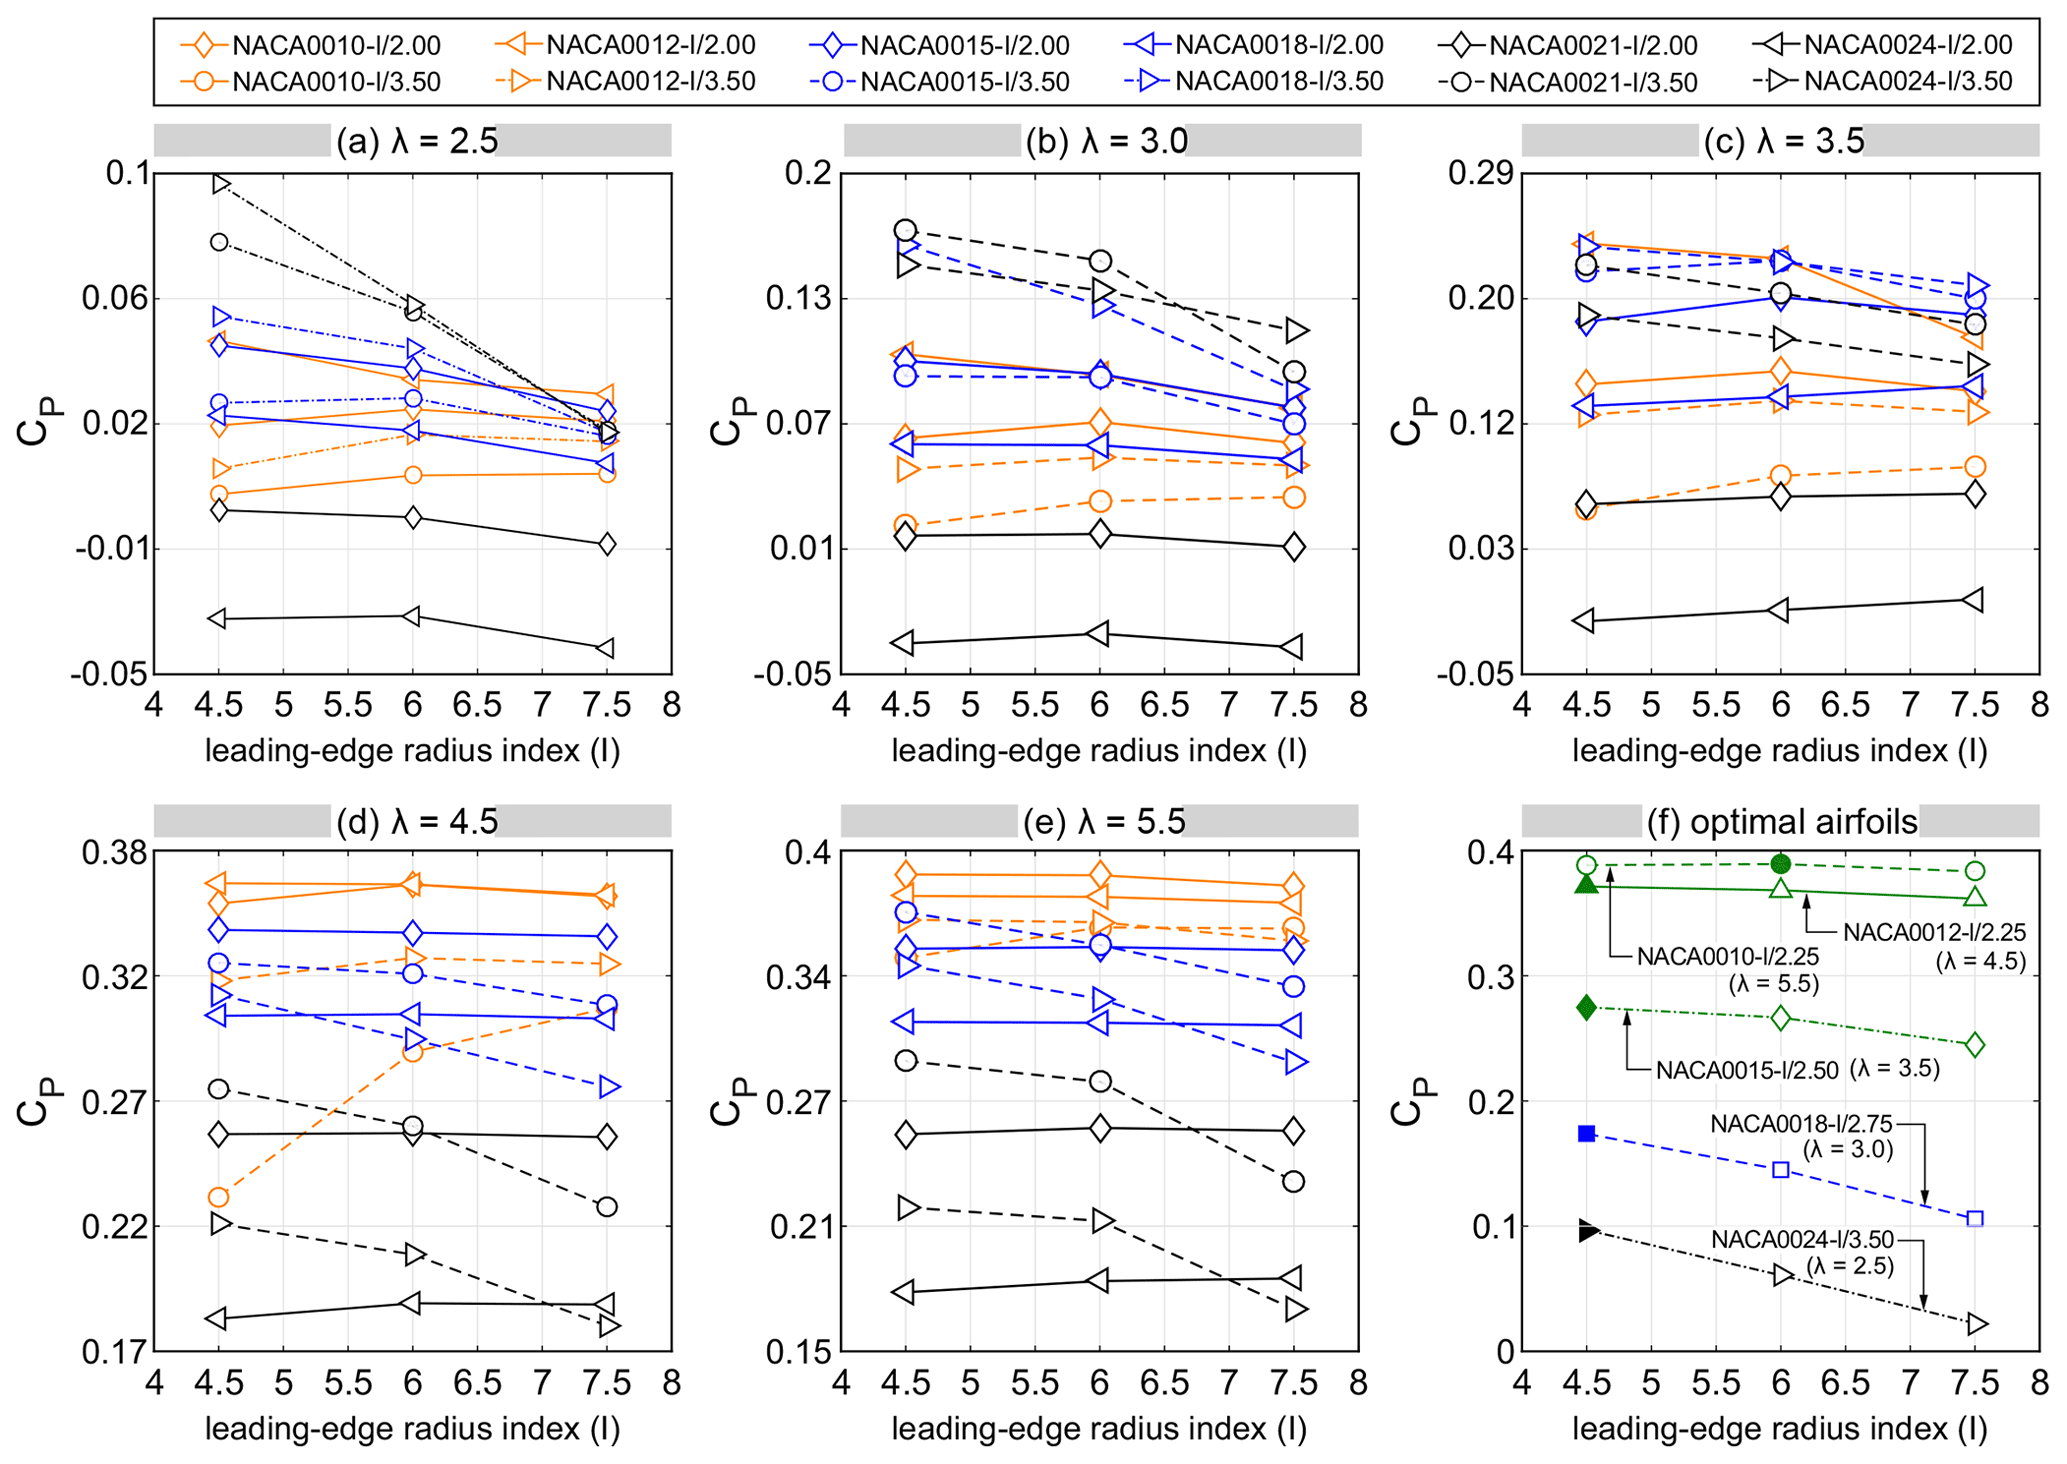
Figure 13Impact of changing rLE on the CP for (a–e) selected and (f) optimal airfoils at different λ. Filled symbols represent the optimal airfoils corresponding to each λ.
For the medium- and high-thickness airfoils (i.e. %), the turbine CP follows a trend with a defined maxima at (see Fig. 10a–e). As previously discussed in Sect. 4.1.1, this non-monotonic trend is a consequence of thicker-airfoil stall type, which is triggered by the formation of a flow reversal near the trailing edge (McCroskey, 1981; Sharma and Visbal, 2019; Frolov, 2016; Meseguer et al., 2007). Therefore, when changes to its optimal value, the adverse pressure gradient becomes less severe, resulting in improved stall characteristics. This can be recognised by either dynamic stall alleviation at low values of λ≤3.5 or a postponed stall at non-dynamic stall regimes with λ≥4.5. Table 4 gives the (i.e. the at each ) in terms of CP,max for each λ. The corresponding for different λ is indicated by a star sign. For λ≤3.5, by increasing , the also increases. However, by increasing λ from 2.5 to 3.5 and thus encountering a comparatively lighter dynamic stall and more limited variation of α, the and its corresponding decrease (see also Fig. 10). The reason for the outperformance of thin airfoils at higher λ is explained earlier in Sect. 4.1.1. Nevertheless, in the dynamic stall regime, the outperformance of moderate to high values of for thicker airfoils at a fixed λ is readily apparent from the turbine Cm for selected % and 24 % (see Fig. 11f–h and k–m). It can be seen that increasing to its optimal value results in an increase in the Cm curve peak, a delay in the sudden drop of Cm,max, less pronounced subsequent fluctuations and higher values of Cm in the turbine downwind quartile. This is due to alleviated dynamic stall and is more pronounced for % (see Fig. 11k–m). A further increase in is found to have a negative effect on Cm and finally leads to an earlier stall. This is because increasing the higher than promotes the formation of LSB and TES and results in an earlier full-flow separation and drop in Cl,max. Please note that for better illustration the Cm plots are not presented for all the studied values of . For λ≥4.5, by increasing for %, the CP shows less sensitivity to , and the corresponding changes marginally (see Fig. 10d, e and Table 4). This is consistent with the turbine Cm plots for selected % and 24 %, where the Cm,max and the azimuth of moment stall are almost invariant to (see Fig. 11i–j and n–o).
Table 4 for I=4.5 at different and λ.
* at the corresponding λ.
Regarding the moderate and highest values of I=6.0 and 7.5 (see Fig. 10f–j and k–o): the shows a similar trend to that of I=4.5. However, in dynamic stall regime (i.e. λ≤3.5), the turbine CP shows a considerably smaller , especially for higher . On the other hand, in non-dynamic stall regime with λ≥4.5, a marginal reduction in is observed. However, the shows more pronounced sensitivity to changing for the moderate and thick airfoils.
4.1.3 Modification of the leading-edge radius (rLE)
Figure 13 shows the impact of changing the index of rLE on the CP for selected airfoils at different λ. Figure 14 shows a comparison of the for different I and selected values of . The analysis is grouped based on the maximum thickness as follows:
regarding the thin airfoils ( % and 12 %) (see Figs. 13 and 14a–e), regardless of , the turbine CP is marginally influenced by the I. This can be attributed to the low dependency of thin airfoils and the relevant aerodynamic loads on rLE, which is due to the geometrical constraints imposed by the airfoil thickness. It can be observed that by increasing the index of rLE for different at λ≤3.5, CP slightly changes; this minimal difference is in line with the corresponding Cm plots for %. This can also be recognised from the skin-friction, lift and drag coefficients by the negligible changes in the characteristics of boundary layer events, including LSB and TES, and consequently the onset of dynamic stall and Cd,max. Due to the large volume of the results, the Cm, Cl, Cd and Cf plots are not presented here. For λ≥4.5, except for the NACA0010-I/3.5, where increasing rLE has the most influence on CP, the aerodynamic loads and the turbine Cm show even less sensitivity to I. Note that this is the regime at which the dynamic stall is no longer encountered and thin airfoils outperform the rest of the airfoils. The impact of the index of rLE on the turbine CP for the optimal thin airfoils at λ≥4.5 is shown in Fig. 13f. Figure 15d and e shows the corresponding Cm plots.
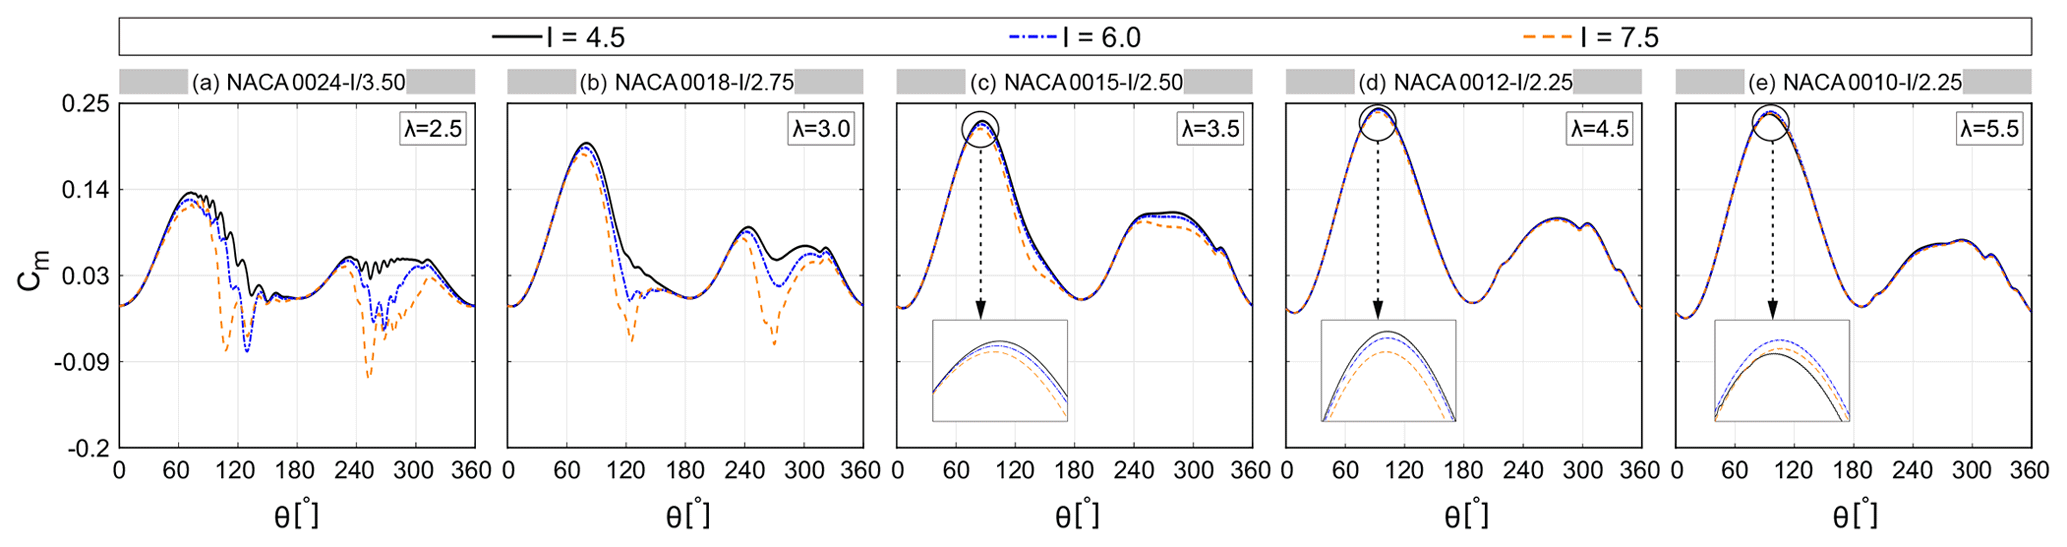
Figure 15Impact of changing rLE on the turbine Cm for the combination of and at different λ.
Regarding the moderately thick airfoils ( % and 18 %) (see Figs. 13 and 14f–j), overall, the turbine CP shows higher dependency and sensitivity to I. The higher dependency is due to the less severe geometrical constraints imposed by the moderately thick airfoils. Thus, changing the I noticeably modifies the airfoil shape and thereby influences the aerodynamic loads. The higher sensitivity is reflected by the noticeable monotonic reduction of CP for most of the values. This significant decrease can be recognised from the Cm plots, where the curve peak drops by increasing the leading-edge radius index. This may be due to the promoted LSB and TES, which results in higher Cd,max for larger I. For λ≤3.0, the more prominent sensitivity is observed within the range of 22.5 % ≤ ≤ 35 %; however, the CP shows less sensitivity to rLE for λ=3.5, corresponding to a lighter dynamic stall regime (see Fig. 14f–h). Note that the moderately thick airfoils show superior performance over the thin and thick airfoils at λ=3.0 and 3.5 (i.e. the NACA0018-4.5/2.75 and NACA0015-4.5/2.5, respectively). Figures 13f and 15b and c show the impact of changing rLE on the turbine CP and Cm for the optimal airfoils at λ=3.0 and 3.5. When the turbine goes into the non-dynamic stall regime with λ≥4.5, the range of within which the index of leading-edge radius is the most influential shifts downstream to 30 % ≤ ≤ 40 % (see Fig. 14i and j).
Regarding the thick airfoils ( % and 24 %) (see Figs. 13 and 14k–o), the analysis shows that at λ=2.5, thick airfoils significantly surpass other airfoils in terms of power performance (see Fig. 13). Aside from the following differences, the overall trend of is quite similar to that of moderately thick airfoils: CP values are more sensitive to rLE at λ=2.5, 4.5 and 5.5 but less so at λ=3.0 and 3.5 (see Fig. 14k–o). By increasing the rLE, the CP values experience a monotonic reduction, especially for thick airfoils with % at λ=2.5, where the variation of I is the most influential on CP. For example, the overall reduction of CP for the NACA0024-I/3.50 at λ=2.5, 3.0, 3.5, 4.5 and 5.5 is 77 %, 21 %, 17 %, 19 % and 23 %, respectively. This can be recognised from the Cm plots, where the Cm values decrease dramatically in both upwind and downwind quartiles, the Cm curve peak drops and the post-stall Cm fluctuations get more significant (see Fig. 15a). This is due to earlier formations of the LSB and TES and thus a higher Cd,max. Thick airfoils with low show marginal sensitivity to rLE at different λ. The corresponding Cm plots show approximately the same azimuth of moment stall for different I. For brevity, the Cm plots are only presented for the NACA0024-I/3.50, which is the optimal airfoil at λ=2.5 (see Fig. 15a).
Overall, at λ≤3.5, the belongs to the range of , which corresponds to the highest sensitivity of CP to rLE. For example, the optimal airfoil at λ=2.5 (i.e. the NACA0024-4.5/3.5) has % that fits in the range of 30 % ≤ ≤ 40 %, within which the impact of rLE is the most significant. This is while the for λ≥4.5 (i.e. %) does not belong to such a range of (i.e. %). In addition, the most noticeable improvement in CP due to changing the rLE occurs at λ=2.5, where the dynamic stall deeply affects the aerodynamic and power performance of the blade. By increasing λ and thus alleviating or avoiding the dynamic stall, the aerodynamic loads are less affected by the rLE.
4.1.4 Combined modification of the airfoil shape-defining parameters
The airfoil shape-defining parameters have a coupled impact on turbine performance. Thus, it is of high importance to study the impact of their combined modification on the turbine CP and CT. Figure 16 shows the variation of CP in space for different I and λ. Except for λ=5.5, where the combination of and is achieved by the moderate I=6.0, the Cp,max corresponds to the smallest I=4.5 for λ≤4.5.
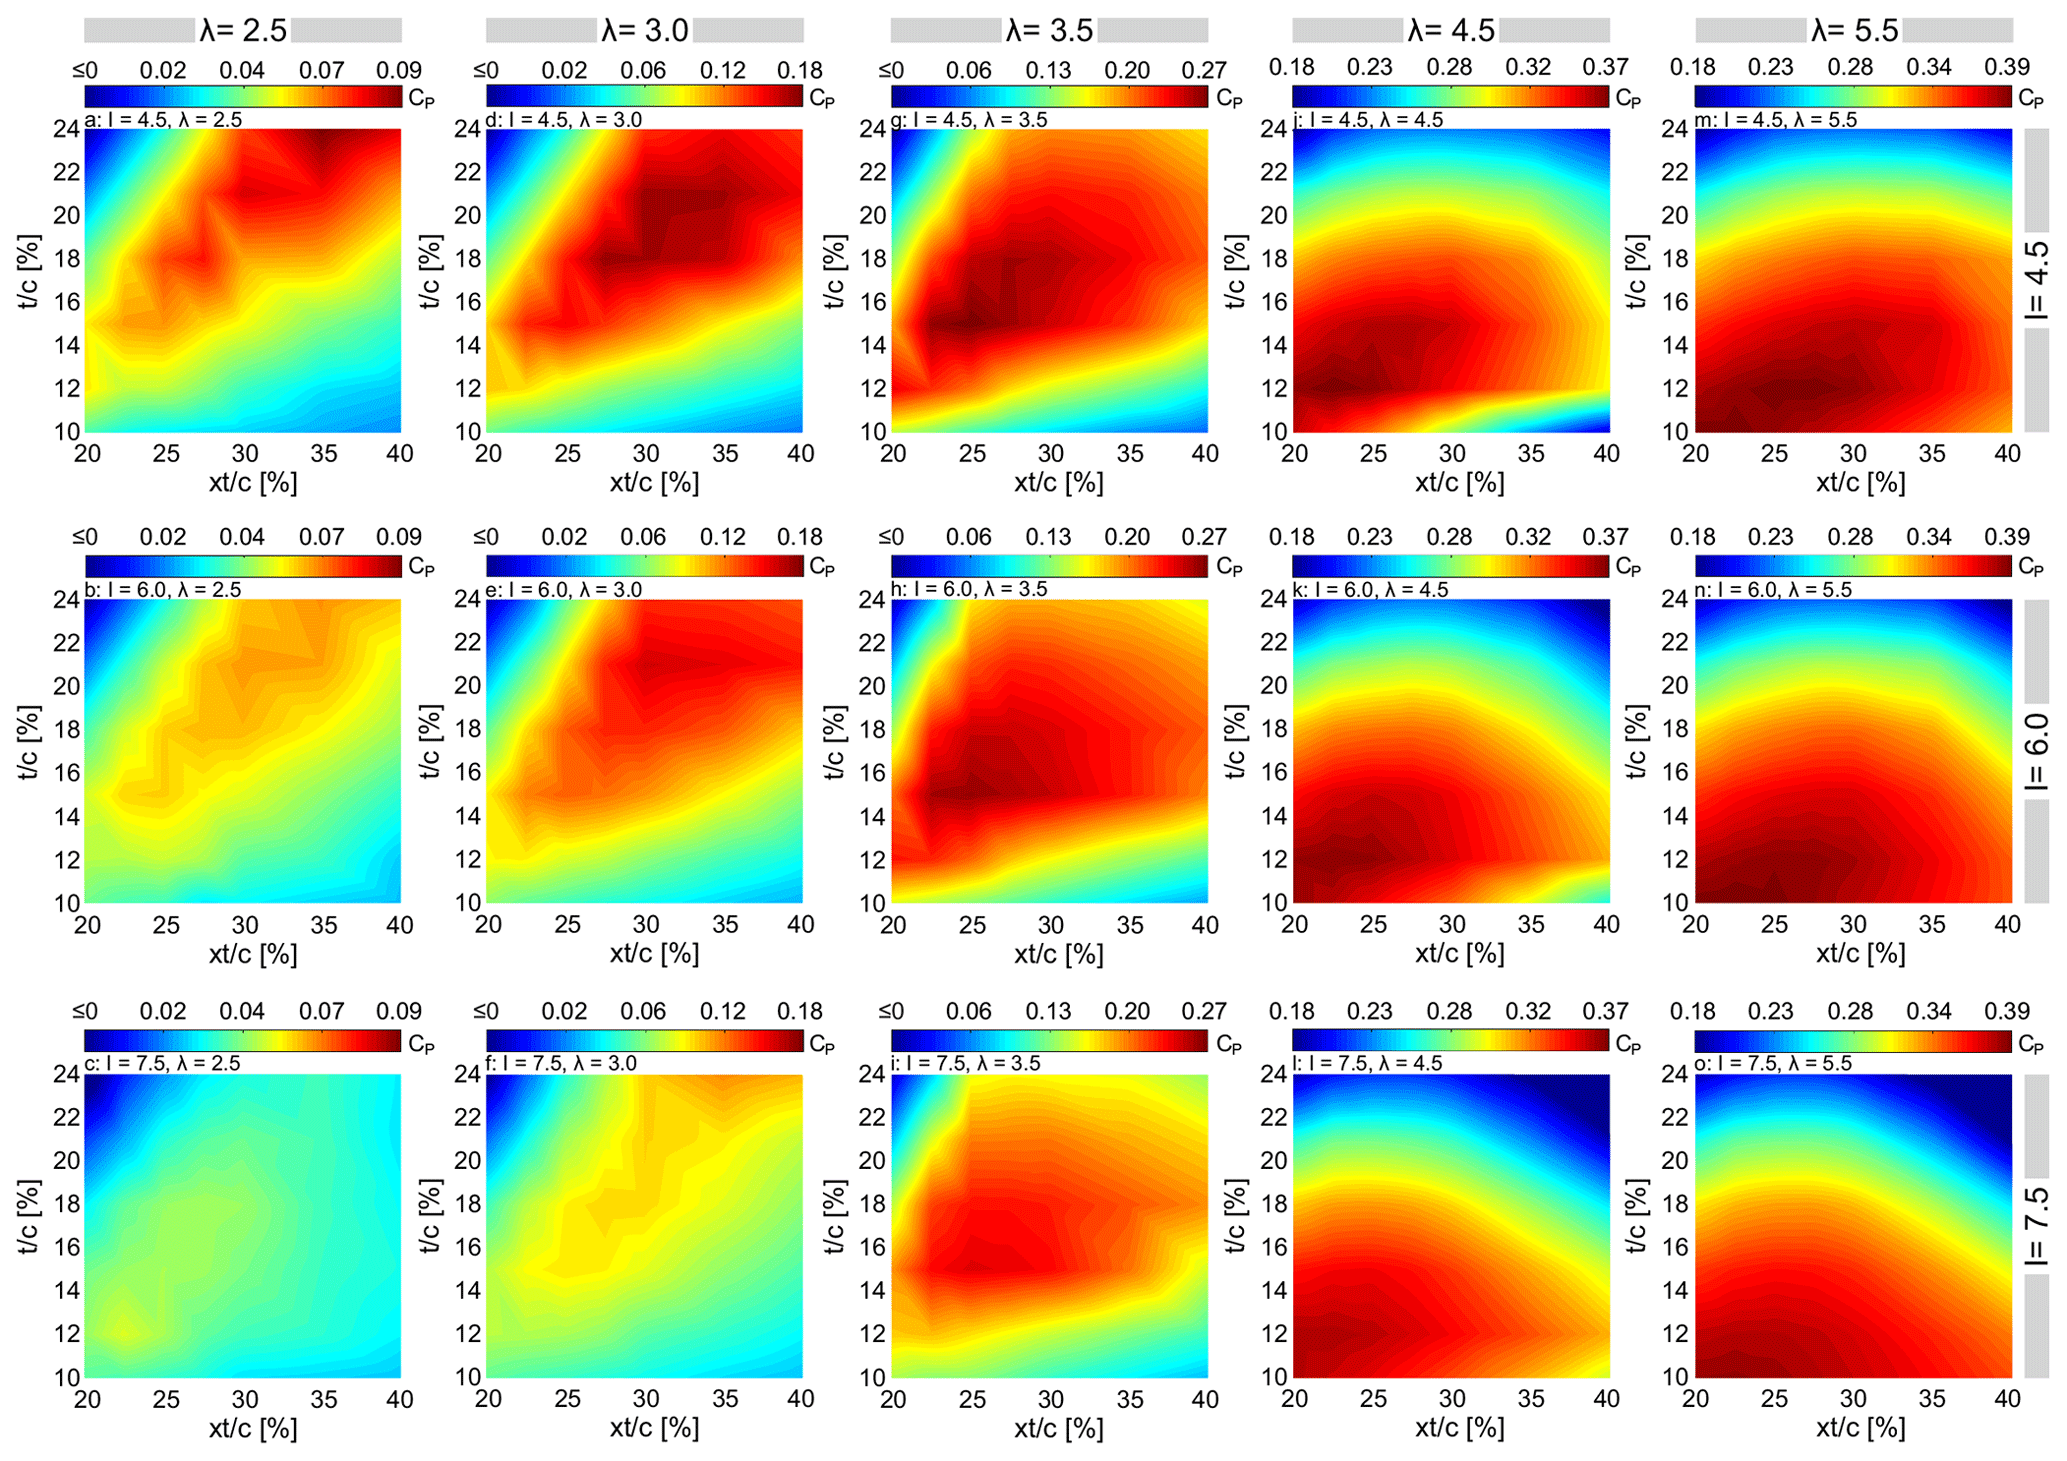
For λ=2.5 and I=4.5, the global optimum occurs by a set of high and (i.e. NACA0024-4.5/3.50). The combination of and values remains invariant for I=6.0; however, the region of maximum Cp shows lower values of Cp. For I=7.5, the optimal airfoil changes to a thin airfoil with low , while experiencing lower CP compared to those of I=4.5 and 6.0. The variation of optimal airfoil shape-defining parameters for different λ and the resultant airfoils at each λ are illustrated in Fig. 17.
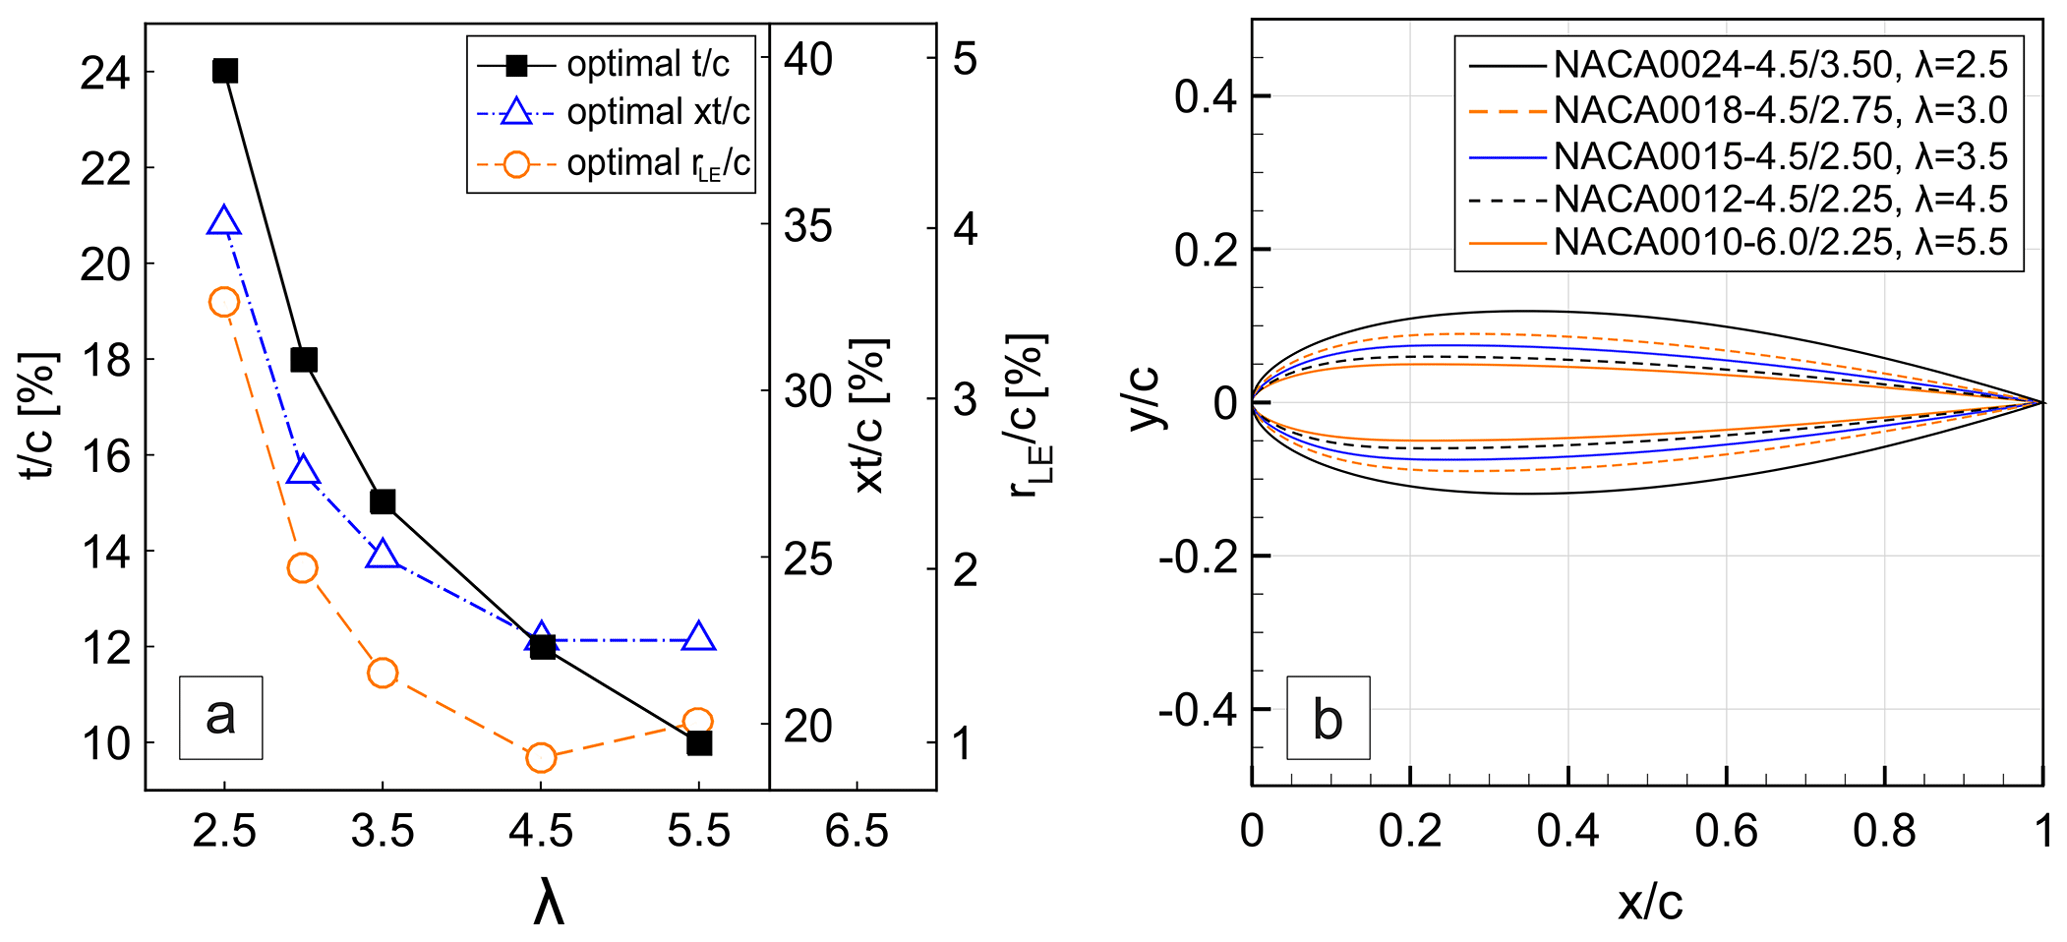
Figure 17(a) Variations of the optimal airfoil shape-defining parameters and (b) optimal airfoil shapes at different λ.
At λ=3.0, the region of CP,max shows less sensitivity to I, shifting between moderate and high values of and (see Fig. 16d–f). However, similar to that of λ=2.5, the overall range of Cp values narrows down with increasing I. For λ=3.5, the optimum region of CP remains nearly the same at moderate values of and for different I (see Fig. 16g–i), while for higher values of λ≥4.5, it stays approximately independent of I, shifting marginally between low values of and (see Fig. 16j–o). This implies that, by increasing λ, the optimum region of turbine CP is less sensitive to I. Overall, by increasing λ, the local region of optimal airfoil shape-defining parameters changes from the combination of high values of and for λ=2.5 to moderate and for λ=3.0 and 3.5 and low values of and for λ≥4.5.
The results highlight that, in designing morphing blades, single-parameter studies will not provide the overall picture and could lead to unreliable results. The contour plots give a conceptual view of the optimal regions in terms of the airfoil shape-defining parameters, with which the resultant airfoils have their most efficient performance, and also the inefficient regions of the turbine CP, which must be avoided.
Figure 18 shows the turbine CT in – space. It is interesting to observe that for low λ≤3.5 there is no coincidence between the optimal regions of CT and CP contours, while for λ≥4.5 these two regions overlap. By increasing λ, the optimal region extends marginally towards higher and , while also experiencing higher values of CT. The non-congruent region of Cp,max and CT,max at low values of λ is different from what is observed in the case of HAWTs. That is, the maximum power output of a HAWT occurs where the highest thrust load is exerted by the turbine blade on the flow. This led to a correlation between the regions of maximum CP and CT. In contrast, the results of the present study show that for VAWTs the same phenomenon only occurs at high values of λ≥4.5, where the turbine goes into non-dynamic stall regimes with more limited variations of α. Therefore, when designing morphing blades for VAWTs, the CT values corresponding to high values of λ are of more importance compared to those of lower λ, where dynamic stall is expected to occur.
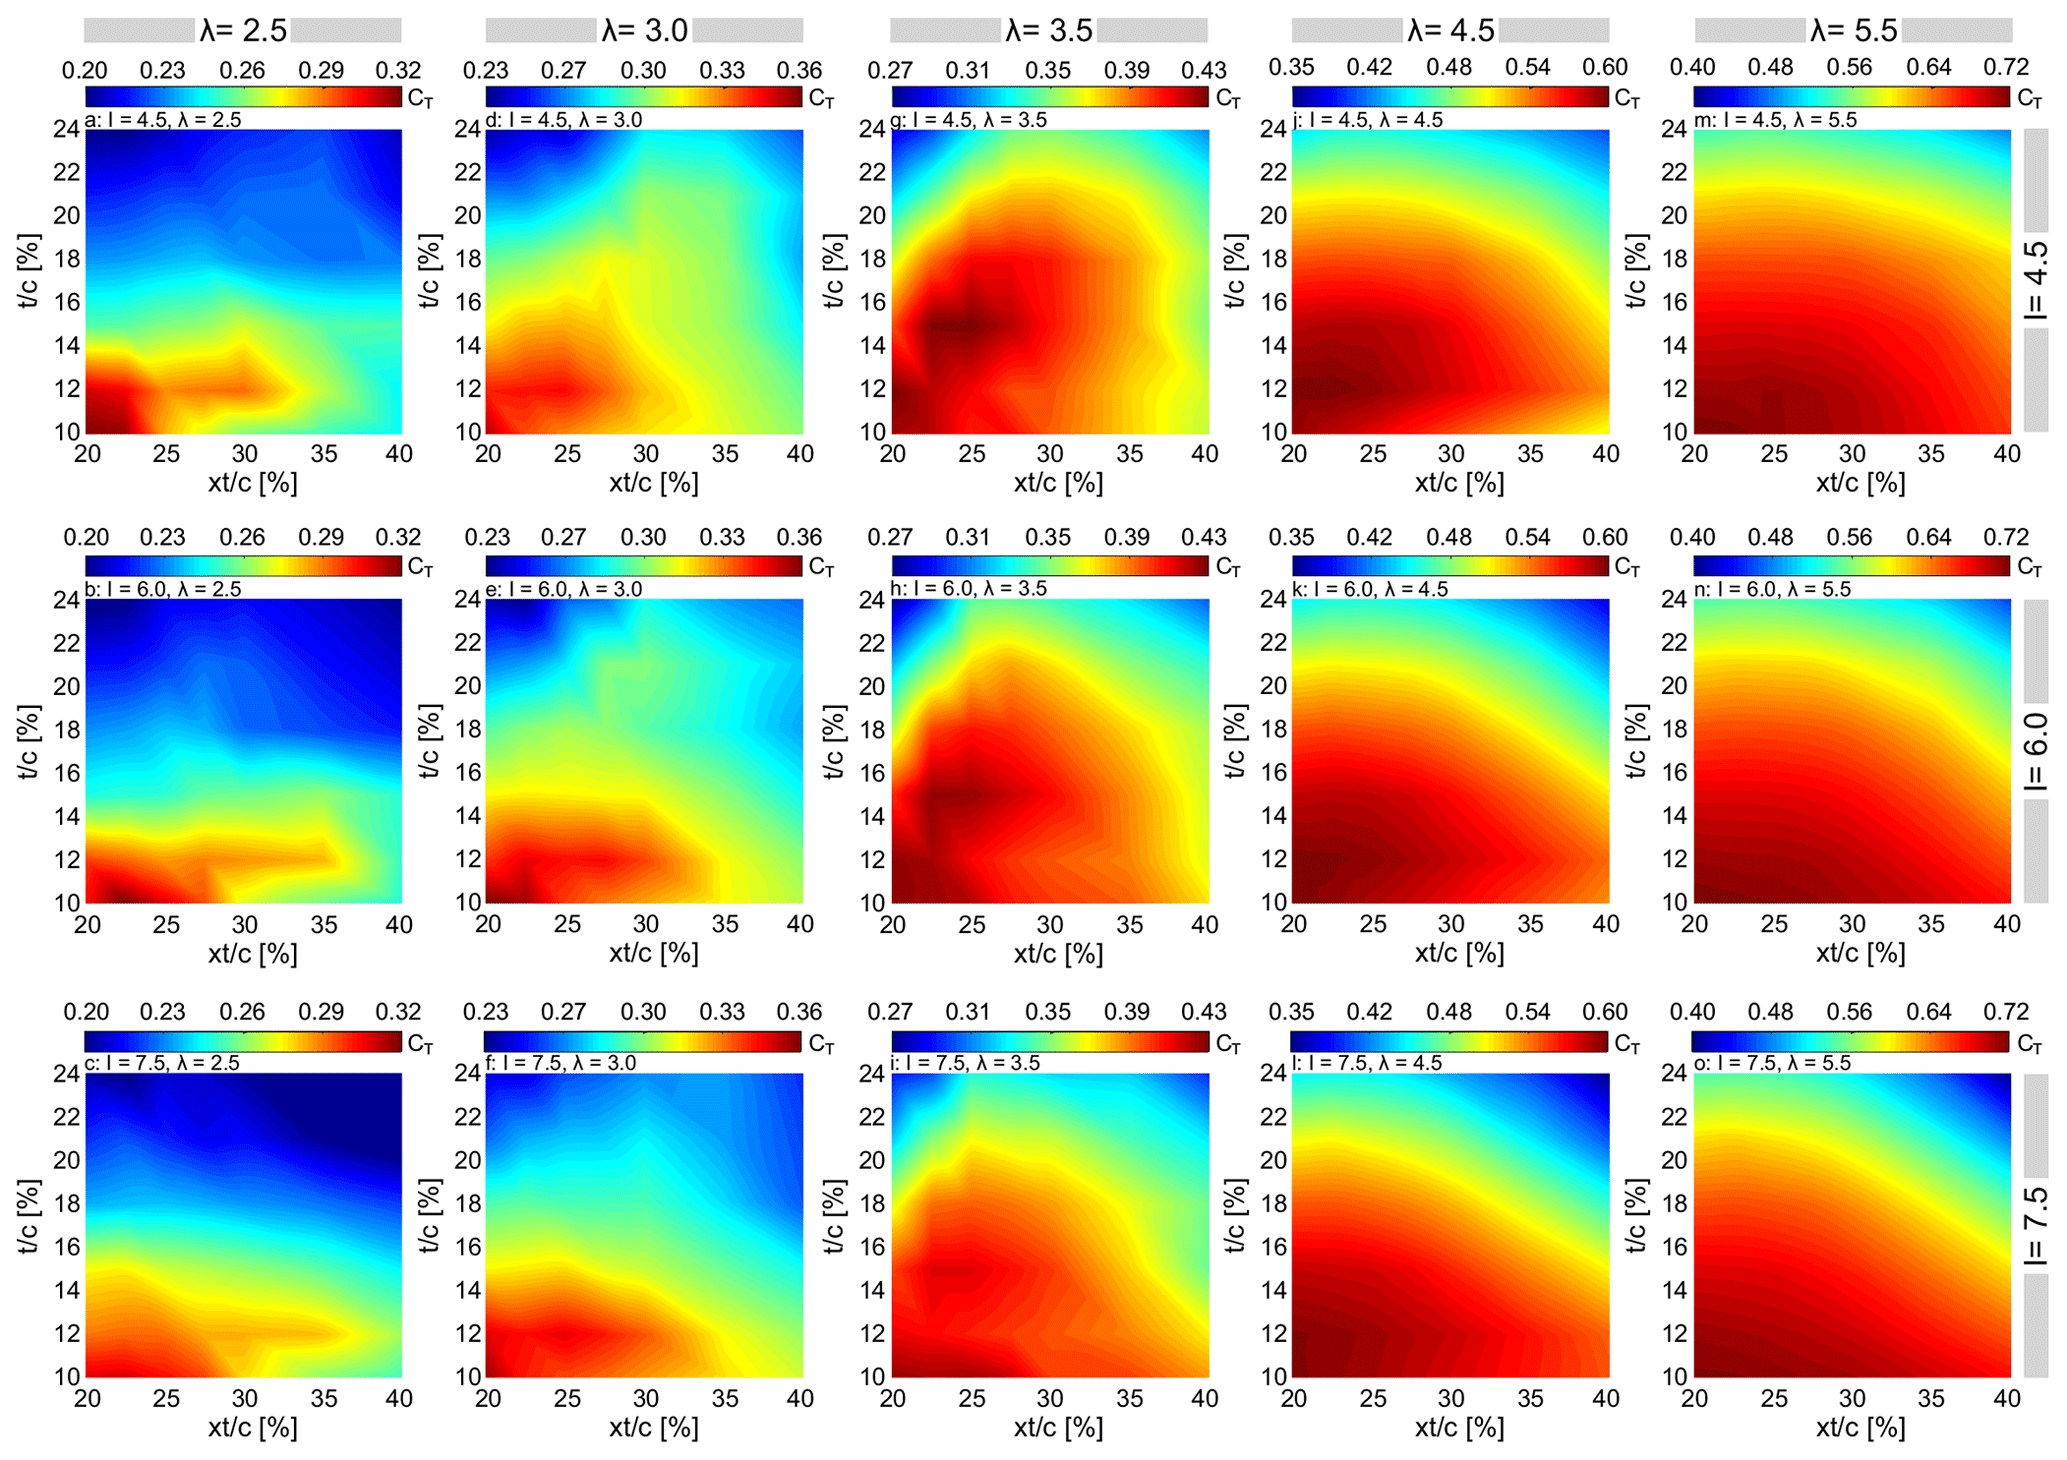
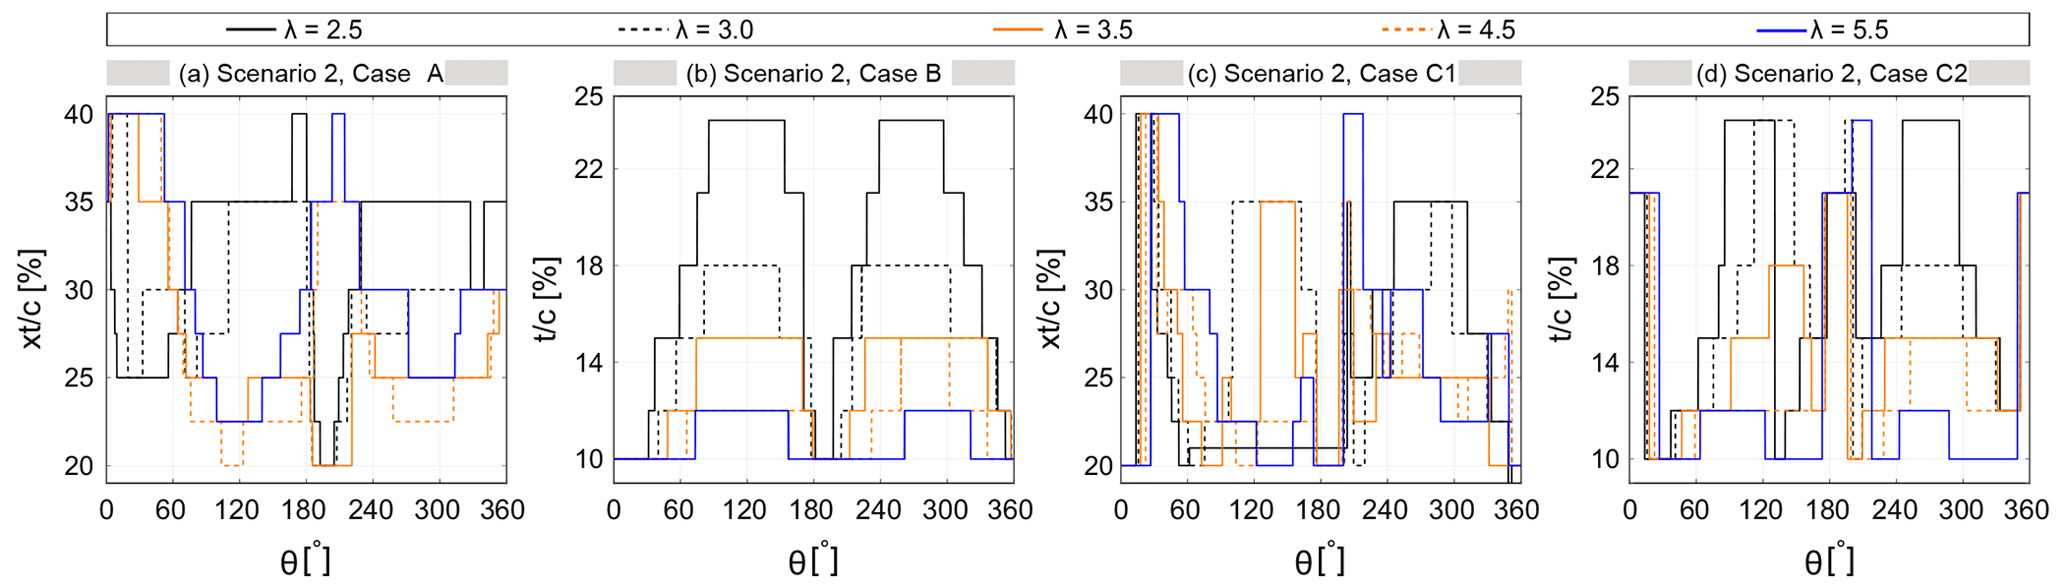
Figure 19Changing (a) and (b) versus azimuth for fixed and corresponding to each λ; changing (c) xt and (d) versus azimuth for fixed and corresponding to each dθ.
4.2 Towards a morphing blade
This section provides an overview of the turbine power gain due to different morphed-airfoil scenarios, namely a fixed optimal airfoil for each λ (scenario 1), as already discussed in Sect. 1, and an optimal airfoil for each dθ (scenario 2), as discussed in the following section. Figure 19 shows the variation of and versus azimuth for scenario 2. Figure 20 shows the corresponding Cm,max for each scenario in λ–θ space. Note that scenario 2 is divided into three cases, namely cases A, B and C. In cases A and B, the and of the already identified optimal shapes for each λ are kept fixed, and distributions of and versus θ, corresponding to Cm,max, are extracted, respectively. In case C, the combination of and , corresponding to Cm,max at each dθ, is selected and kept fixed, and distributions of (i.e. case C1) and (i.e. case C2) versus azimuth are extracted, respectively. Note that Iopt=4.5 remains invariant for λ≤4.5 and changes to Iopt=6.0 only at λ=5.5. For the sake of clarity and analysis, Iopt=4.5 is assumed to be constant throughout the studied range of λ, introducing the NACA0012-4.5/2.50 as the optimal airfoil at λ=5.5. The relative difference between the CP,max values for optimal airfoils with I=4.5 and 6.0 at λ=5.5 is −0.0013.
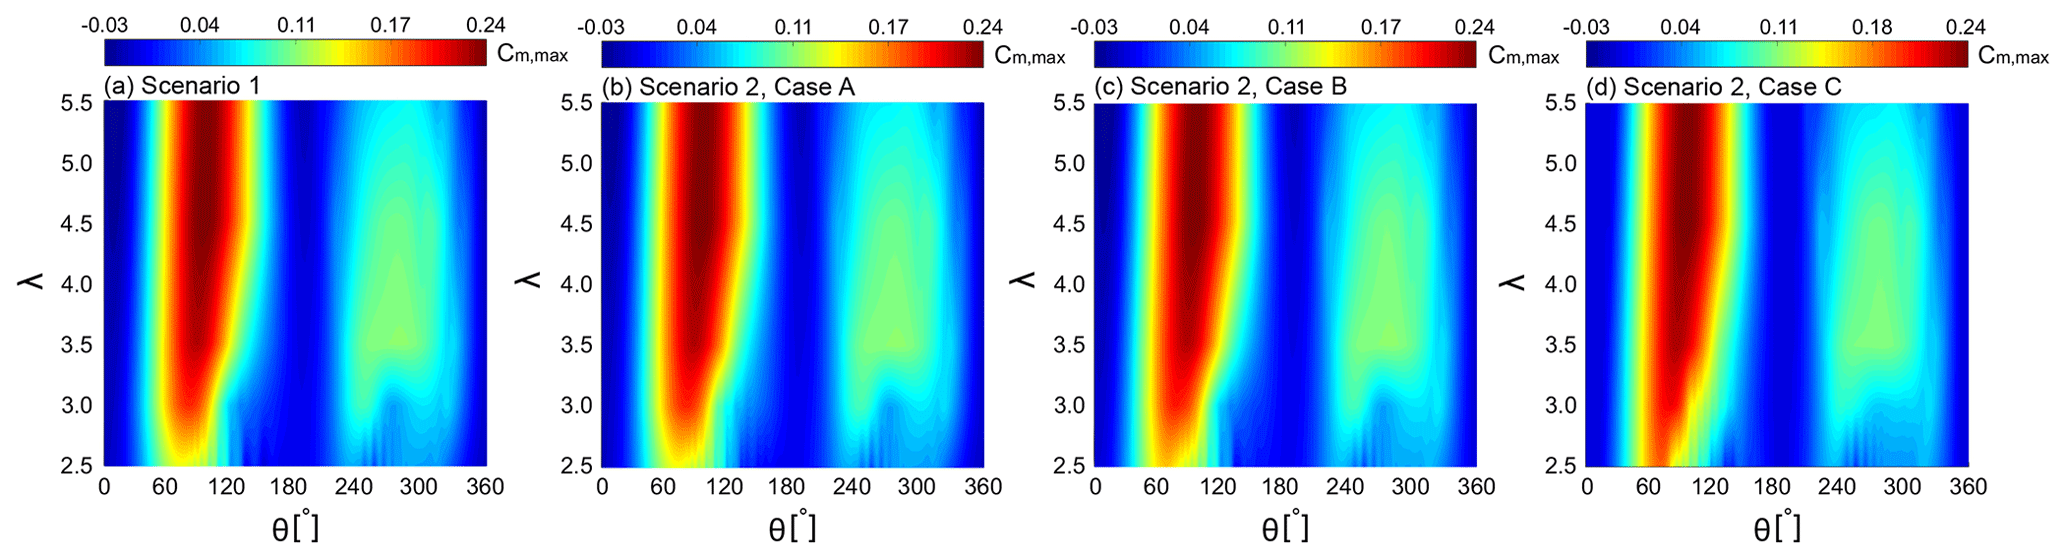
Figures 19a and 20b show the results for scenario 2, case A. Note that the results are based on individual simulations for the studied airfoil shapes and correspond to the with the highest value of Cm at each dθ. It can be observed that shows almost the same level of sensitivity to θ for different λ (see Fig. 18a). Figure 20b shows the overall view of the Cm,max, as the blade airfoil is morphed for different azimuthal position at each λ. Obviously, the maximum torque is obtained around θ=90∘ for different λ. The higher torque generated in the upwind quartile is due to the unperturbed upstream wind profile, while the less pronounced Cm,max in the downwind quartile is due to the lower wind velocity and blade–wake interaction.
For scenario 2, case B, the observed trend for is quite similar for different λ, except for a noticeable difference, that is, the higher λ is, the less sensitive the variation of to θ is. By increasing λ, and thus decreasing the , thinner airfoils outperform the thicker ones (see Fig. 19b). The turbine Cm,max in the λ–θ space shows negligible changes compared to that of scenario 2A (see Fig. 20c). The observations for scenario 2C1 and 2C2 are almost similar to those of cases A and B, respectively. However, there are some narrow ranges of θ at the beginning, middle and end of the turbine rotation disc, where noticeable differences exist. The resulting Cm,max in the λ–θ space differs slightly from the other scenarios (see Fig. 20d).
Figure 21 shows the turbine CP and the power gain due to the morphed airfoils and the reference case for the studied range of λ. The highest average improvement in the turbine CP is due to scenario 2C (i.e. fixed and , corresponding to the Cm,max at each dθ). By increasing λ from 2.5 to 3.5, the power gain significantly decreases. Nevertheless, for λ≥4.5 it marginally increases. The more pronounced ΔCP at low λ is mainly because of alleviating the adverse effects of dynamic stall due to the morphed airfoil. The averaged improvement in CP due to scenarios 1, 2A, 2B and 2C () over the studied range of λ is 0.04, 0.045, 0.047 and 0.06, respectively.
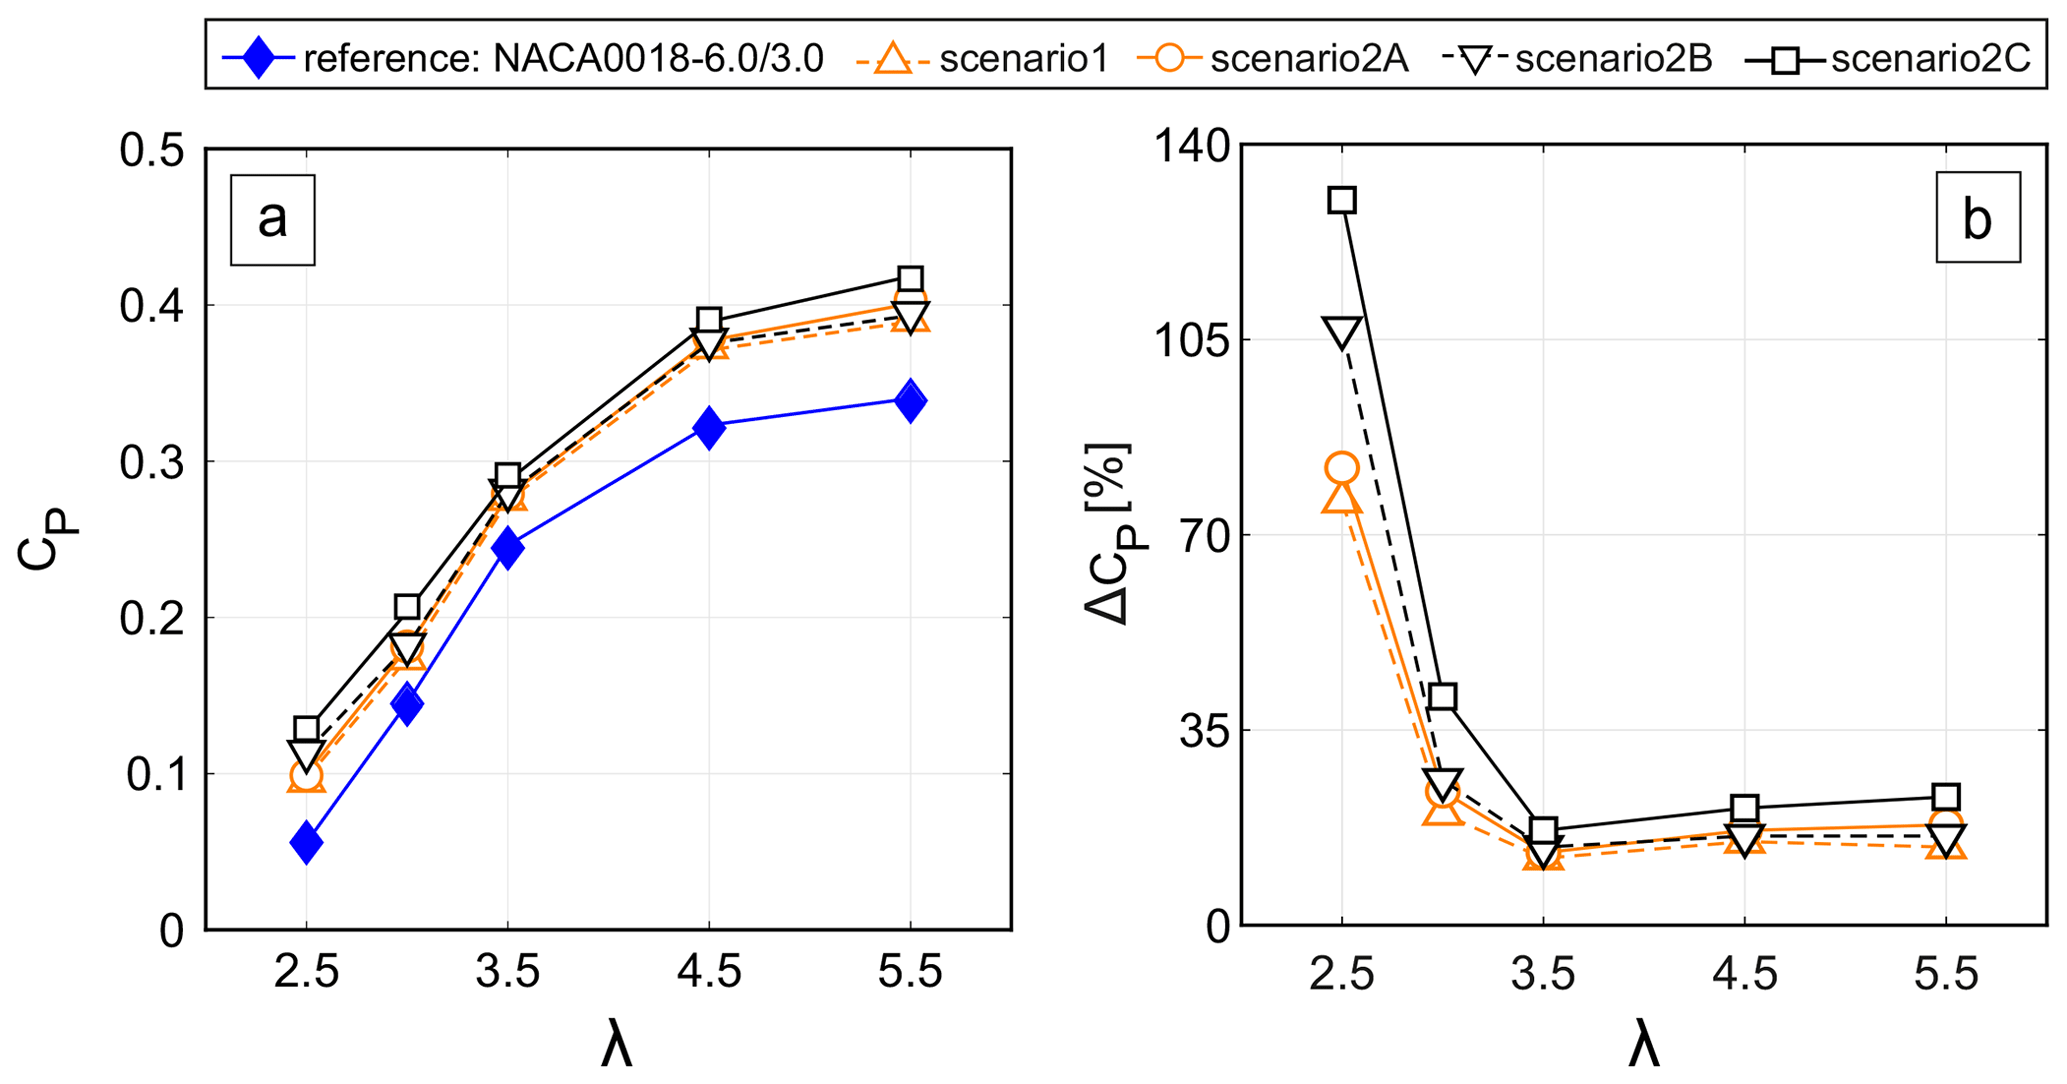
Figure 21Variations of (a) turbine CP and (b) power gain due to different scenarios for a morphed blade at different λ.
4.3 Aerodynamic analysis of the morphed airfoils
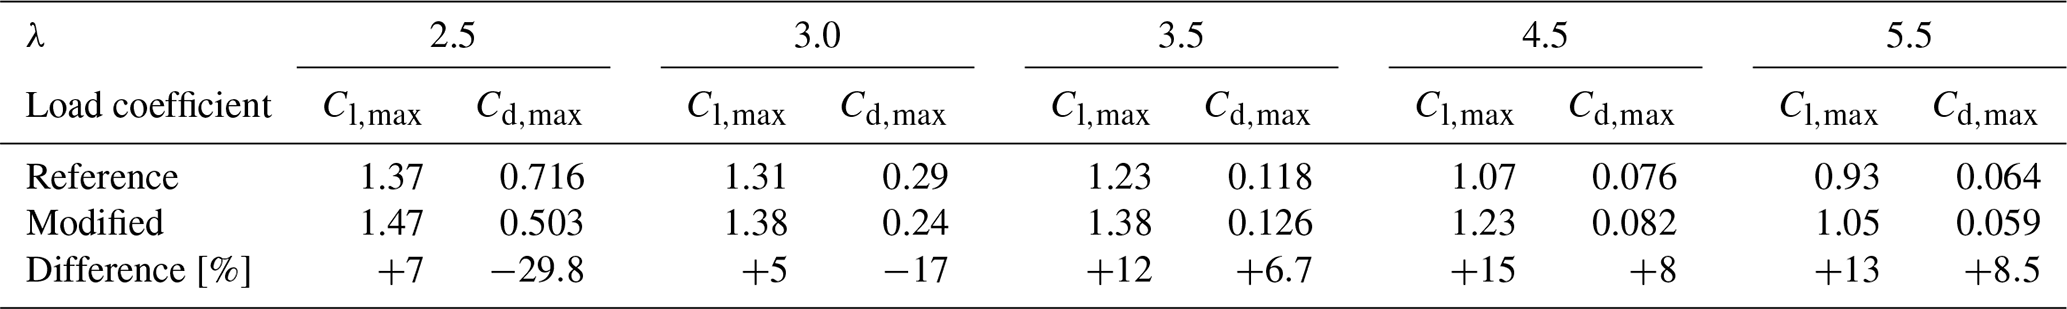
Figure 22 gives a comparison of the turbine aerodynamic loads (namely, Cl and Cd) versus θ and α for the reference and modified airfoils. The results correspond to scenario 1, where an optimal airfoil is identified for each λ. In general, the optimal airfoils have higher Cl,max compared to that of the reference case. For λ=2.5, the optimal airfoil shows an obvious reduction in drag jump both in upwind and downwind quartiles and reduced post-stall fluctuation. These are the reflections of the significantly alleviated dynamic stall. Table 5 gives the Cl,max and Cd,max values for the reference and optimal airfoils at different λ. It can be seen that for λ=3.0 and 3.5, where the turbine goes into a lighter dynamic stall regime, the optimal airfoil shows higher Cl,max with less severe post-stall fluctuation and lower Cd,max with less substantial drag jump. For λ≥4.5 (i.e. non-dynamic stall regime), although the modified airfoils show higher values for both the Cl,max and Cd,max, the increase in Cl,max is more dominant than that of the Cd,max (see also Table 5). Figure 23 shows the turbine Cm for the reference and optimal airfoils at each λ. Other than a reduction for 0∘ ≤ θ ≤ 80∘ at λ=2.5, the turbine Cm is found to improve moderately due to the optimal airfoils at the studied range of λ, indicating higher turbine CP.
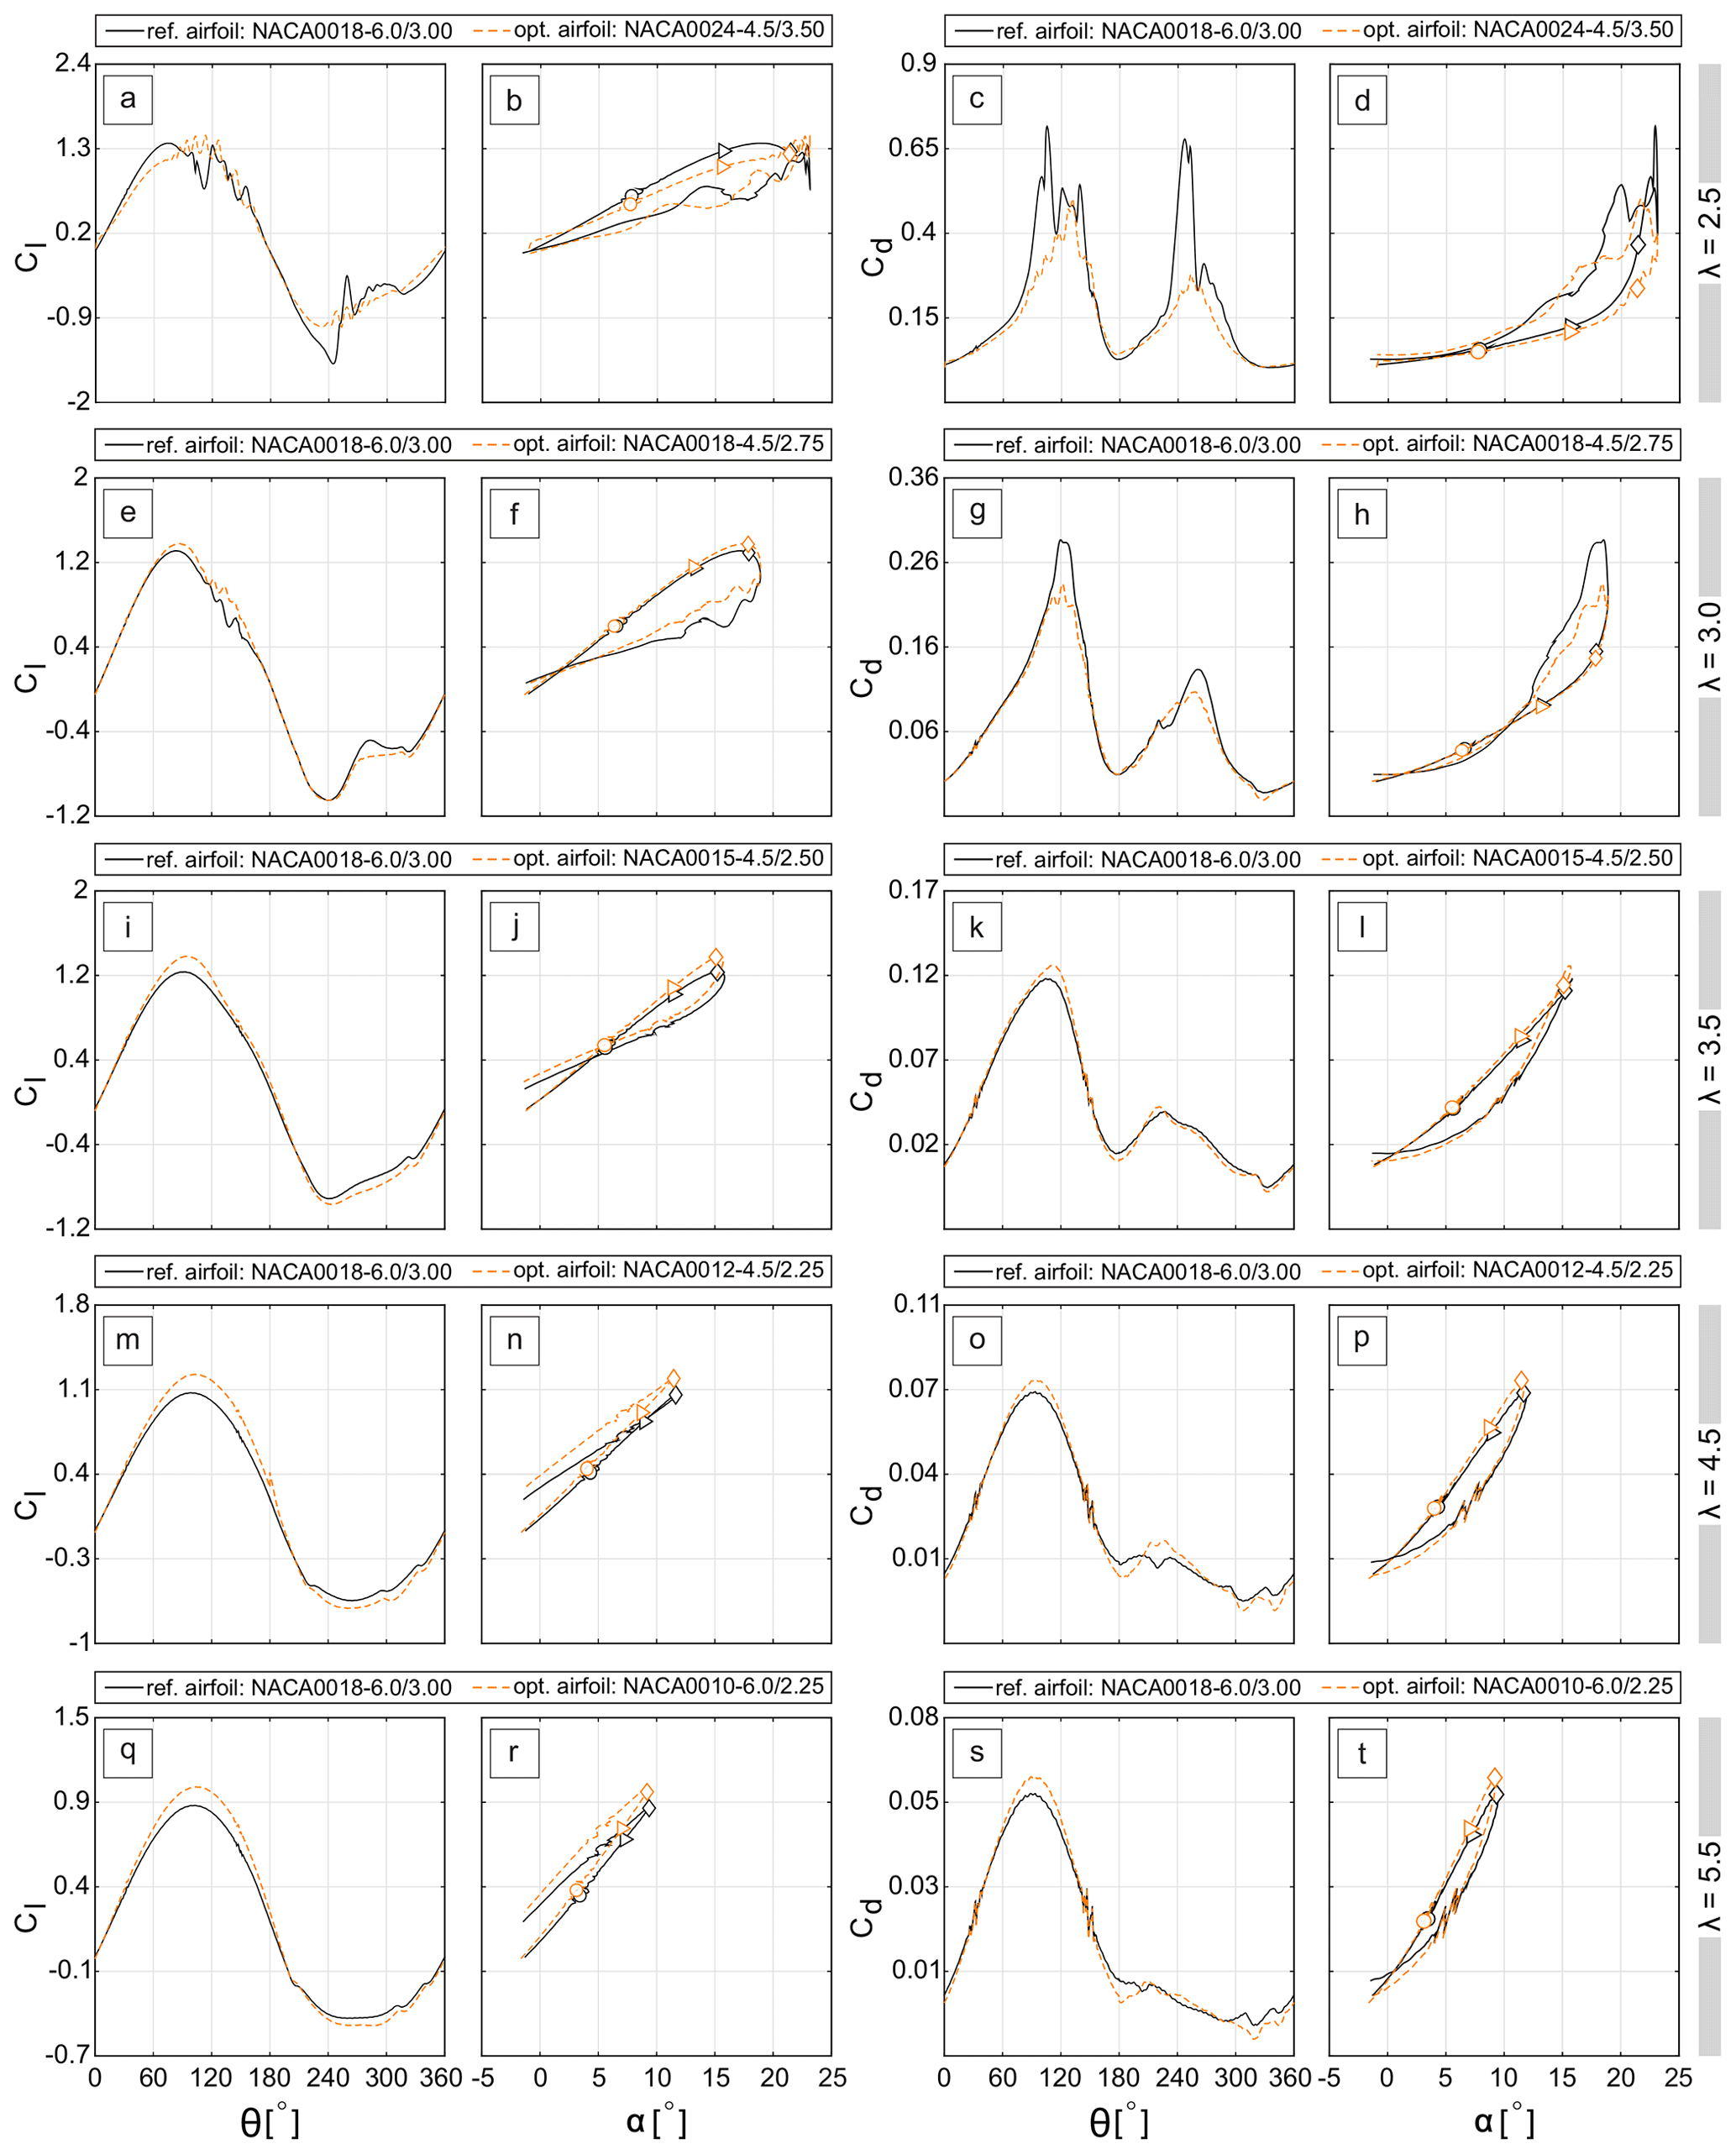
Figure 22Cl and Cd versus θ and α for the reference and optimal airfoils at different λ (∘: θ=60∘; ▹: θ=120∘; ⋄: θ=180∘).
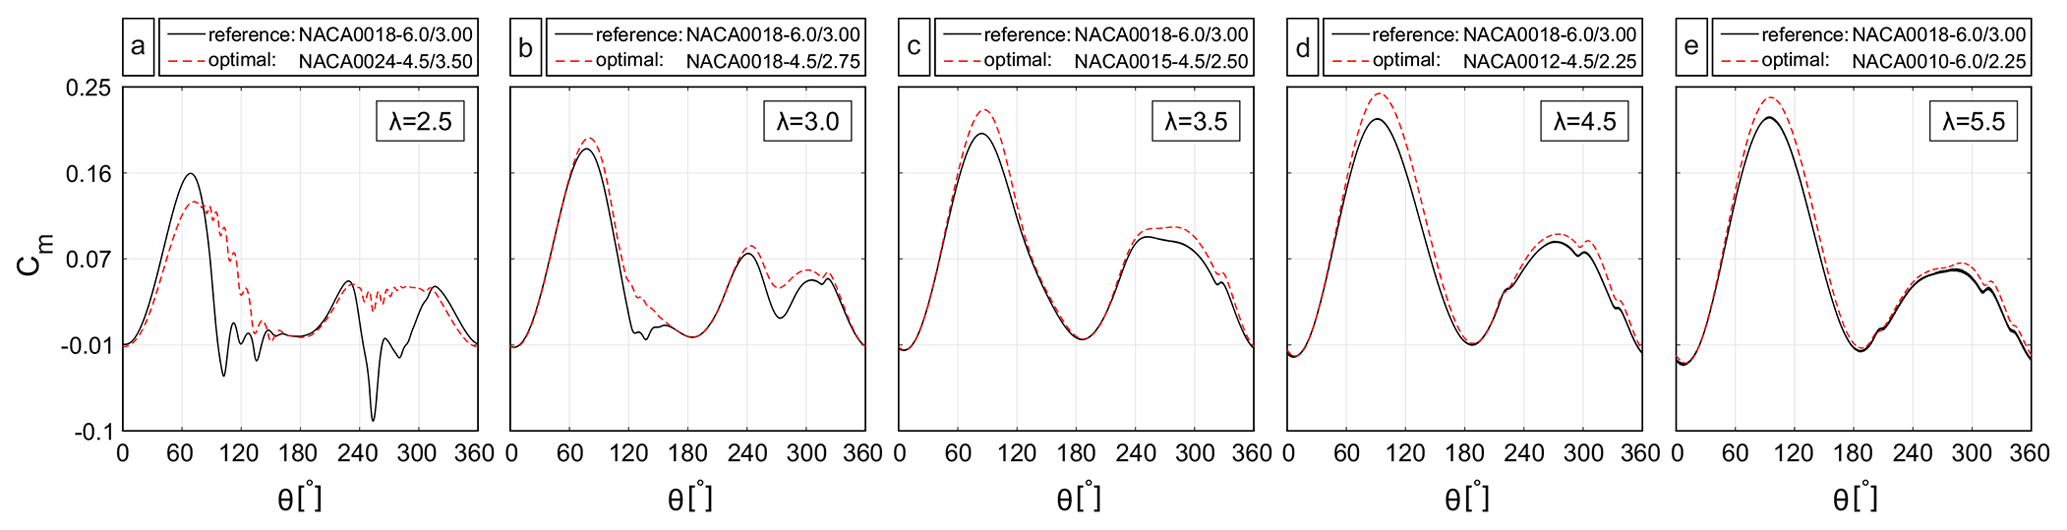
Table 5Estimated Cl,max and Cd,max for the reference and optimal airfoils at different λ (scenario 1).
The present work includes a wide range of λ, where the turbine goes into different operational regimes of light-, deep-, and non-dynamic stall regimes. The aim of the analysis is to highlight the power gain of VAWTs due to different morphed-airfoil scenarios. The results prove the usefulness of the morphing technique to improve the power performance of VAWTs as the main objective of this work. Also, the structural strength of the blade could be another important objective that must be considered while designing morphing blades for VAWTs. It is found that this objective is also satisfied, and the blade structural limitations are met. This is due to the fact that the morphed airfoil changes from a thin one for the highest λ, corresponding to low wind speeds and aerodynamic loads, to a more robust thick airfoil for the lowest λ, where the lack of strength and stiffness can cause blade failure, and thus the blade needs to withstand the aerodynamic loads and to avoid the resultant deflections. However, the maximum and minimum morphing ranges for the airfoil shape-defining parameters might be limited due to the manufacturing process. Another technical challenge of utilising a morphing blade for VAWTs is the fatigue failure of the blade due to continuous shape changing. Therefore, an analysis of stresses and fatigue is of high importance to determine the effects of morphing technique on the lifetime of the smart rotor. In addition, technical considerations related to the complexity of the electromechanical actuators for the morphing blade must be taken into account. The required actuators need to be chosen such that they can meet the displacement requirements at the given response times and rotational speeds in Table 6, which might be unfeasible for very small values of dθ. However, extracting the optimal airfoils corresponding to higher values of dθ (e.g. dθ=30, 45, and 90∘) could result in much higher values of response time and thus make it technically possible to adapt the shape changes with azimuthal position. It is of particular importance to consider the cost factor and also to estimate the contribution of morphing blade in annual energy production of the wind turbine for an annual average wind speed, i.e. the difference between the power required to drive the actuators and the resulting turbine power gain.
Table 6Actuator response time for the blade to morph at λ=2.5, 3.0, 3.5, 4.5 and 5.5.
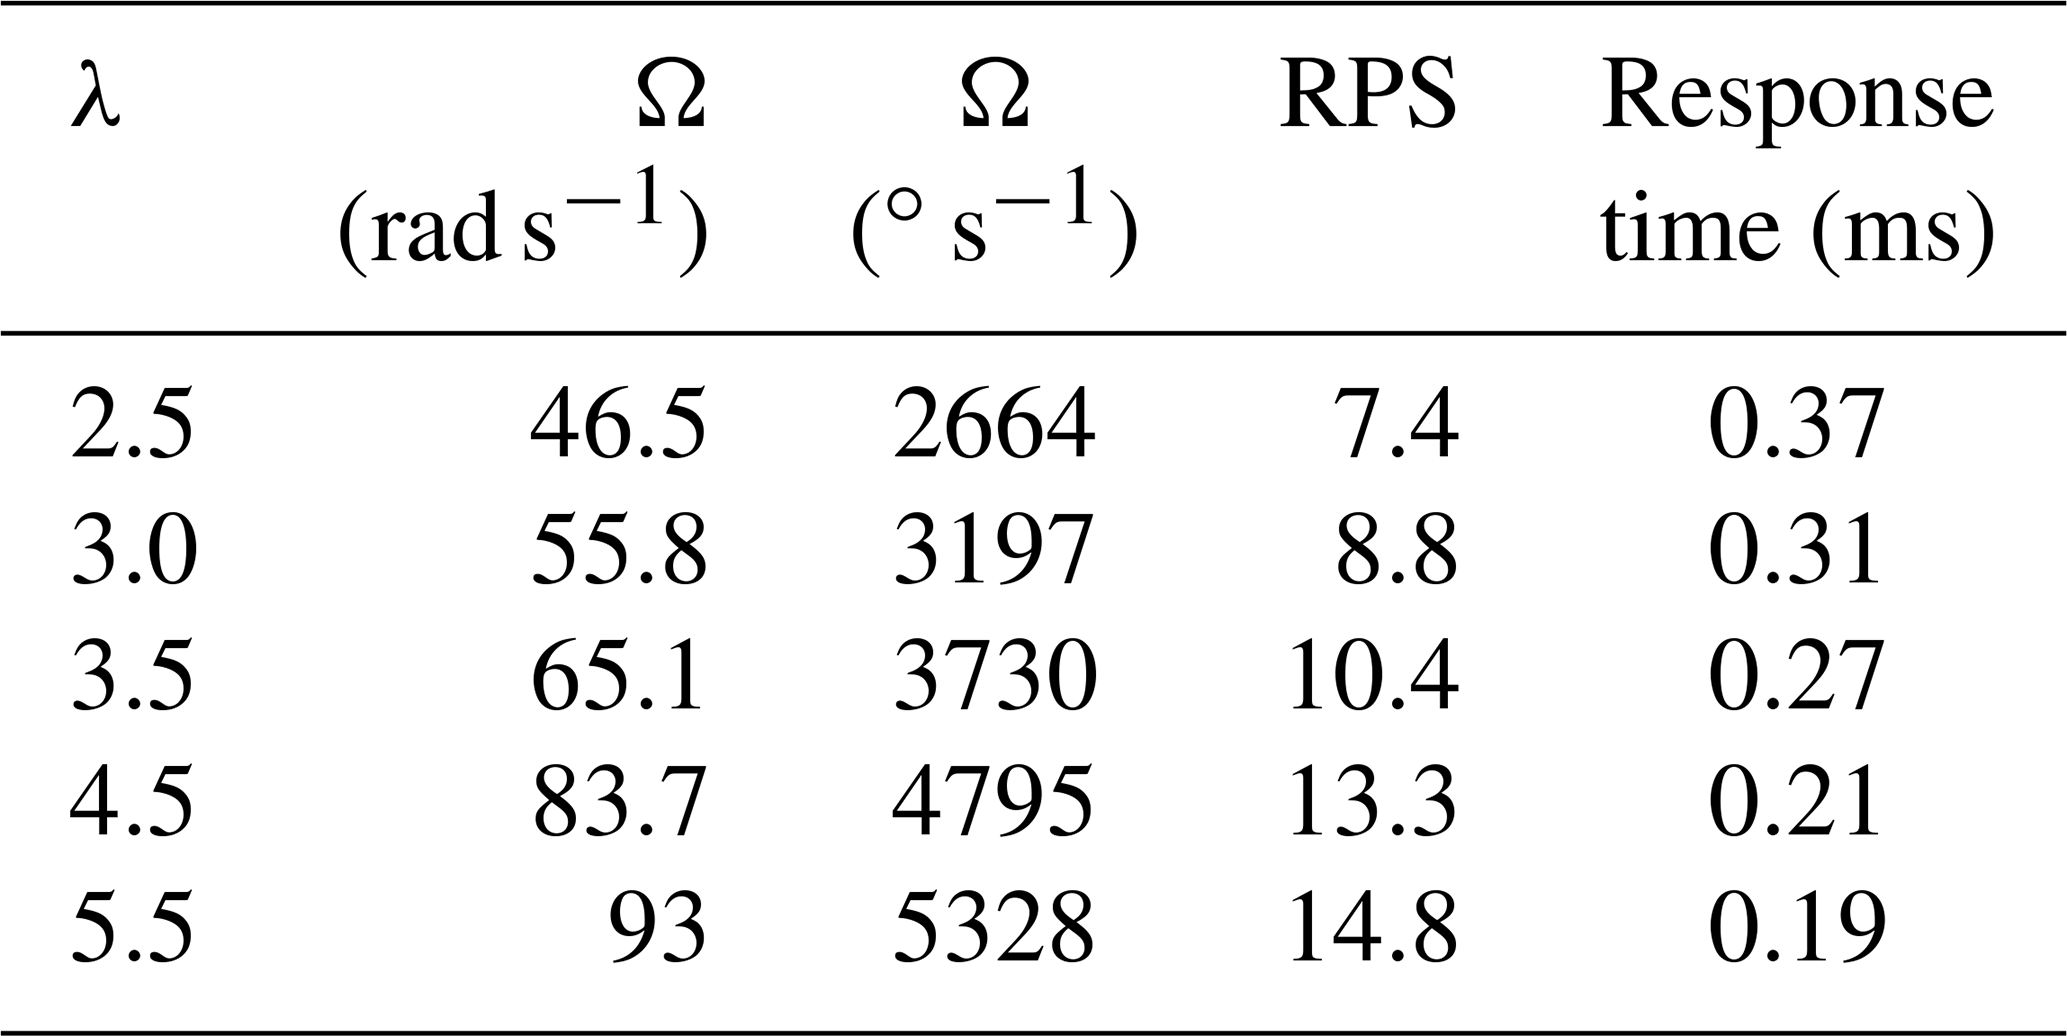
Note: RPS (revolution per second); ms (millisecond).
6.1 Geometrical parameters
The symmetric modified NACA four-digit airfoil series is chosen as a basis for the studied airfoils. The airfoils are generated by changing the three main defining parameters, i.e. , and rLE. However, it is suggested to continue this work for the rest of the parameters, such as camber and its position along the chord, which describe the airfoil asymmetry and have the potential to morph.
The number of blades (n) and solidity (σ) are another two important parameters that would also impact the turbine performance. Some attempts have been made to study the impact of these parameters on turbine performance (Rezaeiha et al., 2018a; Subramanian et al., 2017). For example, it was shown that, for different λ, at a given Rec the variations of α are almost independent of n. In addition, increasing solidity decreases the variations of α at different λ (Rezaeiha et al., 2018a). Therefore, based on the results presented in Sect. 4.2, it is expected that for two-, three- and four-bladed VAWTs, the airfoil shape-defining parameters show the same level of sensitivity to θ, and for higher σ, the airfoil parameters show less pronounced sensitivity to θ. However, due to high computational costs, the focus of this work as the first step in designing smart rotors is confined to investigating the impact of airfoil parameters for a single-blade turbine with a fixed solidity. In addition, due to the large number of simulations in this work, the location of the blade–spoke connection is considered fixed at . Nonetheless, for real application scenarios, dedicated investigations are required to study the sensitivity of the optimal regions for the airfoil shape-defining parameters to the number of blades, the solidity, and the blade and spoke connection point.
6.2 Unsteady aerodynamics
The present study is performed based on a quasi-static assumption where the optimal airfoils at each dθ are selected from individual simulations for the studied airfoil shapes. Therefore, the effect of the varying unsteady changes in bound circulation due to the morphing blade has been considered negligible, and hence no shed vorticity is assumed as a result of the bound circulation temporal gradient. The presented results, as the first step on the way to the smart rotor design, can be utilised as primary tools for quasi-dynamic simulations, where a more focused analysis on a morphing blade scenario would inevitably have to include the mentioned effect, but in view of the major aims put forward in this work, this scenario is left for future studies.
6.3 Operational parameters
The present study is focused on a fixed Reynolds number (Re), turbulence intensity (TI) and reduced frequency (K). In an extensive numerical study by Rezaeiha et al. (2018b), it was shown that the variations of α and normalised Vrel are almost independent of Re and TI. Nevertheless, dedicated studies are mandatory to draw definitive conclusions concerning the impact of these parameters on the optimal region of airfoil geometrical parameters.
6.4 Modelling approach
In the present study, 2D URANS simulations are conducted, representing the midplane of a turbine with a high aspect ratio and negligible 3D tip effects. The 2D simulations are chosen based on our earlier study, where the results from 2D and 2.5D simulations for a VAWT with a given λ and σ showed negligible differences (<1 %) in power and thrust coefficients (CP and CT) (Rezaeiha et al., 2017a). However, compared with the more computationally expensive approaches such as scale-resolving simulations (SRS) and hybrid RANS/LES (large-eddy simulation), the URANS approach fails to provide accurate prediction of the turbine power performance under the influence of the dynamic stall characteristics at low λ – i.e. formation, growth, bursting and shedding of the LSB, dynamic stall vortex (DSV), and trailing-edge vortex (TEV) (Rezaeiha et al., 2019a).
Incompressible URANS simulations, previously validated with experiments, are used to study the impact of different morphed-airfoil scenarios on the power and thrust performance of a VAWT. Three main airfoil shape-defining parameters, namely , and I, are chosen and modified as functions of λ and θ to determine the optimal airfoils in terms of CP in a wide range of λ.
The main conclusions are as follows.
-
For each λ, there exists an optimal airfoil shape corresponding to the turbine CP,max. At the lowest λ=2.5, the modified airfoil is defined with %, % and I=4.5 (i.e. the NACA0024-4.5/3.5). In comparison to the baseline airfoil (i.e. the NACA0018-6.0/3.0), this airfoil has a smaller leading-edge radius and a higher maximum thickness, which is found to shift downstream of the default point by 5 %.
-
By increasing λ, the combination of and changes to lower values; however, it shows less dependency on rLE. For λ=3.0, 3.5, 4.5 and 5.5, the optimal airfoils are the NACA0018-4.5/2.75, NACA0015-4.5/2.50, NACA0012-4.5/2.25 and NACA0010-6.0/2.25, respectively.
-
Regarding the modified airfoil as a function of θ, the highest average improvement in the turbine CP is due to scenario 2C, where the combination of and , corresponding to the turbine Cm,max at each dθ, is selected and kept fixed.
-
The improvement in CP due to the modifying blade becomes more pronounced for low values of λ, where the adverse effects of dynamic stall, e.g. jump in aerodynamic loads and post-stall loads fluctuation, are mitigated by using morphed airfoils.
The presented work not only highlights the strong relevance of the gain in turbine CP to different scenarios for morphing airfoils but also emphasises the combined changing of the airfoil shape-defining parameters. That is, single-parameter modification will not result in the highest power improvement for VAWTs. Other important considerations, such as changing the rest of the geometrical parameters (e.g. camber and its chordwise position, blade/spoke connection point, number of blades and solidity), are yet to be determined. Therefore, the present study could be a significant stride towards future studies on designing advanced morphing blades for smart VAWTs.
| α | Angle of attack [∘] |
| k | Reduced frequency, [–] |
| αss | Static stall angle [∘] |
| L | Lift [N] |
| θ | Azimuth angle [∘] |
| M | Turbine moment [Nm] |
| λ | Tip speed ratio, [–] |
| n | Number of blades [–] |
| ν | Kinematic viscosity of air [m2 s−1] |
| P | Turbine output power [W] |
| σ | Solidity, [–] |
| q | Dynamic pressure [Pa] |
| Ω | Turbine rotational speed [rad s−1] |
| R | Turbine radius [m] |
| A | Turbine swept area, h⋅d [m2] |
| Rec | Chord-based Reynolds number, |
| [–] | |
| c | Airfoil chord length [m] |
| rLE | Airfoil leading-edge radius [%c] |
| Cd | Drag coefficient, [–] |
| T | Turbine thrust force [N] |
| Cf | Skin-friction coefficient, [–] |
| Airfoil relative maximum thickness [%] | |
| Cl | Lift coefficient, [–] |
| U∞ | Free stream velocity [m s−1] |
| Cm | Moment coefficient, [–] |
| U | Instantaneous streamwise velocity [m s−1] |
| CP | Turbine power coefficient, [–] |
| V | Instantaneous lateral velocity [m s−1] |
| CT | Turbine thrust coefficient, [–] |
| Vtan,n | Dimensionless instantaneous tangential |
| velocity, [–] | |
| D | Drag [N] |
| Vrel | Relative velocity [m s−1] |
| h | Turbine height [m] |
| Dimensionless chordwise position of airfoil | |
| maximum thickness [%] | |
| I | Airfoil leading-edge radius index [–] |
| TI | Turbulence intensity [%] |
The numerical results are generated using the commercial CFD package ANSYS Fluent v2019R2 licensed under the University of Malta.
The experimental data that support the findings of this study are openly available at https://doi.org/10.1016/j.renene.2014.02.042 (Tescione et al., 2014), https://doi.org/10.1007/s00348-008-0543-z (Ferreira et al., 2009) and https://doi.org/10.1016/j.energy.2011.05.036 (Castelli et al., 2011).
MRT: conceptualisation, methodology, software, validation, writing – original draft; AR: data curation, conceptualisation, supervision, project administration; DM: conceptualisation, writing – review and editing, visualisation.
The contact author has declared that none of the authors has any competing interests.
Publisher's note: Copernicus Publications remains neutral with regard to jurisdictional claims in published maps and institutional affiliations.
The first author acknowledges the support from his home university for the use of the supercomputing facilities.
This paper was edited by Michael Muskulus and reviewed by two anonymous referees.
Ajaj, R. M., Parancheerivilakkathil, M. S., Amoozgar, M., Friswell, M. I., and Cantwell, W. J.: Recent developments in the aeroelasticity of morphing aircraft, Prog. Aerosp. Sci., 120, 100682, https://doi.org/10.1016/j.paerosci.2020.100682, 2021.
Amet, E., Maitre, T., Pellone, C., and Achard, J.-L.: 2D Numerical simulations of blade-vortex interaction in a Darrieus turbine, J. Fluids Eng., 131, 1–15, https://doi.org/10.1115/1.4000258, 2009.
Balduzzi, F., Bianchini, A., Ferrara, G., and Ferrari, L.: Dimensionless numbers for the assessment of mesh and timestep requirements in CFD simulations of Darrieus wind turbines, Energy, 97, 246–261, https://doi.org/10.1016/j.energy.2015.12.111, 2016a.
Balduzzi, F., Bianchini, A., Maleci, R., Ferrara, G., and Ferrari, L.: Critical issues in the CFD simulation of Darrieus wind turbines, Renew. Energy, 85, 419–435, https://doi.org/10.1016/j.renene.2015.06.048, 2016b.
Barbarino, S., Bilgen, O., Ajaj, R. M., Friswell, M. I., and Inman, D. J.: A Review of Morphing Aircraft, J. Intel. Mater. Syst. Struct., 22, 823–877, https://doi.org/10.1177/1045389X11414084, 2011.
Bedon, G., De Betta, S., and Benini, E.: Performance-optimized airfoil for Darrieus wind turbines, Renew. Energy, 94, 328–340, https://doi.org/10.1016/j.renene.2016.03.071, 2016.
Beyene, A. and Peffley, J.: A morphing blade for wave and wind energy conversion, in: OCEANS 2007 – Europe, 18–21 June 2007, Aberdeen, UK, 1–6, https://doi.org/10.1109/OCEANSE.2007.4302482, 2007.
Bianchini, A., Ferrara, G., and Ferrari, L.: Design guidelines for H-Darrieus wind turbines: Optimization of the annual energy yield, Energ. Convers. Manage., 89, 690–707, https://doi.org/10.1016/j.enconman.2014.10.038, 2015.
Castelli, M. R., Englaro, A., and Benini, E.: The Darrieus wind turbine: proposal for a new performance prediction model based on CFD, J. Energy, 36, 4919–4934, https://doi.org/10.1016/j.energy.2011.05.036, 2011.
Coiro, D., Nicolosi, F., De Marco, A., Melone, S., and Montella, F.: Flow Curvature Effect on Dynamic Behaviour of a Novel Vertical Axis Tidal Current Turbine: Numerical and Experimental Analysis, in: ASME 2005 24th International Conference on Offshore Mechanics and Arctic Engineering, 12–17 June 2005, Halkidiki, Greece, 601–609, https://doi.org/10.1115/omae2005-67193, 2005.
Daynes, S. and Weaver, P. M.: A morphing trailing edge device for a wind turbine, J. Intel. Mater. Syst. Struct., 23, 691–701, https://doi.org/10.1177/1045389X12438622, 2012.
Debiasi, M., Khoo, H. H., Bouremel, Y., Luo, S. c., and Zhiwei, E.: Shape change of the upper surface of an airfoil by macro fiber composite actuators, in: 29th AIAA Applied Aerodynamics Conference, 27–30 June 2011, Hawaii, https://doi.org/10.2514/6.2011-3809, 2011.
Ferreira, C. S., Van Kuik, G., Van Bussel, G., and Scarano, F.: Visualization by PIV of dynamic stall on a vertical axis wind turbine, Exp. Fluids, 46, 97–108, https://doi.org/10.1007/s00348-008-0543-z, 2009.
Frolov, V. A.: Laminar separation point of flow on surface of symmetrical airfoil, in: Proceedings of the 18th International Conference on the Methods of Aerophysical Research, 27 June–3 July 2016, Perm, Russia, 030053, https://doi.org/10.1063/1.4963995, 2016.
Hand, B., Kelly, G., and Cashman, A.: Numerical simulation of a vertical axis wind turbine airfoil experiencing dynamic stall at high Reynolds numbers, Comput, Fluids, 149, 12–30, https://doi.org/10.1016/j.compfluid.2017.02.021, 2017.
Healy, J.: The influence of blade thickness on the output of vertical axis wind turbines, J. Wind Energ., 2, 1–9, 1978.
Ismail, M. F. and Vijayaraghavan, K.: The effects of aerofoil profile modification on a vertical axis wind turbine performance, Energy, 80, 20–31, https://doi.org/10.1016/j.energy.2014.11.034, 2015.
Jain, S. and Saha, U. K.: On the influence of blade thickness-to-chord ratio on dynamic stall phenomenon in H-type Darrieus wind rotors, Energ. Convers. Manage., 218, 113024, https://doi.org/10.1016/j.enconman.2020.113024, 2020.
Lachenal, X., Daynes, S., and Weaver, P. M.: A zero torsional stiffness twist morphing blade as a wind turbine load alleviation device, Smart Mater. Struct., 22, 065016, https://doi.org/10.1088/0964-1726/22/6/065016, 2013.
Ma, N., Lei, H., Han, Z., Zhou, D., Bao, Y., Zhang, K., Zhou, L., and Chen, C.: Airfoil optimization to improve power performance of a high-solidity vertical axis wind turbine at a moderate tip speed ratio, J. Energy, 150, 236–252, https://doi.org/10.1016/j.energy.2018.02.115, 2018.
MacPhee, D. W. and Beyene, A.: Experimental and fluid structure interaction analysis of a morphing wind turbine rotor, J. Energy, 90, 1055–1065, https://doi.org/10.1016/j.energy.2015.08.016, 2015.
Mazarbhuiya, H. M. S. M., Biswas, A., and Sharma, K. K.: Blade thickness effect on the aerodynamic performance of an asymmetric NACA six series blade vertical axis wind turbine in low wind speed, Int. J. Green Energ., 17, 171–179, https://doi.org/10.1080/15435075.2020.1712214, 2020.
McCroskey, W. J.: The phenomenon of dynamic stall, NASA TM 81264, NASA, Moffett Field, CA, https://ntrs.nasa.gov/citations/19810011501 (last access: 8 September 2023), 1981.
Melani, P. F., Balduzzi, F., Ferrara, G., and Bianchini, A.: How to extract the angle attack on airfoils in cycloidal motion from a flow field solved with computational fluid dynamics? Development and verification of a robust computational procedure, Energ. Convers. Manage., 223, 113284, https://doi.org/10.1016/j.enconman.2020.113284, 2020.
Meseguer, J., Alonso, G., Sanz-Andrés, A., and Pérez-Grande, I.: On the circulation and the position of the forward stagnation point on airfoils, Int. J. Mech. Eng. Educ., 35, 65–75, https://doi.org/10.7227/IJMEE.35.1.5, 2007.
Migliore, P., Fanucci, J., and Wolfe, W.: Flow Curvature Effects on Darrieus Turbine Blade Aerodynamics, J. Energy, 4, 49–55, https://doi.org/10.2514/3.62459, 1980.
Minetto, R. A. L. and Paraschivoiu, M.: Simulation based analysis of morphing blades applied to a vertical axis wind turbine, J. Energy, 202, 117705, https://doi.org/10.1016/j.energy.2020.117705, 2020.
Mir, I., Maqsood, A., Eisa, S. A., Taha, H., and Akhtar, S.: Optimal morphing – augmented dynamic soaring maneuvers for unmanned air vehicle capable of span and sweep morphologies, Aerosp. Sci. Technol., 79, 17–36, https://doi.org/10.1016/j.ast.2018.05.024, 2018.
Mulleners, K. and Raffel, M.: The onset of dynamic stall revisited, Exp. Fluids, 52, 779–793, https://doi.org/10.1007/s00348-011-1118-y, 2012.
Nguyen, C.-C. and Tran, P.-T.: A numerical study of thickness effect of the symmetric NACA 4-digit airfoils on self starting capability of a 1 kW H-type vertical axis wind turbine, J. Mech. Eng. Appl., 3, 7–16, 2015.
Pechlivanoglou, G., Wagner, J., Nayeri, C., and Paschereit, C.: Active aerodynamic control of wind turbine blades with high deflection flexible flaps, in: 48th AIAA Aerospace Sciences Meeting Including the New Horizons Forum and Aerospace Exposition, 4–7 January 2010, Orlando, Florida, https://doi.org/10.2514/6.2010-644, 2010.
Rainbird, J. M., Bianchini, A., Balduzzi, F., Peiró, J., Graham, J. M. R., Ferrara, G., and Ferrari, L.: On the influence of virtual camber effect on airfoil polars for use in simulations of Darrieus wind turbines, Energ. Convers. Manage., 106, 373–384, https://doi.org/10.1016/j.enconman.2015.09.053, 2015.
Rezaeiha, A., Kalkman, I. M., and Blocken, B.: CFD simulation of a vertical axis wind turbine operating at a moderate tip speed ratio: guidelines for minimum domain size and azimuthal increment, Renew. Energy, 107, 373–385, https://doi.org/10.1016/J.RENENE.2017.02.006, 2017a.
Rezaeiha, A., Kalkman, I., Montazeri, H., and Blocken, B.: Effect of the shaft on the aerodynamic performance of urban vertical axis wind turbines, Energ. Convers. Manage., 149, 616–630, https://doi.org/10.1016/j.enconman.2017.07.055, 2017b.
Rezaeiha, A., Montazeri, H., and Blocken, B.: Towards optimal aerodynamic design of vertical axis wind turbines: Impact of solidity and number of blades, J. Energy, 165, 1129–1148, https://doi.org/10.1016/j.energy.2018.09.192, 2018a.
Rezaeiha, A., Montazeri, H., and Blocken, B.: Characterization of aerodynamic performance of vertical axis wind turbines: impact of operational parameters, Energ. Convers. Manage., 169, 45–77, https://doi.org/10.1016/j.enconman.2018.05.042, 2018b.
Rezaeiha, A., Montazeri, H., and Blocken, B.: Towards accurate CFD simulations of vertical axis wind turbines at different tip speed ratios and solidities: Guidelines for azimuthal increment, domain size and convergence, Energ. Convers. Manage., 156, 301–316, https://doi.org/10.1016/j.enconman.2017.11.026, 2018c.
Rezaeiha, A., Montazeri, H., and Blocken, B.: CFD analysis of dynamic stall on vertical axis wind turbines using Scale-Adaptive simulation (SAS): Comparison against URANS and hybrid RANS/LES, Energ. Convers. Manage., 196, 1282–1298, https://doi.org/10.1016/j.enconman.2019.06.081, 2019a.
Rezaeiha, A., Montazeri, H., and Blocken, B.: On the accuracy of turbulence models for CFD simulations of vertical axis wind turbines, J. Energy, 180, 838–857, https://doi.org/10.1016/j.energy.2019.05.053, 2019b.
Rezaeiha, A., Montazeri, H., and Blocken, B.: Active flow control for power enhancement of vertical axis wind turbines: Leading-edge slot suction, J. Energy, 189, 116131, https://doi.org/10.1016/j.energy.2019.116131, 2019c.
Rezaeiha, A., Montazeri, H., and Blocken, B.: Scale-Adaptive Simulation (SAS) of Dynamic Stall on a Wind Turbine, 1, Progress in Hybrid RANS-LES Modelling (HRLM 2018), Springer International Publishing, https://doi.org/10.1007/978-3-030-27607-2_26, 2020a.
Rezaeiha, A., Montazeri, H., and Blocken, B.: A framework for preliminary large-scale urban wind energy potential assessment: Roof-mounted wind turbines, Energ. Convers. Manage., 214, 112770, https://doi.org/10.1016/j.enconman.2020.112770, 2020b.
Riemenschneider, J., Balzarek, C., van der Wall, B. G., and Majeti, R. K.: Chord Morphing for Helicopter Rotor Blades, in: ASME 2019 Conference on Smart Materials, Adaptive Structures and Intelligent Systems, 9–11 September 2019, Kentucky, https://doi.org/10.1115/SMASIS2019-5625, 2019.
Sahebzadeh, S., Rezaeiha, A., and Montazeri, H.: Towards optimal layout design of vertical-axis wind-turbine farms: Double rotor arrangements, Energ. Convers. Manage., 226, 113527, https://doi.org/10.1016/j.enconman.2020.113527, 2020.
Sal, F.: Effects of the actively morphing root chord and taper on helicopter energy, Aircr. Eng. Aerosp. Technol., 92, 264–270, https://doi.org/10.1108/AEAT-08-2019-0165, 2020.
Sharma, A. and Visbal, M.: Numerical investigation of the effect of airfoil thickness on onset of dynamic stall, J. Fluid Mech., 870, 870–900, https://doi.org/10.1017/jfm.2019.235, 2019.
Siddall, R., Ortega Ancel, A., and Kovač, M.: Wind and water tunnel testing of a morphing aquatic micro air vehicle, Interface Focus, 7, 20160085, https://doi.org/10.1098/rsfs.2016.0085, 2017.
Song, C., Wu, G., Zhu, W., and Zhang, X.: Study on aerodynamic characteristics of Darrieus vertical axis wind turbines with different airfoil maximum thicknesses through computational fluid dynamics, Arab. J. Sci. Eng., 45, 689–698, https://doi.org/10.1007/s13369-019-04127-8, 2020.
Subramanian, A., Yogesh, S. A., Sivanandan, H., Giri, A., Vasudevan, M., Mugundhan, V., and Velamati, R. K.: Effect of airfoil and solidity on performance of small scale vertical axis wind turbine using three dimensional CFD model, J. Energy, 133, 179–190, https://doi.org/10.1016/j.energy.2017.05.118, 2017.
Tan, J. and Paraschivoiu, M.: CFD-based performance analysis of morphing aileron for vertical axis wind turbines, in: 35th AIAA Applied Aerodynamics Conference, 5–9 June 2017, Denver, Colorado, https://doi.org/10.2514/6.2017-4072, 2017.
Tescione, G., Ragni, D., He, C., Ferreira, C., and van Bussel, G. J. W.: Near wake flow analysis of a vertical axis wind turbine by stereoscopic particle image velocimetry, Renew. Energy, 70, 47–61, https://doi.org/10.1016/j.renene.2014.02.042, 2014.
Thangeswaran, R. S. K., Venkateswaran, S., Kalaiselvan, T., Aravindan, P., and Venugopal, S.: Aerodynamic benefits of flexible morphing airfoil for SUAV, in: International Conference on Applied Mechanics and Optimisation, 13–15 June 2019, Thiruvananthapuram, India, 020002, https://doi.org/10.1063/1.5120189, 2019.
Tirandaz, M. R. and Rezaeiha, A.: Effect of airfoil shape on power performance of vertical axis wind turbines in dynamic stall: Symmetric Airfoils, Renew. Energy, 173, 422–441, https://doi.org/10.1016/j.renene.2021.03.142, 2021.
Wang, W., Caro, S., Fouad, B., and Salinas Mejia, O. R.: A simplified morphing blade for horizontal axis wind turbines, J. Sol. Energ. Eng., 136, 011018, https://doi.org/10.1115/1.4025970, 2014.
Wlezien, R., Horner, G., McGowan, A., Padula, S., Scott, M., Silcox, R., and Simpson, J.: The Aircraft Morphing Program, in: 39th AIAA/ASME/ASCE/AHS/ASC Structures, Structural Dynamics, and Materials Conference and Exhibit, 20–23 April 1998, Long Beach, CA, https://doi.org/10.2514/6.1998-1927, 1998.
Wolff, T., Ernst, B., and Seume, J. R.: Aerodynamic behavior of an airfoil with morphing trailing edge for wind turbine applications, J. Phys.: Conf. Ser., 524, 12–18, https://doi.org/10.1088/1742-6596/524/1/012018, 2014.
Yan, B., Dai, P., Liu, R., Xing, M., and Liu, S.: Adaptive super-twisting sliding mode control of variable sweep morphing aircraft, Aerosp. Sci. Technol., 92, 198–210, https://doi.org/10.1016/j.ast.2019.05.063, 2019.
Zhuang, C., Yang, G., Zhu, Y., and Hu, D.: Effect of morphed trailing-edge flap on aerodynamic load control for a wind turbine blade section, Renew. Energy, 148, 964–974, https://doi.org/10.1016/j.renene.2019.10.082, 2020.