the Creative Commons Attribution 4.0 License.
the Creative Commons Attribution 4.0 License.
 | 27 Feb 2024
Aerodynamic model comparison for an X-shaped vertical-axis wind turbine
Laurence Morgan
Yan Wu
David Bretos
Aurelio Cascales
Oscar Pires
Carlos Ferreira
This article presents a comparison study of different aerodynamic models for an X-shaped vertical-axis wind turbine and offers insight into the 3D aerodynamics of this rotor at fixed pitch offsets. The study compares six different numerical models: a double-multiple streamtube (DMS) model, a 2D actuator cylinder (2DAC) model, an inviscid free vortex wake model (from CACTUS), a free vortex wake model with turbulent vorticity (from QBlade), a blade-resolved unsteady Reynolds-averaged Navier–Stokes (URANS) model, and a lattice Boltzmann method (from PowerFLOW). All models, except URANS and PowerFLOW use the same blade element characteristics other than the number of blade elements. This comparison covers the present rotor configuration for several tip-speed ratios and fixed blade pitch offsets without unsteady corrections, except for the URANS and PowerFLOW which cover a single case. The results show that DMS and 2DAC models are inaccurate – especially at highly loaded conditions, are unable to predict the downwind blade vortex interaction, and do not capture the vertical/axial induction this rotor exhibits. The vortex models are consistent with each other, and the differences when compared against the URANS and PowerFLOW mostly arise due to the unsteady and flow curvature effects. Furthermore, the influence of vertical induction is very prominent for this rotor, and this effect becomes more significant with fixed pitch offsets where the flow at the blade root is considerably altered.
- Article
(4385 KB) - Full-text XML
- BibTeX
- EndNote


Vertical-axis wind turbines (VAWTs) have attracted significant attention as a promising renewable energy source due to their wind direction independence and their low noise and vibration characteristics (Su et al., 2020). However, the design and optimisation of VAWTs pose significant challenges due to their complex aerodynamic characteristics, which are influenced by several factors, including blade geometry, rotor configuration, and wind conditions. To be a viable competitor to horizontal-axis wind turbines (HAWTs), the levelised cost of energy (LCoE) of a single VAWT must be competitive with HAWTs.
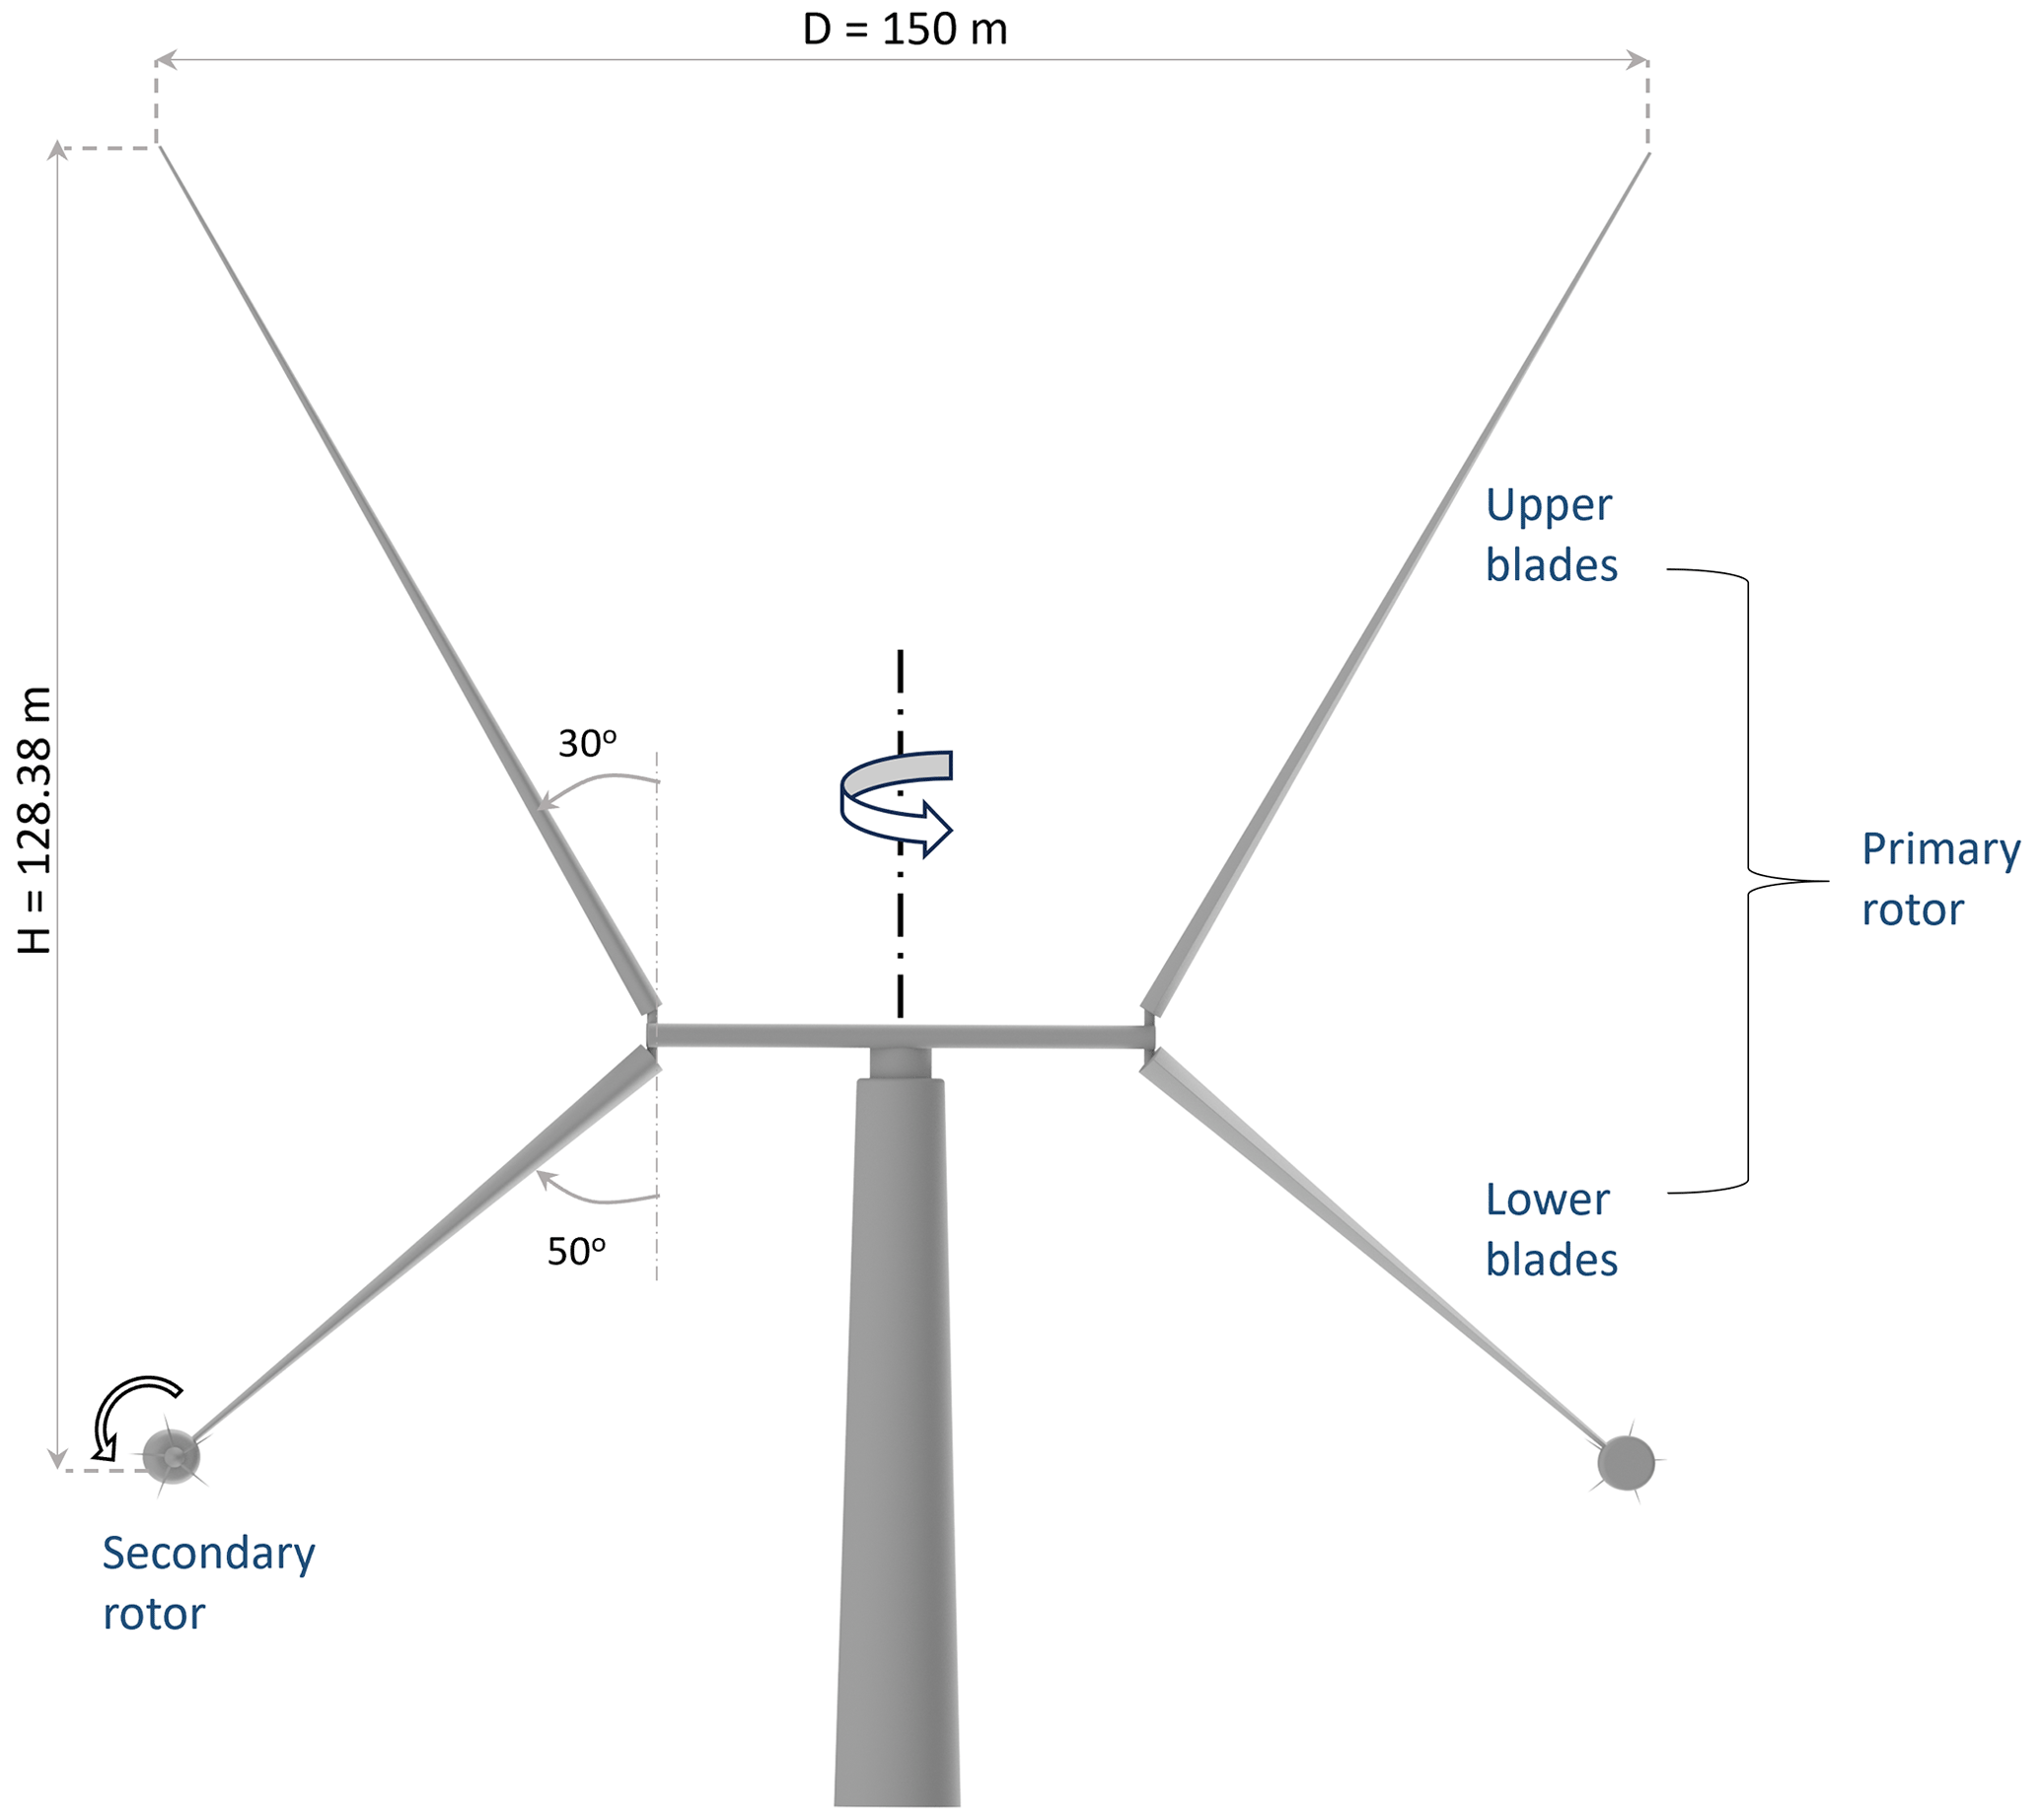
Figure 1A render of the X-Rotor turbine with geometrical dimensions from Leithead et al. (2019).
The X-Rotor (Leithead et al., 2019) is a novel vertical-axis wind turbine concept that is designed to lower its LCoE for offshore applications. The turbine has two key novel features: an X-shaped primary rotor and the use of secondary tip rotors for power generation (Fig. 1). Rather than removing power from the main shaft of the primary rotor, the rotor speed is controlled by the thrust force on the secondary rotors, and all electrical power is extracted from the secondary rotors. The secondary rotors are attached at the lower blade tips and consequently see a significantly accelerated inflow speed due to the relative velocity at the primary rotor blade tips. In turn, this allows the secondary rotors to have a very small radius and a large rotational speed. This facilitates the use of cheap, lightweight, high-speed direct-drive generators, as opposed to using gearboxes, which significantly reduce the capital costs associated with the turbine. Additionally, the low altitude and mass of the generators eliminate the need for jack-up vessels for maintenance, potentially significantly reducing the associated operations and maintenance costs (Flannigan et al., 2022). The primary rotor is designed to increase the tip-speed ratio and swept area of the rotor (compared to a traditional H-shaped VAWT for the same material used) while cancelling the overturning moments associated with V-shaped VAWT rotors (Kolios et al., 2013; Shires, 2013). The upper blades of the X-Rotor are pitch-controlled and are designed to shed aerodynamic power in above-rated conditions. The lower blades are not pitch controlled as any change in them would disrupt the operation of the secondary rotors. A recent study on the operations expenditure of the X-Rotor concept by Flannigan et al. (2022) demonstrated large savings on the operational cost of energy compared to a HAWT. A similar feasibility study by Leithead et al. (2019) showed up to 26 % overall cost savings compared to HAWTs. The development of the X-Rotor concept is currently the subject of a European Union Horizon 2020 project XROTOR (2020).
The characterisation of the aerodynamics of the primary rotor is a critical challenge in the design of the X-Rotor turbine. An initial characterisation was completed by Morgan and Leithead (2022), where a double-multiple streamtube (DMS) simulation tool for the X-Rotor was developed and validated against free vortex wake codes. Although this work presented the potential for the DMS tool to characterise the X-Rotor, it was limited to looking at the turbine without pitch offset.
Accurate prediction of VAWT aerodynamic performance is essential for effective design and optimisation, as it directly affects the power output and efficiency of the turbine. Different aerodynamic models for VAWTs have been researched and used, each with advantages and limitations. Ferreira et al. (2014) presented detailed blind comparisons between different aerodynamic models for a case study of an H-type VAWT with multiple pitch offsets, concluding that streamtube models behave fundamentally differently when pitch offsets are introduced. As VAWTs have finite blade lengths, a spanwise distribution of circulation arises (which varies azimuthally) that in turn leads to spanwise induction and load variations (3D aerodynamic effects). De Tavernier et al. (2020b) showed the effect of 3D aerodynamics (tip and trailing vortices as well) between models for an H-type VAWT at different aspect ratios and identified that the assumptions used in these models limit the 3D aerodynamic behaviour. Keijer (2020), Ferreira (2009), and De Tavernier et al. (2020a) highlighted the importance of accounting for these 3D aerodynamic effects by observing the induction on the wake by the tip vortices at different aspect ratios, as well as describing the loss in power compared to 2D assumptions. Additionally, it was also concluded that modification of the load distribution of a VAWT may be achieved by fixed blade pitch offsets. Ferreira (2009) investigated the induced three-dimensionality of the tip vortices on the near wake by varying the pitching axis and observed that the trailing vortex significantly affects performance compared to 2D models. Franchina et al. (2019) conducted a 3D-CFD analysis of an H-type VAWT to obtain the performance at design and off-design conditions and concluded that these 3D effects significantly affect the rotor loads. It also stated that the turbulence models produce more accurate results at lower tip-speed ratios. Analysis of blade-vortex interaction (BVI) and its effect on the fluid flow as the blade passes through its own wake from the previous passage showed this effect was significant even for rotor-level loads (Kozak et al., 2014; Posa and Balaras, 2018).
With the unique configuration of the X-Rotor, there is a significant influence of induction in the vertical direction expected due to the coned blades of this geometry configuration. Therefore, to characterise the aerodynamics of the X-Rotor, it is necessary to understand the discrepancies between different aerodynamic models. In the aforementioned publications, the 3D aerodynamic effects of pitch offsets have been studied in detail but they do not cover that of VAWTs with coned blades, specifically for the X-Rotor.
Hence, the scope of this article is twofold: (1) present a comparative study of different aerodynamic models for the X-Rotor's primary rotor and (2) investigate the 3D aerodynamics of the X-Rotor associated with fixed blade pitch offsets. The results of this study will provide valuable insights into the development of accurate and efficient VAWT design tools and contribute to the advancement of renewable energy technologies.
The specific objectives of this paper are as follows:
-
understand the agreement between the models presented here, based on the power, thrust, and blade forces;
-
obtain the range of operating conditions over which this agreement holds (of particular interest is the pitch offset);
-
look at the effects of vertical induction to understand where 3D models are necessary for coned VAWT simulations.
2.1 Aerodynamic models
The aerodynamic models used in this study are described here. A short summary of the models used along with their fidelity is presented in Table 1. The fidelity is based on the underlying physics of the model. Using a momentum-based approach is considered low fidelity, a free vortex wake model is considered mid-fidelity, and a viscous CFD approach is referred to as high fidelity. The low- and mid-fidelity models used the airfoil polars that are discussed in Sect. 2.2.
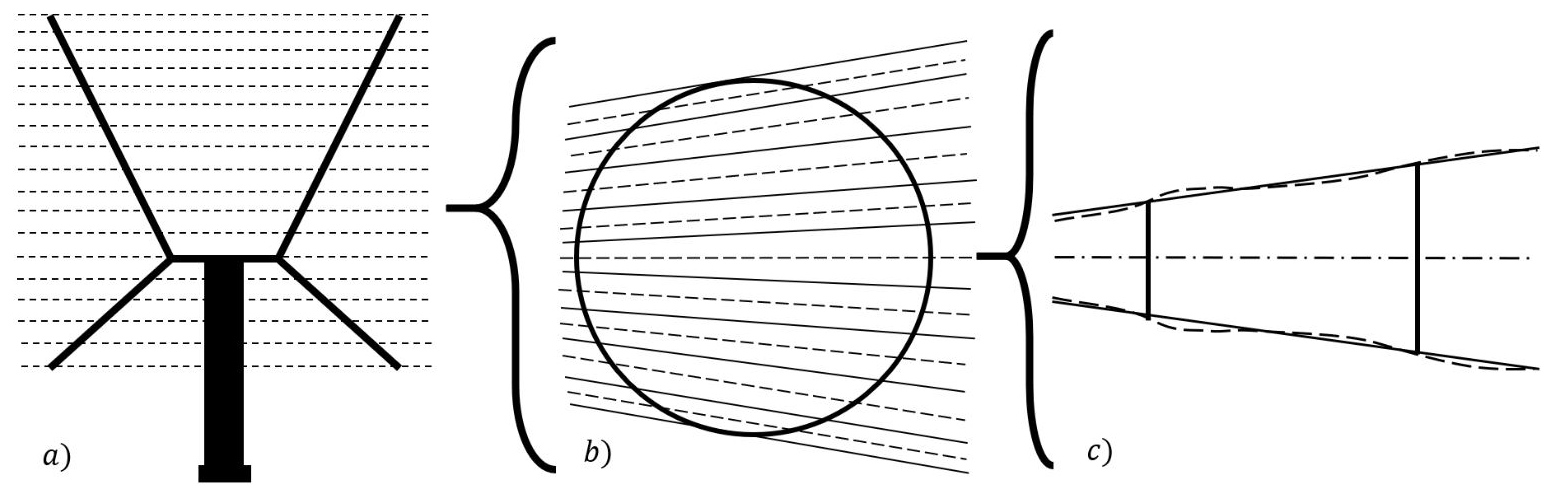
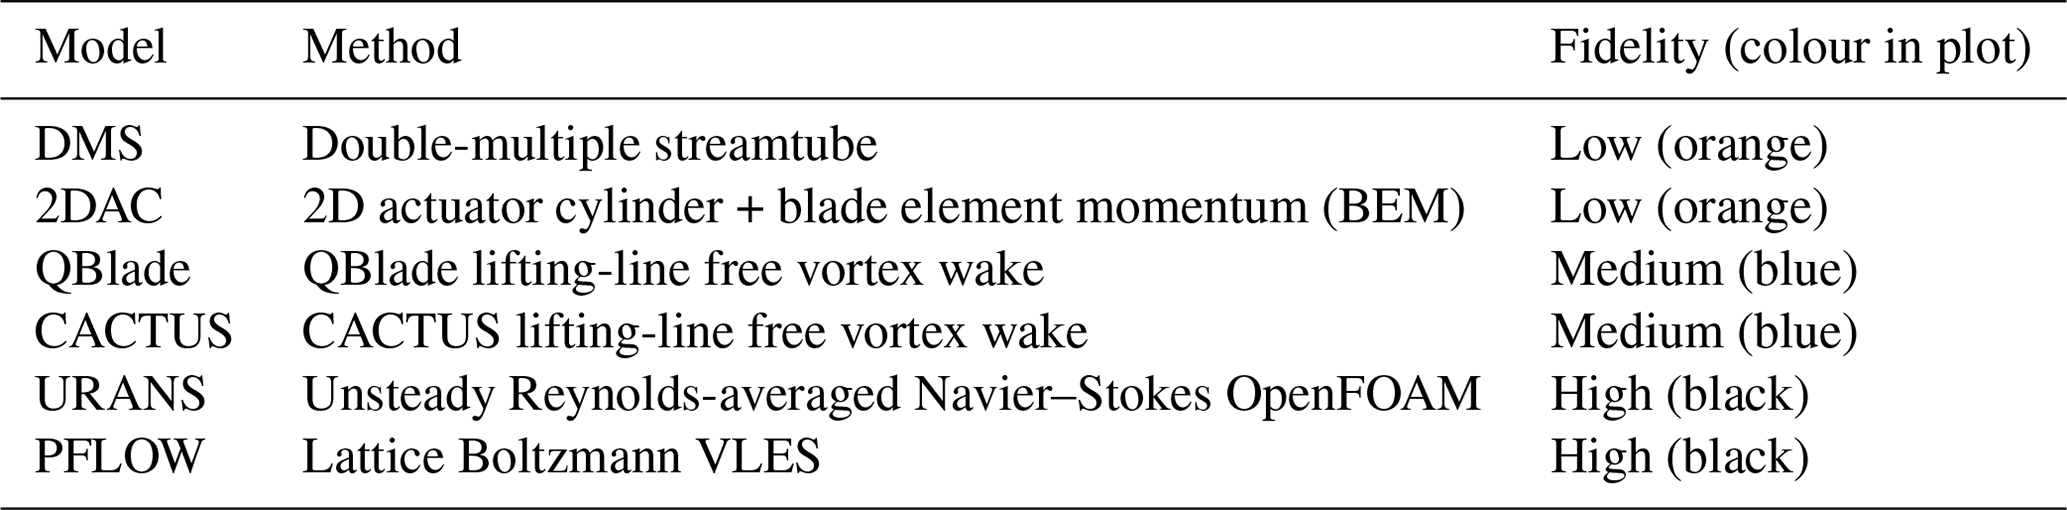
Figure 2The discretisation procedure of the X-Rotor in DMS from Morgan and Leithead (2022). Vertical discretisations are shown in panel (a). Each vertical plane discretised into streamtubes (solid) and its corresponding central streamline (dashed) is shown in panel (b). Streamtubes crossing the upwind and downwind actuators are shown in panel (c).
2.1.1 Double-multiple streamtube model (DMS)
The double-multiple streamtube model, developed by Paraschivoiu (1981), is a 1D momentum-based model which is expanded to model 3D rotors through a double discretisation scheme. Experimental validation studies for this model were conducted by Paraschivoiu (1982). The 3D rotor is first decomposed into 2D slices along its height, and then each slice is split into parallel streamtubes that cross the rotor circumference twice (Fig. 2). Blade element momentum theory is first used to solve the flow at the upwind crossing point and then at the downwind crossing point, assuming that atmospheric pressure has been recovered. Conservation of mass is assured by allowing streamlines to expand through the method proposed by Freris (1990). The implementation in this investigation is identical to that described by Morgan and Leithead (2022); however, no unsteady corrections are applied. Tip and root loss corrections from Prandtl et al. (1927) are applied. The rotor is discretised into 120 slices, with each slice discretised into 31 streamtubes (62 azimuthal positions) after a grid convergence study. The formulation of streamtube expansion means that there is no fixed azimuthal discretion as the distance between streamlines is dictated by the loading on the rotor.
2.1.2 2D actuator cylinder model (2DAC)
The 2D actuator cylinder model, developed by Madsen (1982), is a 2D momentum model that uses the actuator disk concept for the swept area of a VAWT. The model is based on the 2D Euler equations and a linearised solution (Madsen et al., 2014; Cheng et al., 2016) is used in this model. In the implementation of an X-shaped VAWT, the 2DAC is used by decomposing the X-Rotor into 2D slices along its height. Each slice is aerodynamically independent of the other; i.e. it does not account for induction in the axial/vertical orientation. Tip-loss correction (Prandtl et al., 1927) is introduced at the blade tips. A total of 139 slices of the rotor along the rotation axis are considered for the simulations, with each slice containing azimuthal discretisation of 5°. Each blade section contained three slices, with higher refinement of eight slices at the tips and root. A representation of this axial discretisation is shown in Fig. 3.
Figure 3Vertical discretisation procedure of the X-Rotor inside the 2DAC. These are constrained to the radius of the rotor at the specific height of the vertical 2D segment.
2.1.3 CACTUS free vortex wake model (CACTUS)
The Code for Axial and Cross-flow TUrbine Simulation (CACTUS) developed by Murray and Barone (2011) is a three-dimensional vortex modelling tool for wind turbines. The flow field is constructed using a vortex lattice, where the velocity is an arithmetic sum of the freestream and the velocity induced by the vortices. This is calculated through the Biot–Savart law (Katz and Plotkin, 2009). To simulate the X-Rotor, a free wake vortex algorithm that calculates the wake convection velocity at each time step is employed. The upper and lower blades are discretised into 18 blade sections each (minimum to attain blade element independence of power), with an additional blade section to smoothen the geometry from the upper to the lower blades with fixed pitch offsets. A constant vortex core model is used, and the vortex core is 100 % of the chord-to-radius ratio. The simulations are run for 12 revolutions to attain convergence (discussed in Sect. 2.2) with a second-order predictor explicit time advancement scheme.
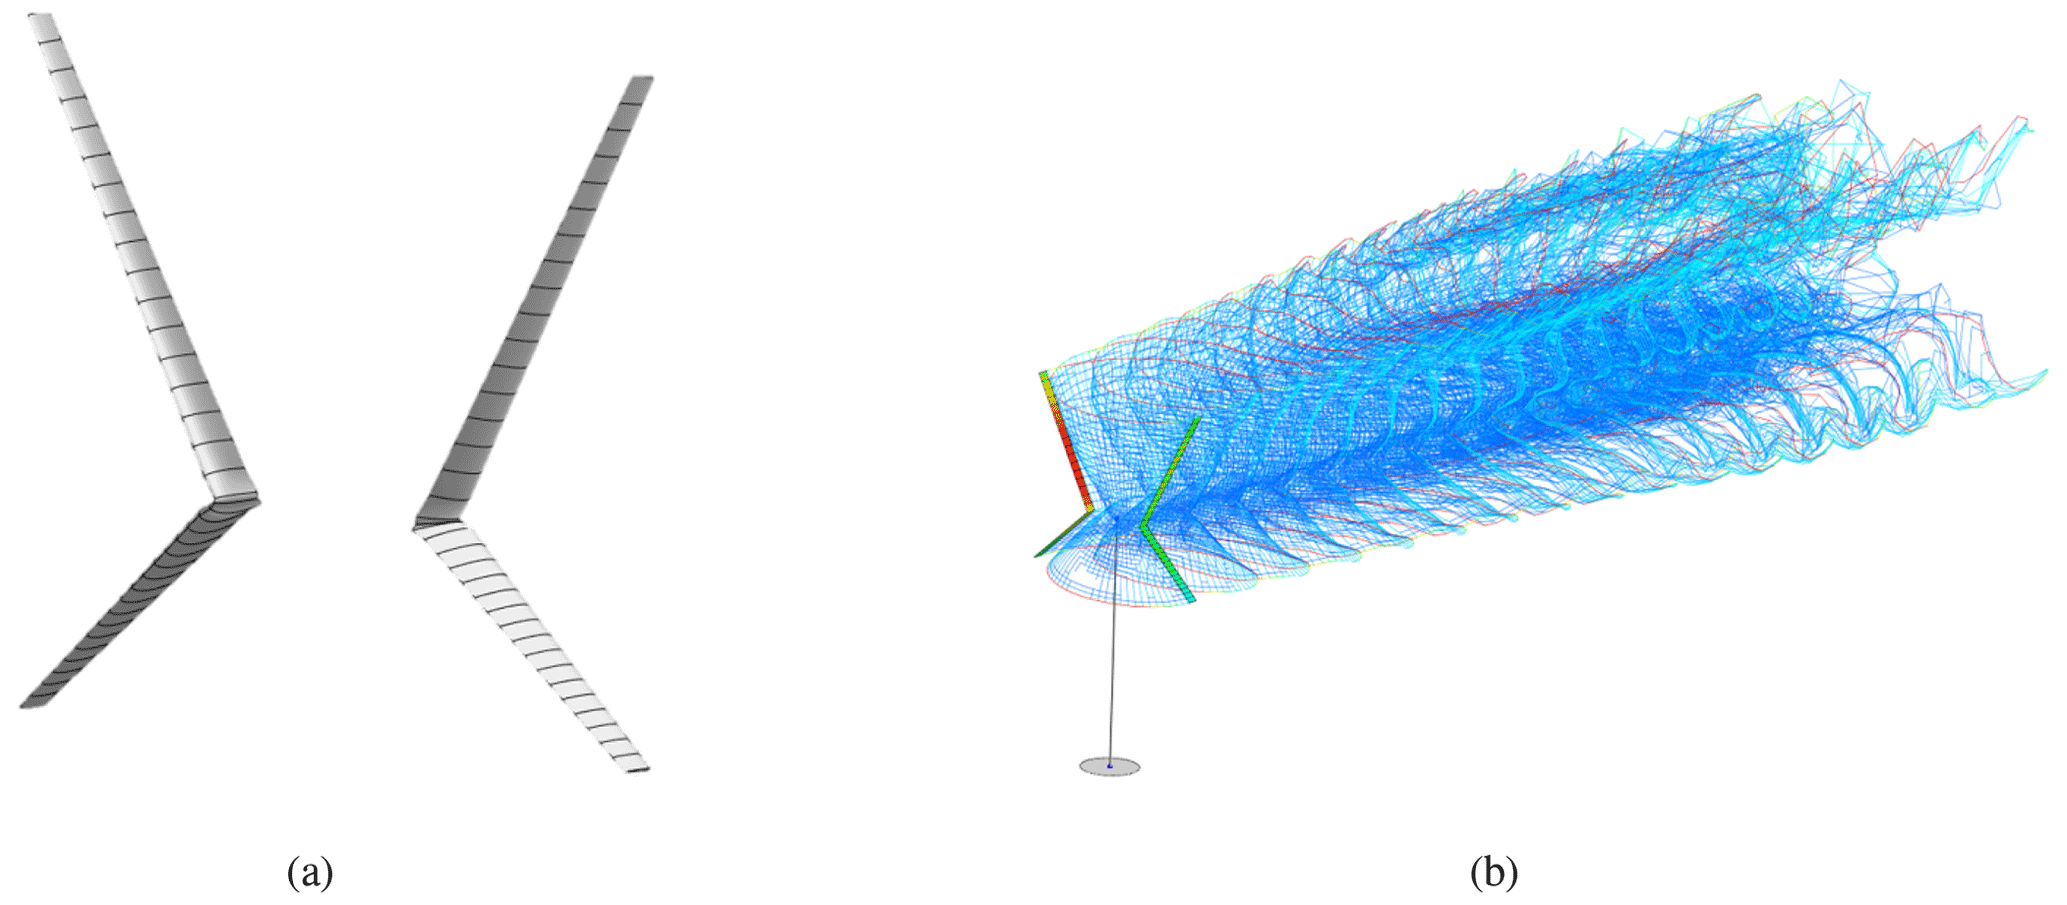
Figure 4Representation of (a) the blade discretisation in CACTUS and QBlade and (b) the vortex lattice of the X-Rotor.
2.1.4 QBlade free vortex wake model (QBlade)
QBlade is a turbine design and simulation tool to perform aerodynamic studies to facilitate the design of wind turbines developed by Marten et al. (2013). Later updates added lifting-line simulation capabilities (Marten, 2020) that used a free vortex wake model with varied vortex core radius. The implementation applied here uses sizes of 100 % and 20 % chord-to-radius ratio for the bound and trailing vortices, respectively; and a first-order forward integration scheme is used for the wake nodes. The blades are discredited into 20 blade sections for both upper and lower blades (based on the blade element convergence of power). A vortex expansion rate is governed by a turbulence vortex viscosity factor of 2560, which is the default setting in QBlade. The model also used vortex stretching, with the maximum value of the stretching factor of 1×10⁶. The blade discretisation and vortex lattice system from this simulation is presented in Fig. 4.
2.1.5 Unsteady Reynolds-averaged Navier–Stokes (URANS) CFD model
The X-Rotor is also simulated using a URANS model through OpenFOAM (Weller et al., 1998), an open-source finite-volume CFD tool used for fluid dynamic simulations. The fluid domain is modelled with a blade-resolved mesh with the k–ω shear-stress transport (SST) turbulence closure model (Menter, 1993) and used the PIMPLE scheme for the pressure–velocity coupling. The implementation here uses 72 million cells (grid independence attained) with domain lengths of 8.26D, 5.33D, and 4D in the streamwise, lateral, and axial directions, where D is the primary rotor diameter. Although previously VAWT CFD simulations with larger domain sizes of 20D were considered as best practices (Shamsoddin and Porté-Agel, 2014; Rezaeiha et al., 201a; Belabes and Paraschivoiu, 2023), these domain sizes are not considered here as the focus was not on flow field and wake. However, this could potentially impact the rotor thrust, which is discussed in Sect. 3.1.2. Mesh refinements are performed through snappyHexMesh with the detailed information provided in Appendix B.
2.1.6 PowerFLOW (PFLOW)
PowerFLOW 6-2021-R2, developed by 3DS SIMULIA (Dassault Systemes, 2021), solves the discrete, explicit, transient, and compressible lattice Boltzmann method (LBM) by statistically tracking the streaming and collisions of fluid particles for a finite number of directions. A more detailed description of this method is presented in the work of Shan et al. (2006). A very large eddy simulation (VLES) model is implemented to account for the effect of the sub-grid unresolved scales of turbulence. A two-equation k–ϵ re-normalisation group is used to compute a turbulent relaxation time added to the viscous relaxation time. This model simulated the coupled primary and secondary rotor, including the tower and cross-beam (strut), unlike the other models in this study. The original purpose of this model was to understand the aero-acoustic effects of the secondary rotor, which is outside the scope of this study, and only the primary rotor's loads and performance are considered here. In order to reduce the computational cost, a pressure-gradient-extended wall model is used to approximate the no-slip boundary condition on solid walls. This implementation used 73.45 million cells and 7.7 million surface elements with domain lengths of 27.75D, 37D, and 5.72D in the stream, lateral, and axial directions. Further information is provided in Appendix C.
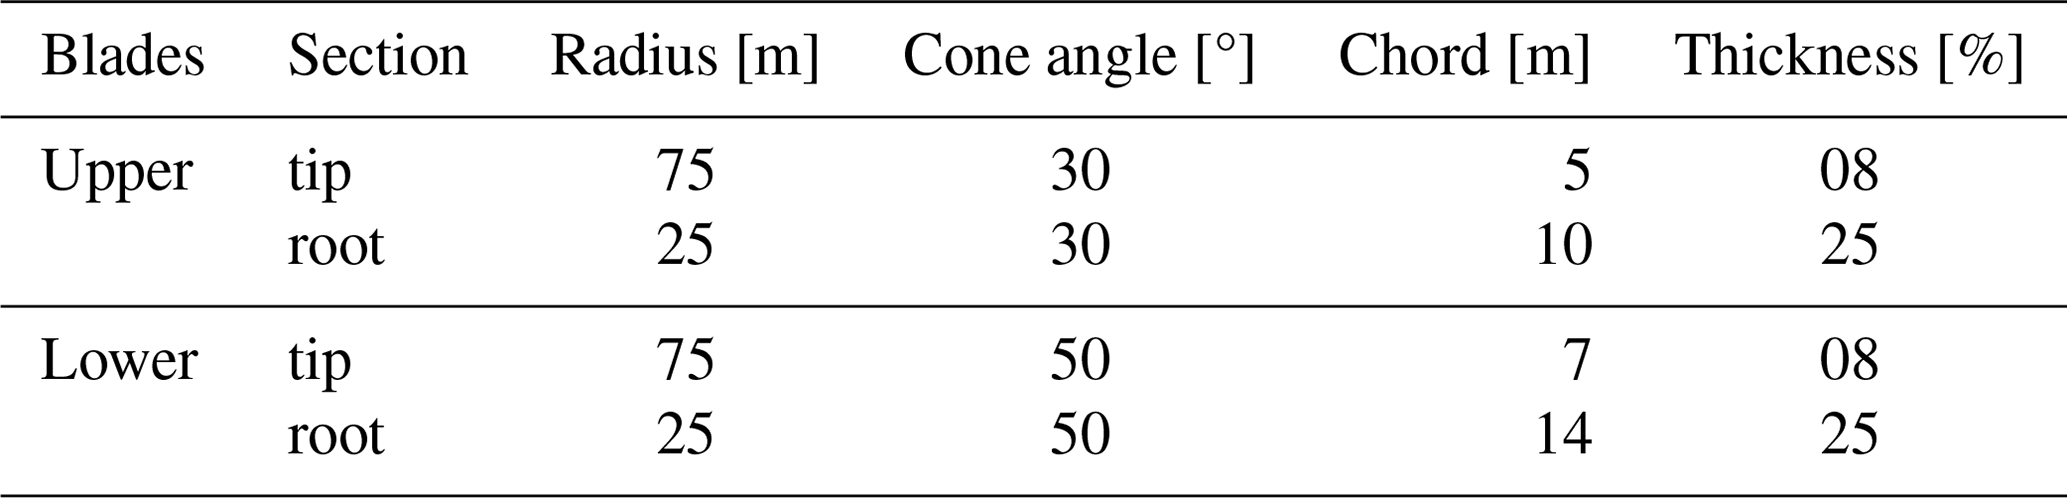
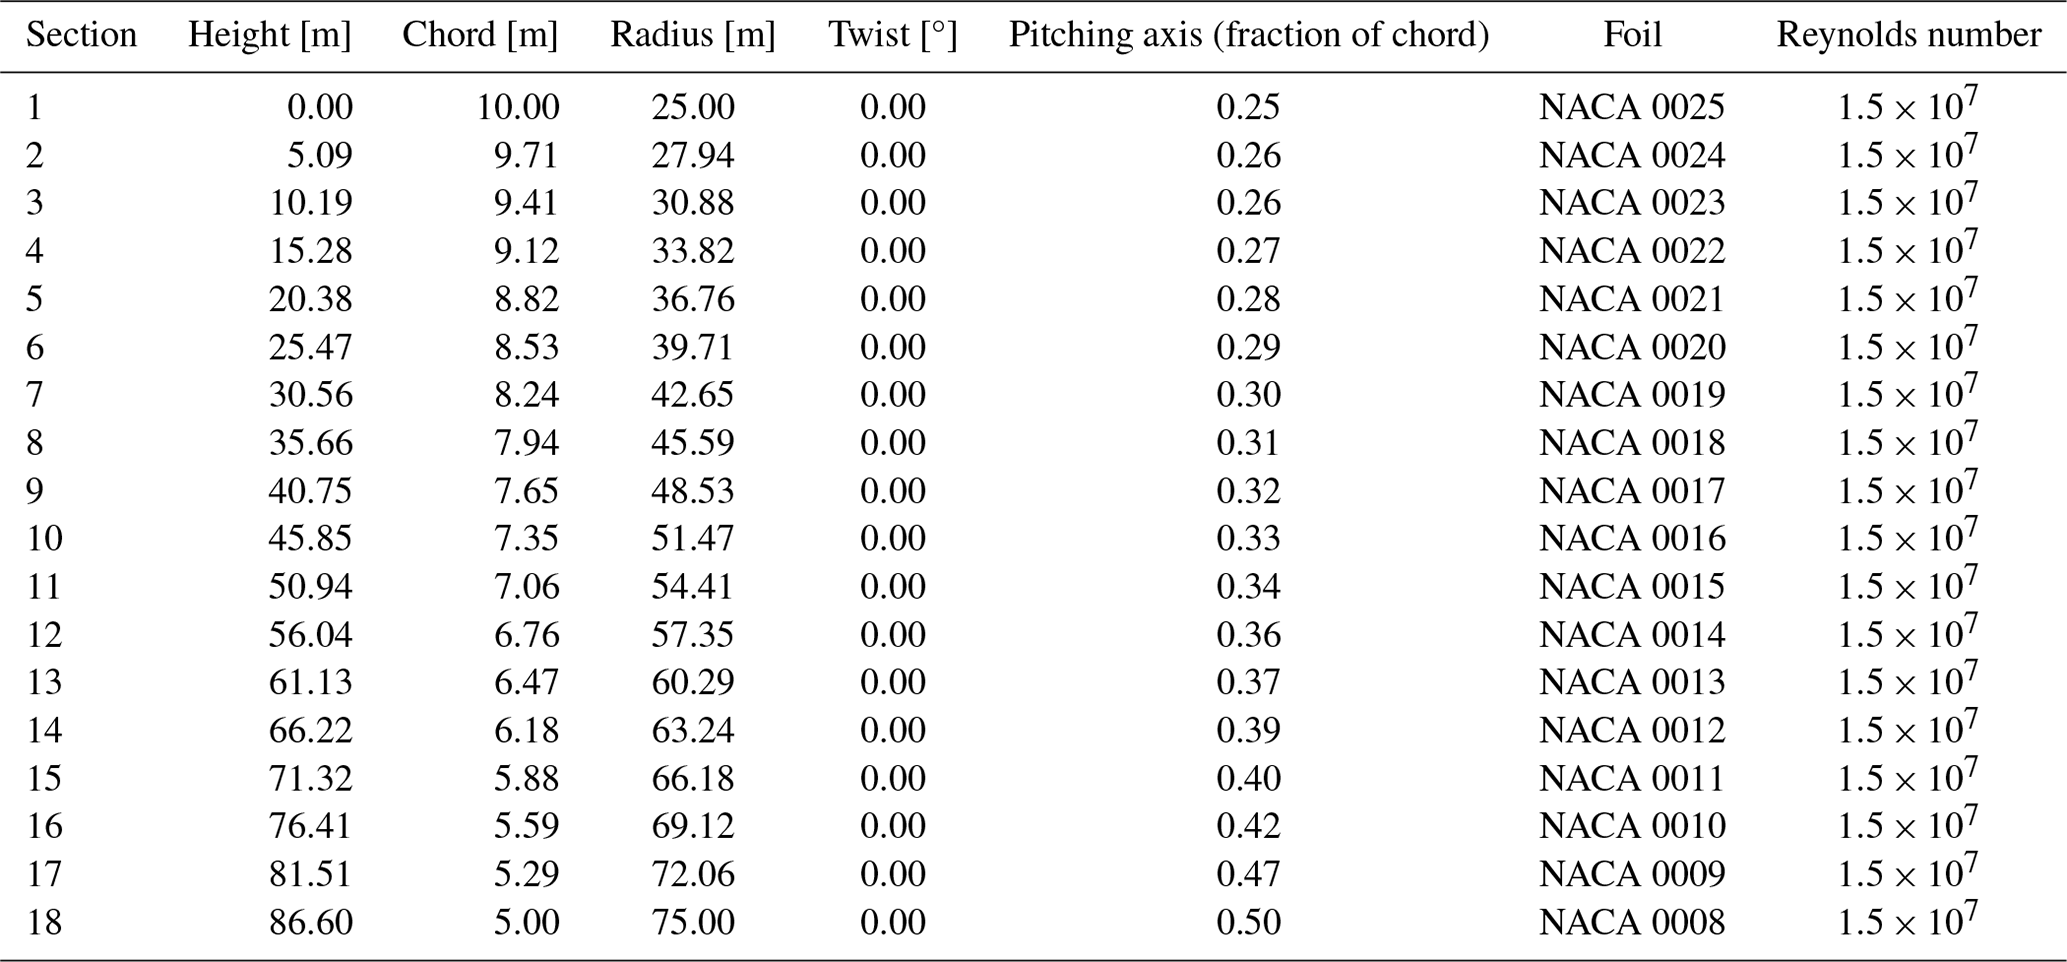
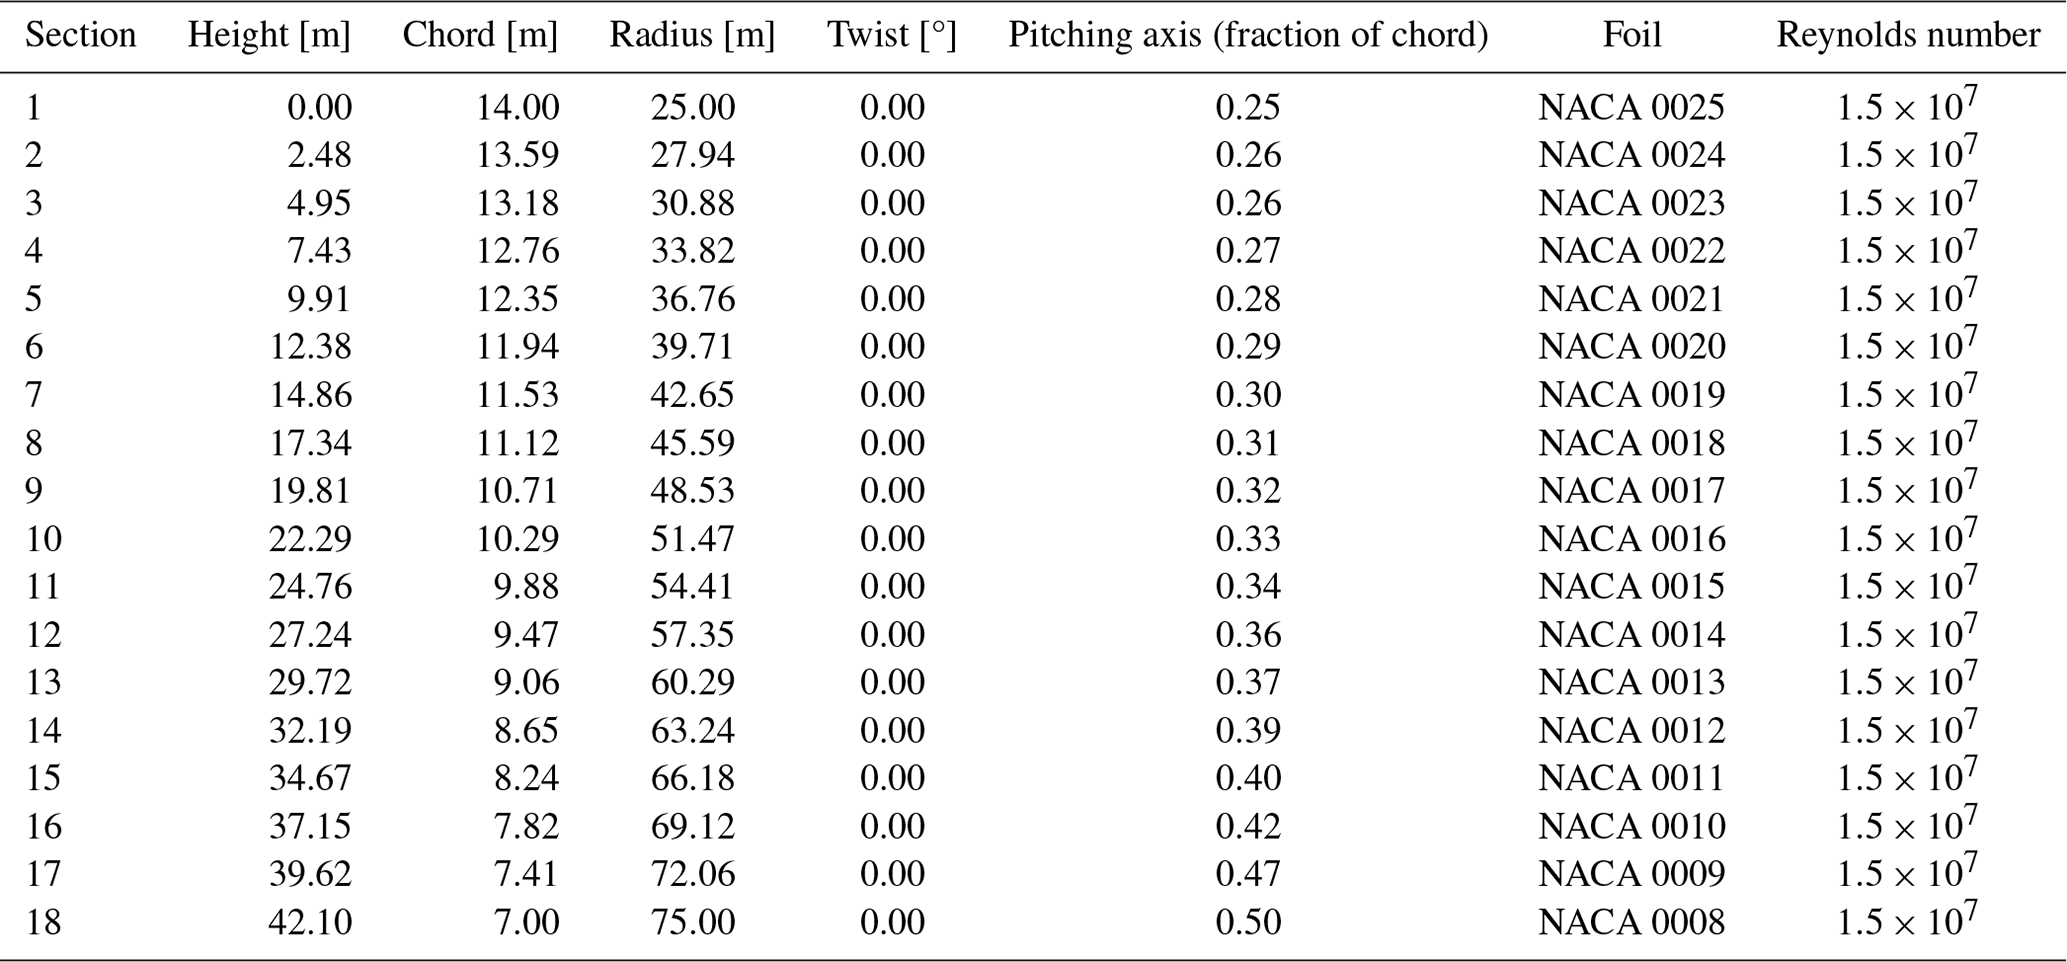
Table 2The geometry for the X-Rotor blades and intermediate values can be found through linear interpolation.
2.2 Test setup
The X-Rotor rotor geometry consists of a radius of 25 and 75 m at the root and the tip of the blades, respectively. The upper blades are attached at 30° from the vertical plane and therefore have a length of 100 m, and the lower blades are connected at 50° from the vertical plane and therefore have a length of 65.3 m. Both sets of blades have a linear taper in chord and relative thickness and utilise the symmetric NACA00XX aerofoil family. The blades are untwisted. The blade geometry at the root and tip is given in Table 2. For all simulation tools that are not blade resolved, polars are generated for the airfoil profile range of NACA0008 (root section) to NACA0025 (tip section) using XFOIL (Drela, 1989) at a Reynolds number of (based on the chord at the tip) and then extrapolated through the Viterna and Janetzke (1982) method. In all models (except PFLOW) only the aerodynamically active portion of the rotor was modelled, meaning that the cross-beam connecting the rotor blades and the tower is not modelled.
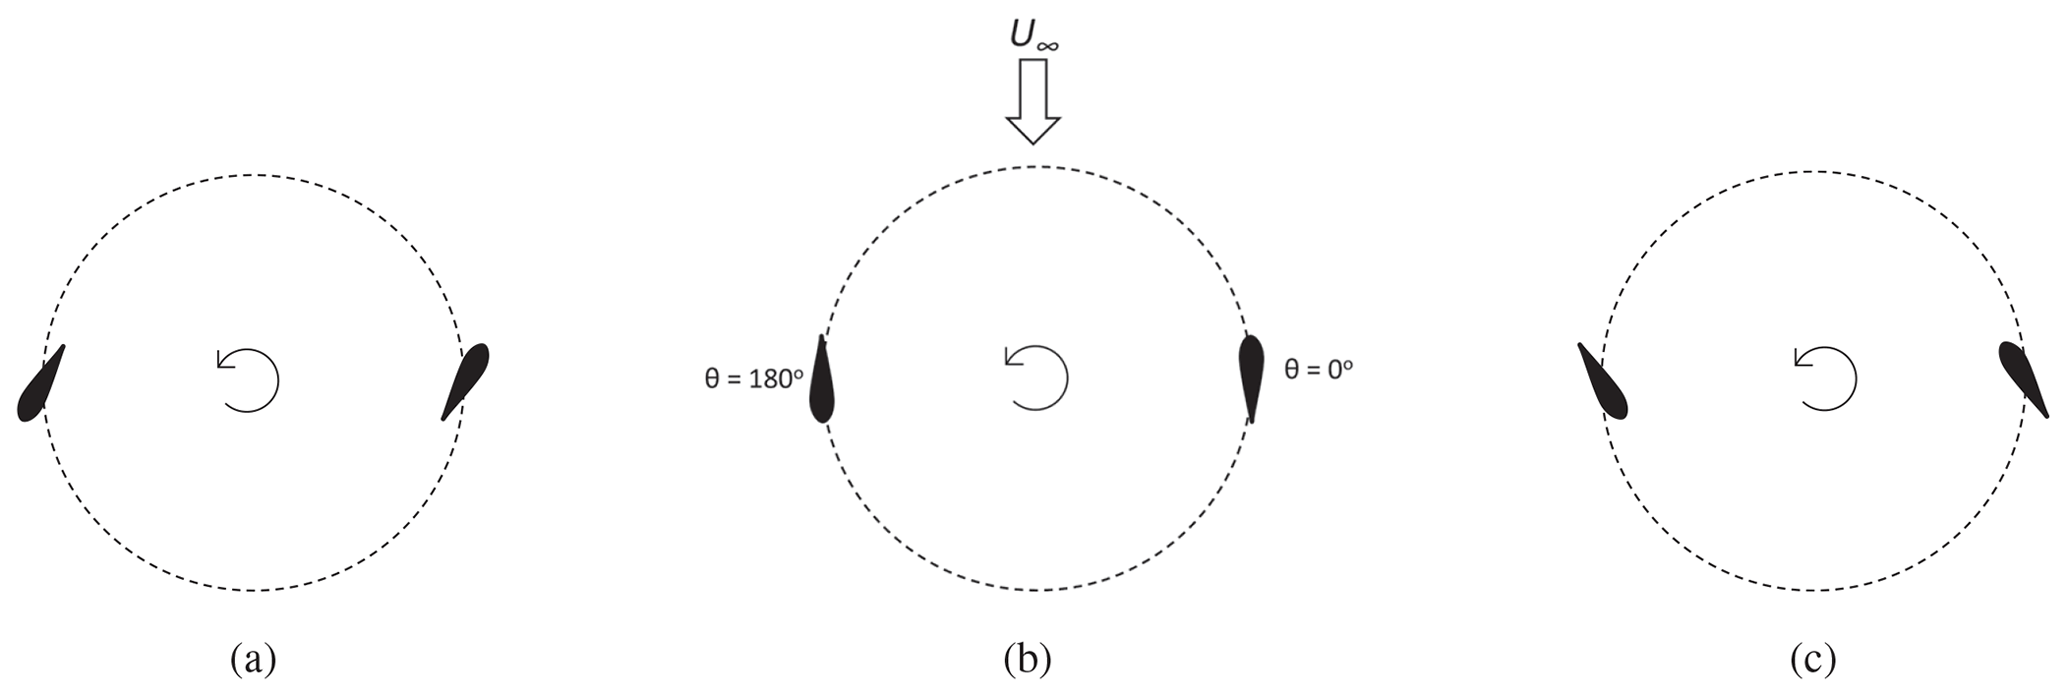
Figure 5Top view of the upper blade tip with (a) negative, (b) zero, and (c) positive pitch offsets. θ indicates the azimuth and U∞ is the freestream velocity
Due to the coned blades, the local tip-speed ratio pertaining to the local blade elements varies along the span and height. Therefore, the tip-speed ratios considered for analysis represent the value at the blade tips. Each of the low-fidelity and mid-fidelity models simulated the aerodynamic performance and loads of the turbine at a tip-speed ratio range of at 0.5 intervals with a fixed upper blade pitch range of β = [−20°, 20°] with 5° intervals. Positive pitch corresponds to the upper blades pitching into the axis of rotation, and negative pitch corresponds to the blades pitching away from the rotation axis. The pitching axis position varies from 25 % chord at the root and 50 % chord at the tips (see Appendix A). Figure 5 shows the difference between the airfoil orientation between positive and negative pitch offsets compared to no pitch offset.
A homogeneous, constant, freestream velocity of U∞ = 12 m s−1 is used for all low- and mid-fidelity models. The 2DAC, CACTUS, and QBlade have 72 azimuthal discretisations per rotation, but this is not enforced in the DMS model, as the streamtube discretisation does not allow for uniform azimuthal discretisation. The high-fidelity models used λ=5 at β=0° as their test cases with an inlet velocity of 12.5 m s−1. Moreover, these models discretised the domain spatially and temporally. The momentum and vortex models are run iteratively to reach a convergence criterion of 10−3 based on the power. In the vortex models, the models completed 12 revolutions to reach this value. The convergence criterion value is chosen to give optimal accuracy for computational time, as a lower value becomes dependent on the interpolation scheme each model used to obtain the angle of attack from the polars. Therefore, the vortex model results presented here are from the last revolution of the rotor.
While the effects of flow curvature (Rainbird et al., 2015; Migliore et al., 1980; Balduzzi et al., 2014) and dynamic stall (Masson et al., 1998; Le Fouest and Mulleners, 2022) are shown to significantly affect aerodynamic performance, the low- and mid-fidelity models have been implemented without these effects. The choice to omit them is made in order to compare the underlying flow models as, at present, these codes do not employ identical correction factors for dynamic stall or flow curvature effects. Any one of these models could be updated with identical correction factors; however, a comparison of the most valid correction factors is beyond the scope of this article.
Both high-fidelity models inherently include flow curvature, dynamic stall, and viscous terms, as the rotor in these models is blade resolved. Additionally, the PFLOW simulations include the secondary rotor in the lower blade, the tower, and the cross-beam that connects the two sets of blades together. As the secondary rotors experience high thrust, this is expected to decrease the tangential forces of the lower blade in the azimuth where the blade does not experience stall, compared to the other simulation cases. As the cross-beam is not as aerodynamically significant compared to the blades of the rotor, the aerodynamic effects from this surface are neglected. The lower blade loads are also expected to be affected by the wake of the tower. However, this is expected to only have a significant impact around an azimuth θ=270°.
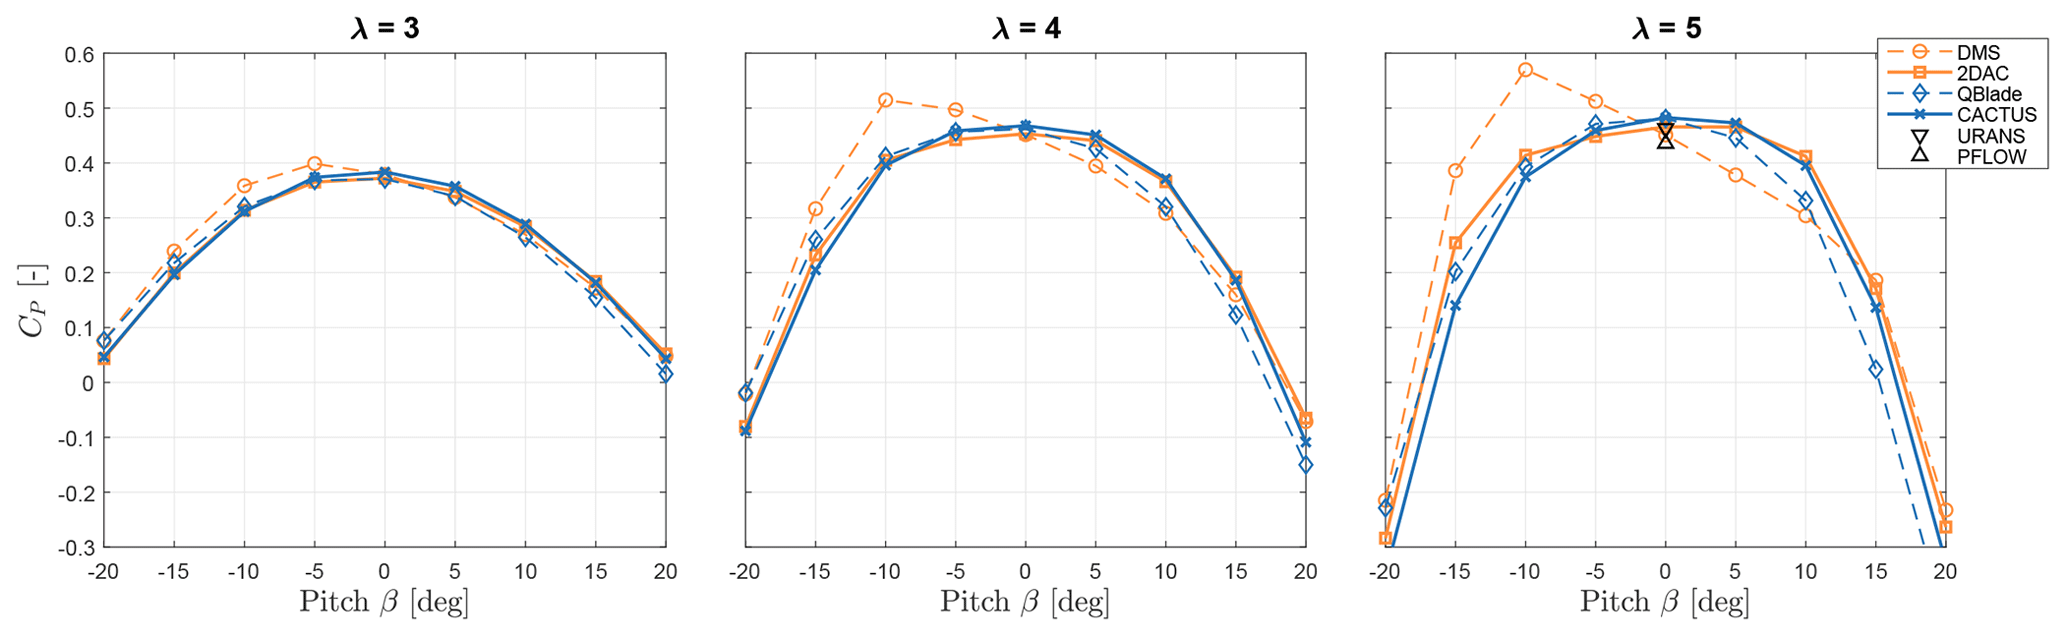
Figure 6Variation in rotor power coefficient (CP) with pitch angle at fixed tip-speed ratios. Orange and blue correspond to the momentum and vortex models, respectively. URANS and PowerFLOW results are also shown at λ=5 for β=0°, corresponding to the black markers.
3.1 Study of rotor power and thrust
The results for power and thrust of the X-Rotor are discussed in detail in Sects. 3.1.1 and 3.1.2. They are represented in terms of non-dimensional coefficients given by
where P and T are the revolution-averaged power and thrust, A is the frontal area of the primary rotor (12 870 m2), U∞ is the freestream velocity, and ρ is the density of air, which is 1.225 kg m−3.
3.1.1 Power
The variation of CP with pitch angle β in the range of tip-speed ratios λ is presented in Fig. 6. In these plots, it is observed that DMS severely deviates at and for all negative pitch offsets from the other models. For positive pitch offsets, the model predicts different values, except at β=15°. There are two key features which lead to the breakdown of the DMS method in situations with pitch offsets. Firstly the DMS method does not consider the induction of the downwind portion of the rotor at the upwind actuator surface which becomes more critical as the loading is skewed to the downwind section at negative pitch offsets. Additionally, the streamtube expansion correction used in the DMS model overpredicts the contraction at the upwind actuator surface and the expansion at the downwind actuator surface. This leads to the region over which negative torque is produced to be contracted and the region over which the positive torque is produced to be extended, leading to an overprediction in power production in the case of negative pitch offsets. This shows that DMS is unreliable to evaluate the X-Rotor's aerodynamic performance, which is also observed by Ferreira et al. (2014) for an H-type VAWT. Although it predicts similar values to the other models without pitch offsets, the model fails to capture the aerodynamic power profile of the X-Rotor.
The mid-fidelity models agree well with each other in pitch ranges of . The 2DAC model agrees with the CACTUS results for positive pitch offsets and agrees better with the QBlade results for negative pitch offsets. Compared to the URANS and PFLOW at λ=5, the vortex models overpredict the power slightly (roughly 6 %), in contrast to the momentum models agreeing well. While blockage effects can affect the CP from the URANS simulations (Rezaeiha et al., 201a), the difference mainly arises from the use of polars in the vortex models versus performing a full blade-resolved study. This is demonstrated in an article conducted by Melani et al. (2019), where they analysed the lift and drag coefficients for a NACA0021 airfoil between XFOIL polars and the blade-resolved 2D URANS results. The results showed significant differences at low Reynolds numbers, but at higher Reynolds numbers, the differences decrease but do not vanish. PFLOW predicts the least power, but this still is quite close to the other models despite modelling the secondary rotors and the tower. Rezaeiha et al. (2017b) demonstrated the power loss correlation with the dimensions of the tower, which explains the power deficit of the PFLOW observed here.
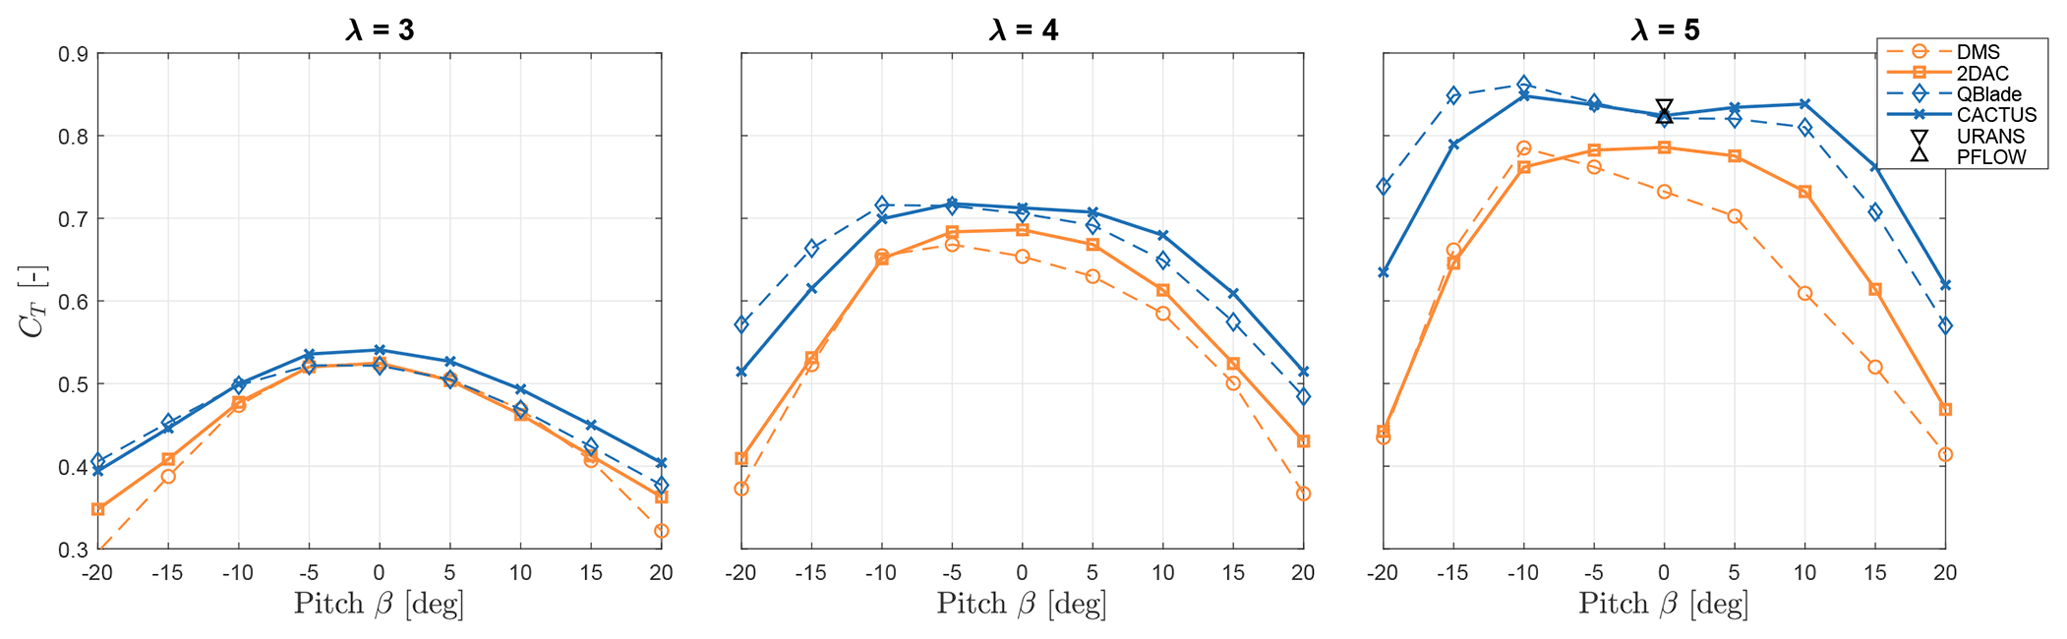
Figure 7Variation in rotor thrust coefficient (CT) with pitch angle at fixed tip-speed ratios. Orange and blue correspond to the momentum and vortex models, respectively. URANS and PowerFLOW results are shown at λ=5 for β=0°, corresponding to the black markers.
3.1.2 Thrust
The variation of CT with pitch angle β and tip-speed ratio λ is shown in Fig. 7. While the trends are preserved between models, the magnitudes differ significantly. At λ=3 for β≥0°, 2DAC and DMS match quite well with QBlade, until β=15°, while CACTUS predicts higher thrust. However, at β≤0°, QBlade moves away from the momentum models and agrees well with CACTUS. At λ=4, all models predict different thrusts, with the momentum models systematically showing lower thrust with increasing λ compared to others. At β≤0°, 2DAC and DMS agree well with each other except at large pitch offsets. This observation is enhanced at λ=5, where the CACTUS and QBlade results estimate larger thrust values than the low-fidelity models. However, URANS and PFLOW agree quite well with the vortex models at β=0°. The DMS model underpredicts the thrust values at high loading, indicating that the correction used for high blockage cases is inaccurate. Additionally, the dependence on pitch angle does not agree with the other models. This can again be attributed to the effects of overprediction of streamtube expansion increasing the estimate of thrust as the loading is shifted to the downwind rotor half and decreasing the estimate of thrust as the loading is redistributed to the upwind rotor half in a similar manner to the power as discussed in section Sect. 3.1.1. 2DAC's low thrust prediction can be attributed to the limitation of the linear correction method, where it becomes less accurate at higher loading (Ferreira et al., 2014). The difference between the URANS and the vortex models (around 2 %) is primarily due to the use of polars in the vortex models vs. blade-resolved simulation of the URANS as discussed previously. All models deviate significantly at large pitch offsets, which in a way exaggerates the differences observed at small pitch offsets.
Overall, the vortex models seem to agree well with the high-fidelity models, suggesting the momentum models are not quite valid at these high tip-speed ratios.
3.2 Study of blade forces
As the URANS and PFLOW predicted the results for one case, the normal and tangential loads are compared with the momentum and the vortex models in Sect. 3.2.1. The momentum and vortex models are analysed in detail for the set pitch offset cases in Sect. 3.2.2.
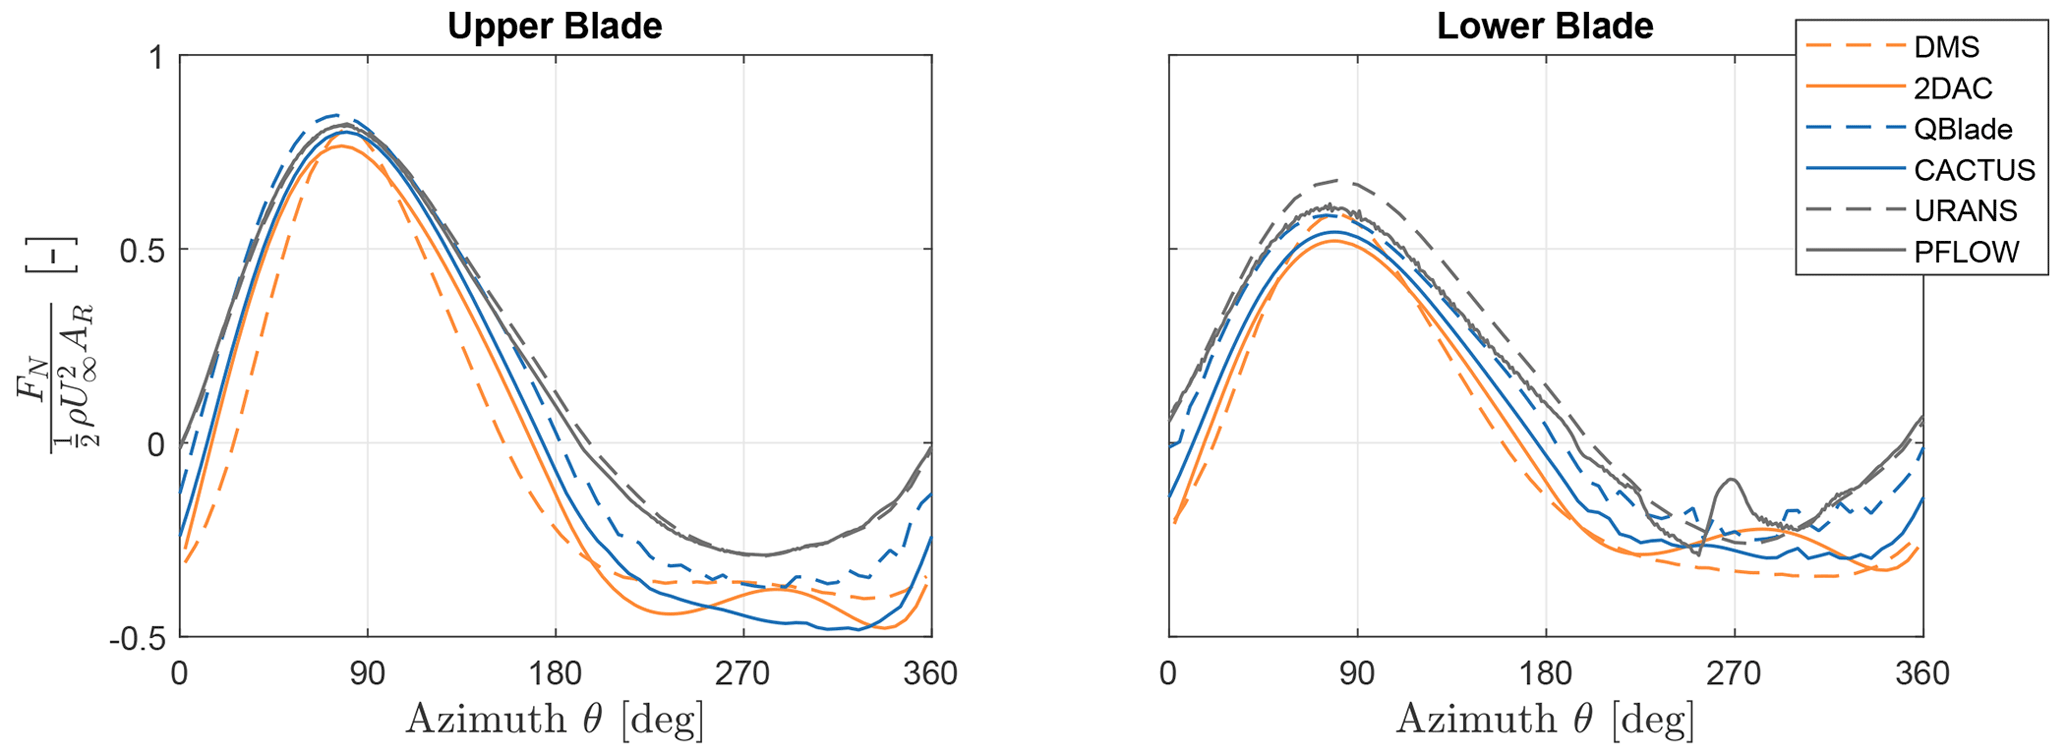
Figure 8Non-dimensionalised normal forces at λ=5 and β=0° predicted by the momentum, vortex, and CFD models. Orange, blue, and grey represent momentum, vortex, and CFD models, respectively.
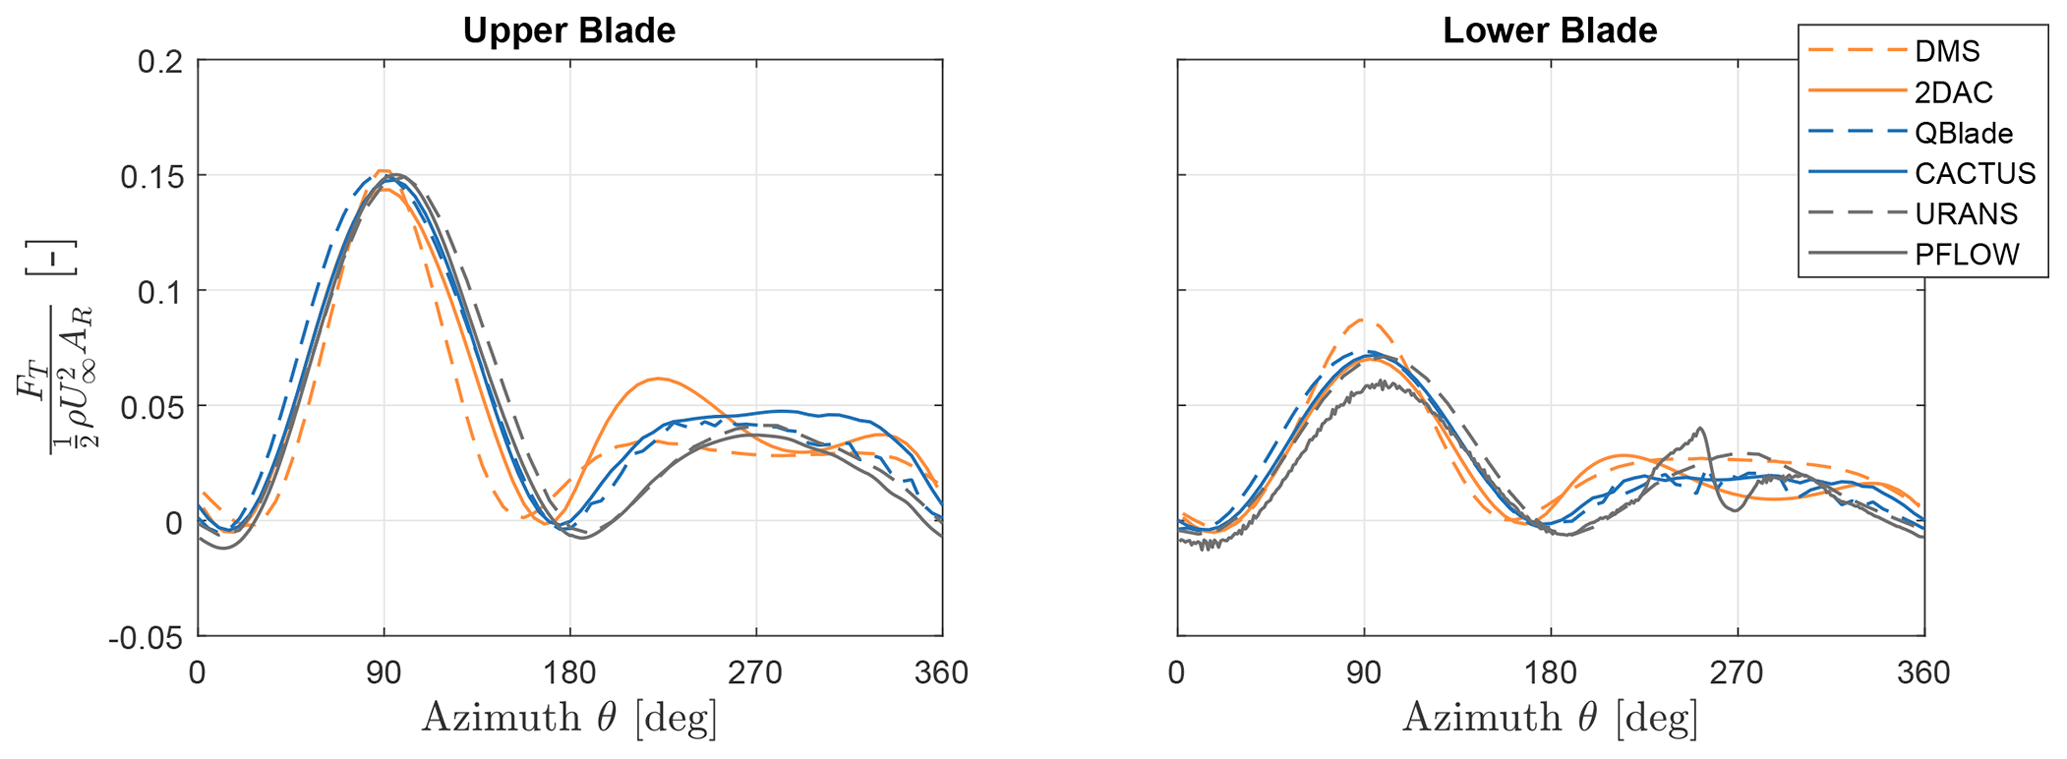
Figure 9Non-dimensionalised tangential forces at λ=5 and β=0° predicted by the momentum, vortex, and CFD models. Orange, blue, and grey represent momentum, vortex, and CFD models, respectively.
3.2.1 Blade forces – comparison with high-fidelity models
The normal and tangential forces at λ=5 and β=0° for the upper and lower blades from all the models are shown in Figs. 8 and 9, respectively. The upper blade normal forces of QBlade and the high-fidelity models match well in the upwind half, but the latter predict lower magnitudes in the downwind half. Additionally, in the lower blade, URANS systematically predicts higher forces than the other models, while PFLOW indicates the fluctuation at θ=270°, which is due to tower wake interaction. The upper blade tangential forces match quite well in the upwind half. But in the downwind half, URANS and PFLOW predict lower forces compared to the other models. This is also observed in the lower blades, except that PFLOW predicted lower forces in the upwind half as well. This is due to the force field created by the induction of the secondary rotor mounted on the lower blades. This induction of the secondary rotor has a small area of influence which does not affect the upper blades significantly. The difference between high-fidelity and other models in both normal and tangential forces is probably due to high flow separation occurring in the downwind half of the turbine. However, isolating its effect from the inherent flow curvature in the high-fidelity model is outside the scope of this paper.
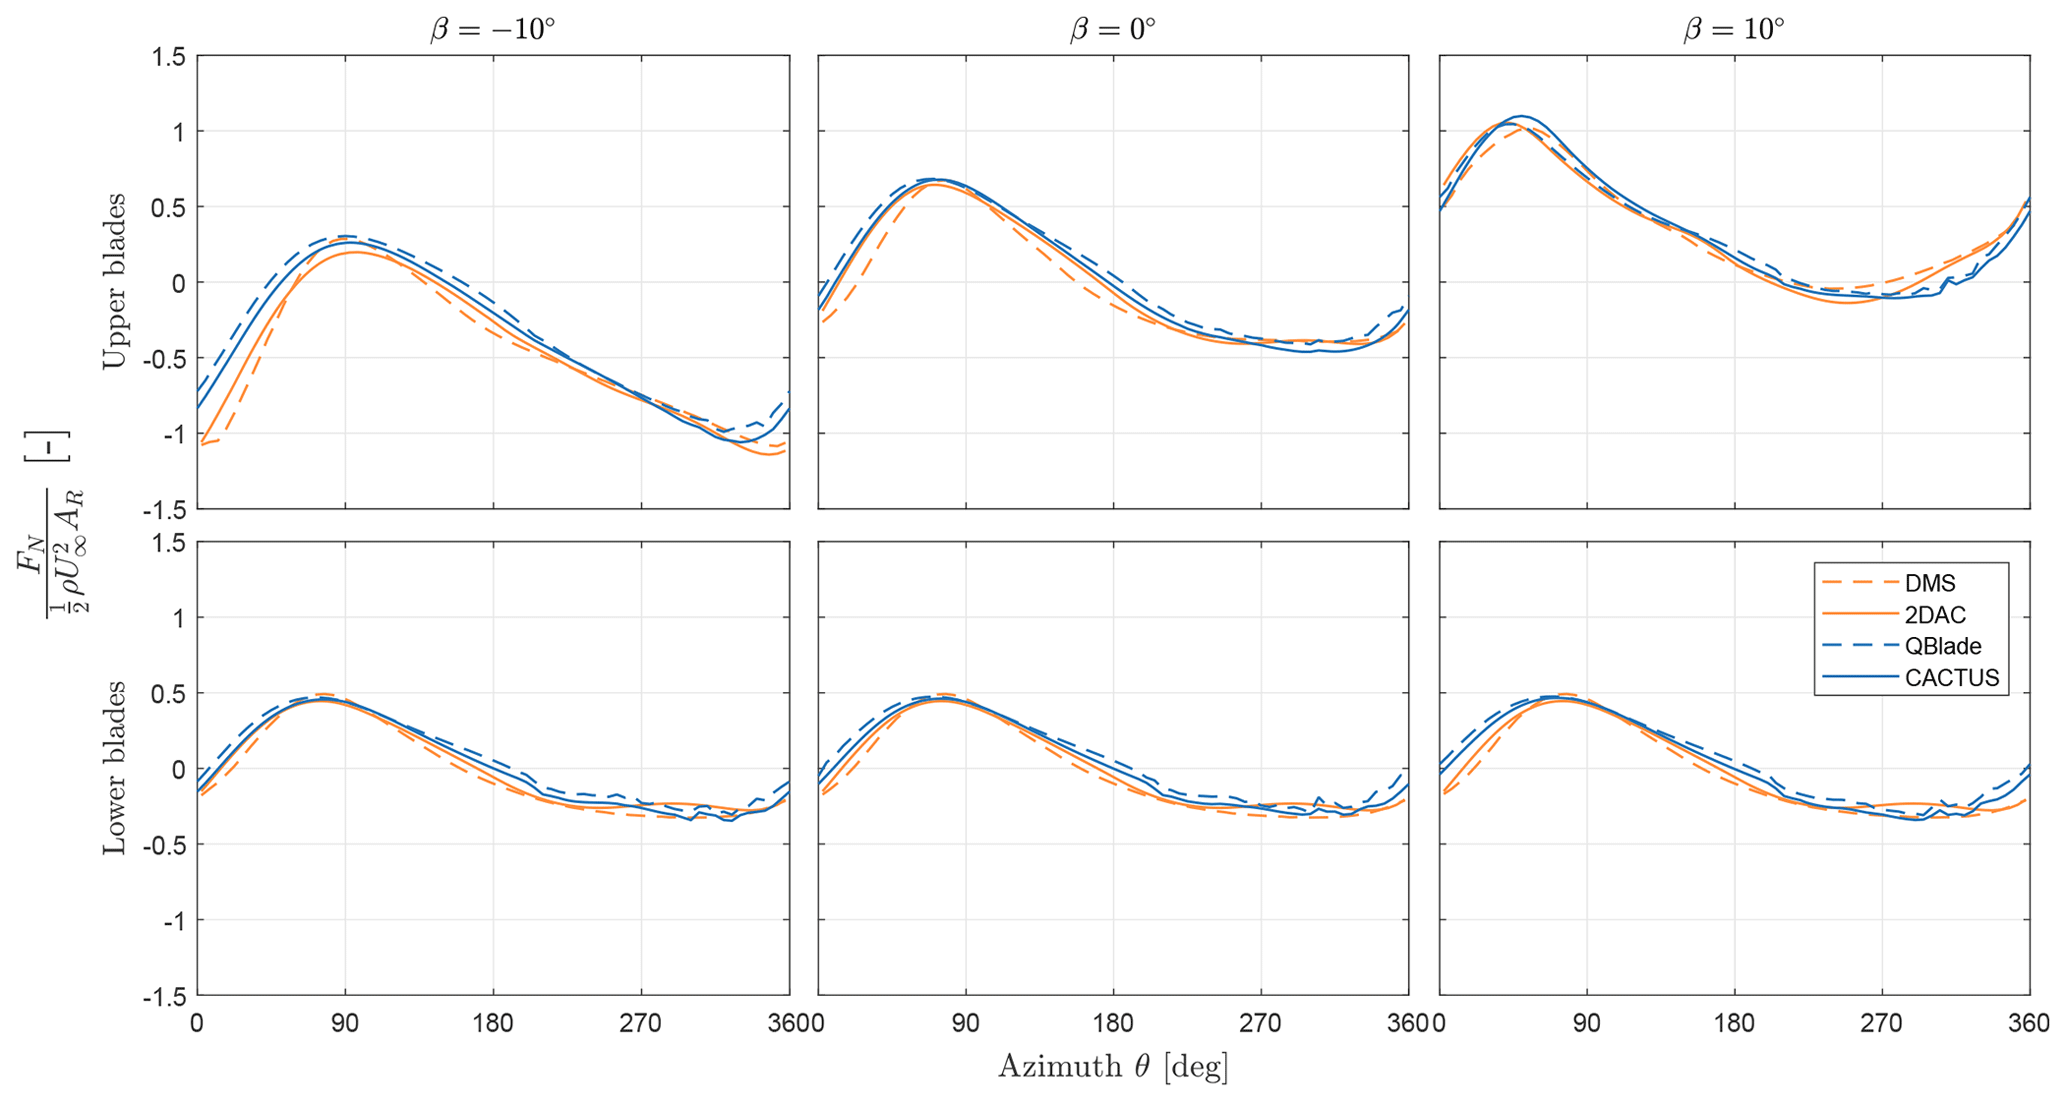
Figure 10Non-dimensionalised normal forces from upper and lower blades for , λ=4. Orange and blue are the momentum and vortex models, respectively.
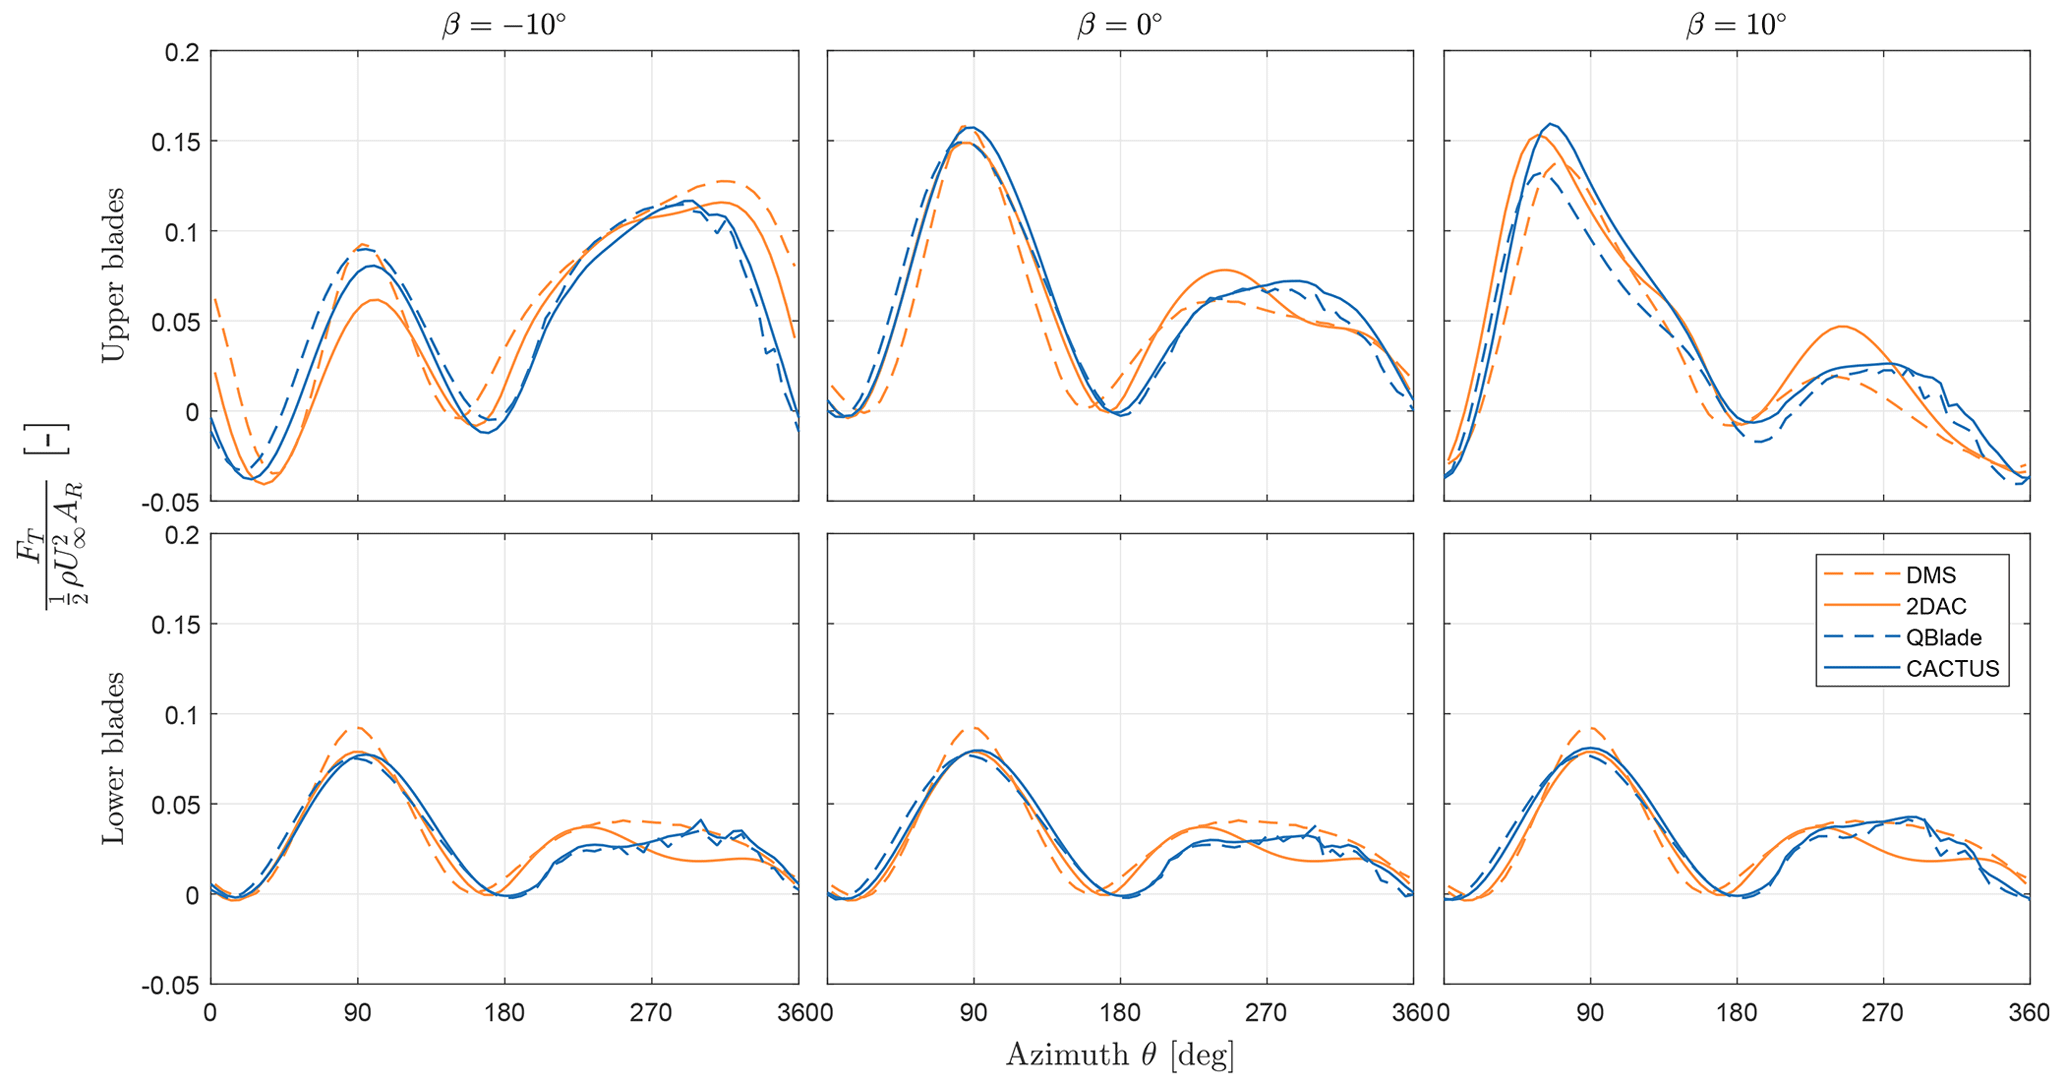
Figure 11Non-dimensionalised tangential forces from upper and lower blades for . Orange and blue are the momentum and vortex models, respectively.
3.2.2 Blade forces – comparison between different pitch offsets
By increasing λ, the loads on the blade increase, which is inferred from Fig. 7. The results discussed henceforth are limited to λ=4. Pitch offset cases of are chosen for further analysis. The forces of the turbine are calculated by integrating individual blade element normal force contributions along the span of the blade. The normal forces for upper and lower blades are shown in Fig. 10, and the tangential forces are shown in Fig. 11.
From the normal force data presented in Fig. 10, at β=0°, the rotor is loaded more in the upwind half () compared to the downwind half (). This is due to the VAWT experiencing asymmetric force distribution during operation, as demonstrated for an H-VAWT (Madsen et al., 2014; Massie et al., 2019). Here, all models agree well except for DMS, which slightly underpredicts the forces in the upwind half, although it matches the peak force predicted by the other models. For negative pitch offsets, the force magnitude decreases at the upwind half of the rotor and increases at the downwind half of the rotor, whereas the opposite occurs when the blades have a positive pitch offset. At , the models significantly deviate in the first quarter of the azimuth for the upper blades. The momentum models predict larger force magnitudes than the vortex models. This is due to the large negative angle of attack observed because of the pitch offset, causing certain points along the span to approach stall conditions. This is also observed in the last quarter. At β=10°, the models agree well in general, but they deviate in the last azimuthal quarter for the upper blades. This difference arises from blades nearing stall conditions (as mentioned earlier) as well as some BVI being captured by the vortex models. Additionally, the rotor experiences a phase shift in the normal force as the pitch offset changes. The peak at β=0° is observed before θ=90°, while the peak for is around θ=90°, and the peak for β=10° is observed around θ=60°. This occurs as the blades experience stall earlier in the azimuth with positive pitch offsets and the opposite for negative pitch offsets compared to β=0°. This phase shift is not observed in the lower blade forces by the momentum models, as they are 2D models that do not take vertical induction into account.
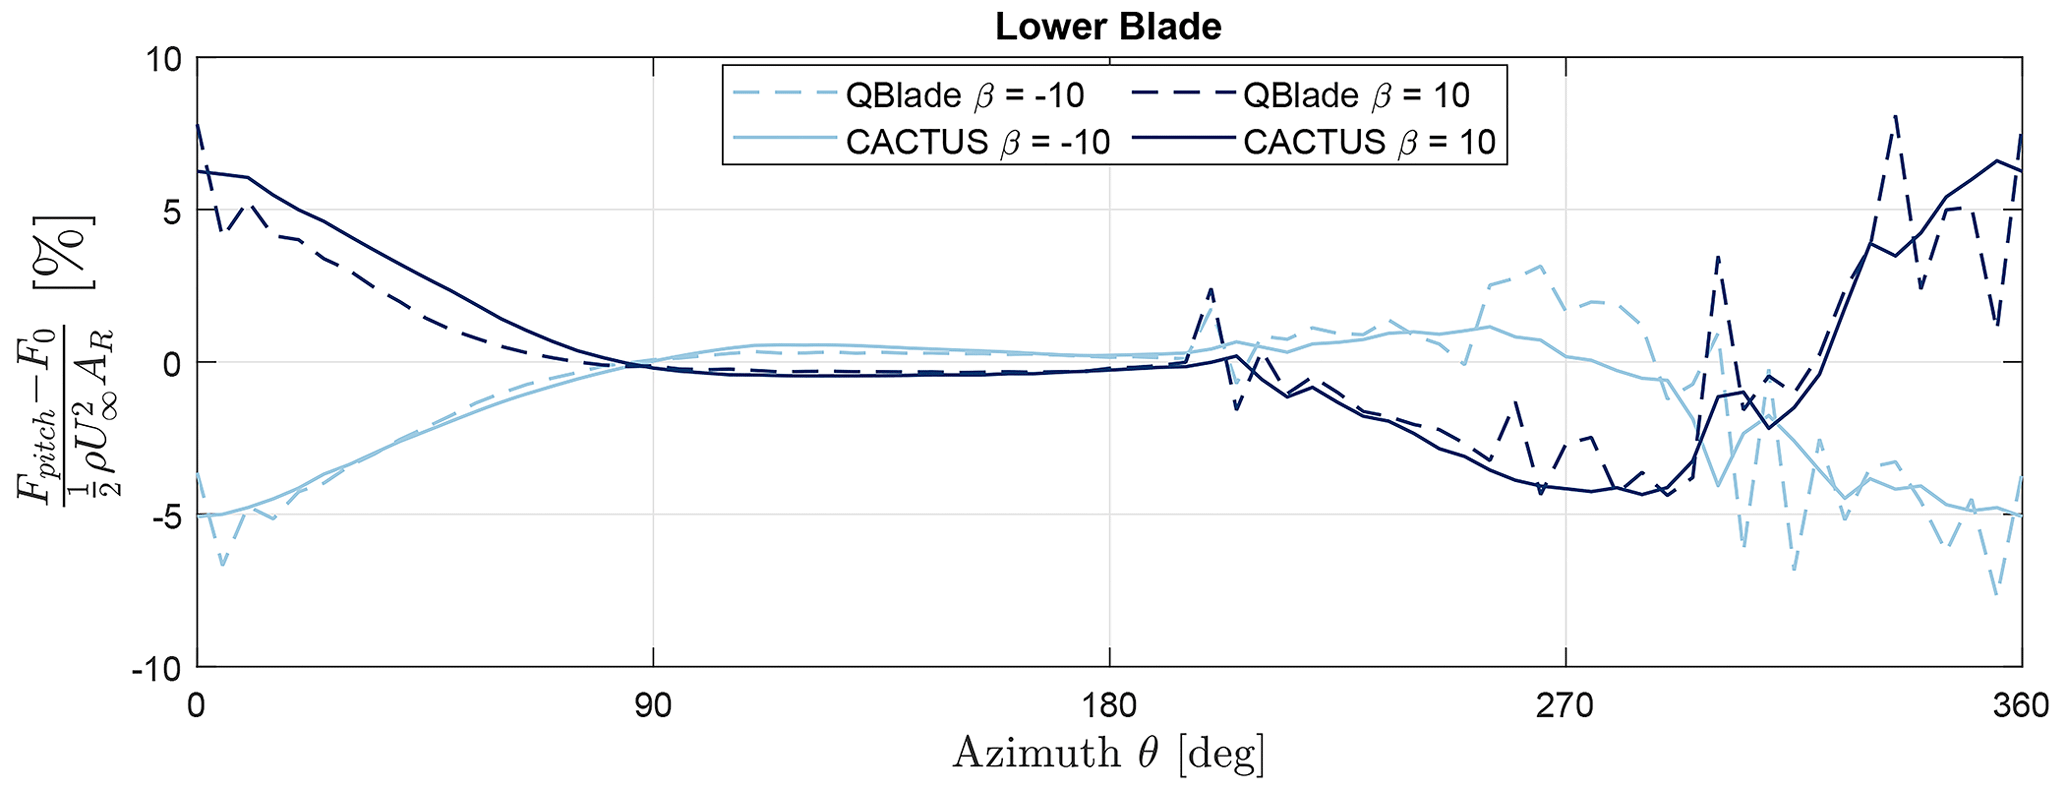
Figure 12Percentage difference of non-dimensional normal forces at fixed pitch offsets relative to zero pitch offset of vortex models. Light and dark blue indicate and β=10°, respectively.
The tangential forces from Fig. 11 also show the redistribution of forces to the upwind and downwind half with positive and negative pitch offsets, respectively. For β=0°, the models behave similarly to the trends previously seen with the normal forces in the upwind half but vary severely in the downwind half where BVI exists. This effect is enhanced with pitch offsets. The DMS model consistently predicts a higher peak tangential force for the lower blade compared to the other models. The phase shift of the forces exists for the upper blades but not for the lower blades. Again, the vortex models show slight differences in the lower blades with pitch offset despite not pitching the lower blades. The momentum models predict identical forces for the lower blades throughout the range of pitch offsets as they are 2D models.
To enhance this difference seen in the lower blade, Fig. 12 shows the normalised difference in the normal force of β=10° and with respect to β=0° of the vortex models. The normal forces of the lower blades with pitch offsets vary from β=0° by roughly 6 %–7 % from the vortex models. This shows a strong 3D aerodynamic effect of vertical induction for the X-Rotor in its operation, which is not accounted for by the 2D momentum models. This variation increases with tip-speed ratio or larger pitch offsets, as the loads increase. In the first azimuthal quarter, where the largest relative velocity is expected, the difference starts out at 5 %–6 % but drops down to nearly 0 % by θ=90°. This is due to the phase shift of the peak forces between the pitched and non-pitched case, which brings down the relative value. In the second azimuthal quarter, the difference is nearly zero due to the weakened blade forces as the blades experience stall conditions. In the third quarter, the downwind passage of the blade flips the pressure and suction side, which inverts the magnitude of the force. In the last quarter, the differences are high due to the presence of BVI and the increase in force magnitude. This is shown by the and β=10° plots crossing each other around θ=300°, where a sudden spike in the difference occurs and continues to diverge steadily beyond that. Additionally, CACTUS results show some jumps in the normal forces (notable ones at θ = 300, 330, and 340°) that are due to BVI. However, QBlade shows large spikes in the entire downwind half of the rotor, in contrast to the gentler spikes from CACTUS that are observed only in the last quarter. This can be attributed to the QBlade's turbulence vortex viscosity factor, which was introduced by Leishman (2006) to account for increased vortex diffusion at highly turbulent flows. In QBlade, this affects the vortex core size at each time step, resulting in larger spikes.
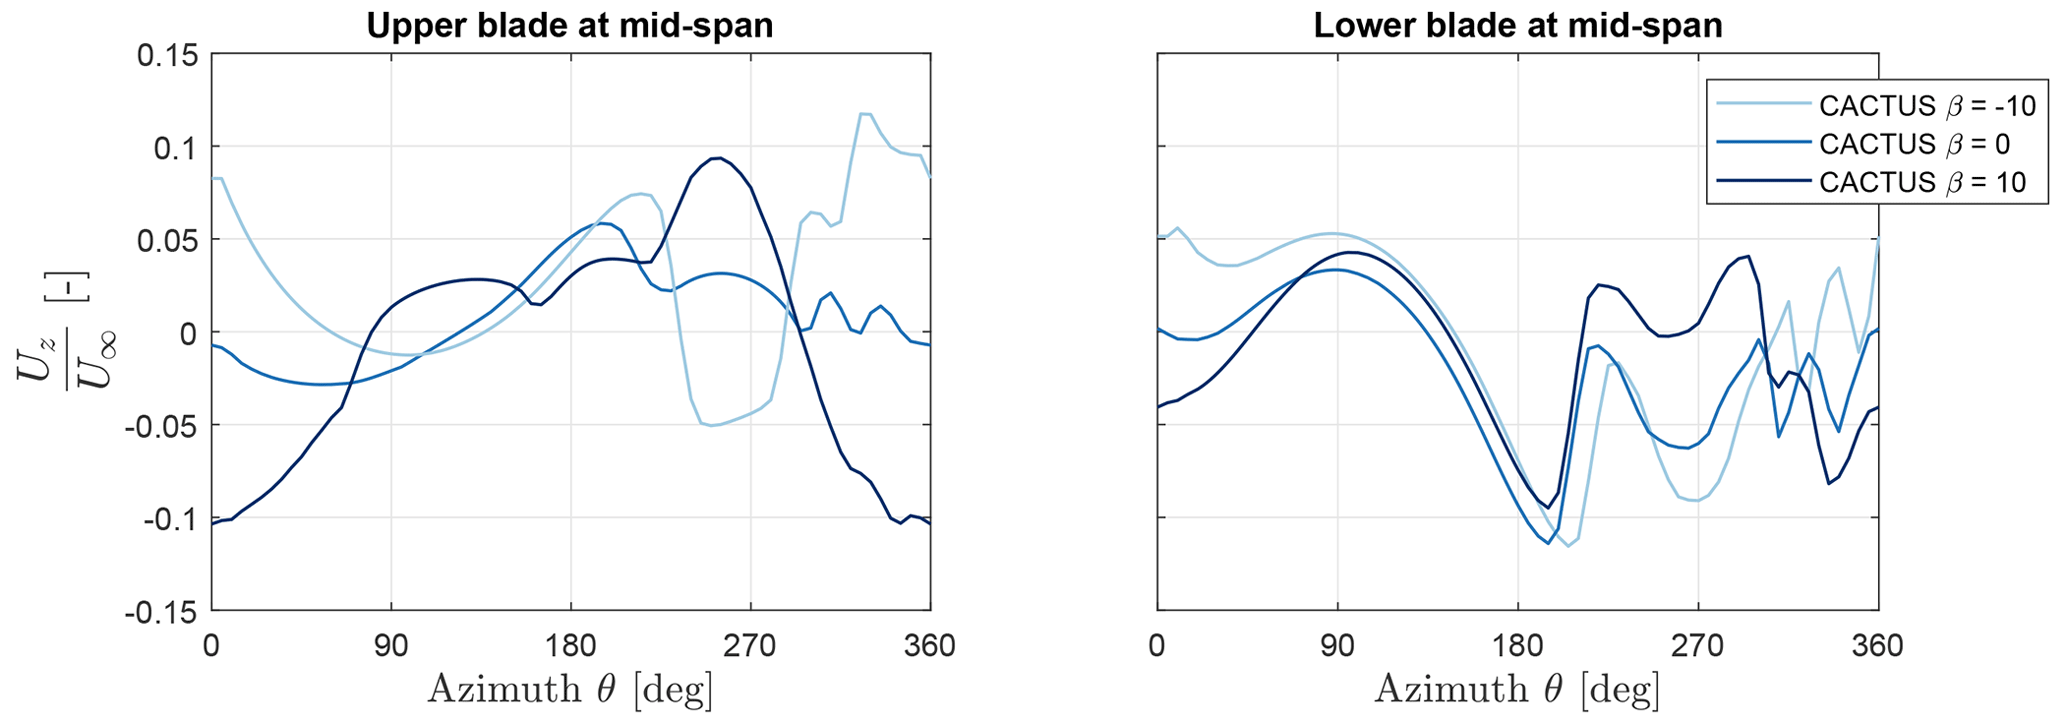
Figure 13Vertical induction normalised by freestream velocity () at the mid-span of the upper and lower blades. Vertical induction results are from CACTUS for , indicated by light, medium, and dark blue profiles. Results are normalised by the freestream velocity.
3.3 Vertical induction and inflow
The X-Rotor consists of coned blades in its primary rotor geometry; therefore, a component of the normal forces from the blade acts in the axial or vertical direction. As observed in Fig. 12, the presence of vertical induction while pitching the upper blades significantly affects the forces in the fixed pitch lower blades due to the change in force field towards the upwind and the downwind halves. CACTUS results for the vertical induction at the mid-span of the X-Rotor blades along its azimuthal cycle are shown in Fig. 13. QBlade results are not considered as it does not store induction in all directions in its output. The vertical induction due to coned blades as well as the finite blade effects can be observed clearly at β=0° for the upper blades, where the induction is mostly negative for the upwind half and mostly positive for the downwind half, which is due to the blade tip vortices as well as the coned blades of the X-Rotor. Furthermore, is shown to exhibit positive induction overall, in contrast to the negative induction shown in β=10°. The direction of vertical induction indicates that the tip vortices also flip their direction, which causes a large change in the flow field of the rotor. The lower blades clearly experience a difference in vertical induction as the pitch of the upper blade changes, which correlates well with the trends that are seen in Fig. 12. Most differences can be observed in the first, third, and last azimuthal quarters, while the second quarter shows the least difference due to stalling of the blade. Furthermore, this shows the importance of vertical induction especially with blade pitch, where the force field changes the tip-vortex strength, resulting in enhanced three-dimensionality of results (Huang et al., 2023).
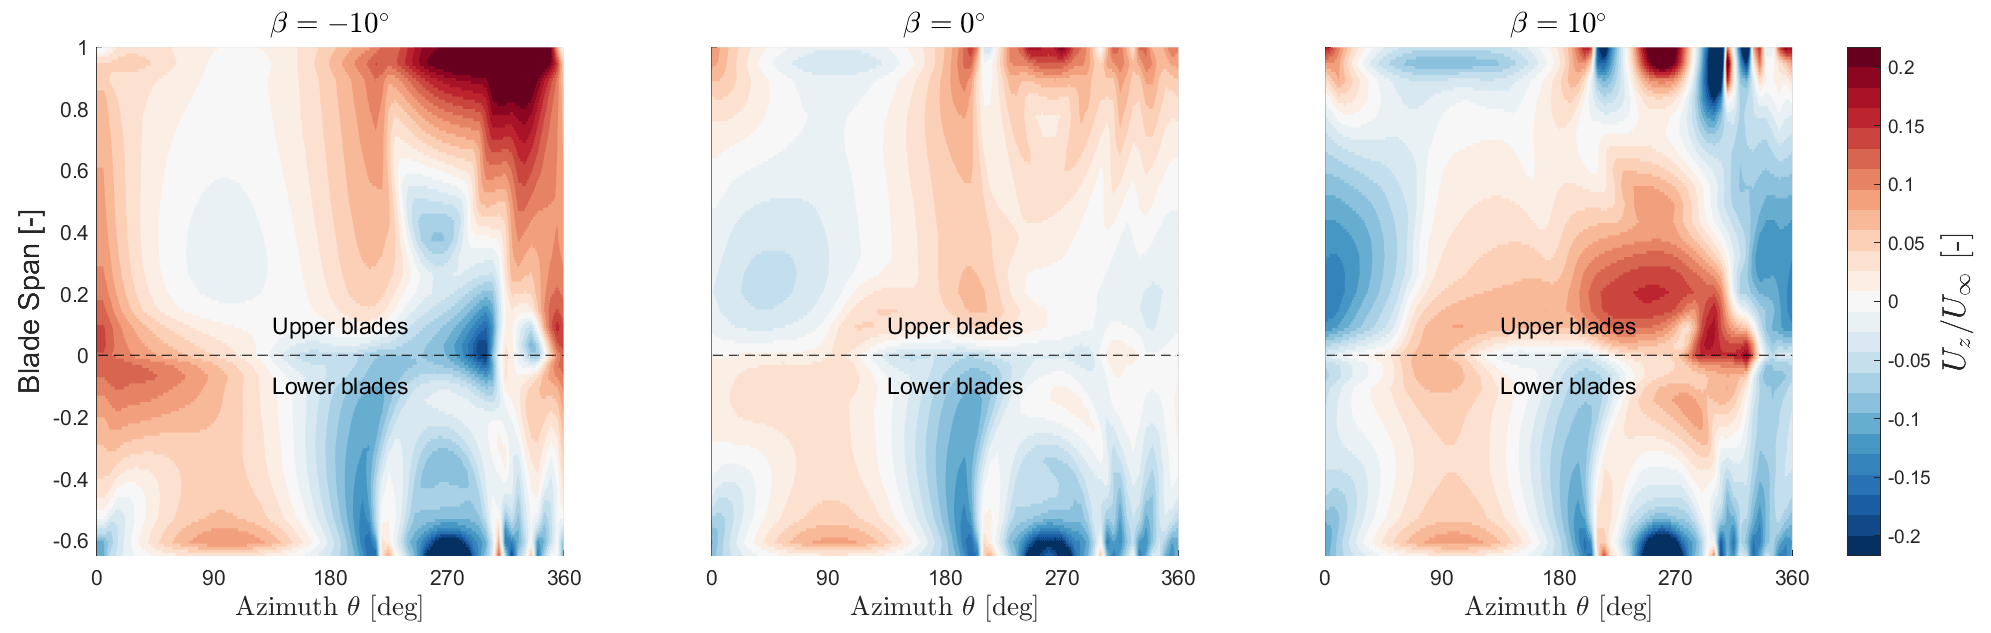
Figure 14Vertical induction normalised by freestream () as a function of azimuth and blade span. Results are from CACTUS for . The lower blade is represented with negative span values. Blade span is normalised with the maximum span, with 1 being the tip of the upper blades, 0 being the root, and −0.65 being the tip of the lower blades.
As the tip-speed ratio is different along the span, the vertical induction also varies along the span. To obtain an overview of the spanwise variation of vertical induction at these pitch cases, Fig. 14 shows contour plots of vertical induction as a function of span and azimuth. At β=0°, the upper blades seem to exhibit almost no vertical induction in the upwind half, while the lower blades produce small positive induction, with the tips showing the largest induction. In the downwind half, the upper blades show positive induction, and the lower blades show negative induction. At , the upwind half is mostly dominated by positive induction from the root sections and the lower blades, with the tip-vortex of the lower blade giving negative induction at θ=0°. This is because the upper blades are loaded more in the downwind half. At θ=180°, the upper blades exhibit large positive induction, while the lower blades show mostly large negative induction. However, there exists a strong negative induction in the root region around θ=300° before transitioning to strong positive induction. Additionally, due to the downwind loading of the upper blades, the regions close to the tip until the mid-span show very large positive induction. At β=10°, there is primarily strong negative induction in the first azimuthal quarter concentrated mostly in the upper blades due to large loading in the upwind half, whereas in the downwind half there exists a dominant positive induction in the root region and the upper blades before transitioning to a strong negative induction in the last azimuthal quarter. Interestingly, it is observed that with pitch offsets, the root section is quite important despite a smaller local tip-speed ratio when compared to the tip. This is attributed to the root vortices that are formed as the upper and lower blade meet there. The change in pitch affects the vorticity system of the upper blade tips as well as the roots. Ultimately, the vertical induction varies quite significantly, and it is seen that the induction on the lower blades is influenced heavily by that of the upper blades as well as the tip and root vortices.
Overall, the force field of the rotor is subject to change with pitch offsets as the vorticity system changes (Huang et al., 2023). Therefore, it can be said that VAWTs (not specifically limited to the X-Rotor) become highly 3D with pitch offsets as the vorticity system changes and the validity of 2D aerodynamic models dwindle with larger offsets.
A numerical comparison of different aerodynamic models was conducted to understand the aerodynamic characteristics and the performance of an X-shaped VAWT for a range of tip-speed ratios and pitch offsets. This study contributed the following: (1) a comparative study of different aerodynamic models for the X-Rotor's primary rotor and (2) the significance of 3D aerodynamics for the X-Rotor associated with fixed blade pitch offsets.
The models presented were the double-multiple streamtube (DMS), 2D actuator cylinder (2DAC), QBlade lifting line (QBlade), CACTUS lifting line (CACTUS), PowerFLOW (PFLOW), and unsteady Reynolds-averaged Navier–Stokes (URANS) CFD model.
This study showed that the DMS model performed almost on par with the other models in calculating rotor performance parameters when there was no pitch offset but predicted significantly different results once blade pitch was introduced, as the validity of the streamtubes enclosing the downwind actuator began to fail. This worsened at high tip-speed ratios where the DMS models predicted power coefficients at the Betz limit with pitch offsets.
The 2DAC model offered consistent data at small pitch offsets (between ). However, being inherently a 2D and a quasi-steady model, it did not capture the BVI and the effect of vertical induction of the X-Rotor. Moreover, it predicted the forces in the lower blade to be the same across all upper blade pitch offsets, which was not the case for the models that accounted for the vertical induction.
The thrust predicted by the momentum models was different from that of the vortex models. Moreover, these models were unable to capture the vertical induction effects and the BVI that occurred in the downwind cycle of the rotor. Therefore, the 2D momentum models were mostly inaccurate in predicting the thrust, power, or blade loads for the X-Rotor due to the influence of 3D aerodynamics.
The QBlade and the CACTUS open-source simulations offered great consistency with each other, including capturing the 3D aerodynamics effectively. The QBlade model showed huge turbulent viscosity spikes in its results occurring throughout the normal and tangential forces, which was a result of the vortex core and turbulent viscosity model used in the solver. This behaviour also translated to the blade-integrated forces where the QBlade slightly overpredicted the results compared to CACTUS. However, both of their results remained consistent, suggesting their reliability over low-fidelity models for this specific rotor geometry.
URANS and PFLOW results were compared with the vortex and momentum models for power, thrust, and blade forces for one test case. Primarily, the URANS and PFLOW agreed very well with the thrust of the vortex models, although they predicted slightly less power. This was because URANS had small domain sizes, which caused enough blockage effects to affect the results, and the PFLOW modelled the tower as well as the secondary rotors, which also caused slight power loss. Secondly, the downwind half of the turbine showed significantly lower force magnitudes, which was due to a combination of flow separation at the blades and the inherent flow curvature effects present in the CFD solvers.
The distribution of vertical induction over the span and azimuth was studied to understand the 3D aerodynamics of the X-Rotor and also with pitch offsets. The vertical induction was dominated primarily by the tip vortices (due to spanwise lift variation) in cases with no pitch offset. Interestingly, with pitch offsets the root vortex showed greater influence on the vertical induction for the X-Rotor despite operating at a much lower local tip-speed ratio. Due to the large vertical induction fluctuations through the azimuthal cycle of VAWTs at fixed pitch offsets, it concluded that the 2D models lose their validity in these conditions and for coned VAWTs.
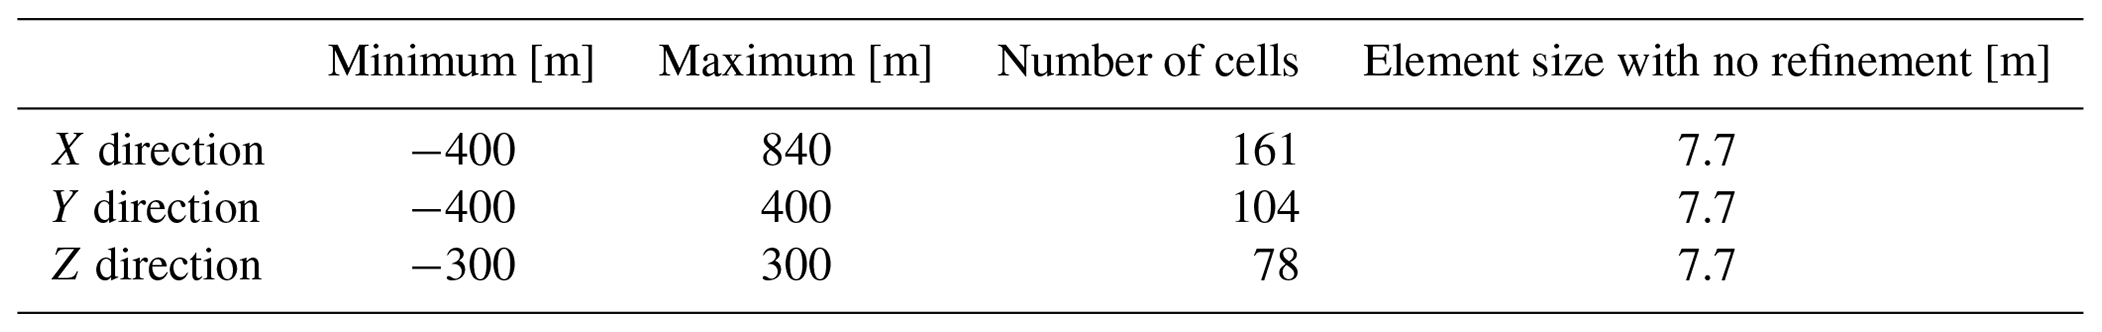
The number of cells is 72 million.
The mesh background is created using blockMesh. The mesh dimensions are described in Table B1.
The mesh has been created using snappyHexMesh, where three refinement regions have been used:
-
annular disk in the upper blades; axis (0, 0, 70 m) to (0, 0, 100 m); radius 90 m with inner radius 60 m;
-
annular disk in the lower blades; axis (0, 0, −55 m) to (0, 0, −35 m); radius 90 m with inner radius 60 m;
-
cylinder axis (0, 0, −150 m) to (0, 0, 150 m); radius 200 m.
With regard to meshing levels, the rotor surface is meshed with level 8, which leads to a minimum element size of 0.96 m. The two annular disks are meshed with level 5, which corresponds to a minimum element size of 1.54 m. The cylinder is meshed with level 3, with a minimum element size of 2.56 m. To account for the boundary layer along the blades, the rotor is meshed with an expansion ratio of 1.2, with a minimum thickness of (to capture the boundary layer, this thickness was necessary to maintain a Y+ to be less than 1) and with five surface layers.
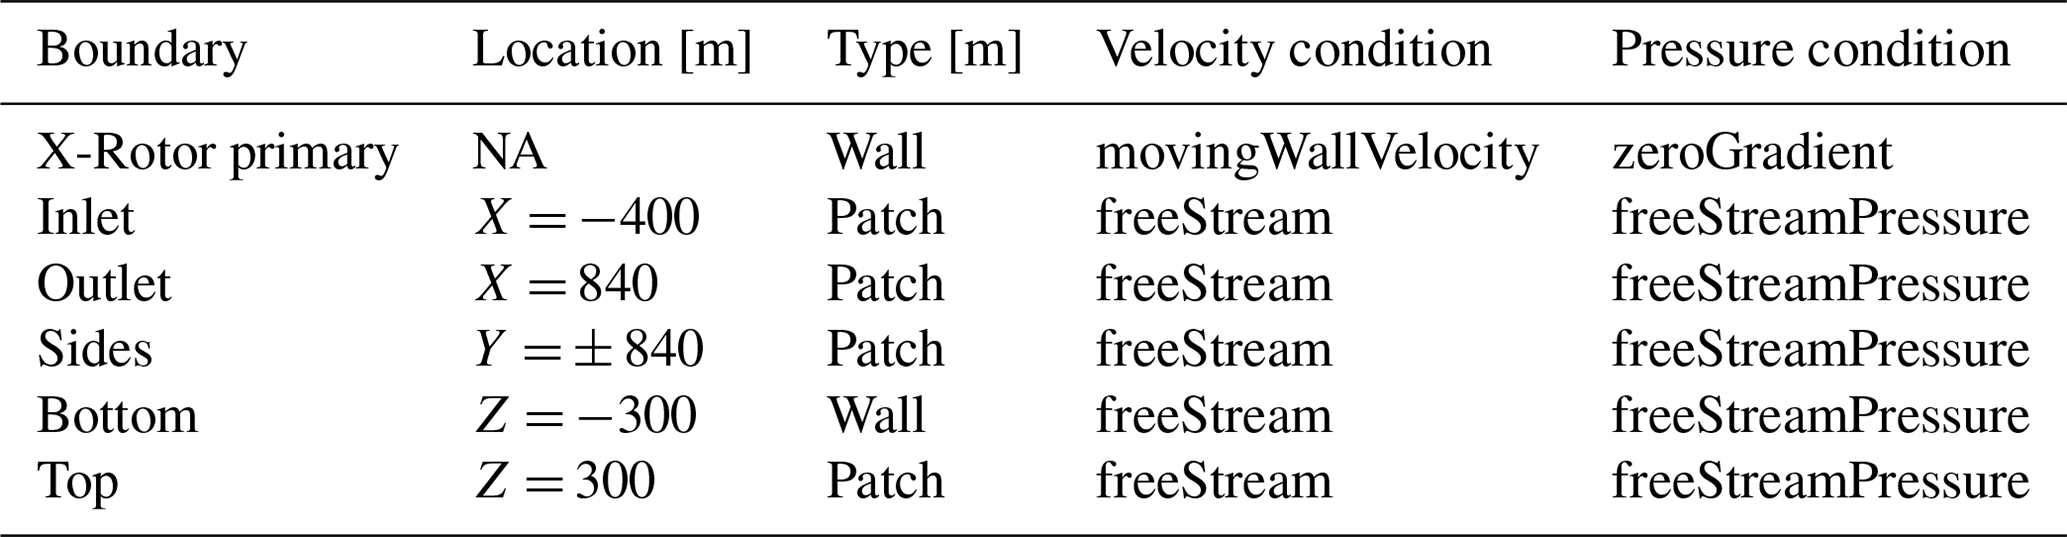
The rotation of the turbine is imposed in the domain using the arbitrary mesh interface (AMI) capability available in OpenFOAM. The boundary condition of the domain is listed in Table B2.
The turbulence model used in the simulations is k−ω SST. The baseline setup used the Euler discretisation scheme for time and Gauss linear schemes for the gradients. Divergence schemes are Gauss linear upwind for velocity, Gauss upwind for k, and ω. The Laplacian schemes used are Gauss linear limited corrected. Pressure–velocity coupling is achieved with the PIMPLE equations with three outer corrector routines. The under-relaxation factors for velocity and pressure are 0.9.
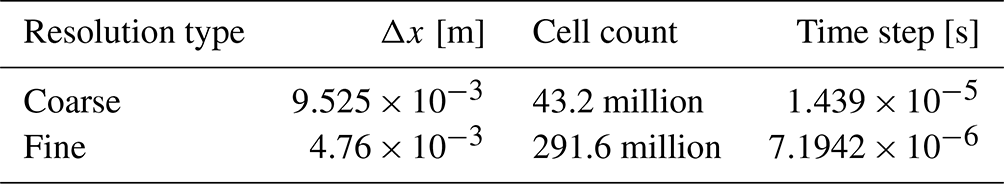
The finest cell size is , which corresponds to 50 cells per average chord of the secondary rotor blade. The total number of cells and surface elements for this simulation is 291.6 million and 32.3 million, respectively. The flow simulation time is 67.63 s, which is equivalent to nine primary rotor revolutions requiring 18 995 CPU hours per revolution using a Linux Xeon® Gold 6148 (500-core Skylake) 2.4 GHz platform.
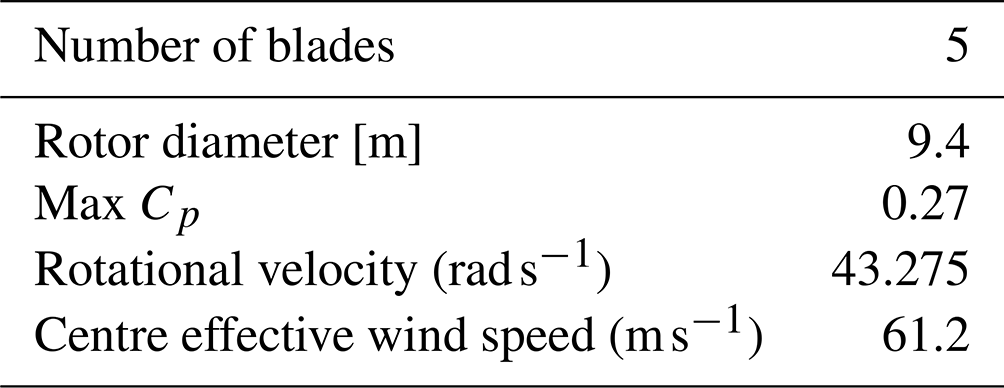
The simulations conducted are of the primary rotor coupled with the secondary rotor and the tower. The dimensions and the operating condition of the secondary rotor are mentioned in Table C2. Additionally, the thrust profile for one of the two secondary rotors for the last revolution from the PFLOW calculations is provided in Fig. C1.
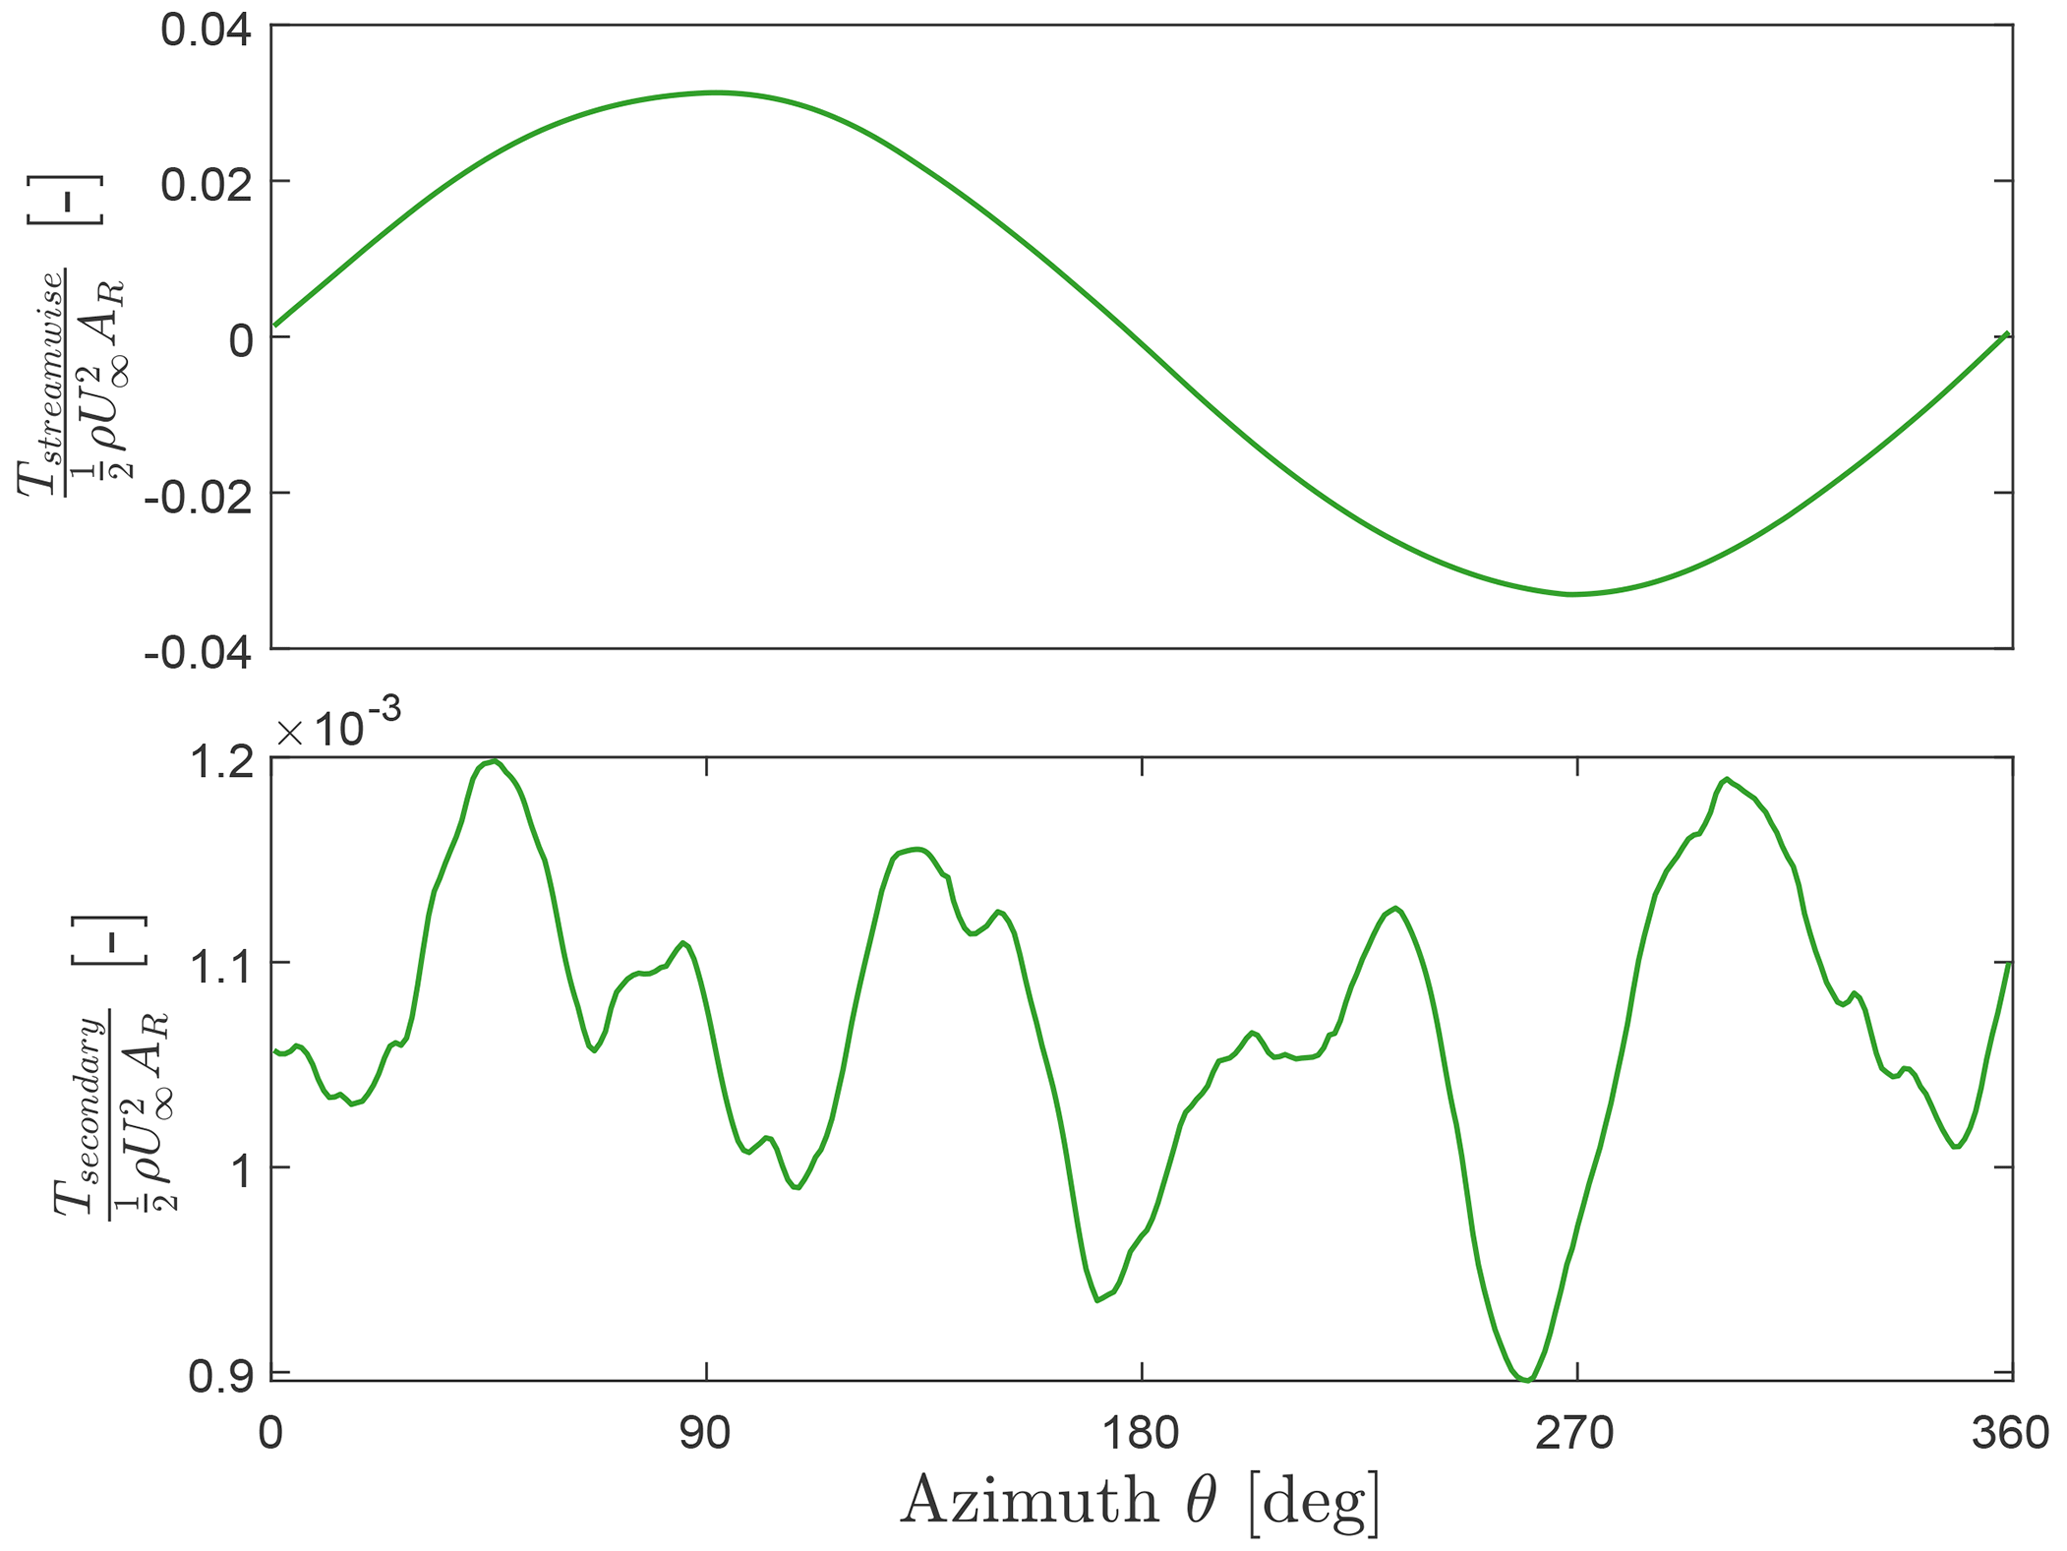
Figure C1Thrust of the secondary rotor over the azimuthal cycle of the primary rotor non-dimensionalised by the inflow velocity U∞ and frontal area AR of the primary rotor over the last azimuthal cycle of the PFLOW simulation. As the secondary rotor changes orientation at each azimuth, the thrust presented at the top is the drag force of the rotor against the freestream direction of the primary rotor, and the bottom figure is the thrust acting along the rotation axis of the secondary rotor.
The generated and processed data sets used in this paper are available at https://doi.org/10.5281/zenodo.8208638 (Giri Ajay et al., 2023) for further research purposes.
AGA and LM did performed main research work; performed and analysed the numerical results from the momentum and vortex models; and wrote the paper, with AGA writing the most. YW developed and provided the numerical results for PowerFLOW. DB, AC, and OP performed the URANS simulations and presented the results. Through meetings and feedback, AGA, LM, YW, and CF contributed to interpreting and discussing the results. CF offered general guidance and also reviewed the paper. The paper was revised and improved by all authors.
The contact author has declared that none of the authors has any competing interests.
Publisher's note: Copernicus Publications remains neutral with regard to jurisdictional claims made in the text, published maps, institutional affiliations, or any other geographical representation in this paper. While Copernicus Publications makes every effort to include appropriate place names, the final responsibility lies with the authors.
The authors acknowledge the use of computational resources of the DelftBlue supercomputer (https://www.tudelft.nl/dhpc, last access: 25 February 2024) to perform the required simulations. Moreover, the authors acknowledge the support provided by William Leithead and James Carroll from the University of Strathclyde for this study.
This research has been supported by the funding received from the European Union's Horizon 2020 research and innovation programme under grant agreement no. 101007135 as part of the XROTOR project (https://doi.org/10.3030/101007135).
This paper was edited by Mingming Zhang and reviewed by two anonymous referees.
Balduzzi, F., Bianchini, A., Maleci, R., Ferrara, G., and Ferrari, L.: Blade design criteria to compensate the flow curvature effects in h-darrieus wind turbines, J. Turbomach., 137, 1–10, https://doi.org/10.1115/1.4028245, 2014. a
Belabes, B. and Paraschivoiu, M.: CFD modeling of vertical-axis wind turbine wake interaction, T. Can. Soc. Mech. Eng., 47, 449–458, https://doi.org/10.1139/TCSME-2022-0149, 2023. a
Cheng, Z., Madsen, H. A., Gao, Z., and Moan, T.: Aerodynamic Modeling of Floating Vertical Axis Wind Turbines Using the Actuator Cylinder Flow Method, Enrgy. Proced., 94, 531–543, https://doi.org/10.1016/J.EGYPRO.2016.09.232, 2016. a
Dassault Systemes: SIMULIA PowerFLOW User's Guide, https://www.3ds.com/products/simulia/powerflow (last access: 25 February 2024), 2021. a
Delft High Performance Computing Centre (DHPC): DelftBlue Supercomputer (Phase 1), https://www.tudelft.nl/dhpc/ark:/44463/DelftBluePhase1 (last access: 25 February 2024), 2022.
De Tavernier, D., Ferreira, C., Paulsen, U., and Madsen, H.: The 3D effects of a vertical-axis wind turbine: rotor and wake induction, J. Phys. Conf. Ser., 1618, 052040, https://doi.org/10.1088/1742-6596/1618/5/052040, 2020a. a
De Tavernier, D., Sakib, M., Griffith, T., Pirrung, G., Paulsen, U., Madsen, H., Keijer, W., and Ferreira, C.: Comparison of 3D aerodynamic models for vertical-axis wind turbines: H-rotor and Φ-rotor, J. Phys. Conf. Ser., 1618, 052041, https://doi.org/10.1088/1742-6596/1618/5/052041, 2020b. a
Drela, M.: XFOIL: An Analysis and Design System for Low Reynolds Number Airfoils, in: Low Reynolds Number Aerodynamics, edited by: Mueller, T. J., Lecture Notes in Engineering, Springer, Berlin, Heidelberg, https://doi.org/10.1007/978-3-642-84010-4_1, pp. 1–12, 1989. a
Ferreira, C. S.: The near wake of the VAWT 2D and 3D views of the VAWT aerodynamics, PhD thesis, Delft University of Technology, Delft, http://resolver.tudelft.nl/uuid:ff6eaf63-ac57-492e-a680-c7a50cf5c1cf (last access: 25 February 2024), 2009. a, b
Ferreira, C. S., Madsen, H. A., Barone, M., Roscher, B., Deglaire, P., and Arduin, I.: Comparison of aerodynamic models for Vertical Axis Wind Turbines, J. Phys. Conf. Ser., 524, 012125, https://doi.org/10.1088/1742-6596/524/1/012125, 2014. a, b, c
Flannigan, C., Carroll, J., and Leithead, W.: Operations expenditure modelling of the X-Rotor offshore wind turbine concept, in: J. Phys. Conf. Ser., 2265, 032054, https://doi.org/10.1088/1742-6596/2265/3/032054, 2022. a, b
Franchina, N., Kouaissah, O., Persico, G., and Savini, M.: Three-dimensional CFD simulation and experimental assessment of the performance of a h-shape vertical-axis wind turbine at design and off-design conditions, International Journal of Turbomachinery, Propulsion and Power, 4, 30, https://doi.org/10.3390/IJTPP4030030, 2019. a
Freris, L. L.: Wind Energy Conversion Systems, Prentice Hall, New York, ISBN 0139605274, ISBN 9780139605277, 1990. a
Giri Ajay, A., Morgan, L., Wu, Y., Bretos, D., Cascales, A., Pires, O., and Ferreira, C.: Aerodynamic model comparison for an X-shaped vertical-axis wind turbine, Zenodo [data set], https://doi.org/10.5281/zenodo.8208638, 2023. a
Huang, M., Sciacchitano, A., and Ferreira, C.: On the wake deflection of vertical axis wind turbines by pitched blades, Wind Energy, pp. 365–387, https://doi.org/10.1002/we.2803, 2023. a, b
Katz, J. and Plotkin, A.: Low-Speed Aerodynamics, Springer, https://doi.org/10.1007/978-1-4020-8664-9_3, 2009. a
Keijer, W. J. T.: 3D aerodynamic effects and circulation control of vertical axis wind turbines, MSc thesis, http://resolver.tudelft.nl/uuid:765b00ba-7a80-4588-8476-774d7badc6cb (last access: 25 February 2024), 2020. a
Kolios, A., Chahardehi, A., and Brennan, F.: Experimental determination of the overturning moment and net lateral force generated by a novel vertical axis wind turbine: Experiment design under load uncertainty, Exp. Techniques, 37, 7–14, https://doi.org/10.1111/j.1747-1567.2011.00727.x, 2013. a
Kozak, P. A., Vallverdú, D., and Rempfer, D.: Modeling vertical-axis wind turbine performance: Blade element method vs. finite volume approach, in: 12th International Energy Conversion Engineering Conference, IECEC 2014, 28–30 July 2014, Cleveland, OH, USA, https://doi.org/10.2514/6.2014-3861, 2014. a
Le Fouest, S. and Mulleners, K.: The dynamic stall dilemma for vertical-axis wind turbines, Renew. Energ., 198, 505–520, https://doi.org/10.1016/J.RENENE.2022.07.071, 2022. a
Leishman, J. G.: Principles of helicopter aerodynamics, 2nd Edn., SE – xxxvii, illustrations; 27 cm, Cambridge University Press, Cambridge, 826 pp., ISBN 978-1-107-01335-3, 2006. a
Leithead, W., Camciuc, A., Amiri, A. K., and Carroll, J.: The X-Rotor Offshore Wind Turbine Concept, J. Phys. Conf. Ser., 1356, https://doi.org/10.1088/1742-6596/1356/1/012031, 2019. a, b, c
Madsen, H. A.: The actuator cylinder: a flow model for vertical axis wind turbine., PhD thesis, ResearchGate, https://doi.org/10.13140/RG.2.1.2512.3040, 1982. a
Madsen, H. A., Paulsen, U. S., and Vitae, L.: Analysis of VAWT aerodynamics and design using the Actuator Cylinder flow model, J. Phys. Conf. Ser., 555, 012065, https://doi.org/10.1088/1742-6596/555/1/012065, 2014. a, b
Marten, D.: QBlade: a modern tool for the aeroelastic simulation of wind turbines, PhD thesis, Technische Universität Berlin, Berlin, https://doi.org/10.14279/depositonce-10646, 2020. a
Marten, D., Wendler, J., Pechlivanoglou, G., Nayeri, C. N., and Paschereit, C. O.: QBLADE: an open source tool for design and simulation of horizontal and vertical axis wind turbines, International Journal of Emerging Technology and Advanced Engineering, 3, 264–269, 2013. a
Massie, L., Ouro, P., Stoesser, T., and Luo, Q.: An Actuator Surface Model to Simulate Vertical Axis Turbines, Energies, 12, 4741, https://doi.org/10.3390/EN12244741, 2019. a
Masson, C., Leclerc, C., and Paraschivoiu, I.: Appropriate dynamic-stall models for performance predictions of VAWTs with NLF blades, International Journal of Rotating Machinery, 4, 129–139, https://doi.org/10.1155/S1023621X98000116, 1998. a
Melani, P. F., Balduzzi, F., Ferrara, G., and Bianchini, A.: An annotated database of low Reynolds aerodynamic coefficients for the NACA0021 airfoil, AIP Conf. Proc., 2191, 20111, https://doi.org/10.1063/1.5138844, 2019. a
Menter, F. R.: Zonal two equation κ-ω turbulence models for aerodynamic flows, in: AIAA 23rd Fluid Dynamics, Plasmadynamics, and Lasers Conference, 6–9 July 1993, Orlando, FL, USA, https://doi.org/10.2514/6.1993-2906, 1993. a
Migliore, P. G., Wolfe, W. P., and Fanucci, J. B.: Flow Curvature Effects on Darrieus Turbine Blade Aerodynamics., J. Energy, 4, 49–55, https://doi.org/10.2514/3.62459, 1980. a
Morgan, L. and Leithead, W.: Aerodynamic modelling of a novel vertical axis wind turbine concept, in: J. Phys. Conf. Ser., 2257, 012001, https://doi.org/10.1088/1742-6596/2257/1/012001, 2022. a, b, c
Murray, J. and Barone, M.: The Development of CACTUS, a Wind and Marine Turbine Performance Simulation Code, in: AIAA 49th Aerospace Sciences Meeting including the New Horizons Forum and Aerospace Exposition 4–7 January 2011, Orlando, Florida, 1–21, https://doi.org/10.2514/6.2011-147, 2011. a
Paraschivoiu, I.: Double-multiple streamtube model for Darrieus in turbines, in: 49th AIAA Aerospace Sciences Meeting including the New Horizons Forum and Aerospace Exposition, 4–7 January 2011, Orlando, Florida, USA, Document number 19820015811, https://ntrs.nasa.gov/citations/19820015811 (last access: 25 February 2024), 1981. a
Paraschivoiu, I.: Aerodynamic Loads and Performance of the Darrieus Rotor, J. Energy, 6, 406–412, https://doi.org/10.2514/3.62621, 1982. a
Posa, A. and Balaras, E.: Large Eddy Simulation of an isolated vertical axis wind turbine, J. Wind Eng. Ind. Aerod., 172, 139–151, https://doi.org/10.1016/J.JWEIA.2017.11.004, 2018. a
Prandtl, L., Betz, A., Klassiker der Strömungsmechanik, G., and Abhandlungen, V.: Vier Abhandlungen zur Hydrodynamik und Aerodynamik, Universit atsverlag Göttingen, Göttingen, https://doi.org/10.17875/gup2010-106, 1927. a, b
Rainbird, J. M., Bianchini, A., Balduzzi, F., Peiró, J., Graham, J. M. R., Ferrara, G., and Ferrari, L.: On the influence of virtual camber effect on airfoil polars for use in simulations of Darrieus wind turbines, Energ. Convers. Manage., 106, 373–384, https://doi.org/10.1016/j.enconman.2015.09.053, 2015. a
Rezaeiha, A., Kalkman, I., and Blocken, B.: CFD simulation of a vertical axis wind turbine operating at a moderate tip speed ratio: Guidelines for minimum domain size and azimuthal increment, Renew. Energ., 107, 373–385, https://doi.org/10.1016/J.RENENE.2017.02.006, 2017a. a, b
Rezaeiha, A., Kalkman, I., Montazeri, H., and Blocken, B.: Effect of the shaft on the aerodynamic performance of urban vertical axis wind turbines, Energ. Convers. Manage., 149, 616–630, https://doi.org/10.1016/J.ENCONMAN.2017.07.055, 2017b. a
Shamsoddin, S. and Porté-Agel, F.: Large eddy simulation of vertical axis wind turbine wakes, Energies, 7, 890–912, https://doi.org/10.3390/EN7020890, 2014. a
Shan, X., Yuan, X. F., and Chen, H.: Kinetic theory representation of hydrodynamics: A way beyond the Navier–Stokes equation, J. Fluid Mech., 550, 413–441, https://doi.org/10.1017/S0022112005008153, 2006. a
Shires, A.: Design optimisation of an offshore vertical axis wind turbine, Proceedings of Institution of Civil Engineers: Energy, 166, 7–18, https://doi.org/10.1680/ener.12.00007, 2013. a
Su, J., Chen, Y., Han, Z., Zhou, D., Bao, Y., and Zhao, Y.: Investigation of V-shaped blade for the performance improvement of vertical axis wind turbines, Appl. Energ., 260, 114326, https://doi.org/10.1016/J.APENERGY.2019.114326, 2020. a
Viterna, L. and Janetzke, D.: Theoretical and experimental power from large horizontal-axis wind turbines, NASA Technical Memorandum, OSTI.GOV, https://doi.org/10.2172/6763041, 1982. a
Weller, H. G., Tabor, G., Jasak, H., and Fureby, C.: A tensorial approach to computational continuum mechanics using object-oriented techniques, Comput. Phys., 12, 620–631, https://doi.org/10.1063/1.168744, 1998. a
XROTOR: X-ROTOR: X-shaped Radical Offshore wind Turbine for Overall cost of energy Reduction, https://cordis.europa.eu/project/id/101007135 (last access: 16 April 2023), 2020. a
- Abstract
- Introduction
- Methodology
- Results and discussions
- Conclusions
- Appendix A: Parametric definition of the blade geometry
- Appendix B: URANS CFD setup
- Appendix C: PowerFLOW setup
- Data availability
- Author contributions
- Competing interests
- Disclaimer
- Acknowledgements
- Financial support
- Review statement
- References