the Creative Commons Attribution 4.0 License.
the Creative Commons Attribution 4.0 License.
 | 14 Mar 2024
Quantifying the impact of modeling fidelity on different substructure concepts for floating offshore wind turbines – Part 1: Validation of the hydrodynamic module QBlade-Ocean
Robert Behrens de Luna
Sebastian Perez-Becker
Joseph Saverin
David Marten
Francesco Papi
Marie-Laure Ducasse
Félicien Bonnefoy
Alessandro Bianchini
Christian-Oliver Paschereit
To realize the projected increase in worldwide demand for floating offshore wind, numerical simulation tools must capture the relevant physics with a high level of detail while being numerically efficient. This allows engineers to have better designs based on more accurate predictions of the design driving loads, potentially enabling an economic breakthrough. The existing generation of offshore wind turbines is reaching a juncture, where traditional approaches, such as the blade element momentum theory, are becoming inadequate due to the increasing occurrence of substantial blade deflections. QBlade is a tool that includes a higher-fidelity aerodynamic model based on lifting-line theory, capable of accurately modeling such scenarios. In order to enable the simulation of offshore conditions in QBlade and to make use of this aerodynamic capability for novel offshore wind turbine designs, a hydrodynamic module called QBlade-Ocean was developed. In the present work, this module is validated and verified with two experimental campaigns and two state-of-the-art simulation frameworks on three distinct floating offshore wind turbine concepts. The results confirm the implementation work and fully verify QBlade as a tool to be applied in offshore wind turbine simulations. Moreover, a method aimed to improve the prediction of non-linear motions and loads under irregular wave excitation is analyzed in various conditions. This method results in a significant improvement in the surge and pitch degrees of freedom in irregular wave cases. Once wind loads are included, the method remains accurate in the pitch degree of freedom, while the improvements in the surge degree of freedom are reduced. A code-to-code comparison with the industry-designed Hexafloat concept highlights the coupled interactions on floating turbines that can lead to large differences in motion and load responses in otherwise identically behaving simulation frameworks.
- Article
(6451 KB) - Full-text XML
- Companion paper
- BibTeX
- EndNote


In recent years, wind turbine technology has seen a dynamic development, characterized by the continuous trend towards increasing tower heights and rotor sizes. This growth has challenged the modeling assumptions of current wind turbine simulation tools. The unfavorable square–cube law scaling (Burton et al., 2001, p. 329) that is characteristic of the scaling of blade lengths has already led to innovative slender blade designs which are notably more flexible (Veers et al., 2019). These developments have required wind turbine simulation tools to move on from the assumption of rigid components and include structural dynamics that enable the analysis of aeroelastic effects and its influence on loads and subsequently designs.
As a consequence, aerodynamic assumptions inherent to the blade element momentum (BEM) method require several corrections to make them viable for modern wind turbines (Perez-Becker et al., 2020; Li et al., 2022). An alternative approach could involve a shift towards physically more accurate models such as a lifting line coupled with a free vortex wake model. A shift towards higher-fidelity aerodynamic methods may be accelerated as wind turbines are placed further offshore, on floating structures that are excited by waves and currents, introducing additional complexity and requiring more accurate models within the wind turbine simulation tools. These capabilities are essential for economic evaluation and optimized engineering solutions of such systems.
To enable economically viable floating offshore wind turbines (FOWTs), simulation tools also require hydrodynamic capabilities to capture the coupled dynamics of aero-hydro-servo-elastic problems and solve the mooring system dynamics. The added degrees of freedom (DOFs) inherent to FOWTs may accelerate the change in how aerodynamic loads and wake aerodynamics are modeled in these increasingly complex scenarios. A floating turbine, unlike its fixed-bottom or land-based counter parts, may also interact with its own wake. Modeling this phenomenon accurately requires resolving the wake explicitly.
At present, FOWTs still rely to a large extent on the BEM method to calculate aerodynamic loads on a wind turbine. This method, while efficient, includes several simplifying assumptions that require empirical corrections. In particular, the rotor is assumed to behave like a planar actuator disk that extracts energy from the stream tube by causing a pressure drop when air flows through it. This assumption inherently omits the finite number of blades on a wind turbine. Moreover, it implies that rotor blades do not deflect outside the rotor plane. Additionally, the momentum theory breaks down for high induction factors, and uniform aerodynamic conditions across the rotor plane are assumed (Burton et al., 2001; Perez-Becker et al., 2020; Li et al., 2022). Given the shortcomings of this method and the empirical nature of its corrections, as detailed and explained by Perez-Becker et al. (2020), current BEM methods might not be sufficient in certain circumstances. Ramos‐García et al. (2022) analyzed the effects of floating motion on the aerodynamic loads predicted by a BEM and a lifting-line solver. The result of this study was that the BEM method can lead to an increased motion response of up 50 % at high wave frequencies. Moreover, it was shown that the BEM method notably underestimates thrust during large backwards oscillations, where the turbine interacts with its own wake.
One particular area in which BEM methods need to improve if they are to maintain their applicability in the future alongside other, more advanced methods is their modeling of dynamic inflow conditions (Jeon et al., 2014). In FOWT modeling in particular, dynamic inflow plays an important role due to the wave-induced motion of the floating structures. Vortex wake models do not have such shortcomings as the wake is modeled explicitly by the trailing and shed vorticity caused by spacial and temporal gradients in the blade-bound vortex. Hence, the wake develops over time and includes the transient effects that, e.g., pitch actuation or gusts have on the induction in the rotor plane (Mancini et al., 2023). The fact that the most recent release of the AeroDyn module (v15) (Murray et al., 2017) of the widely used code OpenFAST (Jonkman et al., 2019) includes a lifting-line aerodynamic method named OLAF (Shaler et al., 2020) may be seen as confirmation that higher-fidelity methods than BEM are a requirement for certain conditions. HAWC2 (Larsen and Hansen, 2007), another well-established state-of-the-art simulation framework, also features multiple aerodynamic solvers based on lifting-line theory.
Another relevant topic for the simulation of FOWTs, on which the community has focused in the past and which remains a major focus of research today, is the accurate prediction of hydrodynamic excitation and floater response below the linear wave excitation frequency range (Pegalajar Jurado and Bredmose, 2019; Gueydon et al., 2014; Azcona et al., 2019). Accurately capturing the excitation at these slow-drift frequencies is important because the natural frequencies of floating structures with catenary mooring systems typically lie below the linear frequency range, and resonance can occur. The current generation of simulation tools often underestimates this non-linear response, as is discussed in detail in the Offshore Code Comparison, Collaboration, Continued, with Correlation (OC5) project (Robertson et al., 2017). Their analysis shows that the inclusion of second-order difference frequency forces leads to a response at the accurate frequency. However, the response at these low frequencies is small compared to experimental results. In the OC6 project (Robertson, 2019), phases Ia and Ib aim for a better understanding of the cause of this underestimation. Robertson et al. (2020) and Souza do Carmo et al. (2020) indicate that the addition of linear damping coefficients during the tuning process is one reason. These coefficients are often added in mid-fidelity tools to better align the decaying behavior with an experimental reference. However, they lead to a restricted response during wave excitation. In addition, both argue that the excitation forces outside the linear wave frequency range are underpredicted. To address the underprediction of excitation forces, Li and Bachynski-Polić (2021) propose a method to tune the difference-frequency quadratic transfer function (QTF) based on the results of a high-fidelity computational fluid dynamics simulation. Another attempt to formulate a methodology that improves the prediction of the floater surge and pitch responses is given by Wang et al. (2022). They identified erroneous viscous excitation, a third-order effect, as the possible source for the underprediction at the natural frequency and suggest a varying treatment of the transversal drag of members close to the mean sea level and a frequency-dependent treatment of the axial drag on heave plates.
QBlade is a tool that includes a numerically optimized free wake method (Marten, 2020). With its hydrodynamic extension QBlade-Ocean, the tool gains the ability to model all required domains to simulate the dynamics of floating wind turbines. Thereby, QBlade addresses a need in the community to provide a numerically efficient code with more accurate aerodynamic and structural models in open access. The development work was carried out within the Horizon 2020 project (FLOATECH, 2020) and was identified as a key outcome. Additionally, to improve the accuracy of the non-linear motion response, the method proposed by Wang et al. (2022) is adopted in QBlade-Ocean, thus allowing an analysis of its improvement in the prediction of non-linear motion responses for two distinct floater types in varying conditions, including irregular wind and wave excitation.
The aim of this two-part study is to analyze the influence of higher-fidelity methods on design driving loads. Part 1 lays the groundwork by validating and verifying the development of QBlade-Ocean. This is done on three different floating offshore wind turbine designs. The designs of the floating substructures deviate strongly from each other regarding their stabilization concept, water plane area, and structural complexity. These characteristics require modeling approaches appropriate for each design and therefore allow for a verification of the various models that are combined to capture the full turbine response to environmental loading. The first FOWT model is the 5 MW Maritime Research Institute Netherlands (MARIN) stock wind turbine (MSWT) experimental turbine which is mounted on the DeepCwind substructure (Robertson, 2017) and was built and tested thoroughly within the OC5 code collaboration (Robertson et al., 2014). The second FOWT that is used for verification purposes is a spar-buoy-type platform on which the Softwind software-in-the-loop (SIL) experiments focused (Arnal, 2020). For both FOWTs, an OpenFAST model that serves as a comparison and a reference to analyze QBlade's results with respect to the experiment was built. The third and final model considered in this work is the Hexafloat concept designed by the company Saipem. This final part documents a code-to-code comparison between QBlade and the industrial software DeepLines WindTM (Principia, 2023). DeepLines WindTM was the main tool used during the design process of this substructure. This work is continued with Part 2 (Papi et al., 2023), which focuses on the analysis of the influence of increased model fidelity on design driving loads in an exhaustive number of simulations that represent more realistic met-ocean conditions.
In Sect. 2, QBlade and the other simulation tools are presented briefly. Section 3 introduces the models utilized throughout the verification process and highlights the modeling differences between the simulation tools. Section 4 shows the main results of this study, and the conclusions are drawn in Sect. 5, which is then followed by an outlook on the intended applications of the fully verified QBlade framework.
2.1 QBlade
QBlade is an openly available simulation tool developed to calculate wind turbine response in the time domain. It has been under development at Technische Universität Berlin (TUB) since 2010, where it started as a coupling between the open-source panel code XFOIL (Drela, 1989), the graphical user interface (GUI) XFLR5 (Deperrois, 2023), and an in-house-developed steady BEM solver. The code has been expanded in its capabilities ever since. Today, QBlade features two time domain aerodynamic solvers. The lower-fidelity one is a BEM method that makes use of a polar grid for the azimuthal discretization of the induction factors, following the approach laid out by Madsen et al. (2020). The higher-fidelity method, the lifting-line free vortex wake (LLFVW) solver, applies the Lagrangian vortex theory and follows the implementation of van Garrel (2003). The structural model used in QBlade relies on the finite element analysis (FEA) module of the PROJECTCHRONO multi-physics engine (Tasora et al., 2016). The application in QBlade is such that the structural model of the turbine consists of multiple body objects for the blades and the tower. Each body is modeled as an Euler–Bernoulli beam using a co-rotational formulation with a floating reference frame (Marten, 2020). The full FEA model of a wind turbine is generated by constraining the different bodies in a multi-body formulation. The aero-elastic coupling of the LLFVW and polar-BEM solvers with the structural solver has been validated against different aero-elastic couplings of the simulation tool HAWC2 by Behrens de Luna et al. (2022).
In the FLOATECH project, QBlade has been extended by a hydrodynamic module that expands its capabilities to offshore conditions. Moreover, the structural model was expanded so that arbitrary substructure geometries can be modeled. Thus, fixed-bottom and floating offshore wind turbines can be designed and analyzed in the simulation suite. More specifically, the hydrodynamic module features the following:
-
a wave generator with the capability to generate waves from several energy spectra but also read prescribed wave amplitude time series;
-
a hydrodynamic solver that calculates radiation damping forces, first-order excitation forces, and second-order excitation forces (sum and difference frequency) from pre-computed potential flow coefficients;
-
a Morison equation approach (Morison et al., 1950) to account for viscous drag, added mass, and Froude–Krylov forces for arbitrary geometries (Faltinsen, 1990);
-
an enhanced model, following the description of Wang et al. (2022), to improve the non-linear motion response under irregular wave excitation (described in detail below Sect. 3.4);
-
a soil model that captures the restoring forces with a distributed spring with non-linear coefficients.
Readers interested in detailed information about the implementation work of QBlade-Ocean are referred to Saverin et al. (2021) and the online documentation (QBlade Documentation, 2022).
2.2 OpenFAST
OpenFAST is a widely known open-source multi-physics simulation tool developed by the National Renewable Energy Laboratory (NREL) (Jonkman et al., 2019). OpenFAST builds on a highly modularized framework that couples modules from various physics disciplines with each other to model the behavior of a wind turbine and the environment around it. All OpenFAST results shown in this study were run with OpenFAST v3.0.0 and the BEM solvers implemented in versions 14 (Jonkman et al., 2023) and 15 (Murray et al., 2017) of the AeroDyn module (depending on the model). The Beddoes–Leishman dynamic stall model and the Øye dynamic wake effects were used. The ElastoDyn module (ElastoDyn, 2023) was utilized to resolve the structural dynamics, employing Euler–Bernoulli beam theory with prescribed modes that allow only edge- and flapwise bending of the blades and neglect blade torsion (Rinker et al., 2020). Moreover, the HydroDyn (HydroDyn, 2023) module is used to account for the interaction between the floater and marine environment. The mooring lines are modeled using MoorDyn (Wendt et al., 2016).
2.3 DeepLines WindTM
DeepLines WindTM (Principia, 2023) is a module of the commercial integrated software solution DeepLinesTM developed by Principia and IFP Energies Nouvelles. It is primarily known as a software solution to calculate in-place and installation analyses for offshore structures such as flexible risers, power cables, and mooring systems. The DeepLines WindTM module was developed in 2011 due to the increased market share of wind energy in the offshore environment and is now able to carry out fully coupled dynamic finite element analysis. Multiple BEM models are implemented and can be chosen from an external .dll library. Like QBlade, DeepLines WindTM can model horizontal- and vertical-axis wind turbines. Within this study, a dynamic inflow model was activated while no unsteady blade aerodynamics were applied. A validation study on DeepLines WindTM was carried out by Perdrizet et al. (2013).
This section briefly introduces the three simulation models used for the validation and verification of QBlade. First, the properties and characteristics of each of the three FOWTs are discussed together with their respective modeling approaches. Second, the areas where the three simulation suites differ from each other in the representation of the physics are highlighted and discussed regarding their possible influence on results. Third, the chosen test cases for validation and verification purposes are introduced. A more extensive description of the three QBlade model definitions can be found in Perez-Becker and Behrens de Luna (2022). Additionally, each turbine database is available on the Zenodo online platform. The corresponding DOIs are provided at the end of this work. To allow for a fair comparison with regard to experimental results (relevant for OC5 and Softwind), each numerical model was tuned independently to reproduce the natural system response of the reference. Details on this matter are specified by Perez-Becker et al. (2022). Figure 1 displays the three FOWT models with their mooring systems in still water. The locations of the load sensors consistently used in this work to validate and verify the mooring tensions are labeled in Fig. 2. For the Softwind model, the loads are exported at the delta connector of the mooring system.
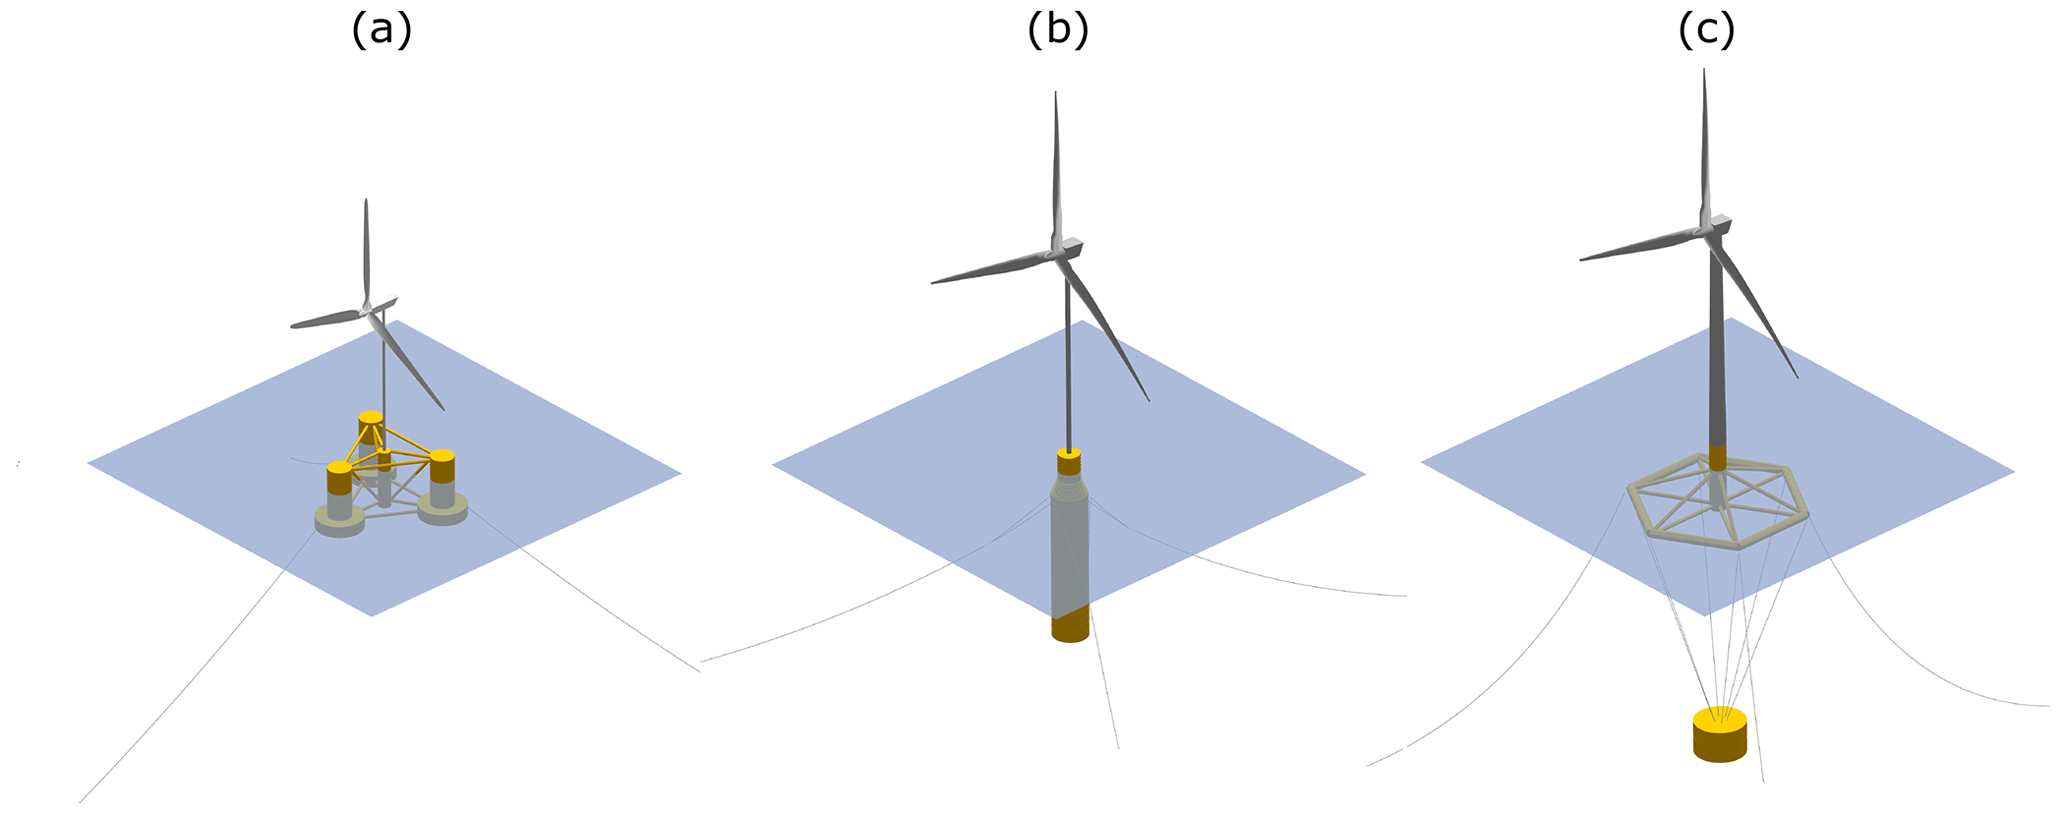
Figure 1Renders of the (a) OC5, (b) Softwind, and (c) Hexafloat models exported from the QBlade GUI.
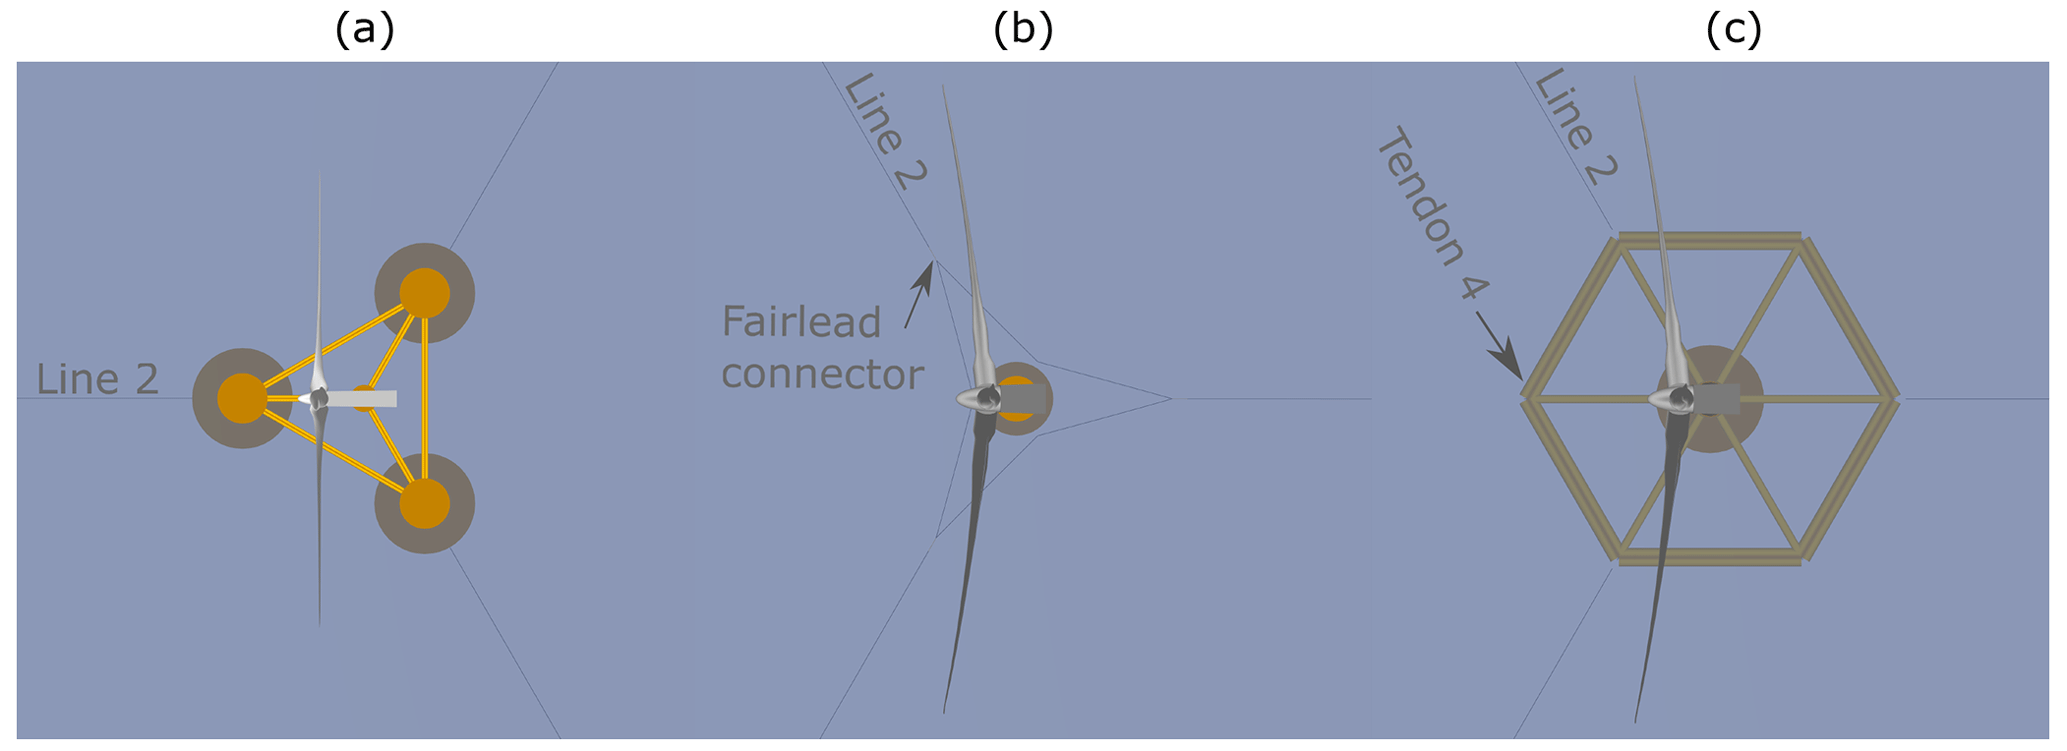
Figure 2Top view of the FOWT models. The incoming wind and wave propagation direction goes from left to right for all considered cases in this study. (a) OC5, (b) Softwind, and (c) Hexafloat.
3.1 OC5 model
The first model of a floating offshore wind turbine used for the verification and validation is the MARIN stock wind turbine mounted on the DeepCwind substructure, henceforth referred to as the OC5 model. This FOWT was thoroughly investigated within the Offshore Code Comparison, Collaboration, Continued, with Correlation (OC5) project (Robertson et al., 2014). The OC5 project was operated under the International Energy Agency Wind Task 30 and builds on previous code-to-code comparison efforts (OC3 and OC4). In the OC5 collaboration, a large number of participants applied various modeling tools with the goal to simulate test cases that were carried out experimentally and relate differences to certain modeling approaches. The experiments were carried out at the Maritime Research Institute Netherlands (MARIN) offshore wave basin. The model on which the experiments were conducted consists of the th scale model of the NREL 5 MW research wind turbine (RWT) turbine mounted on top of the floating semi-submersible substructure. The flexible tower is made out of two aluminum rods that are interconnected and matches the reference turbine's first fore–aft and side–side natural frequencies. The substructure, as mentioned before, is a three-pillar design semi-submersible known as the DeepCwind platform. It consists of a central column, on which the turbine is mounted, and three additional buoyancy-providing columns that connect to the central column through braces. The scaled platform is moored to the ground with three catenary mooring lines, one attached to each buoyancy column. The QBlade model of the OC5 platform can be seen in Fig. 1a. A more precise description of the FOWT is provided by Robertson et al. (2014). Similar to the approach undertaken in the OC5 project, the numerical models are formulated utilizing properties that have been upscaled to match the dimensions of the full-scale size. To compare the numerical results with the experimental ones, the latter are also scaled to a full-scale equivalent via Froude scaling. The OC5 model is particularly well suited for this study as simulation results from a wide variety of simulation codes are openly available for validation purposes, and, even more importantly, experimental data can serve as a reference, thus allowing for a full validation of QBlade. A comprehensive analysis of the OC5 results is provided by Robertson et al. (2017). Moreover, an equivalent model was built in OpenFAST in order to have full oversight of the subtleties of the model and to have the ability to compare test cases not considered in the OC5 collaboration.
3.1.1 OC5 model – turbine modeling choices
The rotor blades of the model-scale NREL 5 MW turbine predominantly consist of MARIN-modified Drela AG04 airfoil sections. The modification was made to reproduce the scaled thrust and torque loads of the reference turbine in a low-Reynolds-number environment. The three most inner stations, which amount to roughly 13 % of the radius, are blended with a cylindrical airfoil. Due to the minor influence of the root region on aerodynamic performance, the lift coefficient of the inner stations is neglected, and an angle-of-attack-independent drag coefficient of 0.5 is assigned. Due to the favorable scaling of the structural properties towards full scale, the blades are assumed to be rigid. These choices are in line with the description found in Goupee et al. (2015), where additional information on the MSWT blade, such as chord and twist distribution as well as the modified polars, may be found. In both QBlade and OpenFAST, the Øye dynamic stall and the tower shadow models are activated. A tower drag coefficient of 0.5 was used.
3.1.2 OC5 model – substructure modeling choices
The popularity of the DeepCwind substructure within the research community has led to the open availability of hydrodynamic coefficient files that were generated with the boundary element solver WAMIT (WAMIT Inc., 2024). This enables a hydrodynamic treatment that relies on solving the diffraction and radiation problems as well as the calculation of non-linear excitation forces through fully populated sum and difference quadratic transfer functions (Faltinsen, 1990). To account for viscous forces, non-linear drag is resolved via application of Morison drag applied to strip theory, where drag coefficients are assigned to the cylindrical elements. Henceforth, this combination is referred to as the potential flow plus Morison drag (PFMD) approach. The required input files for radiation damping, excitation, and second-order wave forces are adopted from the OpenFAST GitHub repository (Jonkman et al., 2019) and are used in the respective OpenFAST and QBlade models.
3.2 Softwind model
Instead of deploying a scaled experimental wind turbine that includes a rotor-nacelle assembly (RNA), as was done in the OC5 campaign, the Softwind experiments rely on a software-in-the-loop setup to capture the fully coupled dynamics of a FOWT. The campaign was carried out at the Research Laboratory in Hydrodynamics, Energetics and Atmospheric Environment department of the École Centrale de Nantes. The SIL setup includes a digital twin of the Softwind FOWT that runs parallel to the experiment and gets information, such as floater displacements and velocities, as an input. The aerodynamics are subsequently solved in the numerical code (OpenFAST), which calculates the rotor's power and thrust force. This information is communicated to a Schübeler high static thrust (HST) thruster sitting atop the tower (Arnal, 2020), which applies the thrust force of the turbine rotor with close to no time lag. The FOWT model is scaled to a th scale, and the turbine is based on the DTU 10 MW RWT (Bak et al., 2013) design, appropriately scaled. Accordingly, the RNA mass distribution aligns with the reference wind turbine. Similarly, the tower properties were scaled down from the DTU 10 MW RWT to match the natural frequency of the first fore–aft and side–side modes, the amplitude of deformation, and the mode shape. The substructure is a spar-type foundation which was dimensioned based on existing geometries such as the OC3 Hywind platform (Jonkman, 2010). Finally, the mooring system has been designed with three catenary lines that split up into two lines just before the substructure to form a delta connection for increased yaw stability (see Fig. 2b). The SIL setup and the Softwind model are described more precisely by Arnal (2020). Figure 1b displays the QBlade model of the Softwind FOWT. Throughout the following sections, this FOWT is referred to as the Softwind model.
3.2.1 Softwind model – turbine modeling choices
As mentioned previously, the rotor of the turbine is, due to the SIL approach, modeled numerically in the experiment as well. Hence, there is no need for re-adjusting the airfoil polars towards a low-Reynolds-number environment. Therefore, the blade definition, along with the airfoil characteristics as outlined in Bak et al. (2013), is utilized to set up the turbine models in QBlade and OpenFAST, respectively. In contrast to the OC5 model, this includes the structural definition of the blades and the tower. Both are assumed to be flexible bodies. For servo dynamics, the DTU baseline controller (Hansen and Henriksen, 2013) with the corresponding parameters was selected for this turbine. It should be pointed out that the SIL setup included the AeroDyn v14 (Jonkman et al., 2023) module. Hence, the OpenFAST calculations for this turbine also deploy the AeroDyn v14 module.
3.2.2 Softwind model – substructure modeling choices
The hydrodynamic loads on the spar-type substructure are modeled with the PFMD approach with first-order forces relying on potential flow theory. Even though second-order forces are generally small in relation to first-order forces on spar-buoy-type platforms, they can cause notable excitation at the resonant natural frequencies of the platform (Roald et al., 2013). For this platform, only the main diagonal terms of the difference-frequency QTF were available. This in turn yields the opportunity to verify the implementation of Newman's approximation of the slowly varying drift forces (Newman, 1974) within QBlade against experimental results. Viscous forces are modeled through the application of Morison drag coefficients to the cylindrical elements of the spar. The potential flow coefficients were calculated in a previous step in the open-source software NEMOH (Kurnia and Ducrozet, 2023; Babarit and Delhommeau, 2015) and converted into the WAMIT format.
3.3 Hexafloat model
The Hexafloat concept has been designed by the company Saipem to provide a cost-efficient substructure with favorable hydrodynamic characteristics. It consists of a hexagonally shaped structure composed of cylindrical members. Twelve braces extend from the six corners inwards, two per corner with varying angles, and converge in a single column. This column is the only member that breaks the water surface in a neutral position, and it connects to the tower of the turbine coaxially. The stability of the platform is provided by a counterweight that connects with six tendons to the corners of the hexagonal structure. The QBlade model of the Hexafloat model is displayed in Fig. 1c. Through this design, the benefits of a shallow draft are merged with the characteristics of a spar-type floater, including a small water plane area and gravity stabilization. The turbine atop the floater is the DTU 10 MW RWT and equals the definition provided by Bak et al. (2013).
3.3.1 Hexafloat model – substructure modeling choices
The Hexafloat structure is modeled with a full-Morison strip theory approach. Accordingly, added mass forces, drag forces, and the Froude–Krylov forces are all resolved in an implicit manner using empirical added mass and drag coefficients for the cylindrical elements. This treatment implies that no linear damping is inherent to the system. Diffraction forces are modeled by the application of the MacCamy–Fuchs correction, and non-linear hydrodynamic excitation is captured, to some extent, by the application of the hydrodynamic loads at the instantaneous position of the floating structure and by using kinematic wave stretching (Robertson et al., 2017).
3.4 Treatment of non-linear excitation
Non-linear excitation is modeled with the approach proposed by Wang et al. (2022). In this approach, the transversal drag coefficients of the substructure members are treated as depth dependent. Hence, to improve the response within the surge DOF, the transversal drag coefficient of the members near sea level (until –4 m below sea level) is increased to . The reason for this is that there is a greater effective drag near the surface (Clement, 2021). In addition, the extrapolation stretching method is applied since this method leads to larger wave-induced velocities near the water surface (Fig. A1 demonstrates the impact of stretching methods on the non-linear response). To improve the response within the pitch DOF, Wang et al. (2022) suggest focusing on the axial drag of the heave plates. They argue that the Morison drag for hybrid members (PFMD treatment) should only be applied on the face of the heave plates that experience negative flow. The reason is that only the flow separation phenomenon is not already accounted for in the potential flow solution. Furthermore, it is argued that one single drag coefficient for heave plates cannot satisfy the appropriate damping and excitation requirements in both the heave DOFs and the pitch DOFs. Flow separation is largely caused by the higher-frequency flow in the heave mode and not by the lower-frequency pitch mode; i.e., the viscous drag influencing the pitch DOF should be lower. This, however, as pointed out by Böhm et al. (2020), leads to a trade-off between an accurate non-linear response in heave and pitch. The proposed approach by Wang et al. (2022) is to high-pass filter the normal velocity at the heave plate faces and to compute the resulting axial drag force applied through the Morison equation with the following:
In this weighted sum, α is the scaling factor between the axial drag force calculated with the unfiltered and filtered velocities FDax and FDax,f. To filter the velocity components, a simple first-order high-pass filter is recommended to prevent phase shift effects. With α=0.5 and fc=0.07 Hz, Wang et al. (2022) weigh both terms equally and use a cutoff frequency that is towards the lower end of the linear wave frequency with good results.
The implementation of the method proposed by Wang et al. (2022) in QBlade-Ocean required different parameter settings in order to achieve good agreement with the experimental results for the test cases considered in this work. In the case of the OC5 model, the near-surface transversal drag coefficients had to be increased to 1 to match the non-linear surge response of the experiment. For the corresponding response in pitch, a weight factor α=0.2 and a cutoff frequency fc=0.04 Hz were required together with an axial drag coefficient of 2 on the heave plates. A parameter study showing the influence of the respective parameters on the non-linear heave and pitch motion peaks and an exemplary velocity time signal with the applied filter is provided in the Appendix (see Figs. A2 and A3) to provide some guidance for researchers looking to implement or fine-tune such an approach. Despite high-pass filtering the axial velocity components, additional damping was required in the heave DOF to prevent overestimation in the heave response. In addition, the approach was tested on the Softwind model in order to gain information on its efficacy for spar-type platforms. For this model, the near-surface transversal drag coefficient is increased from previously to . Due to the lack of heave plates on this structure, the approach making use of Eq. (1) is not applied.
3.5 Modeling approaches and test cases
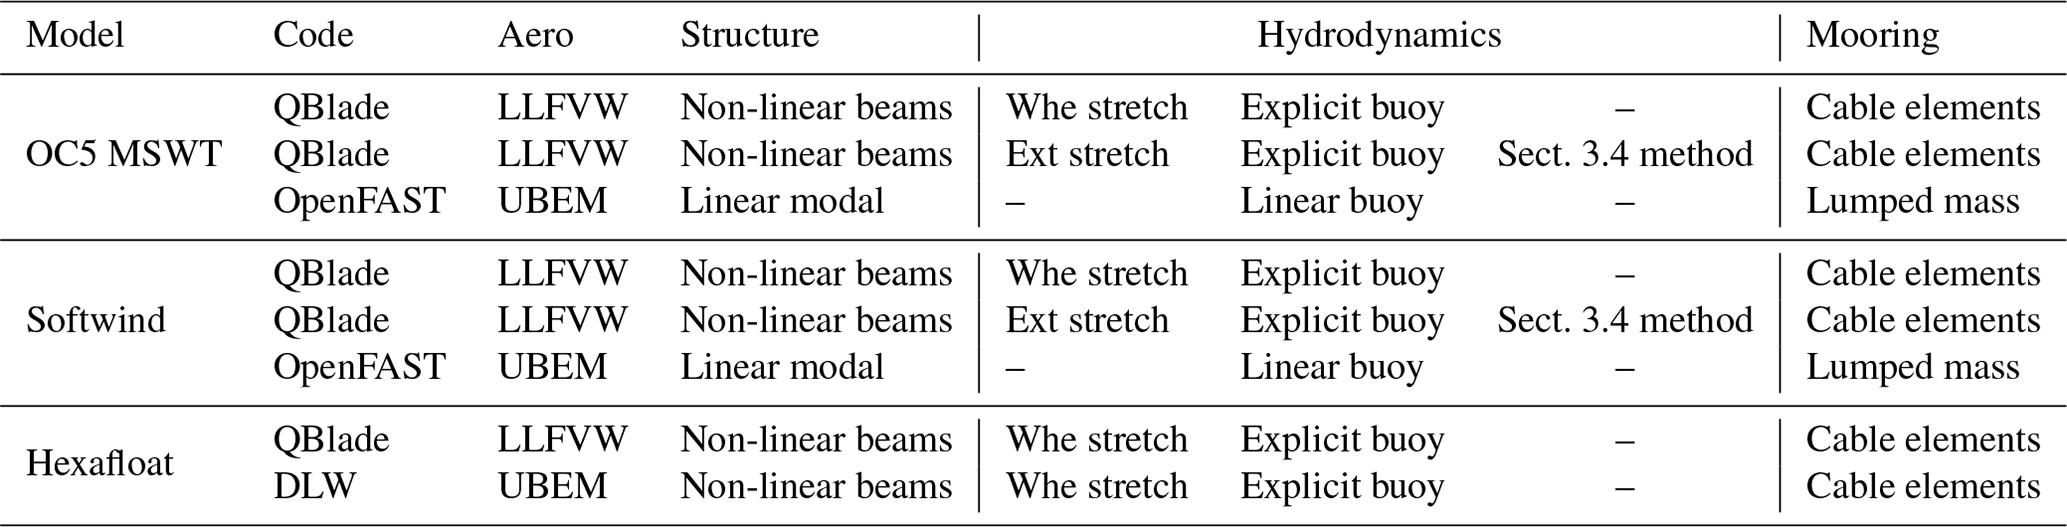
Even though QBlade, OpenFAST, and DeepLines WindTM are simulation frameworks with similar capabilities on a broader scale, decisions made by the developers regarding the representation of specific physical problems (such as wake induction) can cause smaller-scale deviations. In a fully coupled, non-linear system like a FOWT, these deviations may affect overall system dynamics and result in growing deviations throughout the runtime of a full simulation. To help interpret differences in the results between the compared simulation codes, it is important to discuss these modules and their distinctions. Therefore, an overview of the main differences between the three simulation codes is given in the following.
Table 1 summarizes the modeling capabilities of the main physical models of each tool. It can be seen that distinctions are present in various modeling approaches: QBlade deviates from both of the other codes with its LLFVW method compared to the lower-fidelity unsteady BEM approach. Structurally, OpenFAST deviates in the formulation with its ElastoDyn model, which uses a linear modal representation of the blades and the tower, which requires the user to provide previously generated mode shapes. QBlade and DeepLines WindTM both use a non-linear beam FEA representation to model the structure of the blades and the tower. Hydrodynamically, the OpenFAST version used (v3.0.0) lacks the kinematic stretching option available in QBlade and DeepLines WindTM. OpenFAST furthermore relies on linear hydrostatics, whereas both of the other tools explicitly compute the buoyancy and restoring forces caused by the displaced water mass through the submerged volume. Additionally, the formulation described in Sect. 3.4 to capture non-linear excitation was used in a separate QBlade model (referred to as the enhanced model in the following). Finally, the mooring dynamics are resolved explicitly in each of the three tools; however only QBlade and DeepLines WindTM employ FEA cable elements, while OpenFAST follows a lumped-mass approach. Readers interested in greater detail in the modeling formulations are referred to Marten (2020) and QBlade Documentation (2022) for QBlade, Jonkman and Buhl (2005) and OpenFAST Documentation (2023) for OpenFAST, and Perdrizet et al. (2013) for DeepLines WindTM.
Table 1Key differences between the simulation frameworks regarding the respective model.
The authors acknowledge that OpenFAST includes the OLAF solver in its newest AeroDyn v15 release. OLAF is a higher-fidelity lifting-line solver for aerodynamics similar to the one implemented in QBlade (Shaler et al., 2020). Moreover, OpenFAST includes the BeamDyn structural model that allows for the computation of full geometric non-linearity and large deflections of the blades due to its exact beam theory formulation. The application of both modules was not included in this study. The number of simulations for the different turbine designs was large, and the simulations were performed on desktop workstations. Using OLAF and BeamDyn for the OpenFAST calculations would have rendered an unacceptably long evaluation time for these simulations. Finally, NREL released OpenFAST v3.5.0, which includes kinematic wave stretching and explicit buoyancy calculation features, after the underlying simulations for this study were completed.
This section presents the main results of the validation test cases. They are intended to validate individual components and models that influence the FOWT dynamics in isolation. Once this initial validation is achieved, the study will move to more complex test cases where all components interact simultaneously. Although not identical, due to the constraint of resembling the experiments, the set of test cases follows a similar approach for each FOWT model:
-
static cases for assessment of the isolated mooring loads;
-
system properties, including decay cases in still conditions for assessment of the natural system properties;
-
aerodynamic loads, including wind-only cases with a fixed floater for assessment of the isolated aerodynamic loads;
-
hydrodynamic loads, including wave-only excitation cases (regular and irregular) for assessment of the isolated hydrodynamics;
-
combined aero- and hydrodynamic wind and wave cases for assessment of the combined aero-hydro-servo-elastic dynamics.
Following this procedure, the results of all three models are discussed and presented for one set of cases before moving to the next set. The respective test cases are defined in the tables at the beginning of the associated subsections.
4.1 Static displacement
The static displacement test case aims to confirm the static loads caused by the restoring forces of the mooring system which result from displacement of the FOWT model from its neutral position. In the presented case, the substructure is traversed from positive towards negative surge and sway positions. A close alignment of the results, with both the experiment and the other simulation codes, verifies a proper definition of the mooring properties and, subsequently, the static loads calculated by the mooring model of QBlade.
The static displacement tests were only performed for the OC5 model, since experimental data of these tests were readily available. The mooring tensions on the other models were confirmed in still conditions at the neutral position. The analyzed load sensors are located at the fairlead positions. For easier visualization, the fairlead tensions are cumulated to one value in the global surge and sway DOFs and displayed over the displacement direction. Figure 3 shows the results from the OC5 model. The excellent agreement that is displayed by both QBlade and OpenFAST with the experiment, even under significant displacements, allows for the conclusion of a correctly defined mooring system and reliable load estimates of QBlade's mooring model in static conditions.
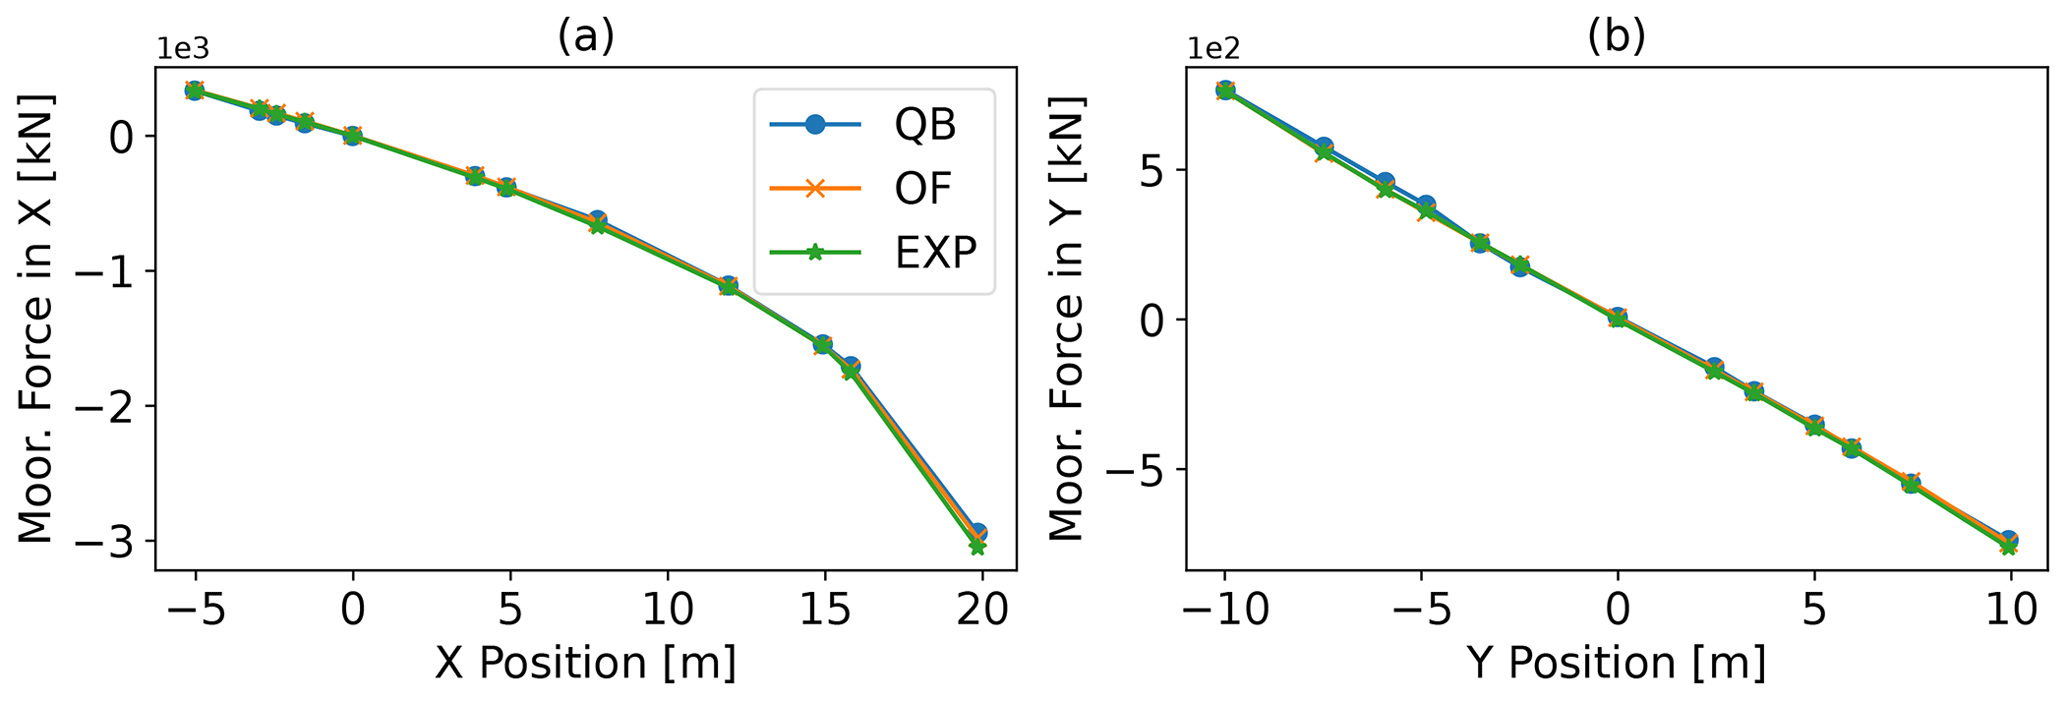
Figure 3Cumulated fairlead tensions on the OC5 model obtained from static displacement tests in surge (a) and sway (b). Positive x values indicate a displacement in the downwind direction.
4.2 System properties – decay tests
The dynamic response of a FOWT when it is displaced from its neutral position is affected by several factors, such as system mass and inertia, center of gravity position, and restoring forces and moments originating from the mooring system and buoyancy. Such decay tests determine the natural frequency and damping of the eigenmodes for the different degrees of freedom. Thereby, these tests are very useful for confirming a correct model setup and give the opportunity to improve alignment of the numerical models with a reference through additional tuning. This subsection presents and discusses the results extracted from the decay time series of the three FOWT models. The time series and damping characteristics are provided by Perez-Becker and Behrens de Luna (2022) and Perez-Becker et al. (2022).
Table 2Natural frequencies in hertz extracted from the dominant degrees of freedom of each decay time series.
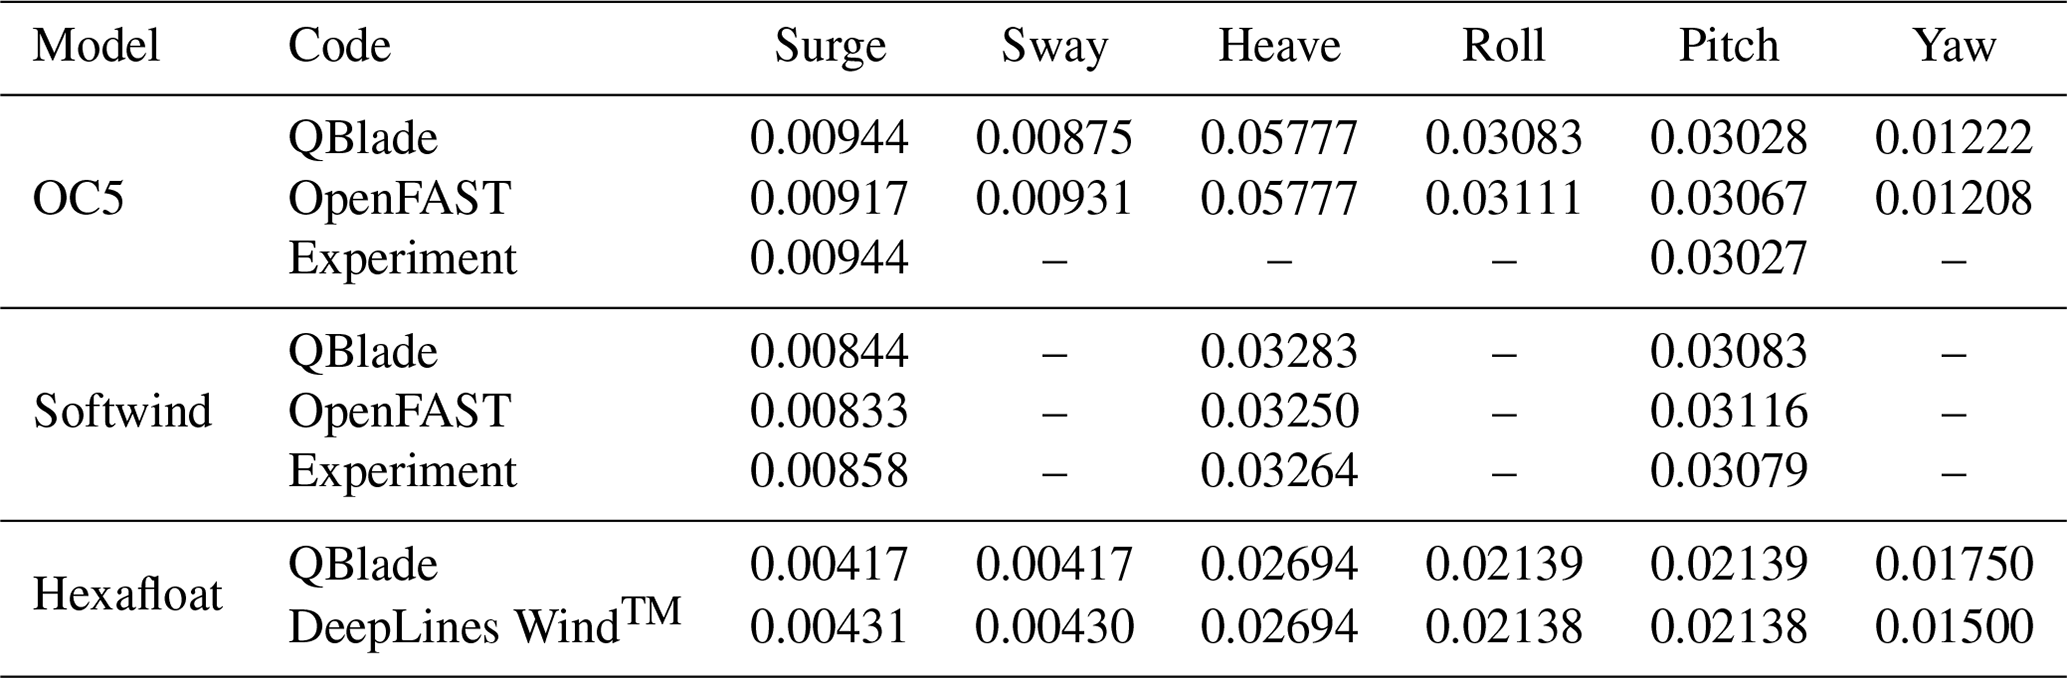
Table 2 shows the natural frequencies as they are extracted from the time series of the decay test for the three FOWT models. The blank spaces indicate that no results of the corresponding test were obtainable. By and large, very good alignment between the numerical codes and, where available, the experiments has been achieved. Minor deviations can be pointed out for (i) the OC5 model, where OpenFAST deviates with a lower surge natural frequency compared to QBlade and the experiment, and (ii) the Softwind model, where the same observation also applies. In both instances, attention has been paid to corresponding masses and inertias between the models. Moreover, the added mass coefficients are adopted from the WAMIT output files. Hence, a possible cause for the small discrepancy could lie in the dynamics predicted by the mooring system, even though in steady conditions very good alignment is observed in Fig. 3. As noted in Table 1, OpenFAST relies on a simplified lumped-mass approach that neglects bending stiffness (Hall and Goupee, 2015). QBlade-Ocean instead models the lines as cable elements with the absolute nodal coordinate transformation in Chrono (QBlade Documentation, 2022), which is a non-linear finite element formulation that includes bending, torsion, and shear deformation.
4.3 Aerodynamic loads
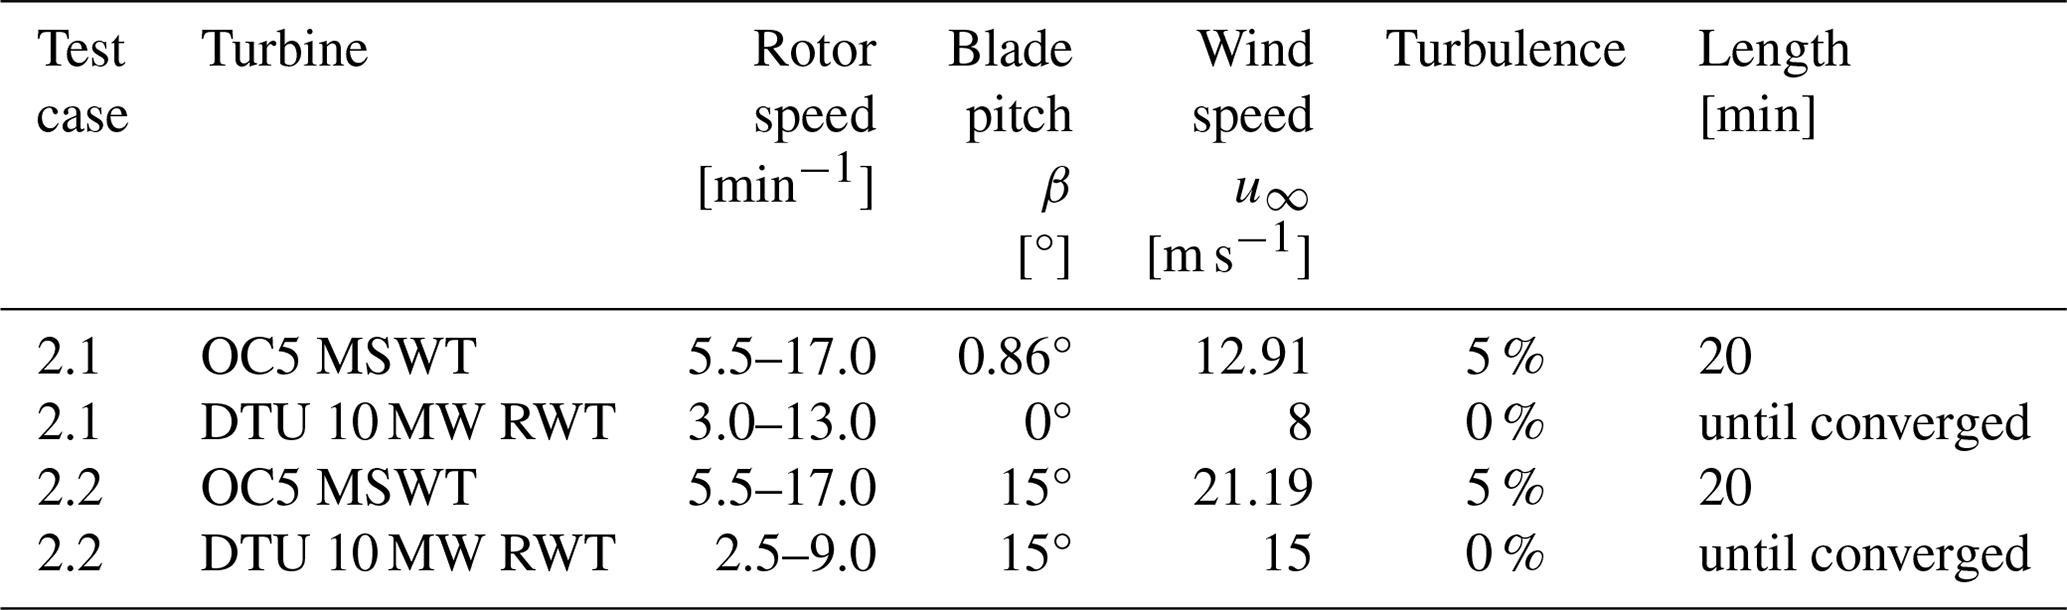
The next set of test cases considered in this study focuses on isolated aerodynamic excitation. Aerodynamic loads affect the dynamics of FOWTs through changes in rotor thrust. This can lead to strong excitation in the substructure surge and pitch DOFs. The test cases follow the setup defined in the first two aerodynamic cases of the OC5 phase II collaboration (Robertson et al., 2014) to be able to compare it to the experimental reference model. This was done for two different rotors: the one used in the OC5 experiment and the DTU 10 MW RWT rotor, used on the Softwind and Hexafloat models, respectively. For the OC5 model, two rotor characteristic curves are recorded with a rotor speed sweep over the same wind field, one representing close to rated and the other one above-rated conditions of the OC5 turbine model. Meanwhile, the substructure is constrained at its neutral position and hence does not respond dynamically to the excitation. The second rotor that was tested is the one from the DTU 10 MW RWT. The Softwind experiment, following a SIL setup, applies the aerodynamic loads that are calculated in real time along the experiment by AeroDyn v14. Accordingly, a verification with OpenFAST using AeroDyn v14 assures alignment with the experiment. To isolate aerodynamic loads, the comparison was carried out on a simplified geometry of the DTU 10 MW turbine that has a rigid tower, no shaft tilt, and also no coning angle. The shape of the blades and their flexibility were not modified. The aerodynamic thruster installed in the SIL experiments only applies the thrust force at a single point on top of the tower. Hence, for this turbine, the thrust coefficient was the main point in the comparison. In each software package, the thrust force applied on the rotor shaft was used to calculate the thrust coefficient. A description of the test cases can be found in Table 3.
Table 3Description of test cases 2.1 and 2.2. Isolated aerodynamic excitation with a constrained substructure at its neutral position.
The average value for Cp and Ct for each rotor speed of the OC5 turbine sweep is displayed in Fig. 4. The reference results that are displayed stem from the study of Goupee et al. (2015), in which the polars of an OpenFAST model were calibrated to resemble the aerodynamic behavior of the OC5 turbine. Two curves can be seen for each coefficient. Test case 2.1 ranges from a tip speed ratio (TSR) of 2.8 up to close to 9 and represents a rotor speed sweep at constant, close to rated wind speed with a 0.89° blade pitch angle. Test case 2.2 ranges from a TSR of 1.7 up to 5.3 at wind speeds representing an above-rated condition. Focusing on the power coefficient first, little deviation between both numerical tools is visible, even though different aerodynamic models are deployed. Bearing in mind that the blades of the OC5 turbine are modeled as rigid structures and are almost perfectly straight, the planar rotor assumption underlying the BEM method is not violated. Hence, good alignment is to be expected. Small deviations from the experiment are visible above a TSR of 6.5, which is in alignment with Goupee et al. (2015). According to them, this is a side effect probably caused by the primary objective during the polar tuning process, which was carried out with the objective to match the experiment's thrust behavior. The turbine's operating point during the experiment will be just below TSR 6, where good agreement is present between both the codes and the experiment. The thrust coefficient shows excellent agreement between QBlade, OpenFAST, and the experiment.
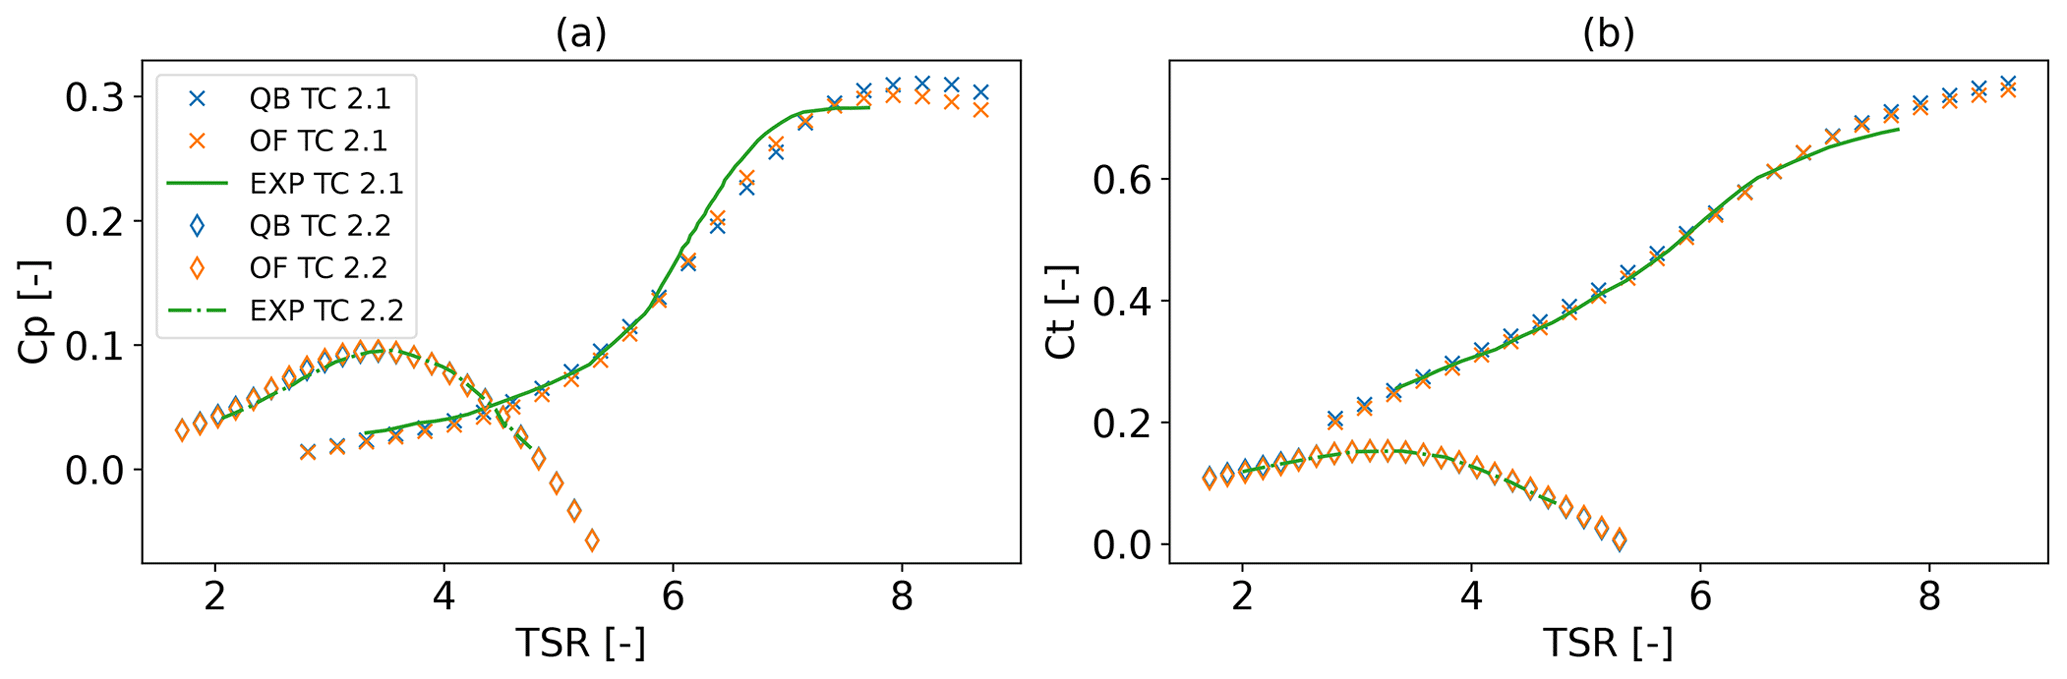
Figure 4OC5 turbine power (a) and thrust (b) coefficients for test case 2.1 (β=0.86°, u∞=12.91 m s−1) and test case 2.2 (β=15°, u∞=21.19 m s−1).
Figure 5 shows the thrust coefficient of the DTU 10 MW RWT for two rotor speed sweeps at a just-below-rated condition (test case 2.1, Fig. 5a) and well above (test case 2.2, Fig. 5b). Inspecting the below-rated case first, it can be seen that for lower TSRs, close agreement between the numerical codes exists. In the region above a TSR of 10, which is representative of cut-in and below-rated conditions, DeepLines WindTM shows increasing deviation from OpenFAST and QBlade. The latter two continue to show good agreement in that region. In rated and below-rated conditions (TSR = 8), excellent agreement is present between all codes. In the second sweep, where blades are collectively pitched to 15° and above-rated wind speeds are present, DeepLines WindTM underpredicts thrust compared to QBlade and OpenFAST in the TSR range between 3 and 5. Below this region, good agreement is achieved. The conditions analyzed later in this paper will resemble states at a TSR approximately equal to 8 in test case 2.1 and a TSR equal to 6 in test case 2.2. In both, acceptable agreement is found in steady conditions.
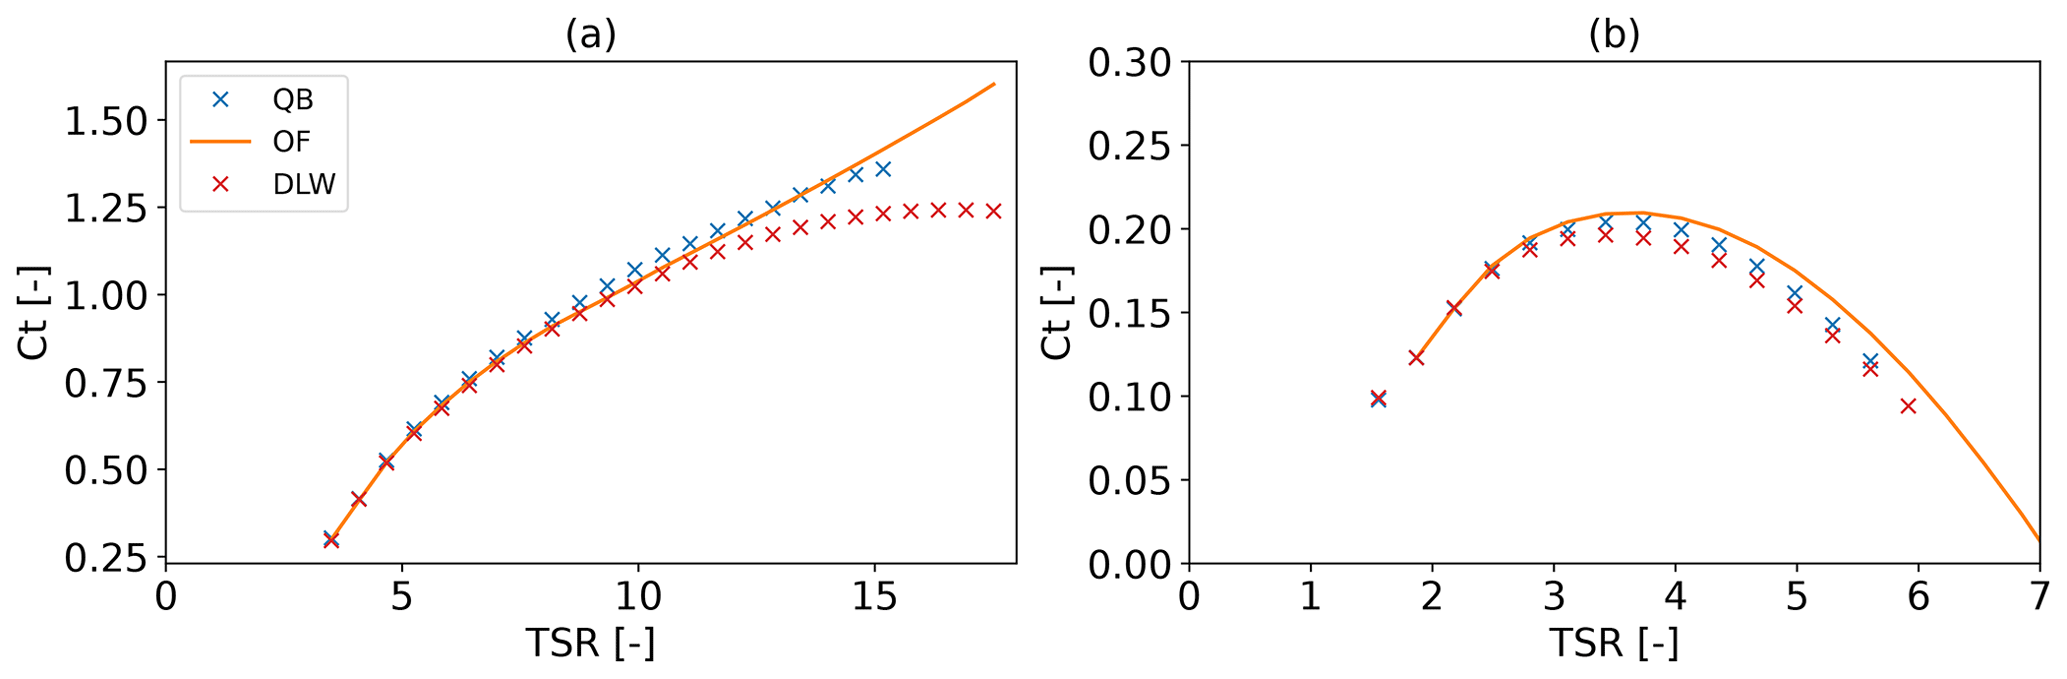
Figure 5DTU 10 MW RWT thrust coefficients for test case 2.1 (a) (β=0°, u∞=8.0 m s−1) and test case 2.2 (b) (β=15°, u∞=15.0 m s−1).
4.4 Hydrodynamic loads
The isolated hydrodynamic (wave-only) test cases considered in the following amount to one regular wave and one irregular wave case for each of the models. After the confirmation of the mooring loads and the decaying behavior (see Sect. 4.1 and 4.2), the excitation by solely waves without considering aerodynamic effects allows for the validation of the hydrodynamic loads computed by QBlade. Thanks to the distinct nature of the hydrodynamic modeling characteristics of the three models, i.e., PFMD for OC5 and Softwind and full Morison for Hexafloat, the implementation of hydrodynamic theory in QBlade can be validated in a general sense. When using the PFMD approach in regular wave test cases, the first-order excitation forces calculated via excitation force coefficients drive the floater response. In the full-Morison case, the wave excitation is captured by the instantaneous wave elevation (Froude–Krylov force) combined with diffraction effects captured with the MacCamy–Fuchs correction. As viscous effects are represented through the inclusion of the drag term in the Morison equation in both approaches, additional damping and excitation effects are captured through drag forces (Lemmer et al., 2018). This effect is significant for models with structural members close to mean sea level. In an irregular wave field, the floater response to the linear wave excitation spectrum is validated. In this subsection, the linear response along with non-linear excitation due to slowly varying drift forces is validated on the OC5 and Softwind models. In addition, an analysis of the efficacy of the enhanced model in capturing non-linear excitation that is implemented in QBlade can be compared to the conventional approaches for both FOWTs. Furthermore, the application of hydrodynamic loads at the instantaneous position (Hexafloat) can be validated. A detailed description of the test cases can be found in Table 4.
Table 4Description of test cases 3.1 and 3.2. Hydrodynamic excitation applied to the free-floating substructure without aerodynamic loads.
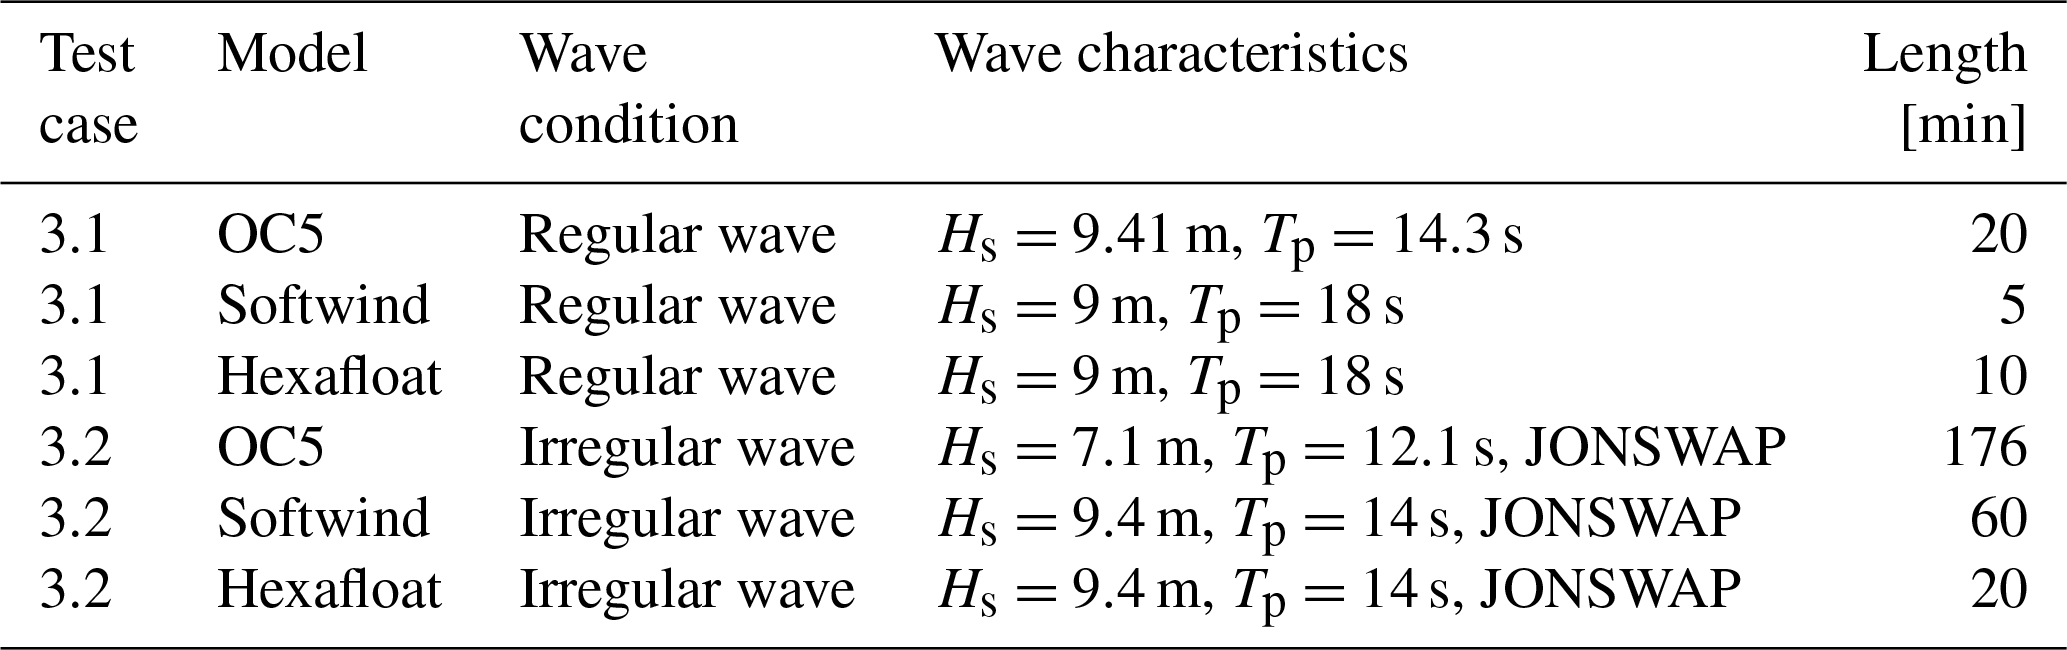
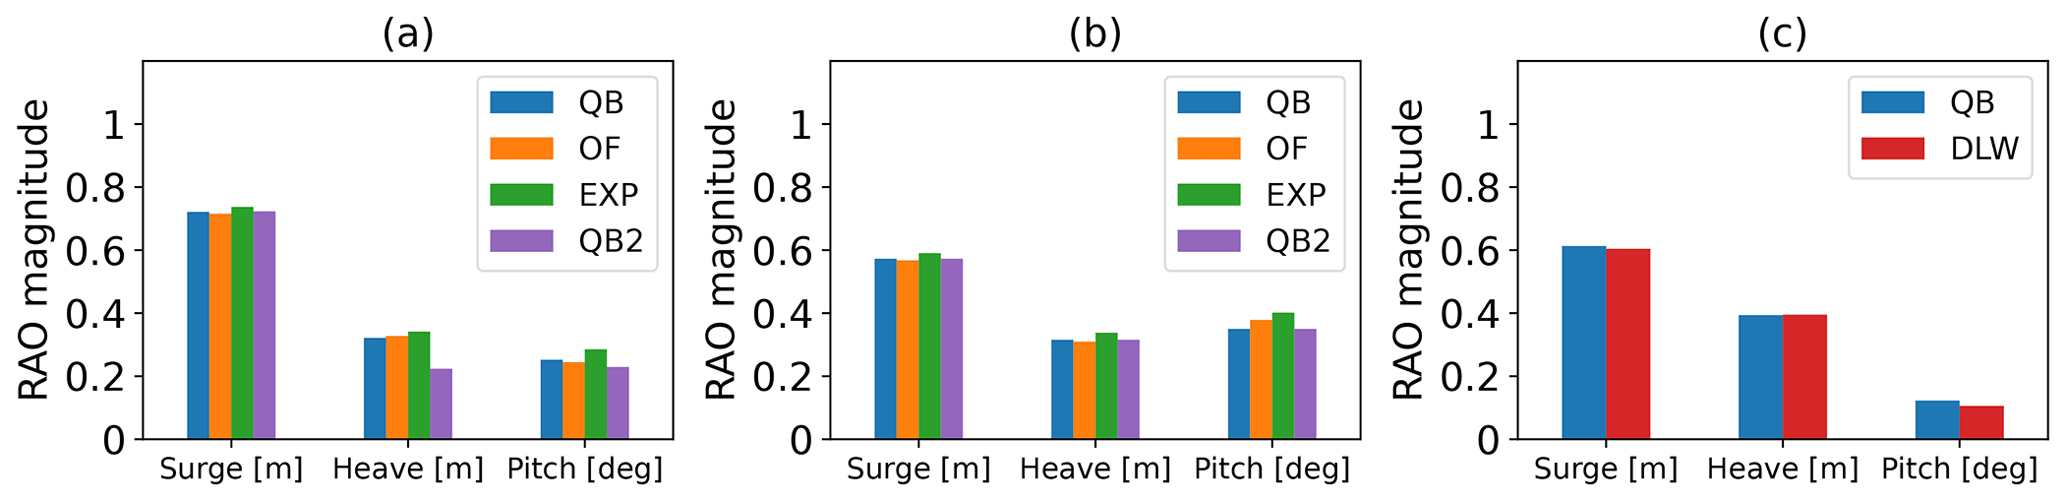
Figure 6RAOs extracted from the time series corresponding to TC 3.1 for the (a) OC5, (b) Softwind, and (c) Hexafloat models.
4.4.1 Regular wave excitation
Figure 6 displays the response amplitude operators (RAOs) of the OC5, Softwind, and Hexafloat FOWTs in the three mainly excited motion DOFs. The RAO provides a quantitative value of the FOWT's response under regular wave excitation. It can be understood as a transfer function that quantifies the motion response for a given excitation. As is done by Robertson et al. (2017), the RAO is defined as the ratio of the amplitude of the rigid-body motion to the amplitude of the wave frequency. RAOs are effective at validating the linear-wave-induced excitation of the model, which is the objective of this section. Across the three models, excellent agreement is present. QBlade demonstrates good agreement with the experiments and OpenFAST in the case of the OC5 and Softwind platforms (Fig. 6a and b). When compared to the large database from the OC5 collaboration, QBlade falls in line with the superior-performing simulation codes (Robertson et al., 2017). For the Hexafloat model, good agreement with DeepLines WindTM is found (Fig. 6c). The modification of the near-sea-level transversal drag coefficient in the enhanced model has a negligible influence on the surge and pitch RAOs for OC5 and Softwind. However, in the heave DOF there is a noticeable reduction in the corresponding RAO. Both the decreased axial drag on the heave plates and the additionally imposed linear damping affect this only to a minor degree. The driving cause of the discrepancy is the weighted sum displayed in Eq. (1) that now applies the high-pass filter to the local velocities present at the heave plates and weights the corresponding axial drag with 80 % in the present model. With a wave frequency of 0.07 Hz in the OC5 test case 3.1, it lies above the cutoff frequency.
Because floating offshore wind turbines are coupled systems, non-linear responses may occur even under regular wave excitation, especially since we compare them to experimental setups that can only approximate an ideal regular wave with only a single frequency component. Hence, in addition to the RAOs, the analysis of several load sensor time series can provide additional information. In Fig. 7, the time series corresponding to the tower top force and the tower base moment (fore–aft) of the OC5 model are shown along with the fairlead tension. Interestingly, the tower-related sensors show a reduced amplitude at the main wave frequency in QBlade and OpenFAST compared to the experimental results. In contrast, the enhanced model (indicated with QB2) with modified treatment of the heave plate viscous drag shows better alignment with the experiment. Moreover, the tower force and moment in the fore–aft direction show a more irregular pattern compared to the fairlead tensions. A plausible explanation could be the existence of multiple wave components (e.g., through reflection) in the experiment, which result in a wave field that includes additional wave components into the dominant wave frequency that excite the tower modes. This phenomenon is only captured by numerical codes when the wave elevation time series of the experiment is used as a direct input.
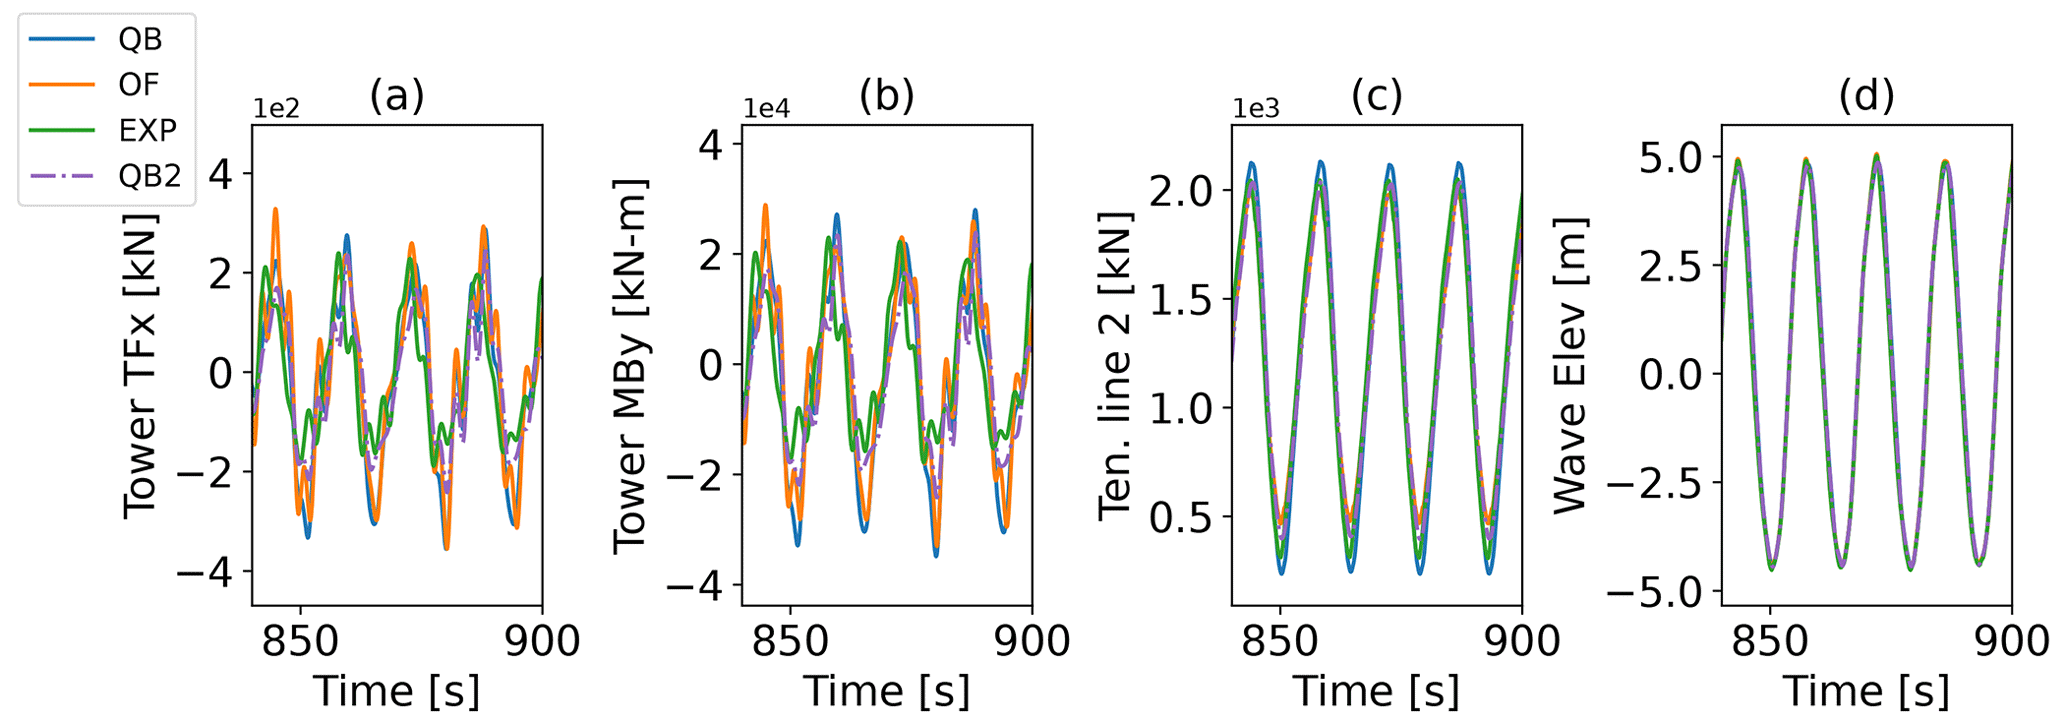
Figure 7OC5 model response to TC 3.1 – regular wave excitation in the (a) tower top force in x, (b) tower base fore–aft moment, (c) fairlead tension in line 2, and (d) wave elevation.
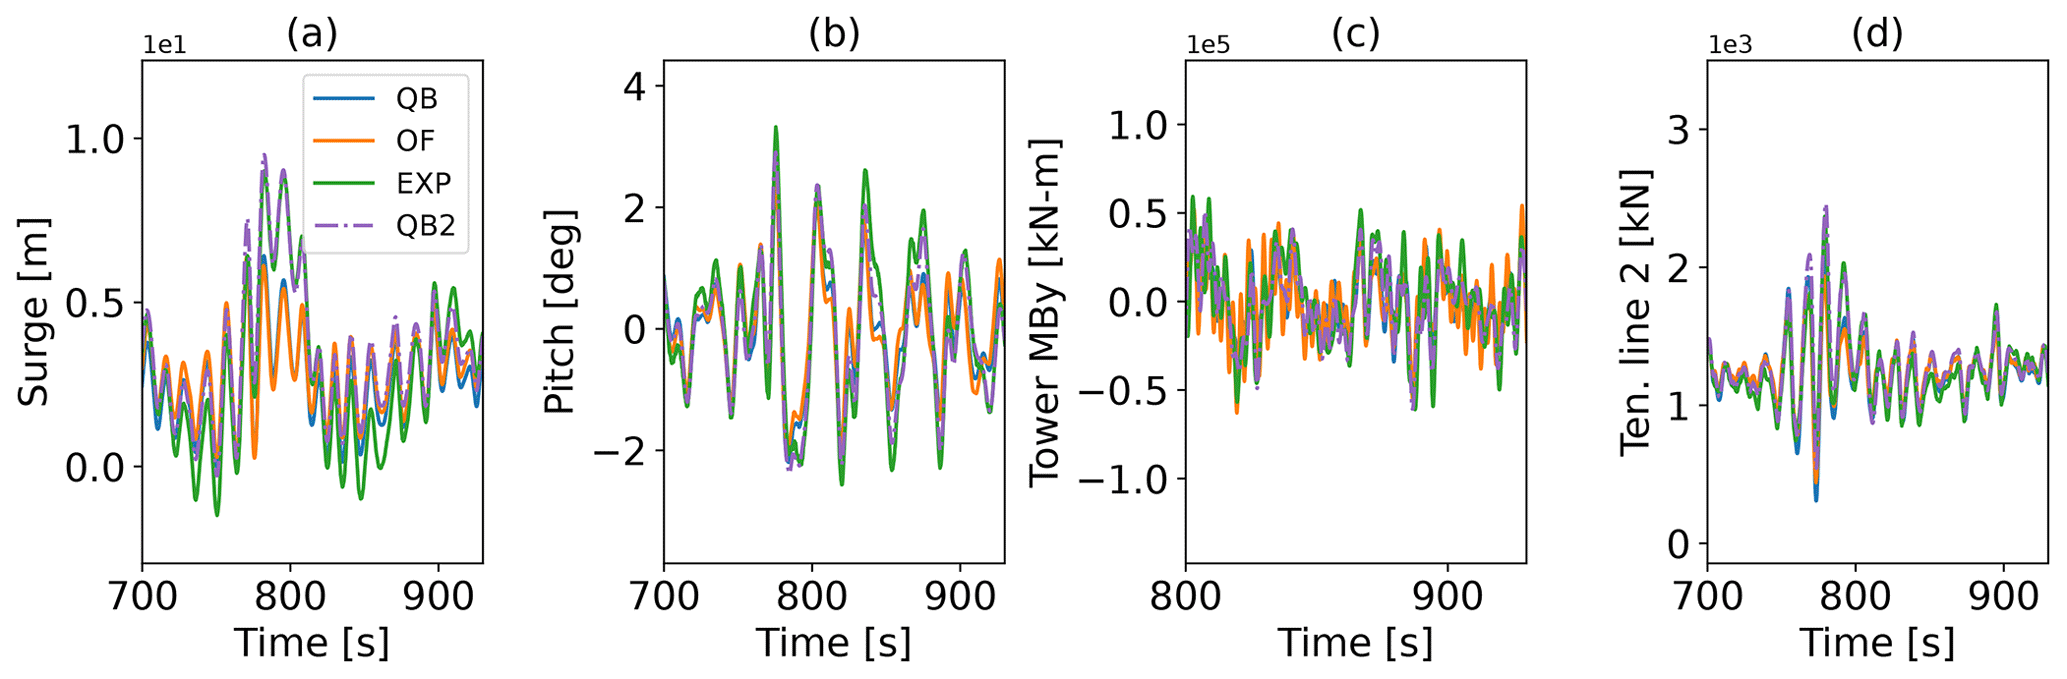
Figure 8OC5 model response to TC 3.2 – irregular wave excitation in (a) surge, (b) pitch, (c) tower base fore–aft moment, and (d) fairlead tension in line 2.
4.4.2 Irregular wave excitation
Continuing with the isolated hydrodynamic excitation cases, the complexity is increased by considering excitation from irregular wave spectra in this subsection. Figure 8 displays the two load-driving motion DOFs (surge and pitch) next to the fore–aft tower base moment and fairlead tension of line 2. As for the regular wave case, good visual agreement is present in the dynamics between all compared instances. QBlade and OpenFAST show almost identical results, while the experiment shows differences mainly in the surge and, to a lesser extent, the pitch DOF. A low-frequency component is present in the time signal that matches the surge natural frequency of the floater with approximately 0.01 Hz (see Table 2). With the enhanced model, this low-frequency component of the experiment (visible in Fig. 8a between 750 and 850 s) is very well captured, while the higher-frequency dynamics remain accurate. The fore–aft tower base moment demonstrates a higher-frequency component caused by an excitation of the tower eigenmode. These are captured to varying degrees by the two structural solvers of QBlade and OpenFAST and are analyzed in more detail in the frequency domain. Besides higher frequencies in the tower response, the wave excitation frequency can be made out and displays good alignment between the three numerical results and the experiment. The tension in fairlead 2 correlates closely with the surge motion, given that it provides the main restoring force. As a result, the enhanced model shows closer alignment with the experiment.
The evaluation of the full test case on a statistical basis is presented in Fig. 9, where the PSD of selected sensors along with their distribution visualized with box–whisker plots is displayed. The PSD can be categorized into several regions: linear wave excitation between 0.05 and 0.3 Hz, the platform's natural frequencies in surge (0.01 Hz) and pitch (0.03 Hz) below the wave frequency range, and the tower natural frequency at about 0.32–0.34 Hz. Focusing on the platform motions first, QBlade shows excellent agreement with the reference results from the experiment and agrees with OpenFAST regarding the linear wave excitation frequencies. Below the wave frequency spectrum, peaks in the natural frequency of each motion DOF are visible. Within these frequencies, QBlade modestly predicts more energy compared to OpenFAST, which can be attributed to the presence of Wheeler stretching.
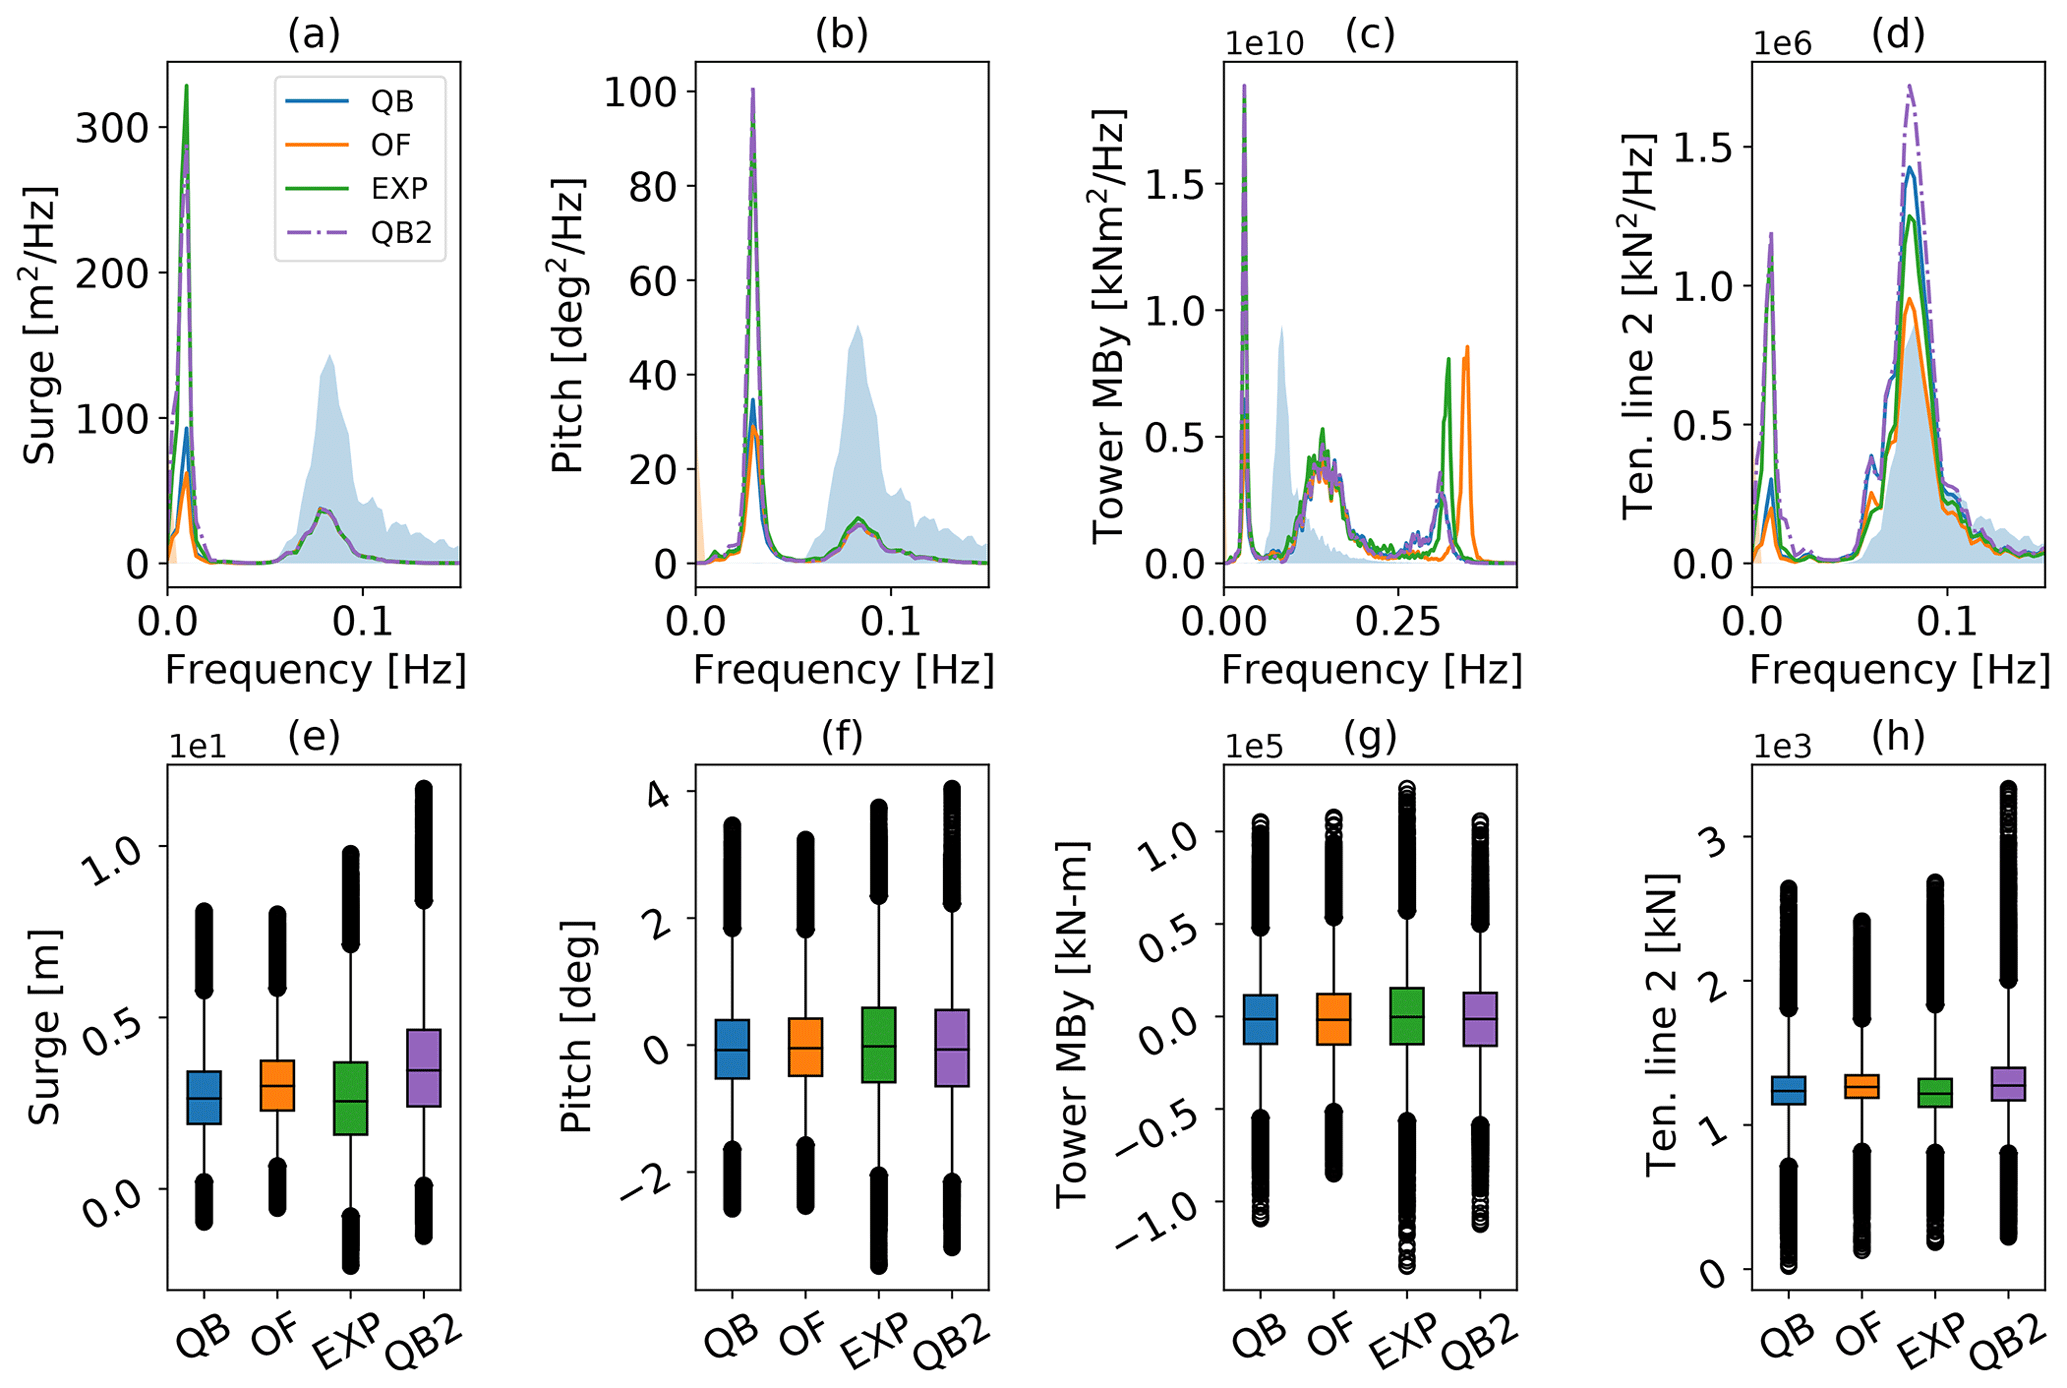
Figure 9OC5 model response to TC 3.2 – irregular wave excitation. PSD of (a) surge motion, (b) pitch motion, (c) tower base fore–aft moment, and (d) fairlead tension in line 2 and the corresponding box–whisker plots (e)–(h). The qualitative wave spectrum is displayed with the transparent blue color in the background for reference.
The experimental results, in contrast, show a much higher energy within the natural frequencies of the surge DOF and, to a lesser extent, the pitch DOF. As shown by the time series in Fig. 8a, the enhanced model achieves much closer alignment with the experiment in the surge natural frequency, while maintaining good agreement in the linear wave range. In the pitch DOF, QBlade and OpenFAST show almost-identical energy spectra, again underestimating the response in the pitch natural frequency. This underestimation of low-frequency response is visible in the load sensors as well. The tower bottom and fairlead load PSDs both show a reduced response in the pitch (tower base) or surge (fairlead 2) natural frequencies compared to the experiment. As was the case in surge, the enhanced model demonstrates good agreement with the experiment in the pitch natural frequency. The more accurate representation of motion response in both DOFs translates to more accurate tower base moments and fairlead estimations at the corresponding natural frequencies but also an overprediction in the response within the fairlead tension at wave frequency. Above the linear wave excitation frequency, the natural fore–aft frequency of the tower is evident in the tower base moment PSD. Here, the different structural representations of the tower between QBlade and OpenFAST are evident. Even though both tools predict similar natural frequencies (Perez-Becker et al., 2022), the shape of the peak is resembled more closely in OpenFAST, while the excitation frequency itself is matched better by QBlade.
For a statistical evaluation of the data, the platform motions and load sensors are shown in boxplots in the second row of Fig. 9. The boxplots categorize the data into five quantities: the 1st and 99th percentile thresholds (outer whiskers), the 1st and 3rd quartiles (height of the box), and the median (black line inside the box). Outside the whiskers lie flier values that are considered extreme outliers. First, the platform motion is analyzed. The surge and pitch interquartile ranges (IQRs) predicted by QBlade amount to a decrease of 28 % and 22 %, respectively, compared to the experiment. This is an improvement compared to the respective OpenFAST values of −32 % in surge and −23 % in pitch (Fig. 9a and b). The median position of the experiment is matched more closely by OpenFAST in surge and by QBlade in pitch. As was noted before, both numerical tools did not capture certain frequency responses that were visible in the experimental data, mainly in surge but also in the pitch degree of freedom. This low-frequency component leads to the larger IQR and spread of the whiskers in the corresponding experimental boxplot and to a more skewed distribution in surge. This is confirmed by the much closer alignment in IQR achieved by the enhanced model, which deviates by only 6 % increase in surge IQR compared to the experiment, and a similarly skewed distribution, albeit with a slightly shifted median position. Moreover, a 2 % increase in pitch compared to the experiment can be seen. With regard to the tower loads (Fig. 9g), a few systemic distinctions can be identified, indicating a similar distribution and good alignment of data from QBlade, OpenFAST, and the experiment. Nevertheless, a slightly more accurate IQR is visible for the enhanced model. In the fairlead tension (Fig. 9h), the response at the linear wave range dominates the IQR compared to the non-linear peak as QBlade almost matches the experimental IQR (−3 %), OpenFAST underpredicts it by 20 %, and the enhanced model overestimates it by 16 %.
To facilitate a more focused discussion, the time series data of the Softwind model are omitted, as only very limited additional insight is contained. The main observations are similar to the ones seen in Fig. 8, with more pronounced long-period responses in the surge and pitch DOFs, which translate into the response of the tower and mooring load sensors. As is shown in the boxplot analysis, an offset in mooring loads that amounts to an approximately 8 % difference in mean tension was present.
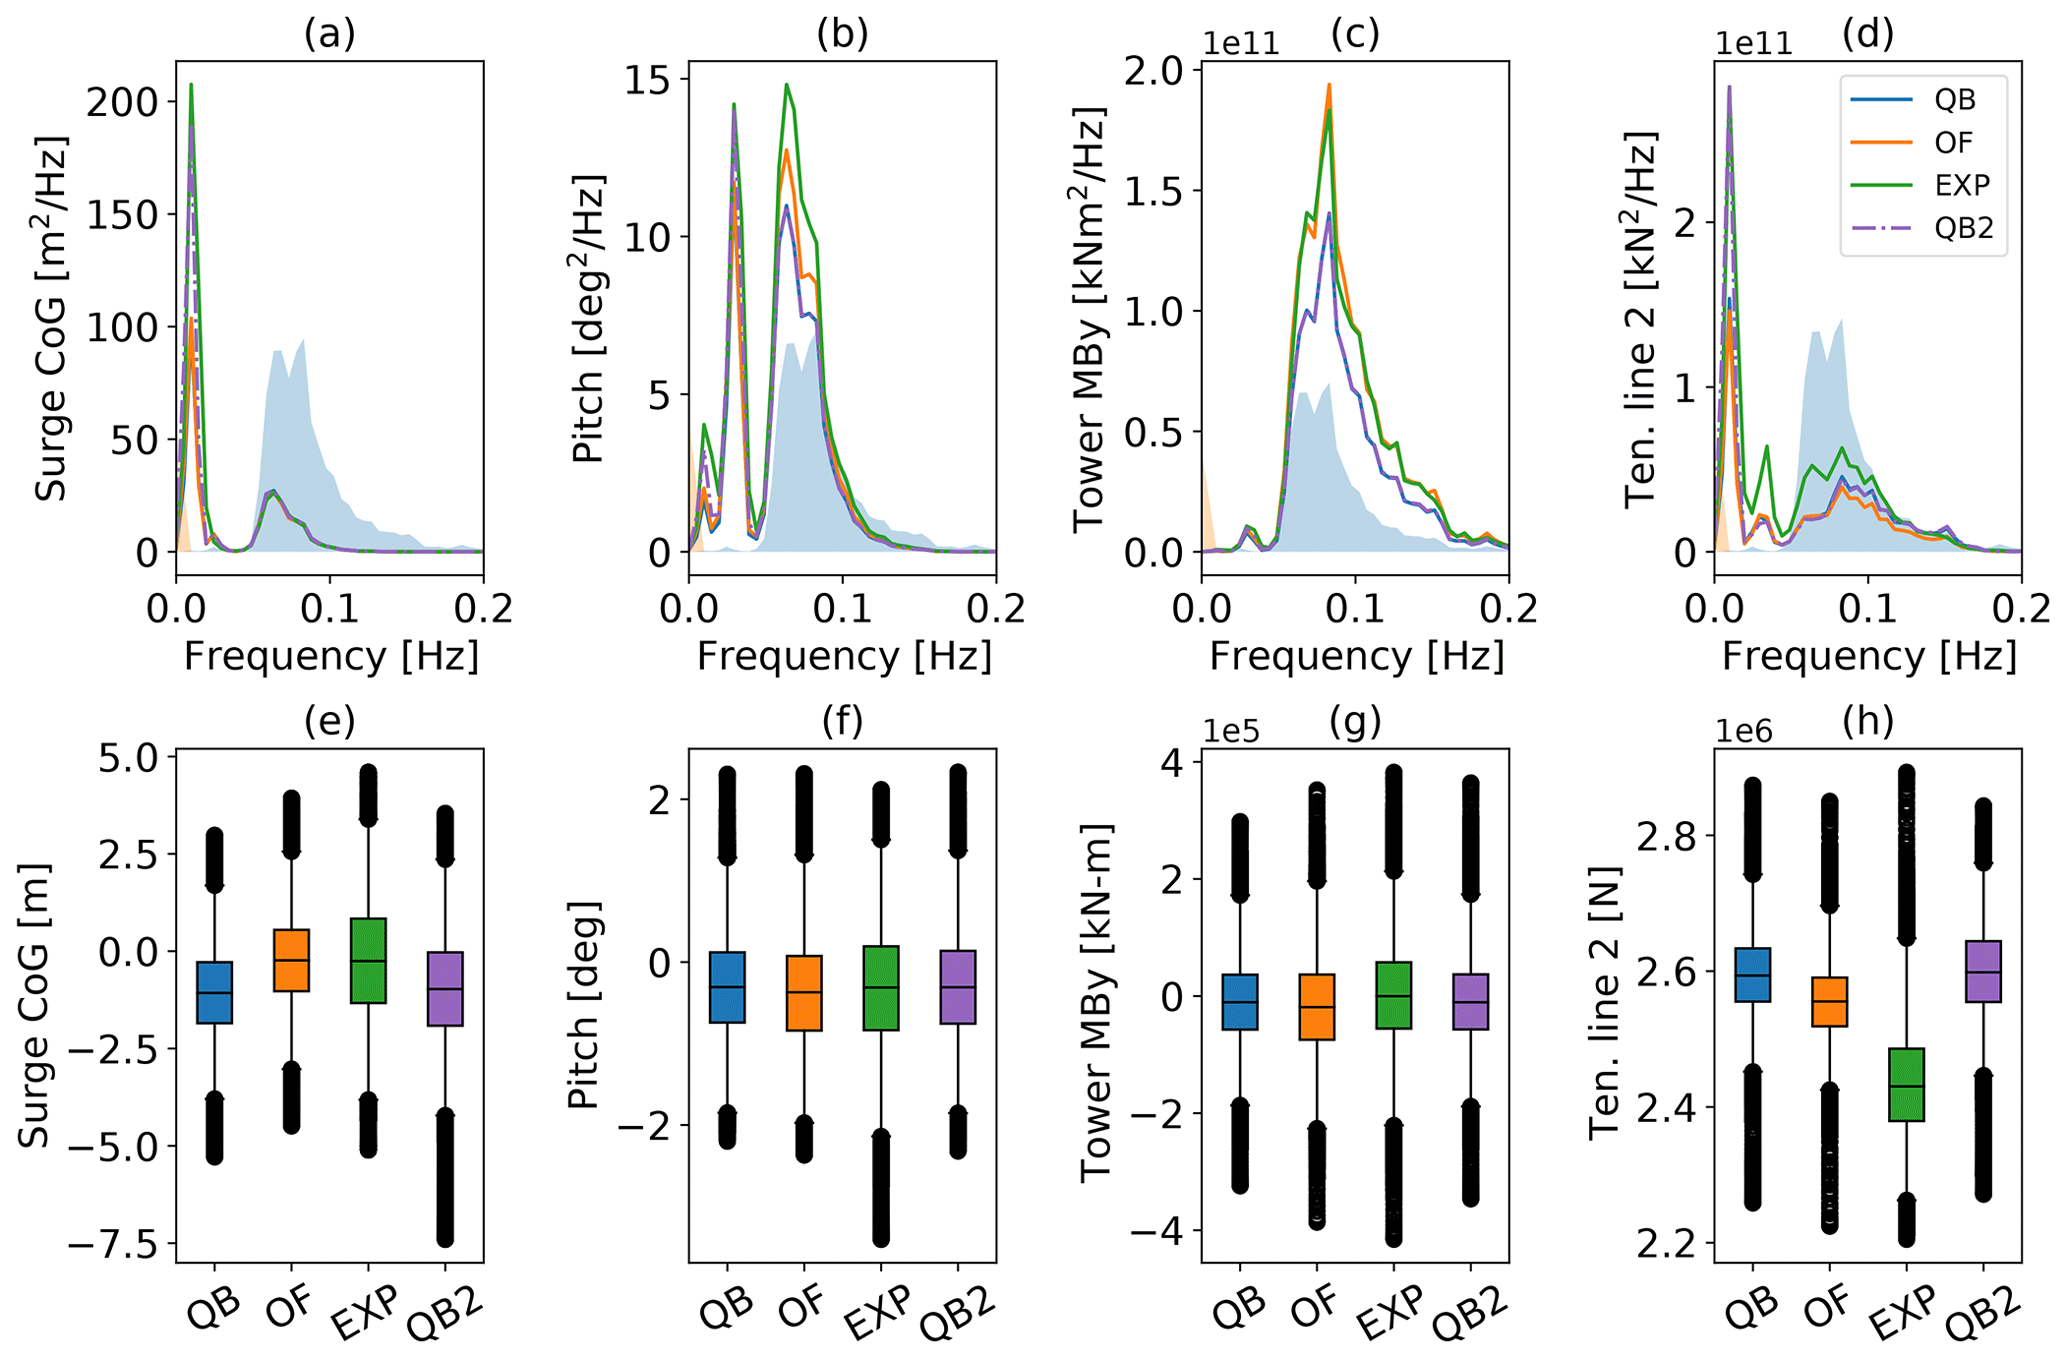
Figure 10Softwind model response to TC 3.2 – irregular wave excitation. PSD of (a) surge motion, (b) pitch motion, (c) tower base fore–aft moment, (d) fairlead tension in line 2, and the corresponding box–whisker plots (e)–(h). The qualitative wave spectrum is displayed with the transparent blue color in the background for reference.
In Fig. 10, the Softwind model response to an equivalent test case is analyzed with the same quantitative methods. In the surge PSD (Fig. 10a), the response within the linear wave spectrum is equivalent between the three results. In the peak of the surge natural frequency, the formerly seen shortcoming regarding non-linear excitation is also visible in both simulation codes on this spar-type FOWT. QBlade and OpenFAST demonstrate equivalent energy within this frequency, indicating that Newman's approximation implemented in QBlade performs similarly to the implementation in OpenFAST. Furthermore, it implies a lesser influence of Wheeler stretching on this model. The corresponding boxplot confirms this with no deviation in the IQR between QBlade and OpenFAST. Both tools underpredict the IQR in surge by 29 % (Fig. 10e). Again, the increased non-linear response seen in the experiment PSD is seemingly the cause. Compared to the conventional models, the enhanced model shows close alignment with the experimental peak at the natural surge frequency and underestimates the IQR by only 14 %. The median value is shifted slightly as a result of different neutral positions in both numerical tools with respect to the experiment. The pitch DOF (Fig. 10b) shows an increased response within the linear frequency range in the experiment. Here, OpenFAST displays closer agreement to the reference compared to QBlade. However, it should be noted that the amplitudes within the linear wave range are small, and therefore small absolute deviations – of the order of a 10th of a degree – cause this relatively large appearing deviation between QBlade and OpenFAST that is seen in the PSD. In the non-linear excitation below the wave frequency range, QBlade and OpenFAST accurately determine the excitation frequency. In contrast to what is observed in Fig. 9f, the underprediction at the natural frequency of this DOF is less severe for the spar-type platform. Since this platform does not include heave plates, the filtered velocity treatment in the enhanced model is not applicable. Nevertheless, the modification of the near-surface transversal drag coefficients demonstrates an improvement in the pitch DOF as well, showing exact alignment with the experimental result. The boxplot (Fig. 10f) shows good alignment among the compared instances and highlights the occurrence of small amplitudes in the pitch response. QBlade and OpenFAST underestimate the IQR by 16 % and 10 %, respectively, while the enhanced model underestimates it by 13 %. The tower base loads (Fig. 10c and g) reproduce observations from the pitch PSD to some degree, albeit with different relative magnitudes between the non-linear and the linear frequency response range, with the former barely visible. The enhanced model matches the baseline QBlade result exactly. Close agreement prevails in the boxplot with similar distribution of data between the 1st and the 99th percentiles between the compared results. Finally, the tension in fairlead 2 (Fig. 10d) also shows a considerable response in the non-linear surge natural frequency, directly related to the increased surge motion at that frequency. In the linear frequency range, the experiment's PSD reveals an increased response that is not fully reproduced by the numerical tools. While it is difficult to pinpoint a definite cause, it is likely to be due to an incorrect estimation of the hydrodynamic damping of the mooring lines, which can be sea-state dependent. Interestingly, this discrepancy does not translate to the response in the linear wave range of the surge DOF (Fig. 10a). Given that the natural frequency lies significantly below the linear frequency range of the wave field, the response in this range is predominantly driven by forcing and the system inertia (Chopra, 2014, p. 79). Thus, the effect of (mooring) stiffness on the surge response in this range is negligible. In the corresponding box–whisker plot in Fig. 10h, QBlade overestimates the median tension by 6.3 % and OpenFAST by 5 % compared to the experiment, while the enhanced model shows an improvement in the IQR by about 15 % compared to QBlade and OpenFAST.
To conclude the isolated wave excitation test cases, the Hexafloat model is analyzed. As for the Softwind model, the time series result is only briefly summarized. The motion sensors demonstrate very close alignment with regard to the dynamic response. A mean offset in the surge position of approximately 0.75 m upstream is visible in QBlade, which can be attributed to minor differences in the mooring tension. Notably, the amplitudes of the pitch motion were slightly increased in QBlade, which causes a minor increase in the tower base moment response as a result.
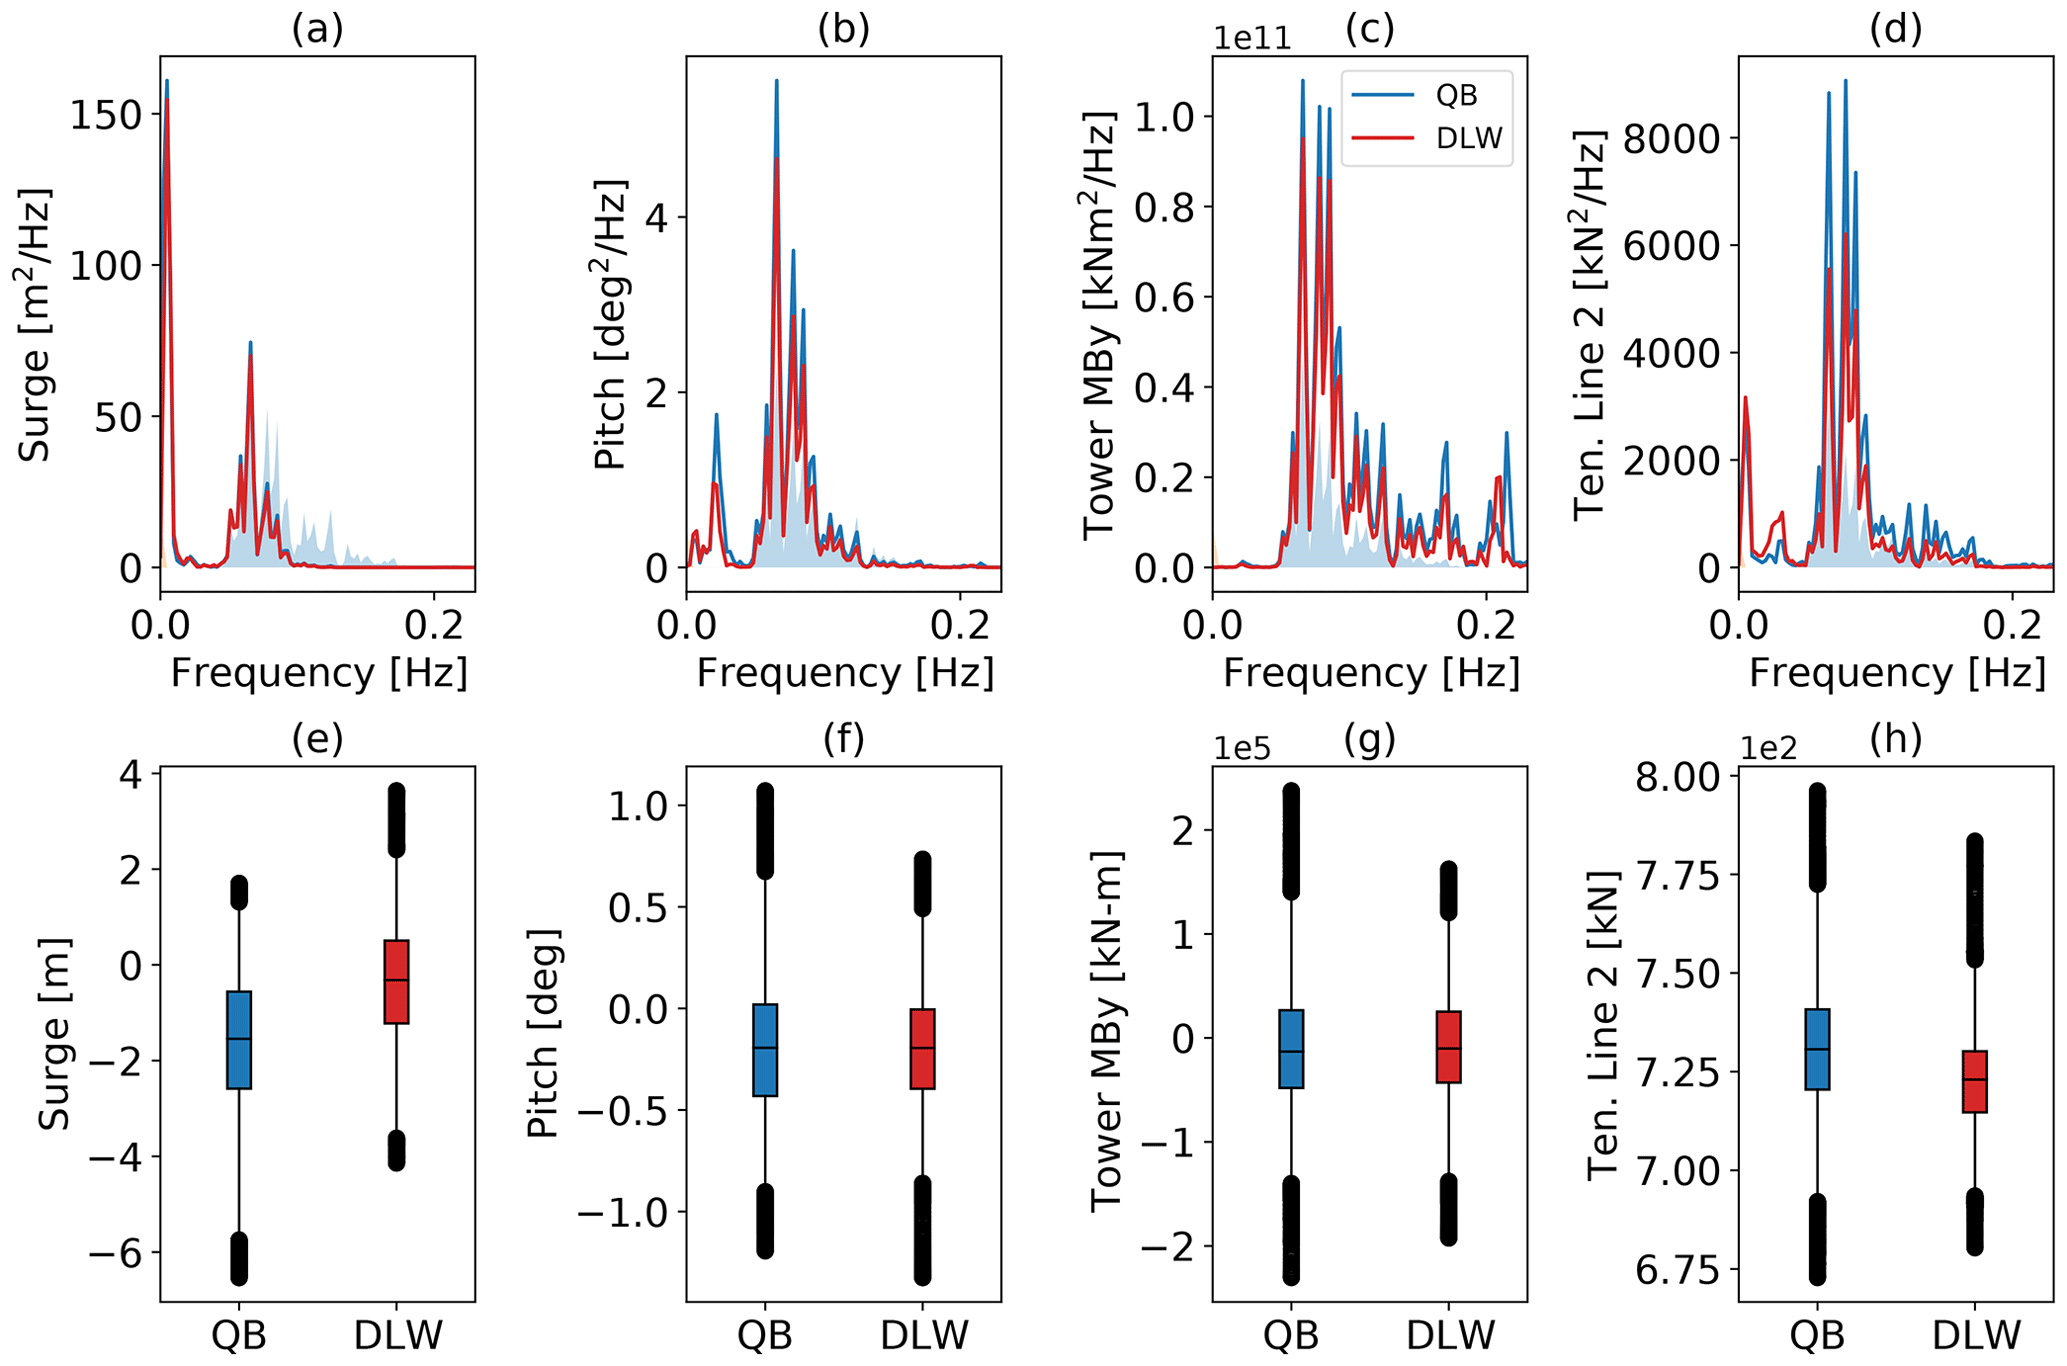
Figure 11Hexafloat model response to TC 3.2 – irregular wave excitation. PSD of (a) surge motion, (b) pitch motion, (c) tower base fore–aft moment, (d) fairlead tension in line 2, and the corresponding box–whisker plots (e)–(h). The qualitative wave spectrum is displayed with the transparent blue color in the background for reference.
Figure 11 illustrates a high degree of similarity between the responses of both tools in the degrees of freedom within the linear excitation frequency range of the wave spectrum, as well as in the non-linear response within the surge and pitch natural frequencies below the wave spectrum (Fig. 11a and b). Notably, no QTFs were available for this model, providing an opportunity to validate the weak, non-linear excitation caused by the application of hydrodynamic loads at the instantaneous floater position combined with kinematic stretching. Both the tower fore–aft moment and fairlead tension in line 2 show good agreement in the excited frequencies, with QBlade predicting moderately higher peaks at the relevant frequencies (Fig. 11c and d). This can be attributed to a slightly larger surge and pitch response within the linear wave spectrum, visible in the corresponding PSDs. The boxplot results show the effect of the increased response throughout the linear frequency range in QBlade: in surge, the IQR is 14 % larger in QBlade, while the median is shifted in a negative x direction (Fig. 11e). The platform pitch and tower base moment data are in good agreement with regard to their median value. Their IQR range is again larger in QBlade (Fig. 11f and g) with 19 % increased spread in pitch that translates to a 10 % increase in the tower base moment spread. Finally, the boxplot of the tension in line 2 (Fig. 11h) displays a mirrored pattern compared to the surge boxplot, indicating their close dependency. QBlade predicts a 30 % larger IQR compared to DeepLines WindTM.
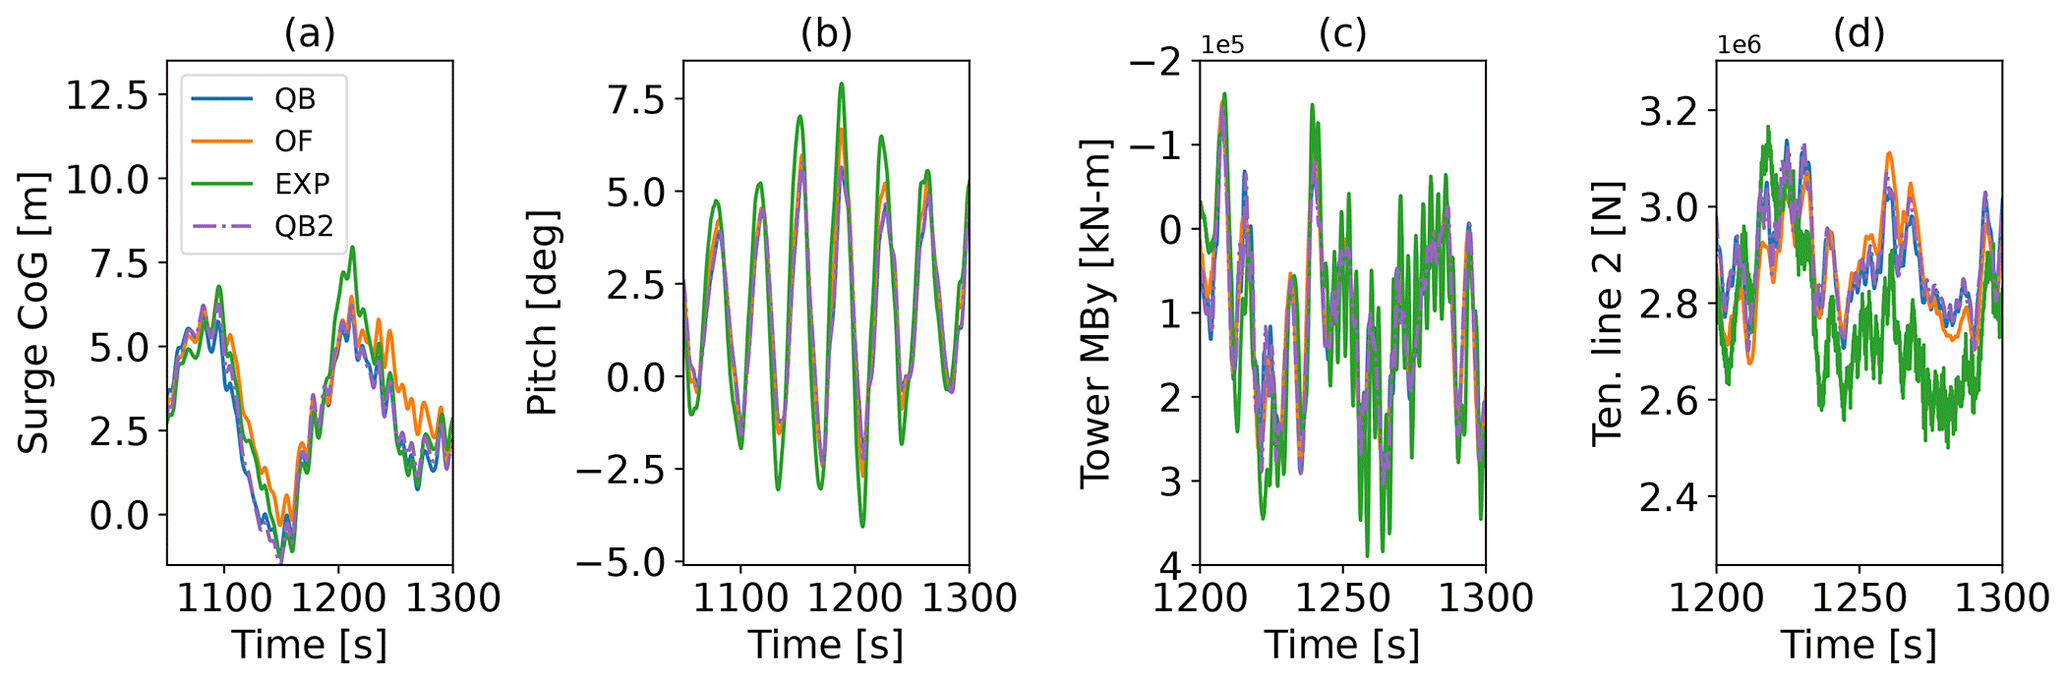
Figure 12Softwind model motion and load response to TC 4.1 – combined irregular wave and wind excitation in (a) surge CoG motion, (b) pitch motion, (c) tower base fore–aft moment, and (d) fairlead tension in line 2.
4.5 Combined aero- and hydrodynamic loads
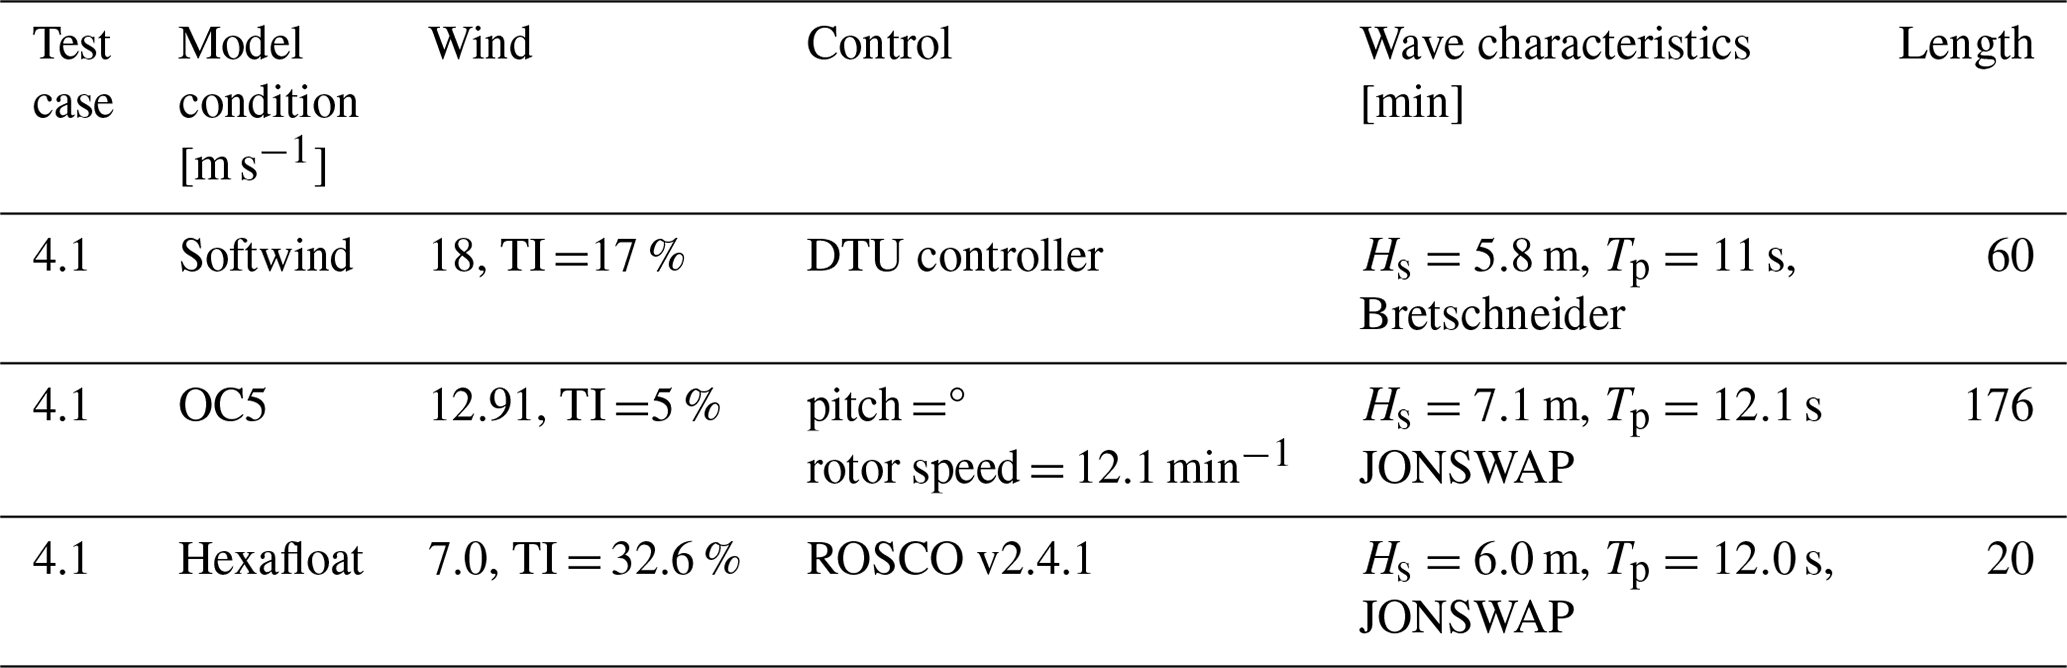
The final test case, which concludes this verification and validation study, combines the fully coupled aero-servo-hydro-elastic dynamics exhibited by a floating offshore wind turbine throughout its lifetime. As before, we perform qualitative analysis of cut-out time series for one exemplary model, in this case Softwind, at the beginning of this section. Subsequently, quantitative statistics are used for each model to assess the predicted responses by QBlade and to compare them to the numerical counterparts and experimental reference cases. Table 5 showcases the three test cases considered, one for each FOWT assembly. To cover three different operational states, varied environmental conditions are selected for each FOWT. The Softwind model is simulated in conditions beyond the rated regime, where the controller constantly actuates the blade pitch to not exceed rated power output. Conversely, the simulation of the OC5 model approximates conditions that are near to rated power. This is done with a constant prescribed value for the blade pitch angle and rotor speed (as was done in the OC5 collaboration). In the case of the Hexafloat model, below-rated conditions are discussed. Here, the controller gradually adjusts the rotational speed to operate at the optimal tip speed ratio to maximize power generation. For the servo control of the DTU 10 MW turbine atop the Softwind platform, the DTU baseline controller (Hansen and Henriksen, 2013) is used, replicating conditions from the experiment. The control parameters correspond to those of the reference turbine, except for the proportional and integral gains of the pitch controller and the linear and quadratic aerodynamic gain scheduling coefficients. These were adjusted to prevent negative damping that originates from the coupling between blade pitch actuation and the floater pitching motion. The PI parameters of the OO-Star 10 MW FWT are used, since the pitch natural frequency between both the OO-Star and the Softwind platforms is nearly identical (Yu et al., 2018). In the case of the Hexafloat model, the ROSCO v2.4.1 controller (NREL, 2021) was selected due to its ability to include a velocity feedback damping loop designed to reduce pitching motion and thereby increase stability of the floating substructure. Unfortunately, this feature had to be disabled for this code-to-code comparison after difficulties were found in the communication between the ROSCO controller and DeepLines WindTM. Leaving this feature active in QBlade alone would have impeded a consistent comparison. Therefore, the controller gains were de-rated to prevent negative damping effects instead.
Table 5Description of test case 4.1. Combined aero-hydrodynamic-servo-dynamic conditions applied to the FOWT models.
The Softwind model is analyzed at above-rated conditions, with a mean wind speed of 18 m s−1 that requires continuous blade pitch actuation by the DTU wind turbine controller. The blade pitch actuation is based on the power output of the wind turbine, which depends on the velocity in the rotor plane. Hence, blade pitch actuation depends on the motion-induced velocities and the wake-induced velocities in the rotor plane of the system. Considering this, the wake model (lifting line vs. BEM) and the hydrodynamic model (buoyancy modeling, wave kinematics) in a given simulation collectively influence the pitch actuation process and subsequently the overall system dynamics. Figure 12 shows a cut-out of the time series displaying the same sensors that were chosen in TC 3.2 to analyze the system response of the Softwind model. What stands out is that even after more than 10 min into the time series, good qualitative agreement between the three compared results is present. The surge time trace demonstrates a long-period cycle at the natural frequency of this DOF. OpenFAST demonstrates a slightly closer agreement with the experiment in the surge response compared to QBlade, which only slightly underestimates the surge amplitude. This is unsurprising as the SIL experiment and OpenFAST both utilize the same aerodynamic models. The enhanced model, in contrast to the results shown in Fig. 8a without wind loading, shows only minor deviation from the baseline QBlade result. The aerodynamic thrust combined with the mean drift force causes a mean surge displacement around 0.5 m that is accurately reflected in the numerical tools. The mean pitch angle enforced by the thrust force amounts to approximately 2°. The pitch response is very similar in all three numerical models, showing good alignment with the experiment. As a result, the tower base moment is in good alignment too, indicating that the aerodynamic thrust predicted by the LLFVW method is similar to the one of the SIL experiment (AeroDyn v14) in unsteady conditions as well. Given that the mean TSR of the test cases is 5, such close agreement could be expected from Fig. 5. The observed offset in the fairlead tension to the experiment that was pointed out in the Softwind response to TCs 3.1 and 3.2 is reduced once aerodynamic thrust is included. The experiment validates the alignment between QBlade and OpenFAST, showing only slightly lower tensions. Regarding the dynamics, good agreement is found.
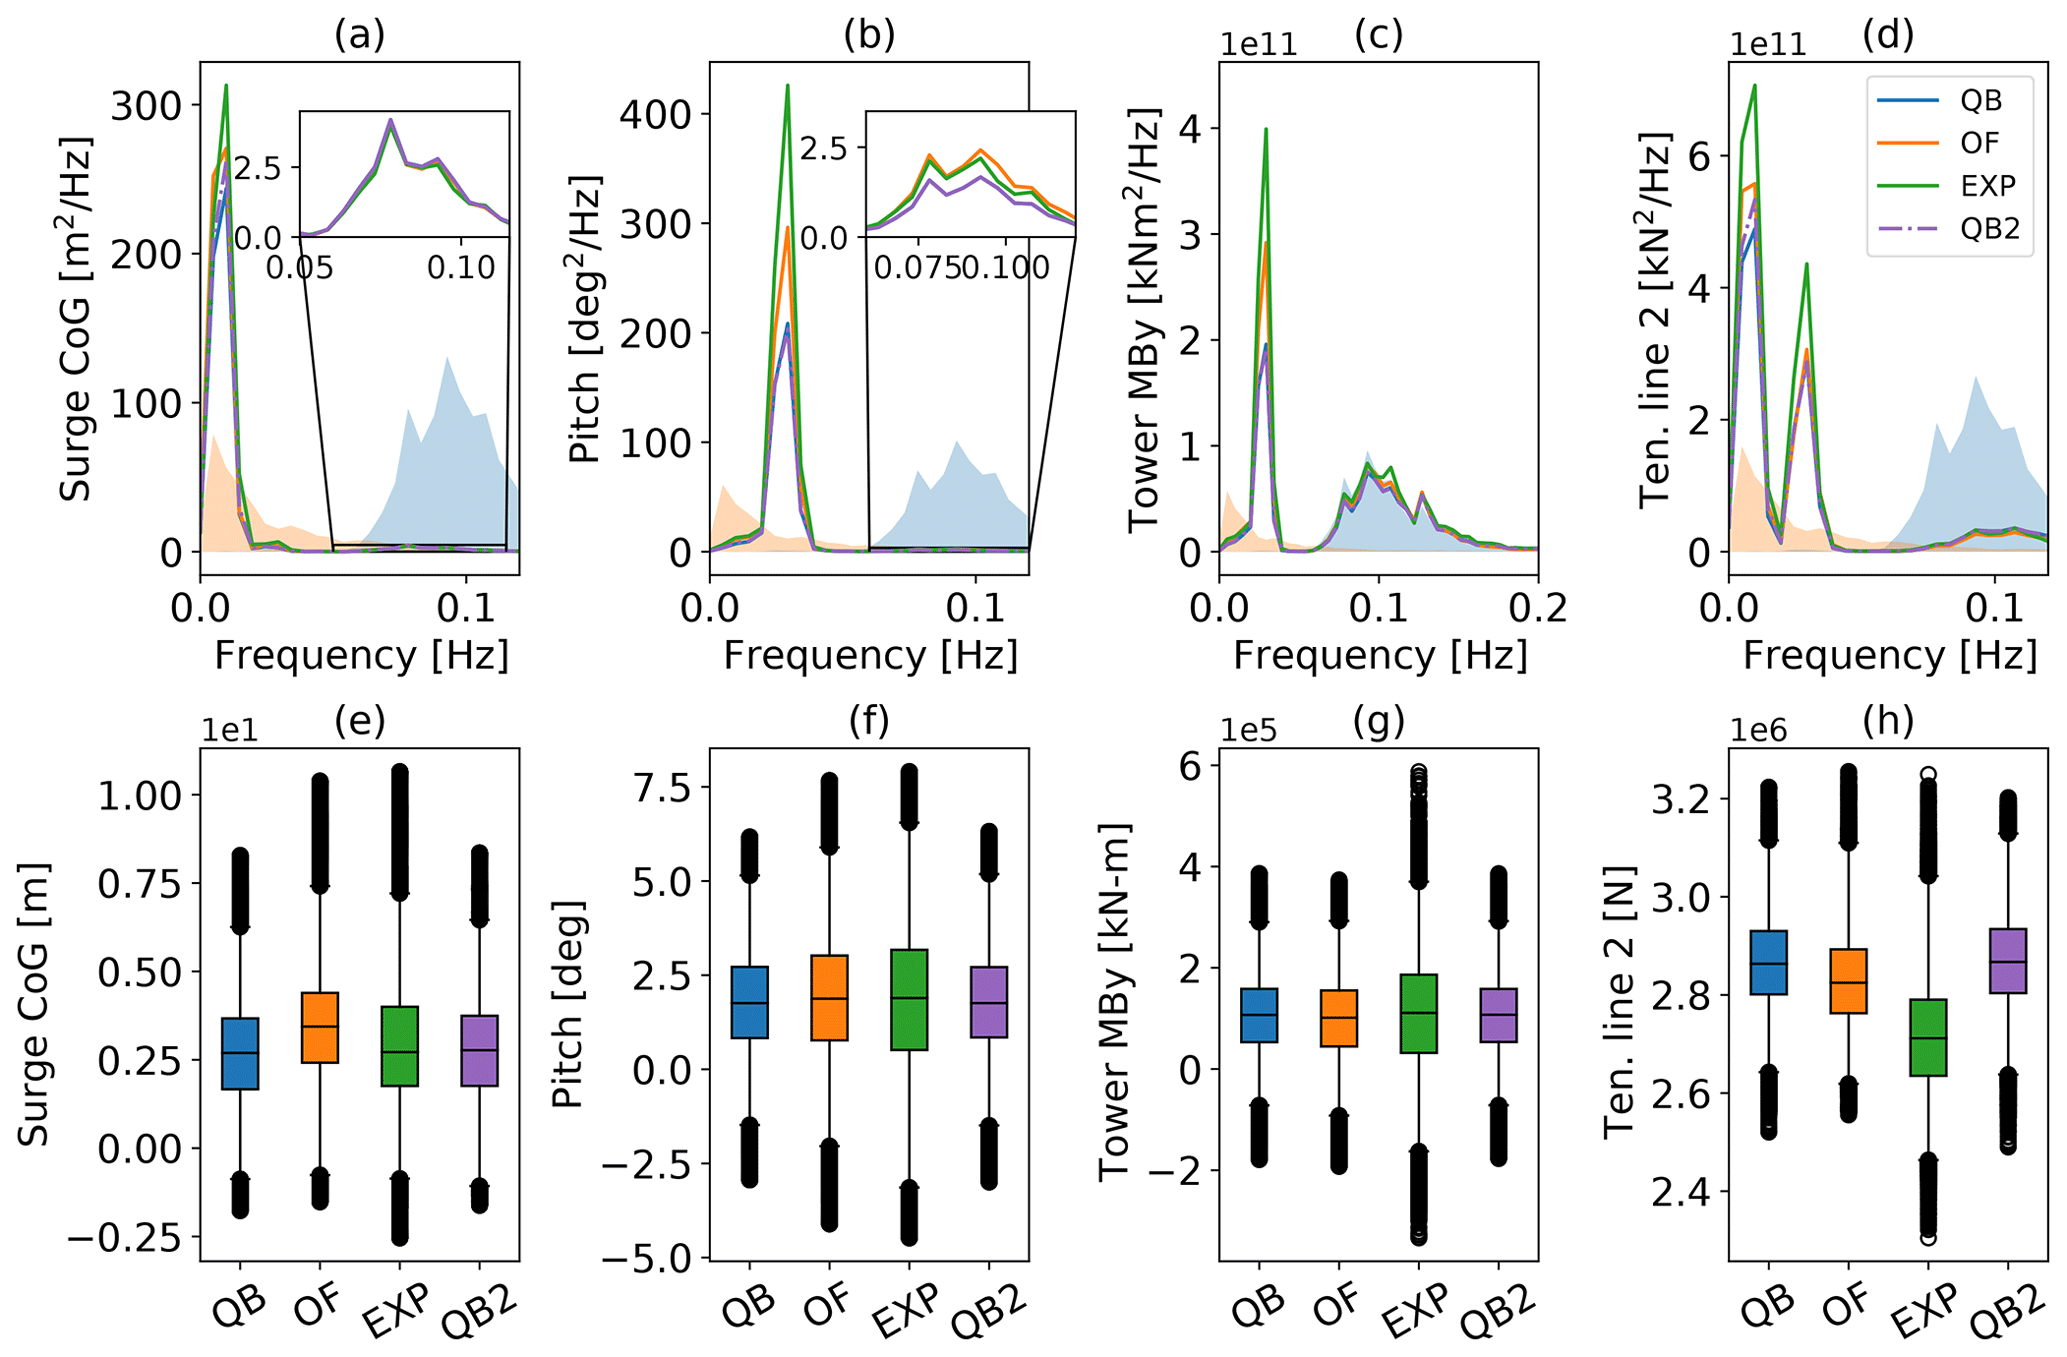
Figure 13Softwind response to TC 4.1 – irregular wave and wind excitation. PSD of the (a) surge CoG motion, (b) pitch motion, (c) tower base fore–aft moment, and (d) fairlead tension in line 2 and the corresponding box–whisker plots (e)–(h). The qualitative wave (blue) and wind (red) spectra are displayed with the transparent color in the background for reference.
Continuing the analysis with Fig. 13, a severe response within the natural frequencies of the different degrees of motion becomes evident. In fact, the response in the surge natural frequency (Fig. 13a) at around 0.01 Hz dominates the spectrum to an extent that the linear wave response is only observable in the zoomed-in frame. In addition to the wave spectrum, the scaled wind spectrum is displayed as an indicator of the excited frequencies by the turbulent wind field. The peak of the wind spectrum aligns with the frequency at Softwind's natural frequency. The energy in that frequency is predicted slightly more accurately by the enhanced model compared to the baseline QBlade model. In the magnified frame, the surge response shows excellent agreement between the numerical tools and the experiment. The corresponding boxplot for the surge direction (Fig. 13e) reveals good alignment between QBlade and the experiment regarding the median and IQR at −11 % difference. The OpenFAST result is offset towards a larger surge displacement and yields an IQR of −16 %. No significant improvement of the enhanced model can be found with an IQR of −13 %. Figure 13b and f shows the PSD and boxplot corresponding to the pitch DOF. The former demonstrates only minor excitation within the linear wave frequency range, in contrast to a strong response in the pitch natural frequency. As continuously stated throughout this work, this excitation frequency matches the experiment response albeit at a reduced scale. This leads to an increased spread of the IQR of the box corresponding to the experiment compared to QBlade (−28 %) and OpenFAST (−18 %). The enhanced model matches the baseline QBlade result exactly. The tower base moment (Fig. 13c and g), being closely related to the pitch motion of the FOWT system, matches the observations for the pitch sensor with more aligned IQRs between QBlade and OpenFAST. Excitation peaks corresponding to the natural frequencies of the coupled surge and pitch DOFs can be seen in the PSD of the tension at the delta connection point of the Softwind platform (Fig. 13d). The boxplots of the mooring tension yet again show the consistent difference in the mooring tensions that was observed throughout the analysis of the Softwind platform. To sum up this load case, it can be stated that, compared to TC 3.2 in Fig. 10, the enhanced model only leads to modest improvement with regard to the motion and load responses when wind loads were included.
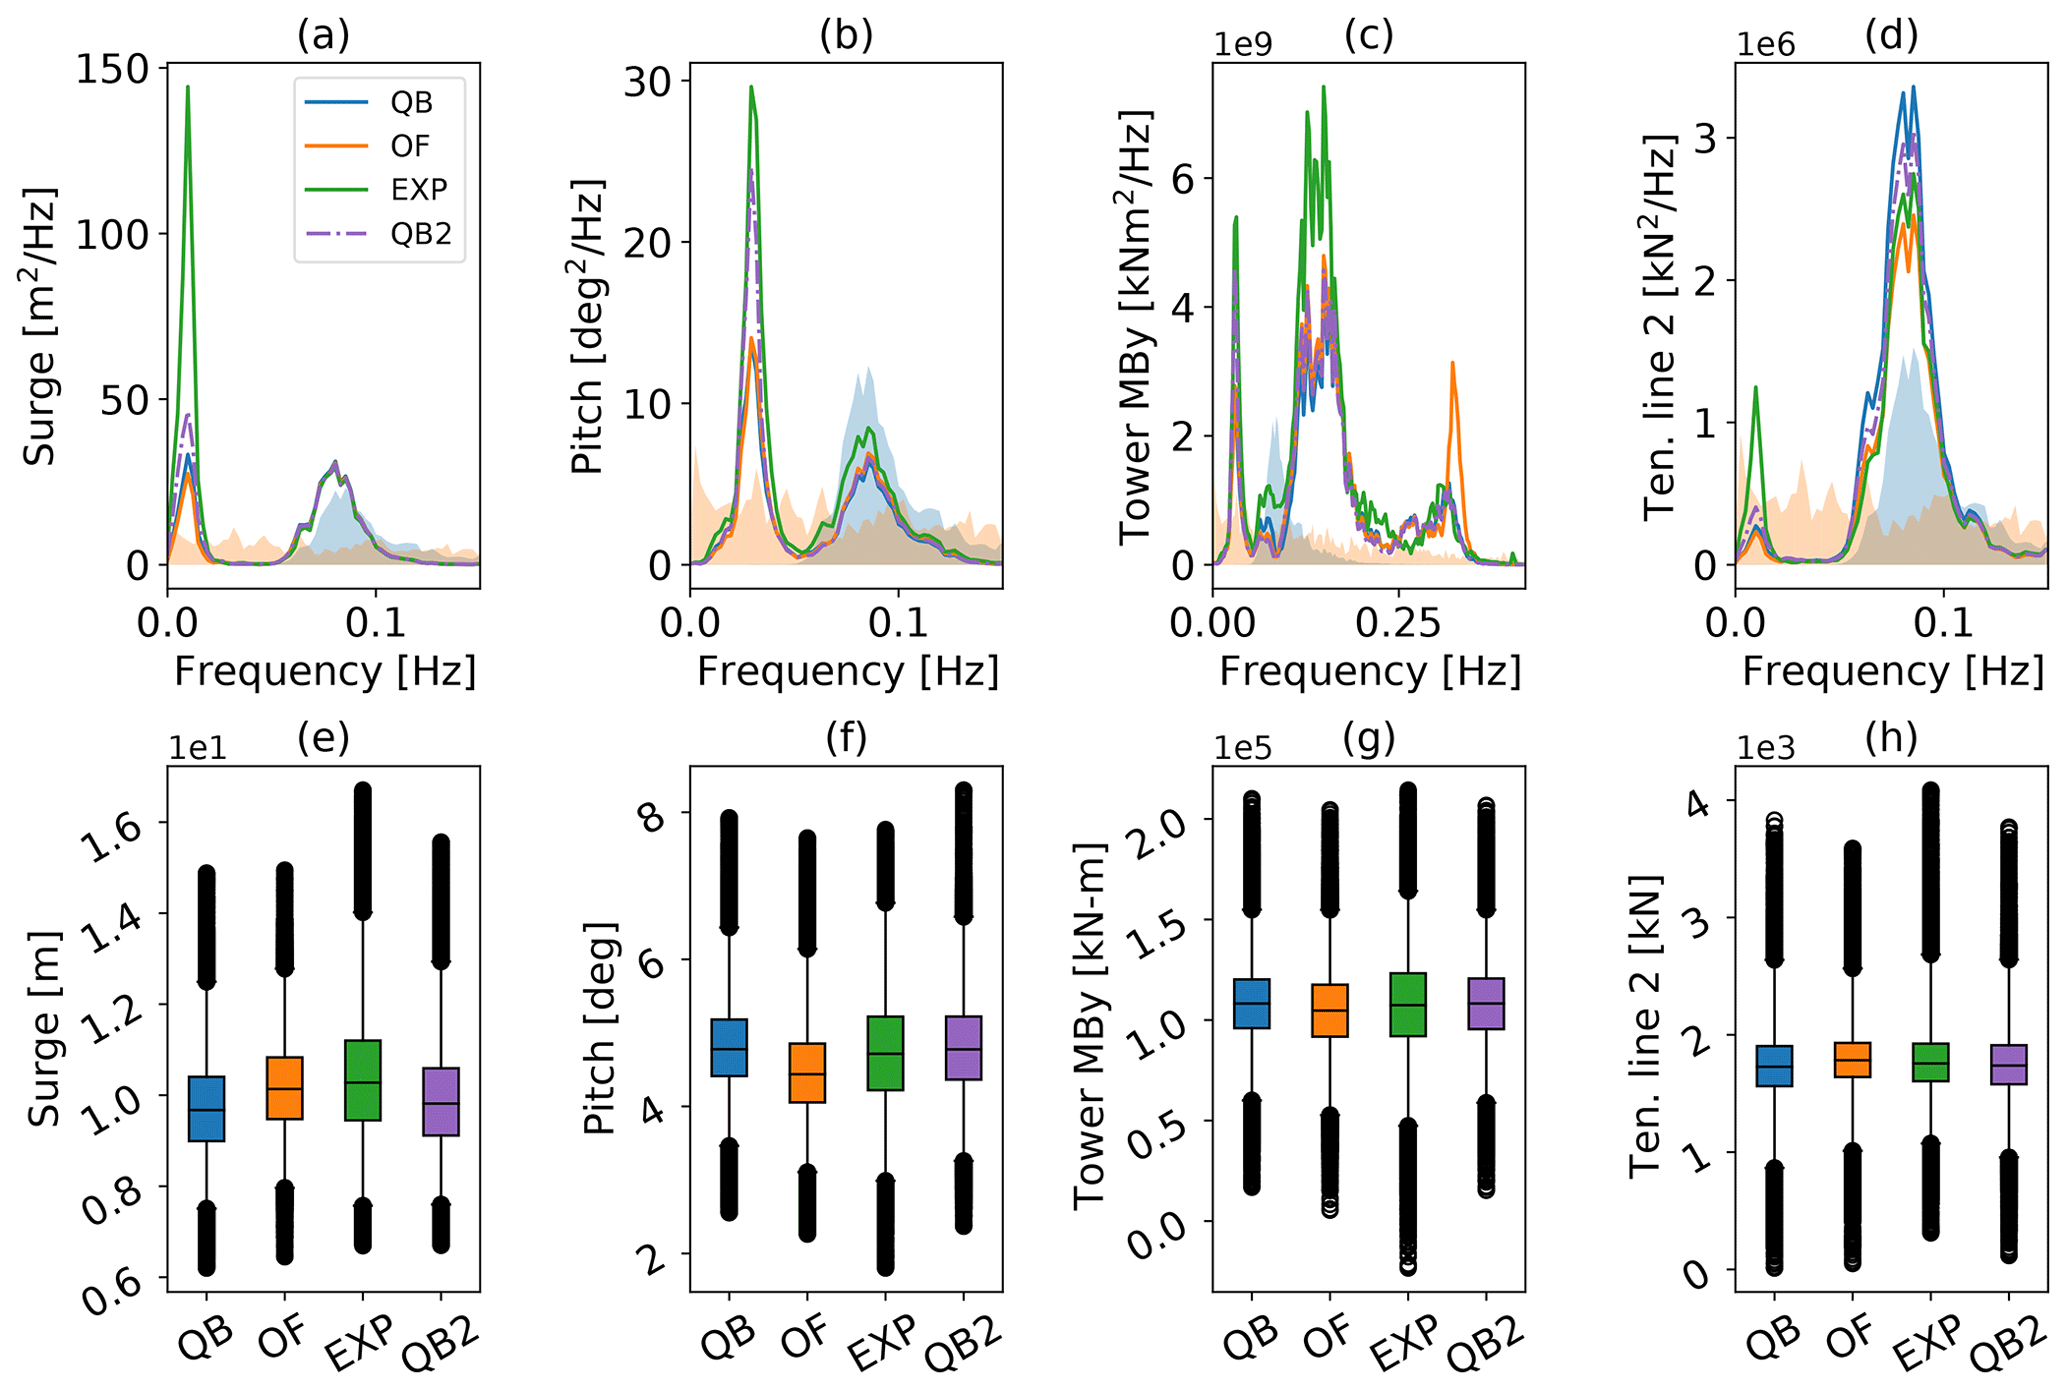
Figure 14OC5 model response to TC 4.1 – irregular wave and wind excitation. PSD of the (a) surge motion, (b) pitch motion, (c) tower base fore–aft moment, and (d) fairlead tension in line 2 and the corresponding box–whisker plots (e)–(h). The qualitative wave (blue) and wind (red) spectra are displayed with the transparent color in the background for reference.
The corresponding PSD and boxplot of the OC5 model for TC 4.1 are shown in Fig. 14. The PSD can still be categorized into the system's natural frequencies, the linear wave frequency range, and the range above, which is most visible in the tower loads. Comparing to the PSD from TC 3.2 in Fig. 9, an outstanding effect is the damping visible in the surge and pitch DOFs (Fig. 14a and b) when aerodynamic loads are included. The aerodynamic damping comes into effect by an increased thrust force that acts on the tower top when the relative wind velocity in the rotor plane is increased during forward motion and reduced during backwards motion. This leads to a more dampened response within the resonant frequencies of the floater. Thereby, the peak in the surge natural frequency is reduced by about 40 %. In contrast, the response within the linear wave range is not changed. As was the case for the Softwind model, when compared to the wave-only test case, the enhanced model shows only slight improvement compared to the baseline QBlade and OpenFAST models. This can be explained by an overall more constrained FOWT as soon as wind is included compared to only hydrodynamic excitation. The aerodynamic thrust force and the increased mooring force that result from a shift in the mean surge position dampen the oscillation at the system's natural frequency. As a result of this, the approach of increasing the near-surface drag coefficient that is followed by the enhanced method is less effective. The impact of aerodynamics also becomes visible in the boxplot (Fig. 14e), where the difference in the interquartile range corresponding to the experiment in surge compared to the one seen for the numerical codes is reduced (−20 % in QBlade, −23 % in OpenFAST). The smaller relative difference between them within the oscillation in natural frequency leads to a closer alignment in data distribution. The same trend can be observed in the pitch PSD (Fig. 14b) with a reduction in the energy within the pitch natural frequency of close to 50 % compared to TC 3.2. The linear response at higher frequencies remains largely unchanged. QBlade and OpenFAST show good agreement with one another, with a slight underestimation of the linear response visible in the QBlade results. The response in the pitch natural period is underestimated by both numerical tools. Compared to them, the enhanced model demonstrates significant improvement in the pitch DOF. Looking at Fig. 14f, the relative differences in the quantile ranges between the experiment and the numerical tools are similar to the ones observed for wave-only excitation, despite the reduced relative difference in the pitch motion at low frequencies (QBlade −23 %, OpenFAST −20 %, and enhanced model −15 %). QBlade shows good alignment with the median position of the experiment, while OpenFAST exhibits a slight underestimation of this position. Moving on to the tower base moment (Fig. 14c), two peaks lie within the linear wave spectrum, one at 0.07 Hz, aligning with the dominant wave frequency, and a larger one at 0.14 Hz that does not. According to Robertson et al. (2017), these two peaks inside the linear wave spectrum are caused by the motion of the structure with respect to the wave. QBlade and OpenFAST capture both peaks similarly, but both underestimate the response compared to the experiment. The underestimation of the response in this frequency is in line with the participants of the OC5 collaboration that deployed a PFMD approach. Furthermore, the tower fore–aft moment PSD shows peaks in the pitch natural frequency and in the tower fore–aft natural frequency. Here, in contrast to Fig. 9, the shape of the peak predicted by QBlade aligns closely with the OC5 experiment, while OpenFAST overestimates the response at an accurate tower frequency. Even though the enhanced model improves the estimation of the peak in the pitch natural frequency, its predicted IQR is with −20 % similar to the other numerical models (−23 % for QBlade and −18 % for OpenFAST). This is a result of the increased response at 0.14 Hz seen only in the experiment (Fig. 14g). The tension within fairlead 2 (Fig. 14d and h) reflects the increased loads on the mooring system caused by the aerodynamic loads compared to TC 3.2. Good alignment is present within the linear frequency range. The increased response of the experimental model in the surge natural period is reflected again in the tension of this line.
The final case that is discussed in this study is the combined wind and wave excitation case for the Hexafloat model. As is shown in Table 5, below-rated conditions are assumed. Consequently, the ROSCO v2.4.1 controller follows the objective of maximizing power by adjusting rotational speed to operate at the optimal TSR of 8.06. According to Fig. 5, the aerodynamic models of DeepLines WindTM and QBlade demonstrate close agreement with regard to the thrust coefficient in this condition. Hence, similar responses on the motion DOFs and loads are to be expected with similarly behaving hydrodynamic models. A time series comparison of the motion and load sensors (not shown here for brevity) confirms this with very good agreement between both simulation tools in the surge and pitch degrees of freedom. In the platform pitch response, QBlade demonstrates slightly increased amplitudes in frequencies that appeared to be within the linear frequency range of the wave field.
The PSDs in Fig. 15 are dominated by the resonant response in the natural surge and pitch frequencies. The response within the linear frequency range only becomes visible within the magnified cut-outs, where good alignment in the time series is confirmed. In contrast to the other two FOWT models that rely on a PFMD approach, the buoyancy calculation at the instantaneous position and submerged volume, the viscous excitation, and the MacCamy–Fuchs correction model the wave excitation in this Morison representation. The boxplots show a closely matched distribution of the data, with the most prominent difference being visible in the surge DOF and in the 99 % quantile of the fairlead tension in line 2 (Fig. 15e and h). However, this is not caused by hydrodynamic treatment but is due to the coupled effects that the servo-dynamics have on the overall response of the turbine, as is discussed next.
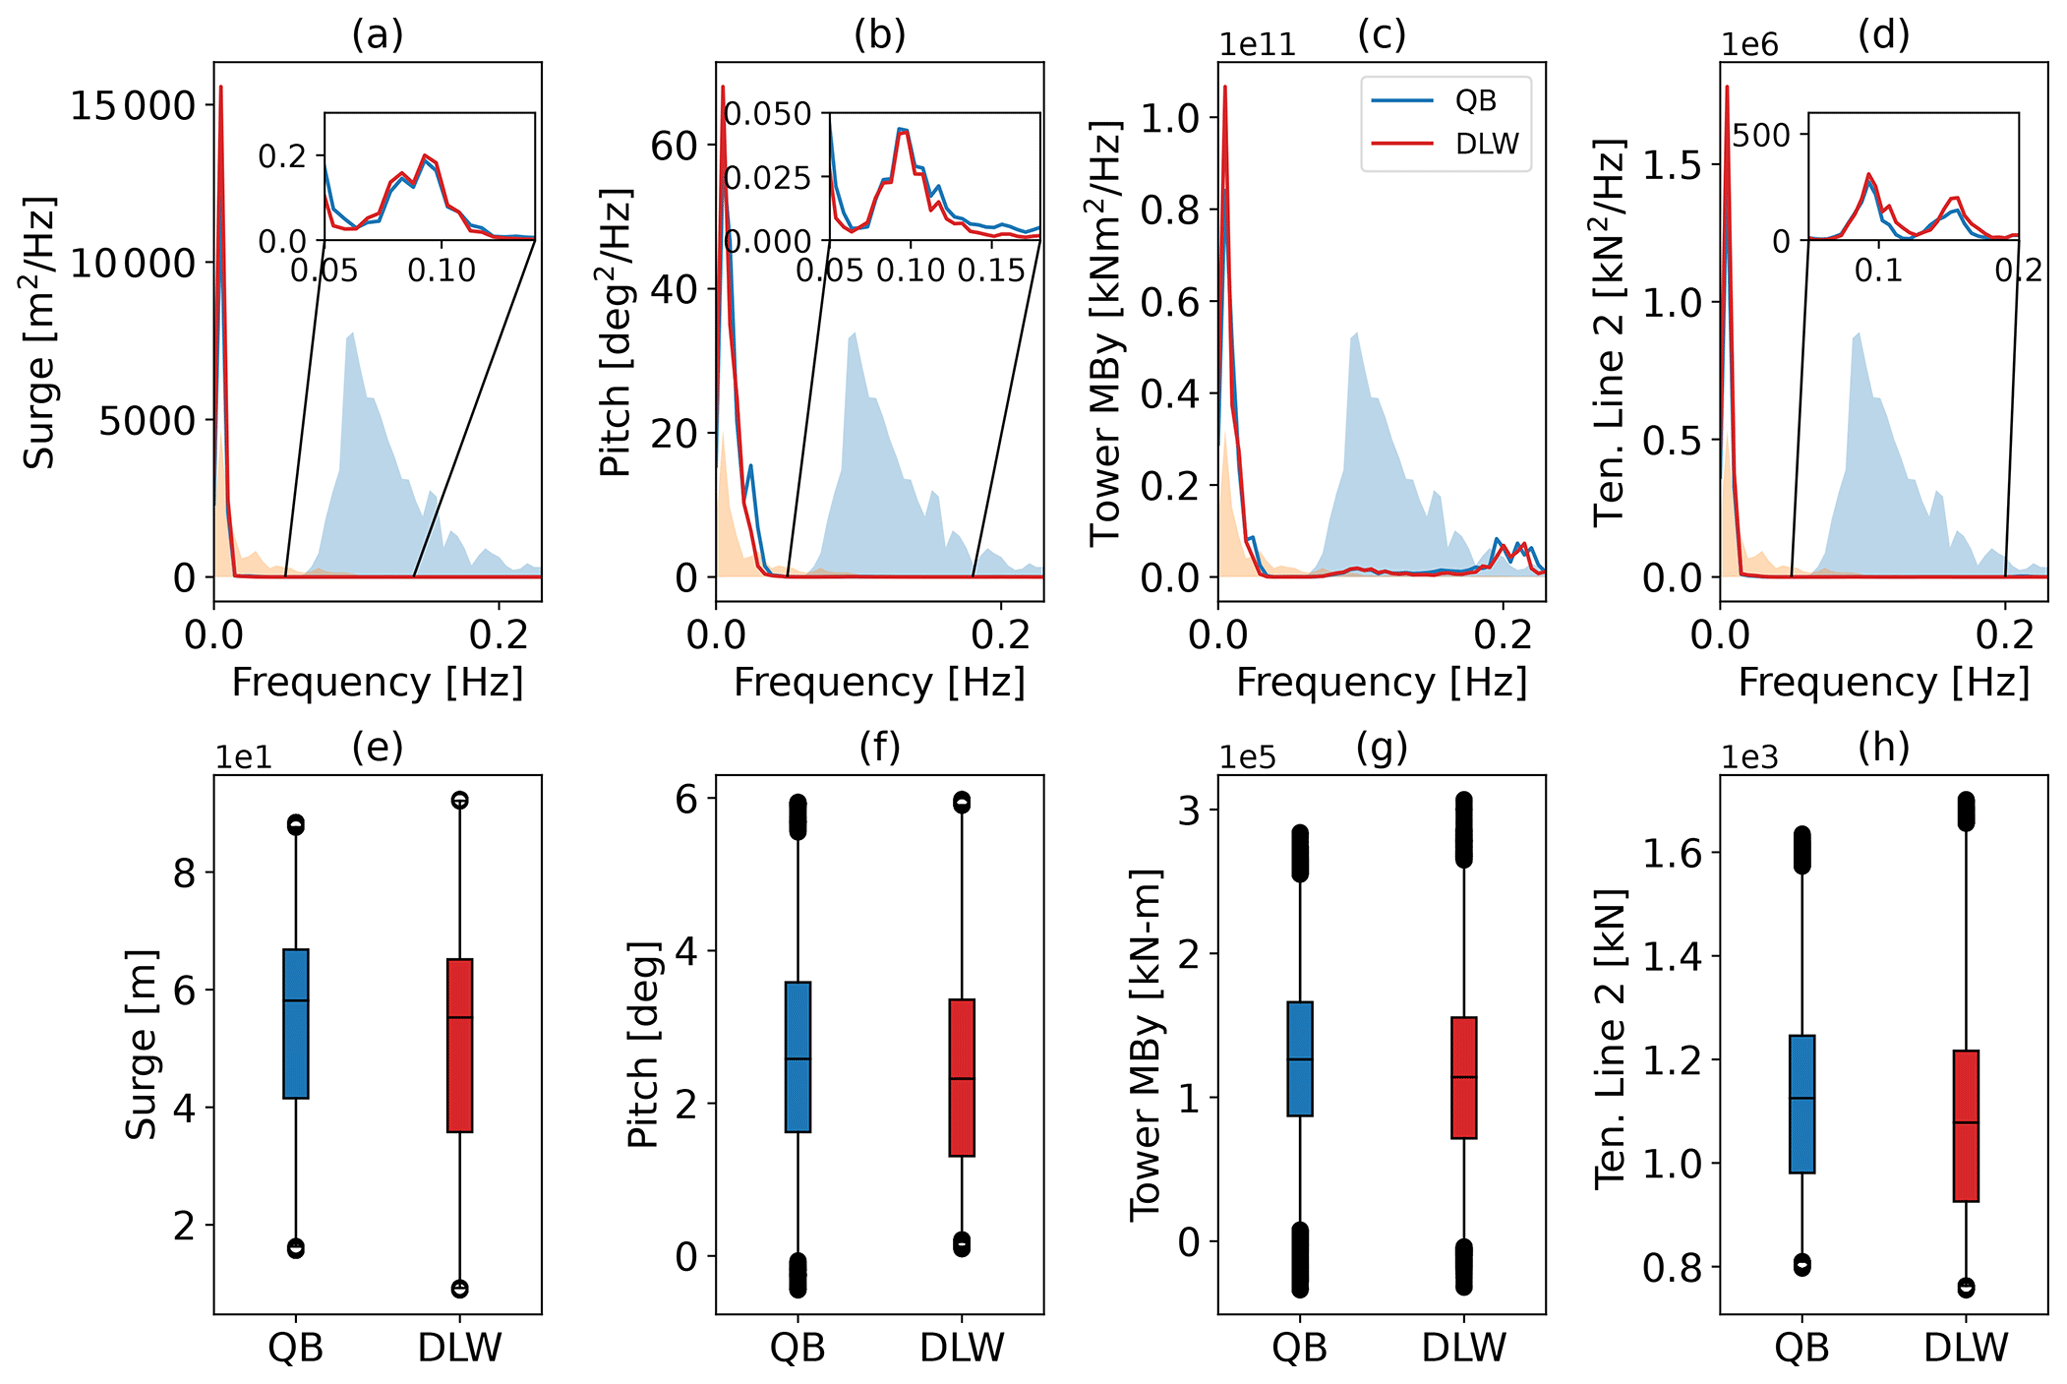
Figure 15Hexafloat model response to TC 4.1 – irregular wave and wind excitation. PSD of the (a) surge CoG motion, (b) pitch motion, (c) tower base fore–aft moment, and (d) fairlead tension in line 2 and the corresponding box–whisker plots (e)–(h). The qualitative wave (blue) and wind (red) spectra are displayed with the transparent color in the background for reference.
The small deviation described above in the floater pitch response can partially be traced back to the rotational speed that is controlled by the ROSCO controller. Figure 16 displays for reference the floater pitch along with the rotational speed which contains a high-frequency component in the QBlade results that is not captured in DeepLines WindTM (Fig. 16a and b).
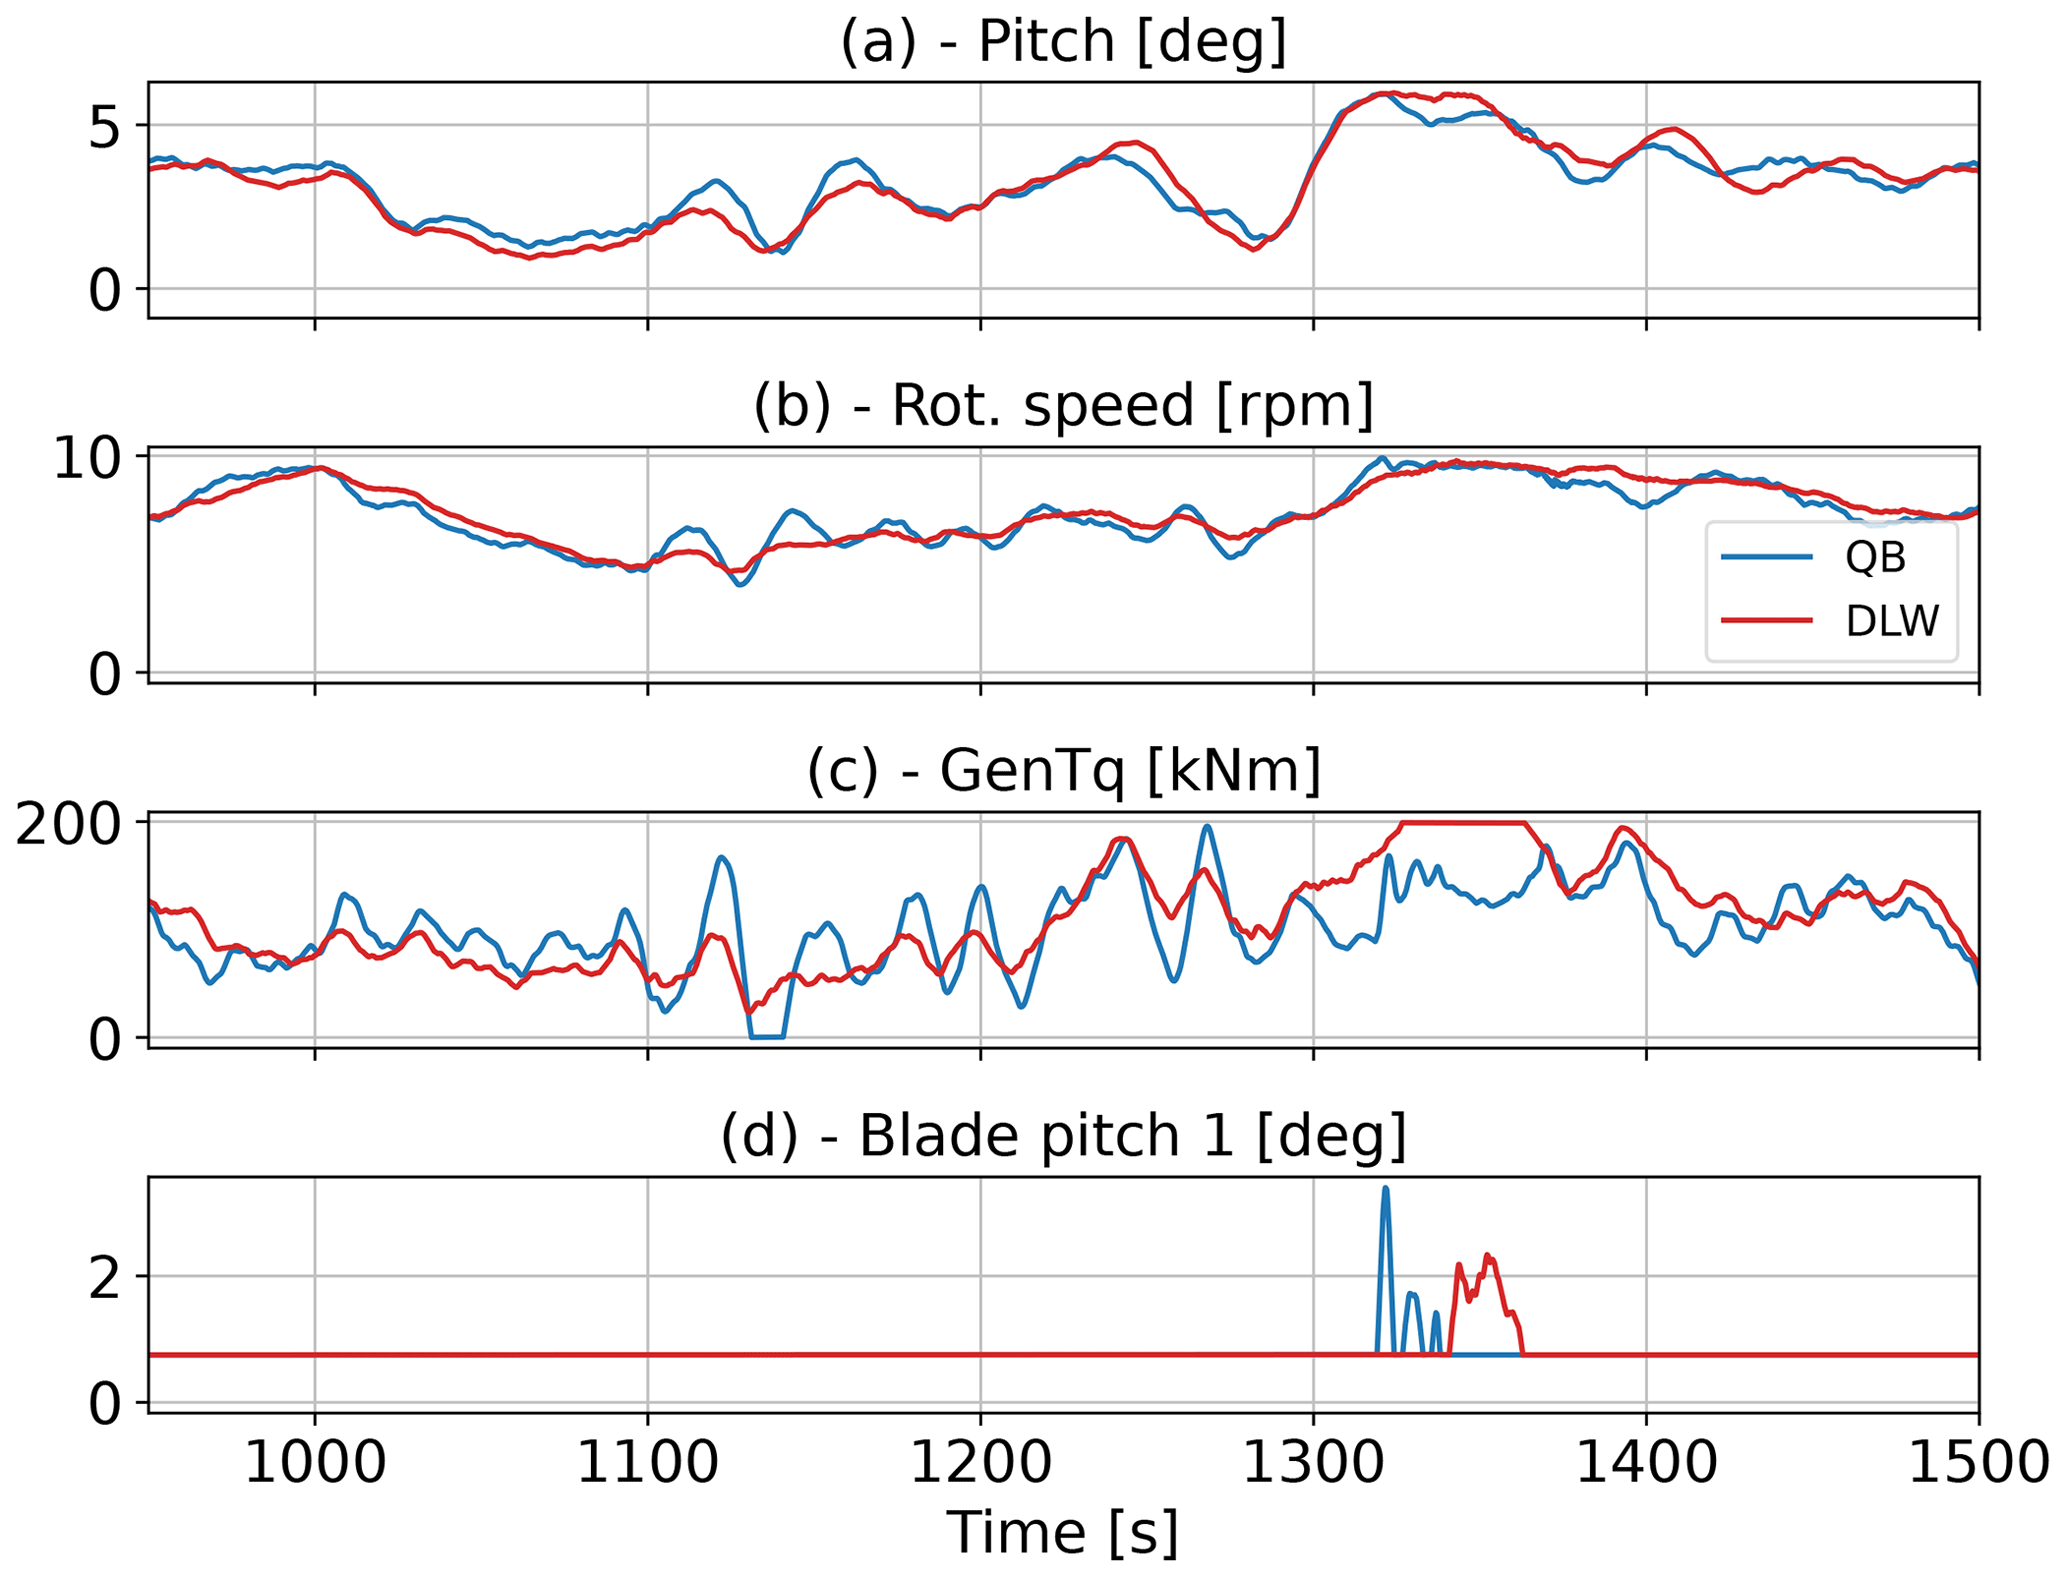
Figure 16Hexafloat model controller actuation (ROSCO v2.4.1) – combined irregular wave and wind excitation: (a) platform pitch, (b) rotor speed, (c) generator torque (high-speed shaft), and (d) blade pitch.
As a result of the small spikes visible in the rotational speed time series, the thrust force will follow this behavior in QBlade and thus causes the slightly increased pitch motion of the floating platform. Following the causal chain further, this deviation is visible in the generator torque (Fig. 16c), where DeepLines WindTM predicts a calmer torque control response compared to QBlade. Since the turbine is operating in a below-rated condition, the blade pitch is only activated temporarily when the rotor speed briefly exceeds rated speed. One example of this can be seen at 1350 s of simulation time, where the increase in rotor speed causes the controller to pitch the blades (Fig. 16d). The controller response in QBlade is more dynamic, and it triggers the controller to activate the blade pitch at a few, much shorter instances. Even though the differences in drivetrain dynamics and the following pitch controller actuation seem to have only a minor influence on overall dynamics, this picture changes drastically when the FOWT operates in regimes with above-rated wind speed. Figure 17 shows an example of this. The turbulent wind in this figure contains velocities above rated between 700 and 1100 s. Here, the rotational speed once again fluctuates more in QBlade compared to DeepLines WindTM, and this leads to larger blade pitch actuation (Fig. 17a and b). The drastic influence on system dynamics is visible in the surge and pitch DOFs. The QBlade model undergoes much larger oscillations with amplitudes of 5.5 m in surge and 4.5° in pitch compared to 1.5 m and 1.2° in DeepLines WindTM. When the wind speed dips below rated and the blade pitch actuation is not required (above 1100 s), the platform surge and pitch responses quickly align (Fig. 16c and d).
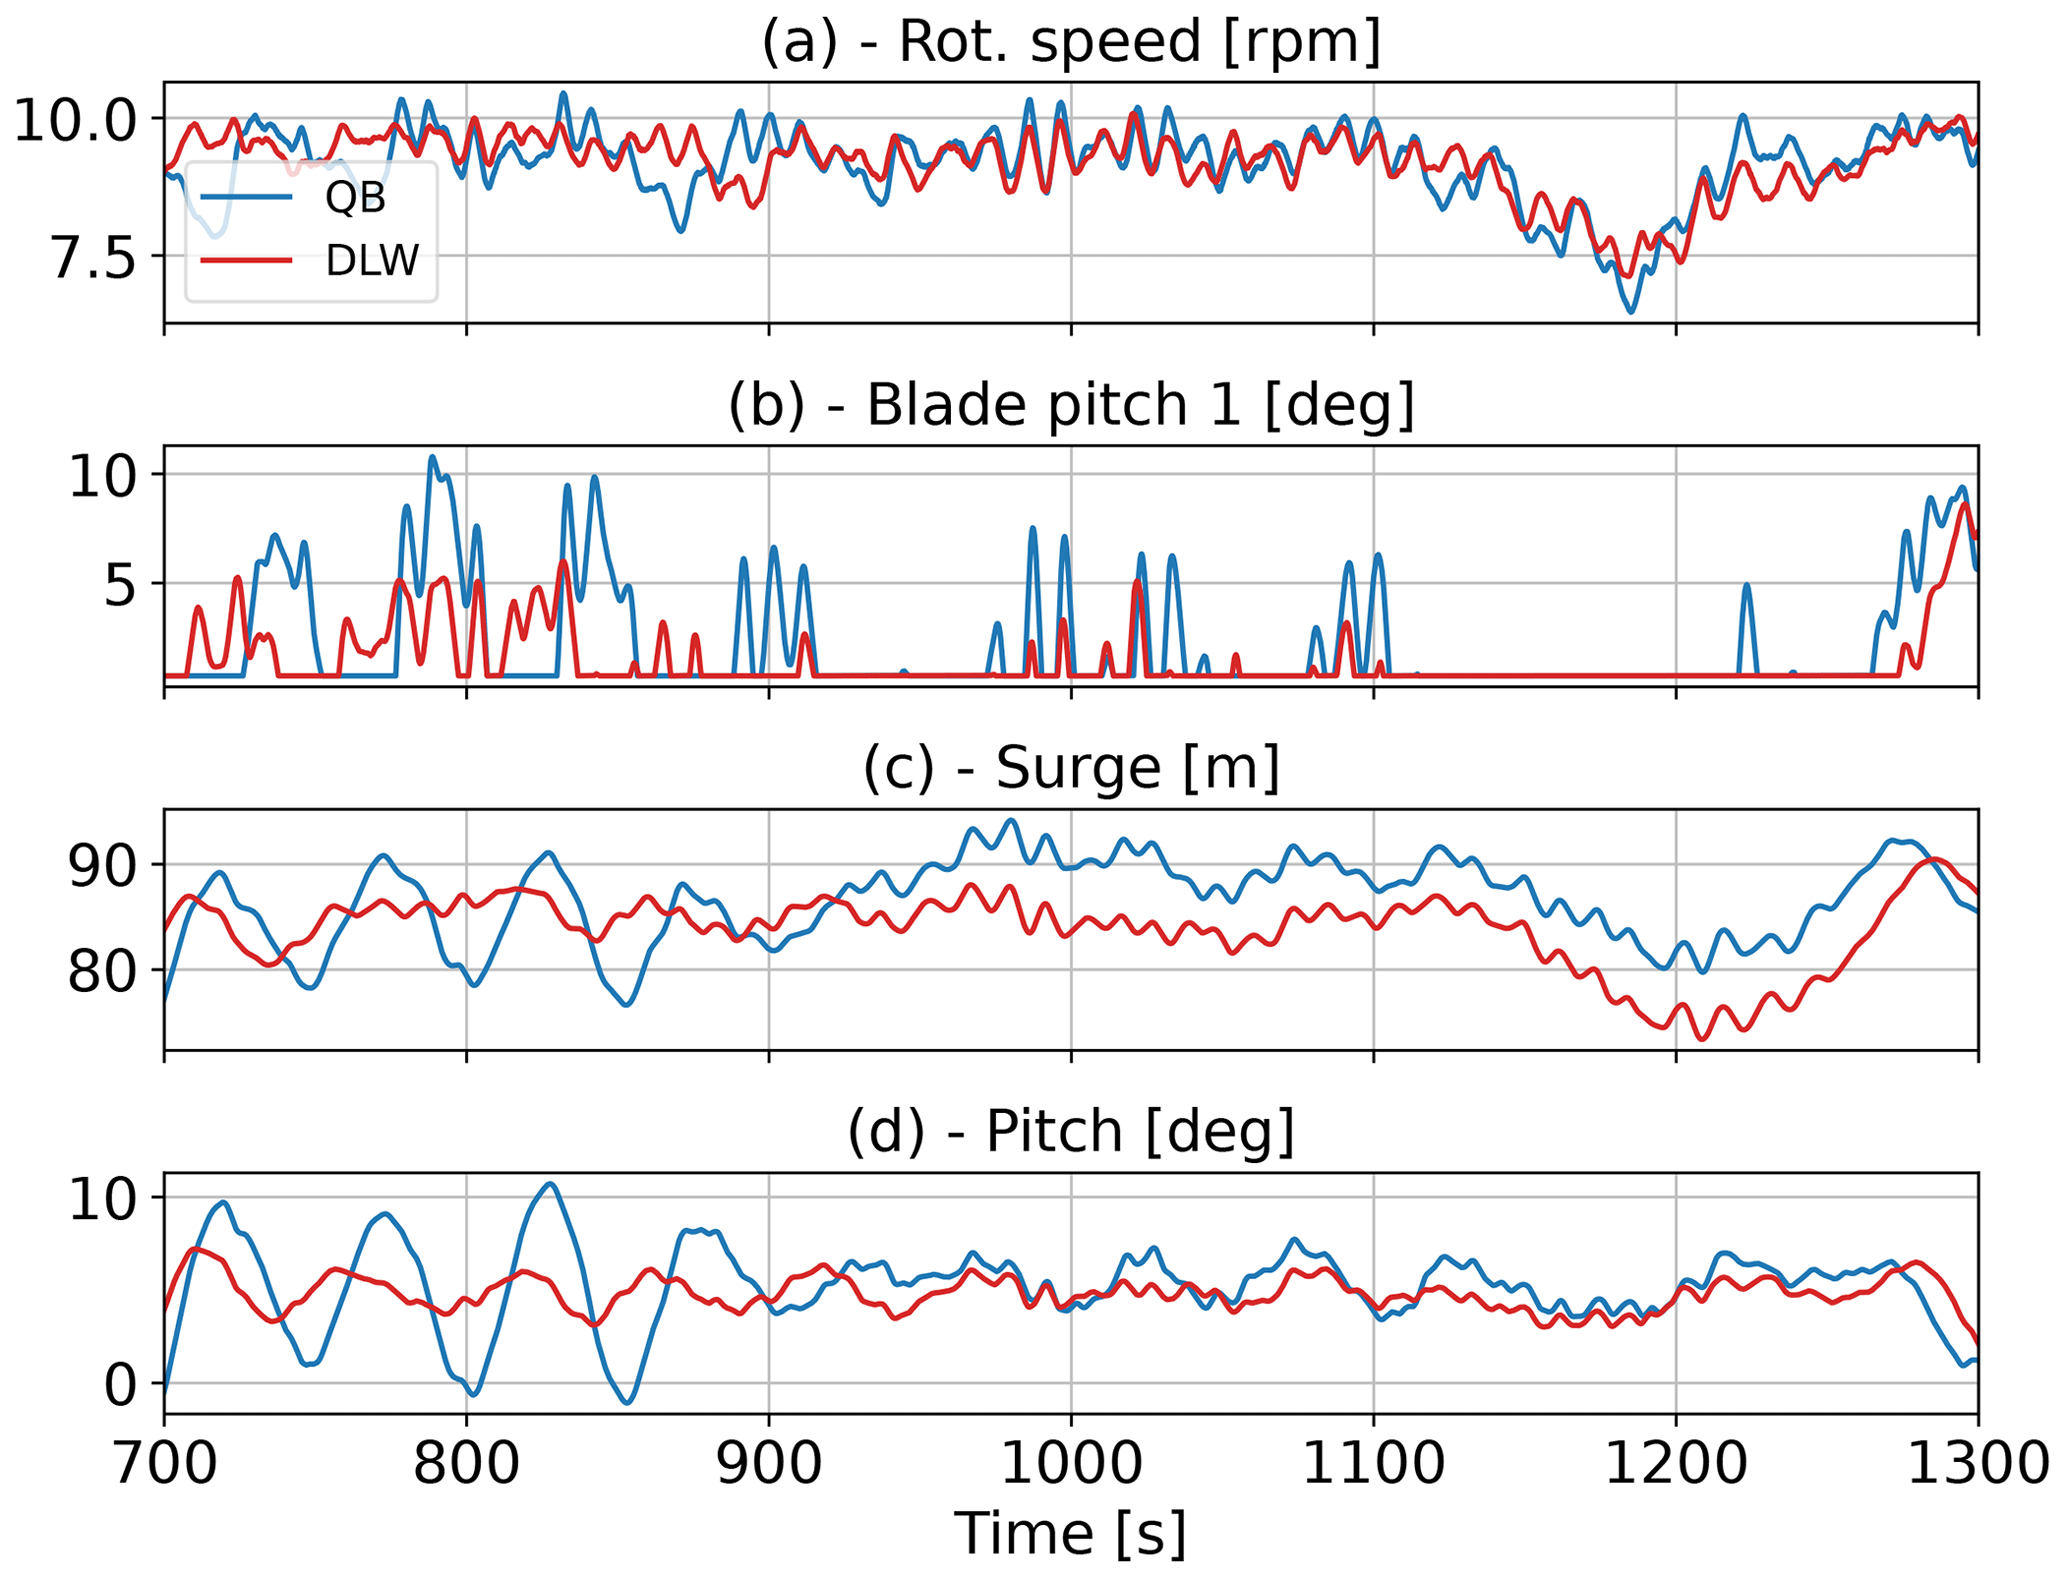
Figure 17Hexafloat model controller actuation and motion response – combined irregular wave and wind excitation: (a) rotor speed, (b) blade pitch, (c) platform surge, and (d) platform pitch. Wind with 11.4 m s−1, 15 % TI, and wave field with JONSWAP spectrum with H=7.7 m and T=12.4 s.
We do not yet fully understand the large differences seen for this model when above-rated conditions are present, especially given the accuracy of the QBlade results compared to OpenFAST and the Softwind experiment in above-rated conditions, which also include a controller. Further research must be carried out to better understand this phenomenon and isolate whether it emerges from differences between QBlade and DeepLines WindTM in the aerodynamic treatment or the controller interface.
In this work, the hydrodynamic module QBlade-Ocean, developed to expand the capabilities of the wind turbine simulation tool QBlade for offshore simulations, is verified and validated on three floating offshore wind turbine models. The three models encompass a variety of different substructure concepts. They are the semi-submersible OC5, Softwind, and Hexafloat FOWTs. In the case of the former two, an experimental campaign was used to validate the results produced within QBlade. Furthermore, equivalent models were built in OpenFAST to verify the results with state-of-the-art code. In the case of the Hexafloat model, a code-to-code comparison with the simulation tool DeepLines WindTM was carried out. The OC5 and Softwind models were simulated using potential flow theory combined with Morison drag, whereas the Hexafloat model was simulated using a strip-theory-based full-Morison approach. Additionally, an enhanced method to improve the prediction of excitation within the resonant frequencies developed by Wang et al. (2022) has been tested in various conditions, including turbulent wind and irregular waves. The influence of the wave stretching type on the method's efficacy and a parameter study indicating its sensitivity have been shown.
In the decay tests, both QBlade and OpenFAST aligned well with the experimental results, thus validating the implementation of the radiation forces and Morison drag. As is common practice, both tools required minor tuning of damping and stiffness parameters to fully align with the reference.
Regular wave excitation cases validated the implementation of diffraction effects and Froude–Krylov forces. In QBlade they can be modeled either through potential flow theory (OC5 and Softwind) or through the use of the full-Morison equation with the MacCamy–Fuchs correction combined with explicitly calculating the buoyancy based on the instantaneous submerged volume (Hexafloat). The RAOs in relation to the reference experimental results and to DeepLines WindTM validated and verified both approaches in QBlade. The observed differences in the experiments were comparable to those of OpenFAST and amounted to less than 3 % in surge, 6 % in heave, and 12 % in pitch. The enhanced model showed a 50 % reduction in the heave RAO of the OC5 model, revealing shortcomings in its applicability in regular wave regimes. However, it was the only one to capture non-linear excitation effects from the regular wave field generated during the experiment and accurately predicted its influence on the tower load amplitudes at regular wave frequency.
In the next step, QBlade's ability to capture non-linear excitation and more complex system dynamics was verified with irregular wave excitation. For the FOWTs modeled with PFMD, sum and difference frequency quadratic transfer functions (OC5) and Newman's approximation (Softwind) were applied to capture the mean drift and non-linear forces. For the full-Morison treatment, weak, non-linear excitation was calculated through the application of hydrodynamic loads at the instantaneous position. The analysis of the conventional numerical models in the spectral space confirmed the observations made throughout the OC5 and OC6 collaborations; non-linear excitation frequencies were captured accurately but with a considerably dampened response compared to experiments. QBlade underestimated the IQR in surge and pitch by 28 % and 22 %, respectively – a slight improvement compared to OpenFAST (32 % and 23 %), which can be attributed to the Wheeler stretching method. The main cause for this deviation lies in the underprediction of the non-linear response, which is significantly improved with the enhanced model. Consequently, the IQR in surge and pitch is overpredicted by only 6 % and 2 %, respectively. The analysis of the PSDs for the Softwind model showed similar responses between the QBlade and OpenFAST models in the linear wave frequency range for platform motions and loads. Again, the enhanced model demonstrated significant improvements in the non-linear motion response in the surge DOF and the corresponding load sensors. Specifically, the enhanced model resulted in a 14 % underestimation of the surge IQR, compared to the 29 % underestimation observed for the baseline QBlade and OpenFAST models. Compared to the OC5 semi-submersible, both baseline models demonstrated better accuracy in capturing the non-linear pitch response for the Softwind spar. Nevertheless, the improved model still demonstrated better alignment with the experiment. The comparison to DeepLines WindTM, based on the Hexafloat model, showed good accordance in the frequency domain, with modestly increased energy within the several peaks predicted by QBlade. In terms of interquartile ranges, this led to an increase in the spread by 14 % in surge and 19 % in pitch motions.
The final test case validated and verified the fully coupled aero-hydro-servo-elastic response predicted by QBlade for the three FOWTs. The discrepancy within the non-linear excitation in the natural frequencies of the PFMD models continued to be noticeable for the conventional methods, albeit less significantly due to aerodynamic damping. QBlade produced improvements of 3 and 5 percentage points over OpenFAST in the surge interquartile range for the OC5 and Softwind models, respectively, due to Wheeler stretching. In contrast to the wave-only cases, the enhanced model produced only modest improvements over the baseline QBlade model in the surge DOF that amounted to 4 percentage points for the OC5 platform and no improvement for Softwind. The cause of the reduced efficacy in surge is the constrained floater movement under wind loads, which leads to reduced viscous excitation. However, in the pitch DOF, the treatment of the axial heave plate drag remained effective with a 9 percentage point improvement concerning the IQR of the OC5 platform over the baseline model. The code-to-code comparison on Hexafloat demonstrated the influence of minor differences in the controller actuation on the overall system dynamics. It was found that the combination of an extremely slack mooring system, a minor increase in the motion response to the linear wave spectrum in QBlade, and a more inert behavior of the drivetrain dynamics in DeepLines WindTM led to differences in the dynamics of the platform pitch. These differences between QBlade and DeepLines WindTM were vastly amplified when operating conditions above-rated wind speed were analyzed. Here, amplitudes in the substructure pitch oscillations of up to 4.5° were seen in QBlade compared to 1.2° in DeepLines WindTM.
Concluding this study, the simulation suite QBlade was expanded by a hydrodynamic module called QBlade-Ocean. The flexible framework of QBlade allows for the combination of different modeling approaches. The PFMD and full-Morison approaches were validated with two experimental campaigns and verified against the state-of-the-art simulation tools OpenFAST and DeepLines WindTM. The results of QBlade-Ocean showed good agreement with both tools and the experimental results. The largest differences that were seen were related to the application of distinct aerodynamic and structural models on the Hexafloat FOWT. In the case of QBlade, these models have been validated in previous studies. Since a floating offshore wind turbine is a complex, tightly coupled multi-disciplinary system, differences in the modeling approaches will influence the overall dynamics and loads of the system. Moreover, the inclusion of an enhanced hydrodynamic model, developed by Wang et al. (2022), to capture viscous excitation improved the prediction of non-linear floater response significantly under hydrodynamic excitation. However, when aerodynamic loads were included, the enhanced model demonstrated less effectiveness.
In Part 2 of this work (Papi et al., 2023), a quantitative analysis to determine the effects of using higher-fidelity modeling methods (LLFVW, structural dynamics) during FOWT simulations on design driving loads during realistic environmental conditions is carried out. Future work will focus on the integration of QBlade with optimization algorithms, where the increased fidelity in the structural and aerodynamic methods could be leveraged to facilitate the development of more accurate surrogate models, which in turn can be included efficiently in optimization problems.
| BEM | Blade element momentum theory |
| DOF | Degree of freedom |
| DLW | DeepLines WindTM |
| Ext stretch | Extrapolation stretching |
| FEA | Finite element analysis |
| FOWT | Floating offshore wind turbine |
| GUI | Graphical user interface |
| HST | High static thrust |
| LLFVW | Lifting-line free vortex wake |
| MARIN | Maritime Research Institute Netherlands |
| MSWT | MARIN stock wind turbine |
| NREL | National Renewable Energy Laboratory |
| PFMD | Potential flow approach with the addition of Morison drag |
| PSD | Power spectral density |
| QTF | Quadratic transfer function |
| RNA | Rotor-nacelle assembly |
| RWT | Research wind turbine |
| SIL | Software in the loop |
| TSR | Tip speed ratio |
| TUB | Technische Universität Berlin |
| Whe stretch | Wheeler stretching |
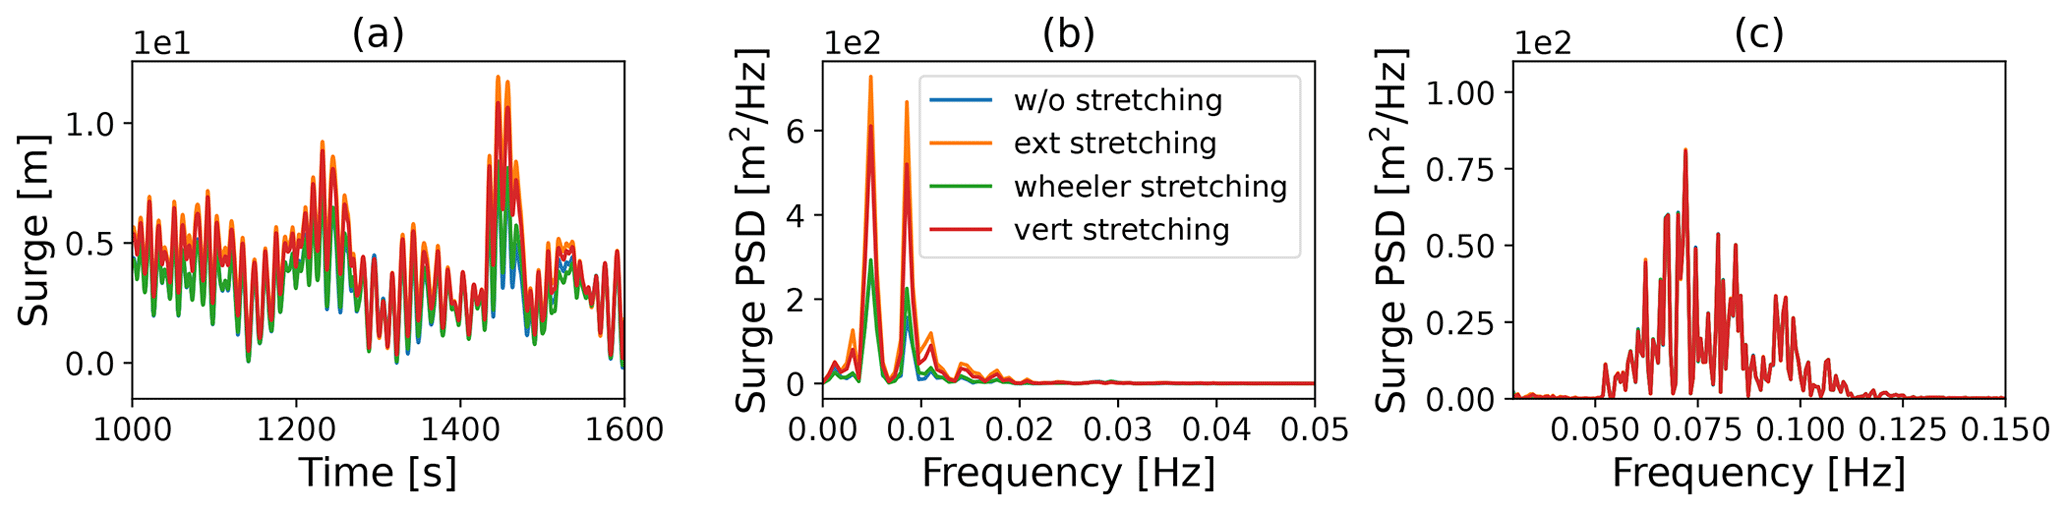
Figure A1Influence of kinematic wave stretching on the OC5 model motion response in the surge DOF. JONSWAP spectrum with Hs=8.1 m and Tp=12.7 s. Panel (a) shows an excerpt of the time series, (b) the non-linear response, and (c) the response within the linear wave frequency range.
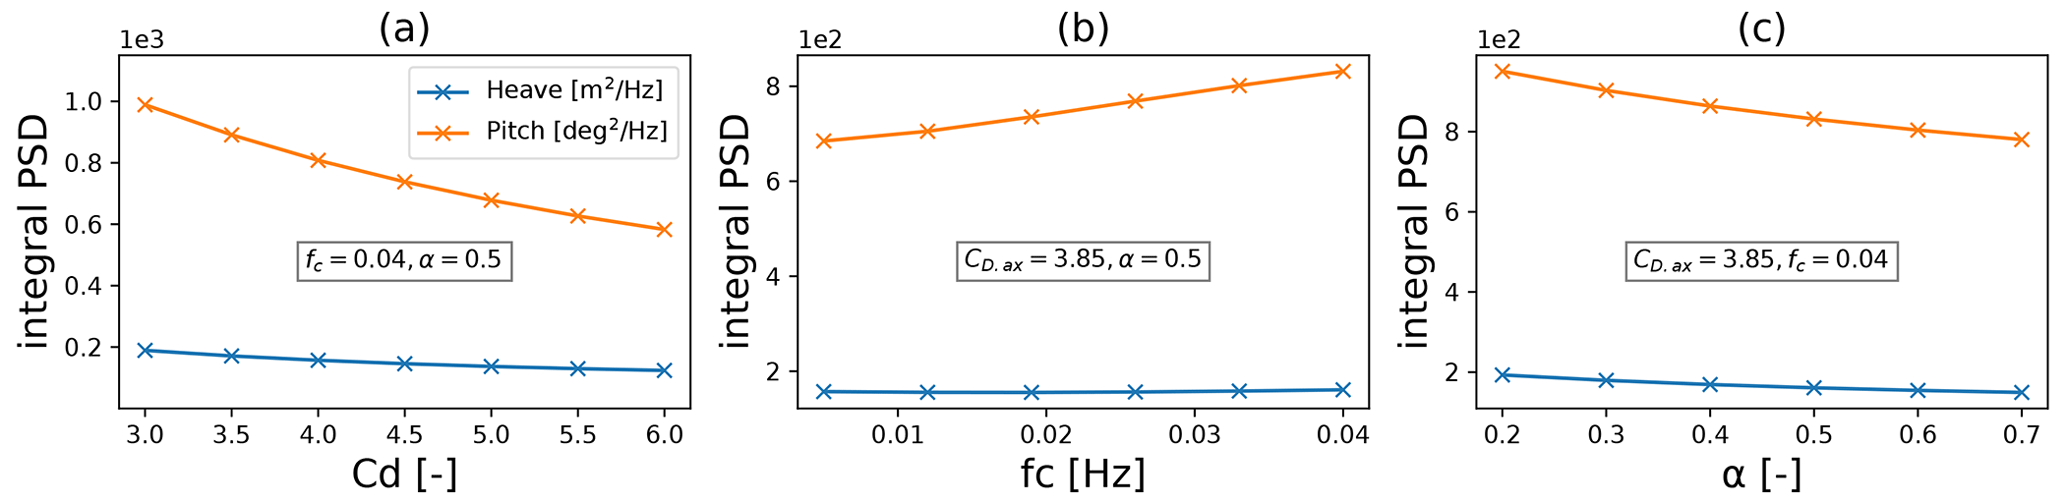
Figure A2Influence of the (a) axial drag coefficient, (b) cutoff frequency, and (c) weight factor on the integral of the non-linear PSD peak in the heave and pitch DOFs of the OC5 model (integral from 0–0.066 Hz).
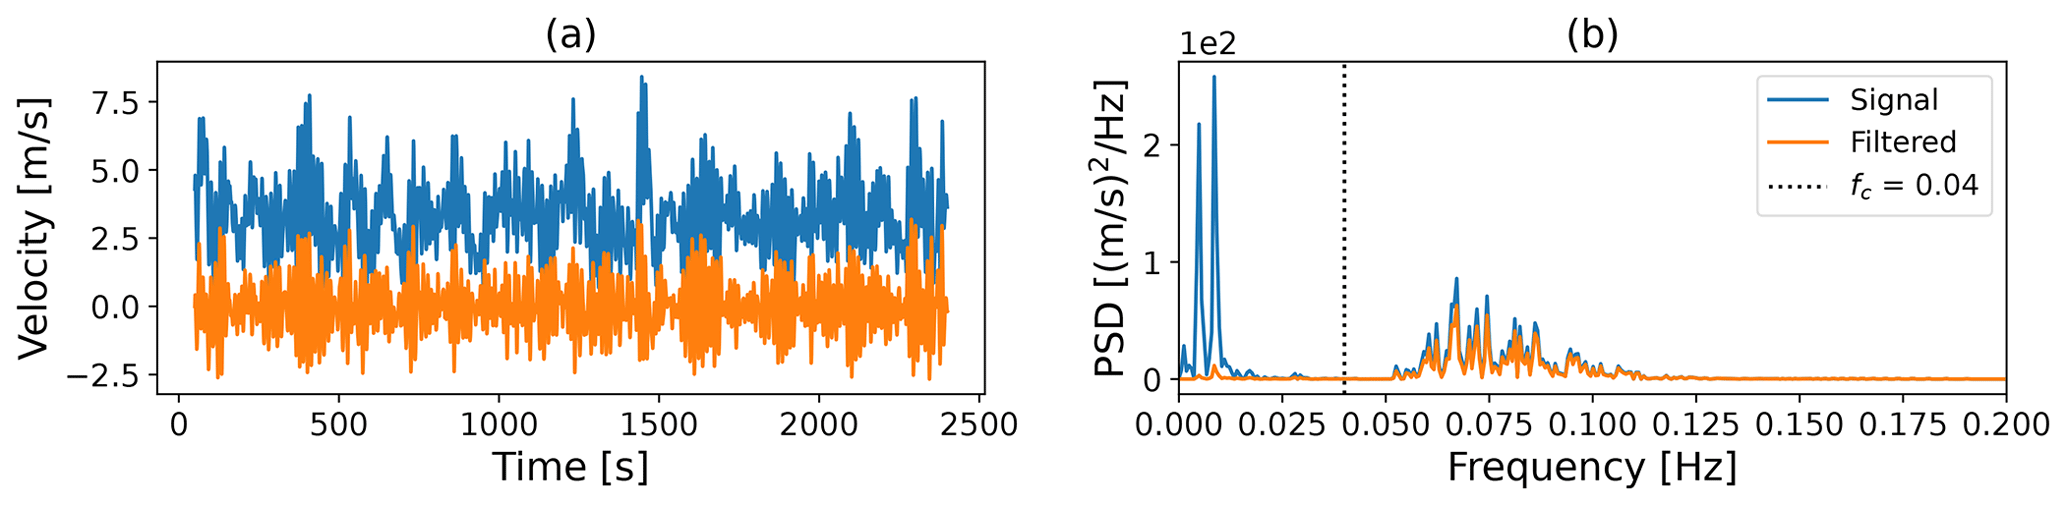
Figure A3High-pass filter, as defined by Wang et al. (2022), applied on a velocity signal in a global z direction. Cutoff frequency fc=0.04 Hz. Displayed is the time signal (a) and the corresponding PSD (b).
The three QBlade models that are used in this study can be accessed under the following DOIs:
- i.
OC5 – https://doi.org/10.5281/zenodo.10634206 (Behrens de Luna, 2024),
- ii.
Softwind – https://doi.org/10.5281/zenodo.10634540 (Perez-Becker et al., 2024), and
- iii.
Hexafloat – https://doi.org/10.5281/zenodo.10634616 (Perez-Becker and Behrens de Luna, 2024).
All authors contributed to this work. In particular, the numerical models in QBlade, OpenFAST, and DeepLines WindTM were built and simulated by the groups at TUB, the University of Florence, and MLD, respectively. FB provided the necessary information to accurately build and tune the Softwind FOWT and offered consultation on the interpretation of the corresponding experimental results.
At least one of the (co-)authors is a member of the editorial board of Wind Energy Science. The peer-review process was guided by an independent editor, and the authors also have no other competing interests to declare.
Publisher's note: Copernicus Publications remains neutral with regard to jurisdictional claims made in the text, published maps, institutional affiliations, or any other geographical representation in this paper. While Copernicus Publications makes every effort to include appropriate place names, the final responsibility lies with the authors.
This work has received funding from the European Union's Horizon 2020 research and innovation program under grant agreement no. 101007142.
This research has been supported by the Horizon 2020 (grant no. 101007142).
This open-access publication was funded by Technische Universität Berlin.
This paper was edited by Erin Bachynski-Polić and reviewed by three anonymous referees.
Arnal, V.: Experimental Modelling of a floating wind turbine using a “software-in-the-loop” approach, PhD thesis, ECN, https://theses.hal.science/tel-03237441 (last access: 13 March 2024), 2020. a, b, c
Azcona, J., Bouchotrouch, F., and Vittori, F.: Low-frequency dynamics of a floating wind turbine in wave tank–scaled experiments with SiL hybrid method, Wind Energy, 22, 1402–1413, https://doi.org/10.1002/we.2377, 2019. a
Babarit, A. and Delhommeau, G.: Theoretical and numerical aspects of the open source BEM solver NEMOH, in: 11th European Wave and Tidal Energy Conference (EWTEC2015), Nantes, France, https://hal.science/hal-01198800 (last access: 13 March 2024), 2015. a
Bak, C., Zahle, F., Bitsche, R., Kim, T., Yde, A., Henriksen, L., Natarajan, A., and Hansen, M.: Description of the DTU 10 MW Reference Wind Turbine, DTU Wind Energy Report-I-0092, DTU Wind Energy, https://orbit.dtu.dk/en/publications/the-dtu-10-mw-reference-wind-turbine (last access: 13 March 2024), 2013. a, b, c
Behrens de Luna, R.: Deliverable 2.1 Aero-hydro-elastic model definition – OC5 5 MW MSWT, version 5.0.0, Zenodo [data set], https://doi.org/10.5281/zenodo.10634206, 2024. a
Behrens de Luna, R., Marten, D., Barlas, T., Horcas, S. G., Ramos-García, N., Li, A., and Paschereit, C. O.: Comparison of different fidelity aerodynamic solvers on the IEA 10 MW turbine including novel tip extension geometries, J. Phys.: Conf. Ser., 2265, 032002, https://doi.org/10.1088/1742-6596/2265/3/032002, 2022. a
Böhm, M., Robertson, A., Hübler, C., Rolfes, R., and Schaumann, P.: Optimization-based calibration of hydrodynamic drag coefficients for a semisubmersible platform using experimental data of an irregular sea state, J. Phys.: Conf. Ser., 1669, 012023, https://doi.org/10.1088/1742-6596/1669/1/012023, 2020. a
Burton, T., Sharpe, D., Jenkins, N., and Bossanyi, E.: Wind Energy Handbook, John Wiley & Sons, ISBN 978-0-471-48997-9, 2001. a, b
Chopra, A. K.: Dynamics of Structures Theory and Applications to Earthquake Engineering, Pearson Education Limited, UK, ISBN 978-0-273-77426-6, 2014. a
Clement, C.: Investigation of Floating Offshore Wind Turbine Hydrodynamics with Computational Fluid Dynamics, PhD thesis, Normandie Université, http://www.theses.fr/2021NORMR028/document (last access: 13 March 2024), 2021. a
Deperrois, A.: XFLR5 Website, http://www.xflr5.tech/xflr5.htm (last access: 14 August 2023), 2023. a
Drela, M.: XFOIL: An Analysis and Design System for Low Reynolds Number Airfoils, in: vol. 54, Springer, ISBN 978-3-540-51884-6, https://doi.org/10.1007/978-3-642-84010-4_1, 1989. a
ElastoDyn: Online documentation, https://openfast.readthedocs.io/en/dev/source/user/elastodyn/index.html (last access: 14 August 2023), 2023. a
Faltinsen, O. M.: Sea loads on ships and offshore structures, Cambridge University Press, ISBN 0521458706, https://www.osti.gov/biblio/5464335 (last access: 13 March 2024), 1990. a, b
FLOATECH: Project Website, https://www.floatech-project.com/ (last access: 23 August 2023), 2020. a
Goupee, A., Kimball, R., Ridder, E.-J., Helder, J., Robertson, A., and Jonkman, J.: A calibrated blade-element/momentum theory aerodynamic model of the MARIN stock wind turbine, 584–592, https://onepetro.org/ISOPEIOPEC/proceedings-abstract/ISOPE15/All-ISOPE15/ISOPE-I-15-104/14454 (last access: 13 March 2024), 2015. a, b, c
Gueydon, S., Duarte, T., and Jonkman, J.: Comparison of Second-Order Loads on a Semisubmersible Floating Wind Turbine, V09AT09A024, American Society Of Mechanical Engineers, https://doi.org/10.1115/OMAE2014-23398, 2014. a
Hall, M. and Goupee, A.: Validation of a lumped-mass mooring line model with DeepCwind semisubmersible model test data, Ocean Eng., 104, 590–603, https://doi.org/10.1016/j.oceaneng.2015.05.035, 2015. a
Hansen, M. H. and Henriksen, L. C.: Basic DTU Wind Energy controller, no. 0028 in DTU Wind Energy E, DTU Wind Energy, Denmark, https://orbit.dtu.dk/en/publications/basic-dtu-wind-energy-controller (last access: 13 March 2024), 2013. a, b
HydroDyn: Online documentation, https://openfast.readthedocs.io/en/dev/source/user/hydrodyn/index.html (last access: 14 August 2023), 2023. a
Jeon, M., Lee, S., and Lee, S.: Unsteady aerodynamics of offshore floating wind turbines in platform pitching motion using vortex lattice method, Renew. Energy, 65, 207–212, https://doi.org/10.1016/j.renene.2013.09.009, 2014. a
Jonkman, B., Buhl, M., and Jonkman, J.: OpenFAST GitHub Repository, GitHub, https://github.com/old-NWTC/FAST (last access: 13 March 2024), 2019. a, b, c
Jonkman, J.: Definition of the Floating System for Phase IV of OC3, NREL technical report, NREL, https://doi.org/10.2172/979456, 2010. a
Jonkman, J., Jonkman, B., and Dimiani, R.: AeroDyn v14, https://github.com/OpenFAST/openfast/tree/main/modules/aerodyn ( last access: 6 September 2023), 2023. a, b
Jonkman, J. M. and Buhl Jr., M. L.: FAST User's Guide – Updated August 2005, OSTI.GOV, https://doi.org/10.2172/15020796, 2005. a
Kurnia, R. and Ducrozet, G.: NEMOH: Open-source boundary element solver for computation of first- and second-order hydrodynamic loads in the frequency domain, Comput. Phys. Commun., 292, 108885, https://doi.org/10.1016/j.cpc.2023.108885, 2023. a
Larsen, T. and Hansen, A.: How 2 HAWC2, the user's manual, no. 1597(ver. 3-1)(EN) in Denmark, Forskningscenter Risoe. Risoe-R, Risø National Laboratory, ISBN 978-87-550-3583-6, 2007. a
Lemmer, F., Yu, W., and Cheng, P. W.: Iterative Frequency-Domain Response of Floating Offshore Wind Turbines with Parametric Drag, J. Mar. Sci. Eng., 6, 118, https://doi.org/10.3390/jmse6040118, 2018. a
Li, A., Pirrung, G. R., Gaunaa, M., Madsen, H. A., and Horcas, S. G.: A computationally efficient engineering aerodynamic model for swept wind turbine blades, Wind Energ. Sci., 7, 129–160, https://doi.org/10.5194/wes-7-129-2022, 2022. a, b
Li, H. and Bachynski-Polić, E. E.: Analysis of difference-frequency wave loads and quadratic transfer functions on a restrained semi-submersible floating wind turbine, Ocean Eng., 232, 109165, https://doi.org/10.1016/j.oceaneng.2021.109165, 2021. a
Madsen, H. A., Larsen, T. J., Pirrung, G. R., Li, A., and Zahle, F.: Implementation of the blade element momentum model on a polar grid and its aeroelastic load impact, Wind Energ. Sci., 5, 1–27, https://doi.org/10.5194/wes-5-1-2020, 2020. a
Mancini, S., Boorsma, K., Schepers, G., and Savenije, F.: A comparison of dynamic inflow models for the blade element momentum method, Wind Energ. Sci., 8, 193–210, https://doi.org/10.5194/wes-8-193-2023, 2023. a
Marten, D.: QBlade: A Modern Tool for the Aeroelastic Simulation of Wind Turbines, PhD thesis, TUB, https://doi.org/10.14279/depositonce-10646, 2020. a, b, c
Morison, J., Johnson, J., and Schaaf, S.: The Force Exerted by Surface Waves on Piles, J. Petrol. Technol., 2, 149–154, https://doi.org/10.2118/950149-G, 1950. a
Murray, R., Hayman, G., Jonkman, J., and Damiani, R.: AeroDyn V15.04: Design Tool for Wind and MHK Turbines, Tech. rep., MHK, https://doi.org/10.15473/1415580, 2017. a, b
Newman, J. N.: Second-order, slowly-varying Forces on Vessels in Irregular Waves, https://api.semanticscholar.org/CorpusID:125961342 (last access: 13 March 2024), 1974. a
NREL: ROSCO. Version 2.4.1, https://github.com/NREL/ROSCO (last access: 6 September 2023), 2021. a
OpenFAST Documentation: https://openfast.readthedocs.io/en/dev/index.html (last access: 7 September 2023), 2023. a
Papi, F., Troise, G., Behrens de Luna, R., Saverin, J., Perez-Becker, S., Marten, D., Ducasse, M.-L., and Bianchini, A.: A Code-to-Code Comparison for Floating Offshore Wind Turbine Simulation in Realistic Environmental Conditions: Quantifying the Impact of Modeling Fidelity on Different Substructure Concepts, Wind Energ. Sci. Discuss. [preprint], https://doi.org/10.5194/wes-2023-107, in review, 2023. a, b
Pegalajar Jurado, A. and Bredmose, H.: Reproduction of slow-drift motions of a floating wind turbine using second-order hydrodynamics and Operational Modal Analysis, Mar. Struct., 66, 178–196, https://doi.org/10.1016/j.marstruc.2019.02.008, 2019. a
Perdrizet, T., Gilloteaux, J.-C., Teixeira, D., Ferrer, G., Piriou, L., Cadiou, D., Heurtier, J.-M., and Le Cunff, C.: Fully Coupled Floating Wind Turbine Simulator Based on Nonlinear Finite Element Method: Part II – Validation Results, in: Volume 8: Ocean Renewable Energy of International Conference on Offshore Mechanics and Arctic Engineering, Nantes, France, V008T09A052, https://doi.org/10.1115/OMAE2013-10785, 2013. a, b
Perez-Becker, S. and Behrens de Luna, R.: Aero-Hydro-Elastic Model Definition in QBlade-Ocean, Tech. rep., Zenodo, https://doi.org/10.5281/zenodo.6958204, 2022. a, b
Perez-Becker, S. and Behrens de Luna, R.: Deliverable 2.1 Aero-hydro-elastic model definition – DTU 10 MW RWT Hexafloat, version 4.0.0, Zenodo [data set], https://doi.org/10.5281/zenodo.10634616, 2024. a
Perez-Becker, S., Papi, F., Saverin, J., Marten, D., Bianchini, A., and Paschereit, C. O.: Is the Blade Element Momentum theory overestimating wind turbine loads? – An aeroelastic comparison between OpenFAST's AeroDyn and QBlade's Lifting-Line Free Vortex Wake method, Wind Energ. Sci., 5, 721–743, https://doi.org/10.5194/wes-5-721-2020, 2020. a, b, c
Perez-Becker, S., Saverin, J., Behrens de Luna, R., Papi, F., Combreau, C., Ducasse, M.-L., Marten, D., and Bianchini, A.: Validation Report of QBlade-Ocean, Tech. rep., Zenodo, https://doi.org/10.5281/zenodo.7817605, 2022. a, b, c
Perez-Becker, S., Behrens de Luna, R., and Saverin, J.: Deliverable 2.1 Aero-hydro-elastic model definition – SOFTWIND 10 MW FOWT (wave-tank SIL version), version 3.3.0, Zenodo [data set], https://doi.org/10.5281/zenodo.10634540, 2024. a
Principia: Company website, https://www.principia-group.com/blog/product/deeplines-wind/ (last access: 23 August 2023), 2023. a, b
QBlade Documentation: https://docs.qblade.org/ (last access: 23 August 2023), 2022. a, b, c
Ramos‐García, N., Kontos, S., Pegalajar‐Jurado, A., González Horcas, S., and Bredmose, H.: Investigation of the floating IEA Wind 15 MW RWT using vortex methods Part I: Flow regimes and wake recovery, Wind Energy, 25, 468–504, https://doi.org/10.1002/we.2682, 2022. a
Rinker, J., Gaertner, E., Zahle, F., Skrzypiński, W., Abbas, N., Bredmose, H., Barter, G., and Dykes, K.: Comparison of loads from HAWC2 and OpenFAST for the IEA Wind 15 MW Reference Wind Turbine, J. Phys.: Conf. Ser., 1618, 052052, https://doi.org/10.1088/1742-6596/1618/5/052052, 2020. a
Roald, L., Jonkman, J., Robertson, A., and Chokani, N.: The Effect of Second-order Hydrodynamics on Floating Offshore Wind Turbines, Energy Proced., 35, 253–264, https://doi.org/10.1016/j.egypro.2013.07.178, 2013. a
Robertson, A.: Uncertainty Analysis of OC5-DeepCwind Floating Semisubmersible Offshore Wind Test Campaign, https://www.osti.gov/biblio/1416717 (last access: 13 March 2024), 2017. a
Robertson, A.: IEA Wind TCP Task 30 (OC6), https://iea-wind.org/task30/ (last access: 25 August 2023), 2019. a
Robertson, A., Jonkman, J., Wendt, F., Goupee, A., and Dagher, H.: Definition of the OC5 DeepCwind Semisubmersible Floating System, https://a2e.energy.gov/api/datasets/oc5/oc5.phase2/files/oc5.phase2.model.definition-semisubmersible-floating-system-phase2-oc5-ver15.pdf (last access: 13 March 2024), 2014. a, b, c, d
Robertson, A., Wendt, F., Jonkman, J., Popko, W., Dagher, H., Gueydon, S., Qvist, J., Vittori, F., Azcona, J., Uzunoglu, E., Guedes Soares, C., Harries, R., Yde, A., Galinos, C., Hermans, K., Bernardus de Vaal, J., Bozonnet, P., Bouy, L., Bayati, I., Bergua, R., Galvan, J., Mendikoa, I., Barrera Sanchez, C., Shin, H., Oh, S., Molins, C., and Debruyne, Y.: OC5 Project Phase II: Validation of Global Loads of the DeepCwind Floating Semisubmersible Wind Turbine, Energy Proced., 137, 38–57, https://doi.org/10.1016/j.egypro.2017.10.333, 2017. a, b, c, d, e, f
Robertson, A., Gueydon, S., Bachynski, E., Wang, L., Jonkman, J., Alarcón, D., Amet, E., Beardsell, A., Bonnet, P., Boudet, B., Brun, C., Chen, Z., Féron, M., Forbush, D., Galinos, C., Galvan, J., Gilbert, P., Gómez, J., Harnois, V., Haudin, F., Hu, Z., Dreff, J. L., Leimeister, M., Lemmer, F., Li, H., Mckinnon, G., Mendikoa, I., Moghtadaei, A., Netzband, S., Oh, S., Pegalajar-Jurado, A., Nguyen, M. Q., Ruehl, K., Schünemann, P., Shi, W., Shin, H., Si, Y., Surmont, F., Trubat, P., Qwist, J., and Wohlfahrt-Laymann, S.: OC6 Phase I: Investigating the underprediction of low-frequency hydrodynamic loads and responses of a floating wind turbine, J. Phys.: Conf. Ser., 1618, 032033, https://doi.org/10.1088/1742-6596/1618/3/032033, 2020. a
Saverin, J., Perez-Becker, S., Behrens de Luna, R., Marten, D., Gilloteaux, J.-C., and Kurnia, R.: Higher Order Hydroelastic Module, Tech. rep., Zenodo, https://doi.org/10.5281/zenodo.6958081, 2021. a
Shaler, K., Branlard, E., and Platt, A.: OLAF User's Guide and Theory Manual, Tech. Rep. NREL/TP-5000-75959, 1659853, MainId:6799, NREL, https://doi.org/10.2172/1659853, 2020. a, b
Souza do Carmo, L., Mello, P., Malta, E., Franzini, G., Simos, A., Gonçalves, R., and Suzuki, H.: Analysis of a FOWT Model in Bichromatic Waves: An Investigation on the Effect of Combined Wave-Frequency and Slow Motions on the Calibration of Drag and Inertial Force Coefficients, American Society Of Mechanical Engineers, https://doi.org/10.1115/OMAE2020-18239, 2020. a
Tasora, A., Serban, R., Mazhar, H., Pazouki, A., Melanz, D., Fleischmann, J., Taylor, M., Sugiyama, H., and Negrut, D.: Chrono: An Open Source Multi-physics Dynamics Engine, in: Lecture Notes in Computer Science, Springer International Publishing, 19–49, https://doi.org/10.1007/978-3-319-40361-8_2, 2016. a
van Garrel, A.: Development of a Wind Turbine Aerodynamics Simulation Module, Tech. rep., ResearchGate, https://doi.org/10.13140/RG.2.1.2773.8000, 2003. a
Veers, P., Dykes, K., Lantz, E., Barth, S., Bottasso, C. L., Carlson, O., Clifton, A., Green, J., Green, P., Holttinen, H., Laird, D., Lehtomäki, V., Lundquist, J. K., Manwell, J., Marquis, M., Meneveau, C., Moriarty, P., Munduate, X., Muskulus, M., Naughton, J., Pao, L., Paquette, J., Peinke, J., Robertson, A., Sanz Rodrigo, J., Sempreviva, A. M., Smith, J. C., Tuohy, A., and Wiser, R.: Grand challenges in the science of wind energy, Science, 366, eaau2027, https://doi.org/10.1126/science.aau2027, 2019. a
WAMIT Inc.: Wamit User Manual, Version 7.4, Chestnut Hill, USA, https://www.wamit.com/manual7.x/html/wamit_v75manual.html (last access: 13 March 2024), 2024. a
Wang, L., Robertson, A., Jonkman, J., and Yu, Y.-H.: OC6 phase I: Improvements to the OpenFAST predictions of nonlinear, low-frequency responses of a floating offshore wind turbine platform, Renew. Energy, 187, 282–301, https://doi.org/10.1016/j.renene.2022.01.053, 2022. a, b, c, d, e, f, g, h, i, j, k
Wendt, F., Robertson, A., Jonkman, J., and Andersen, M. T.: Verification and Validation of the New Dynamic Mooring Modules Available in FAST v8: Preprint, OSTI.GOV, https://www.osti.gov/biblio/1295390 (last access: 13 March 2024) 2016. a
Yu, W., Müller, K., and Lemmer, F.: Qualification of innovative floating substructures for 10 MW wind turbines and water depths greater than 50 m, Tech. rep., LIFES50+, https://lifes50plus.eu/wp-content/uploads/2018/04/GA_640741_LIFES50_D4.2.pdf (last access: 13 March 2024), 2018. a