the Creative Commons Attribution 4.0 License.
the Creative Commons Attribution 4.0 License.
 | 01 Jun 2026
A total of 19 months of daily weather logging on the US east coast: the WFIP3 event log
Joseph Olson
Brian Gaudet
Giacomo Valerio Iungo
Mojtaba Shams Solari
Sayahnya Roy
Julie K. Lundquist
Nathan Agarwal
Timothy A. Myers
Bianca Adler
Jeffrey D. Mirocha
Eric James
Laura Bianco
James M. Wilczak
David D. Turner
The Third Wind Forecast Improvement Project (WFIP3) is a multi-institutional field campaign designed to advance the understanding and prediction of the offshore atmospheric boundary layer along the US east coast. Extending from February 2024 through August 2025, WFIP3 combines long-term coastal and offshore measurements with targeted modeling and forecasting efforts. This data paper presents the WFIP3 event log, a curated record of 578 d of meteorological phenomena and field observations that complements the campaign's extensive high-frequency datasets. The event log provides both manually documented daily weather discussions and automatically derived indicators of atmospheric processes – including low-level jets, wind ramps, extreme wind veer, and weak wind conditions – based on observations from scanning lidars deployed at three coastal and offshore sites. The dataset offers structured metadata, standardized time and site identifiers, and consistent terminology to facilitate its integration with WFIP3's observational and modeling data products. The log supports diverse applications, from model evaluation and forecast verification to the selection of case studies on offshore boundary-layer dynamics. The WFIP3 event log is publicly available through the US Department of Energy's Wind Data Hub, providing the research community with a transparent and enduring contextual reference for the interpretation and use of WFIP3 measurements.
- Article
(4577 KB) - Full-text XML
- BibTeX
- EndNote


This work was authored in part by the National Laboratory of the Rockies for the U.S. Department of Energy (DOE), operated under Contract No. DE-AC36-08GO28308, by the Lawrence Livermore National Laboratory under contract DE-AC52-07NA27344, and by Pacific Northwest National Laboratory (PNNL), operated by the Battelle Memorial Institute, for the U.S. DOE (contract no. DE-AC05-76RLO1830). Funding provided by U.S. Department of Energy Office of Critical Minerals and Energy Innovation Wind Energy Technologies Office and the NOAA Atmospheric Science for Renewable Energy Program. This research was supported by NOAA cooperative agreement NA22OAR4320151, for the Cooperative Institute for Earth System Research and Data Science (CIESRDS), and by DOE contract DE-EE0009424405 to the Woods Hole Oceanographic Institution. The U.S. Government retains and the publisher, by accepting the article for publication, acknowledges that the U.S. Government retains a nonexclusive, paid-up, irrevocable, worldwide license to publish or reproduce the published form of this work, or allow others to do so, for U.S. Government purposes.
In this data description article, we present the WFIP3 event log, a curated record of weather discussions and field observations associated with the Third Wind Forecast Improvement Project (WFIP3). WFIP3 is a large, multi-institutional field campaign (Kirincich et al., 2026) that combined coastal and offshore measurements collected between early 2024 and the summer of 2025 along the US east coast. Given the extensive duration of WFIP3 and the large number of observations gathered across multiple sites, the WFIP3 event log complements the high-frequency measurement data by providing an easily approachable yet comprehensive temporal account of notable atmospheric phenomena – such as frontal passages, low-level jets, sea breezes, fog, and convection – for each day of the 19 months of the WFIP3 field campaign.
The concept of maintaining a daily event log builds upon the successful framework established during the Second Wind Forecast Improvement Project (WFIP2; Shaw et al., 2019; Wilczak et al., 2019), which demonstrated the value of systematically documenting meteorological events and forecast performance to guide subsequent analyses and model evaluation. The WFIP3 event log provides similar contextual information, essential for the interpretation and quality control of the campaign's measurement records and for the identification of relevant case studies for scientific analyses in the region. The log follows a consistent and simple spreadsheet-based structure with standardized time stamps, site identifiers, and event categories, aiming to enhance the utility of WFIP3 observational data for a broad range of applications, from the evaluation of atmospheric models and forecast systems (Olson et al., 2019) to the planning of future offshore field experiments (Bodini et al., 2025a). Through this open-access resource, we aim to provide the community with a transparent and enduring record of WFIP3 operations, enabling more accurate interpretation of the offshore measurements and fostering collaborative research on offshore boundary-layer processes and wind energy applications.
In this data paper, Sect. 2 provides a brief overview of the WFIP3 campaign, Sect. 3 describes the process used to identify and prioritize the atmospheric phenomena included in the event log, and Sect. 4 outlines the overall structure of the log. Section 5 details the data format, and Sect. 6 highlights notable examples of logged events. Concluding remarks are provided in Sect. 7.
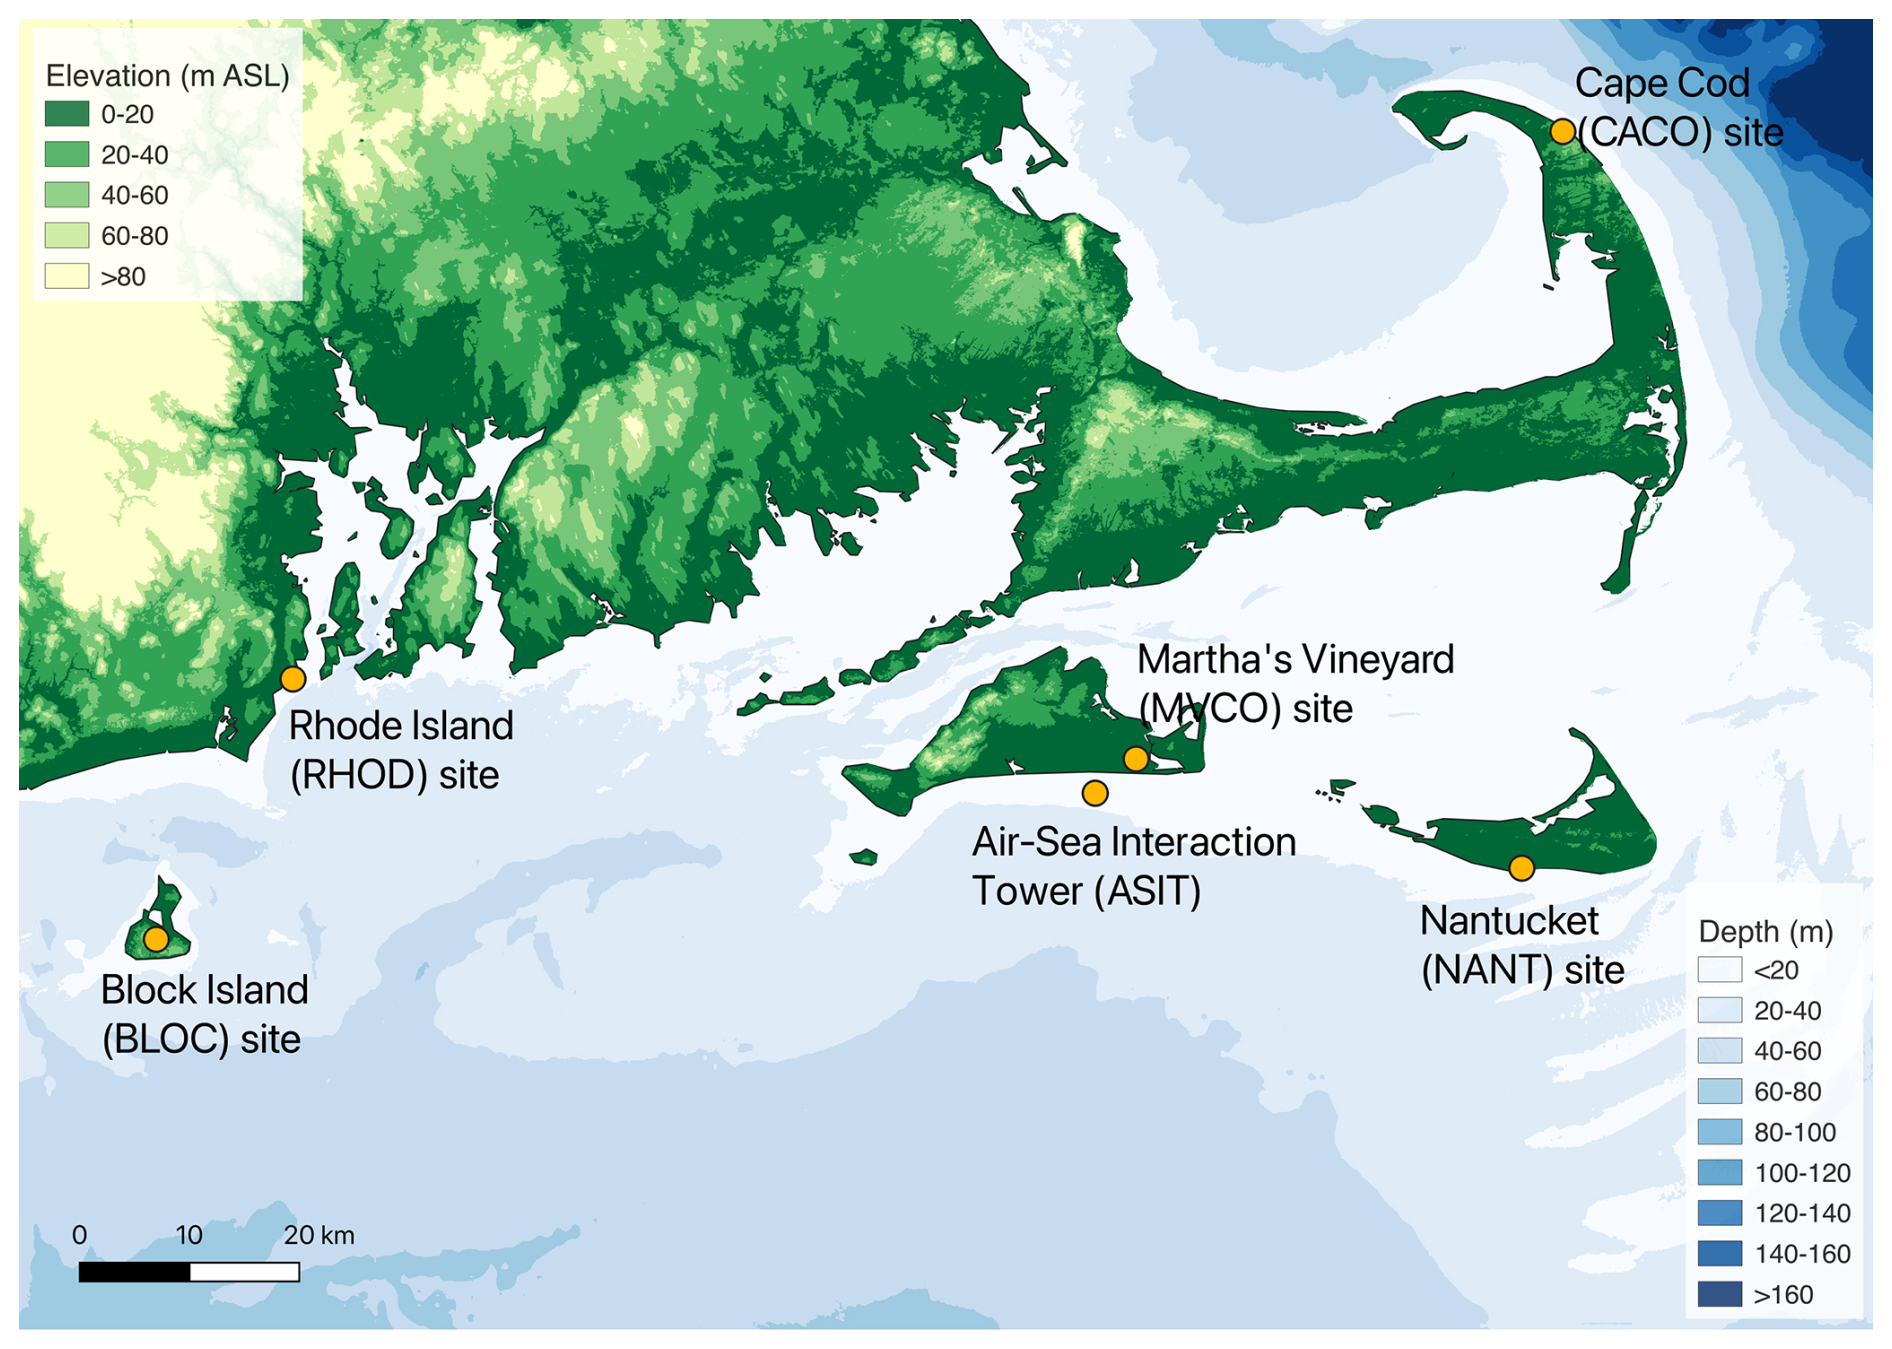
Figure 1Map showing the WFIP3 domain and the main long-term instrumented sites. The manual component of the event log covered the whole region; the automated portion was run using observations collected at sites RHOD (more representative of onshore conditions), BLOC, and NANT (more representative of offshore conditions).
WFIP3 is a multi-institutional field campaign aimed at advancing the scientific understanding and forecasting of the offshore atmospheric boundary layer. Jointly funded by the US Department of Energy (DOE) and the National Oceanic and Atmospheric Administration (NOAA), the project focuses on the southern New England offshore region (Fig. 1), an area of active wind energy development. These coordinated observations provide high-resolution profiles of wind, temperature, and humidity across the marine atmospheric boundary layer – the first of their kind along the US east coast – as well as surface and near-surface measurements. In addition to these primary physical variables, the campaign also captures pressure, aerosol concentrations, and estimates of key indirect parameters such as atmospheric boundary-layer height, turbulence kinetic energy (TKE), and TKE dissipation rate. This comprehensive suite of measurements offers an unprecedented opportunity to evaluate and improve numerical weather prediction models in this data-sparse region. A comprehensive overview of the WFIP3 campaign can be found in Kirincich et al. (2026).
Given the extended duration of the WFIP3 campaign, the research team developed an event log framework to systematically identify and record meteorological processes of particular relevance to offshore wind forecasting and offshore wind energy. This effort aimed to facilitate the discovery of scientifically valuable case studies within the large WFIP3 observational dataset and to support targeted model evaluation and improvement activities.
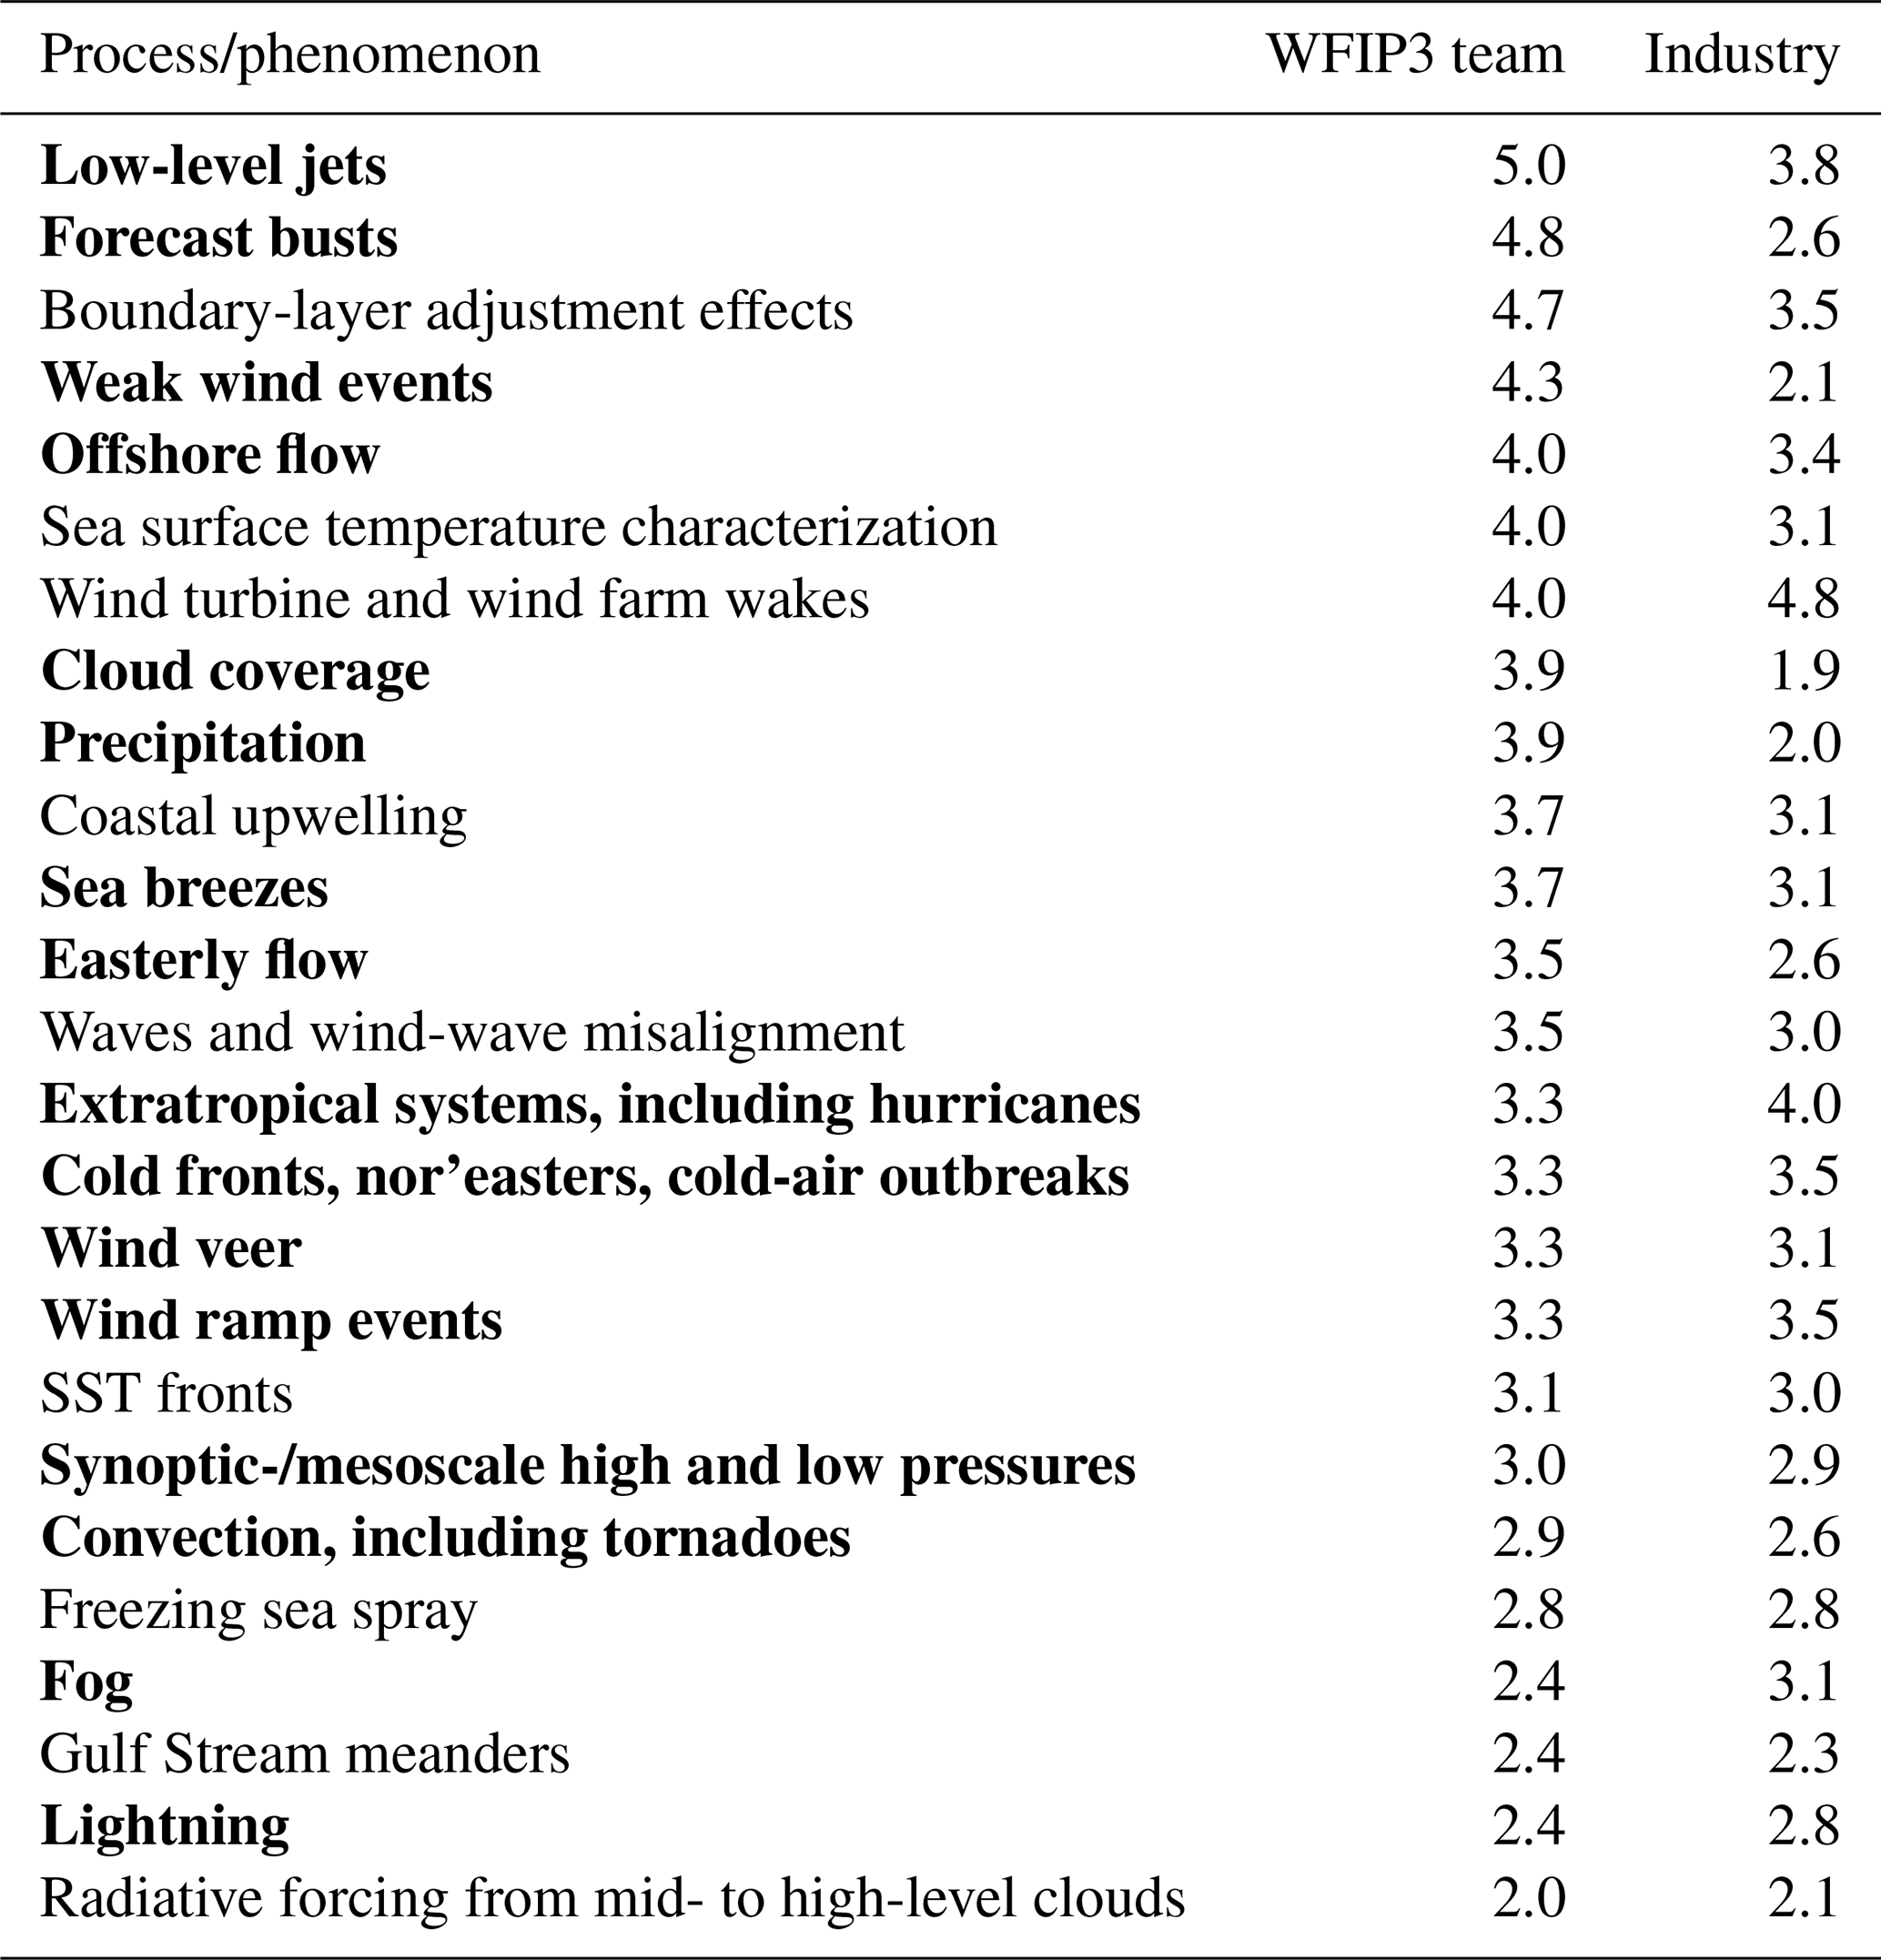
The selection of phenomena to include in the WFIP3 event log followed a structured, multi-stage process. The research team first compiled a comprehensive list of atmospheric and oceanographic processes relevant to the campaign's scientific objectives. This list was subsequently refined and ranked by the WFIP3 core team according to both scientific importance and practical feasibility for daily logging. To ensure the event log also reflected the priorities of the offshore wind industry, the WFIP3 team engaged 11 global experts from leading energy companies. More than 80 % of invitees participated in a survey evaluating the same list of candidate processes and phenomena. The final prioritization results, summarized in Table 1, report mean scores from both the WFIP3 research team and the industry advisors (1 = lowest, 5 = highest).
Overall, the WFIP3 researchers expressed broad scientific interest across a wide range of meteorological processes, reflecting the campaign's goal of improving fundamental understanding and model representation of the offshore boundary layer. In contrast, industry experts identified a smaller number of high-priority topics – particularly wind turbine and wind farm wakes and extratropical systems and hurricanes – as most critical for wind energy applications.
The industry survey also gathered feedback on measurement types considered most impactful for advancing offshore wind resource assessment. A recurring theme was the need for long-term, high-quality observations of vertical temperature profiles to assess numerical weather prediction model skill in representing atmospheric stability and turbulence – key factors influencing wake behavior and power production. Respondents also emphasized the importance of sufficient temporal overlap with existing floating lidar deployments, as short measurement durations (< 12 months) limit the reliability of measure–correlate–predict analyses commonly used in industry. The results of this collaborative prioritization process were directly incorporated into the planning of the WFIP3 event log, ensuring that the phenomena tracked throughout the campaign addressed both scientific and industry-relevant knowledge gaps.
While oceanographic processes were highly prioritized by the research team due to their critical role in air–sea interactions, they were ultimately excluded from the daily event log. This decision was driven by the operational requirement of the logging effort, which relied heavily on real-time data streams (e.g., scanning lidars and operational forecast models). The majority of the oceanographic variability captured during WFIP3 utilized non-real-time datasets that were recovered periodically. Consequently, the log focuses on atmospheric forcing, which provided the most immediate context for evaluating day-to-day turbine-level wind evolution. Comprehensive analyses of the oceanographic measurements and their influence on the offshore boundary layer are detailed in the broader WFIP3 overview literature (e.g., Kirincich et al., 2026). This limitation also highlights a key finding from the WFIP3 campaign: the critical need for advanced sensor–cloud–AI integration in future offshore field experiments. Developing the infrastructure to stream, synthesize, and automatically flag complex oceanographic data in real time will be essential for capturing two-way air–sea interactions in future event-logging frameworks.
Table 1Prioritization of offshore processes by the WFIP3 research team and by offshore wind energy industry experts (1 = lowest priority, 5 = highest). Bold indicates the processes that were tracked in the WFIP3 event log.
While an exhaustive daily record of all relevant metocean processes listed in Table 1 would have been ideal, maintaining such detailed documentation for the full duration of the WFIP3 campaign was not feasible. To balance comprehensiveness and practicality, the WFIP3 event-logging effort was divided into two complementary components:
-
automated event logging
-
manual event logging with weekly weather discussions led by the WFIP3 research team.
4.1 Automated logging
For processes that are suitable for automatic detection using real-time observations from the WFIP3 instruments deployed in the field, algorithms were developed to quantify the daily occurrence of these processes at the relevant WFIP3 sites. Specifically, the following quantities were logged for each day, using measurements (as 10 min averages) from the scanning lidars (used in six-beam vertical-profiling mode) deployed on the ground at the RHOD, BLOC, and NANT sites:
-
Low-level jet (LLJ) occurrence. LLJ occurrence is quantified as the percentage of the day during which an LLJ was present. LLJs are detected using the algorithm presented in Quint et al. (2025): an LLJ is flagged when the lidar profile exhibits (i) a distinct wind speed maximum below 800 m (the “nose”), (ii) a minimum decrease of 3 m s−1 in wind speed above the nose within 400 m, and (iii) a peak wind speed of at least 10 m s−1.
-
Weak wind speeds. Weak wind speeds are quantified as the percentage of the day with 140 m (our proxy for hub height for some of the offshore turbines deployed in the area) wind speeds less than or equal to 3 m s−1 (a typical cut-in value at which a wind turbine begins to generate power).
-
Strong wind speeds. Strong wind speeds are quantified as the percentage of the day with 140 m wind speeds greater than or equal to 25 m s−1 (a typical cut-out value at which a wind turbine is shut down to prevent damage). We note that the strong-wind-speed threshold of 25 m s−1 used here reflects a typical cut-out value commonly referenced in the literature; however, modern offshore turbines often have higher rated cut-out speeds, and some advanced designs gradually curtail power production at high wind speeds rather than applying a discrete cut-out. Users are therefore encouraged to recompute the strong-wind occurrence metric from the underlying 10 min lidar profiles archived on the Wind Data Hub using thresholds appropriate for their specific turbine model or power curve.
-
Easterly winds. Easterly winds are defined as the percentage of the day with 140 m winds from an easterly (between 45 and 135°) direction. These winds represent an offshore flow, which is often linked with a change in atmospheric stability that strongly affects wind speed vertical profiles and turbine height shear.
-
Extreme wind veer. Extreme wind veer is quantified as the percentage of the day when the difference in wind direction between 300 and 100 m exceeded 20°.
-
Wind ramp-up events. Wind ramp-up events are quantified in terms of the percentage of time each day when the 140 m wind speed increased by more than 5 m s−1 over 10 or 30 min or by more than 10 m s−1 over 60 min. These thresholds and timescales were established through consultation with WFIP3 industry partners, acknowledging that no universal definition of wind ramps exists and that criteria are highly application dependent (Bianco et al., 2016).
-
Wind ramp-down events. Wind ramp-down events are expressed as the percentage of time each day when the 140 m wind speed decreased by more than 5 m s−1 over 10 or 30 min or by more than 10 m s−1 over 60 min.
4.2 Manual logging
The manual logging by WFIP3 researchers built on the prioritized list of processes of interest (Table 1) and complemented the automated component of the event log. Each daily entry included information on the synoptic situation, convection, precipitation, mean marine boundary-layer wind direction, perceived accuracy of the High-Resolution Rapid Refresh (HRRR) model (Dowell et al., 2022) day-ahead forecast below 500 m, fog or low-stratus occurrence, lightning, LLJ activity, and sea-breeze events. Additional narrative sections summarized the overall weather evolution and forecast performance, noted any instrument outages, and provided daily ratings for their usefulness for research. Two ratings (ranging from 1 to 5, where 1 indicates “little usefulness” and 5 indicates “perfect”) were assigned to each day – one reflecting a value for model development and one for observational research. We note that for the initial days of the campaign (from 1 February 2024 through 24 March 2024), a single combined score was reported until discussions during the weekly event log pointed out the value of distinguishing model and observational development case studies. The NOAA model observation website https://www.psl.noaa.gov/renewable_energy/wfip3/modelobs/ (last access: 27 May 2026) (Fig. A1) was developed specifically for WFIP3 to facilitate the manual logging effort and monitor atmospheric conditions, model performance, and instrument well-being during the course of the campaign. A complete list of the websites consulted by loggers is available in Appendix A, including National Weather Service forecast discussions, WFIP3 observations, model forecasts, and satellite observations.
A day was generally considered valuable (in either category) when extensive observations were available and the wind field exhibited substantial variability such as ramps, gusty periods, or transitions near key turbine operating thresholds (cut-in or cut-out speeds). From an observational perspective, complex atmospheric conditions, including precipitation, convection, or frontal passages, were not seen as drawbacks because they often yield valuable insights into boundary-layer processes even when certain instruments operate suboptimally. For model development, however, the most informative cases were those characterized by relatively simple meteorology but notable or systematic forecast errors in wind speed or direction, allowing specific model deficiencies to be isolated and examined.
One researcher from the WFIP3 team was in charge of daily logging, which was organized in groups of 4 d to reflect typical timelines of weather systems moving through mid-latitudes. Days were usually “claimed” on a shared Google spreadsheet a month or so in advance. The National Weather Service offices in Boston, Massachusetts, and Upton, New York, contributed to the daily logging effort by completing entries as their operational schedules allowed, providing additional expert insight into synoptic and mesoscale conditions. Weekly review meetings complemented the daily entries. During these discussions, WFIP3 loggers led a structured review of the previous week's logs. These sessions provided an opportunity to identify high-priority case studies (e.g., events with large model forecast errors or distinctive boundary-layer structures), discuss short-term forecast outlooks, and note emerging meteorological or oceanographic processes of potential relevance as the campaign evolved. This combination of daily logging and weekly synthesis ensured a consistent, scientifically grounded record of meteorological conditions throughout the WFIP3 campaign and supported the identification of the most valuable periods for subsequent detailed analysis.
To ensure accessibility and ease of use, the WFIP3 event log is provided as a structured spreadsheet, as was used during the active logging stage. The primary tab contains the manually curated component of the log, which documents daily notes on notable meteorological events, model performance, and instrumentation issues. Additional tabs include the automated logs generated by the scanning lidars deployed at the RHOD, BLOC, and NANT sites. Because the main event log was manually compiled by multiple contributors, a degree of subjectivity in categorization and interpretation is unavoidable. To minimize inconsistencies and enhance data reliability, the log was reviewed weekly by the WFIP3 team to standardize entries and ensure internal consistency across sites and contributors and assigned ratings. The WFIP3 event log is publicly available through the US Department of Energy's Wind Data Hub at https://doi.org/10.21947/3010982 (Bodini et al., 2025b).
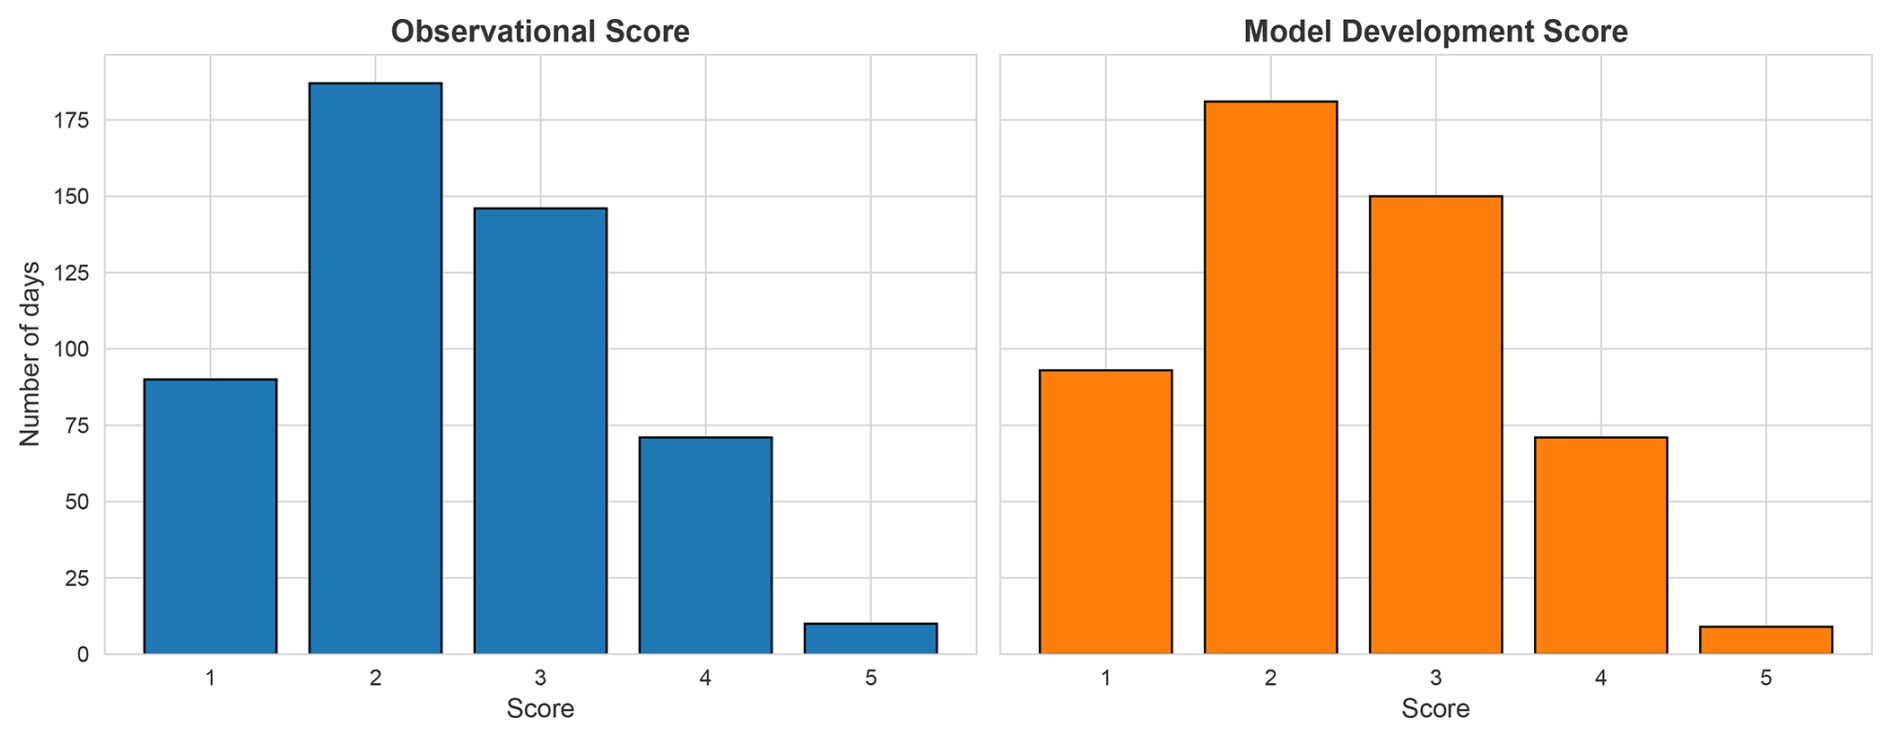
Figure 2Distribution of daily scores assigned by WFIP3 loggers from 25 March 2024 to 31 August 2025. The left panel shows scores for observational relevance, and the right panel shows scores for model development relevance. Note: days from 1 February 2024 to 24 March 2024 are excluded from this figure, as only a single combined score was recorded during that period.
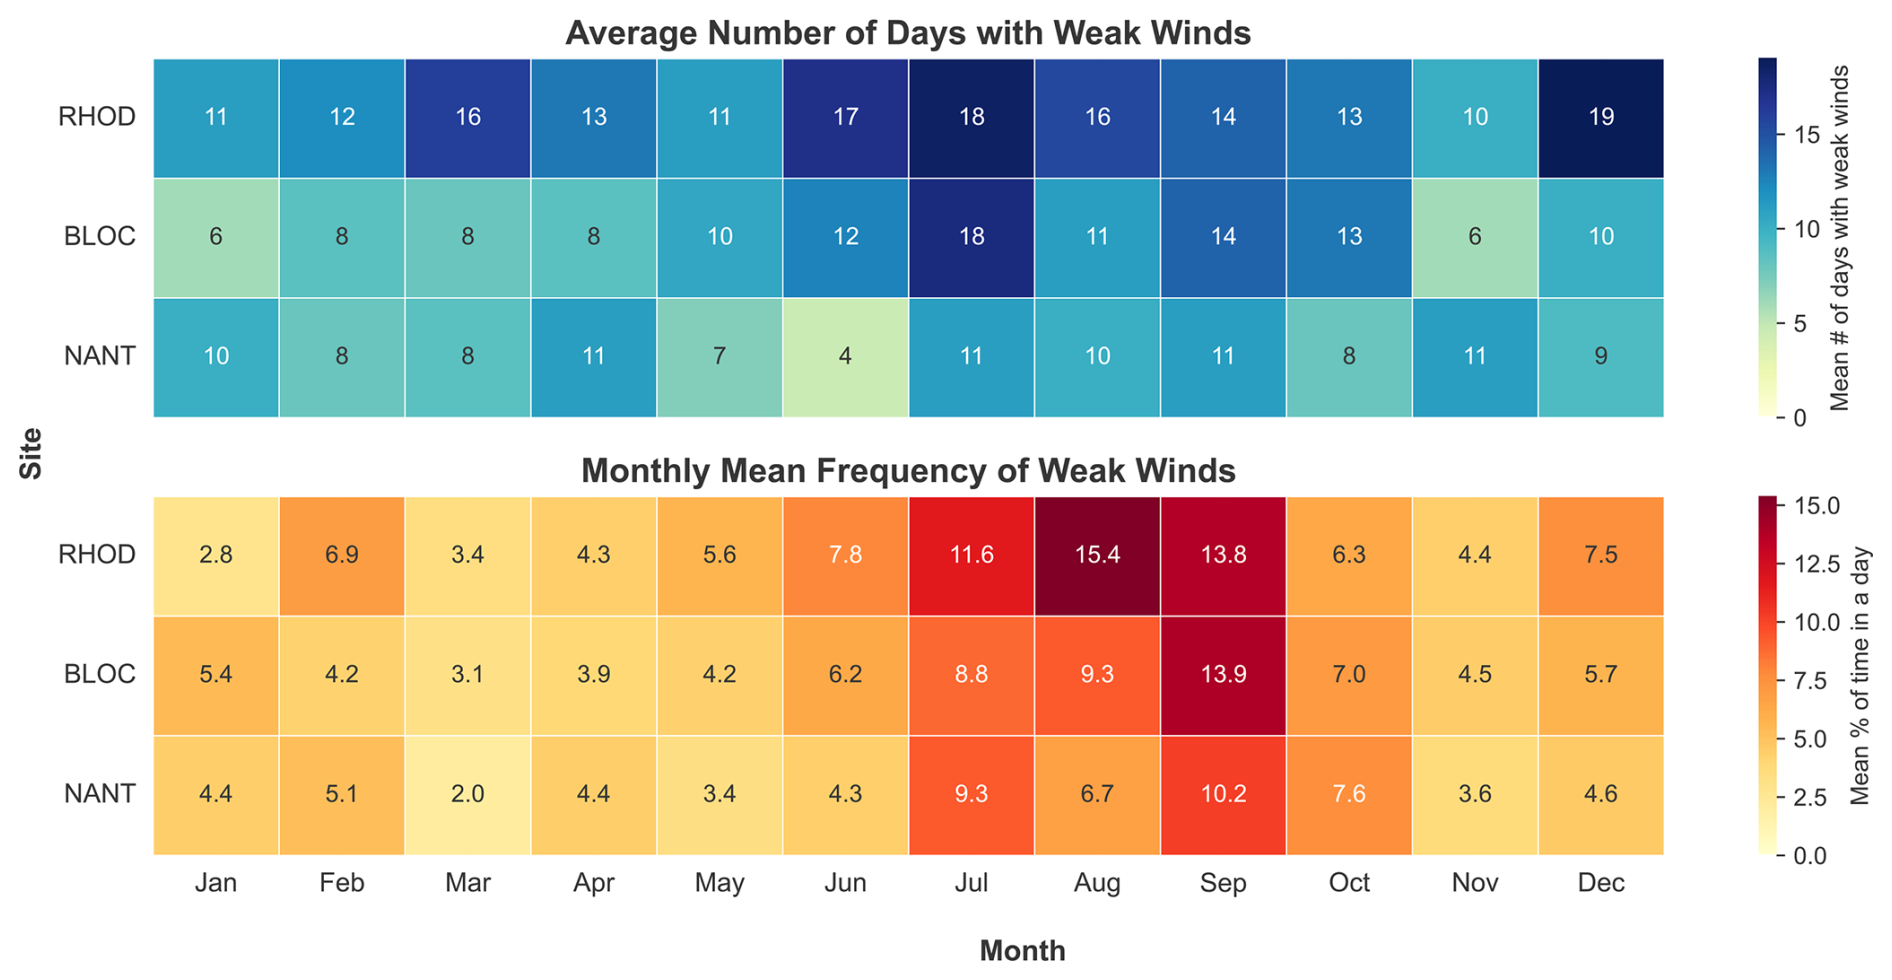
Figure 3Monthly weak-wind characteristics at three WFIP3 sites (RHOD, BLOC, NANT) from February 2024 to August 2025. Weak winds are quantified as the percentage of the day with 140 m wind speeds less than or equal to 3 m s−1. The top panel shows the average number of days per month with weak winds, and the bottom panel shows the mean percentage of time in a day when weak winds were observed for each month and site.
Daily scores assigned by WFIP3 loggers indicate that most days had medium to low ratings across both the observational and the model development categories (Fig. 2). About 10 d received the maximum score of 5 in each category, and roughly 60 d scored 4, reflecting periods of particularly notable observations or cases useful for model evaluation. While the overall distributions of scores are broadly similar for the two categories, individual days did not necessarily receive the same rating for both, highlighting differences in the types of atmospheric features most valuable for observational research versus model development.
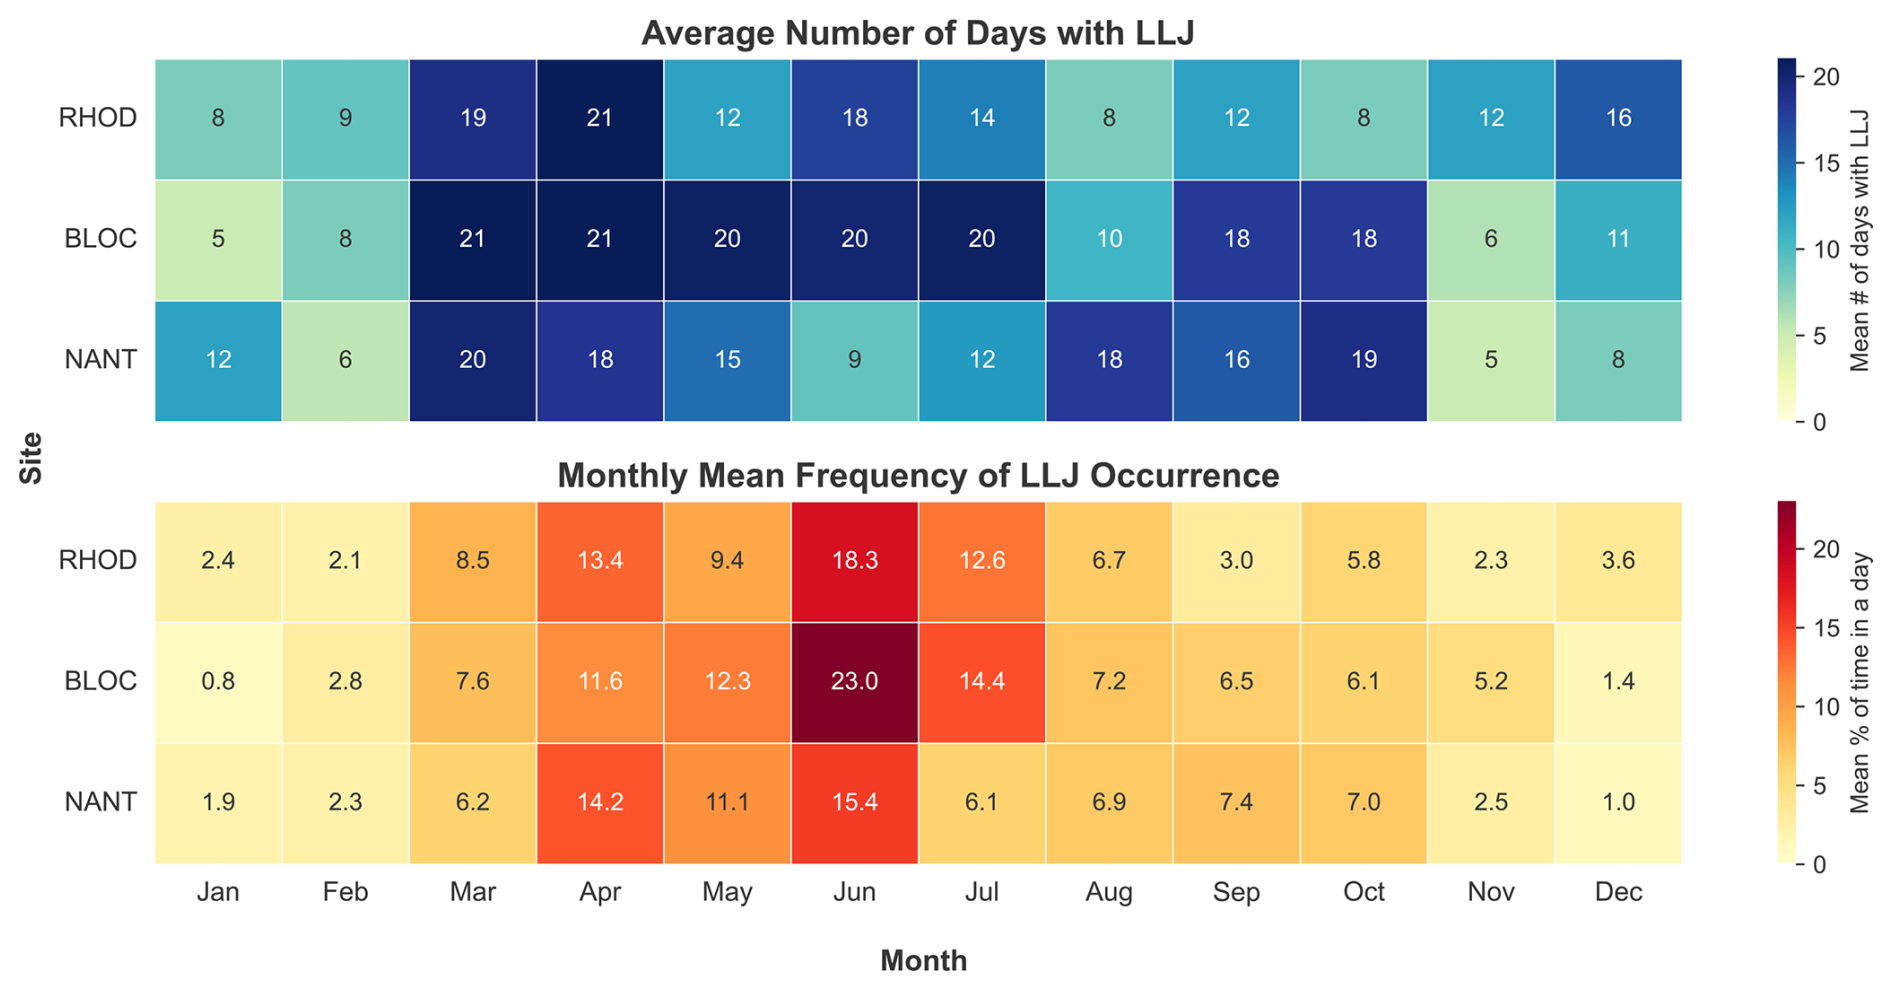
Figure 4Monthly low-level jet (LLJ) characteristics at three WFIP3 sites (RHOD, BLOC, NANT) from February 2024 to August 2025. The top panel shows the average number of days per month with an LLJ detected from the lidar data, and the bottom panel shows the mean percentage of time in a day an LLJ is detected for each month and site.
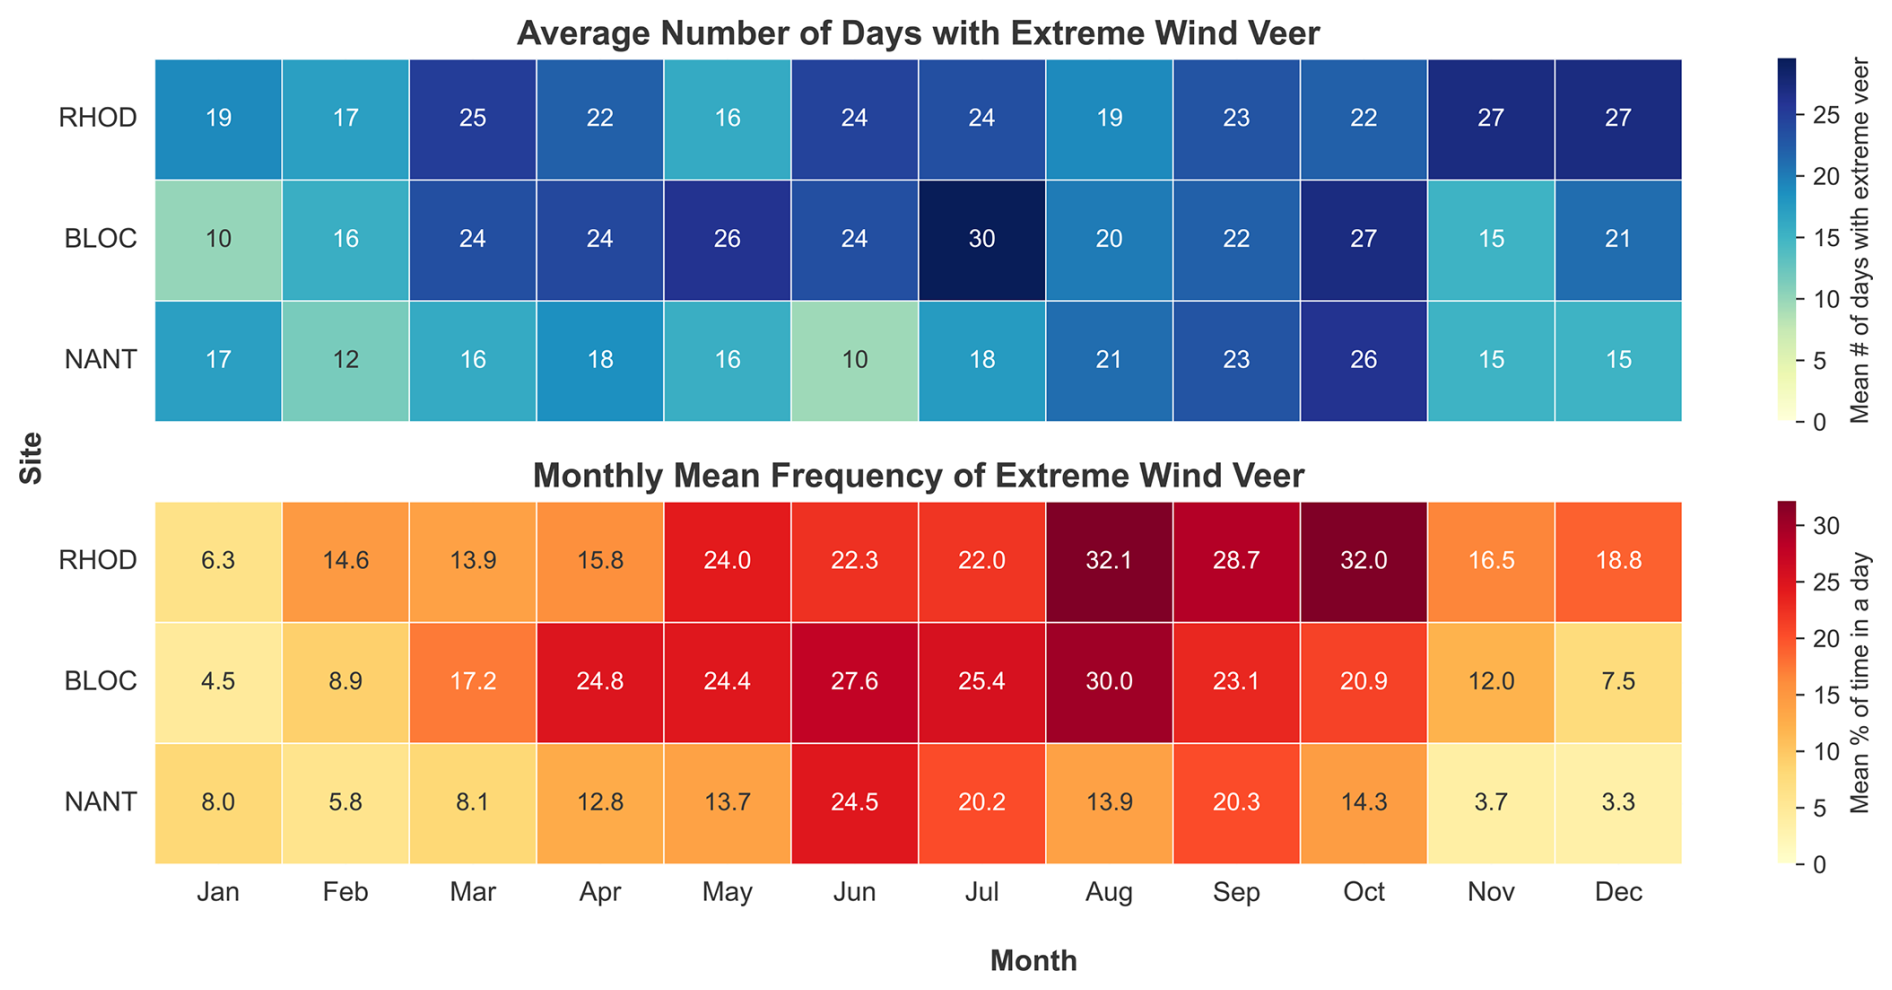
Figure 5Monthly extreme wind veer characteristics at three WFIP3 sites (RHOD, BLOC, NANT) from February 2024 to August 2025. Extreme wind veer is quantified as the percentage of the day when the difference in wind direction between 100 and 300 m exceeded 20°. The top panel shows the average number of days per month with extreme wind veer (% > 0), and the bottom panel shows the mean percentage of time in a day extreme veer was observed for each month and site.
Days that received the maximum observational score exhibited a variety of notable atmospheric phenomena. These included persistent LLJs, substantial spatial and temporal variability in wind speed and direction, and multiple wind ramp events occurring over short periods. Additionally, unique events such as a solar eclipse (Solari et al., 2026) were observed, further highlighting the diversity of atmospheric states captured during the campaign. Days that scored the highest for model development were characterized by significant discrepancies between HRRR forecasts and observations, offering valuable test cases for numerical weather prediction model improvements. Notable issues included mistimed or missed wind ramps, LLJs not accurately captured by the HRRR model, misrepresentation of low-level clouds and fog, and large underestimation or overestimation of wind speeds.
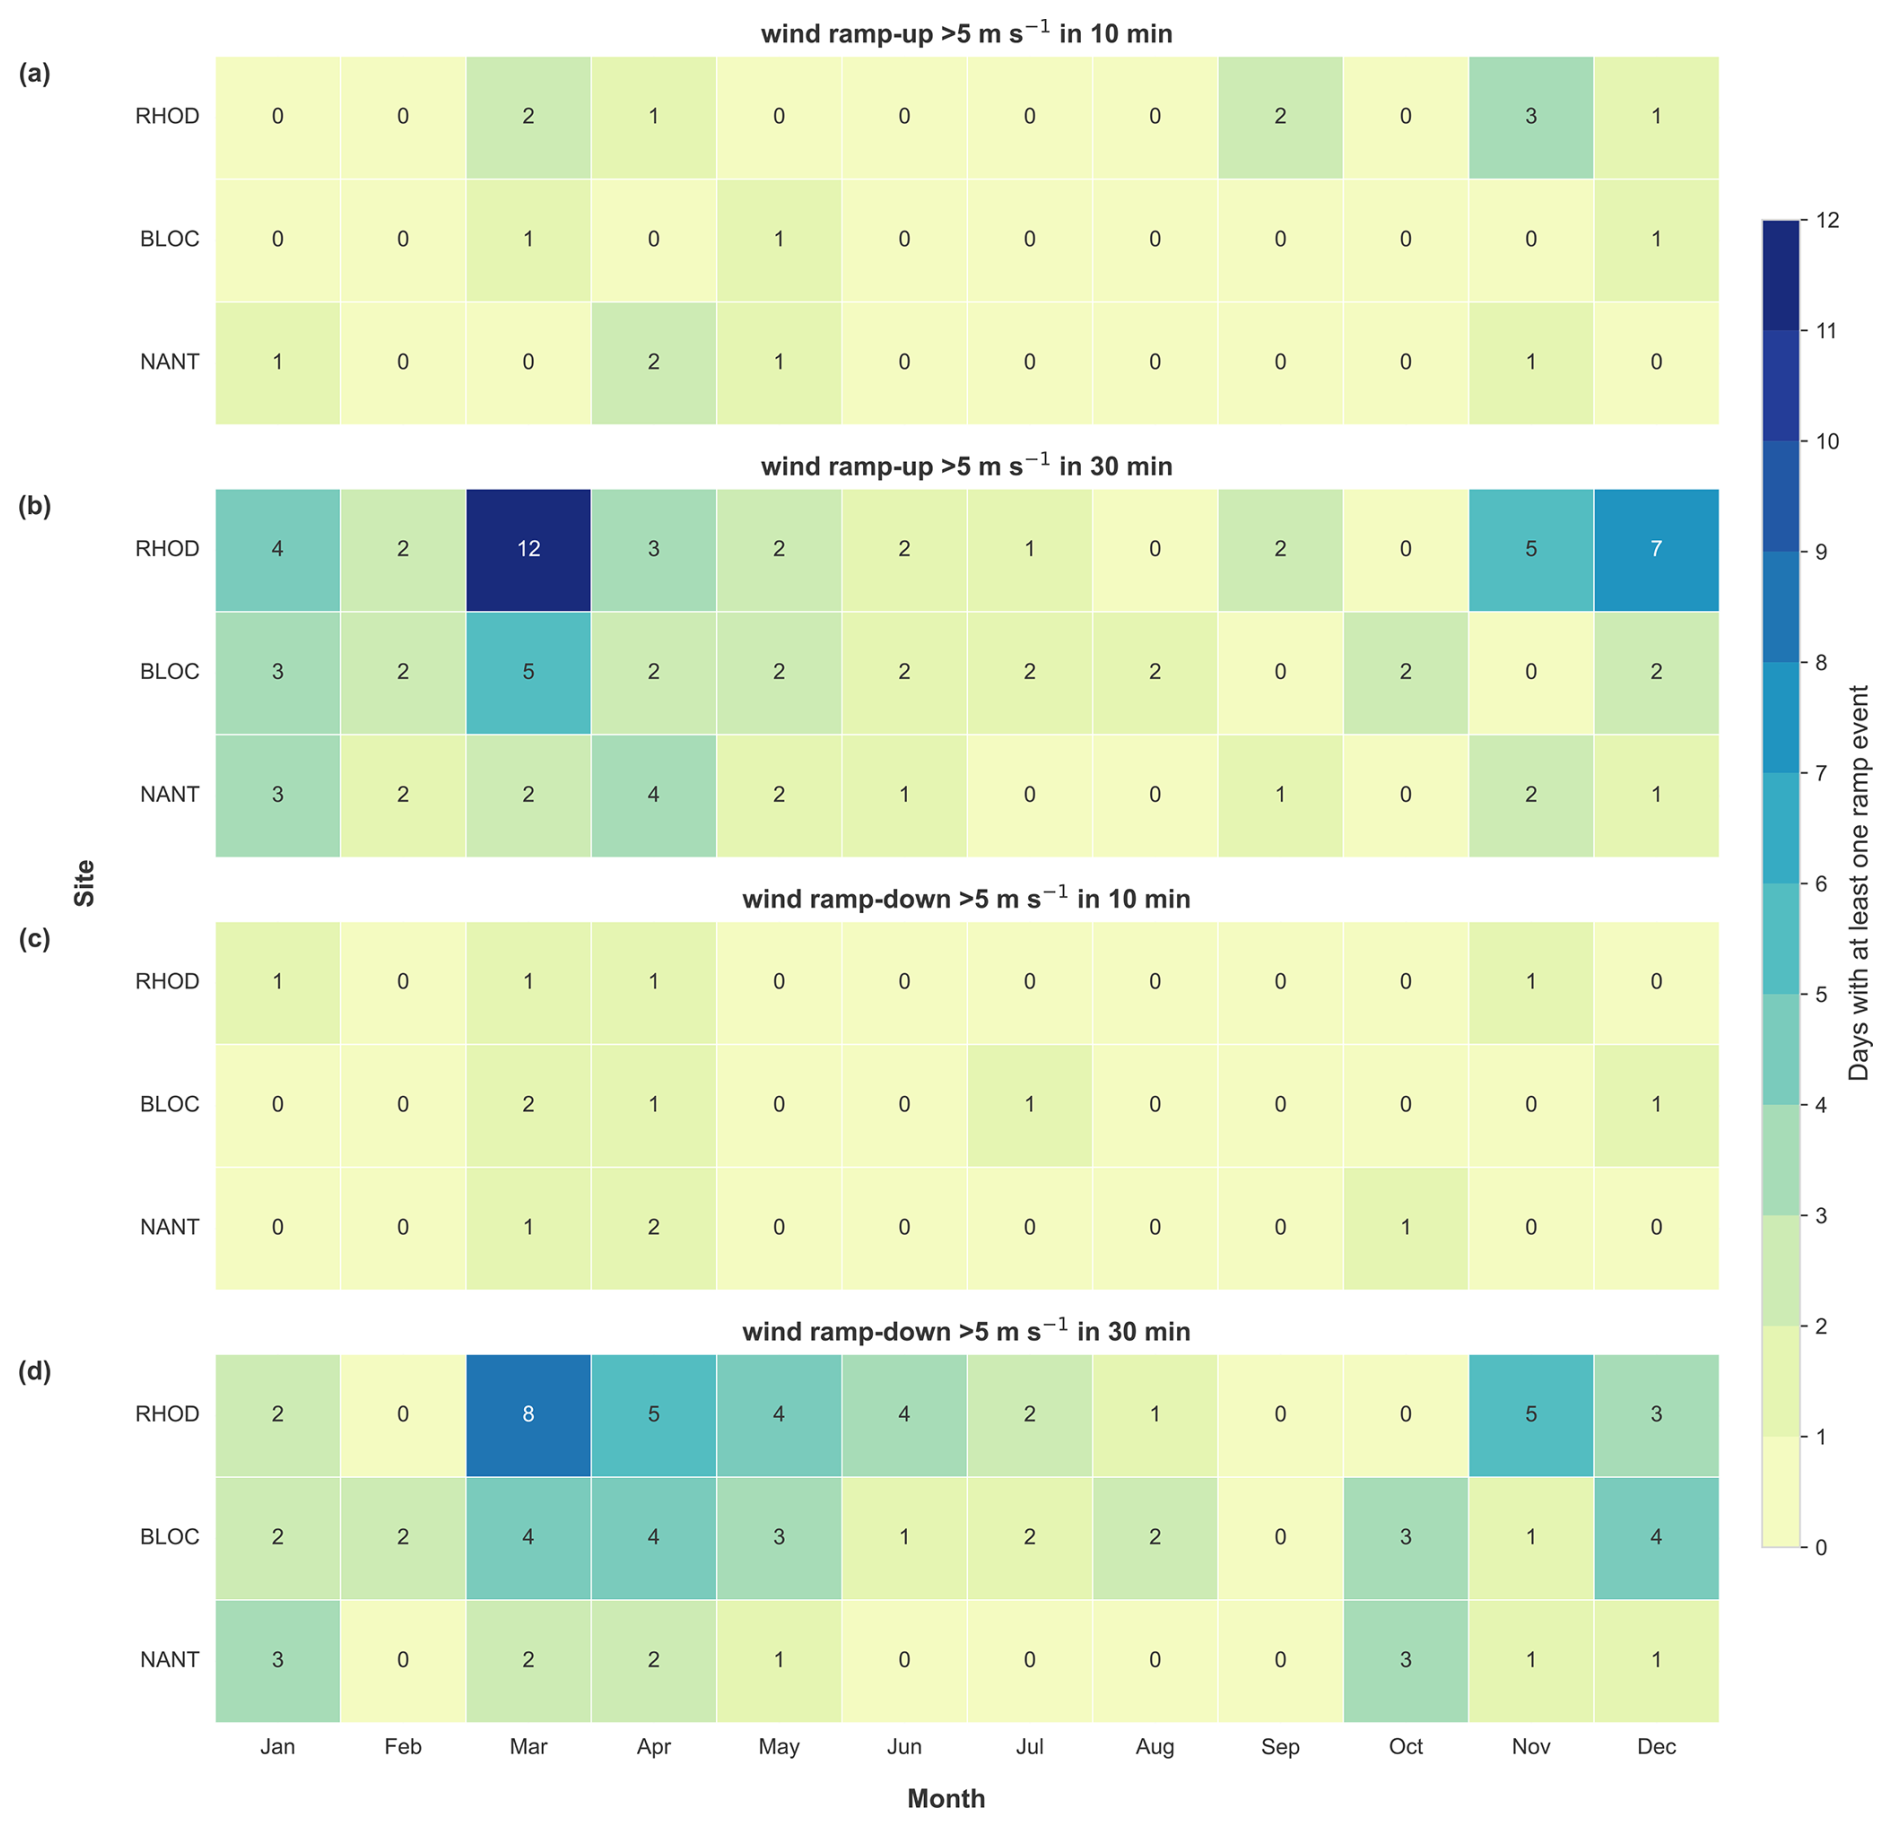
Figure 6Monthly wind ramp events at three WFIP3 sites (RHOD, BLOC, NANT) from February 2024 to August 2025. Panels (a) and (b) show wind ramp-up events, quantified as the percentage of time each day when the 140 m wind speed increased by more than 5 m s−1 over 10 (a) or 30 min (b). Panels (c) and (d) show wind ramp-down events, quantified as the percentage of time each day when the 140 m wind speed decreased by more than 5 m s−1 over 10 (c) or 30 min (d). Values represent the average number of days per month with at least one ramp event.
The analysis of the automated component of the event log allows for some initial assessment of the observed long-term wind conditions in the region. In this context, the RHOD site represents predominantly onshore conditions. BLOC, although offshore, is more influenced by onshore flow under the dominant wind directions, and the NANT site is more representative of fully offshore conditions. Weak winds at 140 m, defined as wind speeds less than or equal to 3 m s−1, are generally brief at all WFIP3 sites (Fig. 3), with the highest occurrence in late summer (up to 15 % of the average day at RHOD) and lower percentages offshore (lowest at NANT, intermediate at BLOC). Onshore, weak-wind conditions are observed on more days per month compared to offshore, highlighting a clear spatial gradient from land to sea.
LLJs occur most frequently in spring, summer, and fall, with up to more than two-thirds of days in a month experiencing events and mean daily durations reaching over 20 % at BLOC in June (Fig. 4). Winter months exhibit reduced LLJ activity. Seasonal trends are similar across all sites, with minor differences in absolute occurrence and duration and no pronounced spatial pattern between sites, consistent with model-based studies of LLJs in these regions (Quint et al., 2025).
Extreme wind veer, defined as differences in wind direction exceeding 20° between 100 and 300 m, is more common onshore (RHOD) and at the nearshore BLOC site, with fewer occurrences offshore at NANT (Fig. 5). These events are observed throughout the year, with slightly higher frequencies in spring, summer, and fall. On average, more than 20 d per month experience extreme veer at the onshore and nearshore sites (RHOD and BLOC sites), and the fraction of time per average day ranges from roughly 3 % offshore (NANT site) in winter to over 30 % in summer and fall.
Ramp events occur more frequently at the RHOD and BLOC sites compared to NANT, indicating stronger variability closer to shore. Short-term wind changes exceeding 5 m s−1 within 10 min are relatively rare and most common during the fall and winter months. Events over a 30 min period are more frequent and distributed throughout the year, with ramp-up occurrences peaking in winter and spring, while ramp-down events extend into the summer months (Fig. 6).
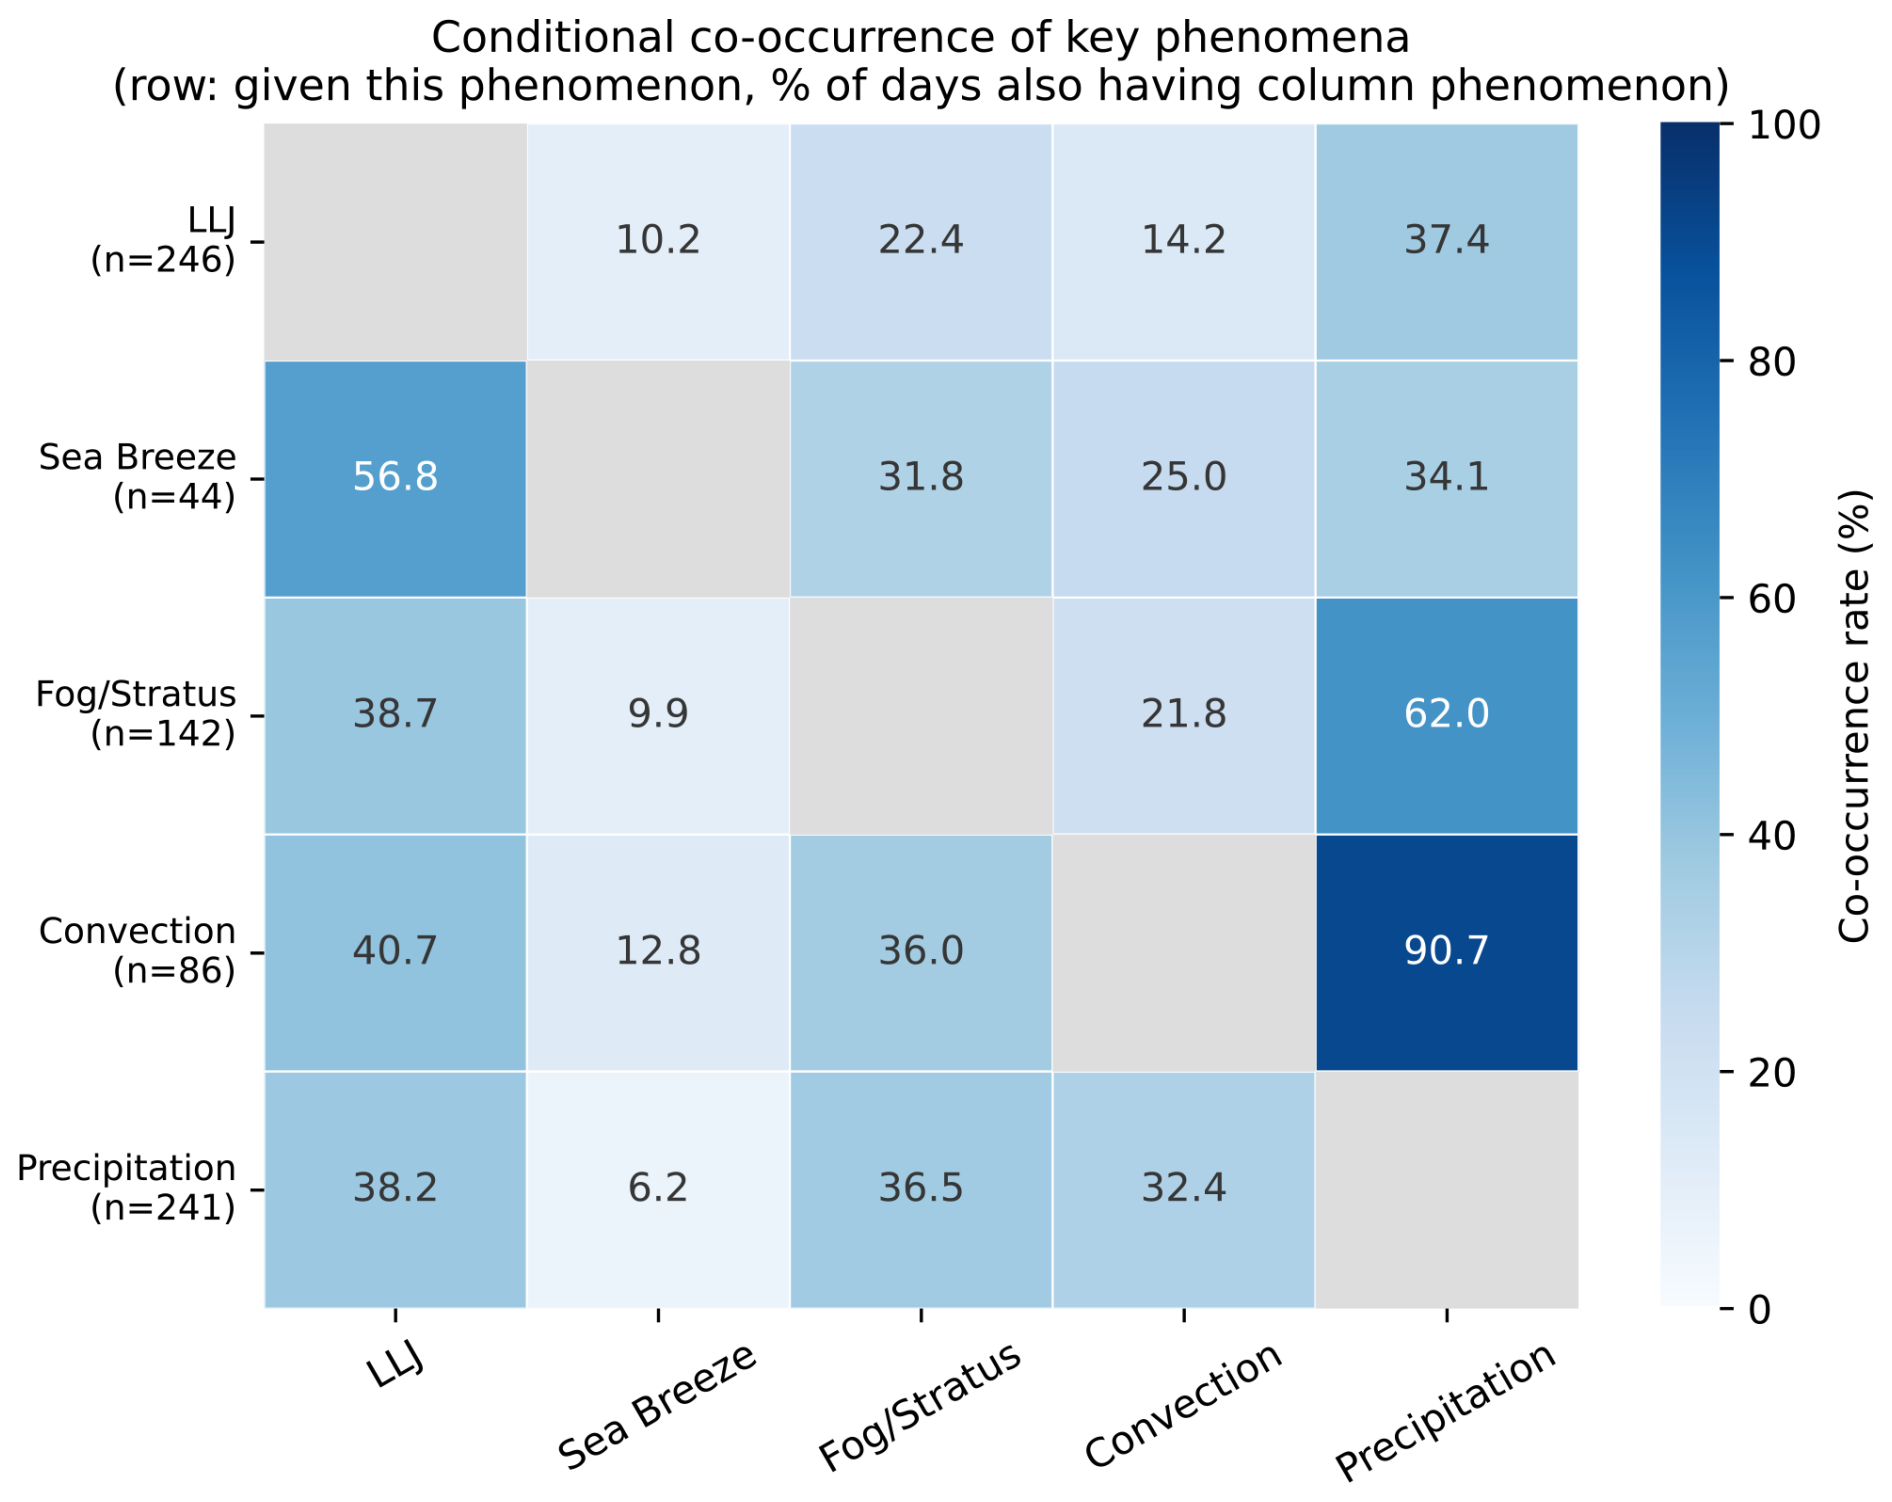
Figure 7Conditional co-occurrence rates among key phenomena in the WFIP3 manual event log. Each cell reports the percentage of days flagged for the row phenomenon that were also flagged for the column phenomenon. Diagonal cells (same phenomenon) are left blank. Marginal occurrence counts for each phenomenon are shown in the row labels.
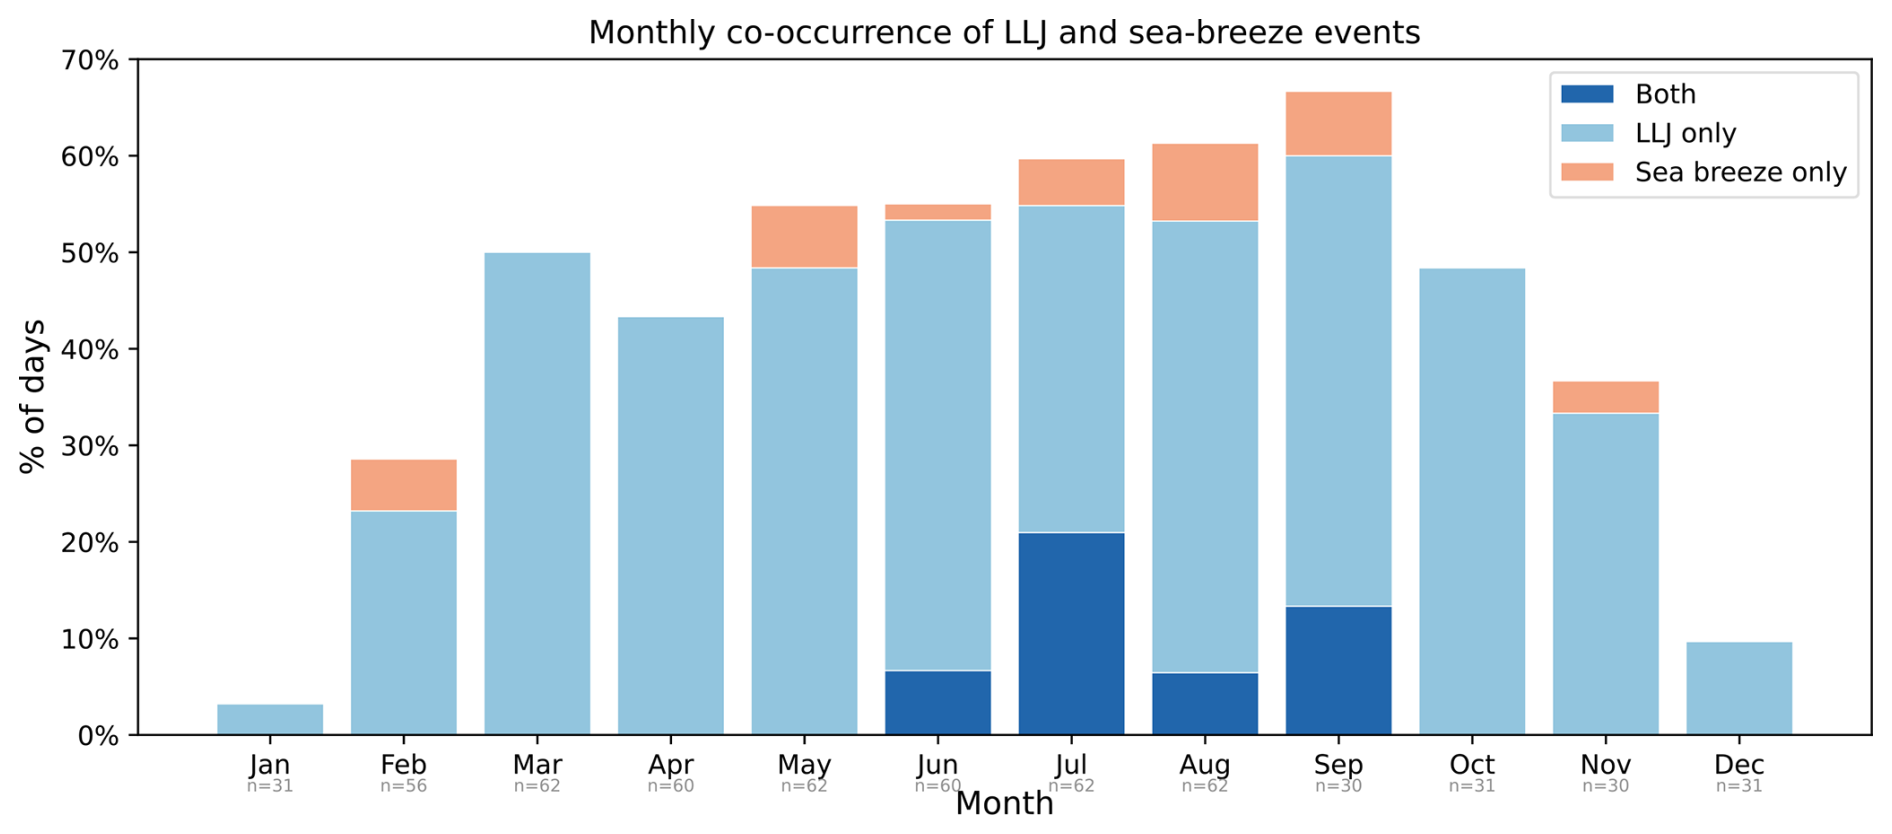
Figure 8Monthly co-occurrence of LLJ and sea-breeze events in the WFIP3 manual log. Stacked bars show the fraction of each month's days on which both phenomena were observed simultaneously (dark blue), only an LLJ was recorded (mid blue), or only a sea breeze was recorded (light orange). Days with neither phenomenon are not shown. The number of logged days contributing to each month is indicated below each bar.
Beyond the individual frequencies of each phenomenon, the manual component of the event log also makes it straightforward to examine how meteorological events co-occur. Figure 7 shows the conditional co-occurrence rates among the five key categorical phenomena tracked in the manual log – LLJs, sea breezes, fog/low stratus, convection, and precipitation – computed across all 578 d of the manual record (1 February 2024–31 August 2025). Each cell reports the percentage of days flagged for the row phenomenon that were also flagged for the column phenomenon, revealing several physically informative asymmetries. The most striking asymmetry involves LLJs and sea breezes. Sea-breeze days carry a 56.8 % chance of co-occurring with an LLJ, whereas only 10.2 % of LLJ days also feature a sea breeze. This asymmetry is physically consistent with the stable, cold marine air advected onshore by sea-breeze circulation, which promotes the low-level wind maximum and directional shear characteristic of coastal LLJs. The seasonal dimension of this coupling is illustrated in Fig. 8: LLJ–sea-breeze co-occurrence is confined almost entirely to the summer and early fall months (June–September), when sea-surface temperatures are sufficiently cool relative to the overlying air to sustain the marine stable layer that supports both phenomena simultaneously.
Fog/low stratus and precipitation are also strongly linked: 62.0 % of fog days coincide with precipitation, consistent with the prevalence of frontal and low-pressure systems that simultaneously moisten and destabilize the marine boundary layer in this region. Convection, on the other hand, is almost invariably accompanied by precipitation (90.7 % of convective days), whereas only 32.4 % of precipitation days include convection – confirming that the majority of precipitation events in the southern New England offshore region are stratiform or frontal rather than convective in nature. These co-occurrence statistics demonstrate that the WFIP3 event log can support not only single-phenomenon case study selection but also research into compound meteorological events. They further underscore the value of the log's structured categorical columns: a researcher interested in, for example, LLJ cases uncontaminated by sea-breeze forcing can trivially exclude the relevant dates by filtering a single column, while a researcher studying marine fog genesis can readily identify the large subset of fog days that also featured precipitation. Such event-log-guided filtering thus serves as an efficient first-pass triage step before retrieving and analyzing the full high-resolution lidar, meteorological, and oceanographic datasets archived for the WFIP3 campaign on the Wind Data Hub.
The WFIP3 event log provides a structured and quality-controlled record of meteorological events observed during the 19-month WFIP3 field campaign, offering essential contextual information for the interpretation of the project's coastal and offshore measurements. It integrates manually curated weather discussions with automated event detection algorithms. The data reveal the frequency and seasonality of several key offshore processes – including LLJs, weak-wind conditions, extreme wind veer, and wind ramps – captured across onshore, nearshore, and offshore sites. While these preliminary summaries demonstrate the internal consistency and completeness of the log, the dataset's primary purpose is to support community-wide analyses and model validation efforts. The WFIP3 event log thus serves as a companion product to the campaign's comprehensive measurement datasets. Its standardized structure, clear metadata, and open-access availability make it a valuable resource for researchers and practitioners investigating offshore boundary-layer processes, evaluating model performance, or planning future measurement campaigns. Continued use of this type of curated contextual dataset will enhance the transparency, reproducibility, and scientific impact of large-scale atmospheric field experiments. When other large-scale atmospheric field experiments are designed and budgeted, resources for similar event-logging capabilities will be critical for ensuring the broad use of large datasets.
The following websites were frequently consulted by the WFIP3 event loggers and provide helpful guidance for a comprehensive characterization of the regional metocean conditions:
-
National Weather Service weather discussions, available for recent days on the National Weather Service website (e.g., Boston office: https://forecast.weather.gov/product.php?site=NWS&issuedby=BOX&product=AFD, last access: 27 May 2026) and archived for older entries by the Iowa State University Iowa Environmental Mesonet at https://mesonet.agron.iastate.edu/wx/afos/list.phtml (last access: 27 May 2026)
-
daily weather maps, archived by NOAA's Weather Prediction Center at https://www.wpc.ncep.noaa.gov/dailywxmap/index.html (last access: 27 May 2026)
-
synoptic evolution, analyzed using Global Forecast System (GFS) analyses and forecasts provided by the University at Albany at https://www.atmos.albany.edu/student/abentley/realtime.html (last access: 27 May 2026)
-
radar imagery for precipitation, available from NOAA's Multi-Radar Multi-Sensor product viewer at https://mrms.nssl.noaa.gov/qvs/product_viewer/ (last access: 27 May 2026) and the National Center for Atmospheric Research (NCAR) Mesoscale and Microscale Meteorology Laboratory at https://www2.mmm.ucar.edu/imagearchive/ (last access: 27 May 2026)
-
cloud fields, viewable from satellite imagery hosted by NCAR at https://weather.ral.ucar.edu/satellite/ (last access: 27 May 2026)
-
mesoscale model fields, such as those from HRRR (https://rapidrefresh.noaa.gov/hrrr/HRRR, last access: 27 May 2026) and WFIP3-specific Weather Research and Forecasting (WRF) model runs (https://rapidrefresh.noaa.gov/WFIP3, last access: 27 May 2026).
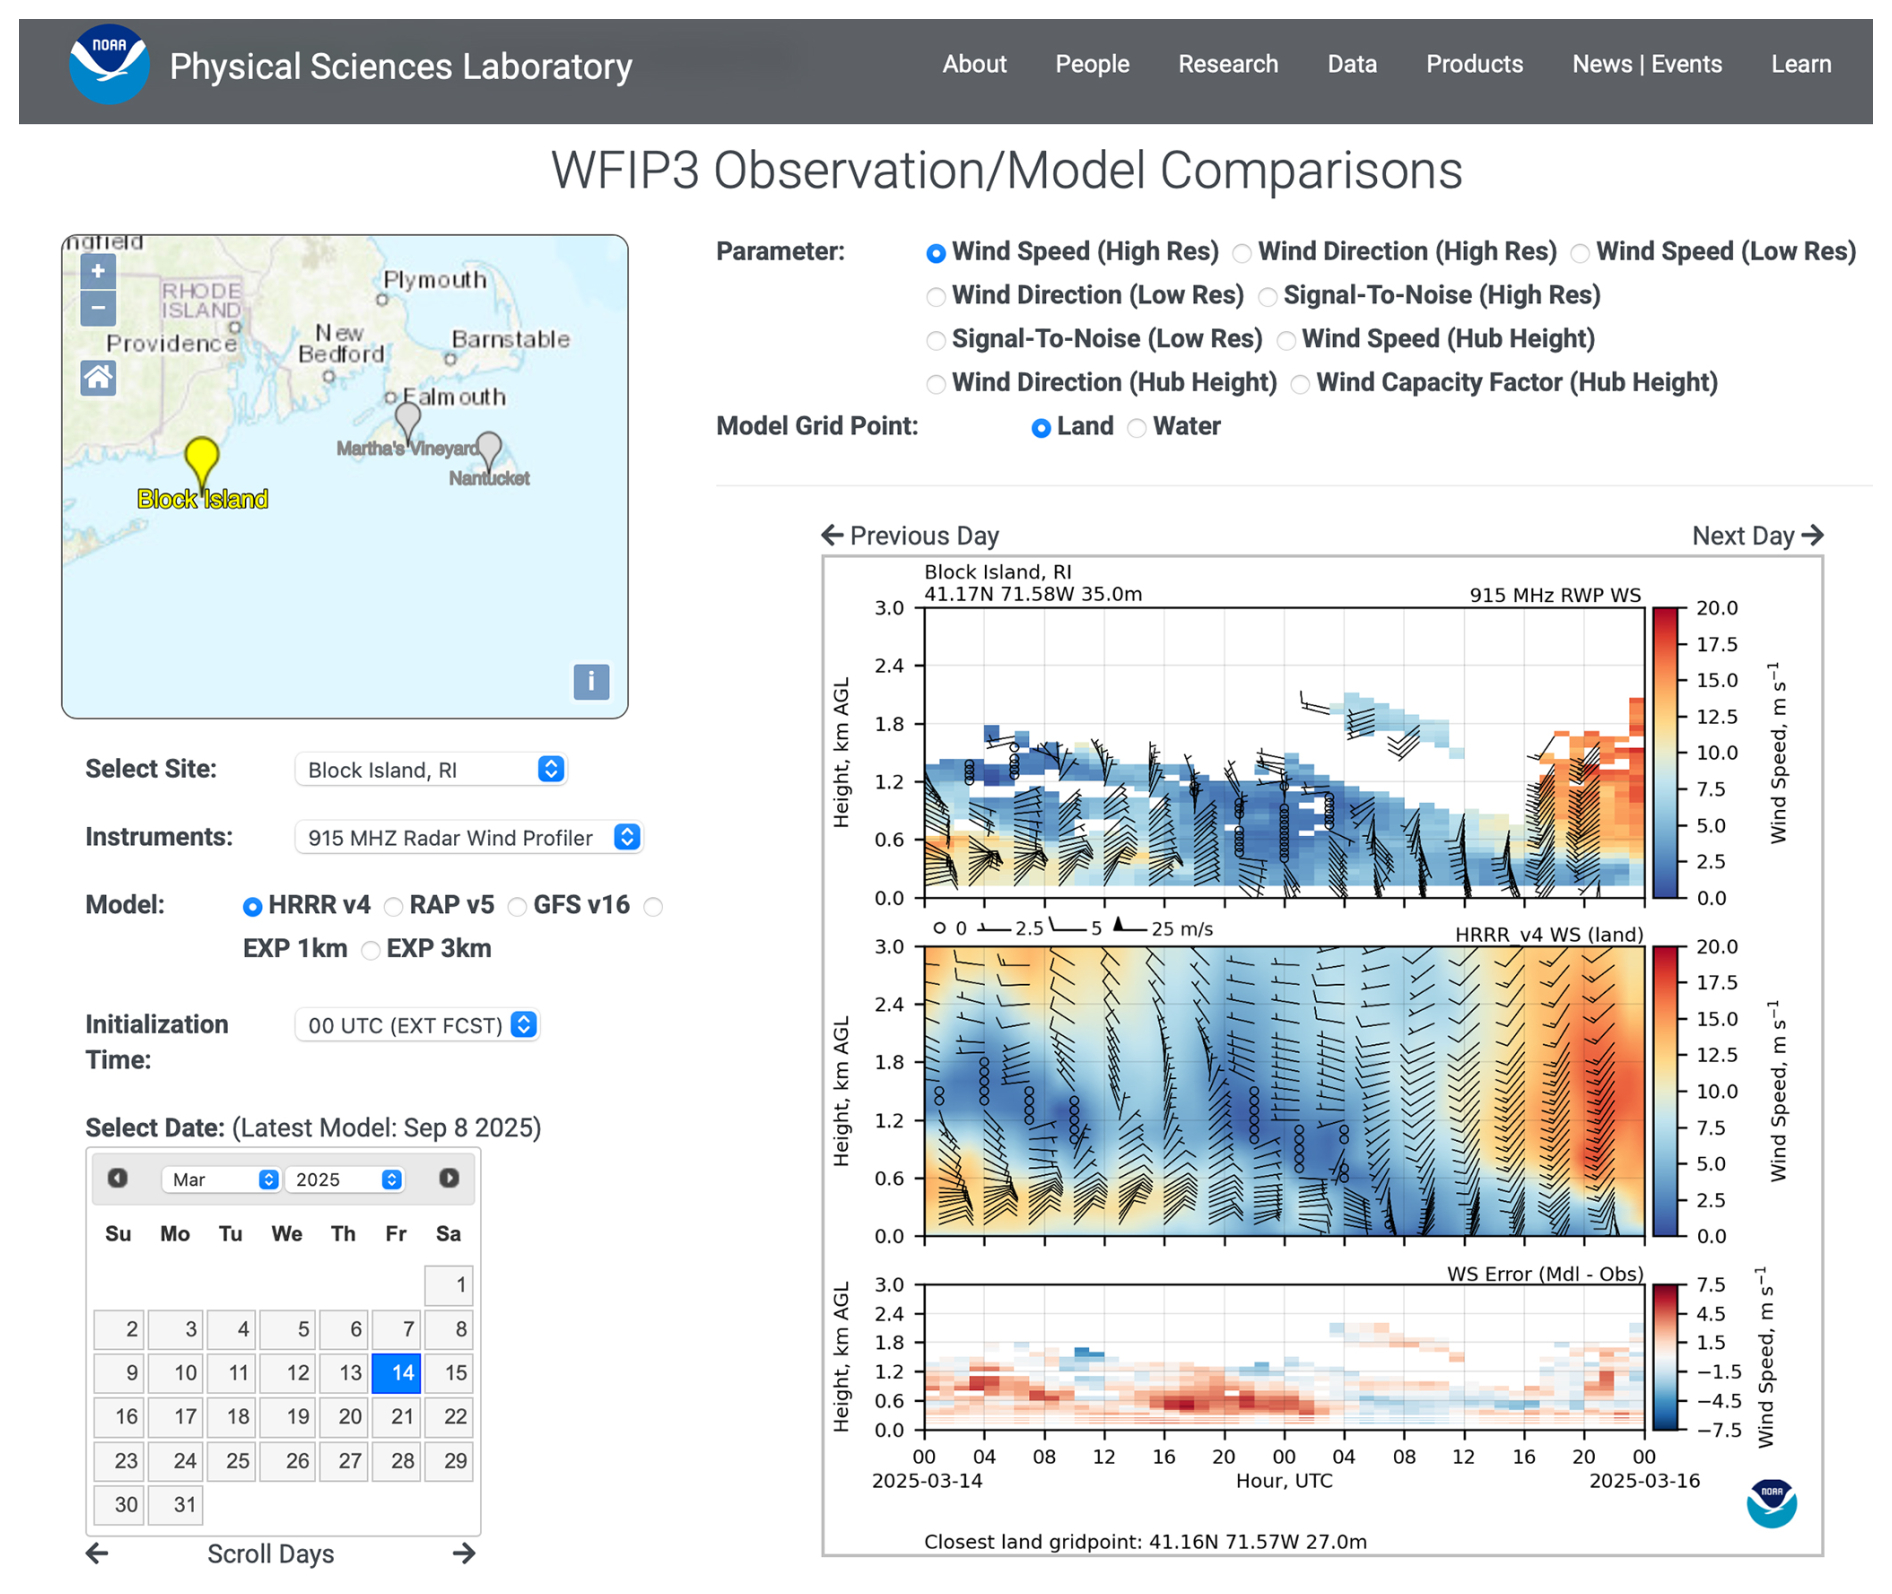
Figure A1Screenshot showing the WFIP3 model–observation comparison website developed by NOAA's Physical Sciences Laboratory.
-
WFIP3 model–observation comparisons, available on NOAA's Physical Sciences Laboratory website at https://psl.noaa.gov/renewable_energy/wfip3/modelobs/ (last access: 27 May 2026) (this portal (Fig. A1), developed specifically for the WFIP3 campaign, enables direct comparison between observed and modeled quantities at three WFIP3 sites (Block Island, Martha's Vineyard, and Nantucket), includes multiple models (HRRR, GFS, RAP, and WFIP3 WRF runs), and integrates data from several instruments, allowing evaluation of variables such as wind speed, wind direction, temperature, pressure, precipitation, boundary-layer height, and cloud-base height over the full course of the field campaign)
-
wave and swell conditions at Martha's Vineyard, available, for example, from https://swell.willyweather.com/ma/dukes-county/south-beach-marthas-vineyard.html (last access: 27 May 2026)
-
wave observations at Block Island, provided by the Coastal Data Information Program at https://cdip.ucsd.edu/m/products/?stn=154p1 (last access: 27 May 2026)
-
sea surface temperature fields, available from NOAA's Office of Satellite and Product Operations at https://www.ospo.noaa.gov/products/ocean/sst/contour/ (last access: 27 May 2026)
-
offshore water forecasts, provided by NOAA's Ocean Prediction Center at https://ocean.weather.gov/shtml/NFDOFFNT1.php (last access: 27 May 2026).
The WFIP3 event log is publicly available on DOE's Wind Data Hub at https://doi.org/10.21947/3010982 (Bodini et al., 2025b).
NB, JO, and DDT led the initial development of the WFIP3 event log. NB wrote the journal article and implemented the automated component of the event log. NB, JO, BG, GVI, MSS, SR, JKL, NA, TM, BA, JM, and EJ contributed to the daily logging. All authors participated in weekly weather discussions, provided feedback on the event log, and reviewed the draft of the journal article.
At least one of the (co-)authors is a member of the editorial board of Wind Energy Science. The peer-review process was guided by an independent editor, and the authors also have no other competing interests to declare.
The views expressed in the article do not necessarily represent the views of the DOE, NOAA, or the U.S. Government.
Publisher's note: Copernicus Publications remains neutral with regard to jurisdictional claims made in the text, published maps, institutional affiliations, or any other geographical representation in this paper. The authors bear the ultimate responsibility for providing appropriate place names. Views expressed in the text are those of the authors and do not necessarily reflect the views of the publisher.
The authors would like to acknowledge the National Weather Service offices of Boston, MA, and Upton, NY, for contributing to the WFIP3 event-logging efforts. We would also like to thank the Wind Data Hub team at the Pacific Northwest National Laboratory for helping with data processing and storage. We also express great appreciation to Don Murray and colleagues at NOAA who generated and maintained the model–observation visualization portal at https://www.psl.noaa.gov/renewable_energy/wfip3/modelobs/ (last access: 27 May 2026) that enabled so much of the event-logging activity.
This research has been supported by the U.S. Department of Energy (contract nos. DE-AC36-08GO28308, DE-AC52-07NA27344, DE-AC05-76RLO1830, and DE-EE0009424405), Office of Critical Minerals and Energy Innovation Wind Energy Technologies Office; and the National Oceanic and Atmospheric Administration (cooperative agreement no. NA22OAR4320151).
This paper was edited by Cristina Archer and reviewed by two anonymous referees.
Bianco, L., Djalalova, I. V., Wilczak, J. M., Cline, J., Calvert, S., Konopleva-Akish, E., Finley, C., and Freedman, J.: A Wind Energy Ramp Tool and Metric for Measuring the Skill of Numerical Weather Prediction Models, Weather Forecast., 31, 1137–1156, https://doi.org/10.1175/WAF-D-15-0144.1, 2016. a
Bodini, N., Moriarty, P., Letizia, S., Mann, J., Wharton, S., Deskos, G., Doubrawa, P., Fast, J., Hamilton, N., Herges, T., Kaul, C., Kelley, C., Krishnamurthy, R., Lavin, L., Lundquist, J. K., Maniaci, D., and Naughton, J.: A perspective on lessons learned and future needs for wind energy field campaigns, J. Renew. Sustain. Ener., 17, 032302, https://doi.org/10.1063/5.0252362, 2025a. a
Bodini, N., Olson, J., Gaudet, B., Iungo, G. V., Solari, M. S., Roy, S., Lundquist, J. K., Agarwal, N., Myers, T. A., Adler, B., Mirocha, J. D., James, E., Bianco, L., Wilczak, J. M., and Turner, D. D.: Wind Data Hub: Event Log / Raw Data, Wind Data Hub for U. S. Department of Energy, Office of Energy Efficiency and Renewable Energy, https://doi.org/10.21947/3010982, last access: 3 December 2025, 2025b. a, b
Dowell, D. C., Alexander, C. R., James, E. P., Weygandt, S. S., Benjamin, S. G., Manikin, G. S., Blake, B. T., Brown, J. M., Olson, J. B., Hu, M., Smirnova, T. G., Ladwig, T., Kenyon, J. S., Ahmadov, R., Turner, D. D., Duda, J. D., and Alcott, T. I.: The High-Resolution Rapid Refresh (HRRR): An hourly updating convection-allowing forecast model. Part I: Motivation and system description, Weather Forecast., 37, 1371–1395, https://doi.org/10.1175/WAF-D-21-0151.1, 2022. a
Kirincich, A., Krishnamurthy, R., Turner, D. D., Adler, B., Agarwal, N., Berg, L. K., Bianco, L., Bodini, N., Chabert d'Hieres, M., Farrar, J. T., Fernando, H. J. S., Gaudet, B., Ghate, V. P., Goldberger, L., Gonzalez, A. O., Hall, E., Hodges, G., Iungo, G. V., Jackson, R., Jiang, H., Kinsella, A., Kosovic, B., Kotamarthi, R., Letizia, S., Lipari, S., Lundquist, J. K., Mirocha, J., Moss, C., Muradyan, P., Myers, T., Newsom, R. K., O'Brien, J., Olson, J. B., Pekour, M., Puccioni, M., Rosencrans, D., Roy, S., Sauvage, C., Sedlar, J., Seo, H., Shams Solari, M., Soldo, L., Stierle, S., Sun, X., Thompson, E., Traiger, E., Wharton, S., Wilczak, J., and Zippel, S.: Improving the Understanding and Forecasting of Winds over the Northeast U. S. Shelf: The Third Wind Forecast Improvement Project (WFIP3), B. Am. Meteorol. Soc., submitted, 2026. a, b, c
Olson, J. B., Kenyon, J. S., Djalalova, I., Bianco, L., Turner, D. D., Pichugina, Y., Choukulkar, A., Toy, M. D., Brown, J. M., Angevine, W. M., Akish, E., Bao, J.-W., Jimenez, P., Kosovic, B., Lundquist, K. A., Draxl, C., Lundquist, J. K., McCaa, J., McCaffrey, K., Lantz, K., Long, C., Wilczak, J., Banta, R., Marquis, M., Redfern, S., Berg, L. K., Shaw, W., and Cline, J.: Improving Wind Energy Forecasting through Numerical Weather Prediction Model Development, B. Am. Meteorol. Soc., 100, 2201–2220, https://doi.org/10.1175/BAMS-D-18-0040.1, 2019. a
Quint, D., Lundquist, J. K., and Rosencrans, D.: Simulations suggest offshore wind farms modify low-level jets, Wind Energ. Sci., 10, 117–142, https://doi.org/10.5194/wes-10-117-2025, 2025. a, b
Shaw, W. J., Berg, L. K., Cline, J., Draxl, C., Djalalova, I., Grimit, E. P., Lundquist, J. K., Marquis, M., McCaa, J., Olson, J. B., Sivaraman, C., Sharp, J., and Wilczak, J. M.: The Second Wind Forecast Improvement Project (WFIP2): General Overview, B. Am. Meteorol. Soc., 100, 1687–1699, https://doi.org/10.1175/BAMS-D-18-0036.1, 2019. a
Solari, M. S., Roy, S., Moss, C., Iungo, G. V., Lundquist, J. K., Adler, B., Bianco, L., Bodini, N., Cinquino, E., Farrar, J. T., Kirincich, A., Krishnamurthy, R., Letizia, S., Myers, T., Muradyan, P., Pekour, M., Sedlar, J., Soldo, L., Wilczak, J., and Zippel, S. F.: Observations of the Marine Atmospheric Boundary Layer's Response to a Solar Eclipse, Bound.-Lay. Meteorol., 192, 32, https://doi.org/10.1007/s10546-026-00973-w, 2026. a
Wilczak, J. M., Stoelinga, M., Berg, L. K., Sharp, J., Draxl, C., McCaffrey, K., Banta, R. M., Bianco, L., Djalalova, I., Lundquist, J. K., Muradyan, P., Choukulkar, A., Leo, L., Bonin, T., Pichugina, Y., Eckman, R., Long, C. N., Lantz, K., Worsnop, R. P., Bickford, J., Bodini, N., Chand, D., Clifton, A., Cline, J., Cook, D. R., Fernando, H. J. S., Friedrich, K., Krishnamurthy, R., Marquis, M., McCaa, J., Olson, J. B., Otarola-Bustos, S., Scott, G., Shaw, W. J., Wharton, S., and White, A. B.: The Second Wind Forecast Improvement Project (WFIP2): Observational Field Campaign, B. Am. Meteorol. Soc., 100, 1701–1723, https://doi.org/10.1175/BAMS-D-18-0035.1, 2019. a
- Abstract
- Copyright statement
- Introduction
- The WFIP3 campaign
- Identification of phenomena to log
- WFIP3 event log structure
- Dataset format
- Event log summary
- Conclusions
- Appendix A: List of resources consulted by event loggers
- Data availability
- Author contributions
- Competing interests
- Disclaimer
- Acknowledgements
- Financial support
- Review statement
- References