the Creative Commons Attribution 4.0 License.
the Creative Commons Attribution 4.0 License.
 | 05 Mar 2021
An overview of wind-energy-production prediction bias, losses, and uncertainties
Joseph C. Y. Lee
M. Jason Fields
The financing of a wind farm directly relates to the preconstruction energy yield assessments which estimate the annual energy production for the farm. The accuracy and the precision of the preconstruction energy estimates can dictate the profitability of the wind project. Historically, the wind industry tended to overpredict the annual energy production of wind farms. Experts have been dedicated to eliminating such prediction errors in the past decade, and recently the reported average energy prediction bias is declining. Herein, we present a literature review of the energy yield assessment errors across the global wind energy industry. We identify a long-term trend of reduction in the overprediction bias, whereas the uncertainty associated with the prediction error is prominent. We also summarize the recent advancements of the wind resource assessment process that justify the bias reduction, including improvements in modeling and measurement techniques. Additionally, because the energy losses and uncertainties substantially influence the prediction error, we document and examine the estimated and observed loss and uncertainty values from the literature, according to the proposed framework in the International Electrotechnical Commission 61400-15 wind resource assessment standard. From our findings, we highlight opportunities for the industry to move forward, such as the validation and reduction of prediction uncertainty and the prevention of energy losses caused by wake effect and environmental events. Overall, this study provides a summary of how the wind energy industry has been quantifying and reducing prediction errors, energy losses, and production uncertainties. Finally, for this work to be as reproducible as possible, we include all of the data used in the analysis in appendices to the article.
- Article
(3028 KB) - Full-text XML
- BibTeX
- EndNote


Determining the range of annual energy production (AEP), or the energy yield assessment (EYA), has been a key part of the wind resource assessment (WRA) process. The predicted median AEP is also known as the P50, i.e., the AEP expected to be exceeded 50 % of the time. P50 values are often defined with timescales such as 1, 10, and 20 years. In this study, unless stated otherwise, we primarily discuss the 20-year P50, which is the typical expected lifespan of utility-scale wind turbines. For years, leaders in the field have been discussing the difference between predicted P50 and actual AEP, where the industry often overestimates the energy production of a wind farm (Hale, 2017; Hendrickson, 2009, 2019; Johnson et al., 2008). A recent study conducted by the researchers at the National Renewable Energy Laboratory (NREL) found an average of 3.5 % to 4.5 % P50 overprediction bias based on a subset of wind farms in the United States and accounting for curtailment (Lunacek et al., 2018).
Such P50 overestimation results in marked financial implications. Healer (2018) stated that if a wind project produces a certain percentage lower than the P50 on a 2-year rolling basis, the energy buyer, also known as the offtaker, may have the option to terminate the contract. For a 20-year contract, if a wind farm has a 1 % chance of such underproduction over a 2-year period, the probability of such an event taking place within the 18 2-year rolling periods is 16.5 %, as 100 % − (100 % − 1 %)18=16.5 % (Healer, 2018), assuming each 2-year rolling period is independent. Therefore, projects with substantial energy-production uncertainty experience the financial risk from modern energy contracting.
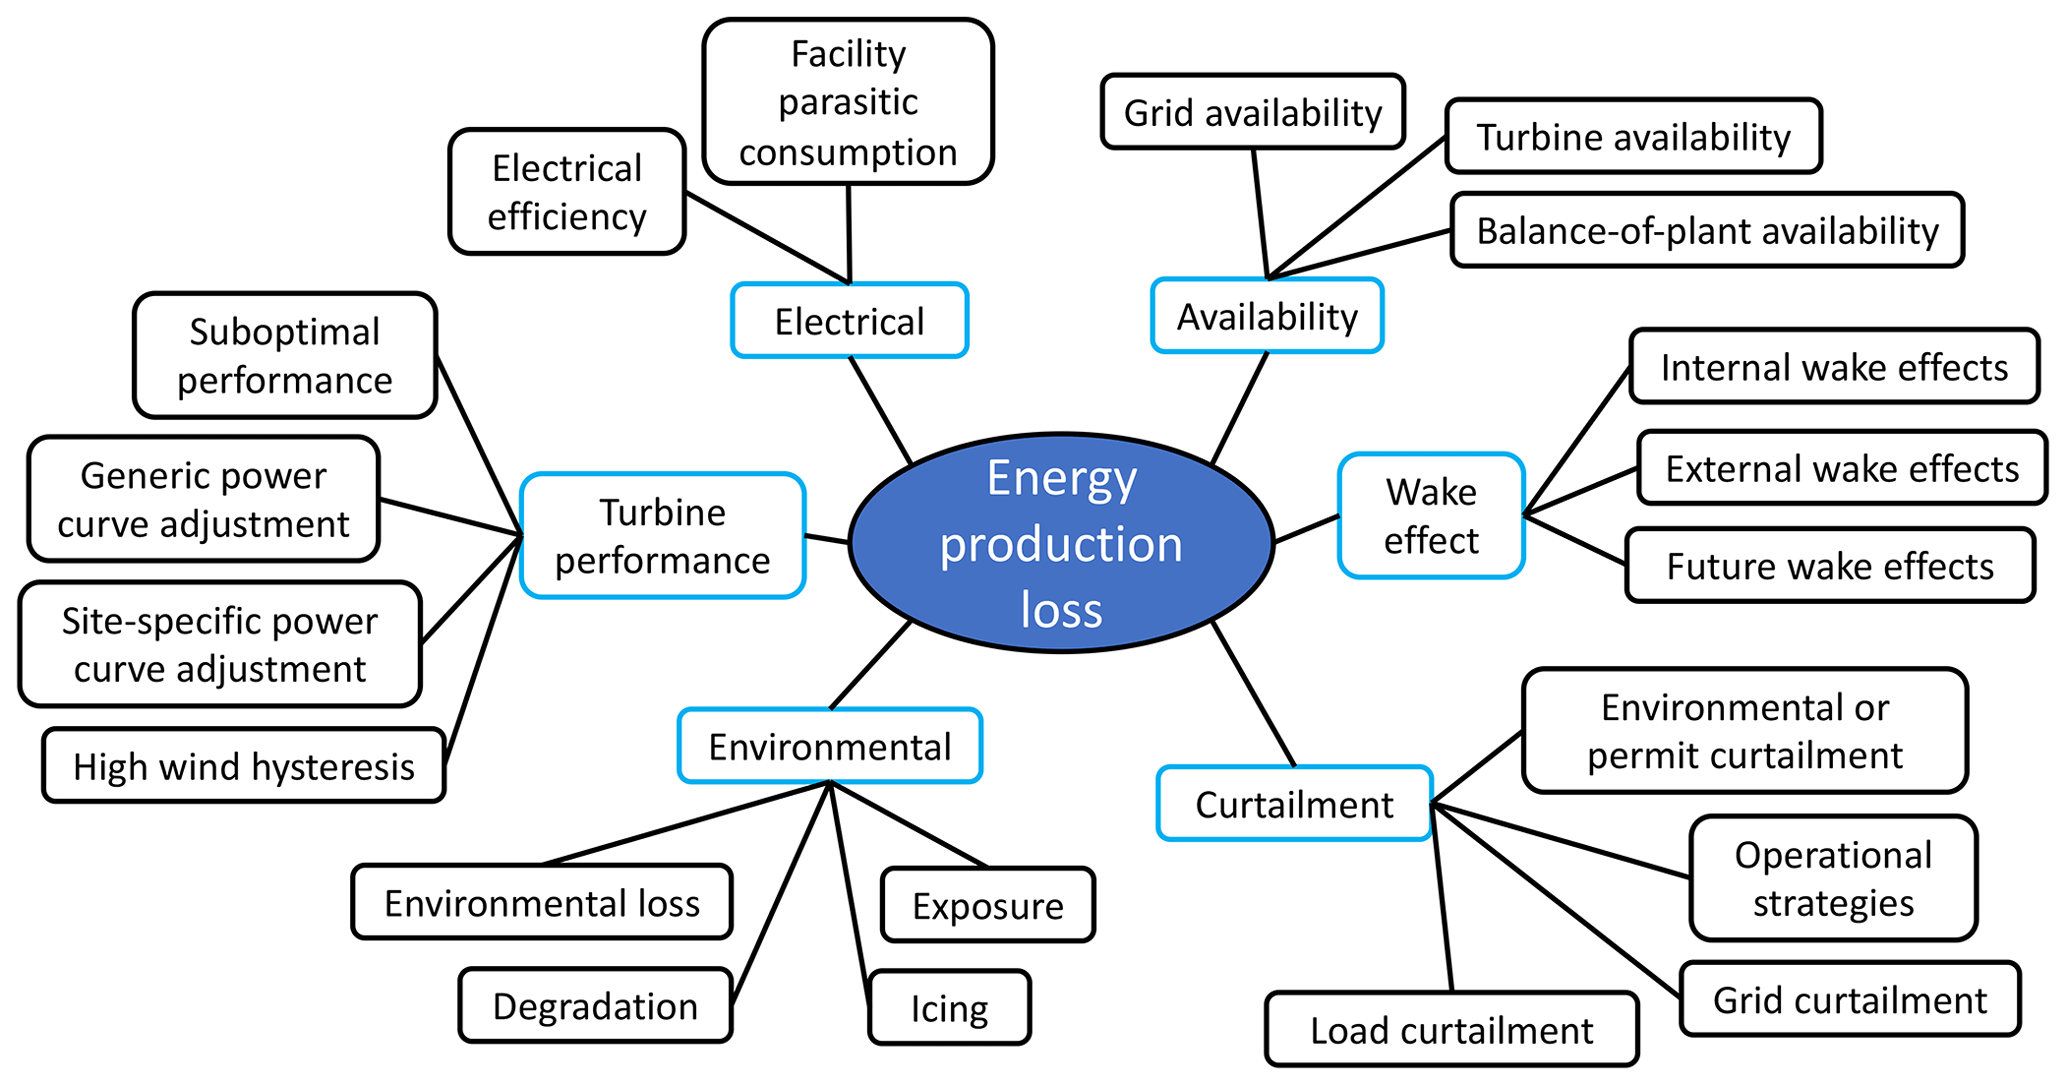
Figure 1Mind map of energy-production loss, according to the IEC 61400-15 proposed framework. The blue and black rounded rectangles represent the categorial and subcategorical losses, respectively. Details of each loss category and subcategory are discussed in Table A1.
Random errors cause observations or model predictions to deviate from the truth and lead to uncertainty (Clifton et al., 2016), and uncertainty is quantified via probability (Wilks, 2011). In WRA, the P values surrounding P50 such as P90 and P95 characterize the uncertainty of the predicted AEP distribution. Such energy-estimate uncertainty depends on the cumulative certainty of the entire WRA process, from wind speed measurements to wind flow modeling (Clifton et al., 2016). When a sample of errors is Gaussian distributed, the standard deviation around the mean is typically used to represent the uncertainty of errors. Traditionally, the wind energy industry uses standard deviation, or σ, to represent uncertainty.
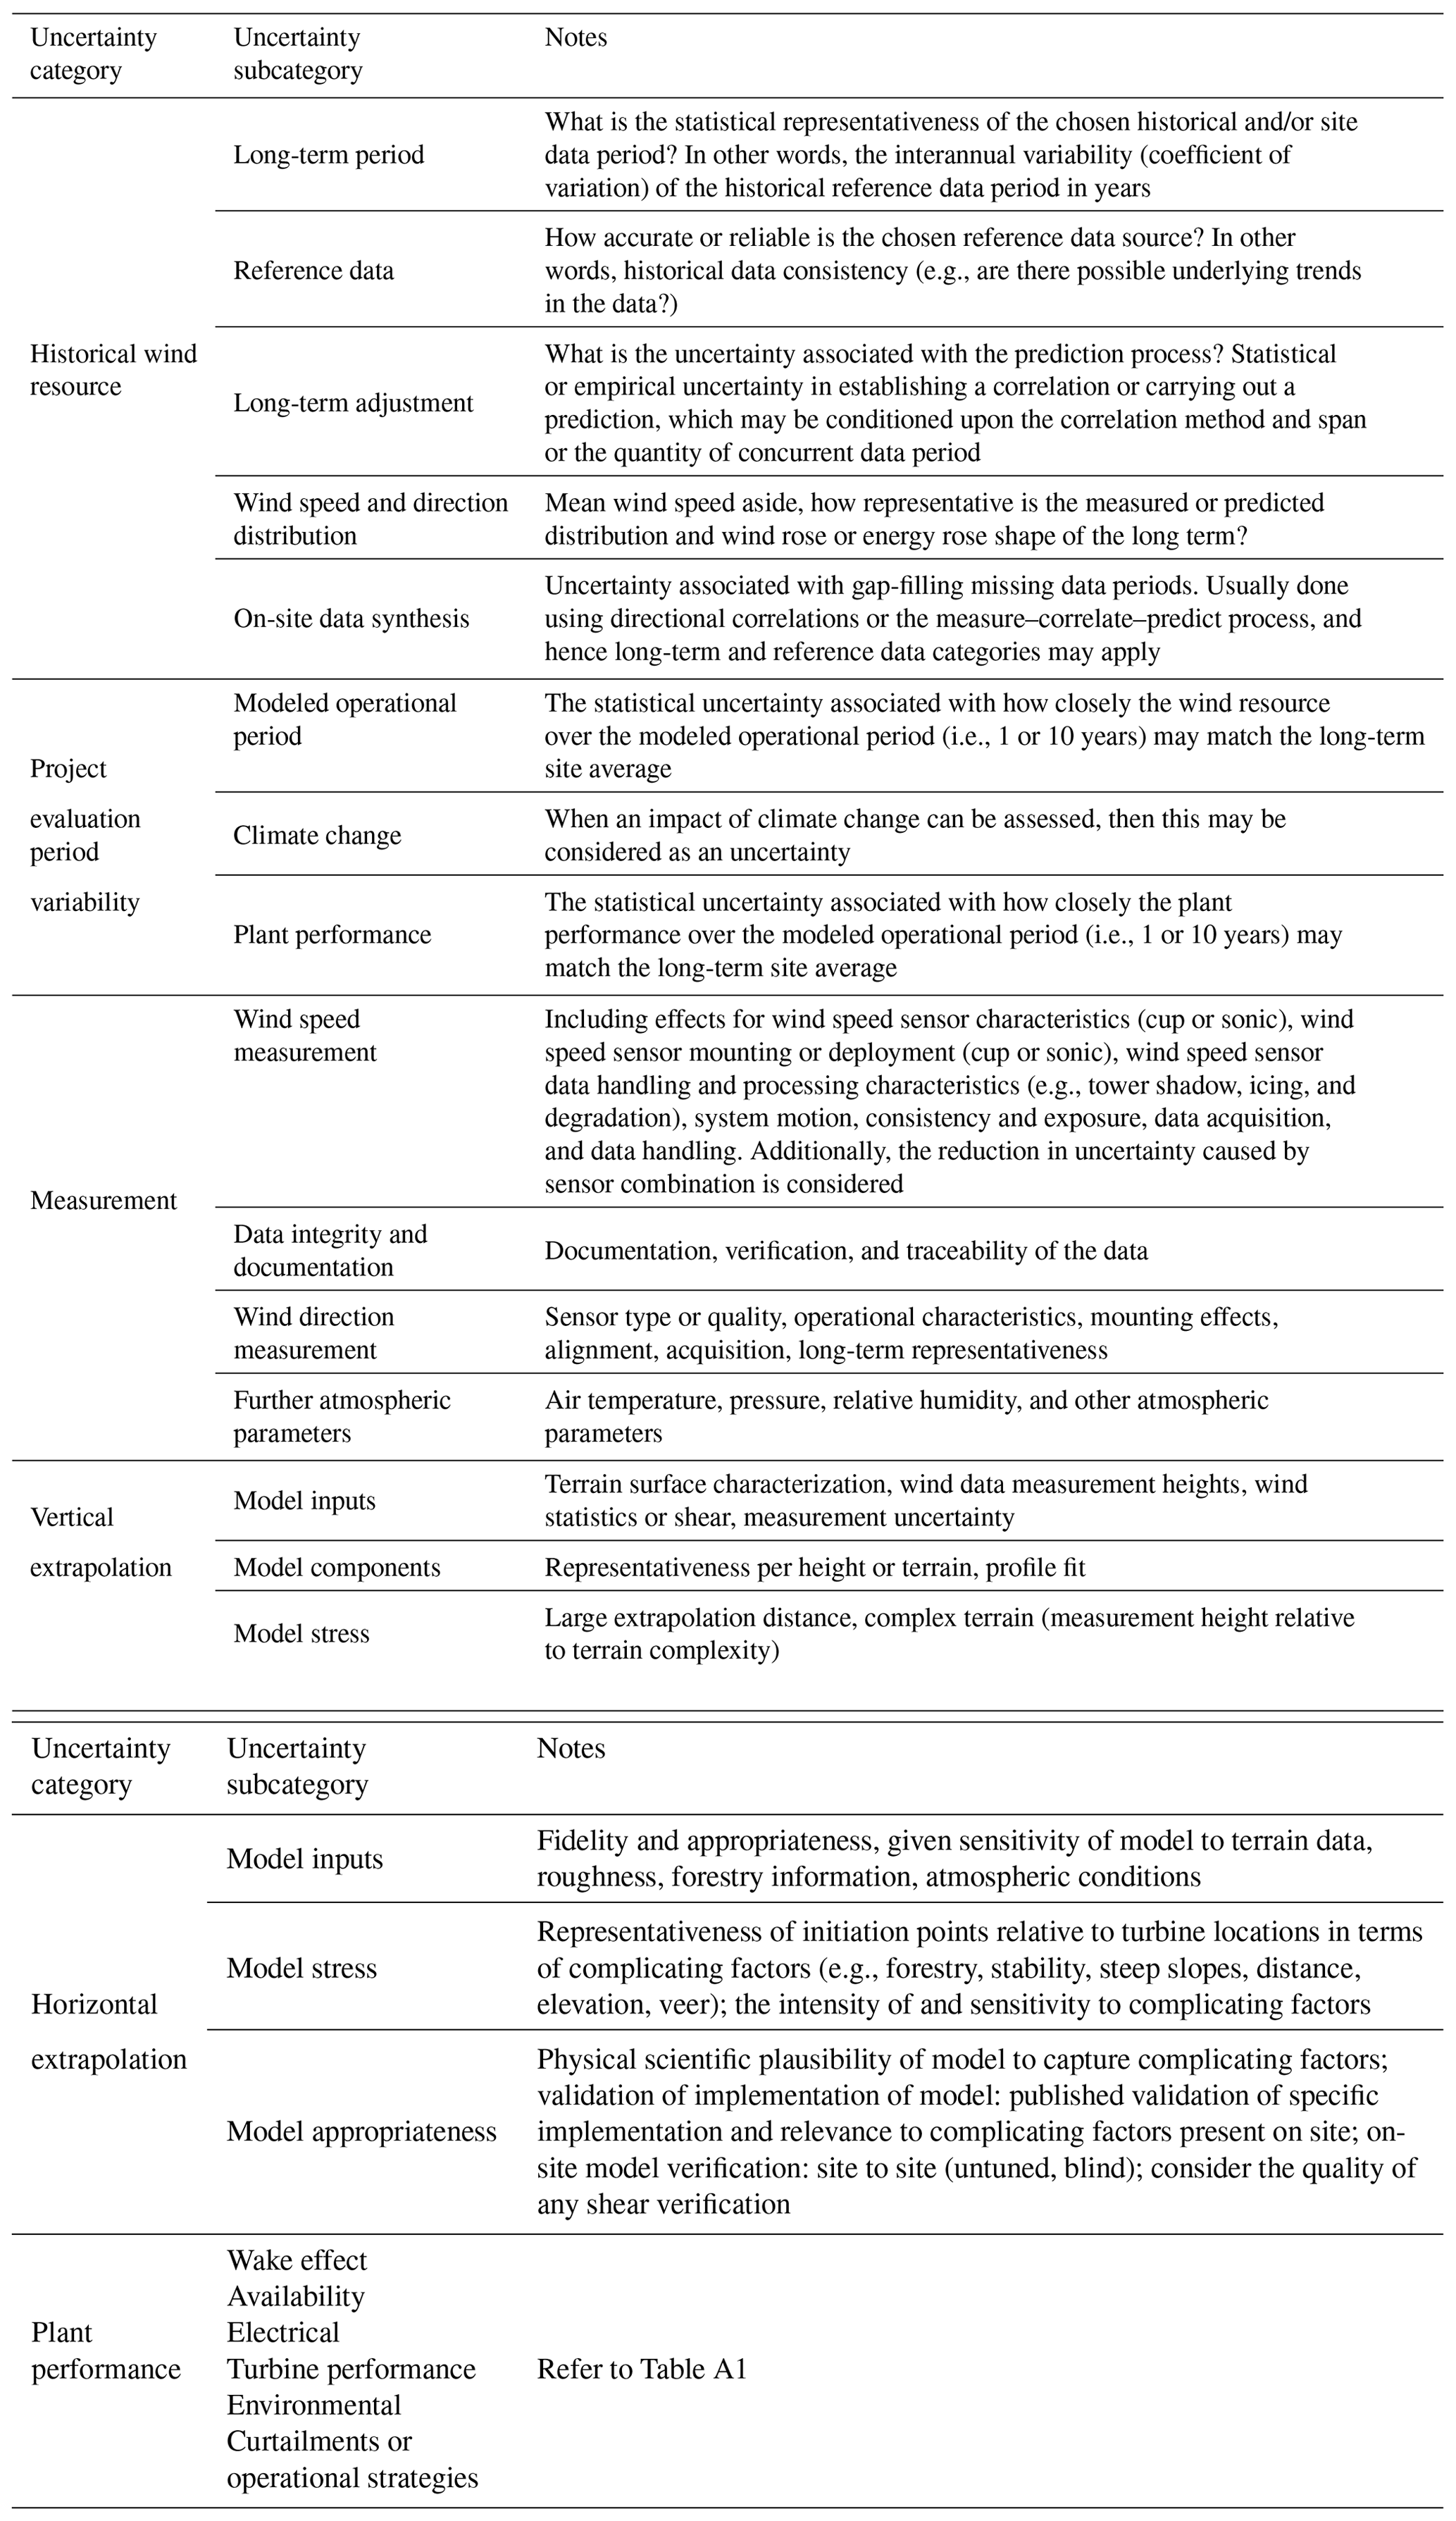
The WRA process governs the accuracy and precision of the P50, and a key component in WRA constitutes the estimation of energy-production losses and uncertainties. Wind energy experts have been using different nomenclature in WRA, and inconsistent definitions and methodologies exist. To consolidate and ameliorate the assessment process, the International Electrotechnical Commission (IEC) 61400-15 working group has proposed a framework to classify various types of energy-production losses and uncertainties (Filippelli et al., 2018, adapted in Appendix A). We illustrate the categorical and subcategorical losses and uncertainties in Figs. 1 and 2. Note that the proposed framework is not an exclusive or exhaustive list of losses and uncertainties because some institution-specific practices may not fit into the proposed standard. Moreover, the proposed framework presented herein does not represent the final IEC standards, which are pending to be published.
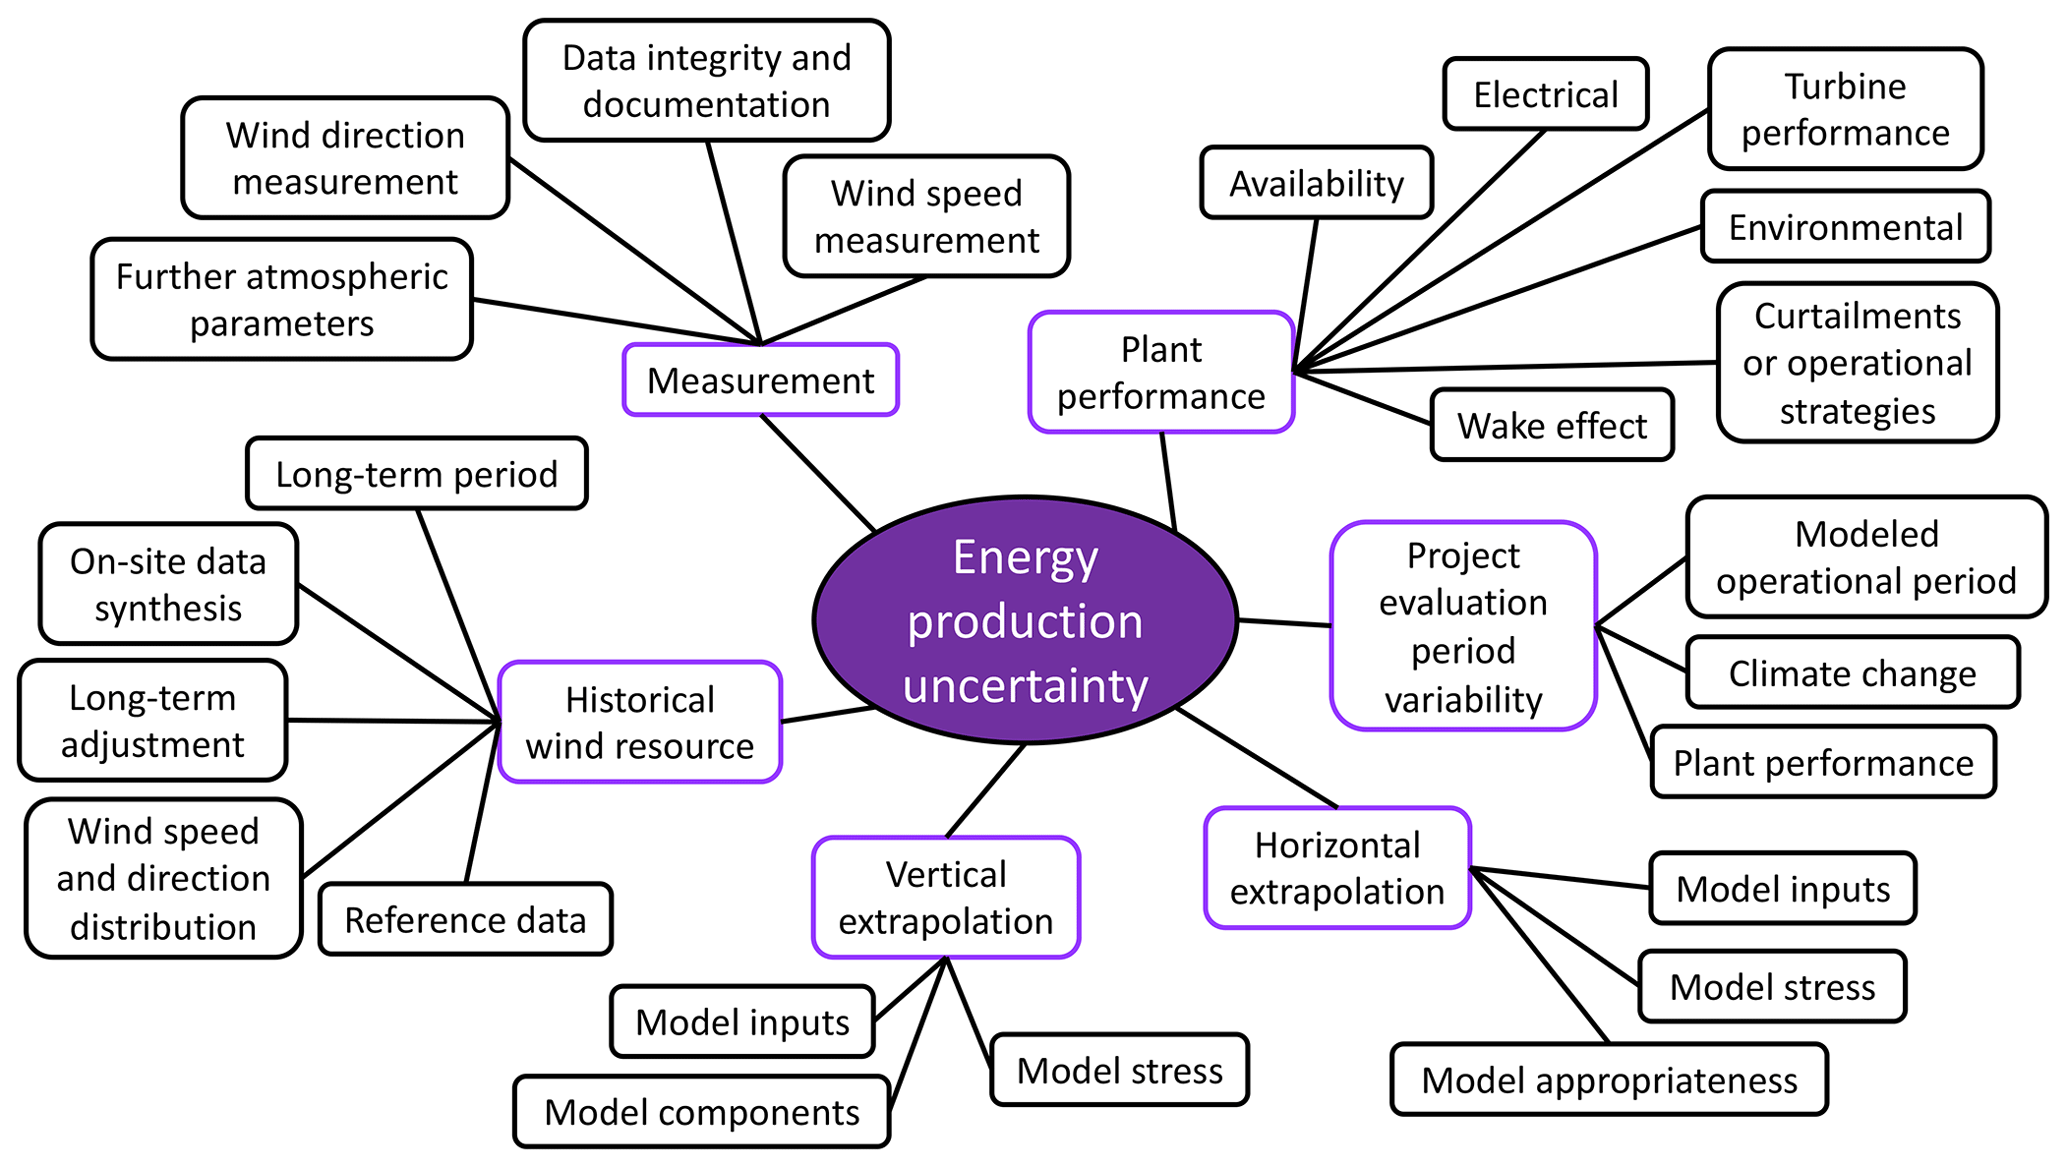
Figure 2Mind map of energy-production uncertainty, according to the IEC 61400-15 proposed framework. The purple and black rounded rectangles represent the categorial and subcategorical uncertainties, respectively. Details of each uncertainty category and subcategory are discussed in Table A2.
The wind energy industry has been experiencing financial impacts caused by the challenges and difficulties in predicting energy-production losses and uncertainties over the lifetime of a modern wind project, which can continue to operate beyond 20 years:
-
an AEP prediction error of 1 GWh, e.g., because of the P50 prediction bias, translates to about EUR 50 000 to 70 000 lost (Papadopoulos, 2019);
-
reducing energy uncertainty by 1 % can result in USD 0.5 to 2 million of economic benefits, depending on the situation and the financial model (Brower et al., 2015; Halberg, 2017);
-
a change of 1 % in wind speed uncertainty can lead to a 3 % to 5 % change in net present value of a wind farm (Kline, 2019).
Experts in the industry have presented many studies on P50 prediction error, energy loss, and uncertainty for years, and the purpose of this literature review is to assemble previous findings and deliver a meaningful narrative. This article is unique and impactful because it is the first comprehensive survey and analysis of the key parameters in the WRA process across the industry. The three main research questions of this study include the following:
-
Is the industry-wide P50 prediction bias changing over time, and what are the reasons for the changes?
-
What are the ranges of different categories of energy-production losses and uncertainties?
-
Given our understanding on losses and uncertainties, what are the opportunities for improvements in the industry?
From past research, in addition to the energy-production uncertainties, we review how the industry has been quantifying various wind speed uncertainties, particularly from wind measurements, extrapolation methods, and modeling. We also compile and present the wind speed results herein.
We present this article with the following sections: Sect. 2 documents the data and the methodology of data filtering; Sect. 3 focuses on P50 prediction bias, including its trend and various reasons of bias improvement; Sects. 4 and 5, respectively, illustrate the energy-production loss and uncertainty, according to the IEC-proposed framework; Sect. 6 describes the numerical ranges of various wind speed uncertainties; Sect. 7 discusses the implications and future outlook based on our findings; Sect. 8 provides conclusions; Appendix A outlines the energy loss and uncertainty frameworks proposed by the IEC 61400-15 working group; Appendix B compiles the data used in this analysis.
We conduct our literature review over a broad spectrum of global sources. The literature includes the presentations at academic, industry, and professional conferences, particularly the Wind Resource and Project Energy Assessment workshops hosted by the American Wind Energy Association (AWEA) and WindEurope, as they are the key annual gatherings for wind resource experts. Additionally, we examine data from industry technical reports and white papers; publicly available user manuals of wind energy numerical models; technical reports from government agencies, national laboratories, and research and academic institutions; and peer-reviewed journal articles. Many of the literature sources originate in North America and Europe. Meanwhile, many of the regional corporations we cited in this article have become global businesses after mergers and acquisitions; hence, their presentations and publications can also represent international practices.
In most cases, we label the data source with the published year of the study, unless the author highlights a change of method at a specific time. For example, if an organization publishes a study in 2012 and reports their improvements on P50 prediction bias by comparing their “current” method with their “previous set of methodology before 2012”, the two P50 biases are recorded as 2012 and 2011, respectively. Moreover, for the same study that documents multiple P50 prediction errors in the same year, we select the one closest to zero, because those numbers reflect the state of the art of P50 validation of that year (Fig. 3). Accordingly, we use the paired P50 errors to indicate the effects from method adjustments (Fig. 4). To track the bias impact of technique changes from different organizations, we combine the closely related, ongoing series of studies from a single organization, usually by the same authors from the same institutions (each line in Fig. 4).
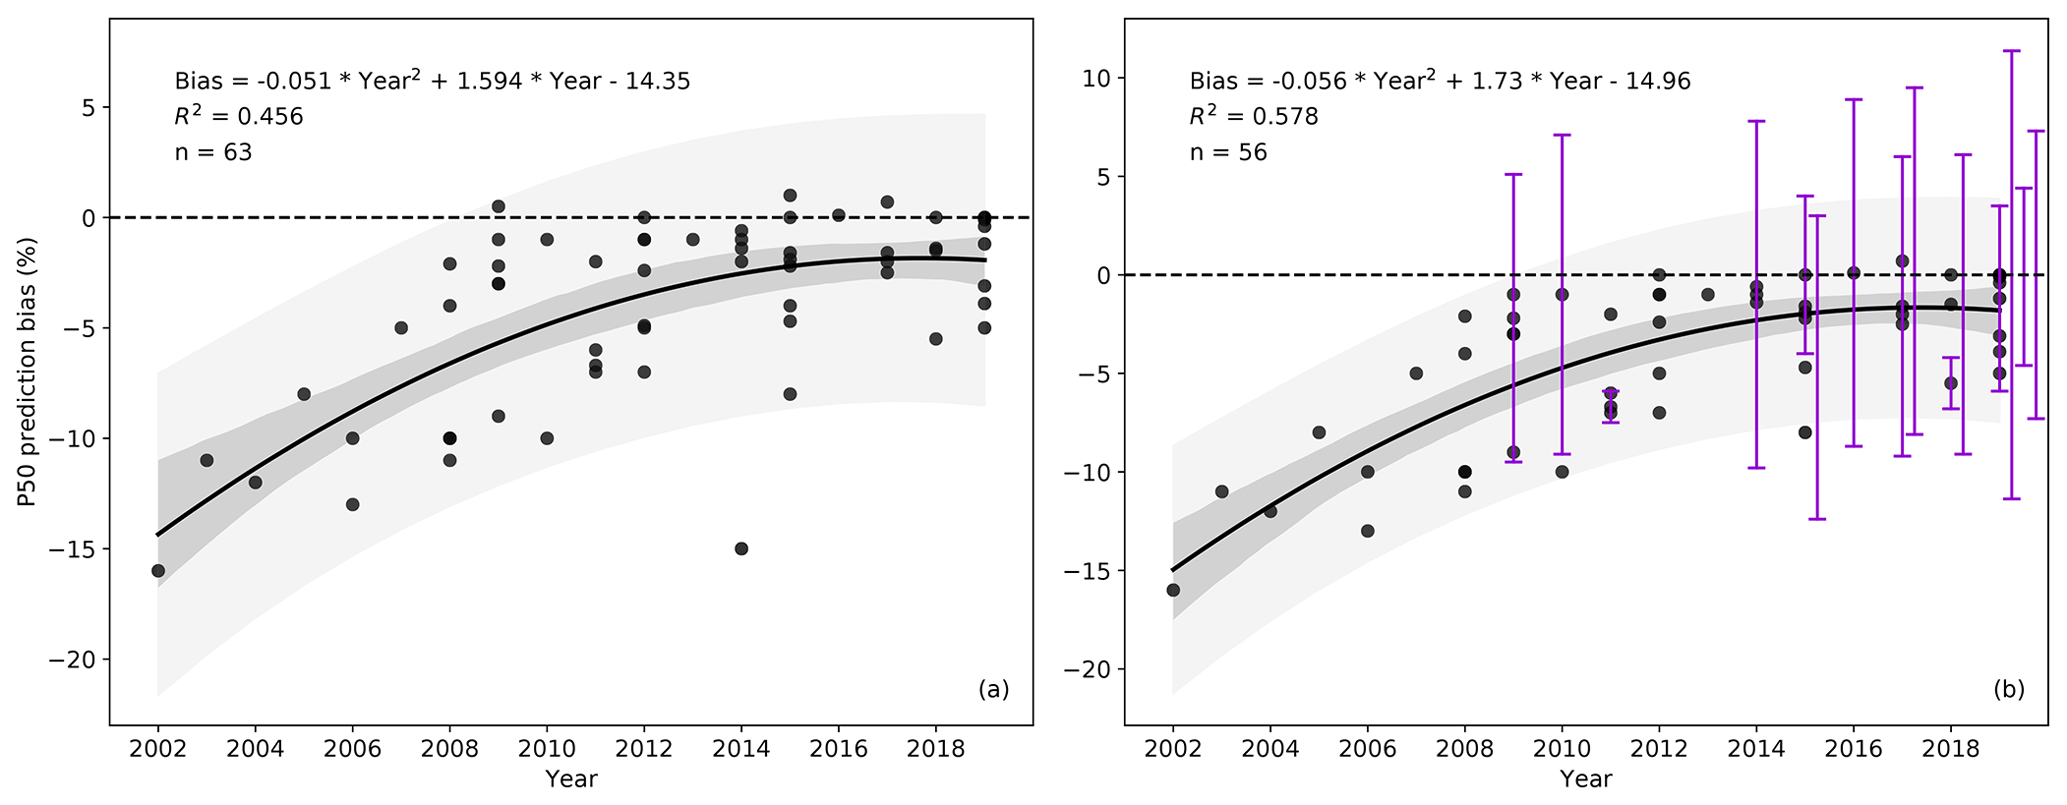
Figure 3The trend of P50 prediction bias: (a) scatterplot of 63 independent P50 prediction error values, where R2 is the coefficient of determination and n is the sample size. Negative bias means the predicted AEP is higher than the measured AEP, and vice versa for positive bias. The solid black line represents the quadratic regression, the dark grey cone displays the 95 % confidence interval of the regression line, the light grey cone depicts the 95 % prediction interval, and the horizontal dashed black line marks the zero P50 prediction error. (b) As in panel (a) but only for 56 studies that use more than 10 wind farms in the analyses. The vertical violet bars represent the estimated uncertainty bounds (presented as 1 standard deviation from the mean) of the mean P50 prediction errors in 15 of the 56 samples. Table B1 summarizes the bias data illustrated herein. For clarity, the regression uses the year 2002 as the baseline; hence, the resultant regression constant, i.e., the derived intercept, is comprehensible.
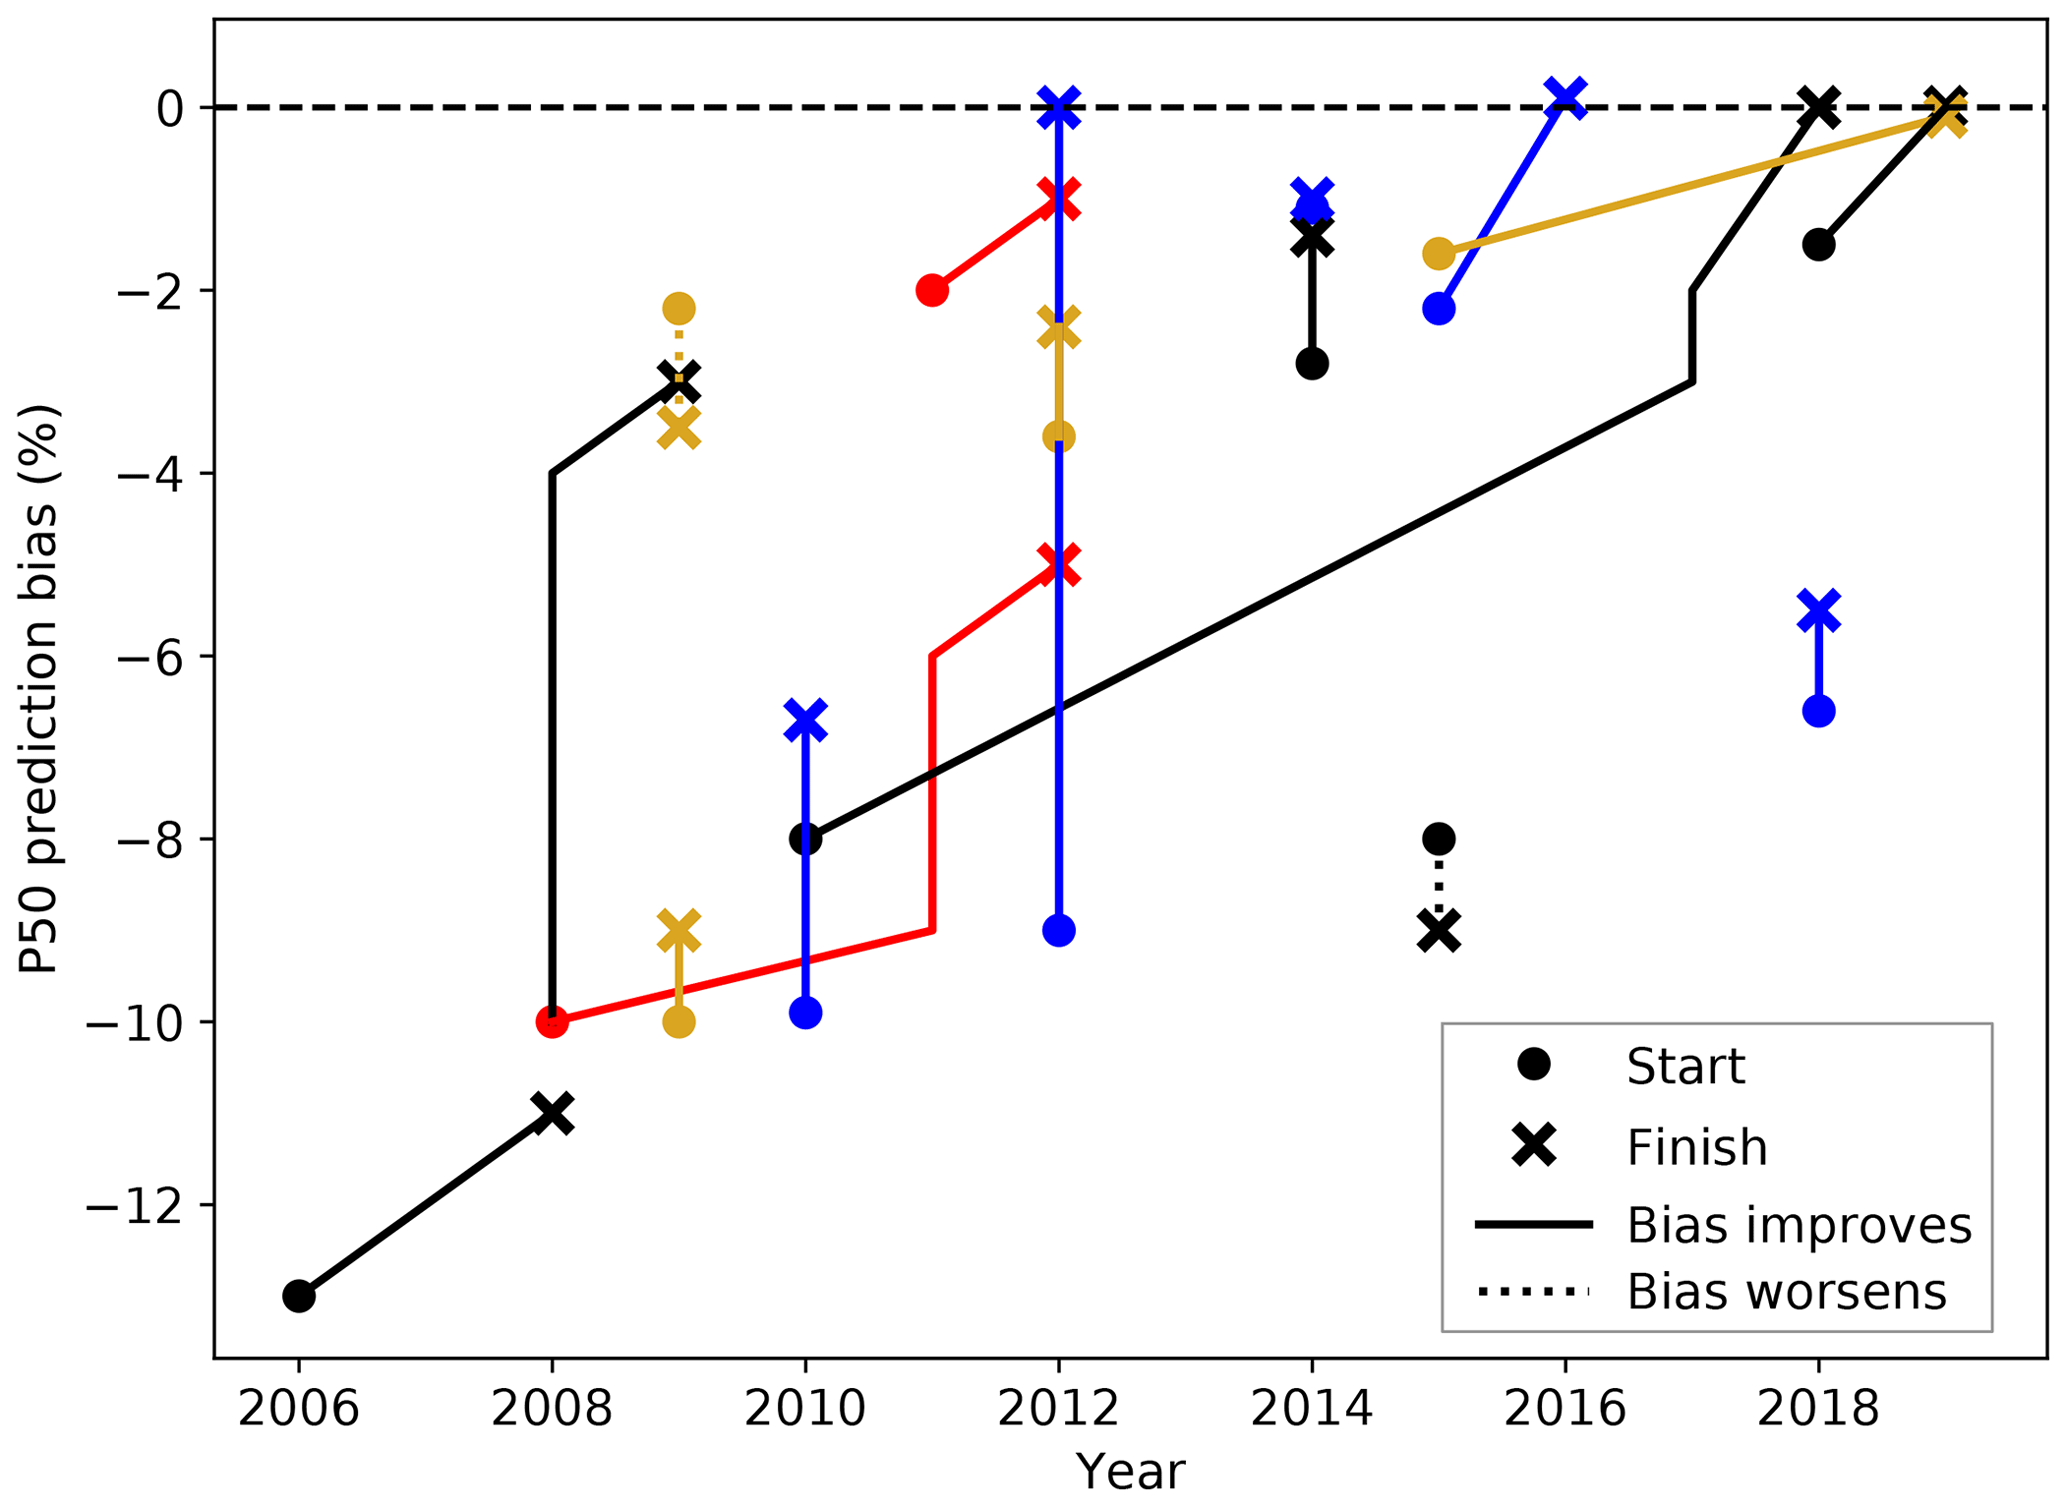
Figure 4Illustration of P50 bias changes over time after method modifications in 17 studies. The dot and the cross, respectively, represent the starting point and the finish point of the P50 prediction error because of method adjustments. The solid line indicates the P50 bias reduces after the method change, and the dotted line displays the opposite. The different colors are solely used to differentiate the lines and represent no meaning. The paired data are presented in Table B2.
We also derive the trend of P50 prediction errors using polynomial regression and investigate the reasons behind such trend. We use the second-degree polynomial regression (i.e., quadratic regression) to analyze the trend of the P50 prediction errors over time, and polynomials of higher degrees only marginally improve the fitting. We choose the polynomial regression over the simple linear regression because the P50 prediction errors are reducing towards zero with a diminishing rate, and we use quadratic polynomial over higher-order polynomials to avoid overfitting. Additionally, in the regressions presented in this article (Figs. 3, 8, and C1), we present an estimated 95 % confidence interval, generated via bootstrapping with replacement using the same sample size of the data, which is performed through the regplot function in the seaborn Python library (Waskom et al., 2020). The confidence interval describes the bounds of the regression coefficients with 95 % confidence. Furthermore, we present the 95 % prediction interval in Fig. 3, which depicts the range of the predicted values, i.e., the P50 prediction bias, with 95 % confidence, given the existing data and regression model. The prediction interval is calculated using standard deviation, assuming an underlying Gaussian distribution. In short, the confidence interval illustrates the uncertainty of the regression function, whereas the prediction interval represents the uncertainty of the estimated values of the predictand (Wilks, 2011). In addition, we evaluate the regression analysis with the coefficient of determination (R2), which represents the proportion of the variance of the predictand explained by the regression.
For loss and uncertainty, we have limited data samples for certain categories because these data are only sparsely available. When a source does not provide an average value, we perform a simple arithmetic mean when both the upper and lower bounds are listed. For instance, when the average wake loss is between 5 % and 15 %, we project the average of 10 % in Fig. 6, and we present all the original values in Appendix B. If only the upper bound is found, then we project the data point as a maximum: the crosses in Fig. 6 are used as an example. We also use linear regression to explore trends in loss and uncertainty estimates.
We categorize the data to the best of our knowledge to synthesize a holistic analysis. On one hand, if the type of loss and uncertainty from a source uses marginally different terminology from the IEC-proposed framework, we first attempt to classify it within the IEC framework, we gather other values in the same category or subcategory from the same data source, and we select the minimum and the maximum. As an illustration, if the total electrical losses from the substation and the transmission line are, respectively, 1 % and 2 %, we then label the total electrical loss with the range of 1 % to 2 %. On the other hand, when the type of loss and uncertainty illustrated in the literature largely differ from the IEC framework, we label them separately (Figs. 7 and 11). Because a few studies contrast wake loss and nonwake loss, where nonwake loss represents every other type of energy loss, we also include nonwake loss in this study (Figs. 6 and 10). When a type of uncertainty is recorded as simply “extrapolation” (seen in McAloon, 2010 and Walter, 2010), we label the value as both horizontal and vertical extrapolation uncertainties with a note of “extrapolation” in Tables B6 and B8. We also divide the reported losses and uncertainties into two groups, the “estimated” and the “observed”, where the former are based on simulations and modeling studies, and the latter are quantified via field measurements.
Unless specifically stated otherwise in Appendix B, we present a loss value as the percentage of production loss per year, and we document an uncertainty number as the single standard deviation in energy percentage in the long term, usually for 10 or 20 years. The wind speed uncertainty is stated as a percentage of wind speed in m s−1, and the uncertainty of an energy loss is expressed as percent of a loss percentage.
This article evaluates a compilation of averages, where each data point represents an independent number. The metadata for each study in the literature vary, in which the resultant P50 prediction errors, losses, and uncertainties come from diverse collections of wind farms with different commercial operation dates in various geographical regions and terrains. Therefore, readers should not compare a specific data point with another. In this study, we aim to discuss the WRA process from a broad perspective. Other caveats of this analysis include the potentially inaccurate classification of the data into the proposed IEC framework; the prime focus on P50 rather than P90, which also has a strong financial implication; and the tendency in the literature to selectively report extreme losses and uncertainties caused by extraordinary events, such as availability loss and icing loss, which potentially misrepresents the reality. Our data sources are also only limited to publicly available data or those accessible at NREL. We perform a rigorous literature review from over 150 independent sources, and the results presented in this article adequately display the current state of the wind energy industry.
3.1 Bias trend
We identify an improving trend of the mean P50 prediction bias, where the overprediction of energy production is gradually decreasing over time (Fig. 3), and the narrow 95 % confidence interval of the regression fit justifies the long-term trend. Such an improving trend is not strictly statistically significant (Fig. 3a), even after removing the studies based on small wind farm sample sizes (Fig. 3b). However, the R2 of 0.578 in Fig. 3b implies that over half of the variance in bias can be described by the regression, and less than half of the variance is caused by the inherent uncertainty between validation studies that does not change over time. The average bias magnitude also does not correlate with the size of the study, neither in wind farm sample size nor wind farm year length (not shown). Note that in some early studies, the reported biases measured in wind farm differ from those using wind farm year from the same source; we select the error closest to zero for each independent reference because the bias units are the same (Sect. 2).
The uncertainty of the average P50 prediction error quantified by the studies remains large, in which the mean standard deviation is 6.6 % of the 15 data sources' reported estimated P50 uncertainty (violet bars in Fig. 3b). The industry started to disclose the standard deviations of their P50 validation studies in 2009, and it is becoming more common. With only 15 data points, we cannot identify a temporal trend of the uncertainty in P50 prediction bias. Even though the industry-wide mean P50 prediction bias is converging towards zero, the industry appears to overestimate or underpredict the AEP for many individual wind projects.
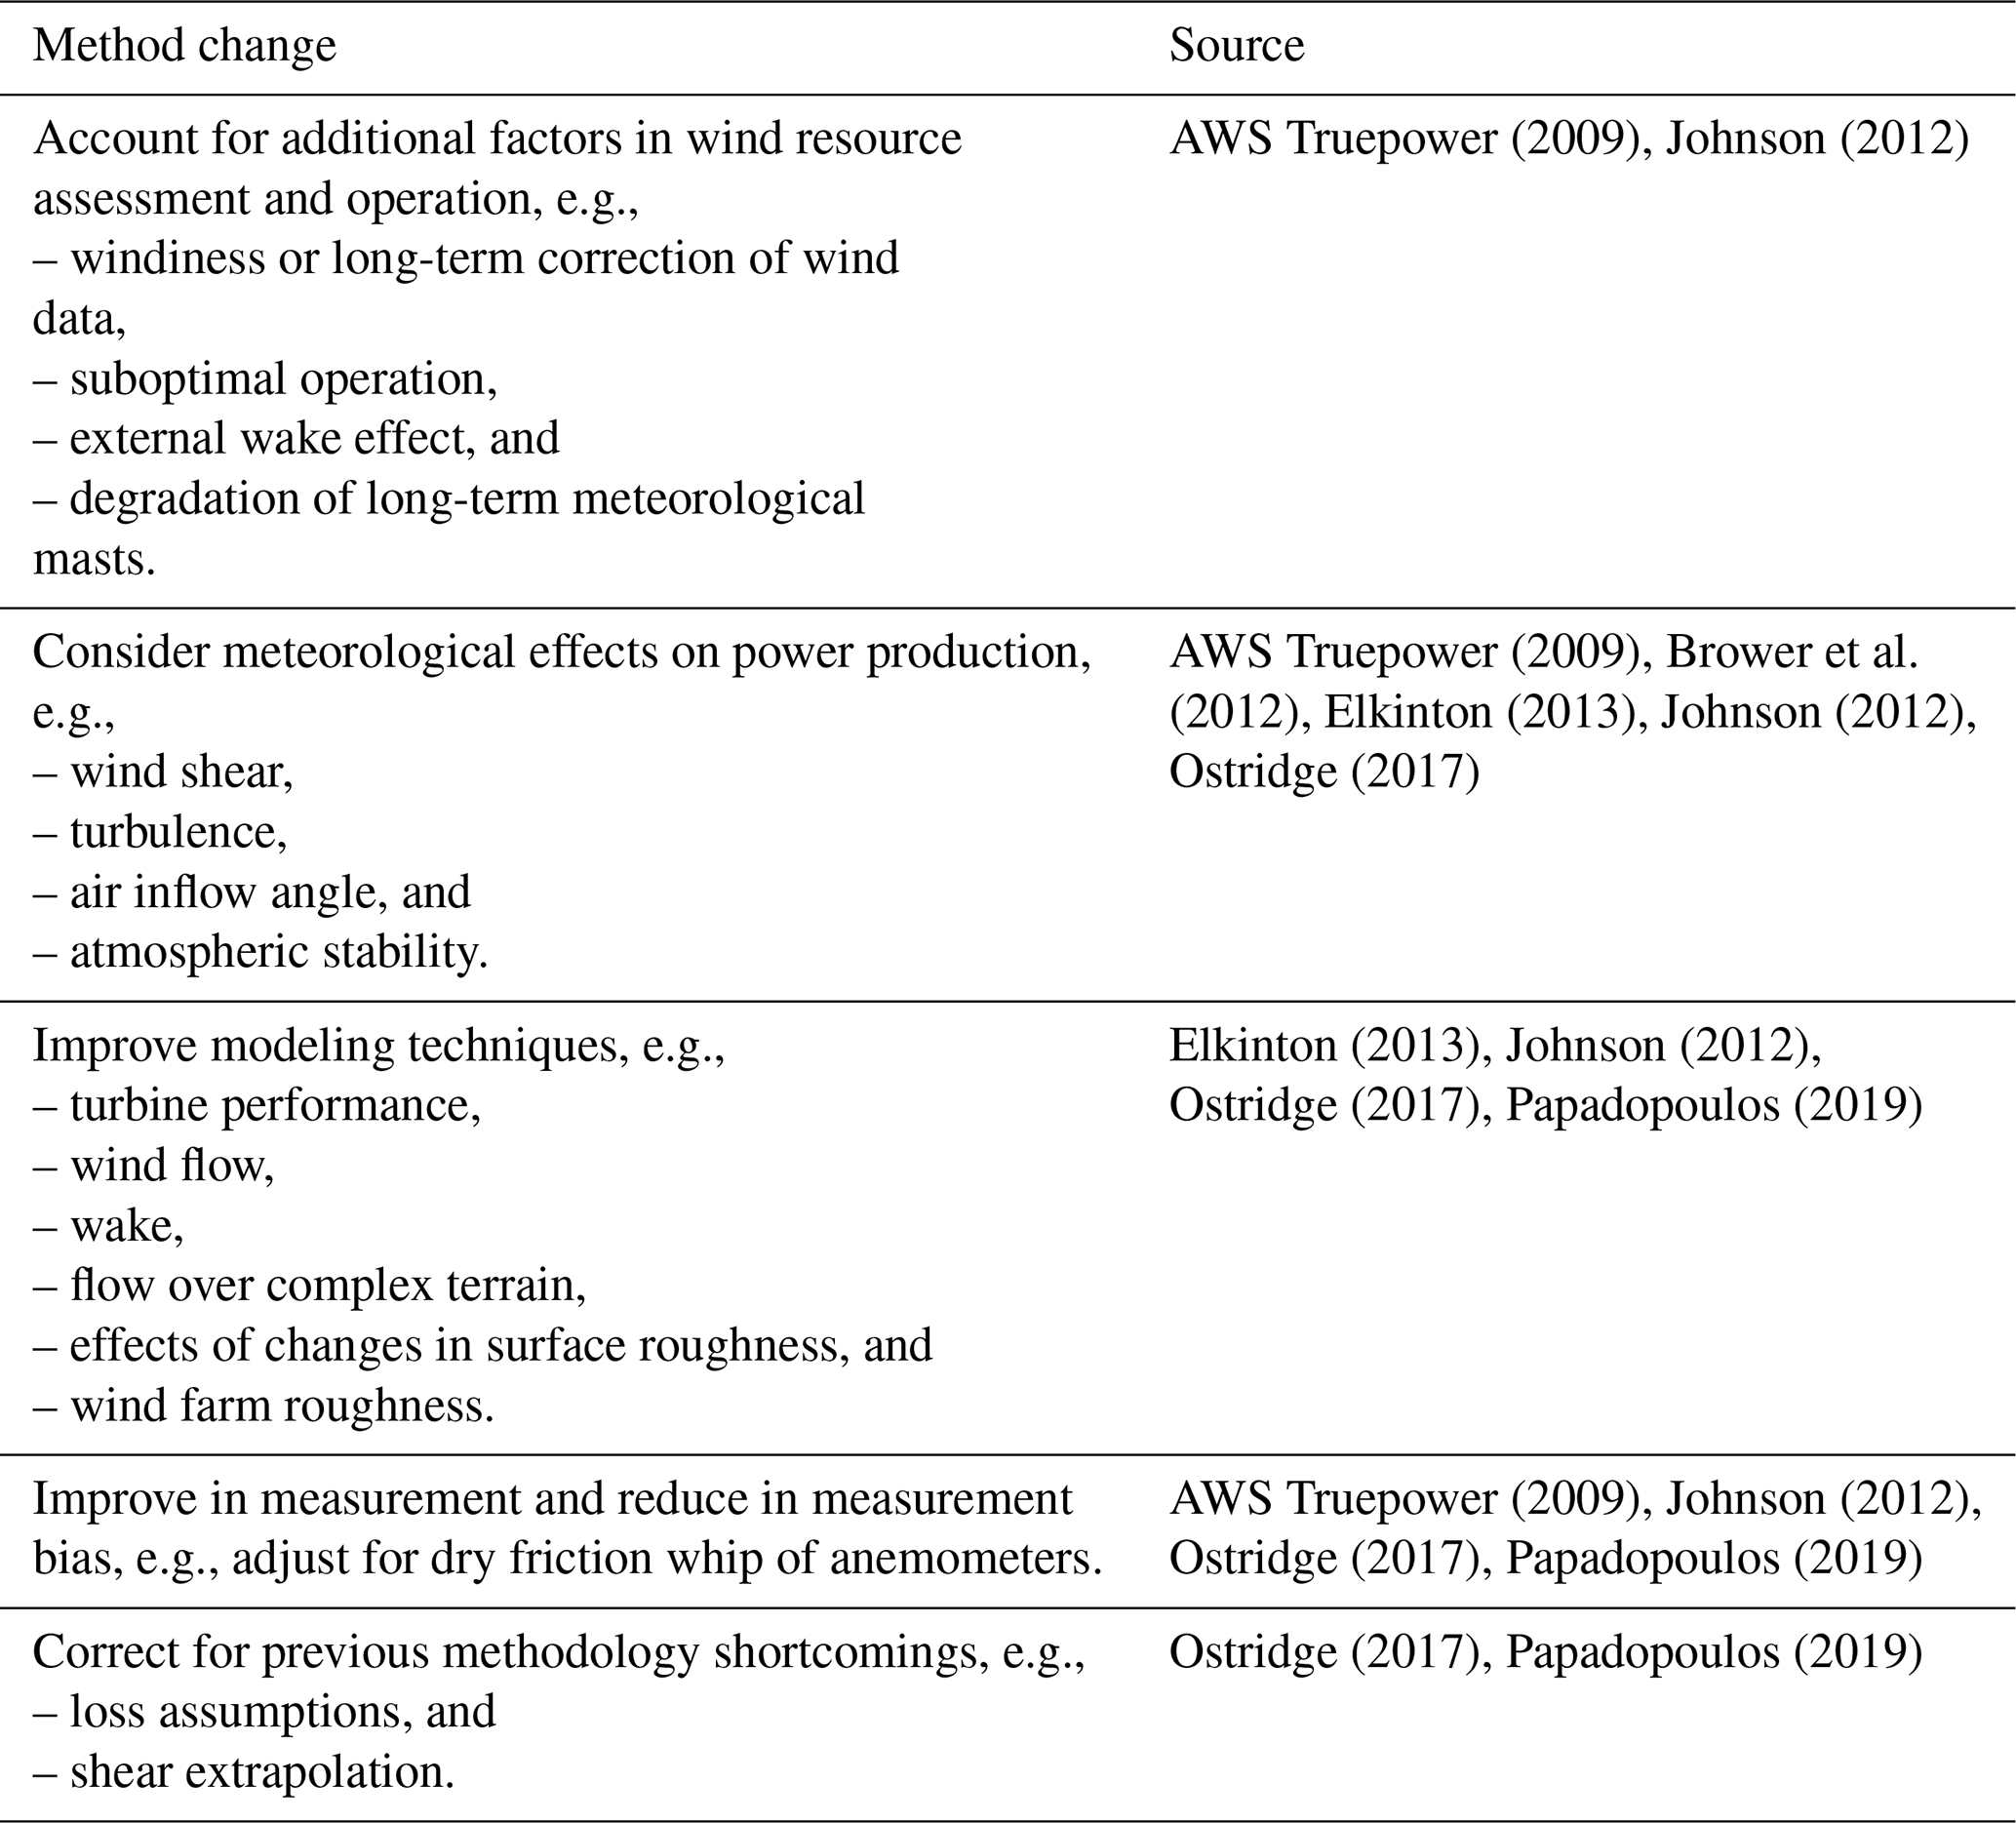
3.2 Reasons for bias changes
To correct for the historical P50 prediction errors, some organizations publicize the research and the adjustments they have been conducting for their WRA processes. We summarize the major modifications of the WRA procedure in Table 1. Most studies demonstrate mean P50 bias improvement over time (Fig. 4), and the magnitude of such bias reduction varies. In two studies, the authors examine the impact of accounting for windiness, which is the quantification of long-term wind speed variability, in their WRA methodologies. They acknowledge the difficulty in quantifying interannual wind speed variability accurately, and their P50 prediction errors worsen after embedding this uncertainty in their WRA process (vertical dashed lines in Fig. 4).
Table 1Categories of method adjustments to improve the wind resource assessment process and the respective data sources.
The prediction and observation of production losses are tightly related to the P50 prediction accuracy; hence, we contrast the estimated and measured losses in various categories and benchmark their magnitude (Figs. 5–7). The total energy loss is calculated from the difference between the gross energy estimate and the product of gross energy prediction and various categorical production efficiencies, where each efficiency is 1 minus a categorical energy loss (Brower, 2012). Of the total categorical losses, we record the largest number of data points from availability loss, and wake loss displays the largest variability among studies (Fig. 5). For availability loss, the total observed loss varies more than the total estimated loss and displays a larger range (Fig. 6a). The turbine availability loss appears to be larger than the balance of plant and grid availability losses; however, more data points are needed to validate those estimates (Fig. 6a). Except for one outlier, the turbine performance losses, in both predictions and observations, are about or under 5 % (Fig. 6b). Large ranges of environment losses exist, particularly for icing and degradation losses, which can drastically decrease AEP (Fig. 6c). Note that some of the icing losses indicated in the literature represent the fractional energy-generation loss from production stoppages over atypically long periods in wintertime, rather than a typical energy loss percentage for a calendar year. Electrical loss has been assured as a routine energy reduction with high certainty and relatively low magnitude (Fig. 6d). Of all the categories, wind turbine wake results in a substantial portion of energy loss, and its estimations demonstrate large variations (Fig. 6e). The magnitude of estimated wake loss is larger than that of the predicted nonwake loss, which consists of other categorical losses (Fig. 6e). The observed total curtailment loss exhibits lower variability, yet with larger magnitude than its estimation (Fig. 6f). From the eight studies that report total loss, the predictions range from 9.5 % to 22.5 % (Fig. 6g). We do not encounter any operational strategies loss under curtailment loss in the literature, and thus the subcategories in Fig. 6 do not cover every subcategory in Table A1.
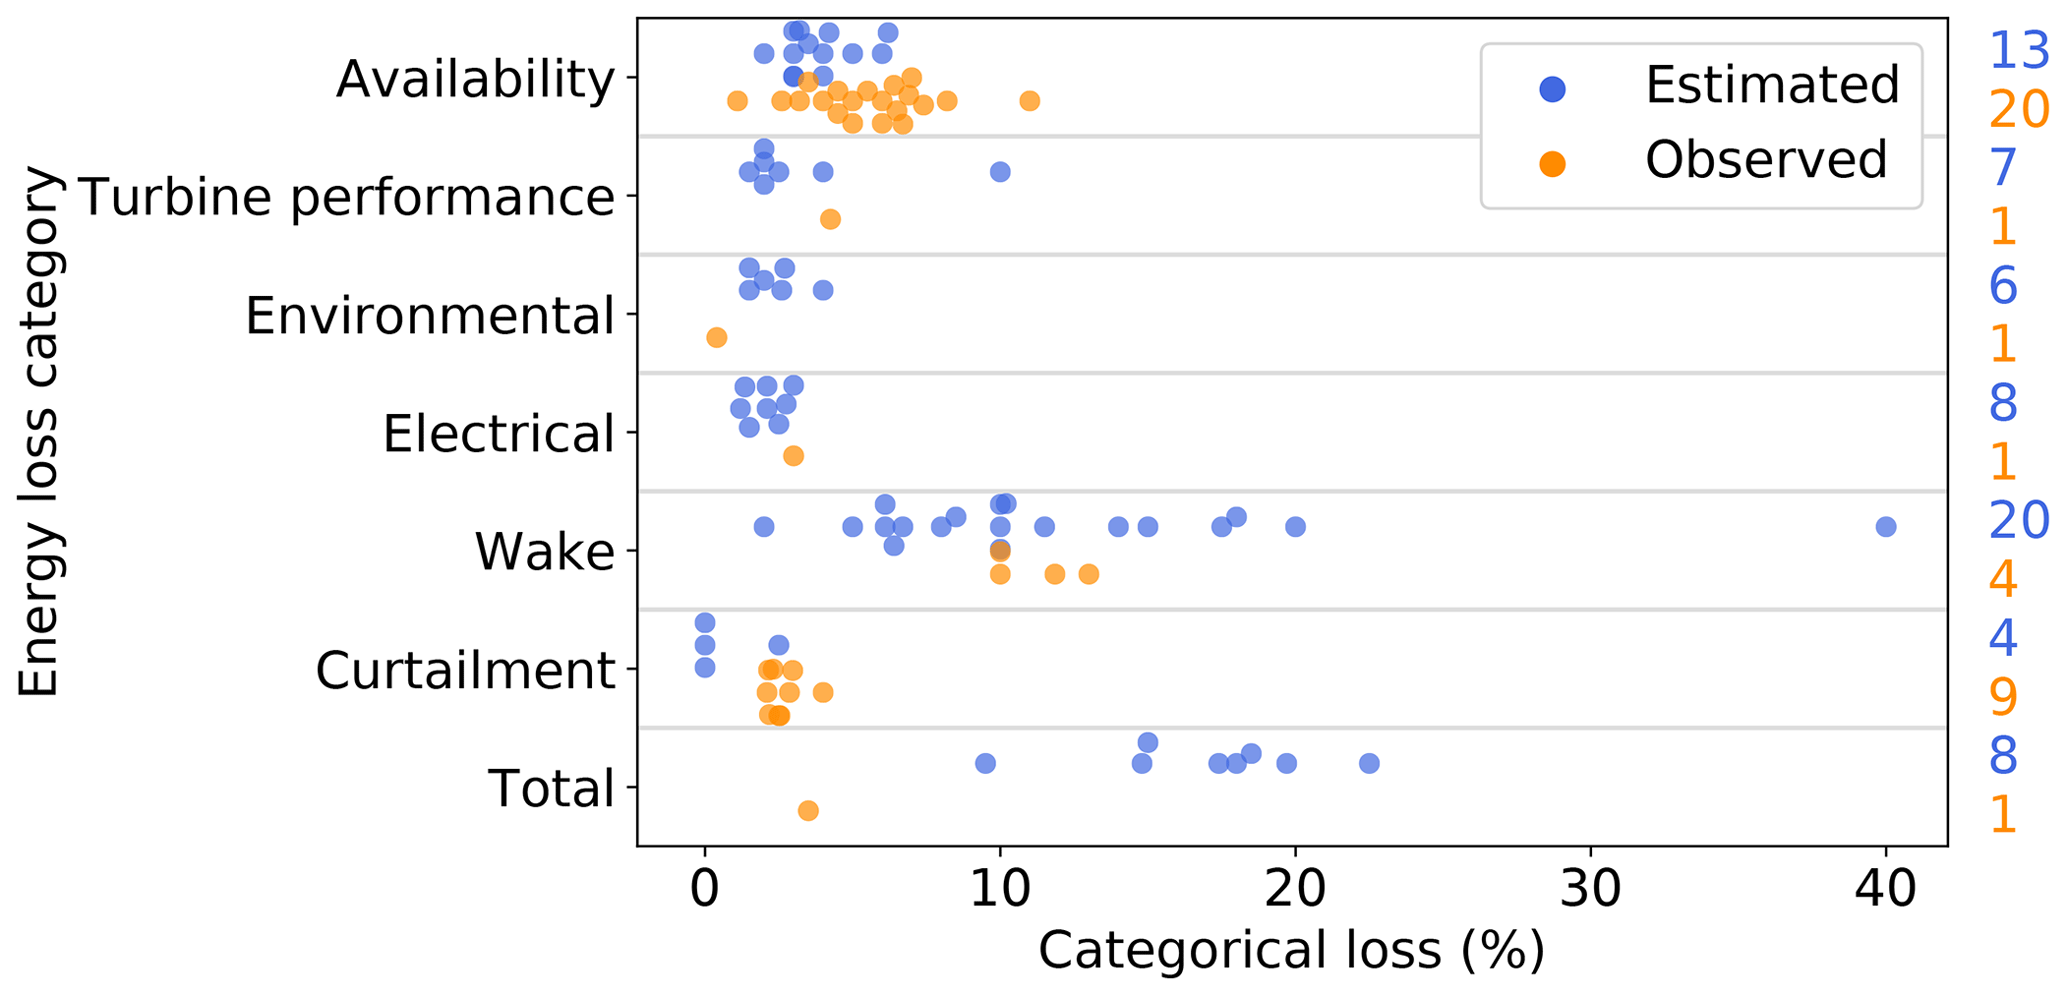
Figure 5Ranges of total energy-production losses in different categories, according to the proposed framework of the IEC 61400-15 standard. Each blue dot and orange dot, respectively, represents the mean estimated loss and mean observed loss documented in each independent reference. The losses are expressed as percentage of AEP. The column of numbers on the right denotes the sample size in each category, where the estimated ones are in blue and the observed ones are in orange. For clarity, the horizontal grey lines separate data from each category. Table B3 catalogs the categorical losses plotted herein.
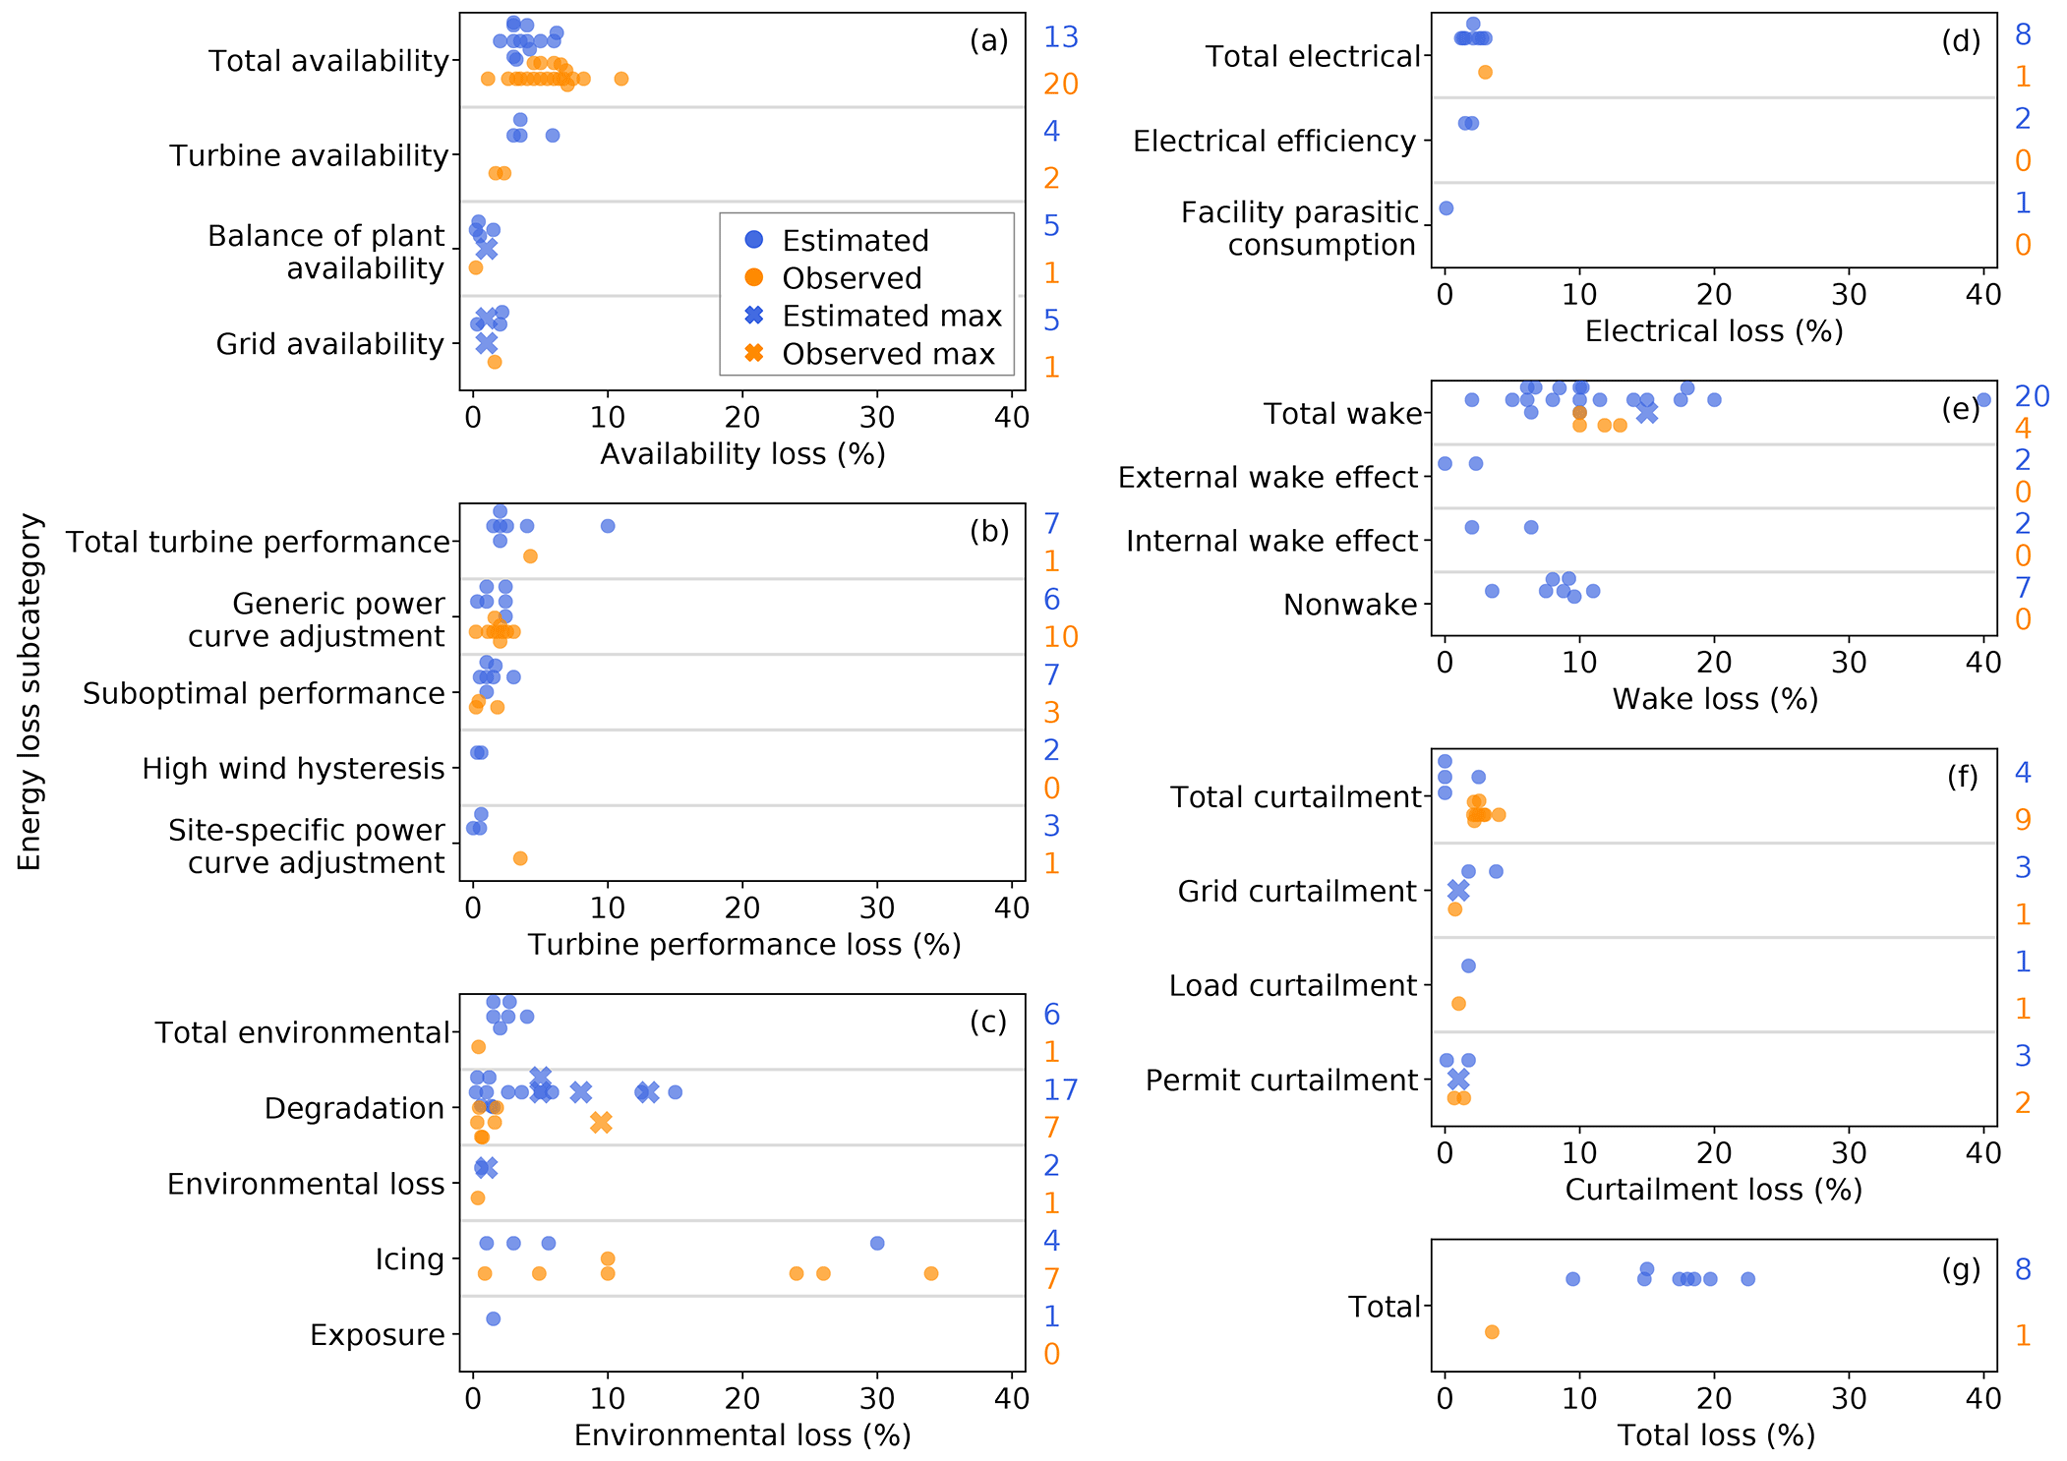
Figure 6Ranges of energy-production losses in different categories and subcategories, according to the proposed framework of the IEC 61400-15 standard, except for nonwake in panel (e), which is an extra subcategory summarizing other nonwake categories. Each blue dot and orange dot, respectively, represents the mean estimated loss and mean observed loss documented in each independent study. The blue and orange crosses, respectively, indicate the maximum of estimated loss and the maximum of observed loss reported, where the minima are not reported, and thus the averages cannot be calculated. The losses are expressed as percentage of AEP. The column of numbers on the right denotes the estimated and observed sample sizes in blue and orange, respectively, in each subcategory, and such sample size represents all the instances in that subcategory that recorded either the mean or the maximum loss values. For clarity, the grey horizontal lines separate data from each subcategory. Table B3 catalogs the categorical and subcategorical losses plotted herein.
Losses that inhibit wind farm operations can cause considerable monetary impact. For example, blade degradation can result in a 6.8 % of AEP loss for a single turbine in the IEC Class II wind regime, where the maximum annual average wind speed is 8.5 m s−1; this translates to USD 43 000 per year (Wilcox et al., 2017). Generally, the typical turbine failure rate is about 6 %, where 1 % reduction in turbine failure rate can lead to around USD 2 billion of global savings in operation and maintenance (Faubel, 2019). In practice, the savings may exclude the cost of preventative measures for turbine failure, such as hydraulic oil changes and turbine inspections.
We categorize two types of energy-production losses additional to the proposed IEC framework, namely the first few years of operation and blockage effect (Fig. 7). For the former loss, a newly constructed wind farm typically does not produce to its full capacity for the first few months or even for the first 2 years. The loss from the first few years of operation captures this time-specific and availability-related production loss. Regarding the later loss, the blockage effect describes the wind speed slowdown upwind of a wind farm (Bleeg et al., 2018). Wind farm blockage is not a new topic (mentioned in Johnson et al., 2008) and has been heavily discussed in recent years (Bleeg et al., 2018; Lee, 2019; Papadopoulos, 2019; Robinson, 2019; Spalding, 2019). Compared to some of the losses in Fig. 6, the loss magnitude of first few years of operation and blockage is relatively small, where it contributes to less than 5 % of AEP reduction per year (Fig. 7).
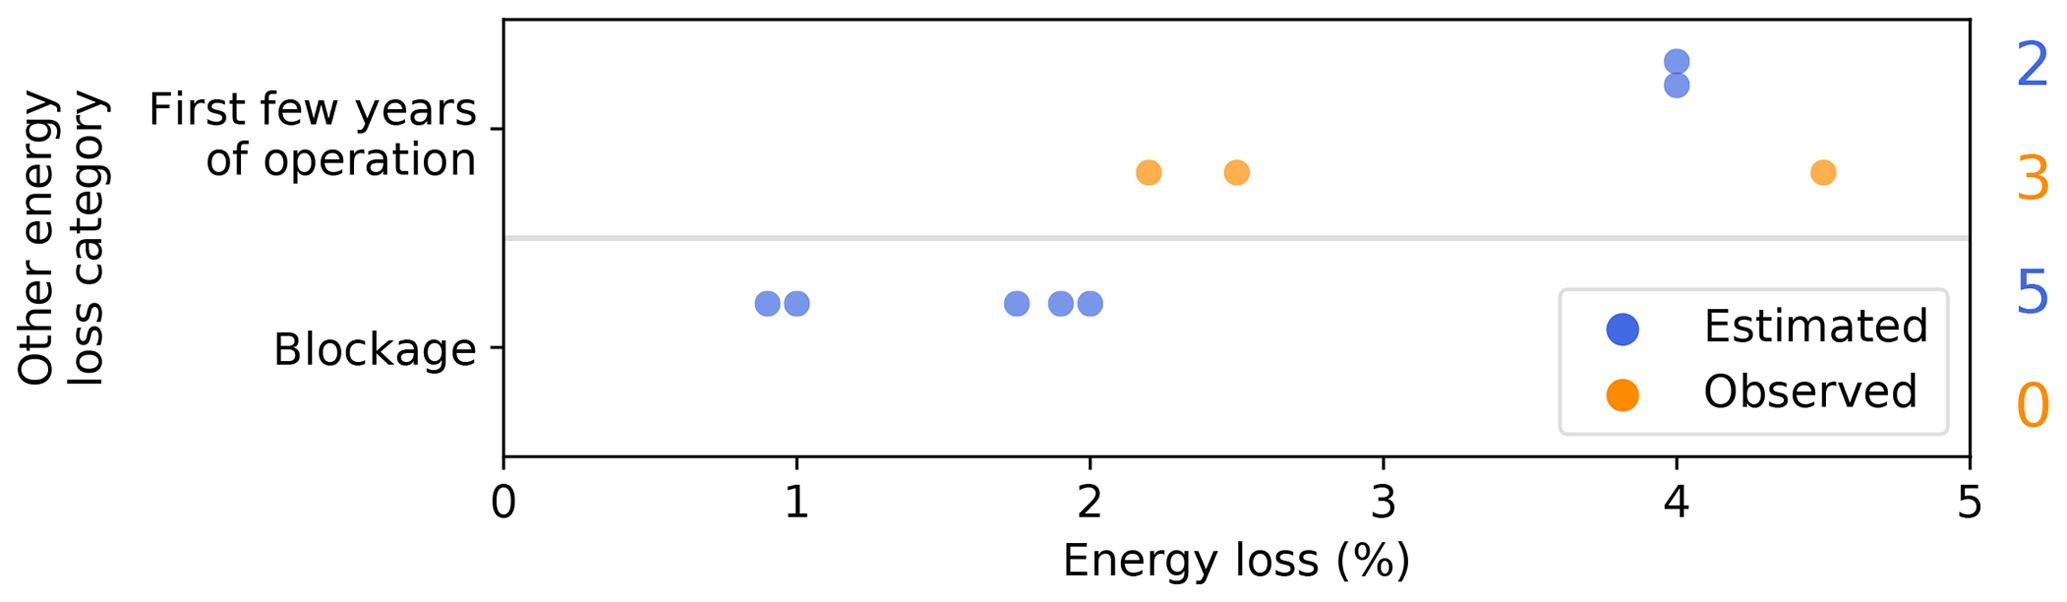
Figure 7As in Fig. 6 but for the loss categories outside of the proposed IEC framework, as listed in Table B4.
For trend analysis, we linearly regress every subcategorical energy loss (Fig. 6 and Table B3) on time, and we only find two loss subcategories demonstrate notable and statistically confident trends (Fig. 8). The measured curtailment loss and the observed generic power curve adjustment loss steadily decrease over time, and the reductions have reasonable R2 (Fig. 8). No other reported losses with a reasonable number of data samples display remarkable trends (Fig. C1).

Figure 8Trend in observed energy-production loss: (a) total curtailment loss and (b) generic power curve adjustment loss. The annotations correspond to those in Fig. 3, where the orange solid line represents simple linear regression, the light orange cone illustrates the 95 % confidence interval, R2 is the coefficient of determination, and n is sample size.
Past research further documents the uncertainties of AEP losses. Except for an outlier of measuring 80 % uncertainty in wake loss, the magnitude of the uncertainty of wake loss is analogous to that of nonwake loss (Fig. 9). The industry also tends to reveal the uncertainty of wake loss than nonwake loss according to the larger number of data sources (Fig. 9). One data source reported that depending on the location, the operational variation from month to month can alter AEP losses for more than 10 % on average (Fig. 9). Note that the results in Fig. 9 represent the uncertainty of the respective production loss percentages in Fig. 6 and Table B3, rather than the AEP uncertainty.
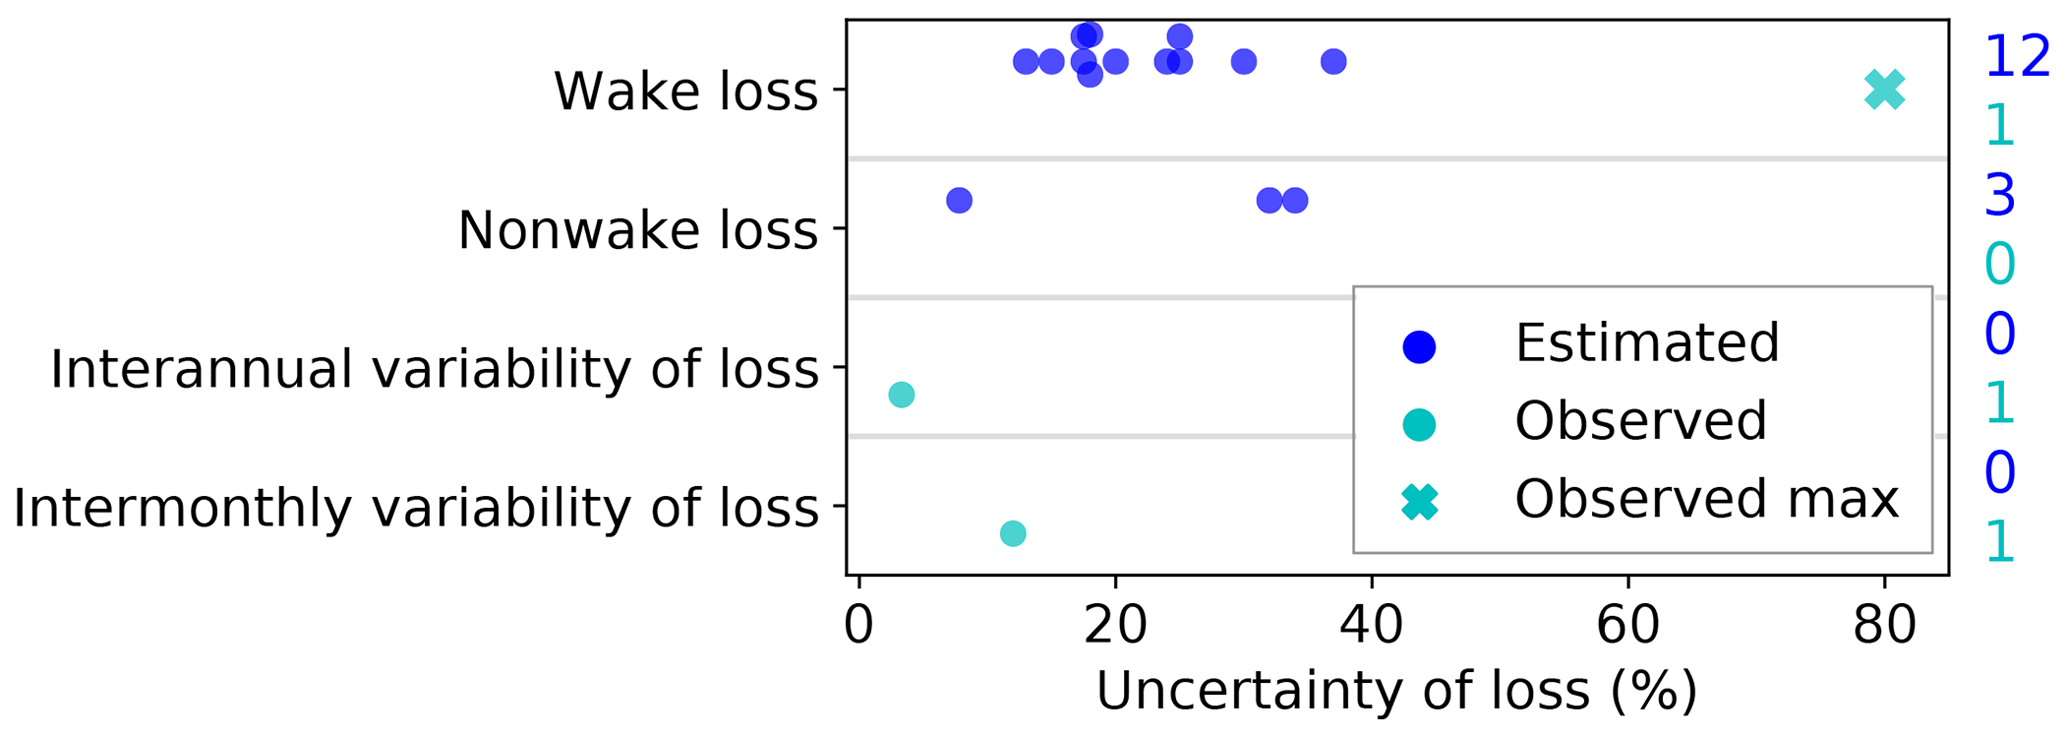
Figure 9Uncertainty of energy-production losses, where the magnitude corresponds to the AEP loss percentages listed in Fig. 6 and Table B3. Each dark blue dot, turquoise dot, and turquoise cross represents the estimated uncertainty, the observed uncertainty, and the maximum observed uncertainty of losses, respectively. The uncertainties are expressed as percentages of uncertainty in terms of the energy-production loss percentage. The column of numbers on the right denotes the estimated and observed sample sizes in dark blue and turquoise, respectively, in each row, and such sample size represents all the instances in that row that reported either the mean or the maximum values. For clarity, the grey horizontal lines separate data from each uncertainty. Table B5 records the uncertainties displayed herein.
The individual energy-production uncertainties directly influence the uncertainty of P50 prediction. Total uncertainty is the root sum square of the categorical uncertainties; the assumption of correlation between categories can reduce the overall uncertainty, and this is a typically consultant- and method-specific assumption (Brower, 2012). Except for a few outliers, the magnitude of the individual energy-production uncertainties across categories and subcategories is about or below 10 % (Fig. 10). The energy uncertainties from wind measurements range below 5 %, after omitting two extreme data points (Fig. 10a). The estimated long-term period uncertainty varies the most in historical wind resource (Fig. 10b), which indicates the representativeness of historical reference data (Table A2). Horizontal extrapolation generally yields higher energy-production uncertainty than vertical extrapolation (Fig. 10c and d). For plant performance, each subcategorical uncertainty corresponds to the respective AEP loss (Fig. 6 and Table A1). The range of the predicted energy uncertainty caused by wake effect is about 6 % (Fig. 10e). The estimated uncertainty of turbine performance loss and total project evaluation period match with those observed (Fig. 10e and f). Overall, the average estimated total uncertainty varies by about 10 %, whereas the observed total uncertainty appears to record a narrower bound, after excluding an outlier (Fig. 10g).
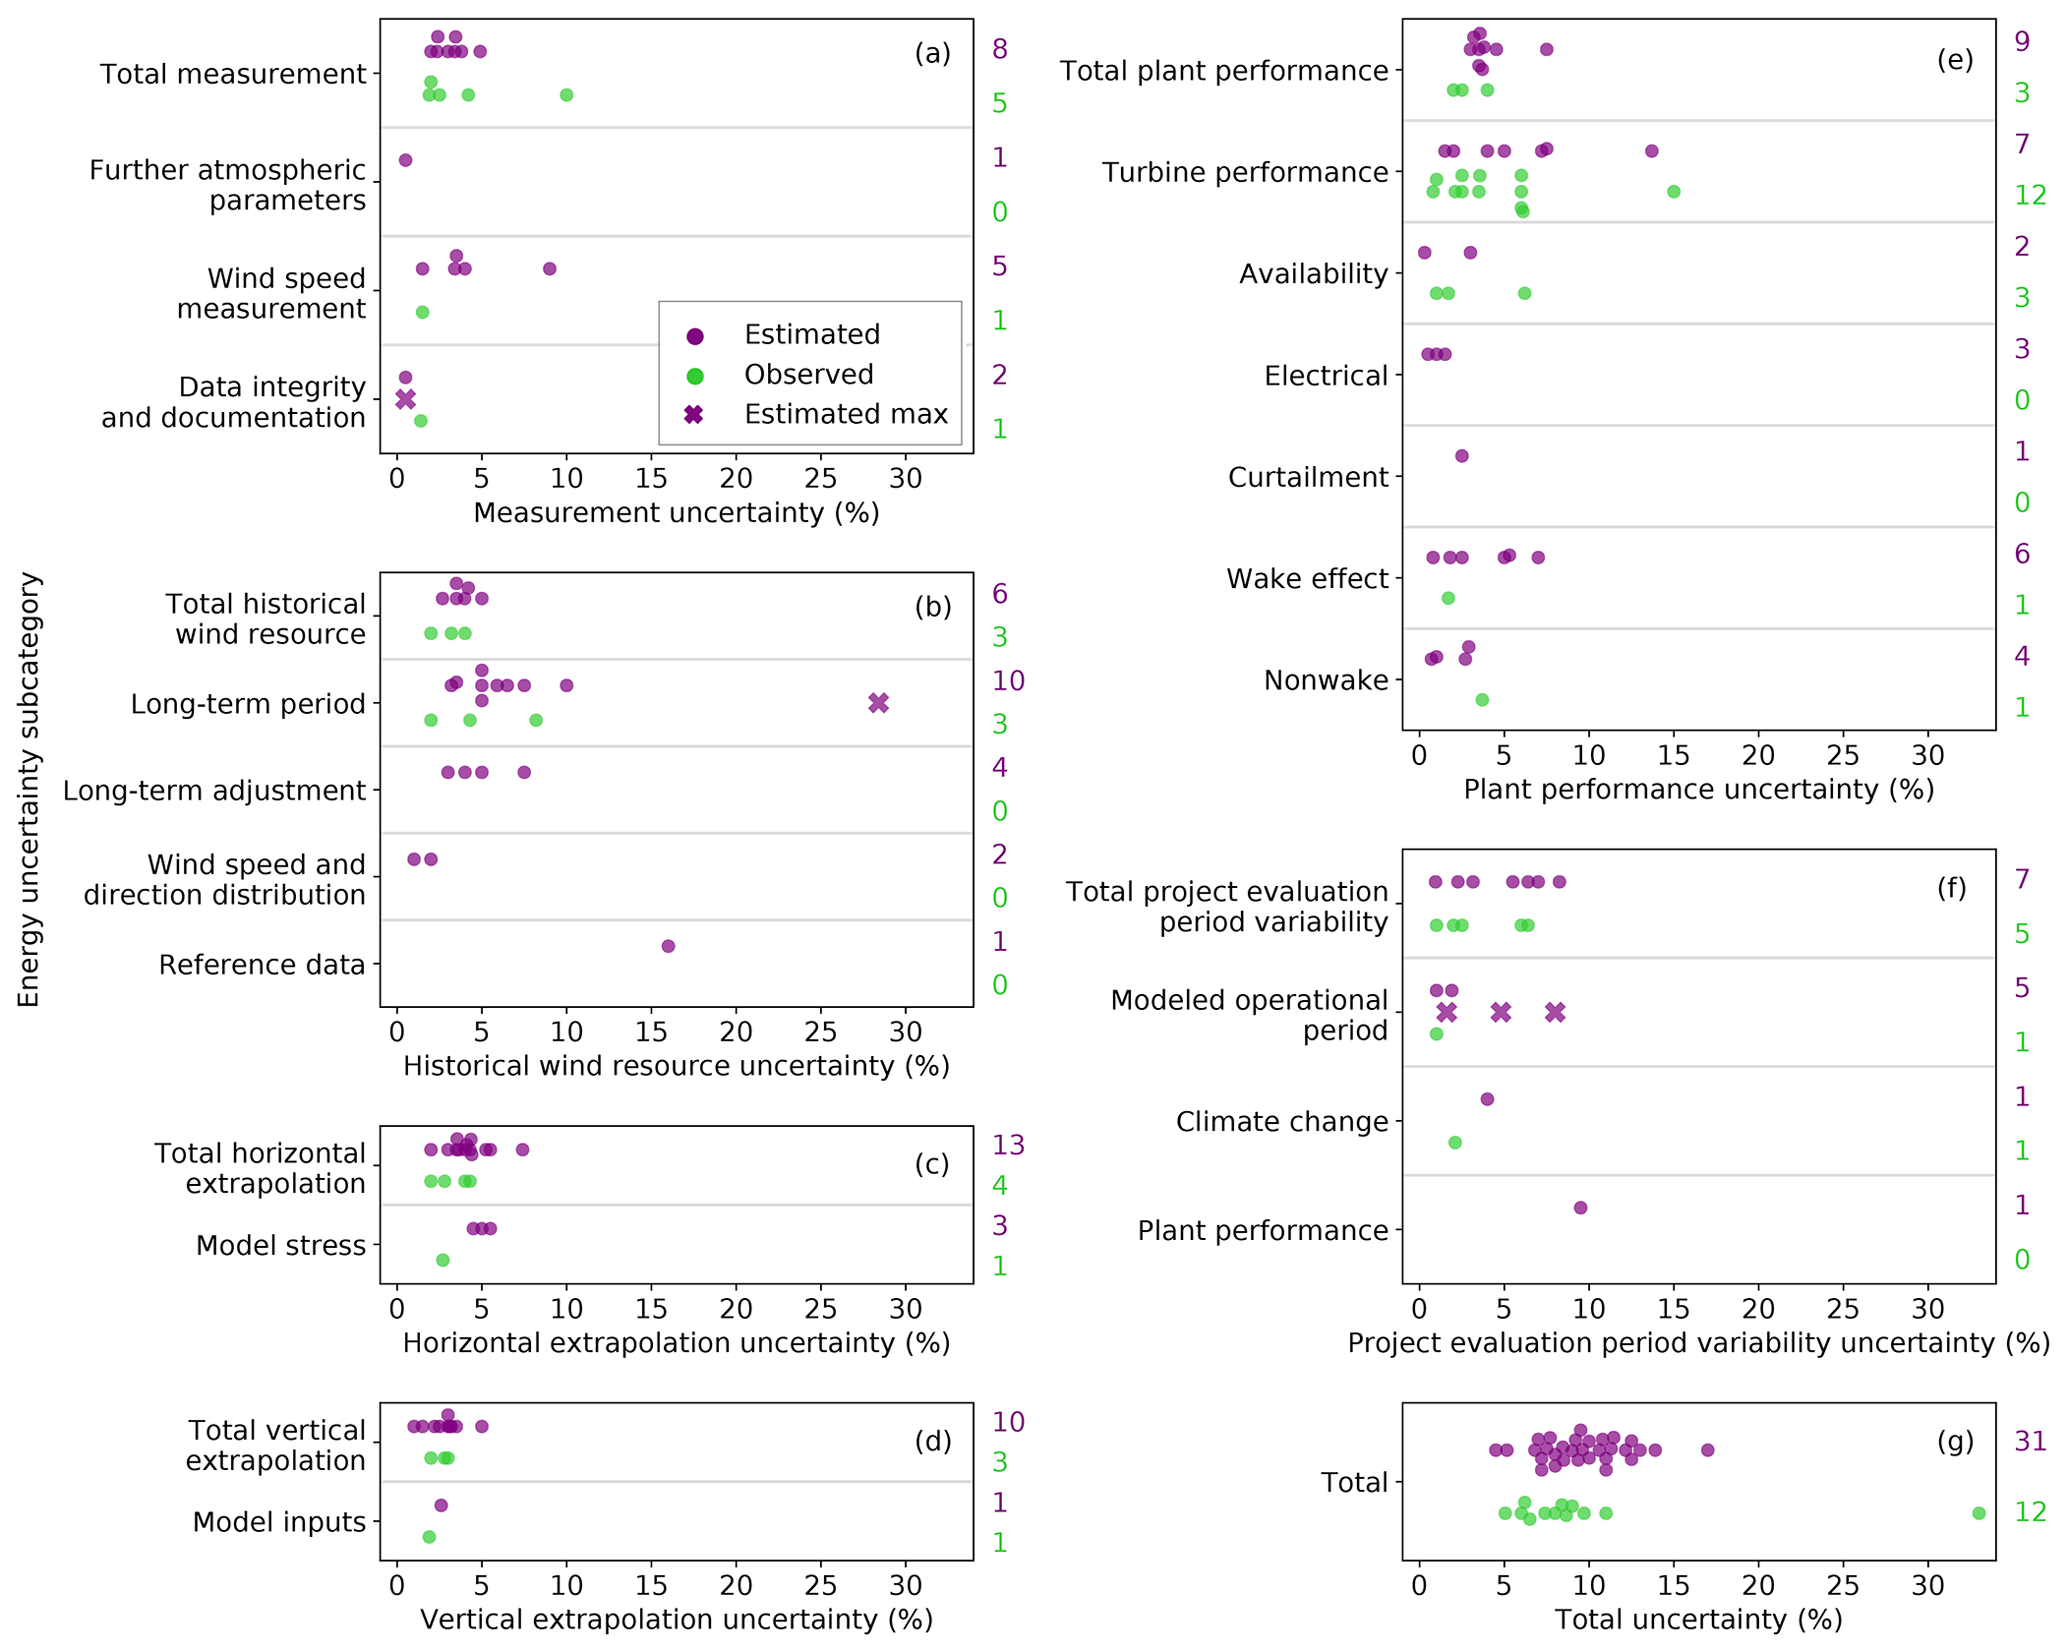
Figure 10Ranges of energy-production uncertainties in different categories and subcategories, according to the proposed framework of the IEC 61400-15 standard. The annotations correspond to those in Fig. 6, where each purple dot, green dot, and purple cross represents the mean estimated uncertainty, the mean observed uncertainty, and the maximum of estimated uncertainty from each independent reference, respectively. The uncertainties are expressed as percentages in AEP. The column of numbers on the right denotes the estimated and observed sample sizes in purple and green, respectively, in each subcategory, and such sample size represents all the instances in that subcategory that reported either the mean or the maximum uncertainty values. For clarity, the grey horizontal lines separate data from each subcategory. Table B6 numerates the production uncertainties.
In the literature, we cannot identify all the uncertainty types listed in the proposed IEC framework; hence, the following AEP uncertainty subcategories in Table A2 are omitted in Fig. 10: wind direction measurement in measurement; on-site data synthesis in historical wind resource; model inputs and model appropriateness in horizontal extrapolation; model components and model stress in vertical extrapolation; and environmental loss in plant performance.
Similar to energy losses, other types of AEP uncertainties not in the proposed IEC framework emerge. The magnitude of the uncertainties in Fig. 11 is comparable to the uncertainties in Fig. 10. The power curve measurement uncertainty in Fig. 11, specifically mentioned in the data sources, could be interpreted as the uncertainty from the turbine performance loss.
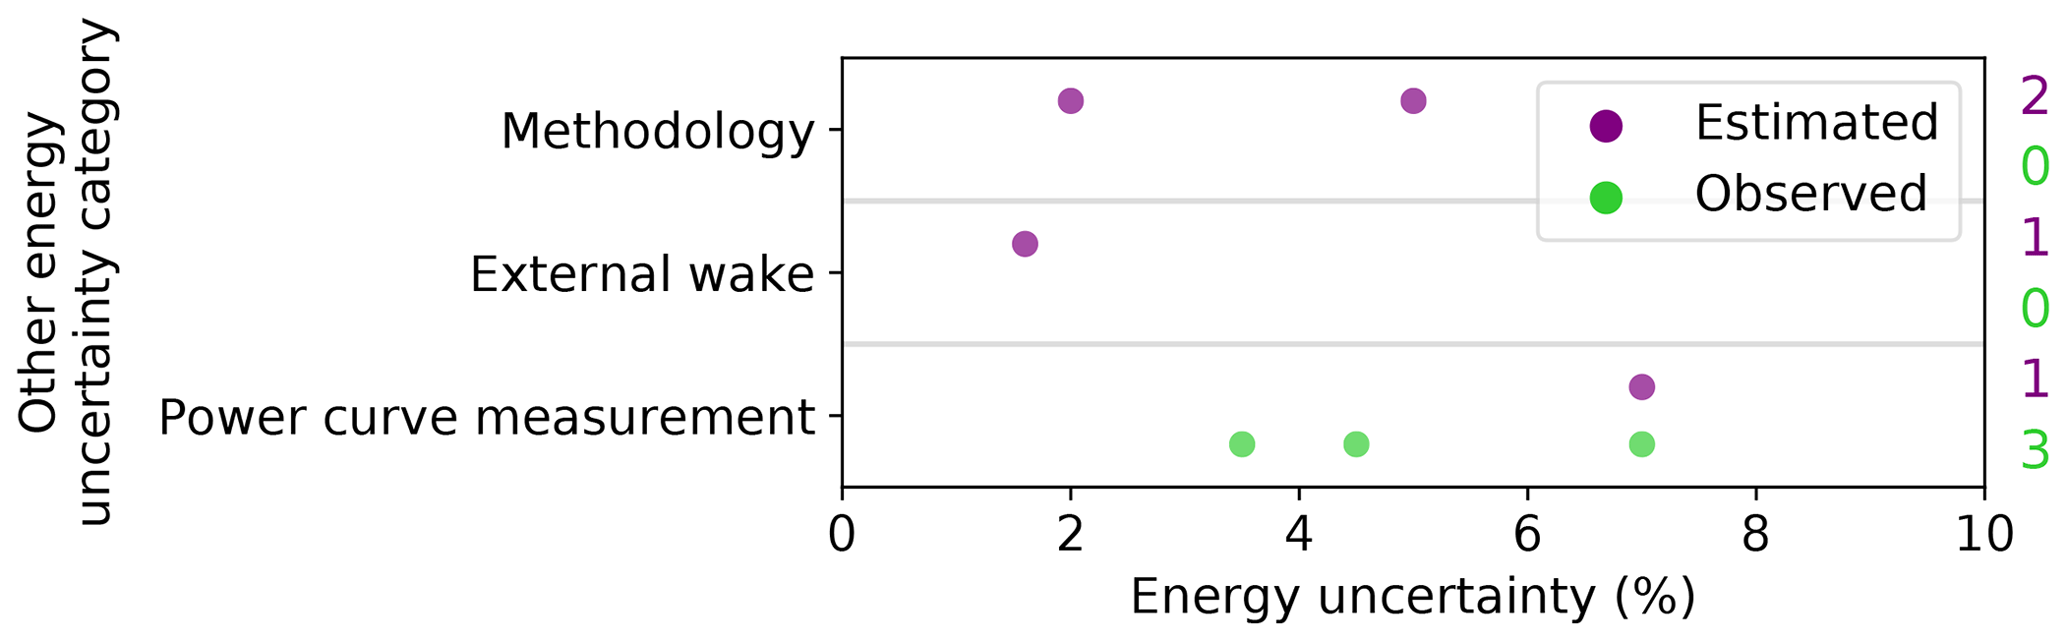
Figure 11As in Fig. 10 but for the uncertainty categories outside of the proposed IEC framework, as listed in Table B7.
The energy-production uncertainty from air density and vertical extrapolation depends on the geography of the site. For instance, the elevation differences between sea level and the site altitude, as well as the elevation differences between the mast height and turbine hub height, affect the AEP uncertainty (Nielsen et al., 2010). For simple terrain, the vertical extrapolation uncertainty can be estimated to increase linearly with elevation (Nielsen et al., 2010). A common industry practice is to assign 1 % of energy uncertainty for each 10 m of vertical extrapolation, which could overestimate the uncertainty, except for forested locations (Langreder, 2017).
Energy production of a wind turbine is a function of wind speed to its third power. Considering wind speed, either measured, derived, or simulated, is a critical input to an energy estimation model, the uncertainty of wind speed plays an important role in the WRA process. We present various groups of wind speed uncertainties in the literature herein (Fig. 12). The bulk of the wind speed uncertainties are roughly 10 % or less of the wind speed. Many studies report estimated uncertainty from wind speed measurement; however, its magnitude and discrepancy among the sources are not as large as those from wind speed modeling or interannual variability (Fig. 12). Notice that some of the wind speed categories coincide with the IEC-proposed framework of energy uncertainty, and others do not. The absence of standardized classification of wind speed uncertainties increases the ambiguity in the findings from the literature and poses challenges to the interpretation of the results in Fig. 12. We also lack sufficient samples of measured wind speed uncertainties to validate the estimates.

Figure 12Ranges of wind speed uncertainties in different categories. The annotations correspond to those in Fig. 10, where each dark purple dot, dark green dot, and dark purple cross represents the mean estimated wind speed uncertainty, the mean observed wind speed uncertainty, and the maximum of estimated wind speed uncertainty from each independent study, respectively. The uncertainties are expressed as percentages of wind speed. The column of numbers on the right denotes the estimated and observed sample sizes in dark purple and dark green, respectively, in each category, and such sample size represents all the instances in that category that reported either the mean or the maximum uncertainty values. For clarity, the grey horizontal lines separate data from each category. Table B8 documents the wind speed uncertainties displayed.
Wind speed uncertainty greatly impacts AEP uncertainty, and the methods of translating wind speed uncertainty into AEP uncertainty also differ between organizations. For example, 1 % increase of wind speed uncertainty can lead to either a 1.6 % (AWS Truepower, 2014) or 1.8 % increase in energy-production uncertainty (Holtslag, 2013; Johnson et al., 2008; White, 2008a, b). Local wind regimes can also affect this ratio. For low wind locations, AEP uncertainty can be 3 times the wind speed uncertainty, while such a ratio drops to 1.5 at high wind sites (Nielsen et al., 2010).
Decreasing wind speed uncertainty benefits the wind energy industry. Reduction in wind speed measurement of 0.28 % could reduce project-production uncertainty by about 0.15 % (Medley and Smith, 2019). Using a computational fluid dynamics model to simulate airflow around meteorological masts can reduce wind speed measurement uncertainty from 2.68 % to 2.23 %, which translates to GBP 1.2 million of equity savings for a 1 GW offshore wind farm in the United Kingdom (Crease, 2019).
Although the industry is reducing the mean P50 overprediction bias, the remarkable uncertainties inherent in the WRA process overshadow such achievement. Different organizations have been improving their techniques over time to eliminate the P50 bias (Table 1), and as a whole we celebrate the technological advancements; nevertheless, challenges still exist for validation and reduction of the AEP losses and uncertainties. Even though the average P50 prediction bias is reducing and approaches zero, the associated mean P50 uncertainty remains at over 6 %, even for the studies reported after 2016 (Fig. 3b). For a validation study that involves a collection of wind farms, such an uncertainty bound implies that sizable P50 predication errors for particular wind projects can emerge. In other words, statistically, the AEP prediction is becoming more accurate and yet is imprecise. Moreover, from an industry-wide perspective that aggregates different analyses, the variability on the mean P50 bias estimates is notable, which obscures the overall bias-reducing trend (R2 below 0.5 in Fig. 3). Specifically, the magnitude of the 95 % prediction interval at over 10 % average P50 estimation error (Fig. 3b) suggests a considerable range of possible mean biases in future validation studies. Additionally, the uncertainties are still substantial in specific AEP losses (Fig. 9), AEP itself (Figs. 10 and 11), and wind speed (Fig. 12). Therefore, the quantification, validation, and reduction of uncertainties require the attention of the industry collectively.
To reduce the overall AEP uncertainty, the industry should continue to assess the energy impacts of plant performance losses, especially those from wake effect and environmental events. On one hand, wake effect, as part of a grand challenge in wind energy meteorology (Veers et al., 2019), has been estimated as one of the largest energy losses (Fig. 6e). The AEP loss caused by wake effect also varies, estimated between 15 % and 40 % (Fig. 9), and the unpredictability of wakes contributes to the AEP uncertainty on plant performance (Fig. 10e) and the wind speed uncertainty (Fig. 12). Although the industry has been simulating and measuring energy loss caused by wake effect, its site-specific impact on AEP for the whole wind farm as well as its time-varying production impact on downwind turbines remains largely uncertain. From a macro point of view, compared to internal wake effect, external wake effect from neighboring wind farms is a bigger known unknown because of the lack of data and research. On the other hand, environmental losses display broad range of values, particularly from icing events and turbine degradation (Fig. 6c). In general, the icing problem halts energy production in the short run, and blade degradation undermines turbine performance in the long run. Diagnosing and mitigating such substantial environmental losses would reduce both loss and uncertainty on AEP. Overall, the prediction and prevention of environmental events are critical, and the production downtime during high electricity demand can lead to consequential financial losses.
Additionally, the industry recognizes the role of remote-sensing instruments in reducing the uncertainty of energy production and wind speed from extrapolation, such as profiling lidars, scanning lidars, and airborne drones (Faghani et al., 2008; Holtslag, 2013; Peyre, 2019; Rogers, 2010). The latter can also be used to inspect turbine blades (Shihavuddin et al., 2019) to reduce unexpected blade degradation loss over time. Industry-wide collaborations such as the International Energy Agency Wind Task 32 and the Consortium For Advancement of Remote Sensing, have been promoting remote-sensing implementation in WRA.
Leaders in the field have been introducing contemporary perspectives and innovative techniques to improve the WRA process, including time-varying and correlating losses and uncertainties. Instead of treating energy loss and uncertainty as a static property, innovators have studied time-varying AEP losses and uncertainties (Brower et al., 2012), especially when wind plants produce less energy with greater uncertainty in later operational years (Istchenko, 2015). Furthermore, different types of energy-production losses or uncertainties interact and correlate with each other, and dependent data sources can emerge in the WRA process. The resultant compound effect from two correlating sources of uncertainty can change the total uncertainty derived using a linear (Brower, 2011) or root-sum-square approach (Istchenko, 2015). For example, an icing event can block site access and decrease turbine availability and even lead to longer-term maintenance problems (Istchenko, 2015).
More observations and publicly available data are necessary to validate the estimates listed in this article. In this article, the ratios between the measured and predicted values are 1 to 1.9, 2.3, and 7.3, for energy loss, energy uncertainty, and wind speed uncertainty, respectively. The small number of references on measured uncertainties indicate that we need more evidence to further evaluate our uncertainty estimates. Besides, challenges exist in interpreting and harmonizing results from disparate reporting of energy-production losses and uncertainties. Documentation aligned with ubiquitous reference frameworks will greatly strengthen the accuracy and repeatability of future literature reviews. Therefore, data and method transparency and standardization will continually improve insight into the WRA process, increase the AEP estimation accuracy, and drive future innovation.
In this study, we compile and present the ranges and the trends of predicted P50 (i.e., median annual energy production) errors, as well as the estimated and observed energy losses, energy uncertainties, and wind speed uncertainties embedded in the wind resource assessment process. We conduct this literature review using over 150 credible sources from conference presentations to peer-reviewed journal articles.
Although the mean P50 bias demonstrates a decreasing trend over time because of continuous methodology adjustments, the notable uncertainty of the mean prediction error reveals the imprecise prediction of annual energy production. The dominant effect of prediction uncertainty over the bias magnitude calls for further improvements on the prediction methodologies. To reduce the mean bias, industry experts have made method adjustments in recent years that minimize the energy-production prediction bias, such as the applications of remote-sensing devices and the modeling advancements of meteorological phenomena.
We present the wind-energy-production losses and uncertainties in this literature review according to the proposed framework by the IEC 61400-15 working group. Wake effect and environmental events undermine wind plant performance and constitute the largest loss in energy production, and validating the wake and environmental loss predictions requires more field measurements and detailed research. Moreover, the variability of observed total availability loss is larger than its estimates. Meanwhile, the decreasing trends of measured curtailment loss and observed generic power curve adjustment loss indicate the continuing industry effort to optimize wind energy production. Additionally, different categorical energy uncertainties and wind speed uncertainties demonstrate similar magnitude, with a majority of the data below 10 %. More observations are the solution to better understand and further lower these uncertainties.
In our findings, we highlight the potential future progress, including the importance of accurately predicting and validating energy-production uncertainty, the impact of wake effect, and innovative approaches in the wind resource assessment process. This work also includes a summary of the data collected and used in this analysis. As the industry evolves with improved data sharing, method transparency, and rigorous research, we will increasingly be able to maximize energy production and reduce its uncertainty for all project stakeholders.
Table A1Consensus energy-production loss framework for wind resource assessment proposed by the International Electrotechnical Commission (IEC) 61400-15 working group (Filippelli et al., 2018). Note that this table does not represent the final standards.
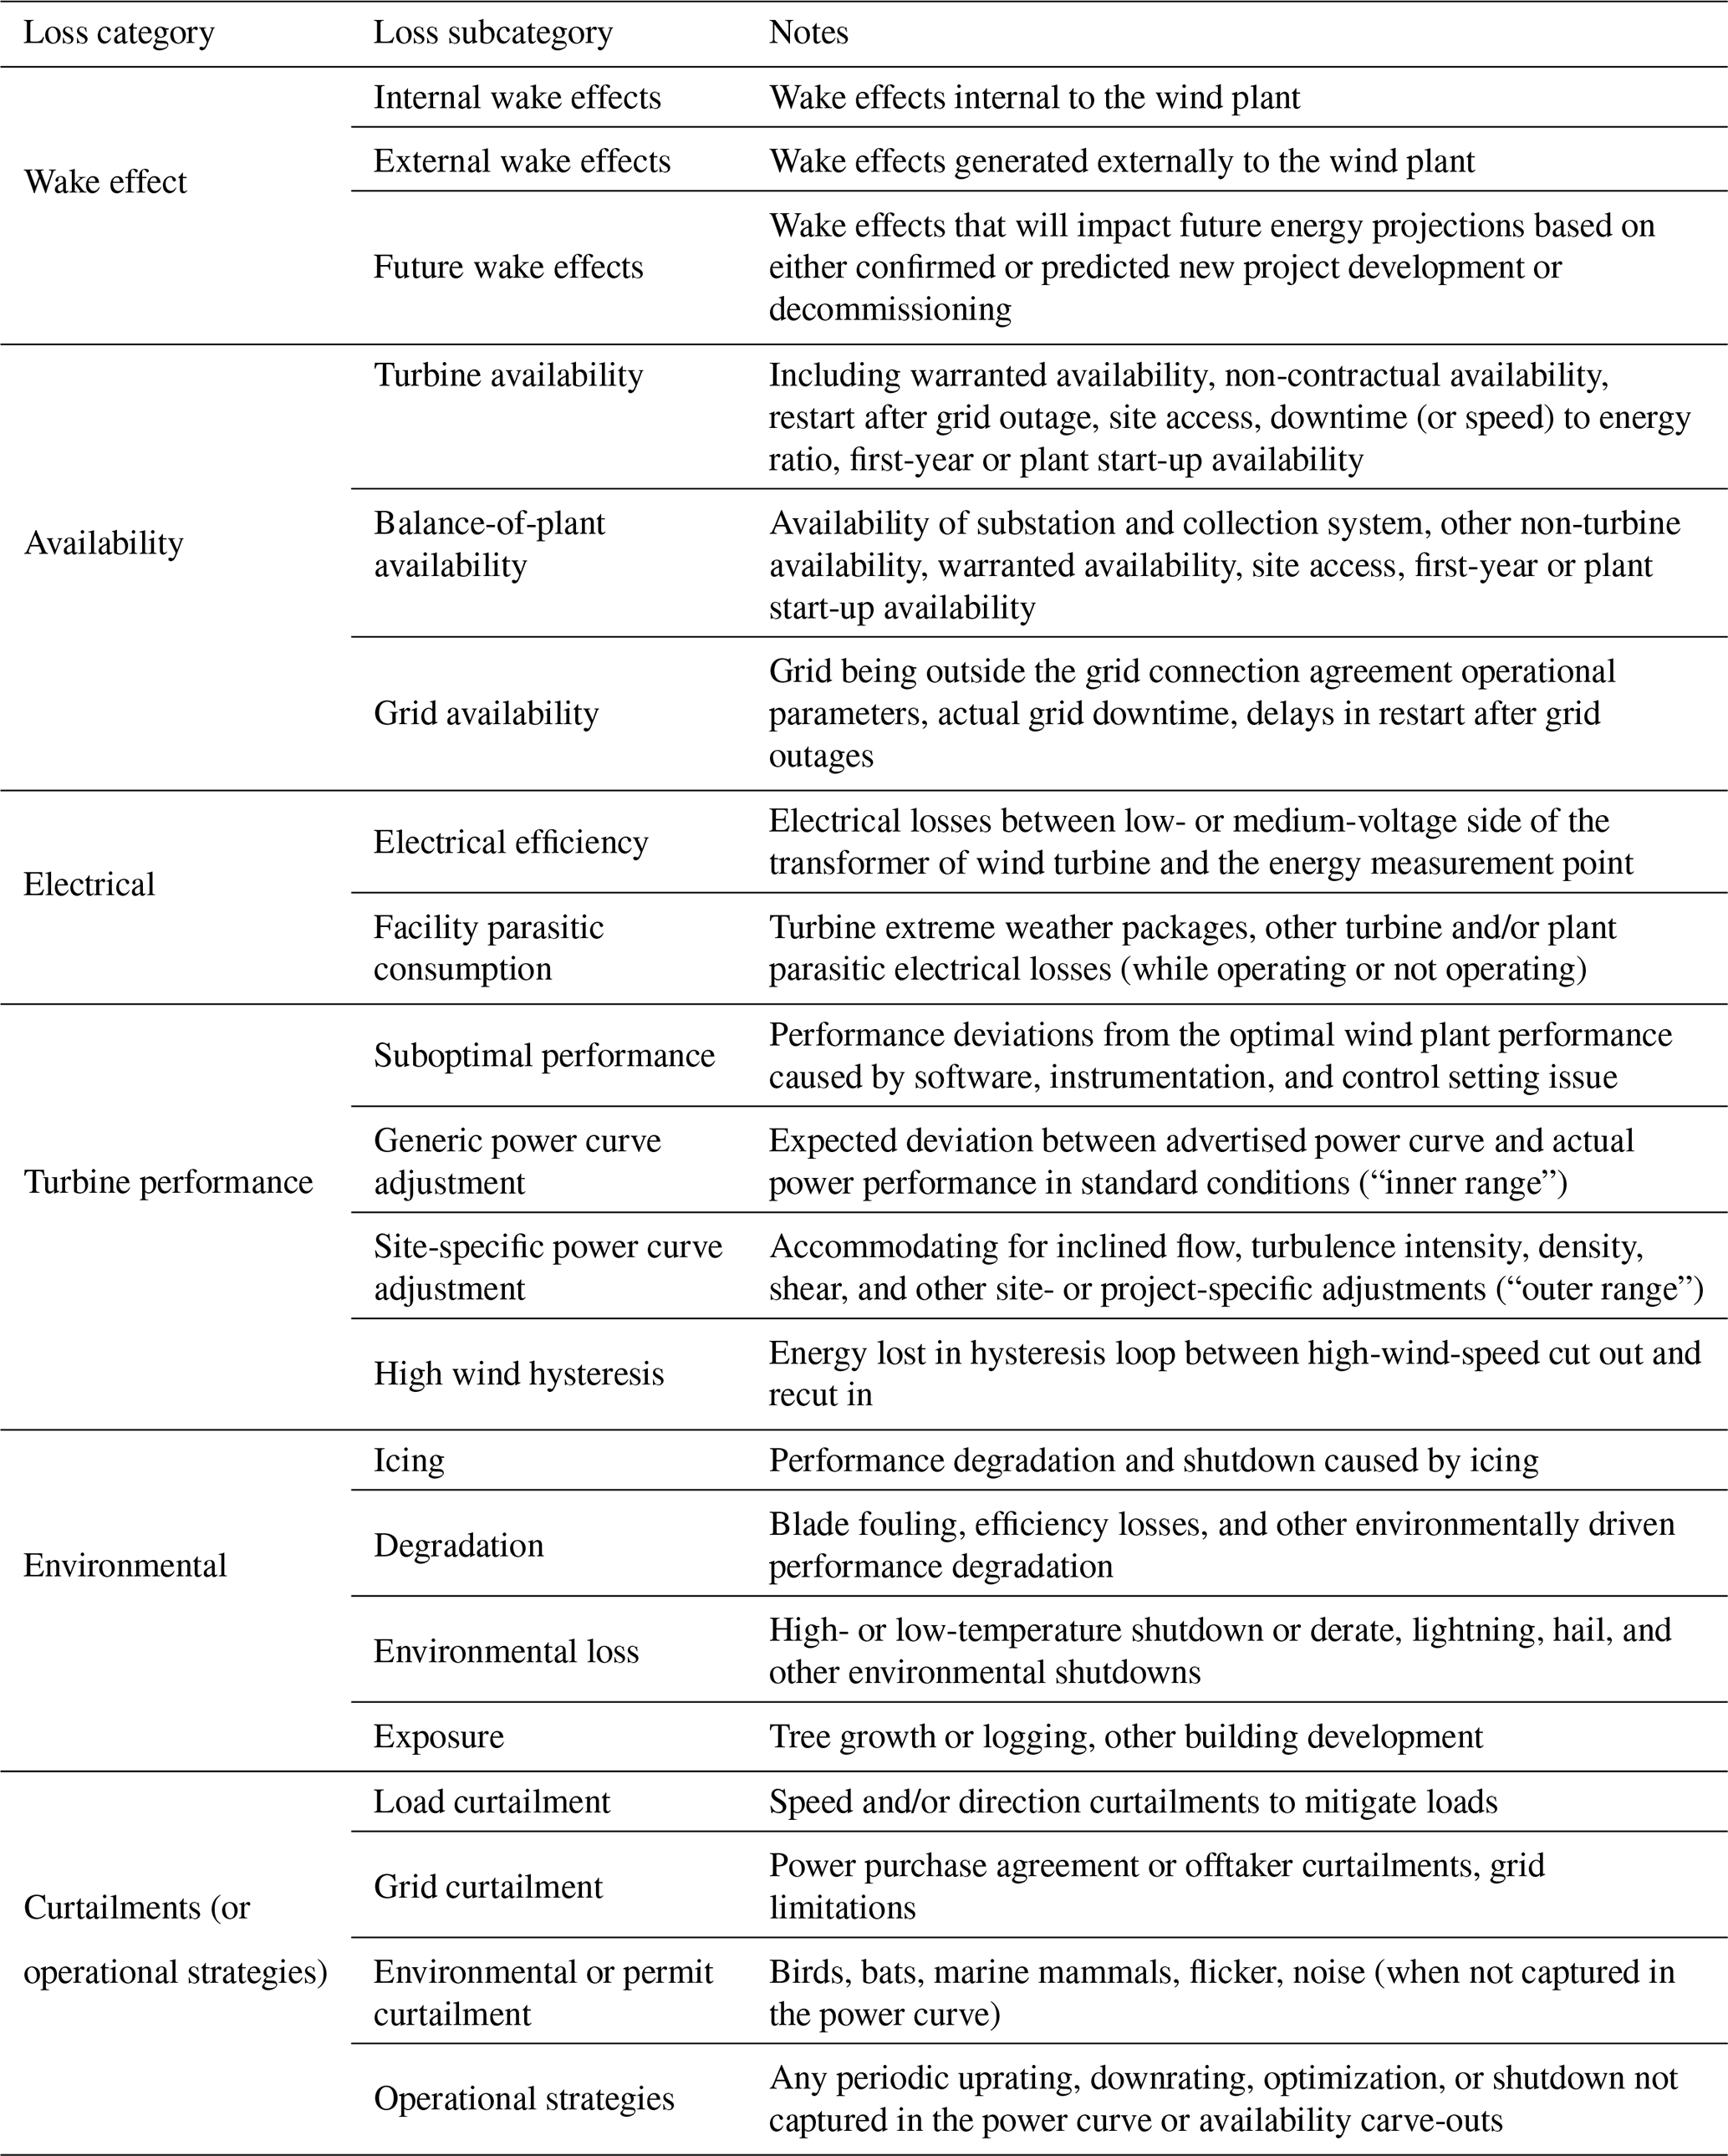
Table A2Consensus energy-production uncertainty framework for wind resource assessment proposed by the IEC 61400-15 working group (Filippelli et al., 2018). Note that this table does not represent the final standards.
For the P50 prediction error, Figs. 3 and 4 use the data from Table B1 and Table B2, respectively. For the various categories and subcategories of losses, Figs. 5, 6, 8, and C1 portray the values in Table B3. Figure 7 illustrates the losses outside of the IEC-proposed framework listed in Table B4. Figure 9 summarizes the uncertainty of production loss percentages in Table B5. Figures 10 and 11 represent the AEP uncertainty data included in Tables B6 and B7, respectively. Figure 12 displays the wind speed uncertainty data in Table B8.
Table B1List of P50 biases in the literature, which is necessary to generate Fig. 3. The “Wind farm” column denotes the number of wind farms reported in the reference, and the “Wind farm year” column indicates the total number of operation years among the wind farms in that study. The “Bias (%)” column represents the average P50 bias, where a negative number indicates an overestimation of actual energy production. All the values in the “Uncertainty (%)” column illustrate 1 standard deviation from the mean.
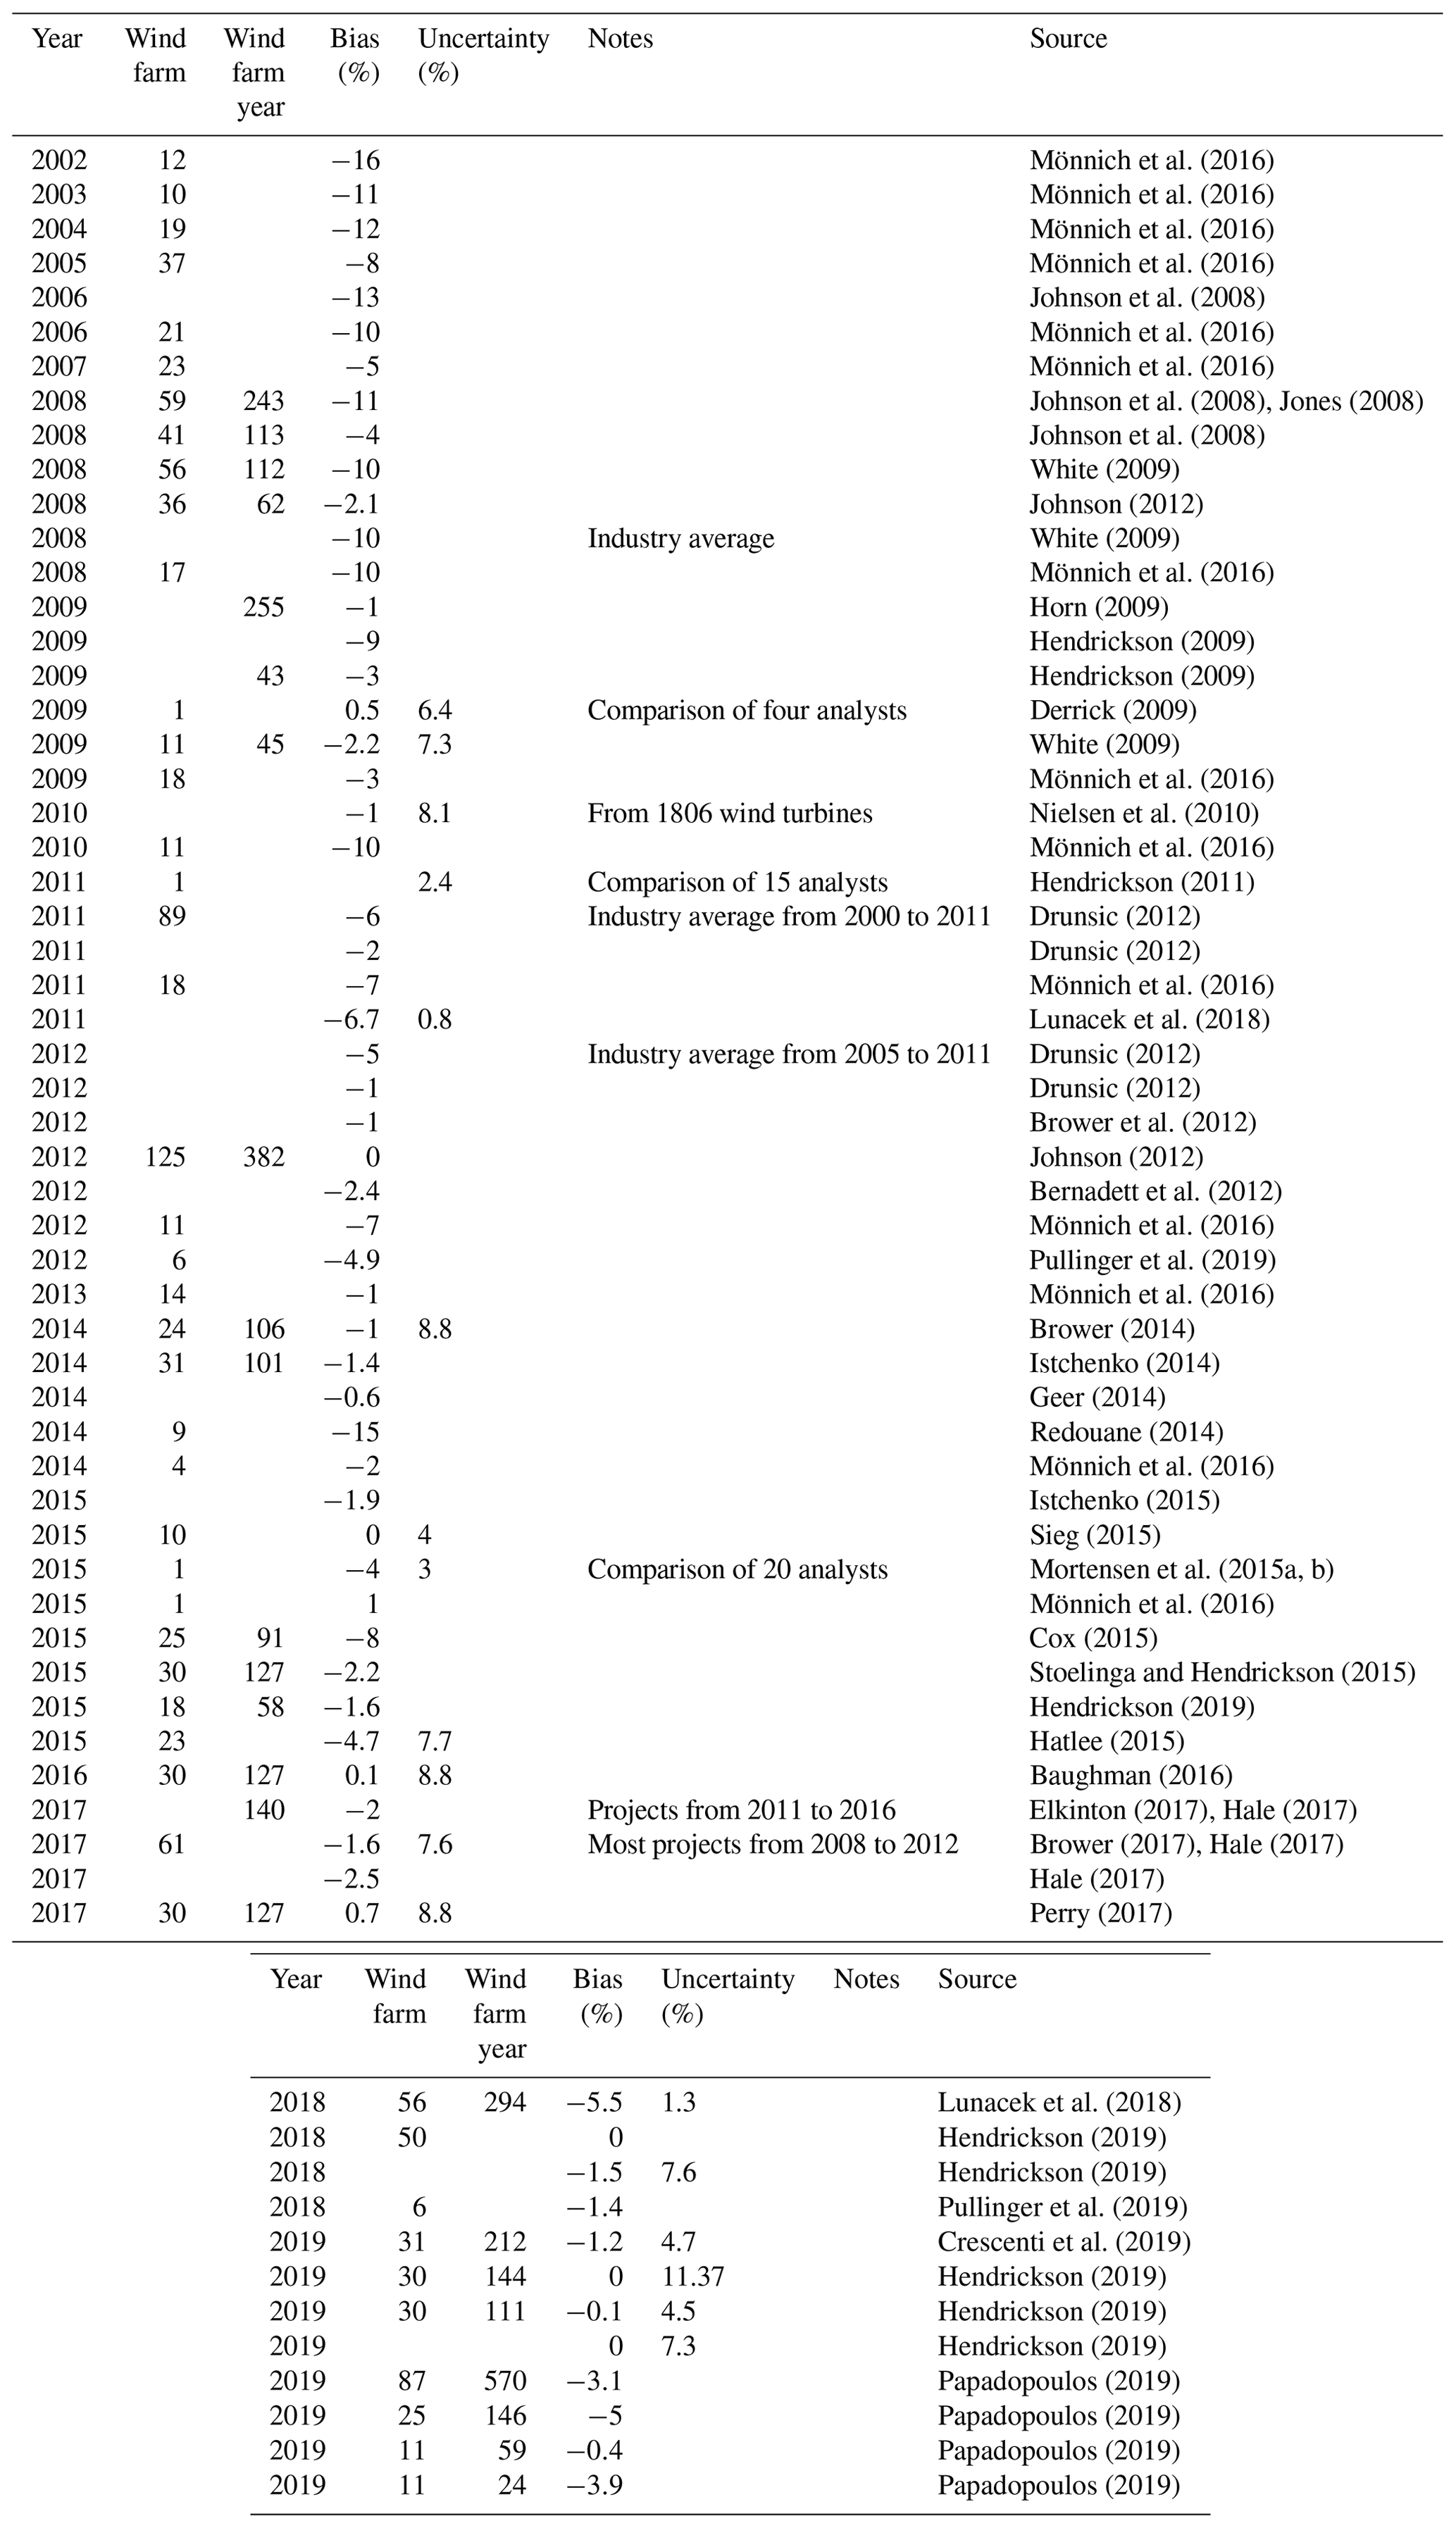
Table B2List of P50 bias groups for Fig. 4, expanding from Table B1. Different groups (the “Group” column) are represented by different line colors in Fig. 4.
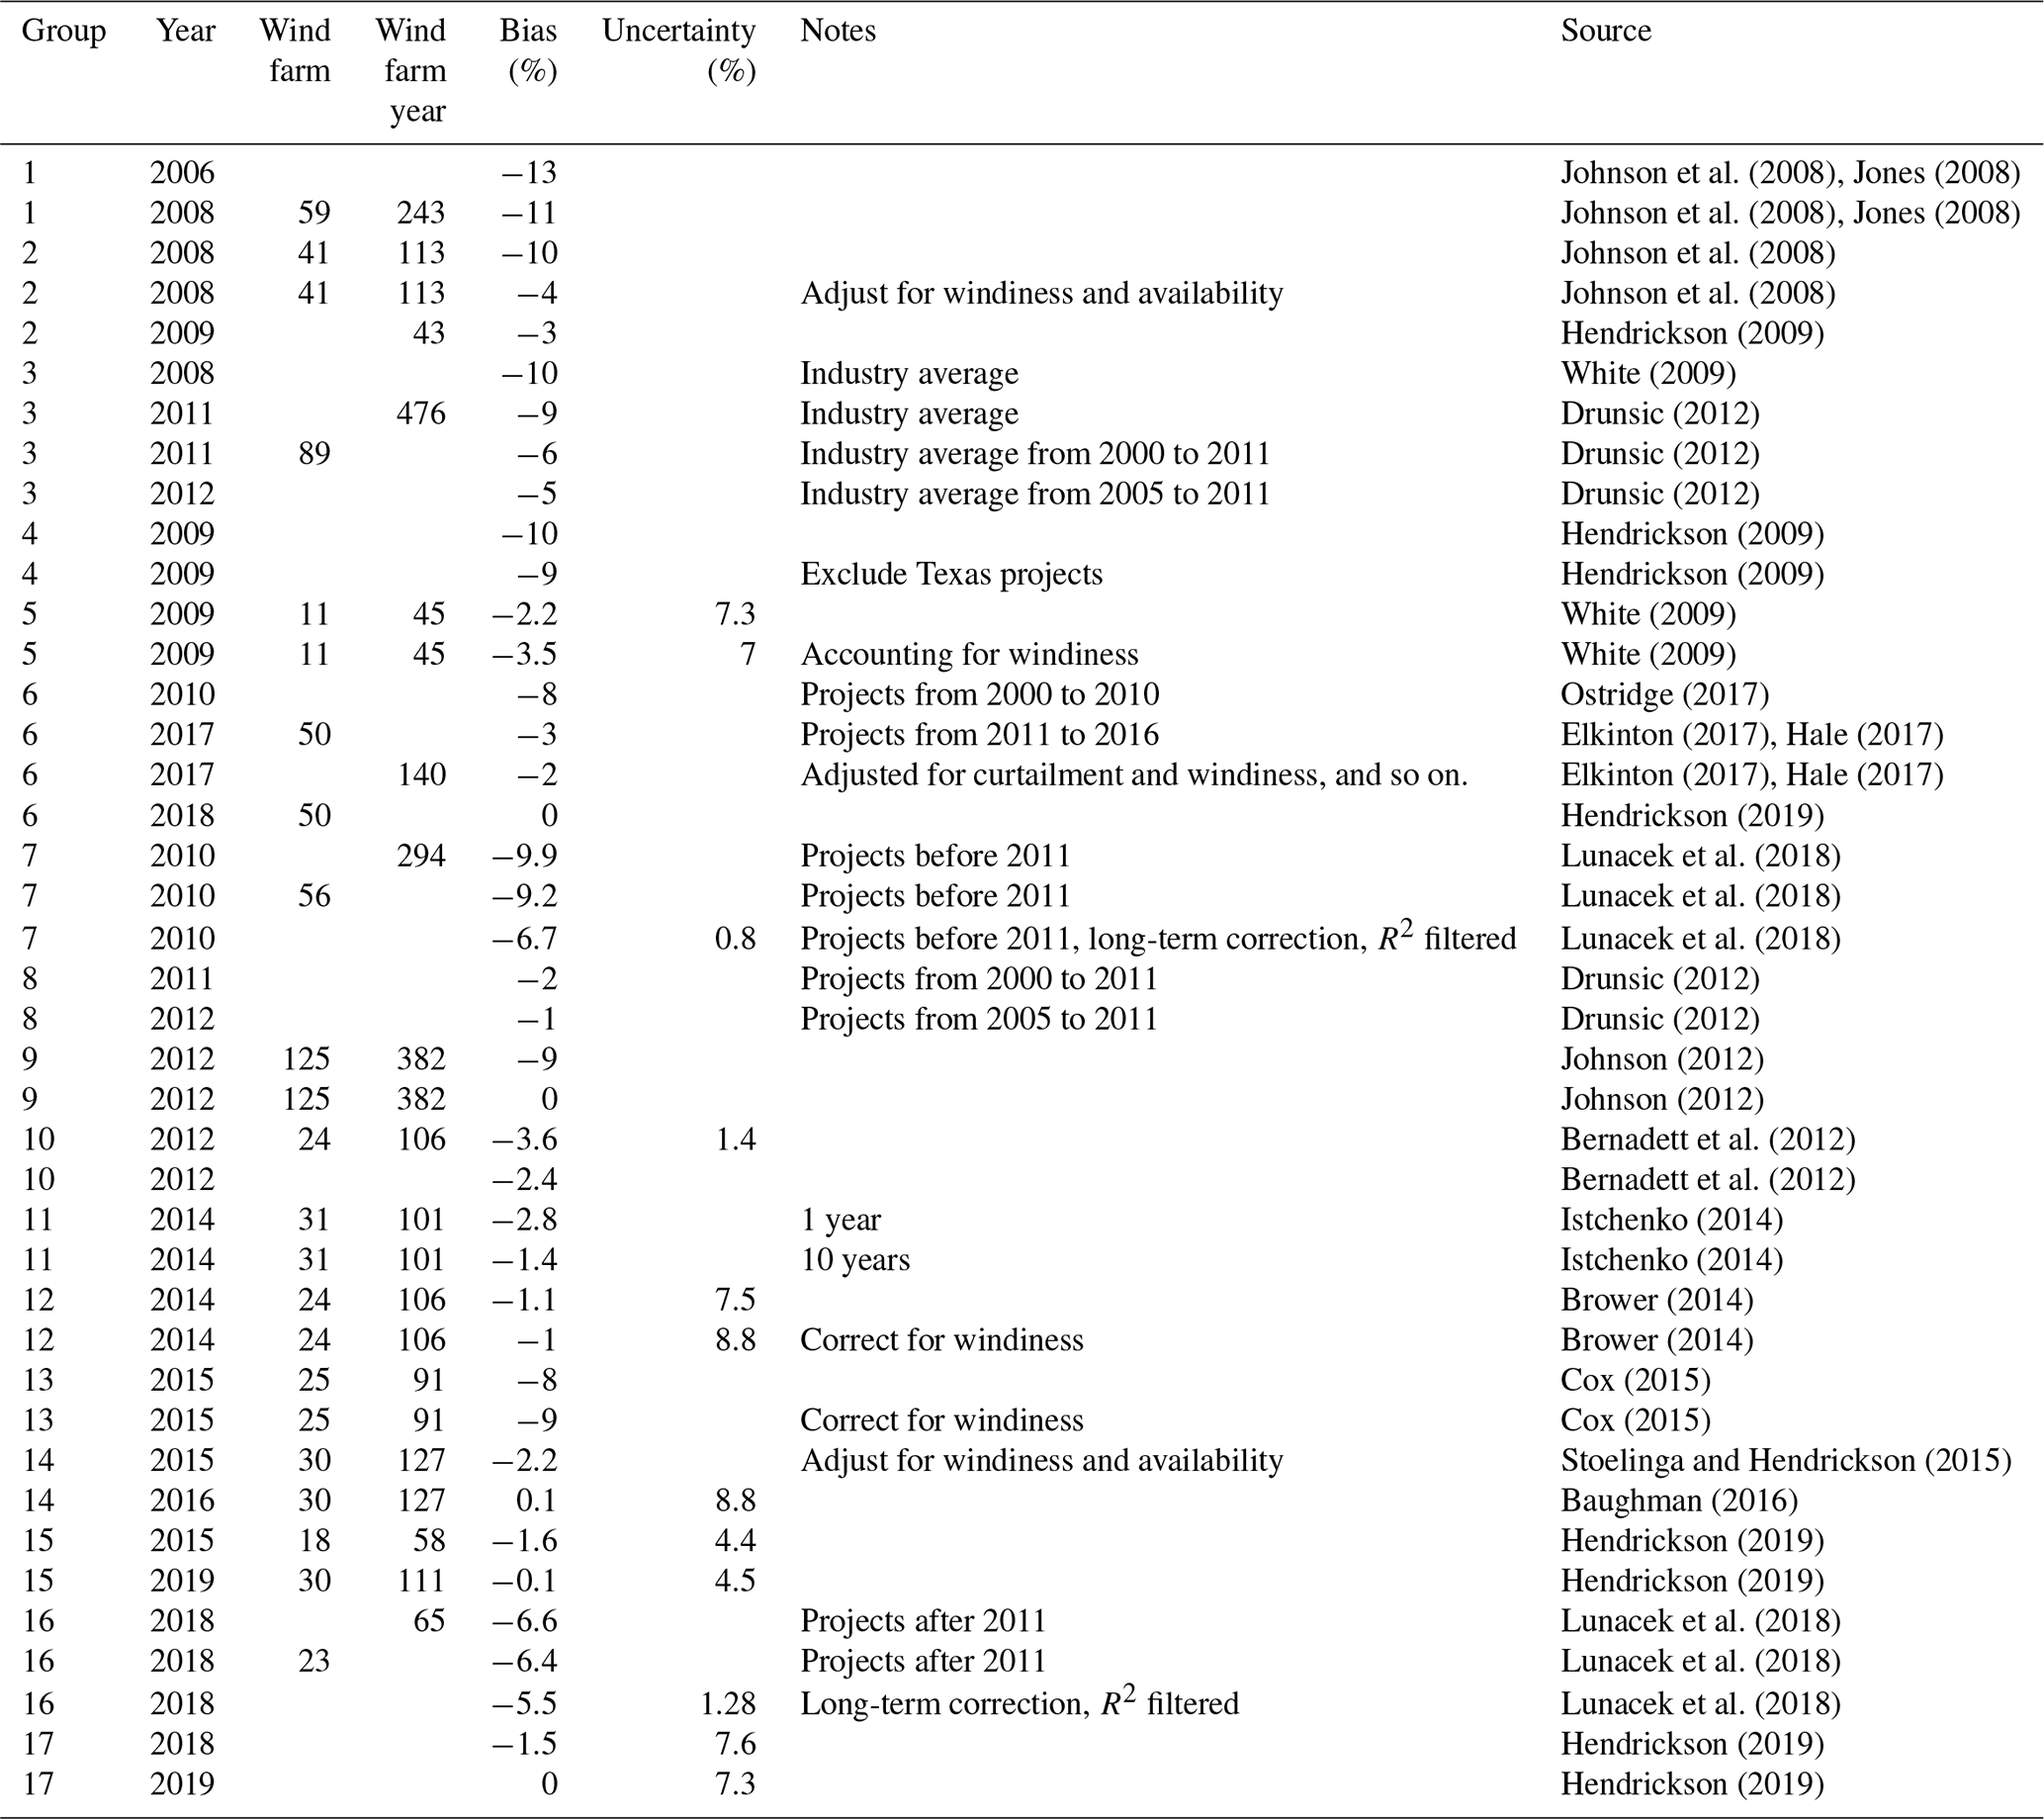
Table B3List of energy losses, corresponding to Figs. 6 and 8. The “e” and “o” in the “Est/obs” column represent estimated and observed values, respectively. The energy loss categories and subcategories align with those in Table A1. “Avg (%),” “Min (%),” and “Max (%) indicate the average, minimum, and maximum energy loss percentages, respectively. The same column-name abbreviations apply to the following tables in Appendix B.

Table B4List of other categorical losses outside the IEC-proposed framework (Table A1), which are used to generate Fig. 7.
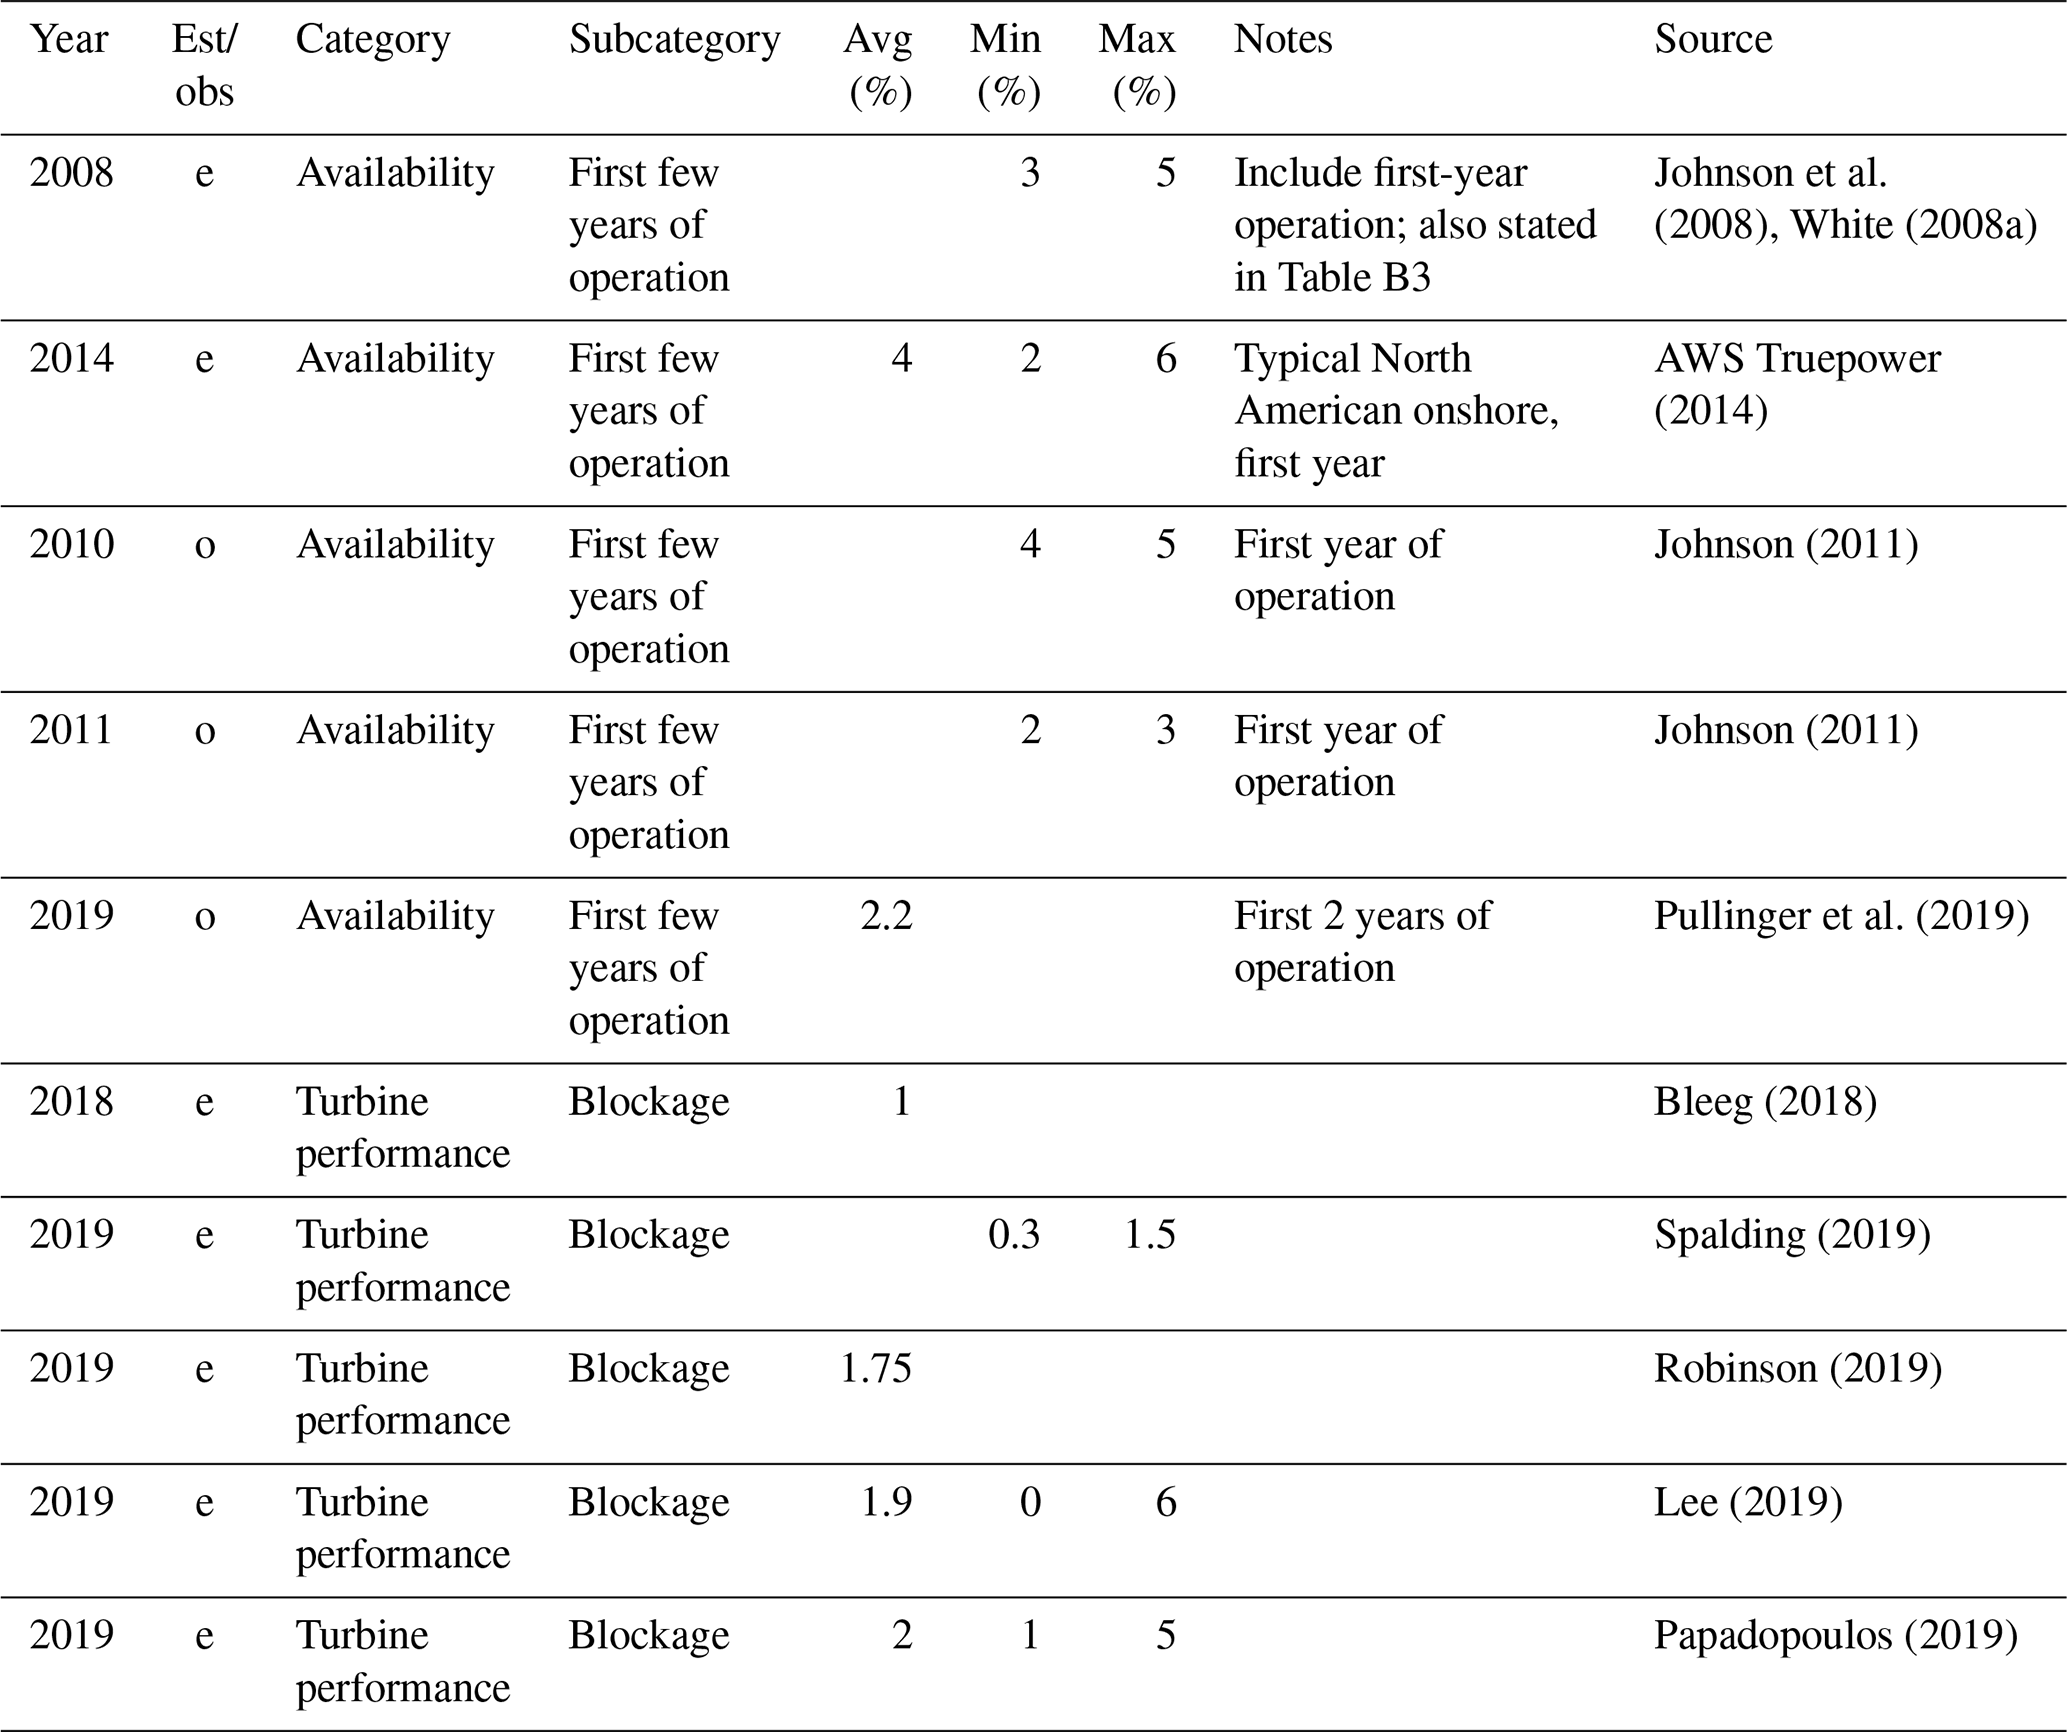
Table B5List of uncertainties of energy losses, as projected in Fig. 9. Note that a value herein represents the percent of energy percentage loss.
Table B6List of energy uncertainties, according to the categories and subcategories in Table A2. These values correspond to Fig. 10.

Table B7List of other energy uncertainties outside of the IEC-proposed framework (Table A2), and the values herein are necessary to generate Fig. 11.

Table B8List of wind speed uncertainties which are used for Fig. 12. Different from other tables in Appendix B, this table records values in percentage of wind speed.
Figure C1As in Fig. 8, the trend in energy-production loss: (a) estimated total curtailment loss, (b) observed total availability loss, and (c) estimated total wake loss. Note that the ranges of the horizontal and vertical axes differ in each panel.
Appendix B includes all the data used to generate the plots in this article.
JCYL performed the literature search, conducted the data analysis, and prepared the article. MJF provided guidance and reviewed the article.
The authors declare that they have no conflict of interest.
This work was authored by the National Renewable Energy Laboratory (NREL), operated by the Alliance for Sustainable Energy, LLC, for the US Department of Energy (DOE), under contract no. DE-AC36-08GO28308. Funding provided by the US Department of Energy Office of Energy Efficiency and Renewable Energy Wind Energy Technologies Office. The views expressed in the article do not necessarily represent the views of the DOE or US Government. The US Government retains and the publisher, by accepting the article for publication, acknowledges that the US Government retains a nonexclusive, paid up, irrevocable, worldwide license to publish or reproduce the published form of this work, or allow others to do so, for US Government purposes.
The authors would like to thank our external collaborators including Matthew Breakey, Matthew Hendrickson, Kisha James, Cory Jog, and the American Wind Energy Association; our colleagues at NREL including Sheri Anstedt, Derek Berry, Rachel Eck, Julie Lundquist, Julian Quick, David Snowberg, Paul Veers, and the NREL library; Carlo Bottasso as our editor, Mark Kelly as our peer reviewer, and one anonymous referee.
This research has been supported by the US Department of Energy (grant no. DE-AC36-08GO28308).
This paper was edited by Carlo L. Bottasso and reviewed by Mark Kelly and one anonymous referee.
Abascal, A., Herrero, M., Torrijos, M., Dumont, J., Álvarez, M., and Casso, P.: An approach for estimating energy losses due to ice in pre-construction energy assessments, in: WindEurope 2019, WindEurope, Bilbao, Spain, 2019.
Abiven, C., Brady, O., and Triki, I.: Mesoscale and CFD Coupling for Wind Resource Assessment, in: AWEA Wind Resource and Project Energy Assessment Workshop 2013, AWEA, Las Vegas, NV, 2013.
Abiven, C., Parisse, A., Watson, G., and Brady, O.: CFD Wake Modeling: Where Do We Stand?, in: AWEA Wind Resource and Project Energy Assessment Workshop 2014, AWEA, Orlando, FL, 2014.
Albers, A., Klug, H., and Westermann, D.: Outdoor Comparison of Cup Anemometers, in: German wind energy conference, DEWEK 2000, Wilhelmshaven, Germany, p. 5, 2000.
Albers, A., Franke, K., Wagner, R., Courtney, M., and Boquet, M.: Ground-based remote sensor uncertainty – a case study for a wind lidar, available at: https://www.researchgate.net/publication/267780849_Ground-based_remote_sensor_uncertainty_-_a_case_study_for_a_wind_lidar (last access: 31 October 2020), 2013.
Anderson, M.: Seasonality, Stability and MCP, in: AWEA Wind Resource and Project Energy Assessment Workshop 2008, AWEA, Portland, OR, 2008.
Apple, J.: Wind Farm Power Curves: Guidelines for New Applications, in: AWEA Wind Resource and Project Energy Assessment Workshop 2015, AWEA, New Orleans, LA, 2015.
AWS Truepower: Closing The Gap On Plant Underperformance: A Review and Calibration of AWS Truepower's Energy Estimation Methods, AWS Truepower, LLC, Albany, NY, 2009.
AWS Truepower: AWS Truepower Loss and Uncertainty Methods, Albany, NY, available at: https://www.awstruepower.com/assets/AWS-Truepower-Loss-and-Uncertainty-Memorandum-5-Jun-2014.pdf (last access: 29 August 2017), 2014.
Balfrey, D.: Data Processing, in: AWEA Wind Resource and Project Energy Assessment Workshop 2010, AWEA, Oklahoma City, OK, 2010.
Barthelmie, R. J., Murray, F., and Pryor, S. C.: The economic benefit of short-term forecasting for wind energy in the UK electricity market, Energy Policy, 36, 1687–1696, https://doi.org/10.1016/J.ENPOL.2008.01.027, 2008.
Baughman, E.: Error Distributions, Tails, and Outliers, in: AWEA Wind Resource and Project Energy Assessment Workshop 2016, AWEA, Minneapolis, MN, 2016.
Beaucage, P., Kramak, B., Robinson, N., and Brower, M. C.: Modeling the dynamic behavior of wind farm power generation: Building upon SCADA system analysis, in: AWEA Wind Resource and Project Energy Assessment Workshop 2016, AWEA, Minneapolis, MN, 2016.
Bernadett, D., Brower, M., Van Kempen, S., Wilson, W., and Kramak, B.: 2012 Backcast Study: Verifying AWS Truepower's Energy and Uncertainty Estimates, AWS Truepower, LLC, Albany, NY, 2012.
Bernadett, D., Brower, M., and Ziesler, C.: Loss Adjustment Refinement, in: AWEA Wind Resource and Project Energy Assessment Workshop 2016, AWEA, Minneapolis, MN, 2016.
Bird, L., Cochran, J., and Wang, X.: Wind and Solar Energy Curtailment: Experience and Practices in the United States, NREL/TP-6A20-60983, National Renewable Energy Laboratory, Golden, CO, 2014.
Bleeg, J.: Accounting for Blockage Effects in Energy Production Assessments, in: AWEA Wind Resource and Project Energy Assessment Workshop 2018, AWEA, Austin, TX, 2018.
Bleeg, J., Purcell, M., Ruisi, R., and Traiger, E.: Wind Farm Blockage and the Consequences of Neglecting Its Impact on Energy Production, Energies, 11, 1609, https://doi.org/10.3390/en11061609, 2018.
Breakey, M.: An Armchair Meteorological Campaign Manager: A Retrospective Analysis, in: AWEA Wind Resource and Project Energy Assessment Workshop 2019, AWEA, Renton, WA, 2019.
Brower, M.: What do you mean you're not sure? Concepts in uncertainty and risk management, in: AWEA Wind Resource and Project Energy Assessment Workshop 2011, AWEA, Seattle, WA, 2011.
Brower, M. C.: Wind resource assessment: a practical guide to developing a wind project, Wiley, Hoboken, NJ, 2012.
Brower, M. C.: Measuring and Managing Uncertainty, in: AWEA Wind Resource and Project Energy Assessment Workshop 2014, AWEA, Orlando, FL, 2014.
Brower, M. C.: State of the P50, in: AWEA WINDPOWER 2017, AWEA, Anaheim, CA, 2017.
Brower, M. C. and Robinson, N. M.: Validation of the openWind Deep Array Wake Model (DAWM), in: AWEA Wind Resource and Project Energy Assessment Workshop 2013, AWEA, Las Vegas, NV, 2013.
Brower, M. C., Robinson, N. M., and Hale, E.: Wind Flow Modeling Uncertainty: Quantification and Application to Monitoring Strategies and Project Design, AWS Truepower, LLC, Albany, NY, 2010.
Brower, M. C., Bernadett, D., Van Kempen, S., Wilson, W., and Kramak, B.: Actual vs. Predicted Plant Production: The Role of Turbine Performance, in: AWEA Wind Resource and Project Energy Assessment Workshop 2012, AWEA, Pittsburgh, PA, 2012.
Brower, M. C., Robinson, N. M., and Vila, S.: Wind Flow Modeling Uncertainty: Theory and Application to Monitoring Strategies and Project Design, AWS Truepower, LLC, Albany, NY, 2015.
Brown, G.: Wakes: Ten Rows and Beyond, a Cautionary Tale!, in: AWEA Wind Resource and Project Energy Assessment Workshop 2012, AWEA, Pittsburgh, PA, 2012.
Byrkjedal, Ø., Hansson, J., and van der Velde, H.: Development of operational forecasting for icing and wind power at cold climate sites, in IWAIS 2015: 16th International Workshop on Atmospheric Icing of Structures, IWAIS, Uppsala, Sweden, p. 4, 2015.
Clark, S.: Wind Tunnel Comparison of Anemometer Calibration, in: AWEA Wind Resource and Project Energy Assessment Workshop 2015, AWEA, New Orleans, LA, 2015.
Clifton, A., Smith, A., and Fields, M.: Wind Plant Preconstruction Energy Estimates: Current Practice and Opportunities, NREL/TP-5000-64735, National Renewable Energy Laboratory, Golden, CO, 2016.
Clive, P.: Wind Farm Performance, in: AWEA Wind Resource and Project Energy Assessment Workshop 2010, AWEA, Oklahoma City, OK, 2010.
Colmenar-Santos, A., Campíez-Romero, S., Enríquez-Garcia, L., Pérez-Molina, C., Colmenar-Santos, A., Campíez-Romero, S., Enríquez-Garcia, L. A., and Pérez-Molina, C.: Simplified Analysis of the Electric Power Losses for On-Shore Wind Farms Considering Weibull Distribution Parameters, Energies, 7, 6856–6885, https://doi.org/10.3390/en7116856, 2014.
Comstock, K.: Uncertainty and Risk Management in Wind Resource Assessment, in: AWEA Wind Resource and Project Energy Assessment Workshop 2011, AWEA, Seattle, WA, 2011.
Comstock, K.: Identifying Pitfalls and Quantifying Uncertainties in Operating Project Re-Evaluation, in: AWEA Wind Resource and Project Energy Assessment Workshop 2012, AWEA, Pittsburgh, PA, 2012.
Conroy, N., Deane, J. P., and, Ó Gallachóir, B. P.: Wind turbine availability: Should it be time or energy based? – A case study in Ireland, Renew. Energy, 36, 2967–2971, https://doi.org/10.1016/J.RENENE.2011.03.044, 2011.
Cox, S.: Validation of 25 offshore pre-construction energy forecasts against real operational wind farm data, in: AWEA Wind Resource and Project Energy Assessment Workshop 2015, AWEA, New Orleans, LA, 2015.
Craig, A., Optis, M., Fields, M. J., and Moriarty, P.: Uncertainty quantification in the analyses of operational wind power plant performance, J. Phys. Conf. Ser., 1037, 052021, https://doi.org/10.1088/1742-6596/1037/5/052021, 2018.
Crease, J.: CFD Modelling of Mast Effects on Anemometer Readings, in: WindEurope 2019, WindEurope, Bilbao, Spain, 2019.
Crescenti, G. H., Poulos, G. S., and Bosche, J.: Valuable Lessons From Outliers In A Wind Energy Resource Assessment Benchmark Study, in: AWEA Wind Resource and Project Energy Assessment Workshop 2019, AWEA, Renton, WA, 2019.
Cushman, A.: Industry Survey of Wind Farm Availability, in: AWEA Wind Resource and Project Energy Assessment Workshop 2009, AWEA, Minneapolis, MN, 2009.
Dahlberg, J.-Å.: Assessment of the Lillgrund Windfarm, Report no. 21858-1, Vattenfall Vindkraft AB, Stockholm, Sweden, 28 pp., 2009.
Derrick, A.: Uncertainty: The Classical Approach, in: AWEA Wind Resource and Project Energy Assessment Workshop 2009, AWEA, Minneapolis, MN, 2009.
Drees, H. M. and Weiss, D. J.: Compilation of Power Performance Test Results, in: AWEA Wind Resource and Project Energy Assessment Workshop 2012, AWEA, Pittsburgh, PA, 2012.
Drunsic, M. W.: Actual vs. Predicted Wind Project Performance: Is the Industry Closing the Gap?, in: AWEA Wind Resource and Project Energy Assessment Workshop 2012, AWEA, Pittsburgh, PA, 2012.
Dutrieux, A.: How long should be long term to reduce uncertainty on annual wind energy assessment, in: WindEurope 2019, WindEurope, Bilbao, Spain, 2019.
Ehrmann, R. S., Wilcox, B., White, E. B., and Maniaci, D. C.: Effect of Surface Roughness on Wind Turbine Performance, SAND2017-10669, Sandia National Laboratories, Albuquerque, NM and Livermore, CA, 2017.
Elkinton, M.: Strengthening Wake Models: DNV GL Validations & Advancements, in: AWEA Wind Resource and Project Energy Assessment Workshop 2013, AWEA, Las Vegas, NV, 2013.
Elkinton, M.: Current view of P50 estimate accuracy based on validation efforts, in: AWEA WINDPOWER 2017, AWEA, Anaheim, CA, 2017.
EMD International A/S: WindPRO 2.4., EMD International A/S, Aalborg, Denmark, 2004.
Faghani, D.: Measurement Uncertainty of Ground-Based Remote Sensing, in: AWEA Wind Resource and Project Energy Assessment Workshop 2011, AWEA, Seattle, WA, 2011.
Faghani, D., Desrosiers, E., Aït-Driss, B., and Poulin, M.: Use of Remote Sensing in Addressing Bias & Uncertainty in Wind Measurements, in: AWEA Wind Resource and Project Energy Assessment Workshop 2008, AWEA, Portland, OR, 2008.
Faubel, A.: Digitalisation: Creating Value in O&M, in: WindEurope 2019, WindEurope, Bilbao, Spain, 2019.
Filippelli, M., Bernadett, D., Sloka, L., Mazoyer, P., and Fleming, A.: Concurrent Power Performance Measurements, in: AWEA Wind Resource and Project Energy Assessment Workshop 2017, AWEA, Snowbird, UT, 2017.
Filippelli, M., Sherwin, B., and Fields, J.: IEC 61400-15 Working Group Update, in: AWEA Wind Resource and Project Energy Assessment Workshop 2018, AWEA, Austin, TX, 2018.
Friis Pedersen, T., Gjerding, S., Enevoldsen, P., Hansen, J. K., and Jørgensen, H. K.: Wind turbine power performance verification in complex terrain and wind farms, report no. Risoe-R 1330(EN), Forskningscenter Risoe, Roskilde, Denmark, 2002.
Garrad Hassan and Partners Ltd: GH WindFarmer Theory Manual, Bristol, England, 2009.
Geer, T.: Towards a more realistic uncertainty model, in: AWEA Wind Resource and Project Energy Assessment Workshop 2014, AWEA, Orlando, FL, 2014.
Geer, T.: Identifying production risk in preconstruction assessments: Can we do it?, in: AWEA Wind Resource and Project Energy Assessment Workshop 2015, AWEA, New Orleans, LA, 2015.
Germer, S. and Kleidon, A.: Have wind turbines in Germany generated electricity as would be expected from the prevailing wind conditions in 2000–2014?, edited by: Leahy, P., PLoS One, 14, e0211028, https://doi.org/10.1371/journal.pone.0211028, 2019.
Gillenwater, D., Masson, C., and Perron, J.: Wind Turbine Performance During Icing Events, in: 46th AIAA Aerospace Sciences Meeting and Exhibit, American Institute of Aeronautics and Astronautics, Reston, Virigina, 2008.
Gkarakis, K. and Orfanaki, G.: Historical wind speed trends and impact on long-term adjustment and interannual variability in Cyprus, in: WindEurope 2019, WindEurope, Bilbao, Spain, 2019.
Graves, A., Harman, K., Wilkinson, M., and Walker, R.: Understanding Availiability Trends of Operating Wind Farms, in: AWEA WINDPOWER 2008, AWEA, Houston, TX, 2008.
Halberg, E.: A Monetary Comparison of Remote Sensing and Tall Towers, in: AWEA Wind Resource and Project Energy Assessment Workshop 2017, AWEA, Snowbird, UT, 2017.
Halberg, E. and Breakey, M.: On-Shore Wake Validation Study: Wake Analysis Based on Production Data, in: AWEA Wind Resource and Project Energy Assessment Workshop 2013, AWEA, Las Vegas, NV, 2013.
Hale, E.: External Perspectives: Estimate Accuracy and Plant Operations, in: AWEA Wind Resource and Project Energy Assessment Workshop 2017, AWEA, Snowbird, UT, 2017.
Hamel, M.: Estimating 50-yr Extreme Wind Speeds from Short Datasets, in: AWEA Wind Resource and Project Energy Assessment Workshop 2014, AWEA, Orlando, FL, 2014.
Hamilton, S. D., Millstein, D., Bolinger, M., Wiser, R., and Jeong, S.: How Does Wind Project Performance Change with Age in the United States?, Joule, 4, 1004–1020, https://doi.org/10.1016/j.joule.2020.04.005, 2020.
Hasager, C., Bech, J. I., Bak, C., Vejen, F., Madsen, M. B., Bayar, M., Skrzypinski, W. R., Kusano, Y., Saldern, M., Tilg, A.-M., Fæster, S., and Johansen, N. F.-J.: Solution to minimize leading edge erosion on turbine blades, in: WindEurope 2019, WindEurope, Bilbao, Spain, 2019.
Hatlee, S.: Measurement Uncertainty in Wind Resource Asessment, in: AWEA Wind Resource and Project Energy Assessment Workshop 2011, AWEA, Seattle, WA, 2011.
Hatlee, S.: Operational Performance vs. Precon Estimate, in: AWEA Wind Resource and Project Energy Assessment Workshop 2015, AWEA, New Orleans, LA, 2015.
Healer, B.: Liquid Power Markets 201, in: AWEA Wind Resource and Project Energy Assessment Workshop 2018, AWEA, Austin, TX, 2018.
Hendrickson, M.: 2009 AWEA Wind Resource & Project Energy Assessment Workshop – Introduction, in: AWEA Wind Resource and Project Energy Assessment Workshop 2009, AWEA, Minneapolis, MN, 2009.
Hendrickson, M.: Extending Data – by whatever means necessary, in: AWEA Wind Resource and Project Energy Assessment Workshop 2010, AWEA, Oklahoma City, OK, 2010.
Hendrickson, M.: Industry Survey of Wind Energy Assessment Techniques, in: AWEA Wind Resource and Project Energy Assessment Workshop 2011, AWEA, Seattle, WA, 2011.
Hendrickson, M.: Extreme Winds in the Suitability Context: Should we be Concerned?, in: AWEA Wind Resource and Project Energy Assessment Workshop 2014, AWEA, Orlando, FL, 2014.
Hendrickson, M.: P50 Bias Update: Are we there yet?, in: AWEA Wind Resource and Project Energy Assessment Workshop 2019, AWEA, Renton, WA, 2019.
Hill, N., Pullinger, D., Zhang, M., and Crutchley, T.: Validation of windfarm downtime modelling and impact on grid-constrained projects, in: WindEurope 2019, WindEurope, Bilbao, Spain, 2019.
Holtslag, E.: Improved Bankability: The Ecofys position on LiDAR use, Utrecht, the Netherlands, 2013.
Horn, B.: Achieving Measurable Financial Results in Operational Assessments, in: AWEA Wind Resource and Project Energy Assessment Workshop 2009, AWEA, Minneapolis, MN, 2009.
Istchenko, R.: WRA Uncertainty Validation, in: AWEA Wind Resource and Project Energy Assessment Workshop 2014, AWEA, Orlando, FL, 2014.
Istchenko, R.: Re-examining Uncertainty and Bias, in: AWEA Wind Resource and Project Energy Assessment Workshop 2015, AWEA, New Orleans, LA, 2015.
Jaynes, D.: The Vestas Operating Fleet: Real-World Experience in Wind Turbine Siting and Power Curve Verification, in: AWEA Wind Resource and Project Energy Assessment Workshop 2012, AWEA, Pittsburgh, PA, 2012.
Jog, C.: Benchmark: Wind flow, in: AWEA Wind Resource and Project Energy Assessment Workshop 2017, AWEA, Snowbird, UT, 2017.
Johnson, C.: Actual vs. Predicted performance – Validating pre construction energy estimates, in: AWEA Wind Resource and Project Energy Assessment Workshop 2012, AWEA, Pittsburgh, PA, 2012.
Johnson, C., White, E., and Jones, S.: Summary of Actual vs. Predicted Wind Farm Performance: Recap of WINDPOWER 2008, in: AWEA Wind Resource and Project Energy Assessment Workshop 2008, AWEA, Portland, OR, 2008.
Johnson, J.: Typical Availability Losses and Categorization: Observations from an Operating Project Portfolio, in: AWEA Wind Resource and Project Energy Assessment Workshop 2011, AWEA, Seattle, WA, 2011.
Jones, S.: Project Underperformance: 2008 Update, in: AWEA WINDPOWER 2008, AWEA, Houston, TX, 2008.
Kassebaum, J.: Power Curve Testing with Remote Sensing Devices, in: AWEA Wind Resource and Project Energy Assessment Workshop 2013, AWEA, Las Vegas, NV, 2013.
Kassebaum, J. L.: What p-level is your p-ower curve?, in: AWEA Wind Resource and Project Energy Assessment Workshop 2015, AWEA, New Orleans, LA, 2015.
Keck, R.-E., Sondell, N., and Håkansson, M.: Validation of a fully numerical approach for early stage wind resource assessment in absence of on-site measurements, in: WindEurope 2019, WindEurope, Bilbao, Spain, 2019.
Kelly, M.: Uncertainty in vertical extrapolation of wind statistics: shear-exponent and WAsP/EWA methods, No. 0121, DTU Wind Energy, Roskilde, Denmark, 2016.
Kelly, M., Kersting, G., Mazoyer, P., Yang, C., Hernández Fillols, F., Clark, S., and Matos, J. C.: Uncertainty in vertical extrapolation of measured wind speed via shear, No. E-0195, DTU Wind Energy, Roskilde, Denmark, 2019.
Kim, K. and Shin, P.: Analysis on the Parameters Under the Power Measurement Uncertainty for a Small Wind Turbine, in: WindEurope 2019, WindEurope, Bilbao, Spain, 2019.
Kline, J.: Wind Farm Wake Analysis: Summary of Past & Current Work, in: AWEA Wind Resource and Project Energy Assessment Workshop 2013, AWEA, Las Vegas, NV, 2013.
Kline, J.: Wake Model Validation Test, in: AWEA Wind Resource and Project Energy Assessment Workshop 2016, AWEA, Minneapolis, MN, 2016.
Kline, J.: Detecting and Correcting for Bias in Long-Term Wind Speed Estimates, in: AWEA Wind Resource and Project Energy Assessment Workshop 2019, AWEA, Renton, WA, 2019.
Lackner, M. A., Rogers, A. L., and Manwell, J. F.: Uncertainty Analysis in MCP-Based Wind Resource Assessment and Energy Production Estimation, J. Sol. Energ. Eng., 130, 31006–31010, https://doi.org/10.1115/1.2931499, 2008.
Langel, C. M., Chow, R., Hurley, O. F., van Dam, C. P., Ehrmann, R. S., White, E. B., and Maniaci, D.: Analysis of the Impact of Leading Edge Surface Degradation on Wind Turbine Performance, in: AIAA SciTech 33rd Wind Energy Symposium, American Institute of Aeronautics and Astronautics, Kissimmee, FL, p. 13, 2015.
Langreder, W.: Uncertainty of Vertical Wind Speed Extrapolation, in: AWEA Wind Resource and Project Energy Assessment Workshop 2017, AWEA, Snowbird, UT, 2017.
Latoufis, K., Riziotis, V., Voutsinas, S., and Hatziargyriou, N.: Effects of leading edge erosion on the power performance and acoustic noise emissions of locally manufactured small wind turbines blades, in: WindEurope 2019, WindEurope, Bilbao, Spain, 2019.
Lee, J.: Banter on Blockage, in: AWEA Wind Resource and Project Energy Assessment Workshop 2019, AWEA, Renton, WA, 2019.
Lee, J. C. Y., Fields, M. J., and Lundquist, J. K.: Assessing variability of wind speed: comparison and validation of 27 methodologies, Wind Energ. Sci., 3, 845–868, https://doi.org/10.5194/wes-3-845-2018, 2018.
Liew, J., Urbán, A. M., Dellwick, E., and Larsen, G. C.: The effect of wake position and yaw misalignment on power loss in wind turbines, in: WindEurope 2019, WindEurope, Bilbao, Spain, 2019.
Lunacek, M., Fields, M. J., Craig, A., Lee, J. C. Y., Meissner, J., Philips, C., Sheng, S., and King, R.: Understanding Biases in Pre-Construction Estimates, J. Phys. Conf. Ser., 1037, 062009, https://doi.org/10.1088/1742-6596/1037/6/062009, 2018.
Maniaci, D. C., White, E. B., Wilcox, B., Langel, C. M., van Dam, C. P., and Paquette, J. A.: Experimental Measurement and CFD Model Development of Thick Wind Turbine Airfoils with Leading Edge Erosion, J. Phys. Conf. Ser., 753, 022013, https://doi.org/10.1088/1742-6596/753/2/022013, 2016.
McAloon, C.: Wind Assessment: Raw Data to Hub Height Winds, in: AWEA Wind Resource and Project Energy Assessment Workshop 2010, AWEA, Oklahoma City, OK, 2010.
McCaa, J.: Wake modeling at 3TIER, in: AWEA Wind Resource and Project Energy Assessment Workshop 2013, AWEA, Las Vegas, NV, 2013.
Medley, J. and Smith, M.: The “Why?”, “What?” and “How?” of lidar type classification, in: WindEurope 2019, WindEurope, Bilbao, Spain, 2019.
Mibus, M.: Conservatism in Shadow Flicker Assessment and Wind Farm Design, in: AWEA Wind Resource and Project Energy Assessment Workshop 2018, AWEA, Austin, TX, 2018.
Mönnich, K., Horodyvskyy, S., and Krüger, F.: Comparison of Pre-Construction Energy Yield Assessments and Operating Wind Farm's Energy Yields, UL International GmbH – DEWI, Oldenburg, Germany, 2016.
Mortensen, N. G.: Planning and Development of Wind Farms: Wind Resource Assessment and Siting, report no. 0045(EN), DTU Wind Energy, Roskilde, Denmark, 2013.
Mortensen, N. G. and Ejsing Jørgensen, H.: Comparative Resource and Energy Yield Assessment Procedures (CREYAP) Pt. II, in: EWEA Technology Workshop: Resource Assessment 2013, Dublin, Ireland, 2013.
Mortensen, N. G., Ejsing Jørgensen, H., Anderson, M., and Hutton, K.-A.: Comparison of resource and energy yield assessment procedures, in: Proceedings of EWEA 2012 – European Wind Energy Conference & Exhibition European Wind Energy Association (EWEA), Technical Universtiy of Denmark, Copenhagen, Denmark, p. 10, 2012.
Mortensen, N. G., Nielsen, M., and Ejsing Jørgensen, H.: Comparison of Resource and Energy Yield Assessment Procedures 2011–2015: What have we learned and what needs to be done?, in: Proceedings of the European Wind Energy Association Annual Event and Exhibition 2015, European Wind Energy Association, Paris, France, 2015a.
Mortensen, N. G., Nielsen, M., and Ejsing Jørgensen, H.: EWEA CREYAP benchmark exercises: summary for offshore wind farm cases, Technical Universtiy of Denmark, Roskilde, Denmark, 2015b.
Murphy, O.: Blade Erosion Performance Impact, in: 21st Meeting of the Power Curve Working Group, PCWG, Glasgow, Scotland, 2016.
Neubert, A.: WindFarmer White Paper, DNV GL, Oldenburg, Germany, 2016.
Nielsen, P., Villadsen, J., Kobberup, J., Madsen, P., Jacobsen, T., Thøgersen, M. L., Sørensen, M. V., Sørensen, T., Svenningsen, L., Motta, M., Bredelle, K., Funk, R., Chun, S., and Ritter, P.: WindPRO 2.7 User Guide, 3rd Edn., Aalborg, Denmark, 2010.
Olauson, J., Edström, P., and Rydén, J.: Wind turbine performance decline in Sweden, Wind Energy, 20, 2049–2053, https://doi.org/10.1002/we.2132, 2017.
Osler, E.: Yaw Error Detection and Mitigation with Nacelle Mounted Lidar, in: AWEA Wind Resource and Project Energy Assessment Workshop 2013, AWEA, Las Vegas, NV, 2013.
Ostridge, C.: Understanding & Predicting Turbine Performance, in: AWEA Wind Resource and Project Energy Assessment Workshop 2014, AWEA, Orlando, FL, 2014.
Ostridge, C.: Using Pattern of Production to Validate Wind Flow, Wakes, and Uncertainty: Using Pattern of Production to Validate Wind Flow, Wakes, and Uncertainty, in: AWEA Wind Resource and Project Energy Assessment Workshop 2015, AWEA, New Orleans, LA, 2015.
Ostridge, C.: Wind Power Project Performance White Paper 2017 Update, DNV GL, Seattle, WA, 2017.
Ostridge, C. and Rodney, M.: Modeling Wind Farm Energy, Revenue and Uncertainty on a Time Series Basis, in: AWEA Wind Resource and Project Energy Assessment Workshop 2016, AWEA, Minneapolis, MN, 2016.
Papadopoulos, I.: DNV GL Energy Production Assessment Validation 2019, report no. L2C183006-UKBR-R-01, DNV GL – Energy, Bristol, England, 2019.
Pedersen, H. S. and Langreder, W.: Hack the Error Codes of a Wind Turbine, in: WindEurope 2019, WindEurope, Bilbao, Spain, 2019.
Perry, A.: Cross Validation of Operational Energy Assessments, in: AWEA Wind Resource and Project Energy Assessment Workshop 2017, AWEA, Snowbird, UT, 2017.
Peyre, N.: How can drones improve topography inspections, terrain modelling and energy yield assessment?, in: WindEurope 2019, WindEurope, Bilbao, Spain, 2019.
Poulos, G. S.: Complex Terrain Mesoscale Wind Flow Modeling: Successes, Failures and Practical Advice, in: AWEA Wind Resource and Project Energy Assessment Workshop 2017, AWEA, Snowbird, UT, 2017.
Pram, M.: Analysis of Vestas Turbine Performance, in: AWEA Wind Resource and Project Energy Assessment Workshop 2018, AWEA, Austin, TX, 2018.
Pryor, S. C., Barthelmie, R. J., and Schoof, J. T.: Inter-annual variability of wind indices across Europe, Wind Energy, 9, 27–38, https://doi.org/10.1002/we.178, 2006.
Pullinger, D., Ali, A., Zhang, M., Hill, M., and Crutchley, T.: Improving accuracy of wind resource assessment through feedback loops of operational performance data: a South African case study, in: WindEurope 2019, WindEurope, Bilbao, Spain, 2019.
Randall, G.: Energy Assessment Uncertainty Analysis, in: AWEA Wind Resource and Project Energy Assessment Workshop 2009, AWEA, Minneapolis, MN, 2009.
Redouane, A.: Analysis of pre- and post construction wind farm energy yields with focus on uncertainties, Universität Kassel, Kassel, 2014.
Rezzoug, M.: Innovative system for performance optimization: Independent data to increase AEP and preserve turbine lifetime, in: WindEurope 2019, WindEurope, Bilbao, Spain, 2019.
Rindeskär, E.: Modelling of icing for wind farms in cold climate: A comparison between measured and modelled data for reproducing and predicting ice accretion, Examensarbete vid Institutionen för geovetenskaper, MS thesis, Uppsala University, Disciplinary Domain of Science and Technology, Earth Sciences, Department of Earth Sciences, LUVAL, Uppsala, Sweden, ISSN 1650-6553, 2010.
Robinson, N.: Blockage Effect Update, in: AWEA Wind Resource and Project Energy Assessment Workshop 2019, AWEA, Renton, WA, 2019.
Rogers, A. L., Rogers, J. W., and Manwell, J. F.: Uncertainties in Results of Measure-Correlate-Predict Analyses, in: European Wind Energy Conference 2006, Athens, Greece, p. 10, 2006.
Rogers, T.: Effective Utilization of Remote Sensing, in: AWEA Wind Resource and Project Energy Assessment Workshop 2010, AWEA, Oklahoma City, OK, 2010.
Rogers, T.: Estimating Long-Term Wind Speeds, in: AWEA Wind Resource and Project Energy Assessment Workshop 2011, AWEA, Seattle, WA, 2011.
Sareen, A., Sapre, C. A., and Selig, M. S.: Effects of leading edge erosion on wind turbine blade performance, Wind Energy, 17, 1531–1542, https://doi.org/10.1002/we.1649, 2014.
Schramm, M., Rahimi, H., Stoevesandt, B., and Tangager, K.: The Influence of Eroded Blades on Wind Turbine Performance Using Numerical Simulations, Energies, 10, 1420, https://doi.org/10.3390/en10091420, 2017.
Shihavuddin, A., Chen, X., Fedorov, V., Nymark Christensen, A., Andre Brogaard Riis, N., Branner, K., Bjorholm Dahl, A., and Reinhold Paulsen, R.: Wind Turbine Surface Damage Detection by Deep Learning Aided Drone Inspection Analysis, Energies, 12, 676, https://doi.org/10.3390/en12040676, 2019.
Sieg, C.: Validation Through Variation: Using Pattern of Production to Validate Wind Flow, Wakes, and Uncertainty, in: AWEA Wind Resource and Project Energy Assessment Workshop 2015, AWEA, New Orleans, LA, 2015.
Simon, R. L.: Long-term Inter-annual Resource Variations in California, in: Wind Power, Palm Springs, California, 236–243, 1991.
Slater, J.: Floating lidar uncertainty reduction for use on operational wind farms, in: WindEurope 2019, WindEurope, Bilbao, Spain, 2019.
Slinger, C. W., Harris, M., Ratti, C., Sivamani, G., and Smith, M.: Nacelle lidars for wake detection and waked inflow energy loss estimation, in: WindEurope 2019, WindEurope, Bilbao, Spain, 2019a.
Slinger, C. W., Sivamani, G., Harris, M., Ratti, C., and Smith, M.: Wind yaw misalignment measurements and energy loss projections from a multi-lidar instrumented wind farm, in: WindEurope 2019, WindEurope, Bilbao, Spain, 2019b.
Smith, M., Wylie, S., Woodward, A., and Harris, M.: Turning the Tides on Wind Measurements: The Use of Lidar to Verify the Performance of A Meteorological Mast, in: WindEurope 2016, WindEurope, 2016.
Spalding, T.: Wind Farm Blockage Modeling Summary, in: AWEA Wind Resource and Project Energy Assessment Workshop 2019, AWEA, Renton, WA, 2019.
Spengemann, P. and Borget, V.: Review and analysis of wind farm operational data validation of the predicted energy yield of wind farms based on real energy production data, DEWI Group, Wilhelmshaven, Germany and Lyon, France, 2008.
Spruce, C. J. and Turner, J. K.: Pitch Control for Eliminating Tower Vibration Events on Active Stall Wind Turbines, Surrey, UK, 2006.
Staffell, I. and Green, R.: How does wind farm performance decline with age?, Renew. Energy, 66, 775–786, https://doi.org/10.1016/j.renene.2013.10.041, 2014.
Standish, K., Rimmington, P., Laursen, J., Paulsen, H., and Nielsen, D.: Computational Predictions of Airfoil Roughness Sensitivity, in: 48th AIAA Aerospace Sciences Meeting Including the New Horizons Forum and Aerospace Exposition, American Institute of Aeronautics and Astronautics, Reston, Virigina, 2010.
Stehly, T., Beiter, P., Heimiller, D., and Scott, G.: 2017 Cost of Wind Energy Review, NREL/TP-6A20-72167, National Renewable Energy Laboratory, Golden, CO, 2018.
Stoelinga, M.: A Multi-Project Validation Study of a Time Series-Based Wake Model, in WindEurope 2019, WindEurope, Bilbao, Spain, 2019.
Stoelinga, M. and Hendrickson, M.: A Validation Study of Vaisala's Wind Energy Assessment Methods, Vaisala, Seattle, WA, 2015.
Tchou, J.: Successfully Transitioning Pre-Construction Measurements to Post-Construction Operations, in: AWEA Wind Resource and Project Energy Assessment Workshop 2012, AWEA, Pittsburgh, PA, 2012.
Tindal, A.: Wake modelling and validation, in: AWEA Wind Resource and Project Energy Assessment Workshop 2009, AWEA, Minneapolis, MN, 2009.
Trudel, S.: Icing Losses Estimate Vadliation: From Development To Operation, in: AWEA Wind Resource and Project Energy Assessment Workshop 2016, AWEA, Minneapolis, MN, 2016.
VanLuvanee, D., Rogers, T., Randall, G., Williamson, A., and Miller, T.: Comparison of WAsP, MS-Micro/3, CFD, NWP, and Analytical Methods for Estimating Site-Wide Wind Speeds, in: AWEA Wind Resource and Project Energy Assessment Workshop 2009, AWEA, Minneapolis, MN, 2009.
Veers, P., Dykes, K., Lantz, E., Barth, S., Bottasso, C. L., Carlson, O., Clifton, A., Green, J., Green, P., Holttinen, H., Laird, D., Lehtomäki, V., Lundquist, J. K., Manwell, J., Marquis, M., Meneveau, C., Moriarty, P., Munduate, X., Muskulus, M., Naughton, J., Pao, L., Paquette, J., Peinke, J., Robertson, A., Sanz Rodrigo, J., Sempreviva, A. M., Smith, J. C., Tuohy, A., and Wiser, R.: Grand challenges in the science of wind energy, Science, 366, 6464, https://doi.org/10.1126/science.aau2027, 2019.
Walls, L.: A New Method to Assess Wind Farm Performance and Quantify Model Uncertainty, in: AWEA Wind Resource and Project Energy Assessment Workshop 2018, AWEA, Austin, TX, 2018.
Walter, K.: Wind Assessment: Raw Data to Hub Height Winds, in: AWEA Wind Resource and Project Energy Assessment Workshop 2010, AWEA, Oklahoma City, OK, 2010.
Waskom, M., Botvinnik, O., Ostblom, J., Lukauskas, S., Hobson, P., MaozGelbart, Gemperline, D. C., Augspurger, T., Halchenko, Y., Cole, J. B., Warmenhoven, J., Ruiter, J. de, Pye, C., Hoyer, S., Vanderplas, J., Villalba, S., Kunter, G., Quintero, E., Bachant, P., Martin, M., Meyer, K., Swain, C., Miles, A., Brunner, T., O'Kane, D., Yarkoni, T., Williams, M. L., and Evans, C.: mwaskom/seaborn: v0.10.0, Zenodo, https://doi.org/10.5281/zenodo.3629446, 2020.
White, E.: Continuing Work on Improving Plant Performance Estimates, in: AWEA Wind Resource and Project Energy Assessment Workshop 2008, AWEA, Portland, OR, 2008a.
White, E.: Understanding and Closing the Gap on Plant Performance, in: AWEA WINDPOWER 2008, AWEA, Houston, TX, 2008b.
White, E.: Operational Performance: Closing the Loop on Pre-Construction Estimates, in: AWEA Wind Resource and Project Energy Assessment Workshop 2009, AWEA, Minneapolis, MN, 2009.
Wilcox, B. J., White, E. B., and Maniaci, D. C.: Roughness Sensitivity Comparisons of Wind Turbine Blade Sections, Albuquerque, NM, 2017.
Wilkinson, L., Kay, E., and Lawless, M.: Braced for the Storm? Startling Insights into the Impact of Climate Change on Offshore Wind Operations, in: WindEurope 2019, WindEurope, Bilbao, Spain, 2019.
Wilks, D. S.: Statistical methods in the atmospheric sciences, Academic Press, Amsterdam, the Netherlands, 2011.
Winslow, G.: Secondary Losses: Using Operational Data to Evaluate Losses and Revisit Estimates, in: AWEA Wind Resource and Project Energy Assessment Workshop 2012, AWEA, Pittsburgh, PA, 2012.
Wiser, R., Bolinger, M., Barbose, G., Barghouth, N., Hoen, B., Mills, A., Rand, J., Millstein, D., Jeong, S., Porter, K., Disanti, N., and Oteri, F.: 2018 Wind Technologies Market Report, US Department of Energy, Office of Energy Efficiency & Renewable Energy, Washington, D.C., 2019.
Wolfe, J.: Deep Array Wake Loss in Large Onshore Wind Farms (A Model Validation), in: AWEA Wind Resource and Project Energy Assessment Workshop 2010, AWEA, Oklahoma City, OK, 2010.
Žagar, M.: Wind Resource from an OEM perspective, in: WindEurope 2019, WindEurope, Bilbao, Spain, 2019.
Zhang, M., Pullinger, D., Hill, N., and Crutchley, T.: Validating wind flow model uncertainty using operational data, in: WindEurope 2019, AWEA, Renton, WA, 2019.
- Abstract
- Introduction
- Data and methodology
- P50 prediction bias
- Energy-production loss
- Energy-production uncertainty
- Wind speed uncertainty
- Opportunities for improvements
- Conclusions
- Appendix A
- Appendix B
- Appendix C
- Data availability
- Author contributions
- Competing interests
- Acknowledgements
- Financial support
- Review statement
- References