the Creative Commons Attribution 4.0 License.
the Creative Commons Attribution 4.0 License.
 | 06 Sep 2023
Controller design for model-scale rotors and validation using prescribed motion
Alessandro Fontanella
Elio Daka
Felipe Novais
Marco Belloli
Aerodynamic-load calculation in aero-hydro-servo-elastic modeling tools has been recently validated against experiments for low-frequency platform motions but without considering the capability of active wind turbine controls. This work presents a control design framework that allows for including industry-standard wind turbine control functionalities in a model-scale rotor and its application to a 1:100 scaled version of the International Energy Agency (IEA) 15 MW turbine. Wind tunnel tests with a fixed foundation and steady wind show the scaled turbine reproduces the steady-state rotor speed–blade pitch–thrust–torque characteristics of the IEA 15 MW turbine, confirming the controller design method. Tests with a prescribed platform pitch motion are carried out to assess the turbine response and controller modeling in conditions representative of the normal operation of floating wind turbines. The blade element momentum model of OpenFAST is verified against the experiment, showing aerodynamic thrust and torque are predicted with higher accuracy in the below-rated than the above-rated region: in our simulation, the decrease in thrust oscillation amplitude due to blade pitch actuation is underpredicted. This, combined with uncertainty in modeling the blade pitch actuators, complicates the numerical–experimental simulation of the turbine aerodynamic response in above-rated operation.
- Article
(5328 KB) - Full-text XML
- BibTeX
- EndNote


The control of floating wind turbines has been a topic of research since the introduction of energy from floating wind turbines. The main reason is the infamous negative damping problem due to the use of the variable-pitch control strategy of bottom-fixed turbines (Larsen and Hanson, 2007; van der Veen et al., 2012). Most of the research about the control of floating wind turbines tried to devise new control methodologies to ensure stable operation and reduce fatigue loads for the components of these systems.
The design and verification of control strategies often make use of aero-hydro-servo-elastic modeling tools to assess the response of the floating system. Accuracy of the aerodynamic-load calculation in these tools must be validated to ensure correct modeling of the turbine response. The theme of the validation of aerodynamic-simulation tools for floating wind turbines has recently been the subject of Phase III of the OC6 (Offshore Code Comparison Collaboration, Continued, with Correlation and unCertainty) project, which addressed the case of a large low-frequency platform surge and pitch motion in a scaled wind turbine (Bergua et al., 2023; Cioni et al., 2023). The OC6 project used data from the wind tunnel experiment of Fontanella et al. (2021), where a strategy for active wind turbine control was not considered. The project has shown the aerodynamic response is quasi-static and is correctly captured by codes of different fidelity in the case of low-frequency motion and without active wind turbine control. Instead, additional verification cases run in the OC6 project have shown aerodynamic unsteadiness may take place when sinusoidal variation in rotor speed or blade pitch is combined with surge motion, but no experimental data were available to validate codes in this scenario.
In the last decade, several scale model experiments about the wind–wave response of floating wind turbines have been carried out, and a review of them is presented by Gueydon et al. (2020). The large majority of tests involving a scaled wind turbine and physical wind generation did not use active wind turbine control. The research carried out by the DeepCwind consortium, whose results are summarized by Robertson et al. (2013), investigated the coupled response of three floating wind turbines, but blade pitch and rotor speed were fixed to a constant value (Goupee et al., 2017). Recently, Mendoza et al. (2022) conducted a scale model experiment of a 15 MW floating wind turbine including active control, but, at the time of writing, only preliminary tests with a fixed tower bottom have been used for the validation of offshore modeling tools. Another research effort on this topic is the wave basin experiment of a 10 MW floating wind turbine that was carried out by Madsen et al. (2020). Tests with various wind–wave conditions were compared to two offshore codes by Kim et al. (2023), and the controller used in the simulation study is the same as in the experiment. The code validation study of Kim et al. (2023) addressed the global response of floating wind turbines, with simultaneous modeling of multiple uncertain phenomena as hydrodynamic viscous loads, turbulent wind fields, closed-loop turbine controls, and rotor aerodynamics with large motion. Overall, the two simulation codes that were the object of validation showed good accuracy with respect to experimental results. Yu et al. (2017) tested a collective blade pitch controller system in a wind–wave basin and examined the influence of the turbine controller on the global response of the platform. A small portion of tests have been modeled with an offshore simulation tool, showing good agreement for platform motion at the main wave frequency. However, in the wave-frequency range, platform response is generally driven by linear wave loads, and it is difficult to assess the accuracy of aerodynamic-load modeling.
In parallel to experiments with physical modeling of the wind turbine, a large number of floating systems supporting 5–15 MW turbines have been tested in wave basins using a hybrid approach. This approach models rotor loads with a force actuator whose set point is computed in real time by a numerical model of the turbine and controller. Gueydon et al. (2018) compared hybrid and physical modeling of wind turbine rotor loads for a tension leg platform floating wind turbine. Thys et al. (2021) investigated the coupling between aerodynamics and hydrodynamics of a 12 MW semi-submersible with a hybrid experiment, where aerodynamic loads are computed with a blade element momentum (BEM) model including the turbine controller and applied to the physical model of the platform and tower with a cable robot. Vittori et al. (2022) tested a 10 MW floating wind turbine reproducing the wind turbine rotor and a state-of-the-art variable-speed control strategy with a multi-fan system. Pires et al. (2020) and Fontanella et al. (2020) utilized the multi-fan system to carry out experiments of the DeepCwind 5 MW turbine and to study the influence on the global response of floating wind turbines of two industry-standard control strategies. The hybrid wave basin testing solves the issue related to the downscaling of the controller, but the aerodynamic response of the turbine is reproduced with models that have yet to be validated.
Wind tunnel testing with active control requires control tools for the wind turbine scale model, but there is no consensus or shared practice on how to implement turbine controllers in scale model experiments. Often, controllers of scale model turbines have simplifications with respect to those used in utility-scale machines (e.g., Reference OpenSource Controller, ROSCO, Abbas et al., 2022b; Technical University of Denmark Wind Energy Controller, DTUWEC, Meng et al., 2020). The purpose of this work is to design a closed-loop controller for a scale model wind turbine with an ad hoc control development framework. The controller has industry-standard functionalities, and, once integrated with the aerodynamic design of the scaled rotor, it allows for replicating the aerodynamic-load response of a full-scale machine in the wind tunnel. Wind tunnel experiments are conducted with the controlled scale model to measure the aerodynamic response with a fixed foundation and with a prescribed low-frequency platform pitch mimicking a floating wind turbine. The turbine in the experiment and its controller are modeled in the offshore simulation tool OpenFAST, and simulations are compared to measurements to identify possible sources of uncertainty in the aero-servo-dynamic response of the scaled wind turbine.
The expected impact of this work is to provide guidance on how to integrate active wind turbine controls into scale model testing using physical wind. The numerical–experimental study using prescribed platform pitch motion verifies the prediction capability of OpenFAST with respect to aerodynamic loading in the presence of active wind turbine control. Data collected in the experiment, as well as the OpenFAST model of the validation study, are shared with the community to promote studies about the control of floating wind turbines. The dataset of the experiment and the OpenFAST model can be used for further validation; the ROSCO controller, which has been implemented in Simulink, can be used not only in future scale model experiments but also in control studies for utility-scale turbines.
The structure of this article is as follows. Section 2 describes the wind turbine scale model and the experimental setup of the wind tunnel experiment. Section 3 outlines the wind turbine control strategy and the algorithm we followed to downscale the controller and implement it in the wind turbine scale model. Section 4 presents the methodology we used to investigate the turbine response and verify the controller design procedure. The article is concluded in Sect. 6.
The experimental setup is shown in Fig. 1. It consists of a wind turbine scale model (WTM), which is mounted on top of a robotic platform with 6 degrees of freedom. Testing is conducted in the atmospheric boundary layer test section of the Politecnico di Milano wind tunnel, which is 13.84 m wide, 3.84 m high, and 35 m long. The wind turbine is placed 20 m downstream the test section inlet. Tests were performed without roughness elements or turbulence generators for a constant inflow velocity and turbulence intensity of 2 %.
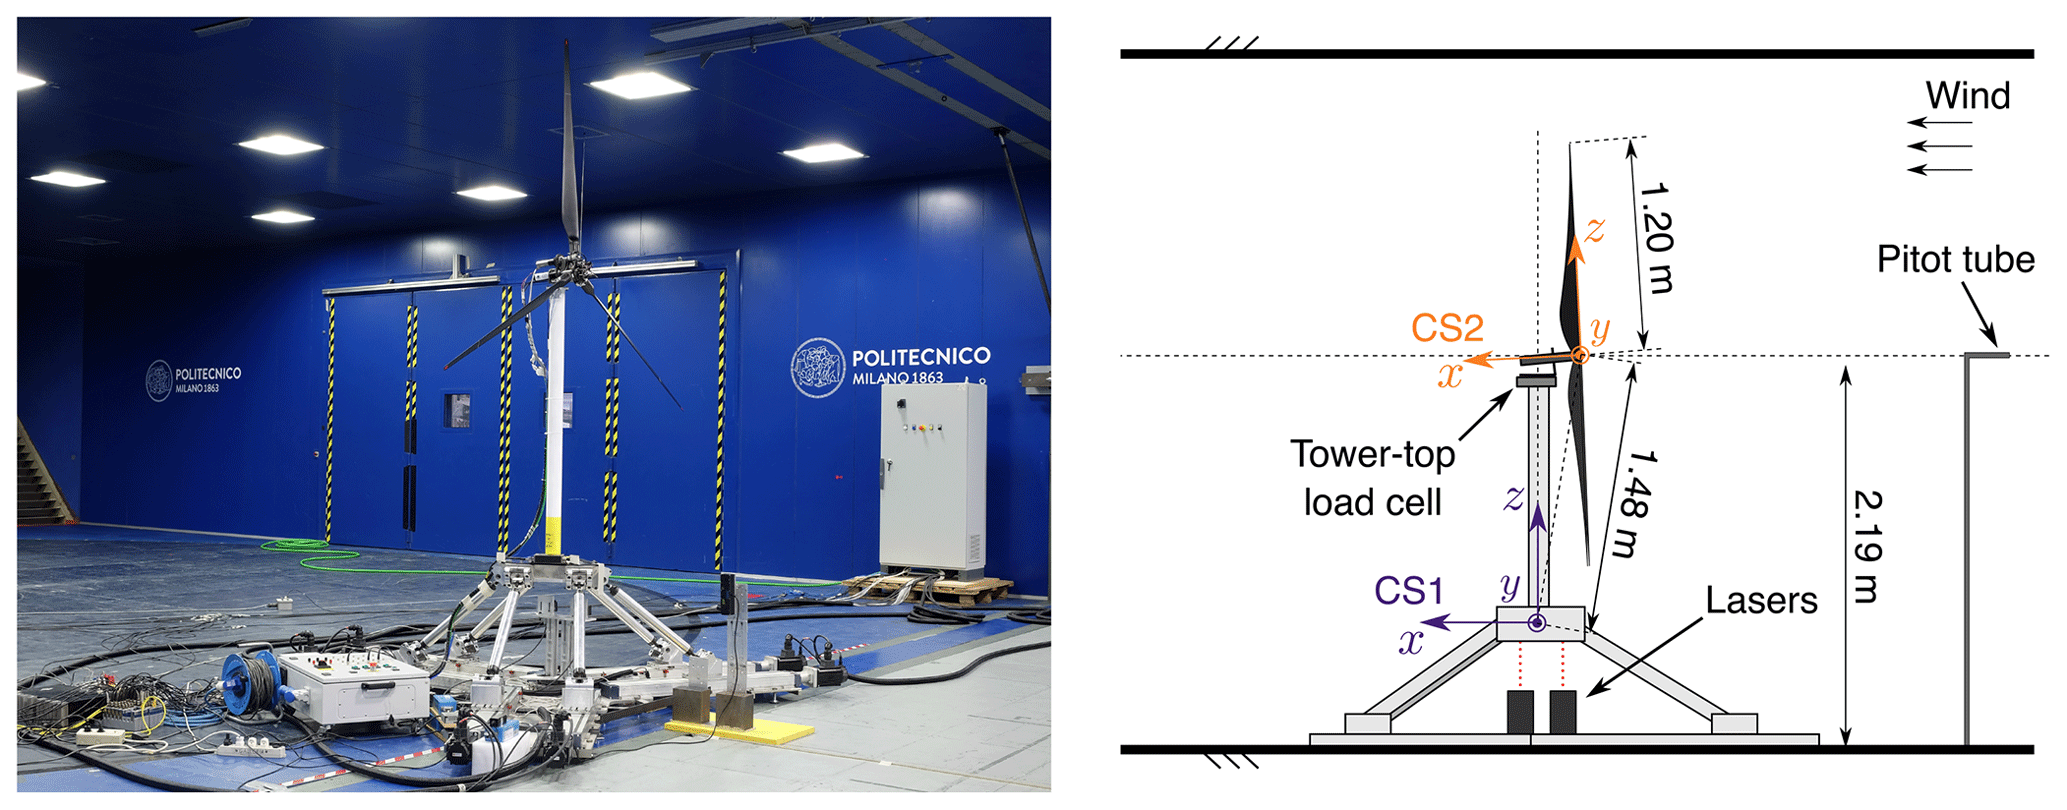
Figure 1Experimental setup in the Politecnico di Milano (POLIMI) wind tunnel. “CS1” and “CS2” are respectively the coordinate systems for platform motion and rotor forces.
2.1 Wind turbine aero-servo-dynamic design
The wind turbine of the experiment is a scaled version of the International Energy Agency (IEA) 15 MW turbine (Gaertner et al., 2020). It was designed to reproduce the aerodynamic response of the full-scale turbine with wind speed reduced by a factor of .
The aim of rotor aerodynamic design is to replicate the blade normal force of the IEA 15 MW turbine with a design tip-speed ratio (TSR) of 9 and blade pitch (β) of 0∘. The main difficulty in achieving this goal is the Reynolds number, which is 350 times lower than for the full-scale turbine. The blade design uses the SD7032 airfoil, which has suitable lift and lift-to-drag characteristics at Reynolds numbers expected for the turbine scale model (i.e., lower than 250 000). The blade chord and twist distributions are altered, section by section, to have the lift force and the variation in lift force with an angle of attack of the IEA 15 MW turbine.
The wind turbine has active generator control and individual blade pitch control. The generator is a Maxon EC-4pole 30 brushless DC motor with a Maxon GP32HP planetary gearbox, with a ratio of 21. Generator speed is measured with the ENC 16 EASY encoder at 500 pulses per turn, and this signal is the main feedback for closed-loop control of the turbine scale model. The generator high-speed shaft is connected to the rotor low-speed shaft with a toothed belt with a ratio of 2; the total transmission ratio is τg=42, and the transmission efficiency is ηg=73.5 %. The electric motor is driven by a Maxon ESCON 70/10 controller, and it functions as a generator with a variable torque set point that is computed by the variable-speed control strategy of the turbine controller. The tower is an aluminum tube with a 75 mm diameter, and the fore-aft mode is at 9.5 Hz (corresponding to 0.33 Hz at full scale).
The wind turbine has individual Harmonic Drive RSF-5 B-30-E 050-C blade pitch actuators housed inside the hub. Each pitch actuator is controlled by a Maxon EPOS 24/2 drive mounted on the turbine hub. Power and blade pitch set points are transmitted to individual pitch motors with a 30-channel slip ring. The wind turbine controller computes generator torque and collective blade pitch set points for the actuators based on generator speed and wind speed measurements. It runs on a National Instruments PXI embedded control system by means of the VeriStand interface.
The main properties of the turbine model are summarized in Table 1.
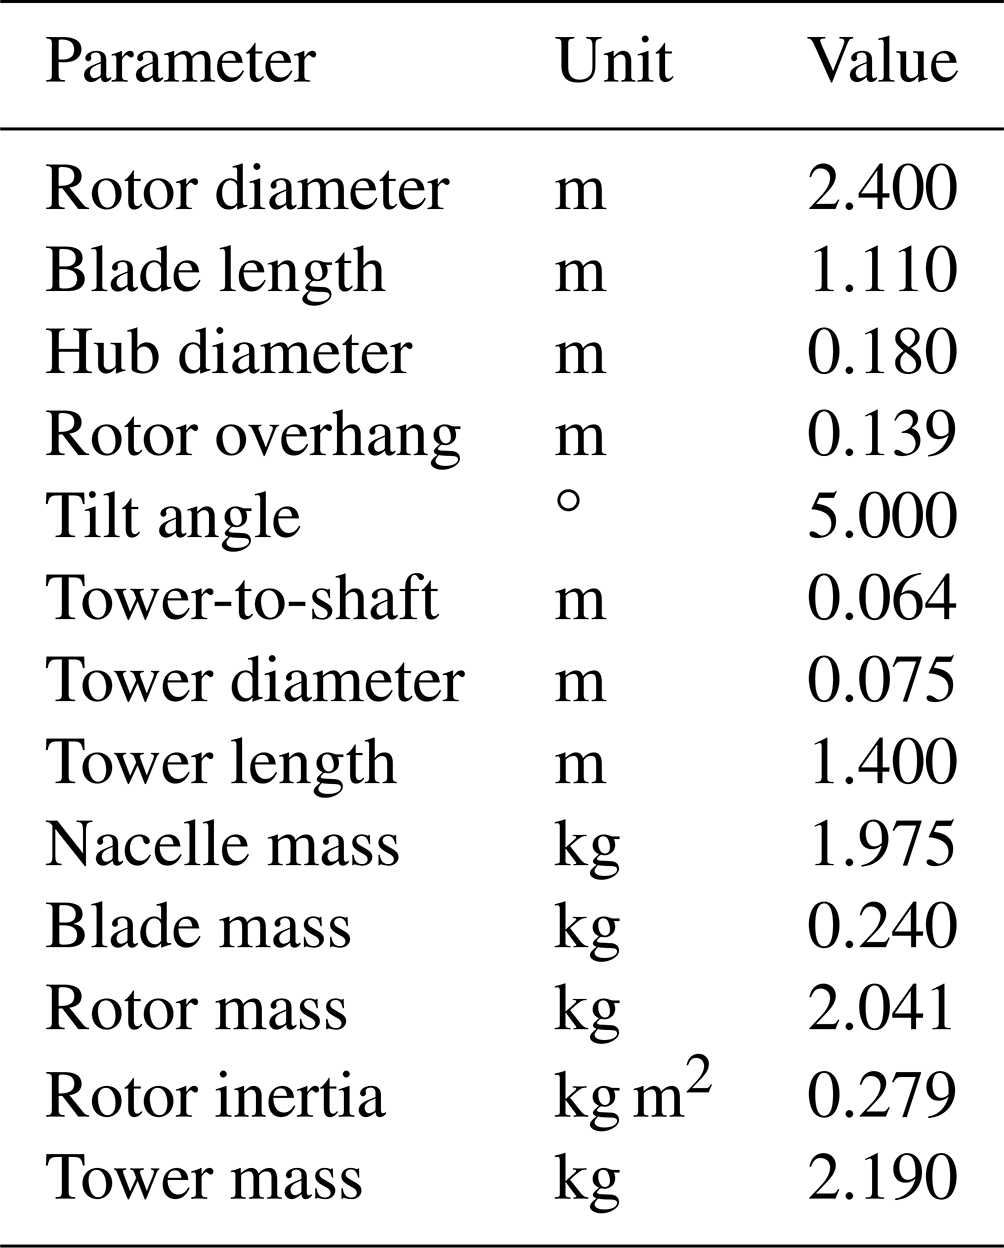
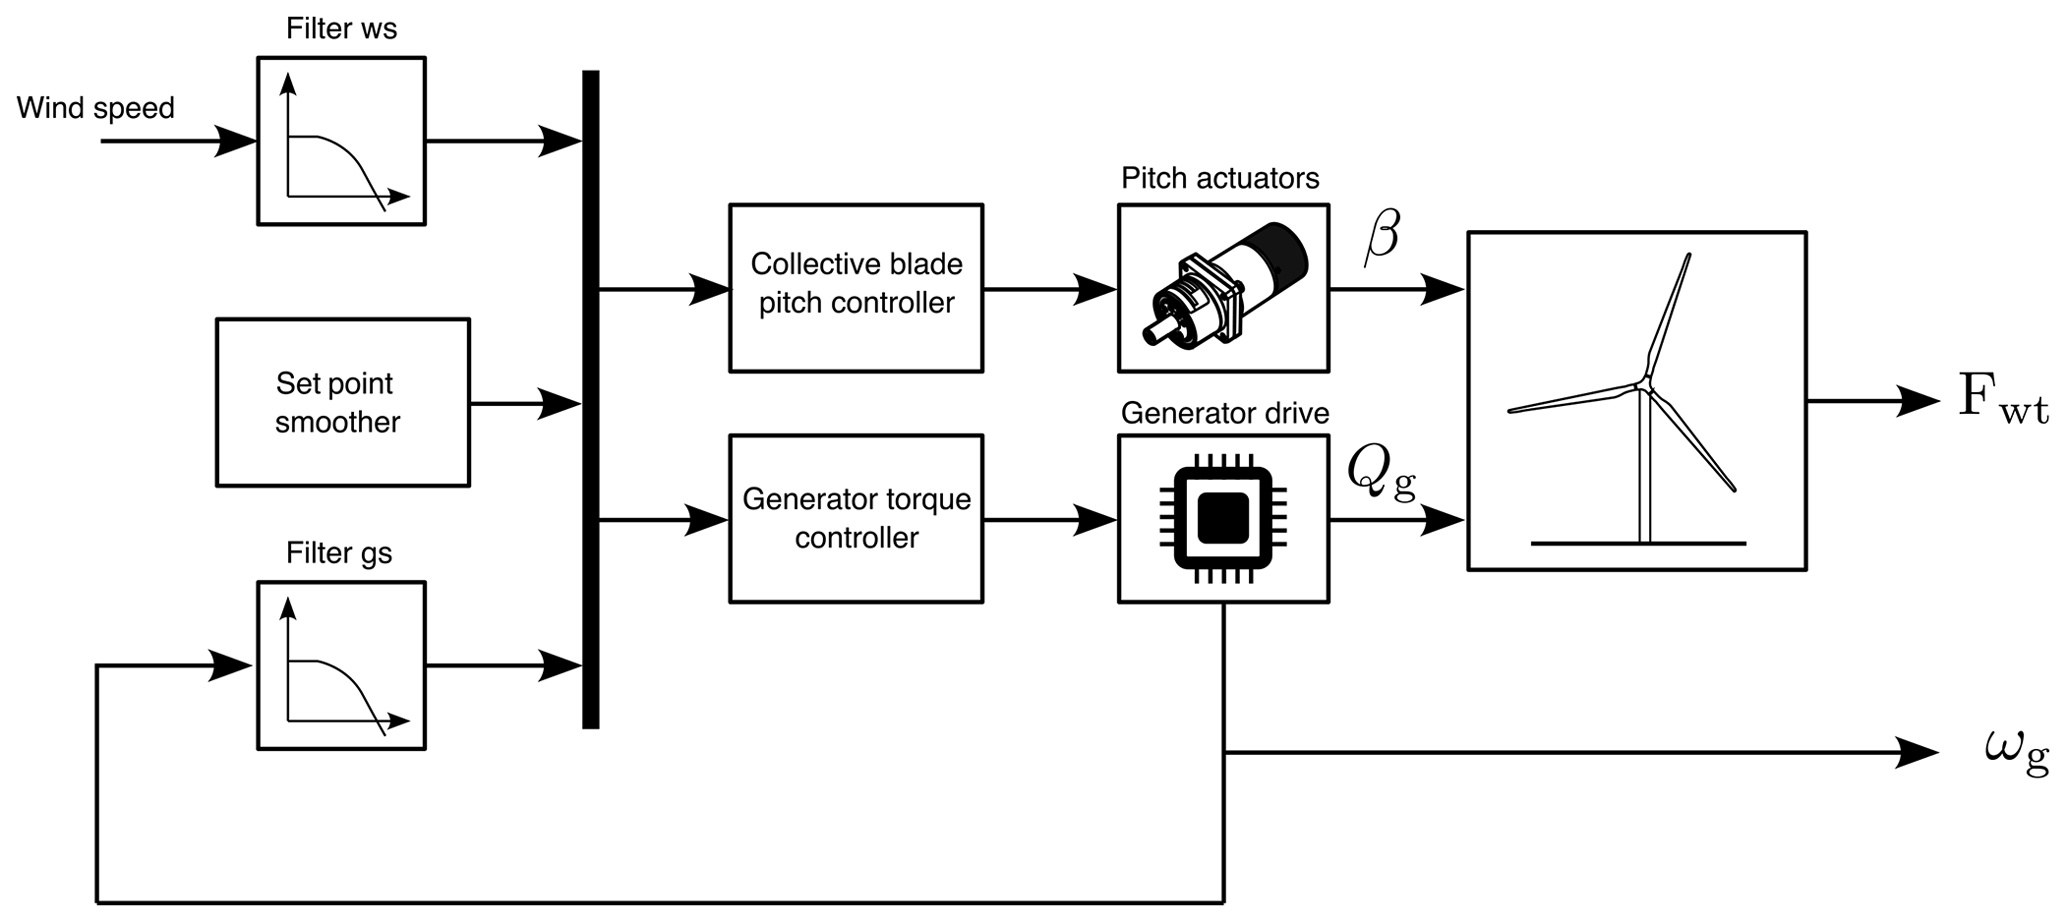
Figure 2Block diagram showing the ROSCO structure and how it is integrated with the wind turbine scale model. The generator torque controller and collective blade pitch controller are based on the PI controller of Eq. (1), “Filter ws” is the low-pass filter for wind speed, “Filter gs” is the low-pass filter for generator speed, ωg is the generator speed signal from the generator encoder, Fwt is the six-component force measured by the tower-top load cell, Qg is the generator torque, and β is the collective blade pitch.
2.2 Measurements
Quantities measured in the experiment are rotor forces, platform motion, current generator speed, the collective blade pitch set point, and hub-height wind speed. Six-component forces at the tower–nacelle interface are measured with an ATI Mini45 load cell with SI-580-20 calibration. Rotor loads are obtained from the projection in the CS2 reference frame of tower-top loads. Platform pitch motion is measured with two MEL M5L/50 lasers placed beneath the robotic platform. Measurement of the undisturbed wind velocity is obtained with a pitot tube placed at the centerline, at the hub height, and 7.15 m upstream of the rotor. Generator speed is measured with the generator encoder, and this quantity is read as an output of the generator drive. Measurement of the current blade pitch angle is not available and is replaced with the collective blade pitch set point. All measurements are acquired simultaneously with an NI digital acquisition (DAQ) system with a sampling frequency of 2000 Hz.
The wind turbine controller computes generator torque and collective blade pitch set points based on generator speed and wind speed measurements. It uses the ROSCO algorithms introduced by Abbas et al. (2022b) and distributed as a dynamic-link library (DLL) and Fortran source code by Abbas et al. (2022a). In this project, ROSCO has been implemented in MATLAB Simulink, and the same controller implementation is adopted for the experiment and co-simulation with OpenFAST.
The logic of ROSCO implemented in the scaled wind turbine is shown in Fig. 2. It has two main modules: a generator torque controller, controlling generator torque below the rated wind speed to achieve maximum wind-power conversion efficiency, and a collective blade pitch controller, controlling aerodynamic torque above the rated wind speed to limit the extracted power to its nominal value.
The generator torque and blade pitch controllers are proportional–integral (PI) controllers with the following generic structure:
where y is the control input, either generator torque (y=g) or collective blade pitch (y=β), kP,y and kI,y are the proportional and integral gains, ωg is generator speed, and ωg,s is the generator speed set point.
Below the rated wind speed, the blade pitch is held constant to the design value of 0∘ and generator torque is controlled to track a constant TSR set point of λ0=9 to achieve the maximum power coefficient. In scale model testing, closed-loop TSR tracking is preferred over the more traditional kω2 law, also available in ROSCO, because kω2 control does not take into account Reynolds number dependency of aerodynamic torque, which occurs in small-scale turbines (Fontanella et al., 2023a). With TSR tracking,
where R is the rotor radius and is the rotor-effective wind speed. In general, this is obtained by means of a wind speed estimator, but in this case it is measured with the hub-height pitot tube upstream of the turbine model. Generator speed is filtered with a second-order low-pass filter, and wind speed is filtered with a first-order low-pass filter.
When the turbine is in above-rated operation, generator torque is held constant:
where P0 is the turbine rated rotor power and ωr,0 is the rated rotor speed. The collective blade pitch is computed with a PI controller as in Eq. (1), where the set point is .
When the wind turbine works near the rated wind speed, the set point for the generator torque and the collective blade pitch controllers is the same (i.e., ). This would lead the controllers to conflict with each other with unwanted oscillations in the turbine response. To avoid this conflict, the set point smoothing algorithm of Abbas et al. (2022b) is used, which progressively lowers the generator speed set point of one of the two controllers in order to smoothly transition from one operating regime to the other. Advanced control functionalities available in ROSCO (Abbas et al., 2022a), such as peak shaving or minimum pitch schedule, are implemented in the MATLAB Simulink version of the controller, but they are not used in this study.
3.1 Scaling of the wind turbine controller
In the experiment, the wind turbine controller is run at model scale. This approach takes a different approach with respect to when the turbine controller is run in real time in its full-scale version with scaling of input and output signals (e.g., in the work of Mendoza et al., 2022). In Appendix B we prove the full-scale approach does not respect the time scaling.
The controller scaling seeks to (1) use the same algorithm of the full-scale turbine controller and (2) replicate the aero-servo-dynamic response of the IEA 15 MW turbine rotor at model scale given the aerodynamic and structural properties of the wind turbine scale model. The tuning procedure is model based; dynamics of pitch and generator actuators are neglected. The wind turbine is modeled as a system with a single degree of freedom, corresponding to the rotor–generator, whose equation of motion is
where is the total inertia of the rotor and generator and Qa is the rotor aerodynamic torque. The aerodynamic torque is
where ρ is air density and CQ is the torque coefficient. CQ is assumed to be a function of rotor speed, collective blade pitch, and wind speed U. The expression of Qa in Eq. (5) is linearized to obtain a linear model of the wind turbine once it is inserted in Eq. (4):
where (⋅)0 denotes the steady-state value of a quantity for a given turbine operating point. In a more compact form, this is
where KωQ, KβQ, and KUQ are the aerodynamic-torque sensitivities with respect to rotor speed, collective blade pitch, and wind speed and , , and are the perturbations of rotor speed, blade pitch, and wind speed.
Below, we detail the scaling of the controller for the below-rated and above-rated regions.
3.1.1 Below-rated operation
In below-rated operation, blade pitch is fixed () and wind speed is assumed to be constant (); thus combining Eq. (4) with Eq. (1), we have
where θr is the rotor azimuth. Gains of the TSR-tracking controller are computed from Eq. (8):
where (⋅)sm denotes WTM quantities at model scale, rad s−1, and h=0.85. In below-rated wind speeds KωQ is about constant; thus we have a single value for kP,g and kI,g. Gains of the generator torque controller for the WTM are N m rad−1 s−1, instead of N m rad−1 s−1 for the scaled IEA 15 MW turbine and N m rad−1 instead of N m rad−1.
The set point of the TSR-tracking controller is computed with Eq. (2).
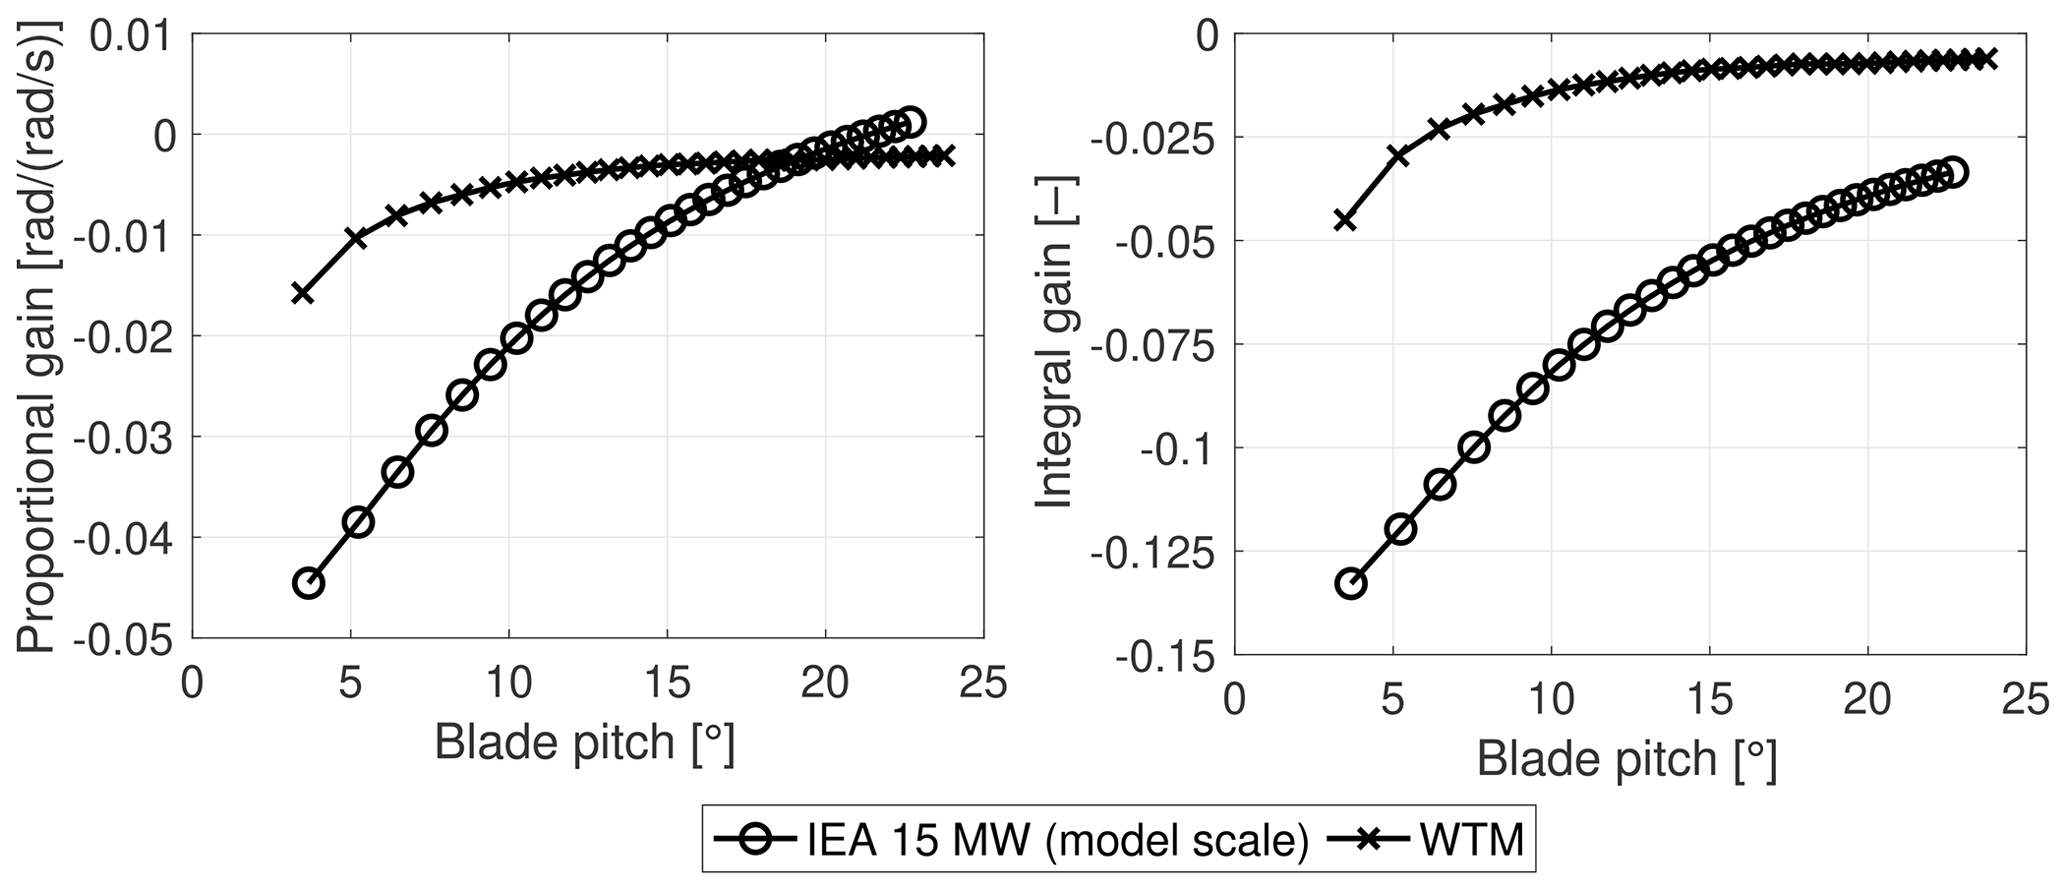
Figure 3Proportional and integral gains for the collective blade pitch controller of the IEA 15 MW turbine (at model scale) and the wind turbine scale model (WTM) as a function of collective blade pitch, which is used for scheduling.
3.1.2 Above-rated operation
Above the rated wind speed, generator torque is constant (), and assuming constant wind speed, Eq. (4) becomes
In above-rated operation, aerodynamic sensitivities KωQ and KβQ depend on wind speed. Gains of the collective pitch controller are computed for discrete wind speeds from “rated” to “cut-out” by means of the following procedure.
-
We compute the closed-loop frequency and damping ratio of the IEA 15 MW turbine at wind speed U0 as
where denotes full-scale quantities, which are evaluated at the operating point identified by U0.
-
The closed-loop frequency and damping of the WTM are computed by dimensionally scaling those of the IEA 15 MW turbine as
where denotes model-scale quantities, which are evaluated at the operating point identified by wind speed U0λv.
-
Gains for the WTM are
Equations (16) and (17) result in the gain schedule for the pitch controller, where the scheduling variable is wind speed. However, since each wind speed corresponds to a steady-state value of collective blade pitch, this is used as the scheduling variable (i.e., U0λv is replaced with β0). In the WTM there is no feedback of the current pitch angle, and it is replaced with the pitch angle set point at a previous time step.
Pitch controller gains for the WTM are compared, at model scale, to those of the IEA 15 MW turbine in Fig. 3. Gains for the WTM are significantly different than values obtained by scaling gains of the IEA 15 MW turbine; the main reason for this difference is rotor inertia, which is larger for the scale model (0.279 kg m2) compared to the scaled value of the IEA 15 MW turbine (0.031 kg m2). Aerodynamic sensitivities for the WTM are instead close to those of the reference wind turbine (see Fig. 7).
The generator torque set point is computed with Eq. (3), where the generator speed set point is
The turbine response and the controller scaling are verified with two sets of tests. The steady-state wind speed–rotor speed–blade pitch–thrust–torque characteristics are assessed by running the wind turbine with steady wind and a fixed tower bottom. The aero-servo-dynamic response is studied with prescribed platform pitch motion.
In the experiment, aerodynamic loads are calculated from tower-top load measurements and are compared to the following two numerical models of the scaled turbine.
-
An OpenFAST model with generator torque and blade pitch controlled with ROSCO. This model is used to study the coupled aero-servo-dynamic response of the wind turbine.
-
The stand-alone AeroDyn model with prescribed platform pitch motion, rotor speed, and blade pitch. Simulations with this tool are used to assess the aerodynamic-load calculations of the aerodynamic module of OpenFAST without including the additional complexity of the closed-loop turbine controller.
This section summarizes the operating conditions and the platform motion of the experiment, explains the algorithm we used to estimate aerodynamic loads from tower-top forces, and provides a description of the modeling approach adopted in OpenFAST.
4.1 Wind turbine operating conditions and platform motion
The wind turbine in a bottom-fixed configuration is run at several wind speeds ranging from 2.5 to 5.8 m s−1 to measure the steady-state response of rotor torque and thrust, rotor speed, and collective blade pitch.
Two operating conditions are selected for tests with platform motion, corresponding to wind speeds of 2.87 and 5.05 m s−1. The imposed motion emulates large-amplitude platform tilt oscillations in floating wind turbines. Motion is in the pitch direction (θ), i.e., the rotation about the y axis of the CS1 reference frame (see Fig. 1), and is sinusoidal:
where Am is motion amplitude and fm is motion frequency. Rotor-level unsteadiness, due to the global response of the rotor and its wake, is often associated with the rotor reduced frequency fr defined as
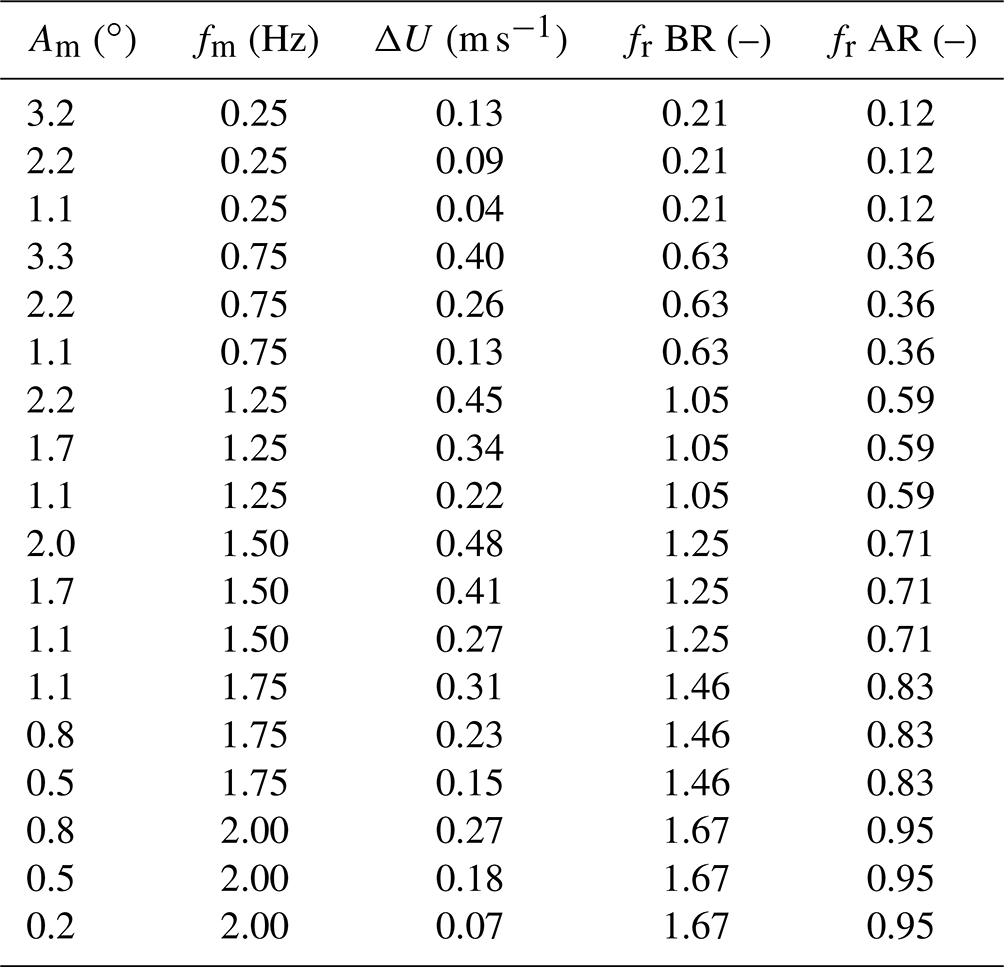
where D is rotor diameter. Several combinations of Am and fm are run in the experiment to explore the turbine aerodynamic response at various values of fr and with different amplitudes of oscillations of apparent wind speed ΔU=2πfmAm. Motion conditions are summarized in Table 2. Tests with prescribed platform motion are carried out not only with the turbine controlled with ROSCO but also with fixed rotor speed and blade pitch.
Table 2Motion conditions (Am is amplitude of pitch motion, fm is frequency, ΔU is the apparent wind speed at hub height, fr BR is the reduced frequency with below-rated wind of 2.87 m s−1, fr AR is the reduced frequency with above-rated wind of 5.05 m s−1).
4.2 Estimation of rotor aerodynamic loads
A measurement of aerodynamic loads is not available in the experiment; thus aerodynamic thrust and torque are estimated from measurements of tower-top loads, which are processed to remove the force contribution due to inertia and weight of the rotor–nacelle assembly. For every motion condition, two tests are run where the same type of motion (amplitude and frequency) is prescribed to the wind turbine: in one test there is no wind, the rotor is fixed, and loads measured by the load cell are mostly due to inertia and weight (we assume the contribution due to air drag on the turbine components is negligible); in the test with wind, the load cell measures inertia, weight, and aerodynamic forces. Time series acquired in the two tests are grouped so they have the same integer number of motion periods; time series of forces in the test with no wind are subtracted from time series of forces in the test with wind, after being projected from CS1 to CS2, obtaining the aerodynamic loads. This procedure for estimating aerodynamic forces is reliable when dynamic amplification due to flexibility is negligible (Fontanella et al., 2021), i.e., when the frequency of motion is significantly lower than the first flexible mode of the wind turbine (in our case it is the fore-aft mode at 9.5 Hz, and the maximum fm is 2 Hz).
Rotor speed is regulated by the wind turbine controller, and, in general, when the turbine operates in unsteady conditions, rotor speed is not constant and the inertia torque due to rotor acceleration is present in the load cell measurements. With sinusoidal platform motion, rotor speed oscillations are dominated by the harmonic component at the motion frequency, as is shown in Fig. 4. Rotor speed oscillations at frequencies other than fm are regarded as noise. Aerodynamic torque is computed by removing the torque component due to rotor inertia from Mx in CS2:
where Aω and ϕω are the amplitude and phase of the rotor speed spectrum.
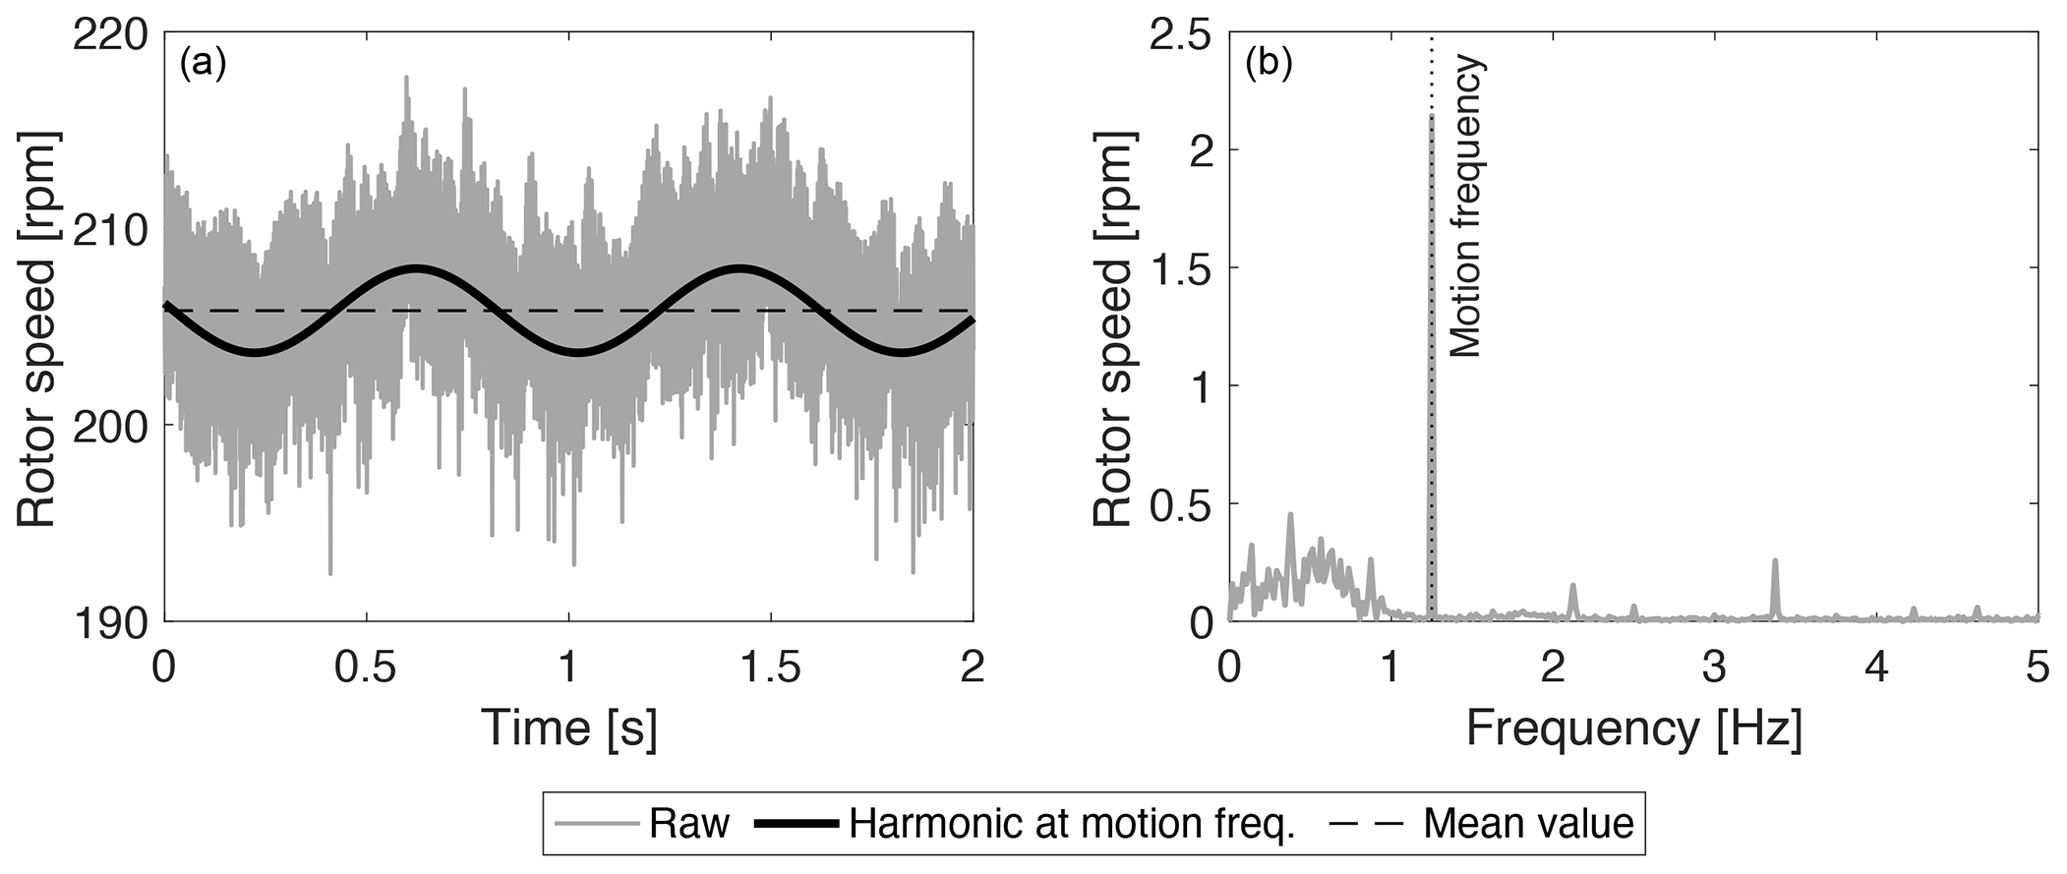
Figure 4Rotor speed with prescribed platform pitch motion of fm=1.25 Hz and Am=2.2∘. (a) Time series, (b) spectrum.
4.3 OpenFAST model
An aero-servo-elastic model of the wind turbine of the experiment is created in OpenFAST. Blades and towers are modeled as rigid bodies. A damped oscillator is introduced at the base of the wind turbine, and external forces are applied to it to prescribe the platform motion of the experiment. The aerodynamic model is implemented in AeroDyn v15 based on blade twist and chord radial distributions and Reynolds-number-dependent polars at 38 radial stations. Calculation of induced velocity in the AeroDyn BEM model is based on the wake equilibrium assumption (steady BEM model) or on a dynamic wake (dynamic BEM model). The airfoil model accounts for flow hysteresis during attached flow and dynamic stall.
The wind turbine controller is the same Simulink controller as in the experiment, which is run in co-simulation with OpenFAST. Pitch actuators are modeled as third-order systems of the following transfer function:
Coefficients of Gact(s) are obtained by means of system identification carried out on the WTM before wind tunnel testing. In the frequency range of imposed motion tests, Gact(s) introduces a constant time delay of 0.075 s (i.e., phase is linear with frequency) and unit amplification.
This section presents results about the wind turbine response from experimental measurements and numerical simulations. The experiment and simulation are compared to identify differences in the modeling of the aero-servo-dynamic response of the wind turbine. The Results section is organized as follows.
-
We verify the steady-state response of rotor speed–blade pitch–thrust–torque characteristics of the turbine controlled with ROSCO. In this step, we check the scaling of set points and the capability of the aero-servo design of the WTM to replicate the IEA 15 MW turbine at a small scale.
-
We examine the steady-state rotor performance coefficients, which are at the base of the linearized aerodynamic model of Sect. 3.1, which is the tool used to downscale the wind turbine controller. In particular, the wind turbine controller scaling uses the OpenFAST CP as a proxy for the experimental CP; thus we check the consistency of the two.
-
We analyze the closed-loop response with unsteady inflow created by platform pitch motion. In detail, we first verify the prediction of the stand-alone aerodynamic model of OpenFAST with prescribed rotor speed oscillations and blade pitch variations; then, we compare the experiment with the OpenFAST model to understand how discrepancies in the modeling of aerodynamics and wind turbine actuation influence the closed-loop response.
5.1 Fixed-turbine response
The response of the WTM controlled with ROSCO is measured at six wind speeds. Figure 5 shows the operating points obtained in the wind tunnel which are compared, at model scale, to the OpenFAST model of the WTM and to the IEA 15 MW turbine.
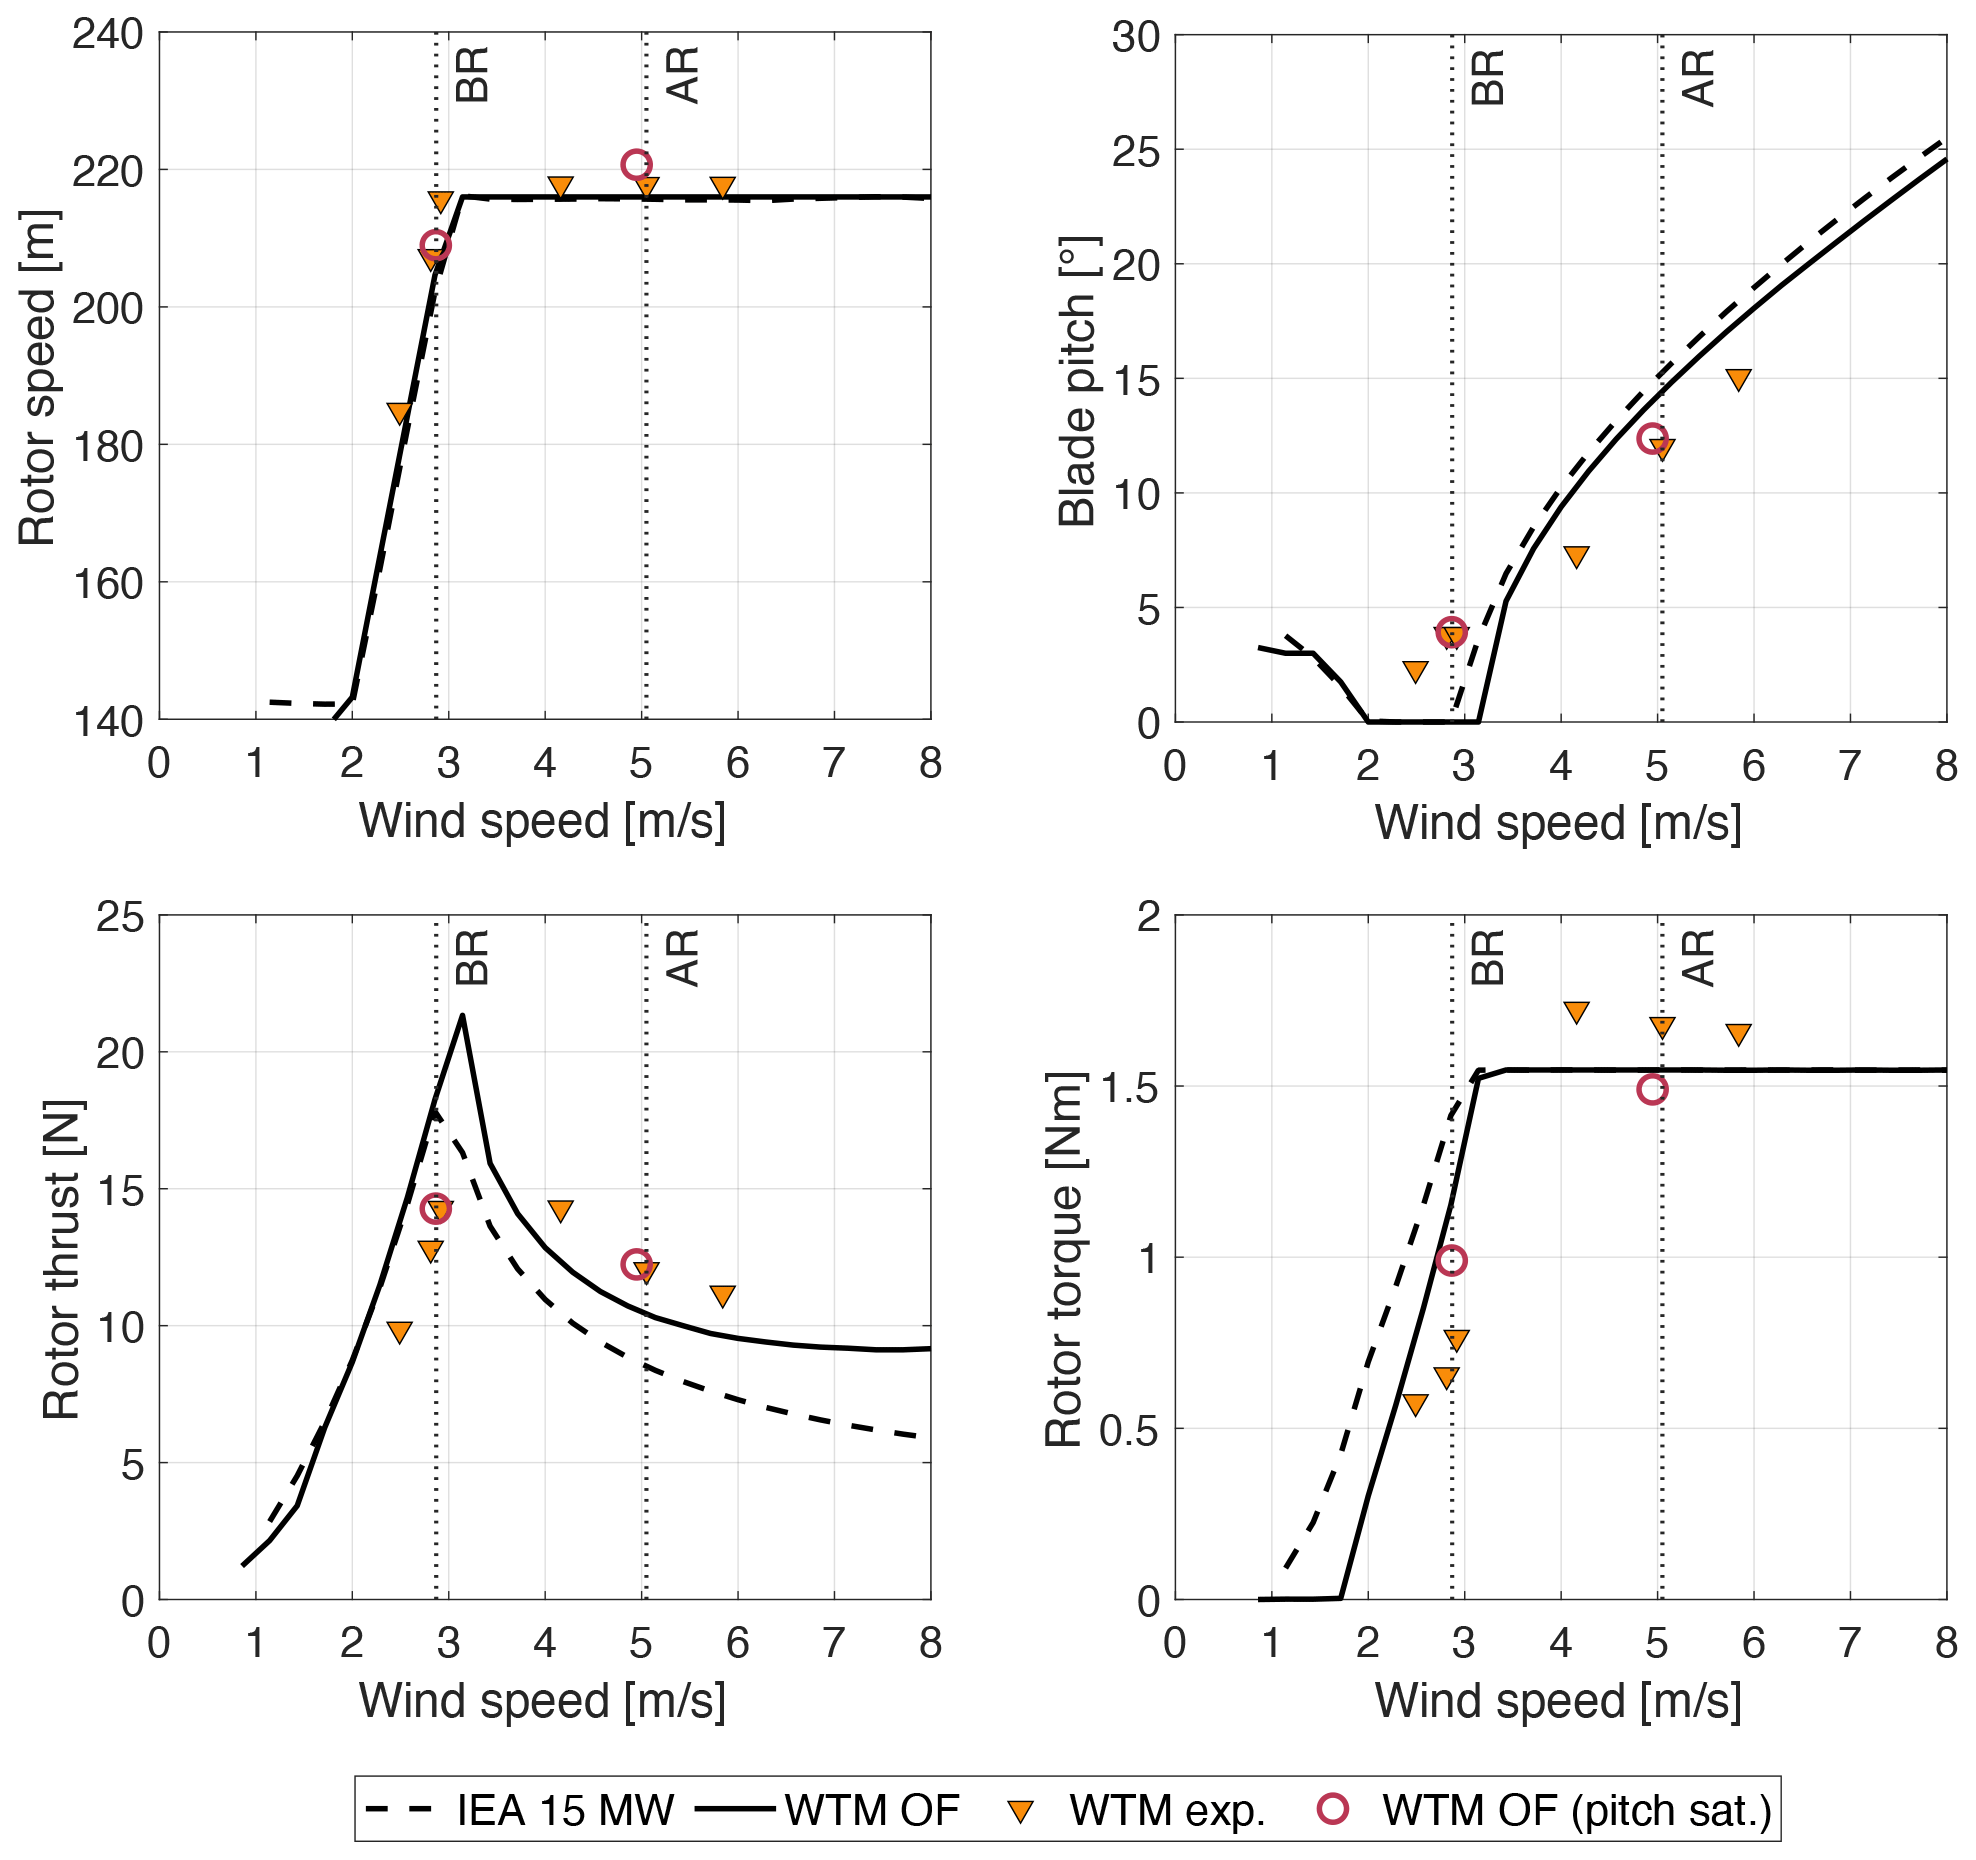
Figure 5Steady-state operating points for the wind turbine scale model (WTM) obtained in the wind tunnel experiment (exp.) and from the OpenFAST model (OF) are compared to the IEA 15 MW turbine at model scale. Vertical dotted lines identify the below-rated (BR) and above-rated (AR) operating conditions considered for tests with platform motion. In “WTM OF (pitch sat.)” the minimum pitch in ROSCO is set to the BR pitch of the experiment to simulate the blade pitch offset.
The OpenFAST model of the WTM is perfectly aligned with the IEA 15 MW turbine, whereas rotor speed in the experiment is slightly higher (the maximum error is 10.5 rpm at 2.9 m s−1). The discrepancy in the experiment can be due to a small static offset in the generator speed feedback and/or in the wind speed measurement used for calculation of the generator speed set point in the TSR-tracking controller. In below-rated wind speeds, collective blade pitch is 2.3∘ instead of 0∘, and this is likely due to misalignment of individual blades and/or incorrectly setting the zero-pitch position. In above-rated wind speeds, the rated rotor speed is achieved with values of the blade pitch that have an offset of about −3.5∘ with respect to the IEA 15 MW turbine.
The scale model rotor is designed to match the thrust force of the IEA 15 MW turbine when TSR = 9 and β=0∘. In below-rated operation, the thrust force in the experiment is lower than the IEA 15 MW turbine due to the blade pitch offset; instead, in OpenFAST, where the blade pitch is 0∘, the thrust force is aligned to the one of the IEA 15 MW turbine. Blades misalignment is a well-known problem for model wind turbines: its impact on wind turbine performance and thrust is also investigated by Jüchter et al. (2022), who propose to reduce it with a new blade-mounting procedure.
The torque in OpenFAST is lower than the IEA 15 MW turbine for all wind speeds. This is due to the lower efficiency of the SD7032 compared to full-scale airfoils. In the experiment, torque is higher than the rated value for the IEA 15 MW turbine; the cause of this error can be the torque set point obtained with Eq. (3), which requires knowledge of the transmission efficiency, and is hard to characterize. Rotor thrust has the same trend in the experiment and in the WTM OpenFAST model, but wind tunnel values are higher than in simulations. The difference is attributed to the blade pitch offset that is present in the experiment.
The minimum blade pitch of ROSCO in the WTM OpenFAST model is increased to the collective pitch of the experiment to simulate the blade's pitch offset. This model is simulated in the two wind conditions considered in the tests with platform movement, and results are closer to those of the experiment. The largest difference is seen for rotor torque in the below-rated condition, which is 29 % higher in OpenFAST compared to the experiment. This difference is attributed to airfoil efficiency, which is higher in the OpenFAST model, which is based on polars measured on a 2D airfoil (Fontanella et al., 2021), than in the 3D rotor, and it can be due to manufacturing imperfections or unpredicted variations in aerodynamic characteristics that may occur at low Reynolds numbers. The primary function of wind turbine controllers like ROSCO is to regulate power; thus any difference in airfoil efficiency changes the operating points of the wind turbine, making it difficult to reproduce the experiment with a numerical simulation tool for validation tasks. Matching between OpenFAST and the experiment can be improved, estimating polars based on experimental data, for example by means of the methodology proposed by Bottasso et al. (2014).
5.2 Performance coefficients and linearized aerodynamic response
Power and thrust coefficients of the wind turbine scale model are measured for various combinations of TSR and blade pitch angle. The wind speed is 4 m s−1 in all tests, and the TSR is varied by changing rotor speed. The same conditions of the experiment are simulated with the OpenFAST model of the WTM, and results of wind tunnel measurements and simulations are compared in Fig. 5. The maximum CP in OpenFAST is 0.42 with a TSR of close to 9 and β of 0∘, whereas the maximum CP in the experiment is 0.44, with a TSR of near 9.5 and β of 0∘. The transition from maximum CP to 0 is milder in OpenFAST than in the experiment, where more combinations of TSR and β have CP≈0; this can be due to the efficiency of the blade that in conditions far from the steady-state characteristic of the turbine is lower in the wind tunnel than in OpenFAST, as already seen in Fig. 5. At TSR = 9, CT=0.8 in OpenFAST, whereas in the wind tunnel CT=1. The higher values of CP and CT measured in the wind tunnel are likely due to blockage (Robertson et al., 2023). Despite the low Reynolds numbers and the presence of blockage, the performance of the wind turbine model at its optimal operating point and the shape of the CP and CT curves are very close to the IEA 15 MW turbine, and this makes the model sufficiently representative of the full-scale turbine.
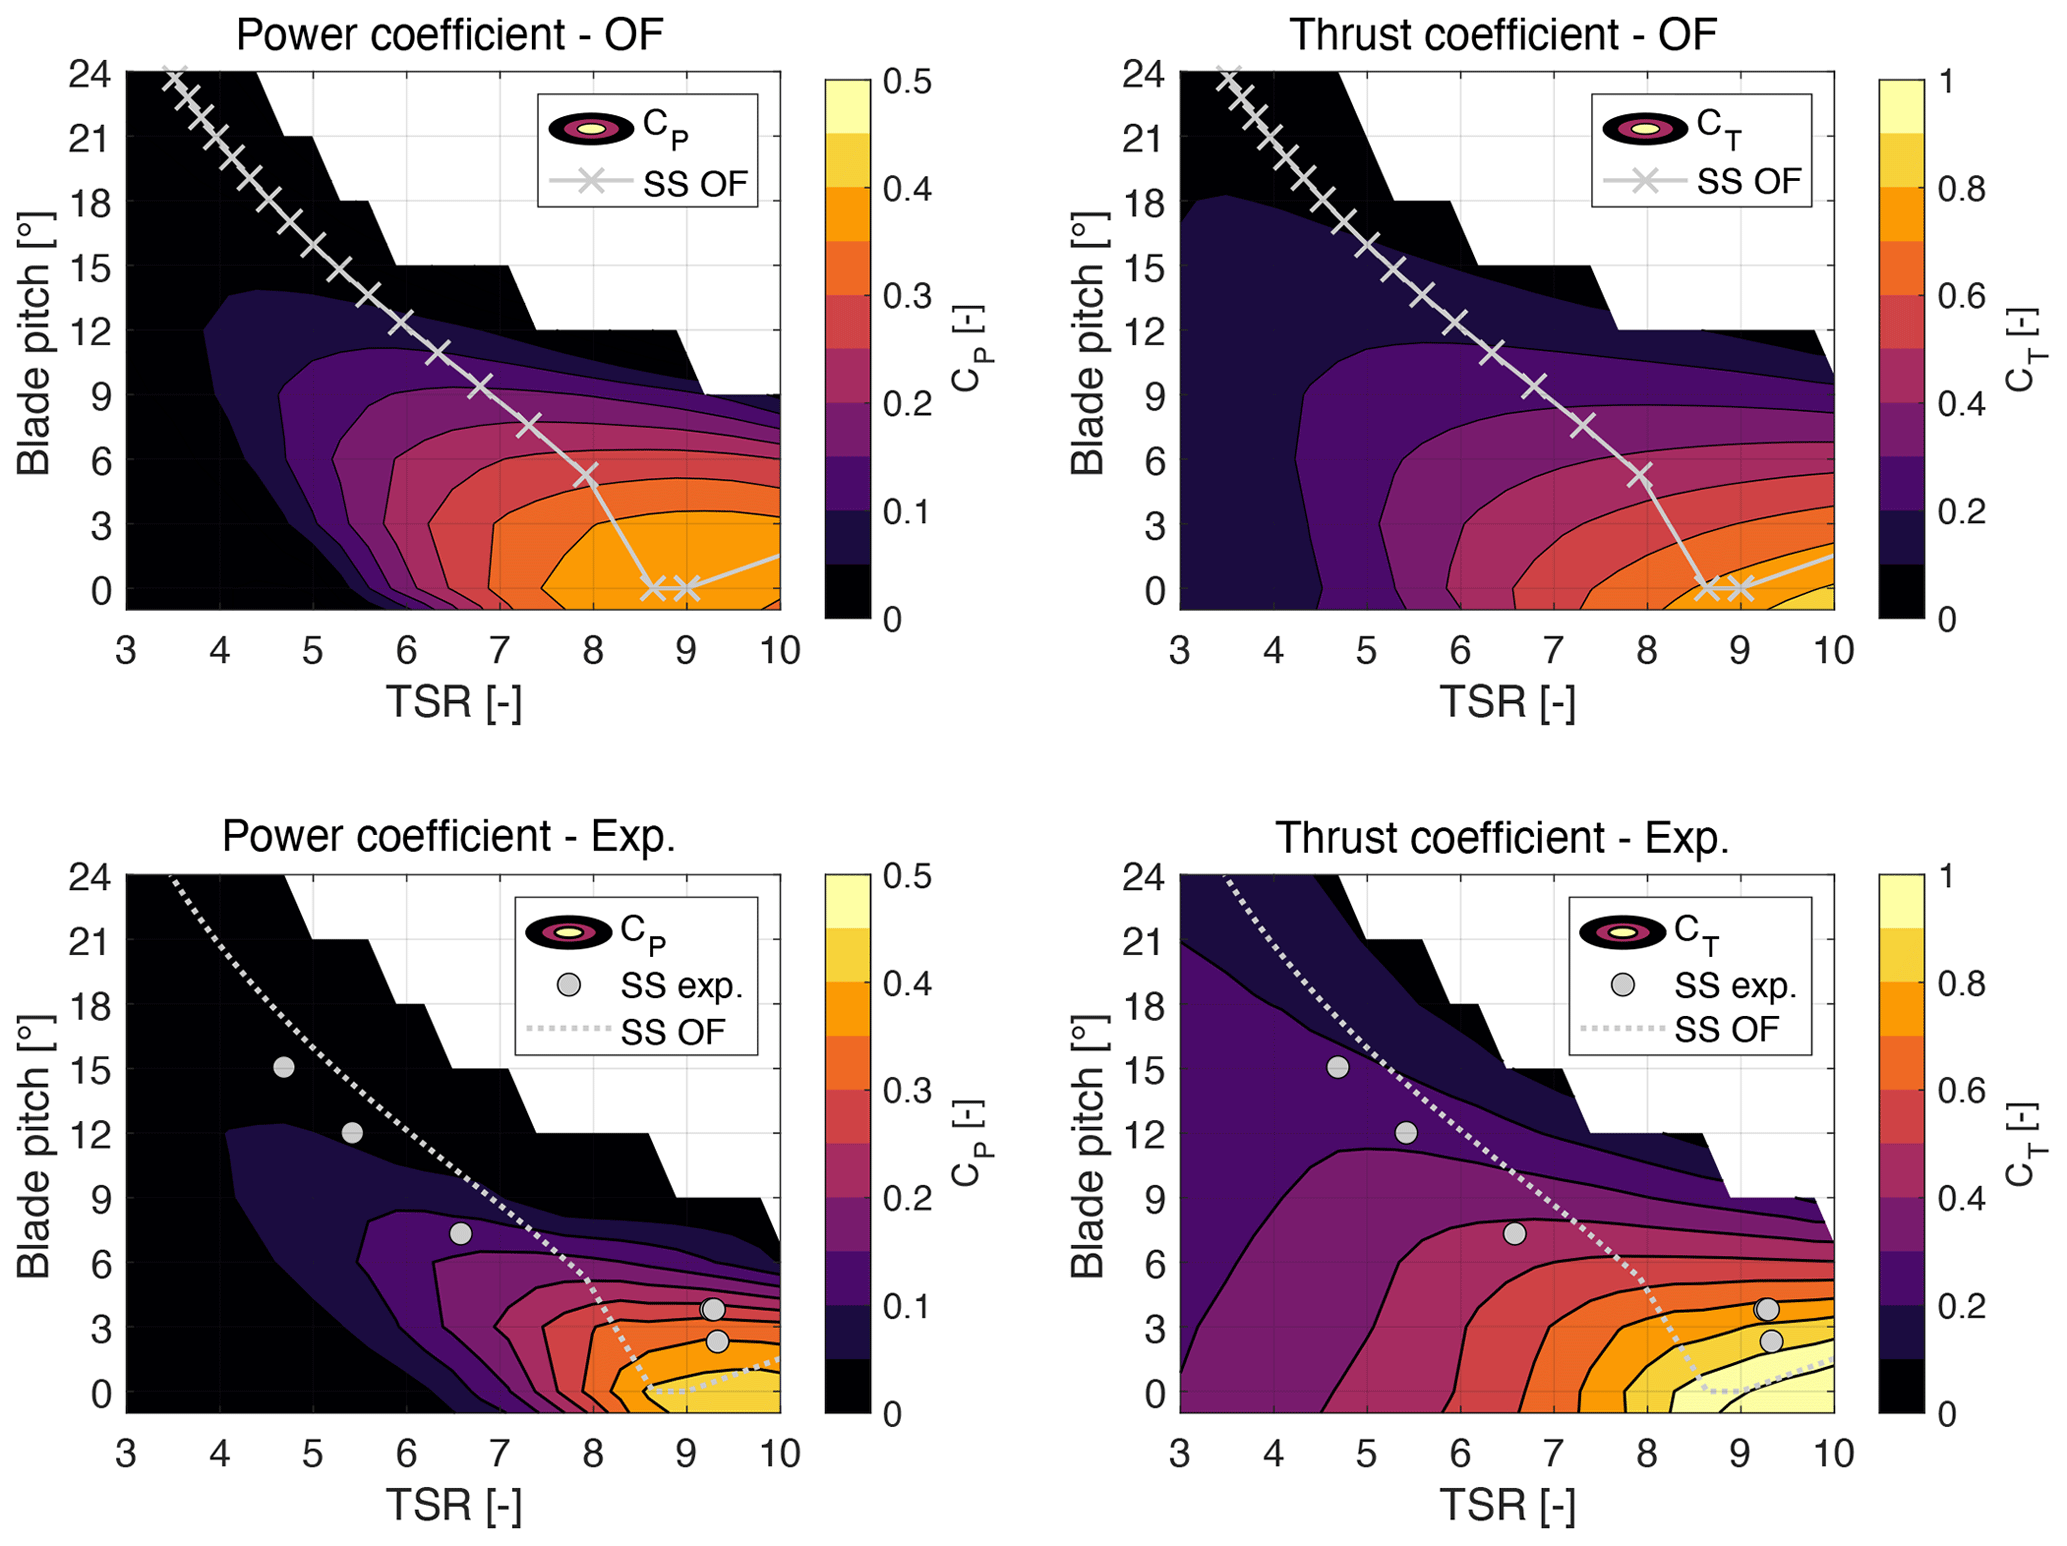
Figure 6Power coefficient (CP) and thrust coefficient (CT) for the wind turbine scale model measured in the wind tunnel (exp.) and obtained in OpenFAST (OF). “SS OF” and “SS exp.” are the steady-state control trajectories of Fig. 5. Negative values are not shown.
Aerodynamic sensitivities are calculated as in Appendix A, from partial derivatives of the performance coefficients of Fig. 6 and the steady-state operating points of Fig. 5. Partial derivatives of CP(λ,β) and CT(λ,β) are obtained from the numerical gradient of rotor performance coefficients, which is computed with the central difference method. The aerodynamic sensitivities of the WTM and of the IEA 15 MW turbine are shown in Fig. 7. In above-rated wind speeds, the experiment is in good agreement with the OpenFAST model of the WTM and matches the IEA 15 MW turbine well, whereas larger differences are seen in the below-rated region. Discrepancies in below-rated wind speeds are more pronounced for KβQ and KβT, the sensitivities to blade pitch, and they can be due to the blade pitch offset present in the experiment. KωQ is very similar in the experiment and in OpenFAST, and this supports the use of the OpenFAST results in the tuning of the PI TSR-tracking controller, with a similar convergence of results being found for KβQ in the above-rated region; thus aerodynamic data obtained from the OpenFAST model are suitable also to designing the PI pitch controller.
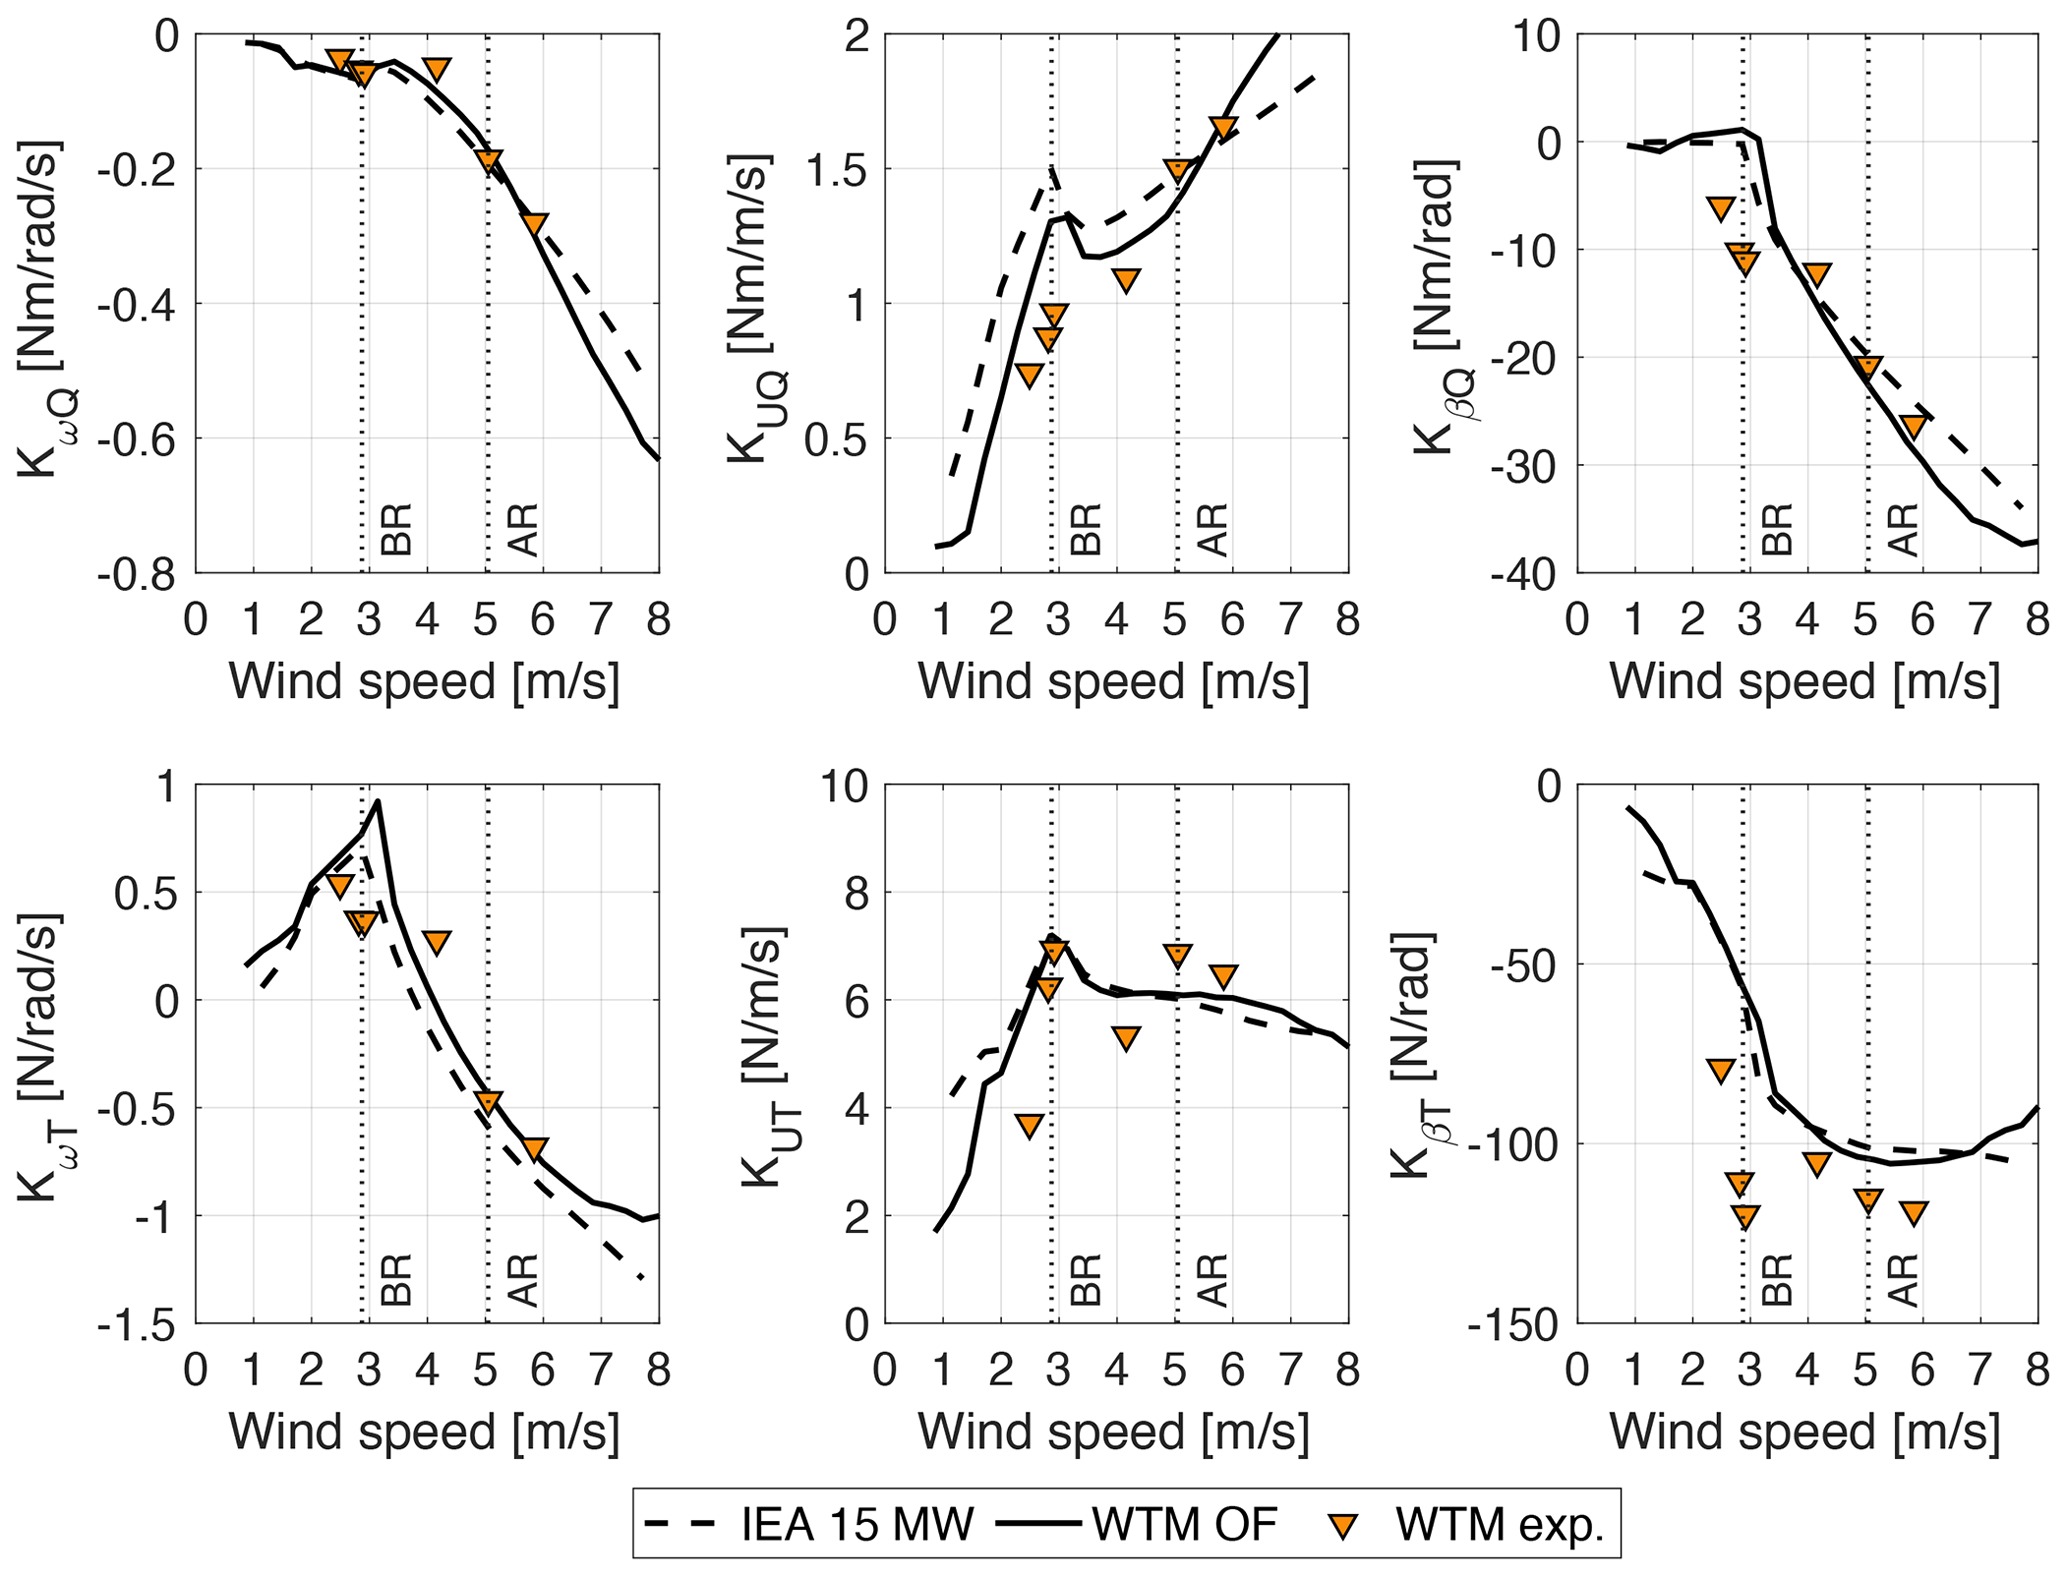
Figure 7Aerodynamic sensitivities at the steady-sate operating points of Fig. 6 obtained from CP(λ,β) and CT(λ,β) coefficients with the expressions of Appendix A. Experimental results (WTM exp.) are compared to values computed from the OpenFAST model of the wind turbine scale model (WTM OF) and to the IEA 15 MW turbine at model scale. Vertical dotted lines identify the below-rated (BR) and above-rated (AR) operating conditions considered for tests with platform motion.
5.3 Verification of the aerodynamic model with platform pitch motion
When the wind turbine is subjected to prescribed platform pitch motion, the turbine controller dynamically actuates generator torque and collective blade pitch to regulate rotor speed. Platform pitch variations result in oscillations of rotor speed, blade pitch, rotor thrust, and torque whose amplitude is proportional to the apparent wind speed created by platform motion. We discuss the condition with Am=2.2∘ and fm=1.25 Hz, with a relatively large ΔU, where it is possible to see the largest differences between experiment and numerical simulations.
Calculation of aerodynamic loads in the stand-alone AeroDyn module is verified by prescribing the platform pitch, rotor speed, and blade pitch oscillations of the experiment in the numerical model. Time series of rotor speed and blade pitch are filtered to isolate the harmonic at frequency fm, and only this harmonic component is analyzed. The aerodynamic response of AeroDyn is compared to the experiment in Figs. 8 and 9, which show the zero-peak amplitude and phase shift with respect to motion of the aerodynamic thrust and torque. AeroDyn simulations are repeated with dynamic-wake (DW) and static-wake (SW) models. In the cases without control, rotor speed and blade pitch are fixed; for the below-rated wind speed, the experimental results with a fixed rotor speed or blade pitch are omitted because when the WTM is controlled with an open-loop rotor speed set point, rotor speed is not fixed but has oscillations.
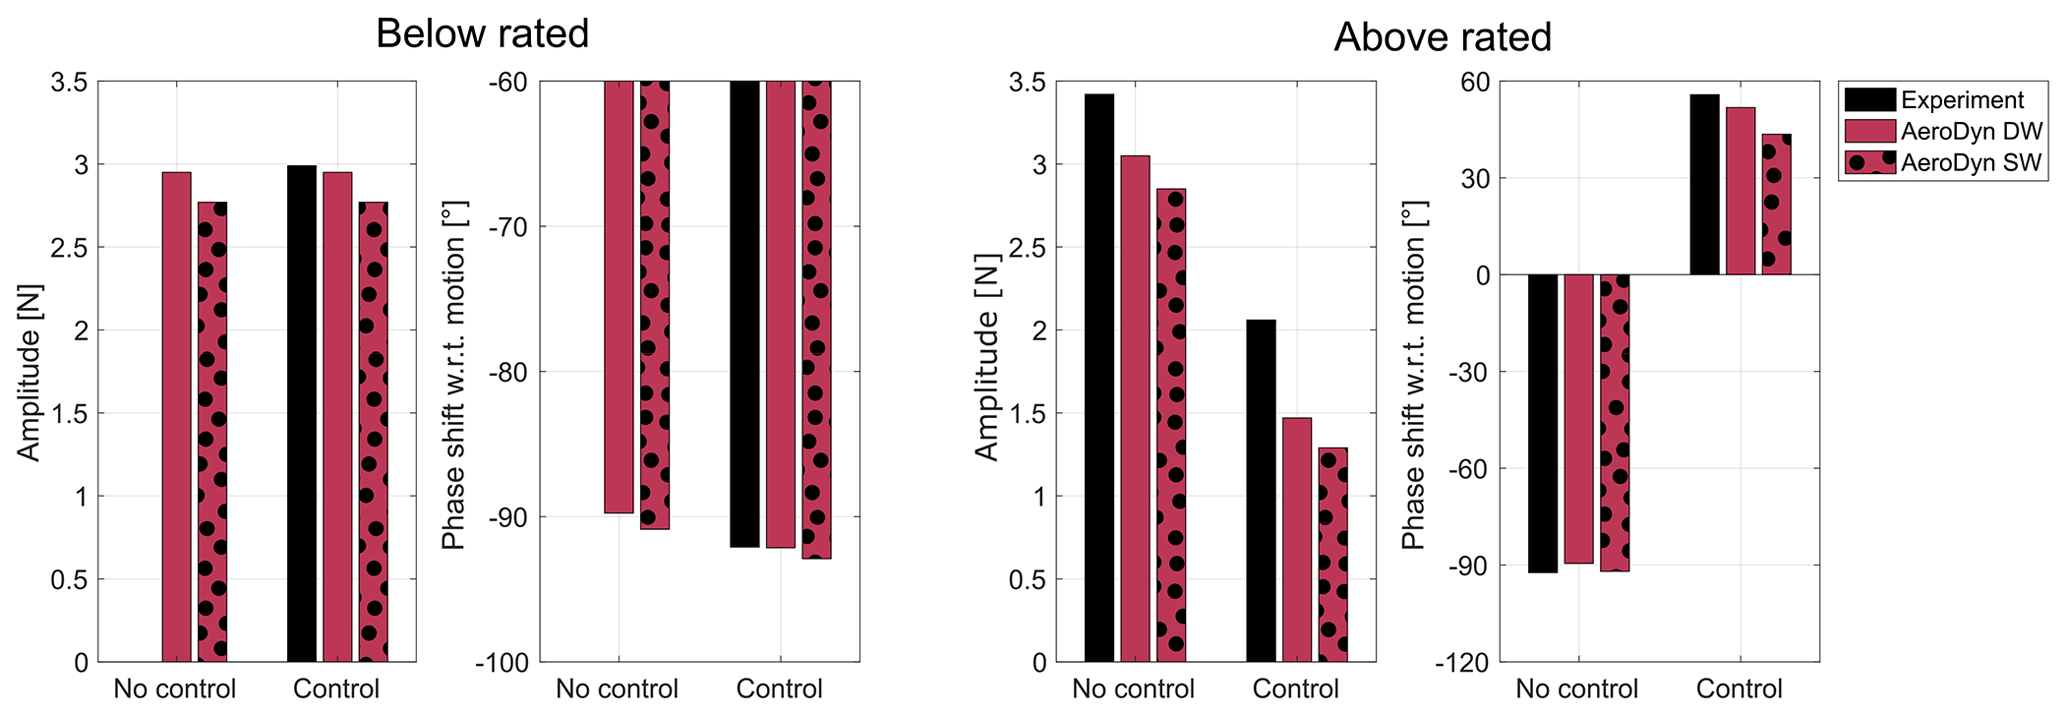
Figure 8Amplitude and phase shift with respect to the platform motion of aerodynamic rotor thrust with Am=2.2∘, fm=1.25 Hz, a below-rated wind speed of 2.87 m s−1, and an above-rated wind speed of 5.05 m s−1, from the experiment and the stand-alone AeroDyn model with a dynamic wake (DW) and static wake (SW).
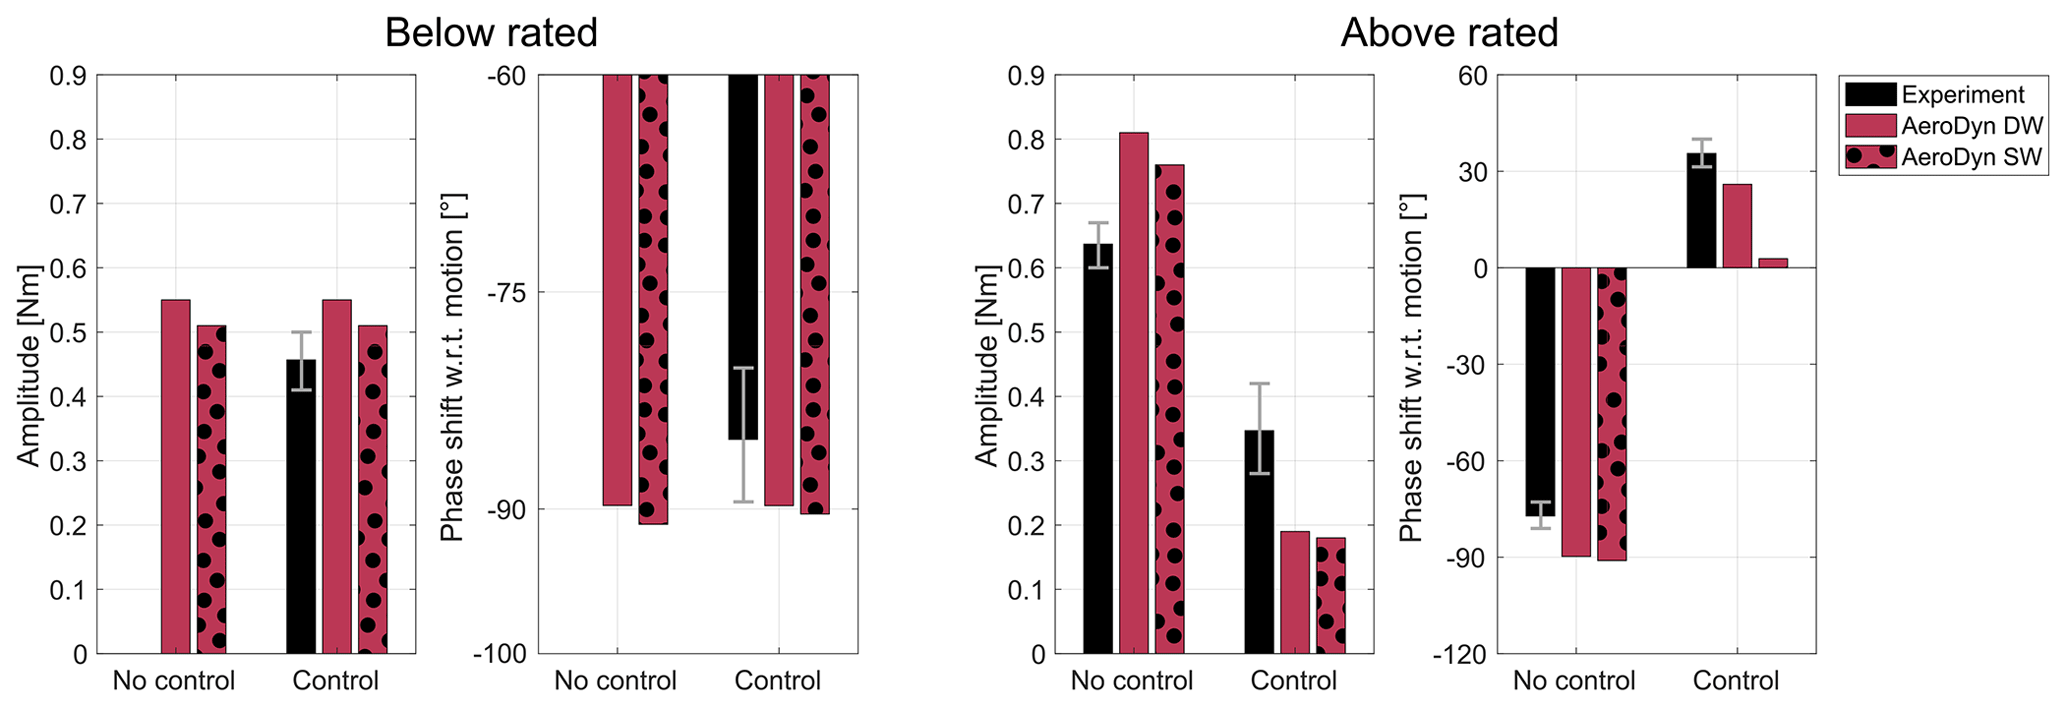
Figure 9Amplitude and phase shift with respect to the platform motion of aerodynamic rotor torque with Am=2.2∘, fm=1.25 Hz, a below-rated wind speed of 2.87 m s−1, and an above-rated wind speed of 5.05 m s−1, from the experiment and the stand-alone AeroDyn model with a dynamic wake (DW) and static wake (SW). Whiskers show the experimental aerodynamic torque with a variation in rotor inertia of ±20 %.
In below-rated operation, when rotor speed and blade pitch are fixed, the amplitude and phase shift in aerodynamic-load variations computed with AeroDyn and a static or dynamic wake are similar. The result does not change much when rotor speed varies sinusoidally: the thrust phase is slightly lower than in the fixed-rotor speed case, and the torque phase is slightly higher. The estimate of aerodynamic torque of the experiment is affected by uncertainty in the rotor inertia (see Sect. 4.2). Whiskers in Fig. 9 show how the torque amplitude and phase change due to a variation in rotor inertia of ±20 % of its mean value (0.279 kg m2), which is considered a reasonable error for this parameter. Overall, in the below-rated condition, the aerodynamic loads are captured by AeroDyn. This can be in part due to the fact that rotor speed oscillations are not large enough to create a challenging unsteady condition (as it is instead done in Bergua et al., 2023), and indeed the AeroDyn-DW solution is very close to AeroDyn-SW.
In above-rated operation, with fixed rotor speed and blade pitch (i.e., no control), the amplitude and phase of aerodynamic loads are again similar for the AeroDyn model with a static or dynamic wake. AeroDyn underpredicts the amplitude of thrust measured in the experiment and overpredicts the amplitude of torque; the phase shift in thrust with respect to motion is approximately −90∘ and is captured well. The blade pitch actuation alleviates aerodynamic loads, resulting in smaller amplitudes compared to the case without control. The reduction in thrust and torque predicted by AeroDyn is greater than in the experiment; it is similar for the DW and SW models, with the DW model being slightly closer to the experiment. The phase shift is captured well by AeroDyn-DW, whereas it is underpredicted by AeroDyn-SW. In the above-rated condition, differences between numerical simulations and the experiment are larger than the below-rated condition. This can be in part due to blade pitch actuation, which is known to cause dynamic inflow effects (Snel and Schepers, 1995), and, in the case of torque, can also be due to uncertainties in the estimation of aerodynamic loads from experimental measurements.
5.4 Coupled response with platform pitch motion
The turbine response measured in the experiment is compared to the OpenFAST model of the WTM, which includes ROSCO. The comparison is done based on the time series of rotor speed, blade pitch, aerodynamic thrust, and torque recorded over a number of periods, which are phase-averaged to filter harmonic contributions not due to platform motion.
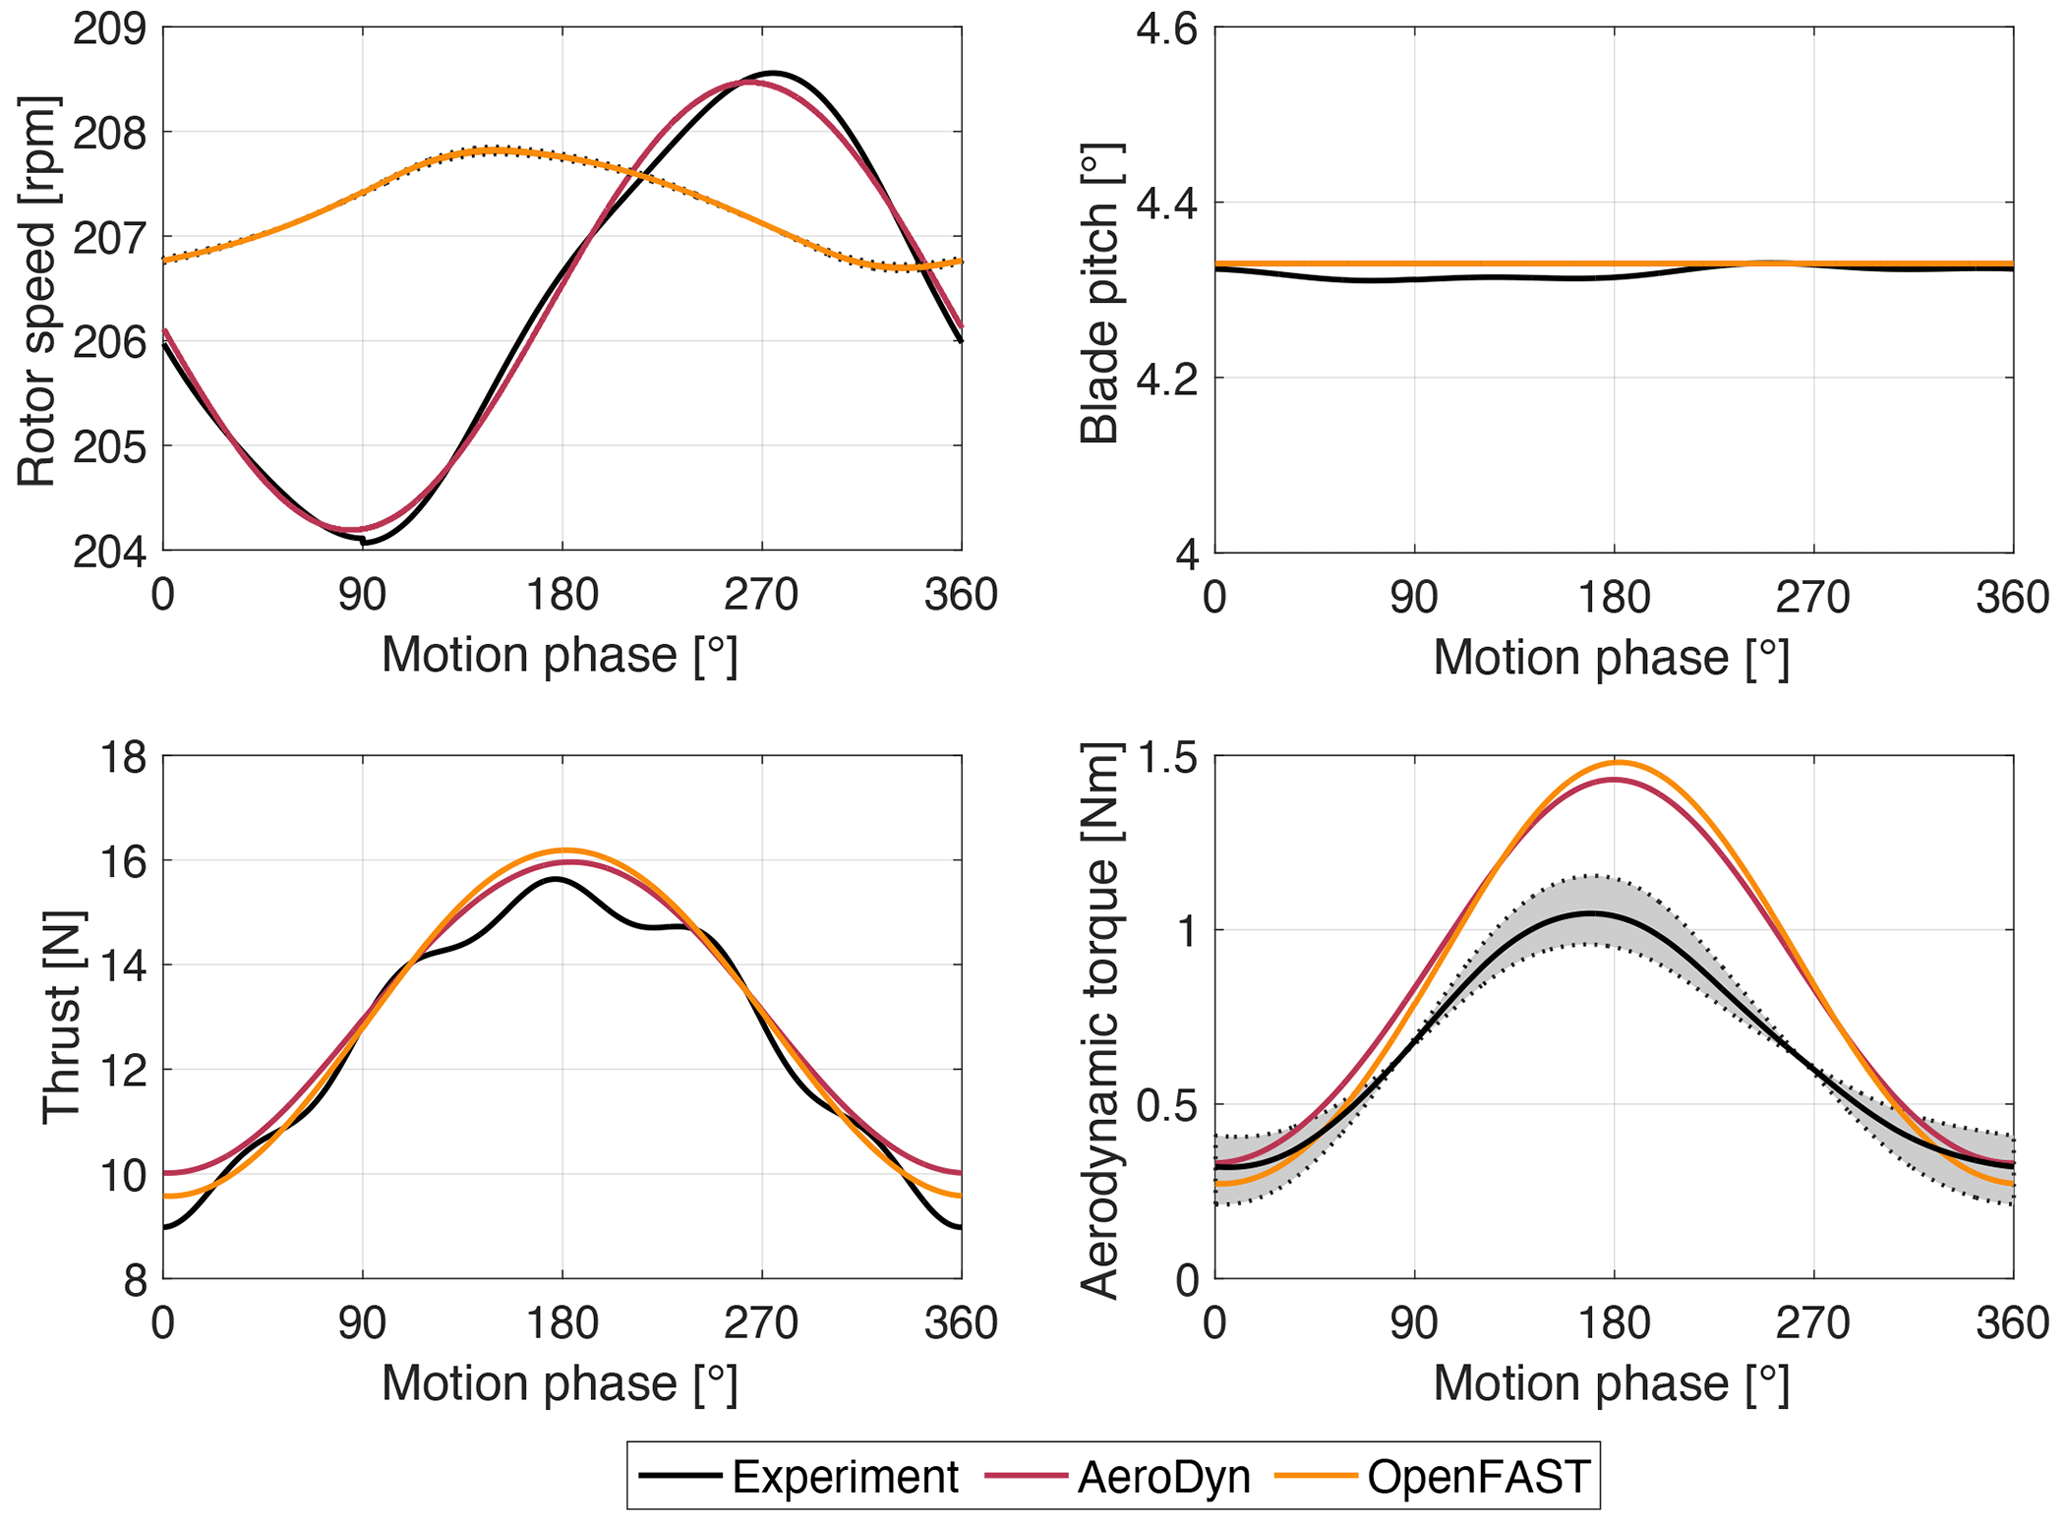
Figure 10Phase-averaged turbine response with a platform pitch motion of Am=2.2∘, fm=1.25 Hz, and a below-rated wind of 2.87 m s−1, measured in the experiment and computed in AeroDyn (with a dynamic wake) with a prescribed rotor speed and blade pitch and in OpenFAST with the Simulink controller. The grey area shows the aerodynamic-torque estimate with a variation in rotor inertia of ±20 %.
Figure 10 shows the WTM response with a below-rated wind speed of 2.87 m s−1. Blade pitch is saturated, and the controller responds with actuation of generator torque. All signals exhibit a first-order sine wave; thus the wind turbine response is driven by a single frequency corresponding to platform motion. In the OpenFAST–Simulink model, the rotor speed has a peak when the motion phase is 150∘ and a peak-to-peak amplitude of 1 rpm. The peak-to-peak amplitude of rotor speed oscillations in the experiment is 4.5 rpm, and the maximum is reached when the motion phase is 275∘. The thrust force response is similar in the experiment, in OpenFAST, and in the stand-alone AeroDyn simulation. In all cases, the thrust peak is close to 180∘, when the hub moves upwind with maximum velocity. Also the torque peak is close to 180∘, and the amplitude of oscillations in the experiment is slightly lower than in the OpenFAST model and in AeroDyn (the grey-shaded area in the figure shows how the aerodynamic-torque estimate changes with a variation in rotor inertia of ±20 %), but the mean value of torque in the simulations (0.86 N m) is higher than in the experiment (0.66 N m), as seen in Fig. 5. The variations in thrust and torque of the OpenFAST–Simulink model are close to the experiment and similar to the stand-alone AeroDyn model, despite the different amplitude and phase of rotor speed oscillations. With aerodynamic-torque variations similar in AeroDyn and OpenFAST–Simulink, one plausible reason for the different rotor speed response is the generator dynamics which are not modeled in OpenFAST (in Simulink the torque set point is followed perfectly by the generator, whereas in the physical WTM the generator has a torque control loop with a dynamic response; this dynamic response is hard to model because the torque controller is embedded in the generator drive and its parameters are not disclosed to users).
Figure 11 shows the phase-averaged WTM response with an above-rated wind speed of 5.05 m s−1. In this case, generator torque is saturated to its rated value, and the controller responds with actuation of collective blade pitch. Signals generally exhibit a first-order sine wave, but higher-order effects are seen in the blade pitch and aerodynamic loads of the OpenFAST–Simulink simulation.
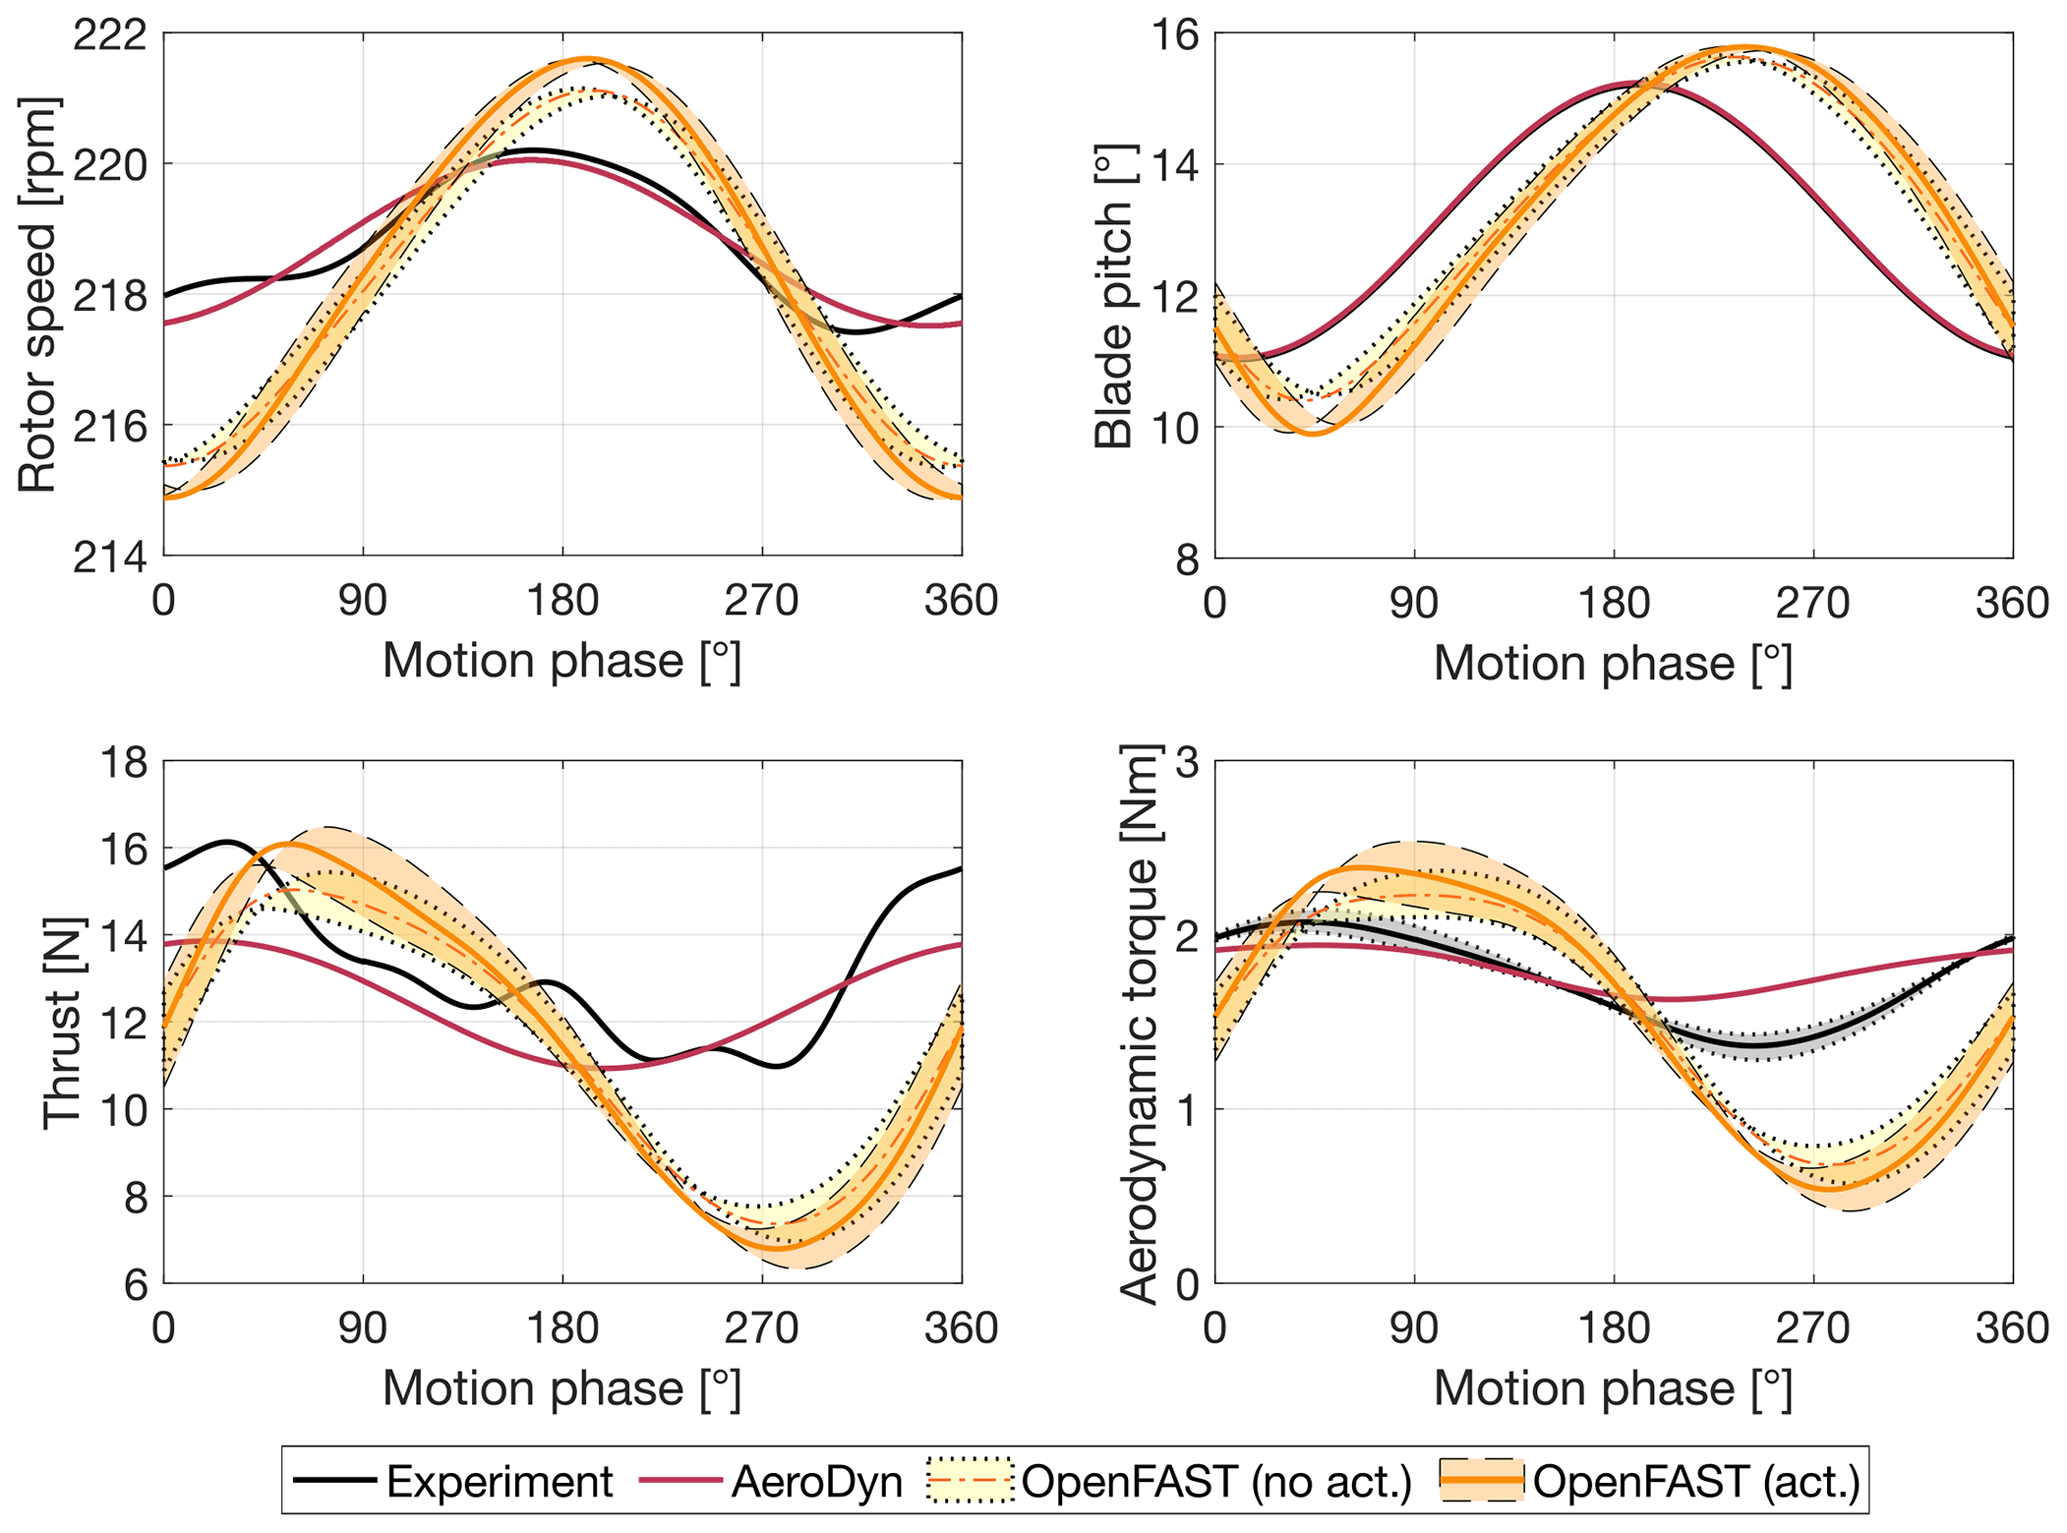
Figure 11Phase-averaged turbine response with a platform pitch motion of Am=2.2∘, fm=1.25 Hz, and an above-rated wind of 5.05 m s−1, measured in the experiment and computed in AeroDyn (with a dynamic wake) with prescribed rotor speed and blade pitch and in OpenFAST with the Simulink controller. Two OpenFAST–Simulink models are shown, one with and one without the pitch actuator model. The shaded areas show the variation in metrics due to a change in rotor inertia of ±20 %.
The peak-to-peak amplitude of rotor speed and blade pitch variations is lower in the experiment (3 rpm and 4.1∘) than in the OpenFAST–Simulink model (6.7 rpm and 6∘); the phase shift between the rotor speed peak and the blade pitch peak is lower in the experiment than in the simulation. When OpenFAST simulations are repeated without including the pitch actuator dynamics (i.e., Gact(s)=1), the amplitude of rotor speed and blade pitch variations is slightly lower than with the actuator model but still higher than in the experiment. Oscillations of thrust and torque in the experiment have lower amplitude than in the OpenFAST–Simulink model. The blade pitch excursions in this operating condition are large enough to influence the aerodynamic response of the wind turbine, and modeling the blade pitch control system is critical to capture the wind turbine aerodynamic loading. The pitch actuator may behave differently with wind (i.e., when there is an aerodynamic moment on the blade) than in still air; this difference would not be captured by the pitch actuator model and explains the discrepancies in the rotor speed–blade pitch response of OpenFAST compared to the experiment.
In this article, a theoretical framework is proposed to downscale the Reference OpenSource Controller (ROSCO) and use it to control a 1:100 scale model of the IEA 15 MW turbine. The controller preserves the algorithms of its full-scale version, but it is run in real time at model scale to respect the time scaling of the experiment. Due to this choice, the controller parameters are downscaled. The controller scaling procedure is model based and uses information about the aerodynamic response and inertial properties of the model turbine to preserve, at a small scale, the rotor response of the full-scale turbine. The aero-servo-dynamic response of the wind turbine scale model with ROSCO is studied in a wind tunnel experiment with load cases where the tower base is fixed and with large prescribed platform pitch motion that mimics a floating foundation.
The experiment is modeled in OpenFAST, and results of simulations are compared to those of testing to verify the controller scaling and identify the main sources of uncertainty in the modeling of the wind turbine scale model closed-loop response. The steady-state rotor speed–blade pitch–thrust–torque characteristics of the scaled turbine match those of the IEA 15 MW turbine and are correctly captured by the OpenFAST model. The largest differences are attributed to an offset in blade pitch present in the experiment, to a lower airfoil efficiency for the physical blade compared to its OpenFAST model, and to uncertainty in the drivetrain efficiency required for generator control. The wind turbine controller is scaled, making use of a linearized aerodynamic model. The linearized aerodynamics of the turbine scale model are captured by OpenFAST and are close to the IEA 15 MW turbine.
With platform pitch motion, the turbine response is modeled with different accuracy in the below-rated and above-rated regions. In below-rated operation, the aerodynamic response is driven by the rotor-apparent wind created by motion rather than rotor speed oscillations, which are relatively small. The aerodynamic model of OpenFAST captures the loads measured in the experiment, and the agreement is better for thrust than for torque, whose estimate is affected by the uncertain knowledge of rotor inertia. The rotor speed response in OpenFAST is different than in the experiment, and this is attributed to the lack of a model for the generator actuator. However, with the control strategy and operating condition we considered here, rotor speed oscillations do not cause significant unsteadiness; thus differences in the rotor speed dynamics are not critical for modeling the aerodynamic-load response due to platform motion. In above-rated operation, rotor speed is regulated with collective blade pitch. The amplitude of aerodynamic-load variations is driven by the combination of apparent wind and blade pitch oscillations. Differences between the aerodynamic loads computed in OpenFAST and those measured in the experiment are larger than in the below-rated condition. In particular, the decrease in loads due to blade pitch variations is overestimated in AeroDyn compared to the experiment. Slightly better agreement is obtained with the use of a dynamic BEM model compared to a static-wake model. The phase of blade pitch variations in OpenFAST is different than in the experiment, and this influences the amplitude and phase of aerodynamic loads in the simulation. The different response obtained in OpenFAST can be due to the scale model blade pitch actuators behaving differently with wind than in still air (i.e., where the pitch actuator model is obtained), the aerodynamic model of OpenFAST not completely capturing the experiment, or a combination of the two.
In conclusion, this work has provided guidance on how to include wind turbine control functionalities in scale model testing of floating wind turbines. It has also confirmed that the aerodynamic-load response with platform motion and active control is more difficult to model than when rotor speed and blade pitch are fixed, in particular in the above-rated region where large blade pitch excursion occurs. It is shown that knowledge of the blade pitch actuator response is important for modeling the aero-servo-dynamic response of a floating turbine in above-rated wind speeds.
In future work, more codes, possibly of higher fidelity than the BEM model we considered here, can be used to study the wind tunnel experiment, and this will help one understand the physics of the wind turbine system that are important to consider when modeling the aerodynamic response of a floating wind turbine with active control. The present research examined the case of active wind turbine control and prescribed motion – of low frequency and large amplitude – in the pitch direction. Floating wind turbines can experience large wave-frequency motions that should be examined in future experiments. Moreover, only thrust and torque loads have been investigated in the present study, but the other four components of the aerodynamic loading are important for the response of some floater concepts (Bachynski et al., 2015) and should be addressed in future wind tunnel studies.
We provide here the analytical expressions of rotor aerodynamic sensitivities. The sensitivity of rotor speed to rotor torque is
the sensitivity of wind speed to rotor torque is
and sensitivity of the collective blade pitch angle to rotor torque is
where and are the two components of the CQ gradient. The torque coefficient is computed from the power coefficient as .
The sensitivity of rotor speed to rotor thrust is
the sensitivity of wind speed to rotor thrust is
and sensitivity of the collective blade pitch angle to rotor thrust is
where and are the two components of the CT gradient.
We demonstrate that running the turbine controller at full scale with scaling of input and output signals does not preserve the turbine frequency response.
Let us consider here the response of the wind turbine to a change in wind speed when it functions at full load and rotor speed is controlled with a PI collective blade pitch controller. Assuming the wind speed rate of change is low, the variation in rotor speed is
This variation in rotor speed is counteracted by the PI collective pitch controller, the frequency response function of which for the IEA 15 MW turbine is shown in Fig. B1.
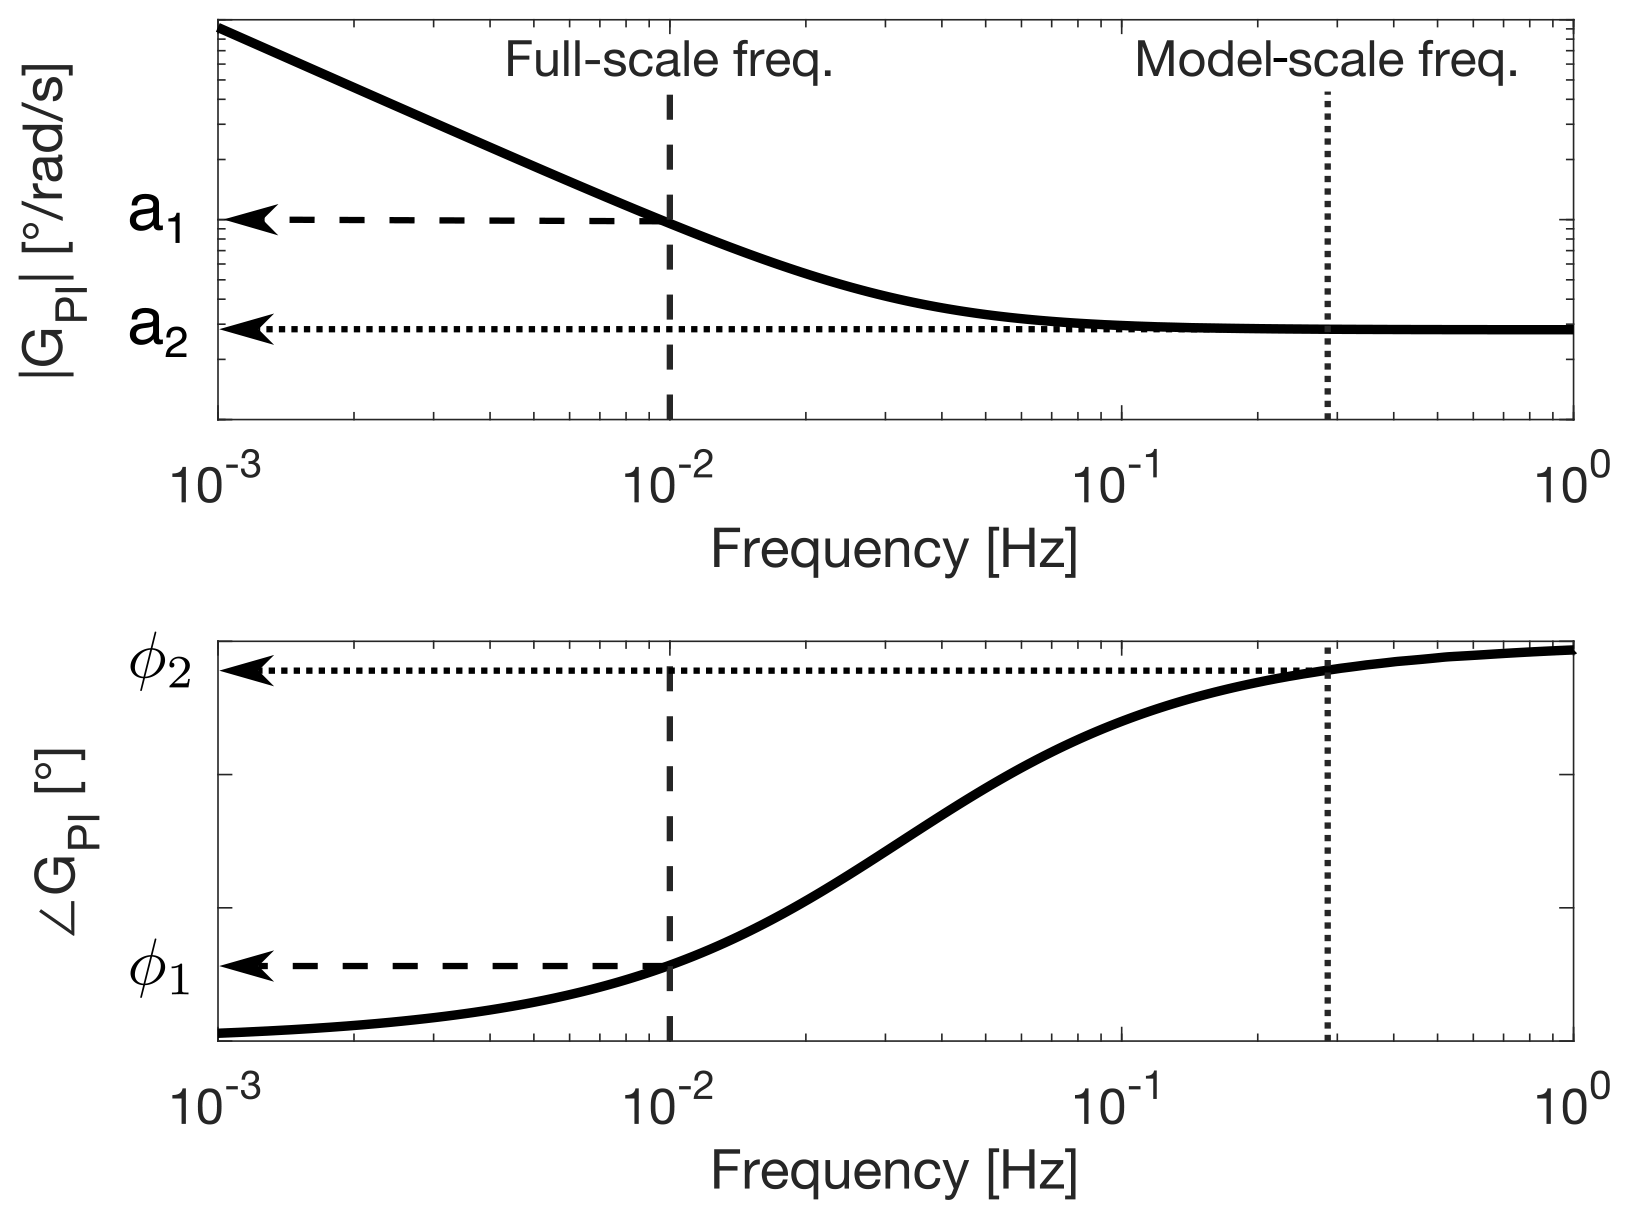
Figure B1Frequency response function (amplitude and phase) of the IEA 15 MW turbine PI collective blade pitch controller. The frequency response function evaluated at “Full-scale freq.” has amplitude a1 and phase ϕ1. If it is evaluated at “Model-scale freq.”, it has amplitude a2 and phase ϕ2.
We assume the variation in wind speed for the full-scale turbine is harmonic. In general, this can be due to a wind gust or due to the apparent wind created by motion in the case of a floating wind turbine. The wind speed variation is
where fw is the frequency of the wind speed oscillations. Using Eq. (B1), the rotor speed response due to the wind speed is
The blade pitch controller reaction to this oscillation is
where a1 and ϕ1 are the amplitude and frequency of the PI pitch controller frequency response function at fw.
Let us consider a scaled version of the full-scale turbine. The wind speed oscillation for the model has scaled amplitude and scaled frequency (e.g., when the turbine is mounted on a scale model of the floating platform):
where . Assuming the rotor response of the turbine model is ideally scaled,
When the turbine controller is operated in real time in full-scale mode, inputs from the turbine model are scaled up to full-scale values before going into the controller. For rotor speed,
where . The blade pitch controller response is
where a2 and ϕ2 are the amplitude and frequency of the PI pitch controller frequency response function at fwλf. is non-dimensional, and, with the full-scale controller approach, it is applied to the turbine scale model without any further operation.
Comparing Eq. (B4) to Eq. (B8) we see they have different amplitude and phase, which is due to the frequency response function of the PI blade pitch controller rather than dimensional scaling.
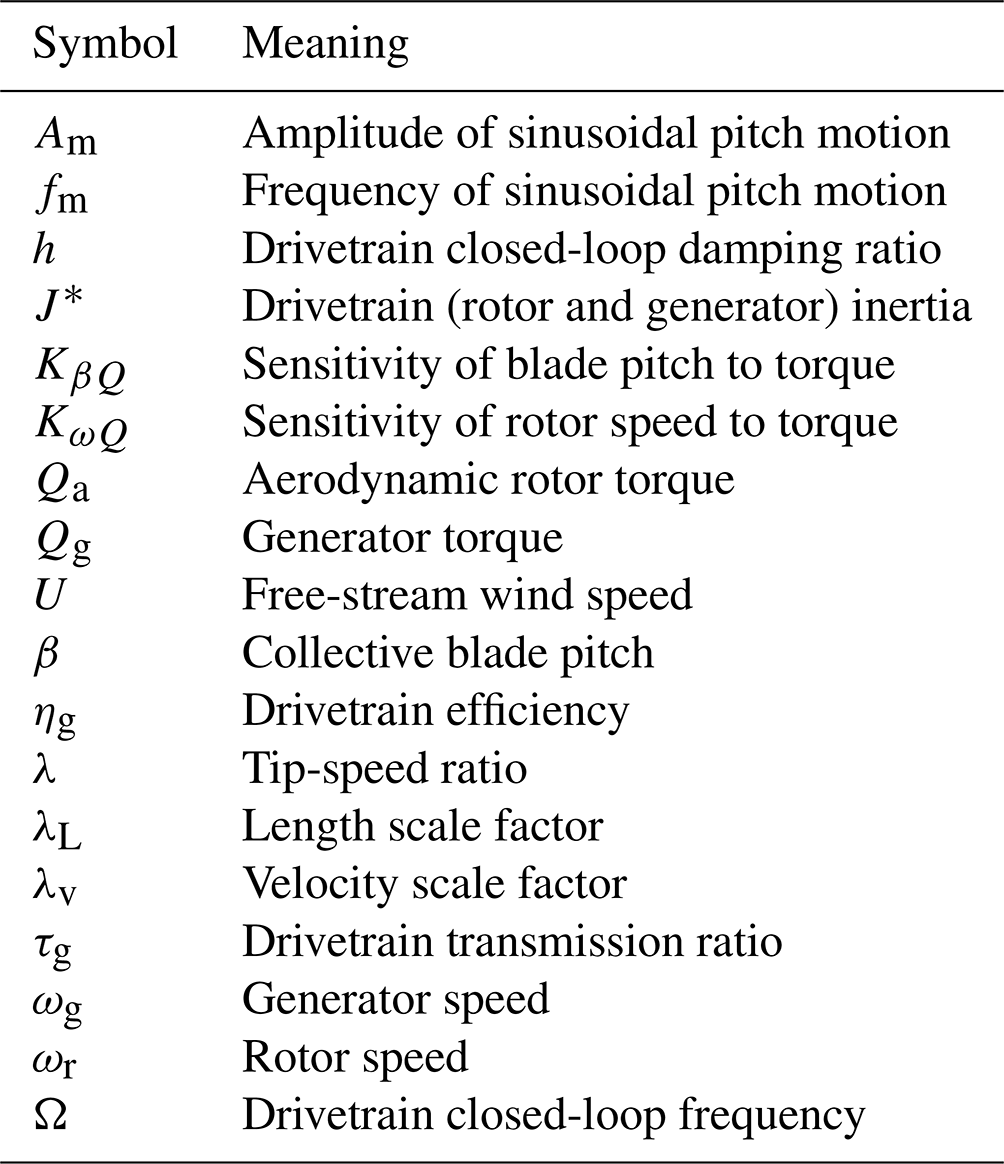
Table C1 is a list of the symbols that occur most often in the text.
The OpenFAST model, the MATLAB Simulink version of the Reference OpenSource Controller (ROSCO), and experimental data can be accessed via Fontanella et al. (2023b) (https://doi.org/10.5281/zenodo.7741358).
AF and ED devised the methodology to downscale the wind turbine controller and created the simulation model. FN, AF, and MB designed the wind tunnel experiment, which was run by AF, ED, and FN. ED and AF analyzed the experimental data and ran the numerical simulations. MB supervised the research project. All coauthors thoroughly reviewed the article.
The contact author has declared that none of the authors has any competing interests.
Publisher's note: Copernicus Publications remains neutral with regard to jurisdictional claims in published maps and institutional affiliations.
This paper was edited by Erin Bachynski-Polić and reviewed by three anonymous referees.
Abbas, N. J., Daniel, Z. S., Mudafort, R. M., Hylander, G., Mulders, S., davidheff, and Bortolotti, P.: NREL/ROSCO: RAAW v1.3, Zenodo [code], https://doi.org/10.5281/zenodo.7154733, 2022a. a, b
Abbas, N. J., Zalkind, D. S., Pao, L., and Wright, A.: A reference open-source controller for fixed and floating offshore wind turbines, Wind Energ. Sci., 7, 53–73, https://doi.org/10.5194/wes-7-53-2022, 2022b. a, b, c
Bachynski, E. E., Chabaud, V., and Sauder, T.: Real-time Hybrid Model Testing of Floating Wind Turbines: Sensitivity to Limited Actuation, Energ. Proced., 80, 2–12, https://doi.org/10.1016/j.egypro.2015.11.400, 2015. a
Bergua, R., Robertson, A., Jonkman, J., Branlard, E., Fontanella, A., Belloli, M., Schito, P., Zasso, A., Persico, G., Sanvito, A., Amet, E., Brun, C., Campaña Alonso, G., Martín-San-Román, R., Cai, R., Cai, J., Qian, Q., Maoshi, W., Beardsell, A., Pirrung, G., Ramos-García, N., Shi, W., Fu, J., Corniglion, R., Lovera, A., Galván, J., Nygaard, T. A., dos Santos, C. R., Gilbert, P., Joulin, P.-A., Blondel, F., Frickel, E., Chen, P., Hu, Z., Boisard, R., Yilmazlar, K., Croce, A., Harnois, V., Zhang, L., Li, Y., Aristondo, A., Mendikoa Alonso, I., Mancini, S., Boorsma, K., Savenije, F., Marten, D., Soto-Valle, R., Schulz, C. W., Netzband, S., Bianchini, A., Papi, F., Cioni, S., Trubat, P., Alarcon, D., Molins, C., Cormier, M., Brüker, K., Lutz, T., Xiao, Q., Deng, Z., Haudin, F., and Goveas, A.: OC6 project Phase III: validation of the aerodynamic loading on a wind turbine rotor undergoing large motion caused by a floating support structure, Wind Energ. Sci., 8, 465–485, https://doi.org/10.5194/wes-8-465-2023, 2023. a, b
Bottasso, C. L., Cacciola, S., and Iriarte, X.: Calibration of wind turbine lifting line models from rotor loads, J. Wind Eng. Indust. Aerodynam., 124, 29–45, https://doi.org/10.1016/j.jweia.2013.11.003, 2014. a
Cioni, S., Papi, F., Pagamonci, L., Bianchini, A., Ramos-García, N., Pirrung, G., Corniglion, R., Lovera, A., Galván, J., Boisard, R., Fontanella, A., Schito, P., Zasso, A., Belloli, M., Sanvito, A., Persico, G., Zhang, L., Li, Y., Zhou, Y., Mancini, S., Boorsma, K., Amaral, R., Viré, A., Schulz, C. W., Netzband, S., Soto Valle, R., Marten, D., Martín-San-Román, R., Trubat, P., Molins, C., Bergua, R., Branlard, E., Jonkman, J., and Robertson, A.: On the characteristics of the wake of a wind turbine undergoing large motions caused by a floating structure: an insight based on experiments and multi-fidelity simulations from the OC6 Phase III Project, Wind Energ. Sci. Discuss. [preprint], https://doi.org/10.5194/wes-2023-21, in review, 2023. a
Fontanella, A., Liu, Y., Azcona, J., Pires, O., Bayati, I., Gueydon, S., de Ridder, E. J., van Wingerden, J. W., and Belloli, M.: A hardware-in-the-loop wave-basin scale-model experiment for the validation of control strategies for floating offshore wind turbines, J. Phys.: Conf. Ser., 1618, 032038, https://doi.org/10.1088/1742-6596/1618/3/032038, 2020. a
Fontanella, A., Bayati, I., Mikkelsen, R., Belloli, M., and Zasso, A.: UNAFLOW: a holistic wind tunnel experiment about the aerodynamic response of floating wind turbines under imposed surge motion, Wind Energ. Sci., 6, 1169–1190, https://doi.org/10.5194/wes-6-1169-2021, 2021. a, b, c
Fontanella, A., Da Pra, G., and Belloli, M.: Integrated Design and Experimental Validation of a Fixed-Pitch Rotor for Wind Tunnel Testing, Energies, 16, 1–15, https://doi.org/10.3390/en16052205, 2023a. a
Fontanella, A., Daka, E., Novais, F., and Belloli, M.: Aerodynamics of a Floating Wind Turbine Scale Model with Active Control, Zenodo [code and data set], https://doi.org/10.5281/zenodo.7741358, 2023b. a
Gaertner, E., Rinker, J. and. Sethuraman, L., Zahle, F., Anderson, B., Barter, G., Abbas, N., Meng, F., Bortolotti, P., Skrzypinski, W., Scott, G., Feil, R., Bredmose, H., Dykes, K., Shields, M., Allen, C., and Viselli, A.: Definition of the IEA 15-Megawatt Offshore Reference Wind Turbine, Tech. rep., National Renewable Energy Laboratory, https://www.nrel.gov/docs/fy20osti/75698.pdf (last access: 1 April 2023), 2020. a
Goupee, A. J., Kimball, R. W., and Dagher, H. J.: Experimental observations of active blade pitch and generator control influence on floating wind turbine response, Renew. Energy, 104, 9–19, https://doi.org/10.1016/j.renene.2016.11.062, 2017. a
Gueydon, S., Lindeboom, R., van Kampen, W., and de Ridder, E.-J.: Comparison of Two Wind Turbine Loading Emulation Techniques Based on Tests of a TLP-FOWT in Combined Wind, Waves and Current, in: ASME 2018 1st International Offshore Wind Technical Conference, 4–7 November, v001T01A012, San Francisco, California, USA, https://doi.org/10.1115/IOWTC2018-1068, 2018. a
Gueydon, S., Bayati, I., and de Ridder, E.: Discussion of solutions for basin model tests of FOWTs in combined waves and wind, Ocean Eng., 209, 107288, https://doi.org/10.1016/j.oceaneng.2020.107288, 2020. a
Jüchter, J., Peinke, J., Lukassen, L. J., and Hölling, M.: Reduction and analysis of rotor blade misalignments on a model wind turbine, J. Phys.: Conf. Ser., 2265, 022071, https://doi.org/10.1088/1742-6596/2265/2/022071, 2022. a
Kim, T., Madsen, F., Bredmose, H., and Pegalajar-Jurado, A.: Numerical analysis and comparison study of the 1:60 scaled DTU 10 MW TLP floating wind turbine, Renew. Energy, 202, 210–221, https://doi.org/10.1016/j.renene.2022.11.077, 2023. a, b
Larsen, T. J. and Hanson, T. D.: A method to avoid negative damped low frequent tower vibrations for a floating, pitch controlled wind turbine, J. Phys.: Conf. Ser., 75, 012073, https://doi.org/10.1088/1742-6596/75/1/012073, 2007. a
Madsen, F., Nielsen, T., Kim, T., Bredmose, H., Pegalajar-Jurado, A., Mikkelsen, R., Lomholt, A., Borg, M., Mirzaei, M., and Shin, P.: Experimental analysis of the scaled DTU10MW TLP floating wind turbine with different control strategies, Renew. Energy, 155, 330–346, https://doi.org/10.1016/j.renene.2020.03.145, 2020. a
Mendoza, N., Robertson, A., Wright, A., Jonkman, J., Wang, L., Bergua, R., Ngo, T., Das, T., Odeh, M., Mohsin, K., Flavia, F. F., Child, B., Bangga, G., Fowler, M., Goupee, A., Kimball, R., Lenfest, E., and Viselli, A.: Verification and Validation of Model-Scale Turbine Performance and Control Strategies for the IEA Wind 15 MW Reference Wind Turbine, Energies, 15, 1–25, https://doi.org/10.3390/en15207649, 2022. a, b
Meng, F., Lio, W. H., and Barlas, T.: DTUWEC: an open-source DTU Wind Energy Controller with advanced industrial features, J. Phys.: Conf. Ser., 1618, 022009, https://doi.org/10.1088/1742-6596/1618/2/022009, 2020. a
Pires, O., Azcona, J., Vittori, F., Bayati, I., Gueydon, S., Fontanella, A., Liu, Y., de Ridder, E., Belloli, M., and van Wingerden, J.: Inclusion of rotor moments in scaled wave tank test of a floating wind turbine using SiL hybrid method, J. Phys.: Conf. Ser., 1618, 032048, https://doi.org/10.1088/1742-6596/1618/3/032048, 2020. a
Robertson, A., Bergua, R., Fontanella, A., and Jonkman, J.: OC6 Phase III Definition Document, OSTI.GOV, https://doi.org/10.2172/1957538, 2023. a
Robertson, A. N., Jonkman, J. M., Goupee, A. J., Coulling, A. J., Prowell, I., Browning, J., Masciola, M. D., and Molta, P.: Summary of Conclusions and Recommendations Drawn From the DeepCwind Scaled Floating Offshore Wind System Test Campaign, proceedings of the ASME 2013 32nd Offshore Mechanics and Arctic Engineering (OMAE) conferce, Vol. 8, Ocean Renewable Energy, Nantes, France, 9–14 June, v008T09A053, https://doi.org/10.1115/OMAE2013-10817, 2013. a
Snel, H. and Schepers, J. G.: Joint investigation of dynamic inflow effects and implementation of an engineering method, Tech. Rep., https://publicaties.ecn.nl/PdfFetch.aspx?nr=ECN-C--94-107 (last access: 1 September 2023), 1995. a
STEP4WIND: STEP4WIND project, https://step4wind.eu (last access: 19 March 2023), 2023. a
Thys, M., Souza, C., Sauder, T., Fonseca, N., Berthelsen, P. A., Engebretsen, E., and Haslum, H.: Experimental Investigation of the Coupling Between Aero- and Hydrodynamical Loads On A 12 MW Semi-Submersible Floating Wind Turbine, proceedings of the ASME 2021 40th Offshore Mechanics and Arctic Engineering (OMAE) conferce, V. 9, Ocean Renewable Energy, 21–30 June, v009T09A030, https://doi.org/10.1115/OMAE2021-62980, 2021. a
van der Veen, G. J., Couchman, I. J., and Bowyer, R. O.: Control of floating wind turbines, in: 2012 American Control Conference (ACC), 27–29 June 2012, Montreal, Canada, 3148–3153, https://doi.org/10.1109/ACC.2012.6315120, 2012. a
Vittori, F., Azcona, J., Eguinoa, I., Pires, O., Rodríguez, A., Morató, A., Garrido, C., and Desmond, C.: Model tests of a 10 MW semi-submersible floating wind turbine under waves and wind using hybrid method to integrate the rotor thrust and moments, Wind Energ. Sci., 7, 2149–2161, https://doi.org/10.5194/wes-7-2149-2022, 2022. a
Yu, W., Lemmer, F., Bredmose, H., Borg, M., Pegalajar-Jurado, A., Mikkelsen, R., Larsen, T. S., Fjelstrup, T., Lomholt, A., Boehm, L., Schlipf, D., Armendariz, J. A., and Cheng, P.: The Triple Spar Campaign: Implementation and Test of a Blade Pitch Controller on a Scaled Floating Wind Turbine Model, Energ. Proced., 137, 323–338, https://doi.org/10.1016/j.egypro.2017.10.357, 2017. a
- Abstract
- Introduction
- Description of the experimental setup
- Wind turbine control strategy
- Methodology for investigation of the turbine response
- Results
- Conclusions
- Appendix A: Analytical expressions of rotor aerodynamic sensitivities
- Appendix B: Frequency response of the turbine controller with input–output scaling
- Appendix C: List of symbols
- Data availability
- Author contributions
- Competing interests
- Disclaimer
- Financial support
- Review statement
- References