the Creative Commons Attribution 4.0 License.
the Creative Commons Attribution 4.0 License.
 | 20 Dec 2023
Free-vortex models for wind turbine wakes under yaw misalignment – a validation study on far-wake effects
Maarten J. van den Broek
Delphine De Tavernier
Paul Hulsman
Daan van der Hoek
Benjamin Sanderse
Jan-Willem van Wingerden
Near-wake effects of wind turbine models using the free-vortex wake have been studied extensively, but there is a lack of validation for such predictions in the mid to far wake. This paper presents a novel validation study using three free-vortex wake models of increasing complexity: an actuator disc, an actuator disc with rotation, and a lifting-line model. We emphasise the application for dynamic wind farm flow control optimisation with a focus on wake redirection using yaw misalignment. For this purpose, wake models should provide sufficiently accurate power predictions at a low computational expense to enable real-time control optimisation. Three sets of wind tunnel data are used for validation: flow measurements under steady yaw misalignment, time-resolved flow measurements for a step change in yaw, and turbine output measurements with yaw control and simulated wind direction variation. Results indicate that the actuator-disc model provides the best balance between computational cost and accuracy in power predictions for the mid to far wake, which is not significantly improved upon by the addition of rotation. In the near wake, the added complexity of the lifting-line model may provide value as it models blade loading and individual tip vortices. Altogether, this study provides important validation for further studies into optimisation of wake steering under time-varying conditions and suggests that the actuator-disc model is a suitable candidate for use in a model-predictive wind farm flow control framework.
- Article
(5642 KB) - Full-text XML
- BibTeX
- EndNote


The limited availability of offshore and onshore parcels for wind energy production means that large, densely spaced wind farms are commonly used. However, in these farms, wake effects can lead to a significant decrease in power production and an increase in fatigue loading. While farm topology is typically optimised to minimise aerodynamic interaction, it lacks flexibility for time-varying wind conditions (van Wingerden et al., 2020). Under those conditions, wind farm flow control uses existing control degrees of freedom to reduce aerodynamic interaction between wind turbines with methods such as wake redirection through yaw misalignment, dynamic induction control with collective pitch control, and wake-mixing strategies with individual pitch control (Meyers et al., 2022).
This paper focuses on the use of yaw misalignment for wake steering, where an intentional misalignment in the yaw angle with respect to the dominant wind direction is used to deflect the low-energy, turbulent wake behind the turbine. After demonstrations of effectiveness in both simulation and wind tunnel experiments, wake steering has been shown to yield power gains in wind farms for predefined yaw angle offsets under steady conditions in field studies (Howland et al., 2019; Fleming et al., 2020, 2021; Doekemeijer et al., 2021; Simley et al., 2021). An important aspect of the wind turbine wake under yaw misalignment is the formation of a counter-rotating vortex pair, which generates a curled, or kidney-shaped, wake (Howland et al., 2016; Bastankhah and Porté-Agel, 2016; Bartl et al., 2018; Fleming et al., 2018; Hulsman et al., 2022b).
Wind turbine wake models are essential tools for developing and implementing wake steering control strategies. Accurate predictions of wake behaviour allow for optimisation of wind turbine controls for objectives such as power production and reduction in fatigue loading. Current control strategies are mostly based on lookup tables generated by steady-state optimisation with engineering wake models, such as those in the FLORIS toolbox (NREL, 2022). This includes, for example, the curled wake model (Martínez-Tossas et al., 2019), which has been extended with dynamics (Branlard et al., 2023) as the steady-state models are limited for use in time-varying conditions. Another approach is the use of Lagrangian particle methods to use the wake models within FLORIS for dynamic wake prediction (Becker et al., 2022; Lejeune et al., 2022).
Instead of implementing the dynamics into steady-state models, physics-based approaches attempt to simplify first principles to reduce complexity while maintaining essential dynamics. Studies with large-eddy simulation have been successful in control optimisation (Munters and Meyers, 2018), and recent work has moved towards real-time control by coarsening mesh resolution and adjusting control parameters (Janssens and Meyers, 2023). On the other hand, simplified flow models based on two-dimensional Navier–Stokes equations, such as WFSim (Boersma et al., 2018) and FRED (van den Broek and van Wingerden, 2020), were developed in an attempt to provide computationally efficient flow estimates for control. However, these have been shown to be unsuitable for yaw control as the wake dynamics under yaw misalignment are fundamentally three-dimensional (van den Broek et al., 2022b). A physics-based model for efficient control optimisation was introduced by van den Broek et al. (2022a), modelling the wind turbine wake with an actuator-disc model based on free-vortex methods and representing the curled wake dynamics.
Free-vortex wake (FVW) methods are meshless methods, using Lagrangian elements to model flow dynamics based on the vorticity formulation of the Navier–Stokes equations (Leishman, 2000; Katz and Plotkin, 2001). This leads to an efficient, skeletal representation of the wind turbine wake. The FVW method was initially applied to wake modelling for helicopter rotors with a focus on tip vortices in studies (Bhagwat and Leishman, 2001). From there, it was adapted to application for unsteady aerodynamics in wakes of wind turbine rotors (Leishman, 2002).
Several studies have applied FVW methods to model wind turbine wakes, such as a lattice method (Simoes and Graham, 1992), axisymmetric vortex rings for the near wake under yaw misalignment (de Vaal et al., 2014), and the study of the effectiveness of dynamic induction control for near-wake breakdown (Brown et al., 2021). The latter model has been shown to only be accurate within the near wake in a comparison with data from large-eddy simulations (Houck et al., 2022). Other studies utilise the flexibility of the meshless formulation for the study of wind turbines on floating platforms. These consider, for example, the effects of platform motion on rotor induction (Sebastian and Lackner, 2012), unsteady aerodynamics in the near wake (Jeon et al., 2016), rotor performance on a moving platform (Dong et al., 2019), wake dynamics for specific motions (Lee and Lee, 2019), and control optimisation for a coupled aero- and hydrodynamic model (van den Broek et al., 2023).
Most FVW models focus on wake dynamics close to the rotor and, to the best of our knowledge, little validation has been done for the mid to far wake. We define the mid-wake from 1 to 4 D and the far wake beyond 4 D downstream from the rotor, where D is the rotor diameter. Therefore, this study aims to validate the applicability of FVW models for dynamic wind farm flow control optimisation, especially focusing on wake steering through yaw misalignment. For this purpose, we consider three different turbine model formulations: the three-dimensional actuator-disc model, an extension of the actuator disc with a root vortex to model wake rotation, and an extension to a lifting-line model (van Kuik, 2018). This simplified lifting-line model is also known as the Joukowsky rotor.
The validity of these models for wake predictions under yaw misalignment is evaluated with three sets of experimental data from wind tunnel measurements: first, a set of data that consists of lidar measurements of wind turbine wakes under steady yaw misalignment (Hulsman et al., 2022b); second, a set of time-resolved particle-image velocimetry measurements of the wake following a step change in yaw angle (van der Hoek et al., 2023a); and third, turbine output measurements from an experiment for yaw-based wake steering with wind direction variation (Hulsman et al., 2023).
The contribution of this paper is twofold: (i) an analysis of model parameter choice and suitable levels of simplification of the turbine representation for modelling the wind turbine wake and (ii) a validation of free-vortex wake models for mid- to far-wake power predictions with wind tunnel data, in light of control optimisation for yaw control.
The remainder of this paper is structured as follows. Section 2 presents the free-vortex method and develops the three different models of the wind turbine wake, followed by a study of parameter sensitivity and convergence in Sect. 3. The data sets from the wind tunnel experiments and methods for validation are presented in Sect. 4. The results are discussed in Sect. 5, and, finally, the conclusions are shown in Sect. 6.
First, we construct the models of the wind turbine wake that are studied in this paper. The free-vortex methods and straight-line vortex filament definition are introduced in Sect. 2.1. Using these filaments as building blocks, the three wind turbine representations for wake modelling for control optimisation are then described in Sect. 2.2.
2.1 Free-vortex wake
The basis of the vortex methods is the vorticity formulation of the Navier–Stokes equations. The FVW method is based on Lagrangian particles that advect downstream. These particles induce a velocity based on their associated circulation strength. The resultant flow velocity may be calculated at any position based on the freestream velocity and the sum of induced velocities. The vorticity formulation requires the assumption of inviscid and incompressible flow, although diffusion may be approximated. For a further description of the fundamentals, the reader is referred to aerodynamic literature, such as Leishman (2000) or Katz and Plotkin (2001).
2.1.1 Vortex filaments
The three-dimensional model formulations in this study are based on straight-line vortex filaments. The induced velocity ui∈ℝ3 at a point x0∈ℝ3 is calculated with the Biot–Savart law from a single vortex filament starting at x1∈ℝ3 and ending at x2∈ℝ3, with vortex strength Γ,
where the relative positions r∈ℝ3 are defined as
A Gaussian core with core size σ is included to regularise singular behaviour of the induced velocity close to the vortex filament:
2.1.2 Convection of vortex filaments
Vortex filaments are convected over time according to the combination of the freestream velocity u∞∈ℝ3 and the total velocity induced by all filaments uind∈ℝ3 at the vortex position x∈ℝ3,
where is the time derivative of the vortex position. At fixed intervals, a new set of vortex filaments is released from the rotor according to the wind turbine model definition. The oldest set of vortex filaments is then discarded from the simulation such that a fixed number of sets of filaments nr is maintained.
2.1.3 Modelling viscous diffusion
Turbulence is not explicitly accounted for when using the FVW to construct models of wind turbine wakes. However, growth of the vortex core may be used to approximate the effects of turbulent and viscous diffusion as
which is Squire's modification of the diffusive growth of the Lamb–Oseen vortex core (Squire, 1965), with the discrete time step k, constant α=1.25643, effective turbulent viscosity coefficient δ to tune the core growth, kinematic viscosity , and time step Δt.
2.2 Wind turbine models
The wind turbine models used for this study are the three-dimensional actuator disc as used by van den Broek et al. (2022a), an extension with rotation, and a lifting-line model. These three concepts are illustrated in Fig. 1. Note that a two-dimensional actuator disc could be considered to be a further simplification of the wind turbine wake under axisymmetric conditions. It is however not considered in the current study because it has already been shown to be ineffective in modelling the wind turbine wake under yaw misalignment due to a lack of axisymmetry (van den Broek et al., 2022a).
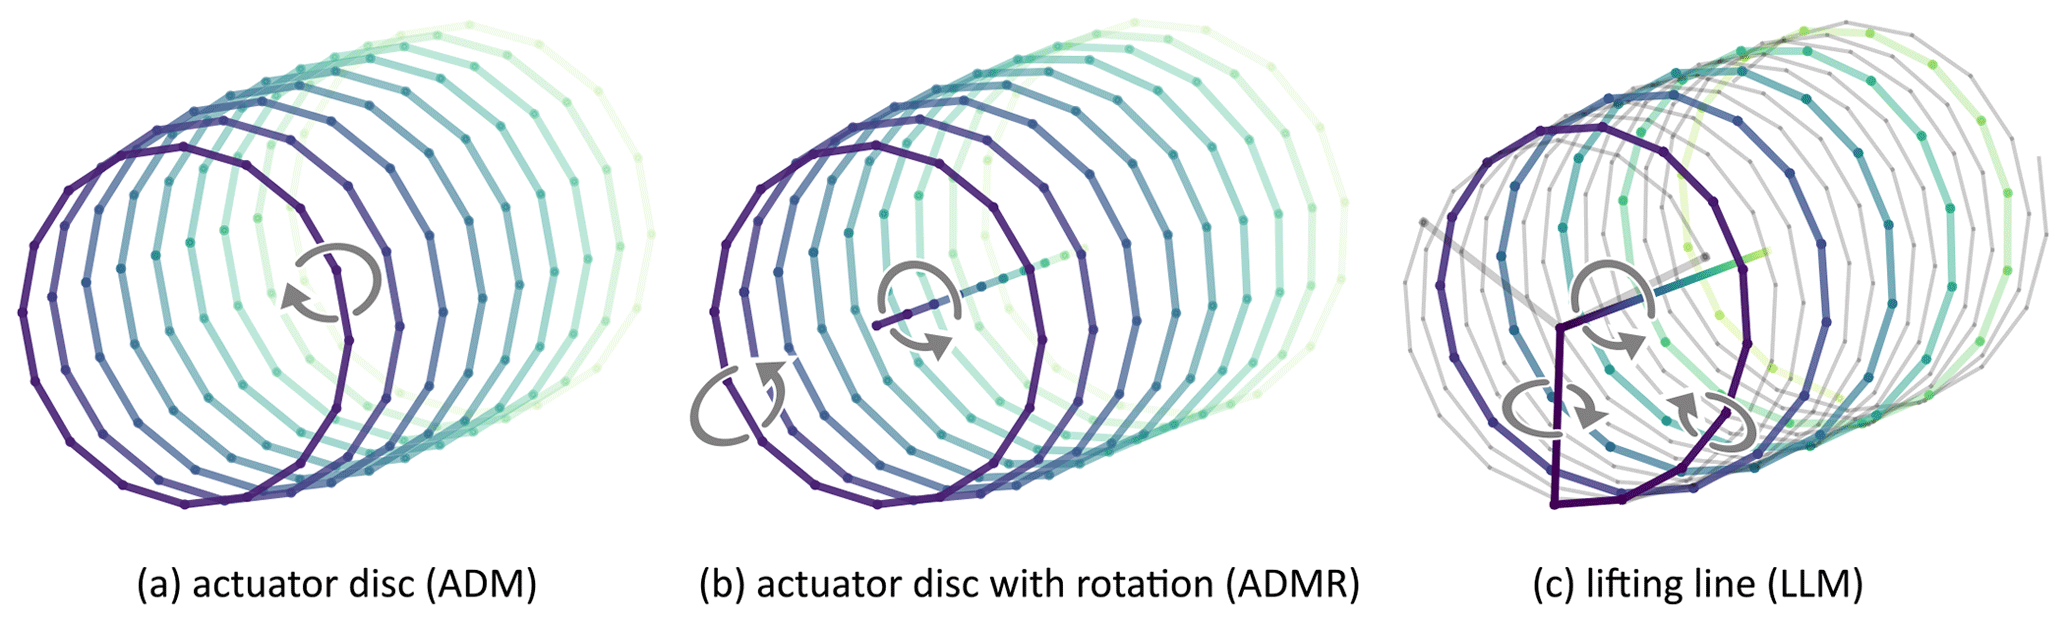
Figure 1The vortex filament structures and the direction of circulation for the three different free-vortex wind turbine representations under consideration: (a) the actuator disc model (ADM) builds up a wake with discretised vortex rings; (b) the actuator disc model with rotation (ADMR) adds a root vortex along the wake centre to model swirl due to turbine rotation; and (c) the lifting-line model (LLM) models individual blade circulation, tip vortices, and a combined root vortex. In (c), the vortex structure from a single blade is highlighted for clarity.
2.2.1 Coefficients for wind turbine modelling
The turbine thrust T is calculated according to the magnitude of the freestream inflow velocity u∞,
with thrust coefficient ct, air density ρ, and rotor swept area Ar. The thrust is assumed to vary over yaw misalignment γ with a cosine exponent βt, which may be adjusted to represent experimental data. Similarly, aerodynamic power pa is calculated with the power coefficient cp as
where the exponent βp can be used to tune power variation over yaw misalignment, as seen in Hulsman et al. (2022a). The thrust and power coefficient are assumed to be a function of the axial induction factor a normal to the rotor based on momentum theory,
with the parameter ct1=2.3 and the induction at the transition point . The thrust coefficient calculation is based on momentum theory with a transition to a linear approximation for high induction values, which is an empirical correction based on the Glauert correction (Burton et al., 2001). The induction factor is used as a control input to determine thrust and power; it is assumed to be uniform over the rotor disc.
2.2.2 Actuator disc model (ADM)
An actuator-disc representation of a wind turbine is implemented with the free-vortex method and illustrated in Fig. 1a. The actuator disc is assumed to be uniformly loaded, so it only sheds vorticity along its edge (Katz and Plotkin, 2001).
At fixed time intervals Δt, a vortex ring discretised in ne vortex filaments is generated at the edge of the rotor. The vorticity Γ generated along the edge of an actuator disc is directly related to the pressure differential generated by the disc (van Kuik, 2018),
where this pressure jump is due to the thrust force. The vortex system is a finite cylinder because a finite number of vortex rings nr are released. This approximates the theoretical semi-infinite vortex system. The numerical parameters for the model are listed in Table 1.
Table 1Numerical parameters for the FVW models as used for this validation study.
The vorticity generated by the ADM is purely azimuthal as long as the turbine is yaw-aligned with the freestream wind direction. Under yaw misalignment, the vortex rings deform into the characteristic curled shape of the wake as a counter-rotating vortex pair is formed.
2.2.3 Actuator disc model with rotation (ADMR)
An extension of the ADM is the actuator disc model with rotation (ADMR). A root vortex is released along the centre line of the wake as shown in Fig. 1b. Note that the associated distributed vorticity over the disc and the wake boundary is neglected. This root vortex models the swirl in the wake induced by the rotation of the wind turbine rotor. The inclusion of rotation may contribute to modelling asymmetry in wake steering.
Assuming again that the rotor is uniformly loaded, the thrust force is equally distributed over each of the blades,
where L is the individual blade loading, and nb is the number of blades. The bound vorticity at the blade Γb is then calculated according to the Kutta–Joukowsky theorem,
with the relative velocity urel along the blade r with rotational velocity ω. Integration over the blade length then yields
where λ is the tip-speed ratio and R the rotor radius. The bound vortex strength of a single blade is then
Combining circulation of the bound vortices of each blade yields the root vortex strength Γr,
2.2.4 Lifting-line model (LLM)
The Joukowsky rotor model is a lifting-line model (LLM) that assumes uniform blade loading, forming a rotating horseshoe vortex system for each blade (van Kuik, 2018). The vortex filament structure is shown in Fig. 1c, where the vortex system from a single blade is highlighted. Each blade is modelled with a bound vorticity Γb as in Eq. (16). The tip vortices coming off from each of the blades have the same vorticity, Γt=Γb. The root vortex is the combination of the bound vorticity of each of the blades, Γr=nbΓb, which is equivalent to the one previously introduced in the ADMR.
An important aspect of the wind turbine models from Sect. 2.2 is the sensitivity to parameter changes. This section explores the convergence behaviour of the ADM with the aim of finding a set of suitable parameters in terms of numerical convergence. These parameters are then used for the comparison with wind tunnel data in Sect. 4. For brevity, the convergence behaviour of the ADMR and LLM is performed but not included, as the results are similar to the ADM. The reference parameter values for all three models are listed in Table 1. The study is split into four parts: first, the effect of the streamwise spatial discretisation in Sect. 3.1; second, time discretisation in Sect. 3.2; third, the sensitivity to the azimuthal spatial discretisation of the vortex rings in Sect. 3.3; and, fourth, the effect of the core size in Sect. 3.4.
3.1 Streamwise spatial discretisation
The streamwise spatial discretisation of the ADM is studied by constructing a cylindrical vortex tube with a length of 12 D from discretised vortex rings, approximating the ADM wake. The spacing between vortex rings is varied to study the effect on the wake deficit without the effects of temporal evolution. The number of rings is adjusted accordingly to maintain a constant wake length, and the circulation of the vortex filaments is adjusted to maintain the same distribution of total circulation. The velocity error εu is defined as
where u is the induced velocity on the wake centre line, and uref is a reference value, which is generated for a spacing of .
The convergence behaviour of the velocity deficit with an increasing number of rings is first order as is illustrated in Fig. 2.
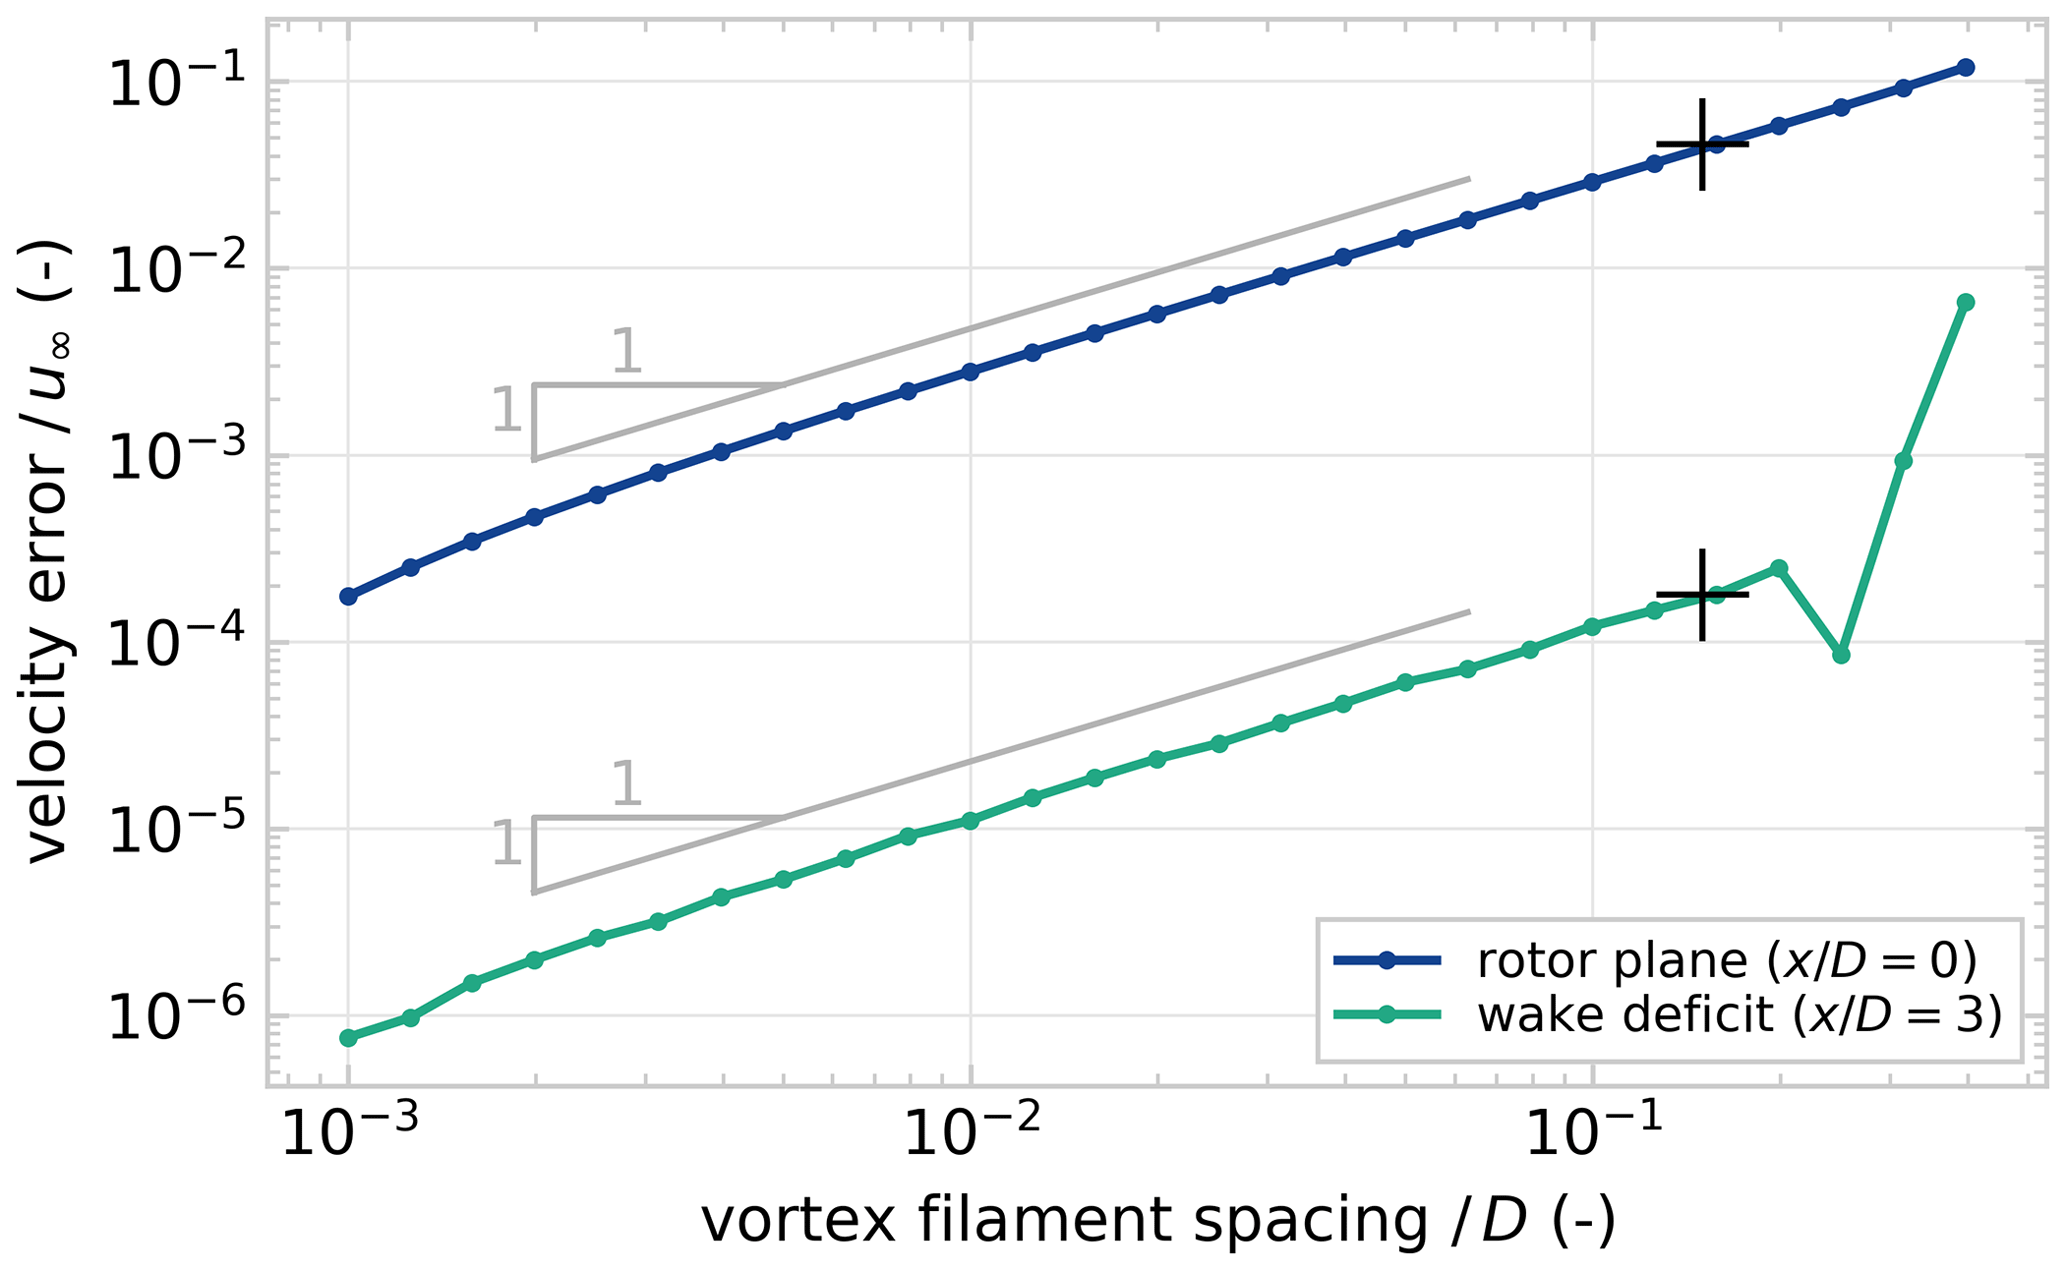
Figure 2Relative error in the velocity deficit at the rotor plane and at a downstream distance . The spacing between the vortex rings is varied, and circulation strength of the filaments is adjusted accordingly. The reference solution for spacing . The crosses (+) mark the approximate streamwise spacing produced for as used throughout this paper.
The variation in error over filament spacing within the wake, at , is small compared to the variation in error at the entry of the tube, which corresponds to the rotor plane, . The sharp increase in error for for the coarsest spacing is caused by an insufficiently large core size, which produces an oscillating velocity profile in the wake. This is not an issue as the core size used in the rest of this paper produces a smooth velocity deficit profile for the chosen numerical settings; i.e. there are no significant oscillations in velocity magnitude along the wake centre streamline. The inflow at the rotor disc varies a lot for different filament spacing values, which limits the consistency of using local velocity measurements at the rotor plane.
It is important to note that streamwise spatial discretisation is directly connected to the time discretisation and the computational complexity. The largest possible time step is such that a vortex ring is released at every time step. High spatial resolution is thus only possible for small time steps. Additionally, the large number of elements required to generate a wake of sufficient length with high streamwise resolution leads to large increases in the computational cost of the induced velocity calculation; the cost of the induced velocity evaluation increases quadratically with the number of vortex filaments. Small time steps and expensive induced velocity calculation both contribute to a significant increase in computational cost for a given prediction horizon. Therefore, a relatively large time step and coarse spatial resolution are chosen for the purpose of efficient optimisation of wind turbine controls.
The ADMR introduces a single extra vortex filament per time step compared to the ADM, which makes it about 1.1 times more expensive with the current numerical settings. The LLM requires 4 times as many filaments as the ADM for a wake of the same length, which makes a single time step 16 times more expensive. Accounting for the smaller time steps, simulating a given time with the LLM is theoretically about 140 times more expensive than the ADM.
A small benchmark is run on a regular laptop running Windows 10 on an i7-8650 CPU at 1.90 GHz with 8 GB RAM. The benchmark is run in Julia 1.8.0 using the BenchmarkTools module. For comparison to real-time flow, a rotor diameter of D=200 m and inflow wind speed are used. The ADM simulates a single wake for 600 s of real-time flow in 0.9 s, or 670 times faster than real time. The same simulation takes 1.1 s with the ADMR and 85 s with the LLM, approximately 550 times and 7 times faster than real time, respectively.
To put these numbers into perspective, evaluating a single wake in FLORIS with the cumulative-curl model (Martínez-Tossas et al., 2019) takes about 2 ms on the same laptop. However, this is a steady-state, time-averaged engineering approximation of the wake – it includes no dynamics. A large-eddy simulation of the wake would include dynamics but requires at least several hours on a computing cluster and is infeasible to run on a regular laptop.
3.2 Time discretisation
The time discretisation of the FVW is studied by examining convergence for a first- and second-order integration scheme. In order to perform this convergence experiment, it is necessary to decouple streamwise spatial discretisation and time discretisation. We reformulate the problem such that a number of sub-steps may be taken between releasing vortex rings.
The largest time step considered is , where one set of vortex filaments is released at every step. From there, the time step is reduced to , and a reference solution is generated with a step size of . The convergence is then quantified using the mean position error εx of all vortex filaments with respect to the reference solution,
where xi are the np coordinates defining the positions of the vortex filaments, and xref,i is the reference solution.
Figure 3 shows the convergence of time integration of the wake from a yaw-misaligned rotor for decreasing step size with the first-order explicit Euler method as used in this paper and with the second-order explicit Heun method for comparison. The convergence for a yaw-aligned rotor exhibits similar trends and has been omitted for conciseness.
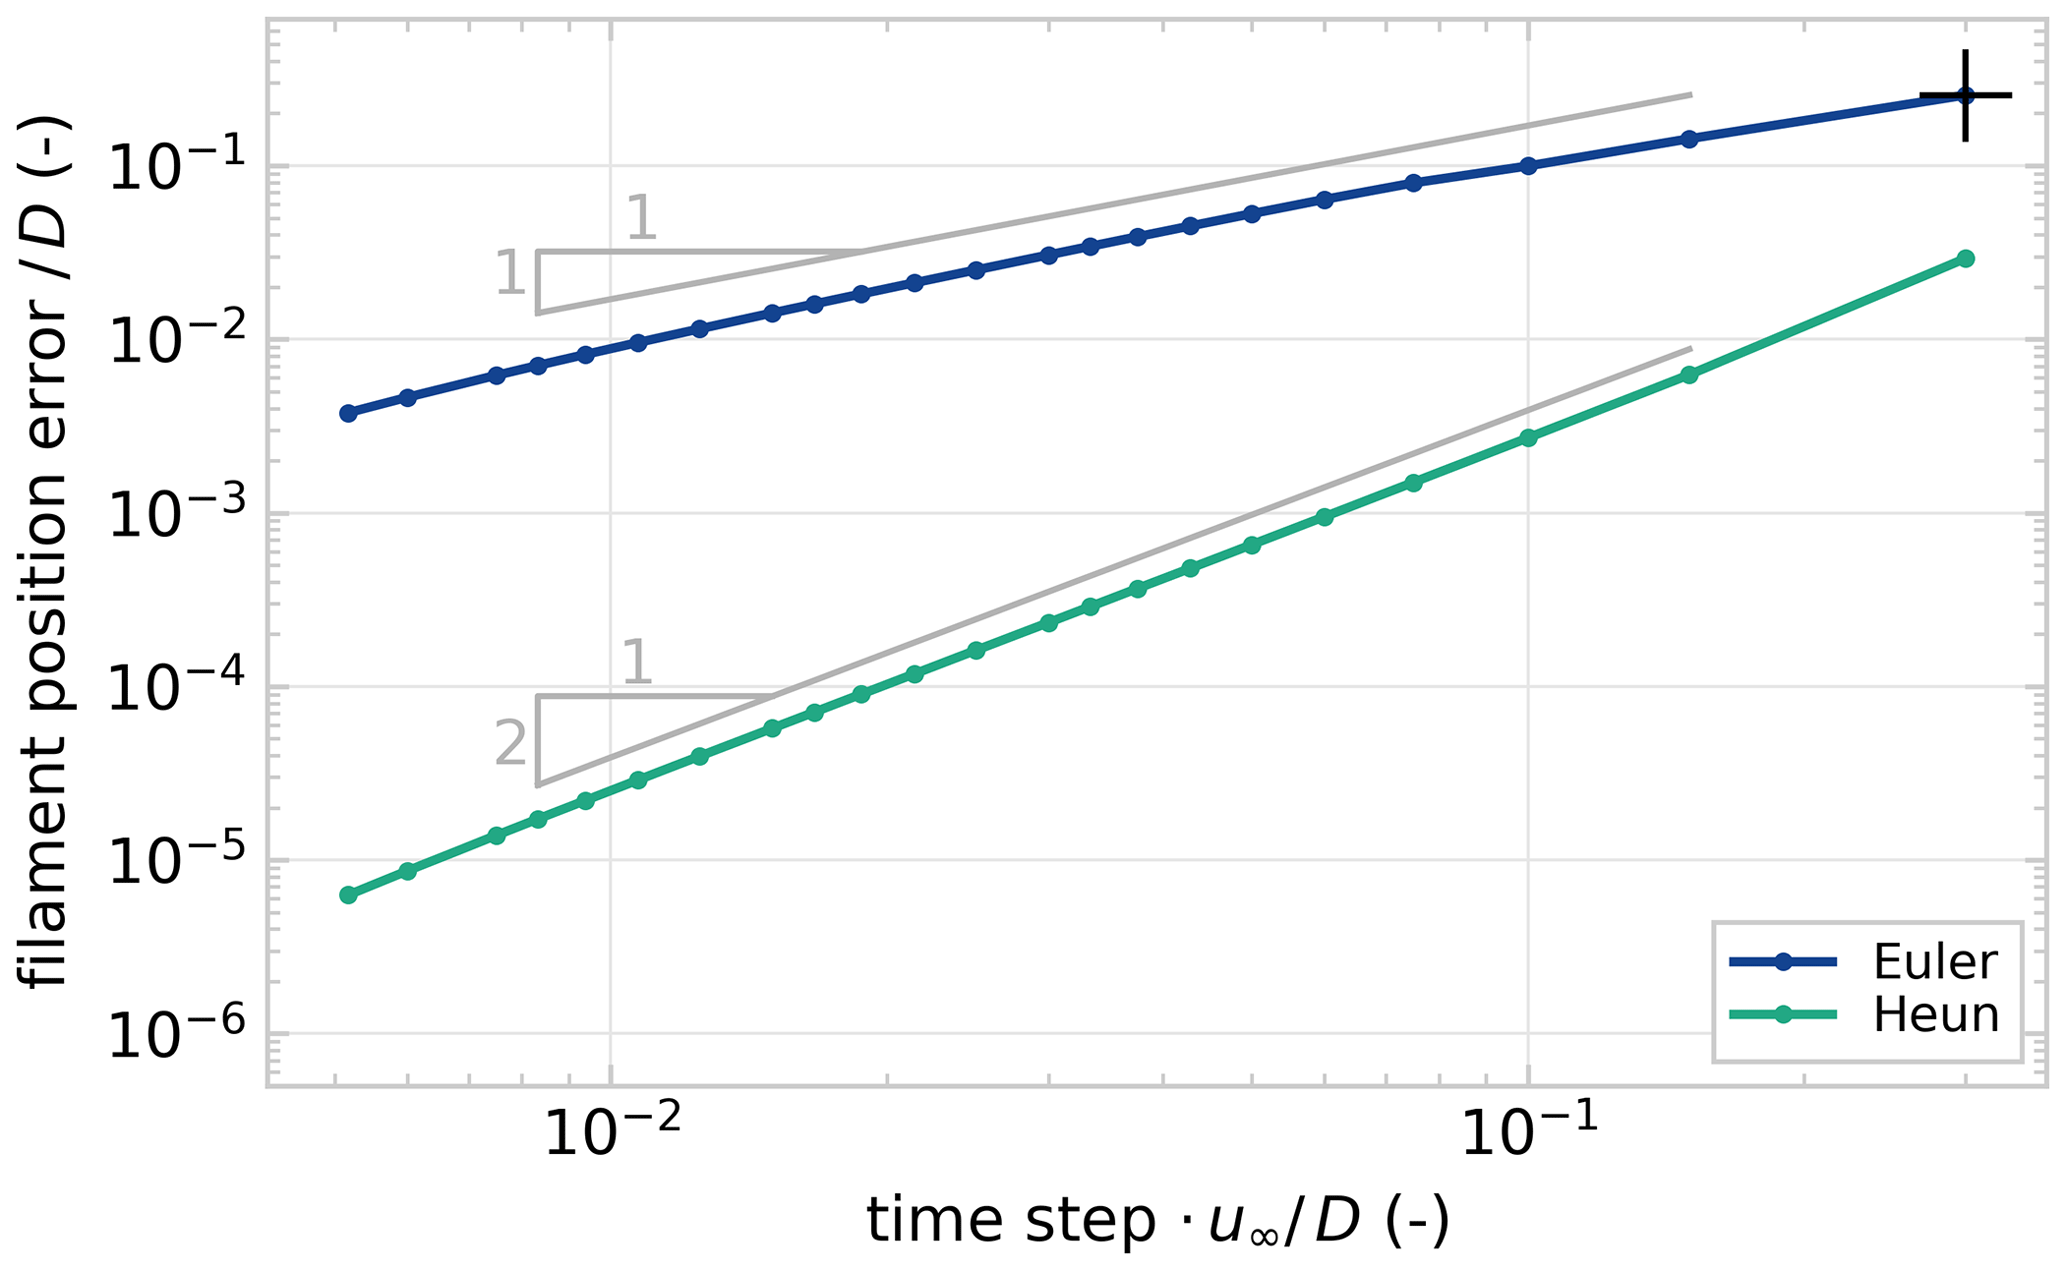
Figure 3Relative error in the position of the vortex filaments for varying time discretisation, comparing the first-order explicit Euler method and the second-order explicit Heun method in simulating the wake of a yaw-misaligned rotor. The reference solution for time step . The cross (+) marks as used throughout this paper.
For the numerical parameters presented here, the methods converge as expected. The chosen time step is rather large because of the emphasis on computational efficiency for control optimisation. This is also the reason for choosing explicit Euler, as it requires only a single function evaluation per time step. If a higher degree of convergence is required from the time integration, a change in integration method is more efficient than a reduction in time step.
3.3 Azimuthal spatial discretisation
The convergence of azimuthal discretisation is tested by varying the number of elements in the vortex rings. A simulation with a yaw misalignment of 30∘ under steady inflow is performed for the different discretisation steps. When the initial transient of the developing wake is passed, a cross-stream profile of rotor-averaged velocity is recorded. The rotor-averaged quantity is chosen because of the intended application for power predictions, where downstream turbines inherently average flow quantities over the rotor area in the power output. The error norm of this deficit profile εd is
where ur(y) is the rotor-averaged velocity at cross-stream position y, and the reference solution is generated for ne=512 elements in the ring discretisation.
Figure 4 shows that the velocity deficit profile converges for increasing number of vortex filaments in the vortex ring discretisation. The azimuthal discretisation in the current study is for ne=16.
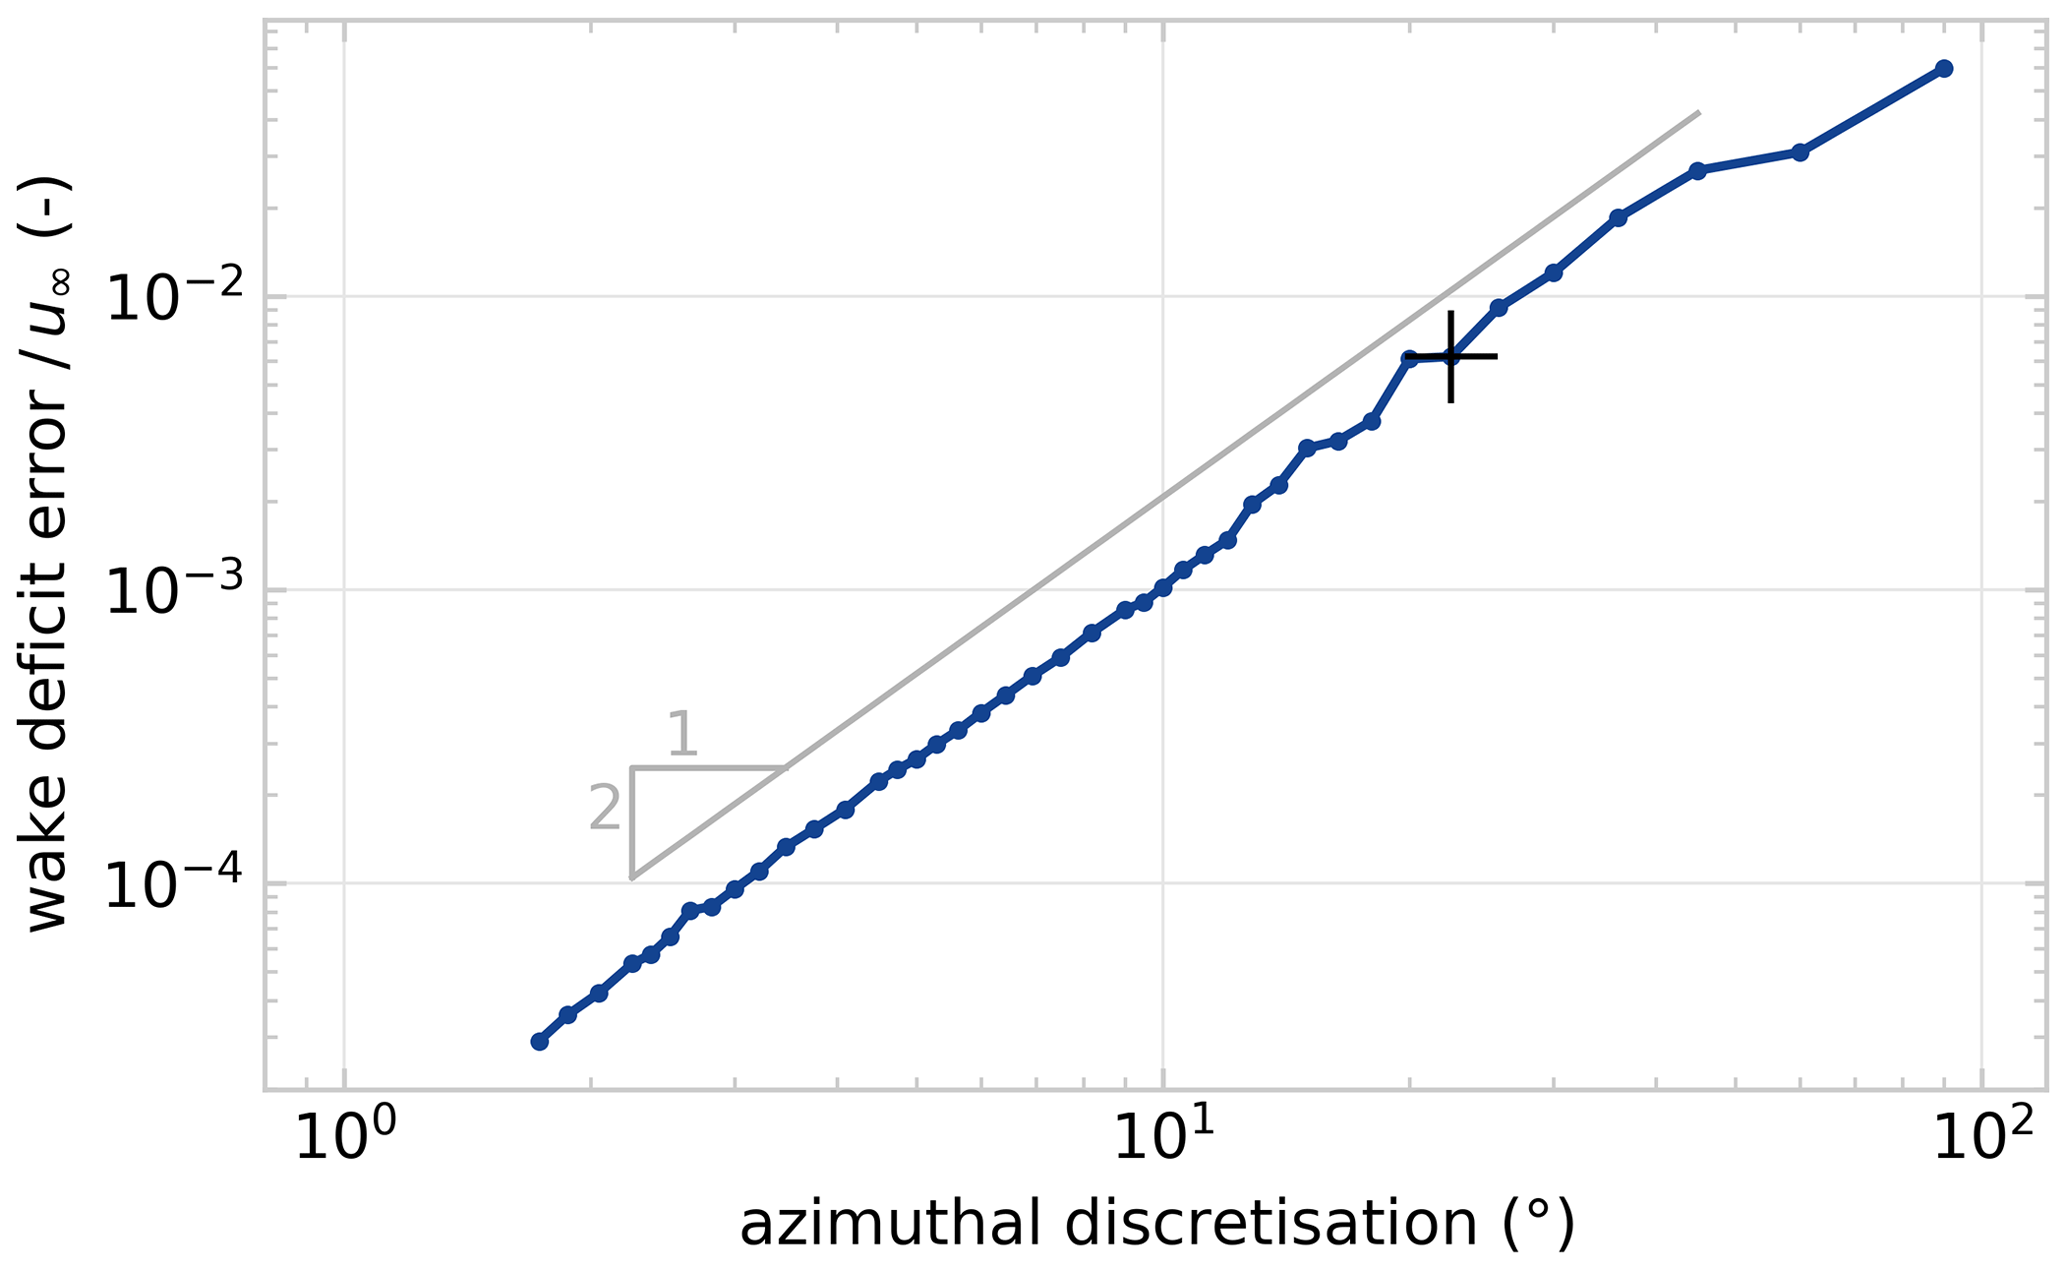
Figure 4Relative error in the cross-stream rotor-averaged velocity profile at 5 D downstream for the ADM under a yaw misalignment of . The azimuthal discretisation is , and the reference is at 0.7∘ for ne=512 elements. The cross (+) marks 22.5∘ for ne=16 as used throughout this paper.
The time discretisation of the LLM is chosen such that it achieves the same azimuthal resolution, which is for . A time step that is 9 times smaller implies 9 times as many vortex rings – the set of vortex filaments released at one time step – are necessary to model a wake of the same length as the ADM. The LLM thus combines a smaller time step and a more expensive velocity calculation due to the larger number of vortex filaments, which makes it less attractive for control optimisation for long wakes.
3.4 Vortex core size
The choice of vortex core size σ plays a major role in the stability of the FVW models as illustrated for the ADM in Fig. 5 for different sizes of the Gaussian vortex core. For small constant core sizes, the wake structure transitions into instability, leading to chaotic development of the wake downstream. For larger core sizes, this disturbance growth is smoothed out, and the wake structure appears more stable. The size of the vortex core needs to be tuned to the streamwise spatial resolution of the wake. It should at least be large enough to guarantee a smooth velocity profile between vortex filaments, avoiding oscillations in the wake deficit. On the other hand, it should be small enough not to lose information.
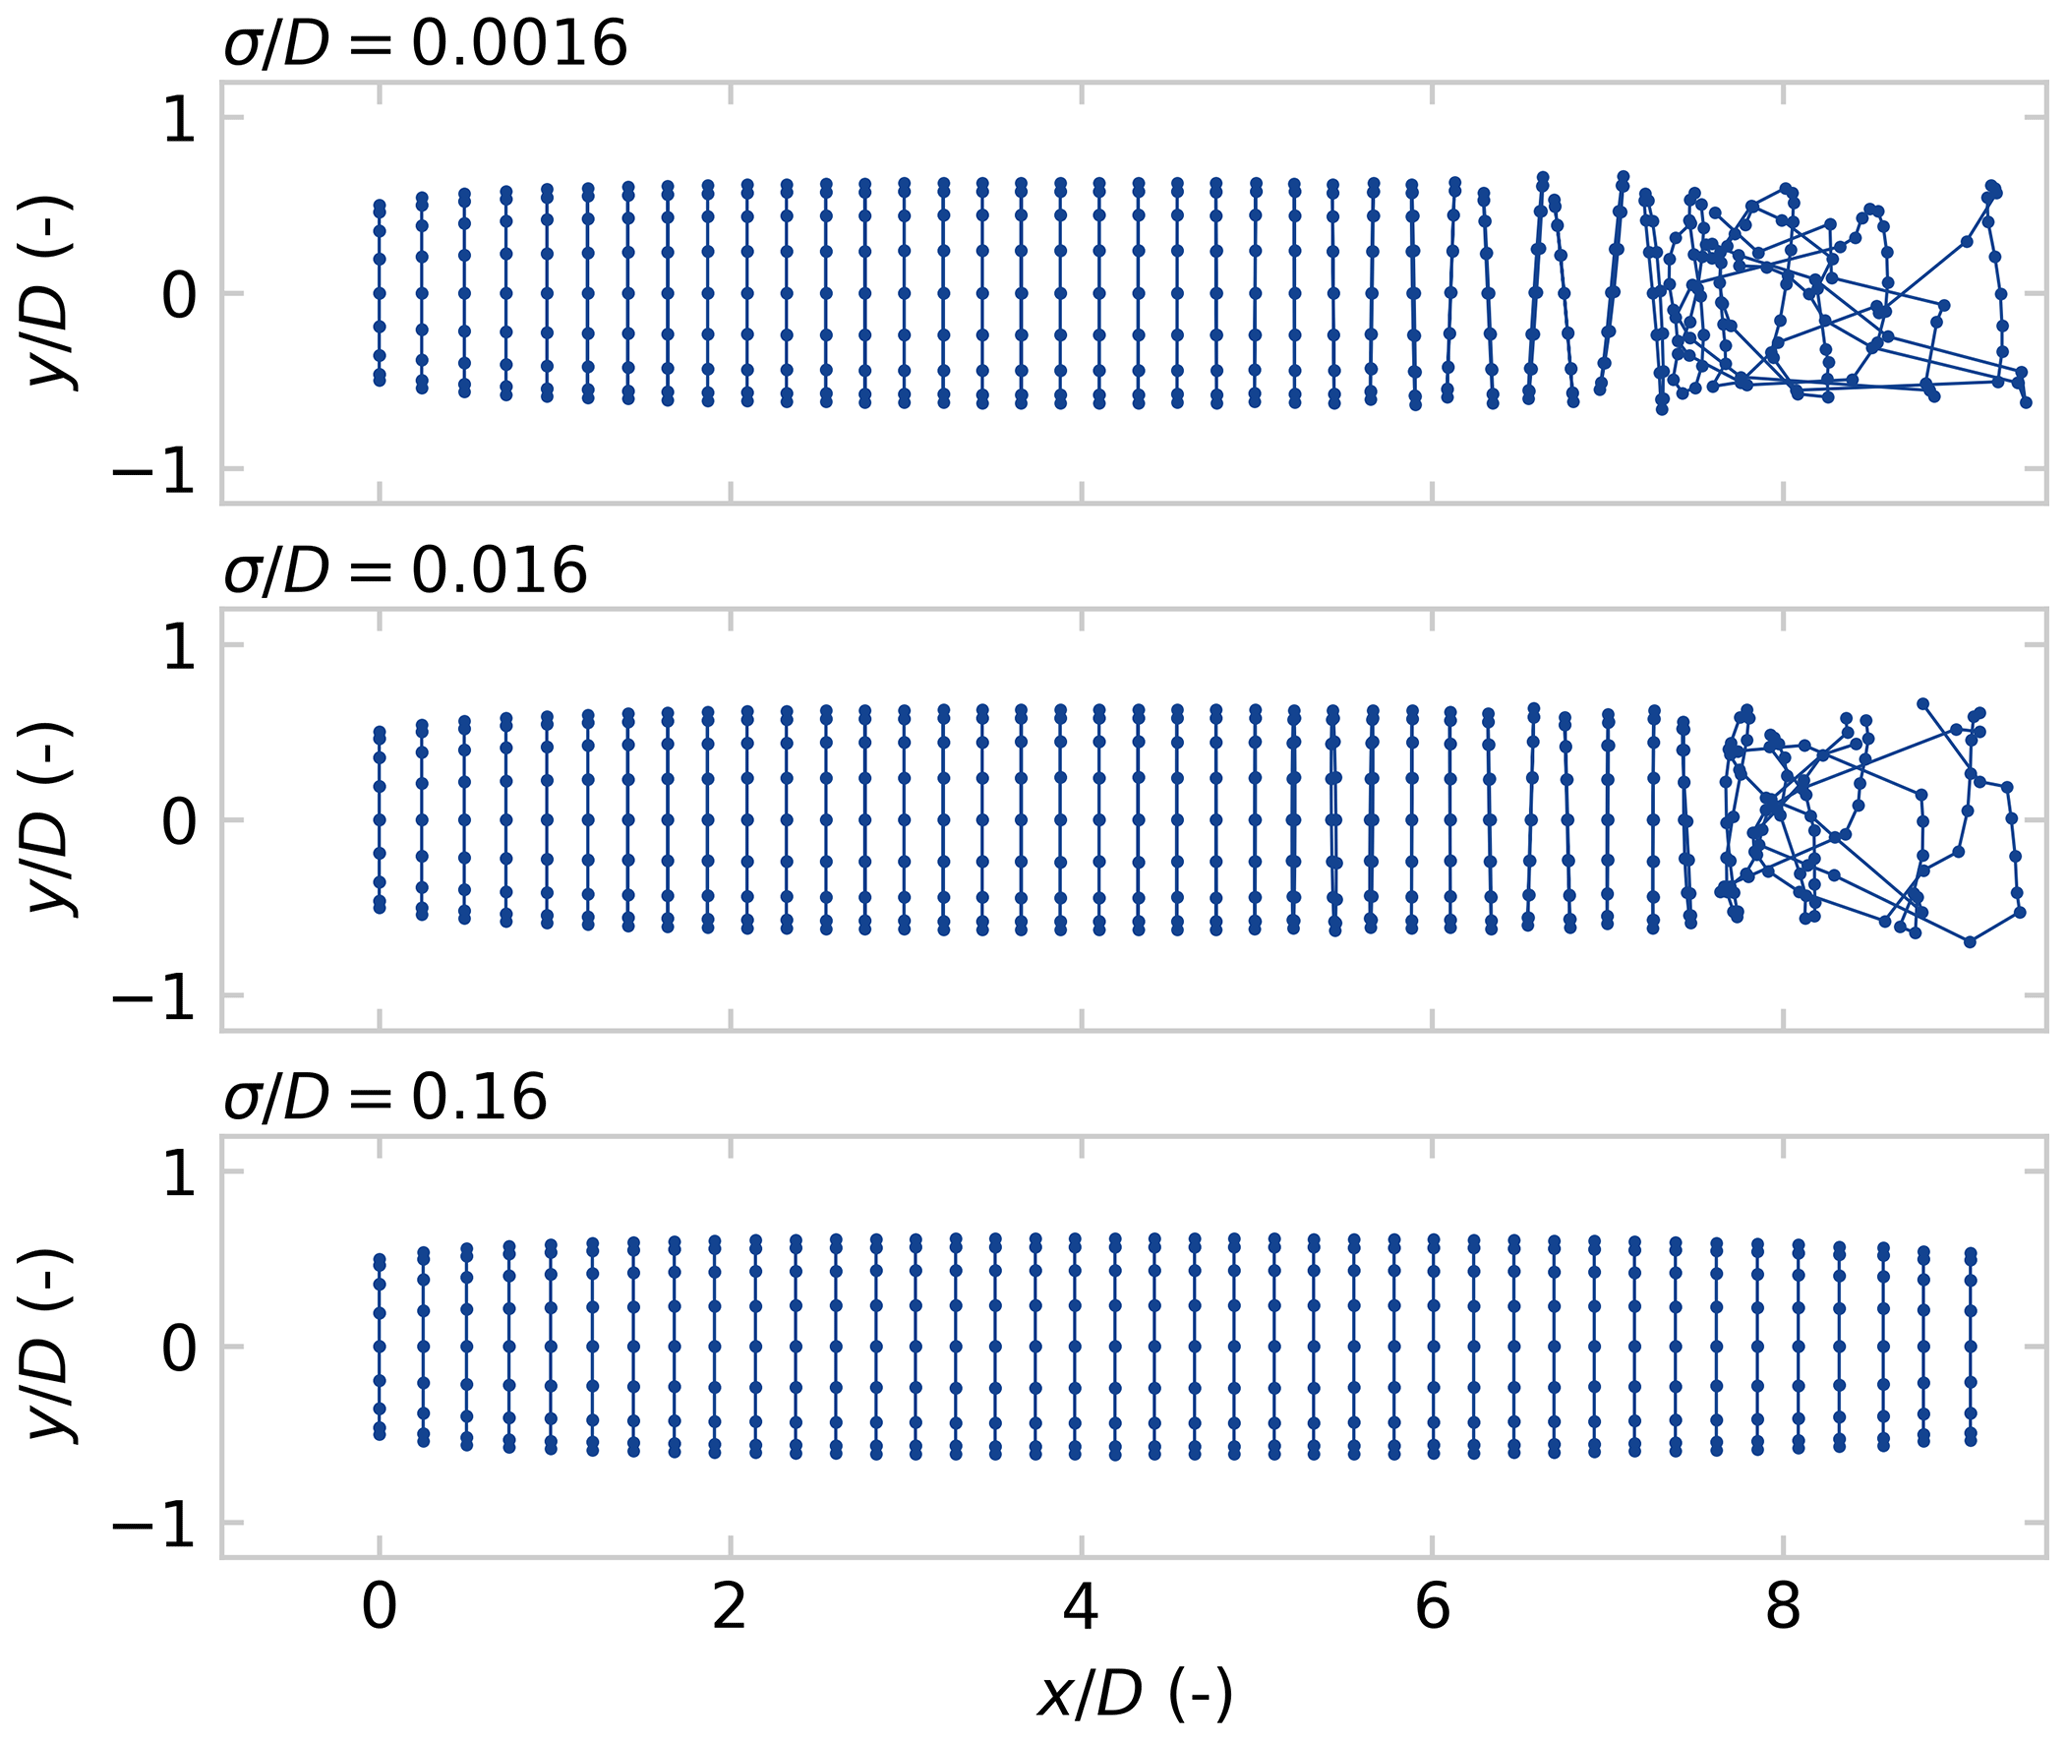
Figure 5Illustration of vortex particle/filament trajectories for varying initial core sizes. Larger core sizes produce more stable, i.e. less unstable, trajectories. The results in this paper are produced for an initial core size .
Variation in the vortex core size has very little influence on the initial wake depth. However, the wake recovery can be tuned with vortex growth, implemented with Eq. (7). Figure 6 shows how increasing the turbulent core growth parameter δ impacts the recovery of the wake and allows for tuning the representation of turbulent mixing. The validation simulations run in this paper are for δ=100, which is chosen to model some wake recovery.
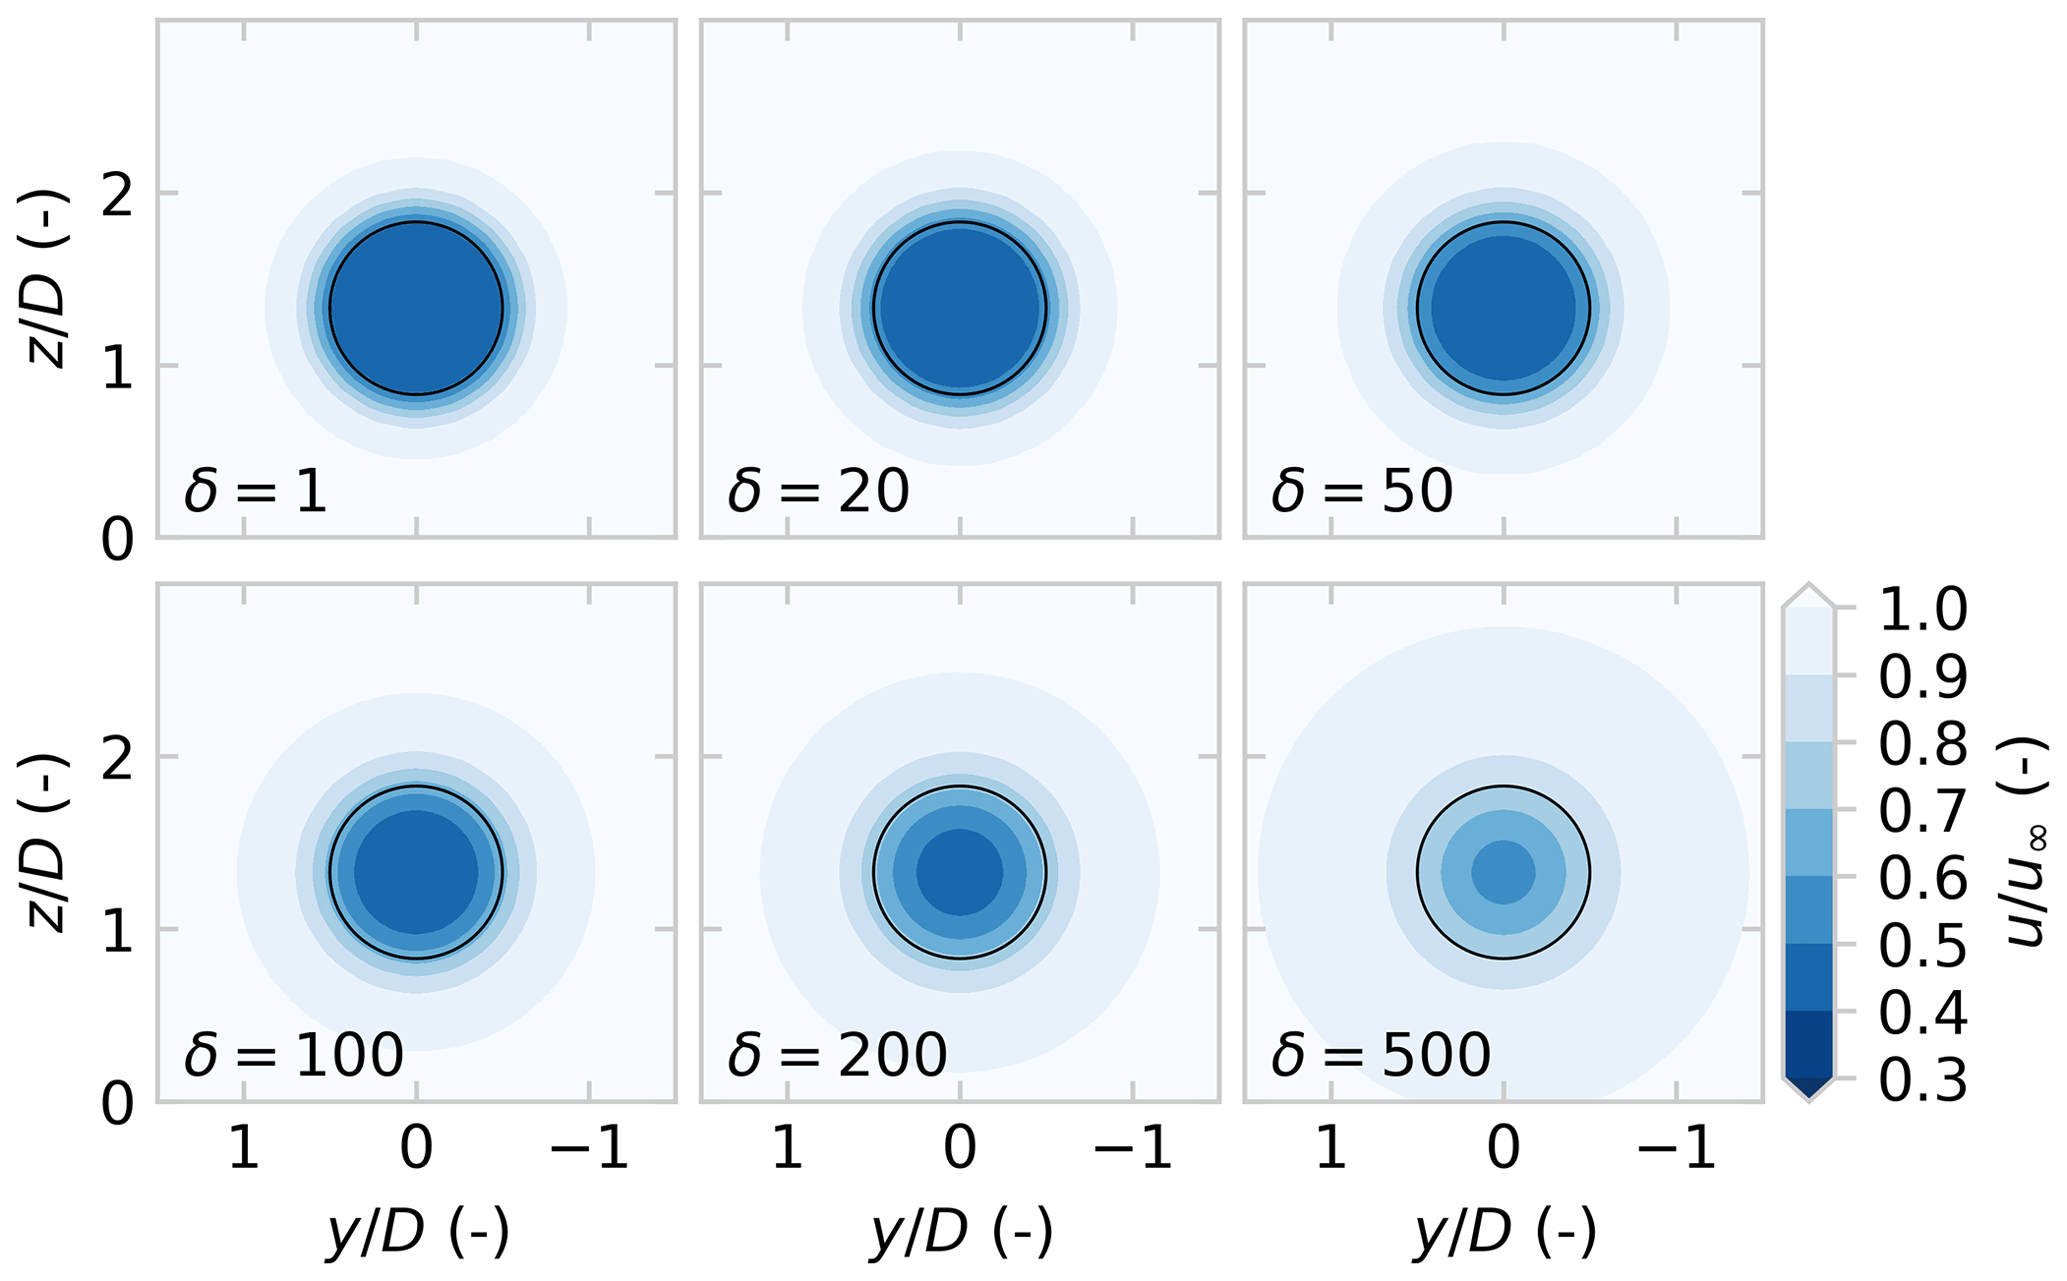
Figure 6Introducing vortex core growth using the Lamb–Oseen model allows for tuning of the diffusion to approximately match turbulent mixing in the wake. Slices at downstream for turbulent growth parameter δ from 1 to 500, with an initial core size .
Following the study of numerical model parameters, it is essential to validate the wake flow and power predictions of the FVW model for yaw control optimisation. This section first presents the available data from the three wind tunnel experiments in Sect. 4.1. The performance measures used to quantify performance are introduced in Sect. 4.2, followed by details on the replication of the experiments with the FVW models in Sect. 4.3.
4.1 Wind tunnel experiments
Three sets of experimental data are used in this paper for the model validation study. The first is a set of steady-state flow measurements for the wind turbine wake under yaw misalignment (Hulsman et al., 2022b). The second is a dynamic experiment with high temporal resolution of a step change in yaw angle (van der Hoek et al., 2023a). The third is a longer set of turbine output measurements for wake redirection with wind direction variation (Hulsman et al., 2023).
The wind direction θ is defined as clockwise positive, with 0∘ along the positive x axis pointing downstream. The yaw angle ψ is clockwise positive with a 180∘ shift such that the rotor is fully aligned with the wind direction if ψ=θ. The yaw misalignment such that an anticlockwise misalignment is positive.
All experiments used the MoWiTO 0.6 turbine with a rotor diameter D=0.58 m (Schottler et al., 2016). The model turbine has pitch control, and the generator can be used for torque control to regulate rotor speed.
4.1.1 Steady yaw misalignment – WTA
The first set of experimental data (labelled WTA) was recorded in the wind tunnel at ForWind, University of Oldenburg, and has been published in (Hulsman et al., 2022b). The wind tunnel has a 3 m × 3 m test section with an active grid, used passively, to control inflow turbulence and boundary layer profiles. It may be operated as an open jet, but for this experiment three movable test sections are installed to form a closed section 18 m in length. The flow circulates in a closed circuit. The experimental data provide measurements of wind turbine wakes under yaw misalignment with steady flow conditions.
The data contain measurements of wakes for yaw misalignment angles . The turbines were mounted at a hub height of 0.77 m. Operation was at a tip-speed ratio of λ=5.7 for aligned flow and λ=5.3 when misaligned. The cross-sectional averaged flow measurements were obtained with a WindScanner lidar performing a Lissajous scan within a 3 D × 3 D area, for uniform and sheared inflow with a turbulence intensity of around 1 %. Wind speed was 7.5 m s−1 at hub height. Only the uniform inflow data are analysed in the current study, primarily the vertical measurement planes at downstream distances from .
4.1.2 Step change in yaw – WTB
The second set of experimental data (labelled WTB) was recorded in the Open Jet Facility (OJF) at the TU Delft, with the same set-up as used in van der Hoek et al. (2023a). The OJF is a wind tunnel with an open jet that runs in a closed circuit with turbulence intensities between 0.5 % and 2 %. A step change in yaw was measured at high temporal resolution using tomographic particle-image velocimetry (PIV).
A PIV set-up with four cameras was used to measure the flow velocity at downstream distances using helium-filled soap bubbles as flow tracers. The seeding rake for these bubbles was placed at the outlet of the open jet. The measurements were recorded at 500 Hz for a 5 s duration. The step change was initiated 1 s after a trigger signal. This trigger also initiated the PIV measurements and was used to synchronise the data at the four downstream distances. The turbine yawed from a to a misalignment with the inflow, at a yaw rate of approximately . The turbine operated at a tip-speed ratio of λ=5.5 for an inflow velocity .
4.1.3 Wind direction variation – WTC
The third set of experimental data (labelled WTC) was again recorded in the wind tunnel at ForWind, University of Oldenburg (Hulsman et al., 2023). Instead of steady yaw misalignment, it provides turbine output measurements of a dynamic yaw experiment. Two turbines were used to test open-loop yaw control strategies under a simulated time-varying wind direction.
The upstream turbine was stationary and yaw-controlled to achieve wake steering. The second turbine was placed 2.66 D downstream with an increased hub height of 0.16 D. The downstream turbine is mounted on an x–y traverse system, which models wind direction variation by translating the downstream turbine along a circular path around the upstream turbine. Effectively, this rotates the wind farm layout in the constant wind tunnel inflow, thus changing the wind direction relative to the turbine alignment. The active grid was used passively to generate inflow with a turbulence intensity TI<1 % and a shear profile with a shear exponent α=0.28, where the wind speed was 7.3 m s−1 at hub height for the upstream turbine.
The yaw set points for the upstream turbine were stored in a lookup table and applied differently for each control experiment. The experiments are labelled BW30, BW60, BW120, BW300, and BW600 based on the length of the wind direction averaging window used in the controller, with shorter windows leading to more frequent yaw variations. Figure 7 illustrates the variation in yaw angle and relative wind direction for the BW30 experiment. Each controller experiment yielded 10 min of turbine data, such as generator power, torque, and rotor speed, recorded with a 5 kHz sampling frequency. The raw data have been filtered with a low-pass filter with a cut-off frequency at 20 Hz for noise reduction before use in the current study.
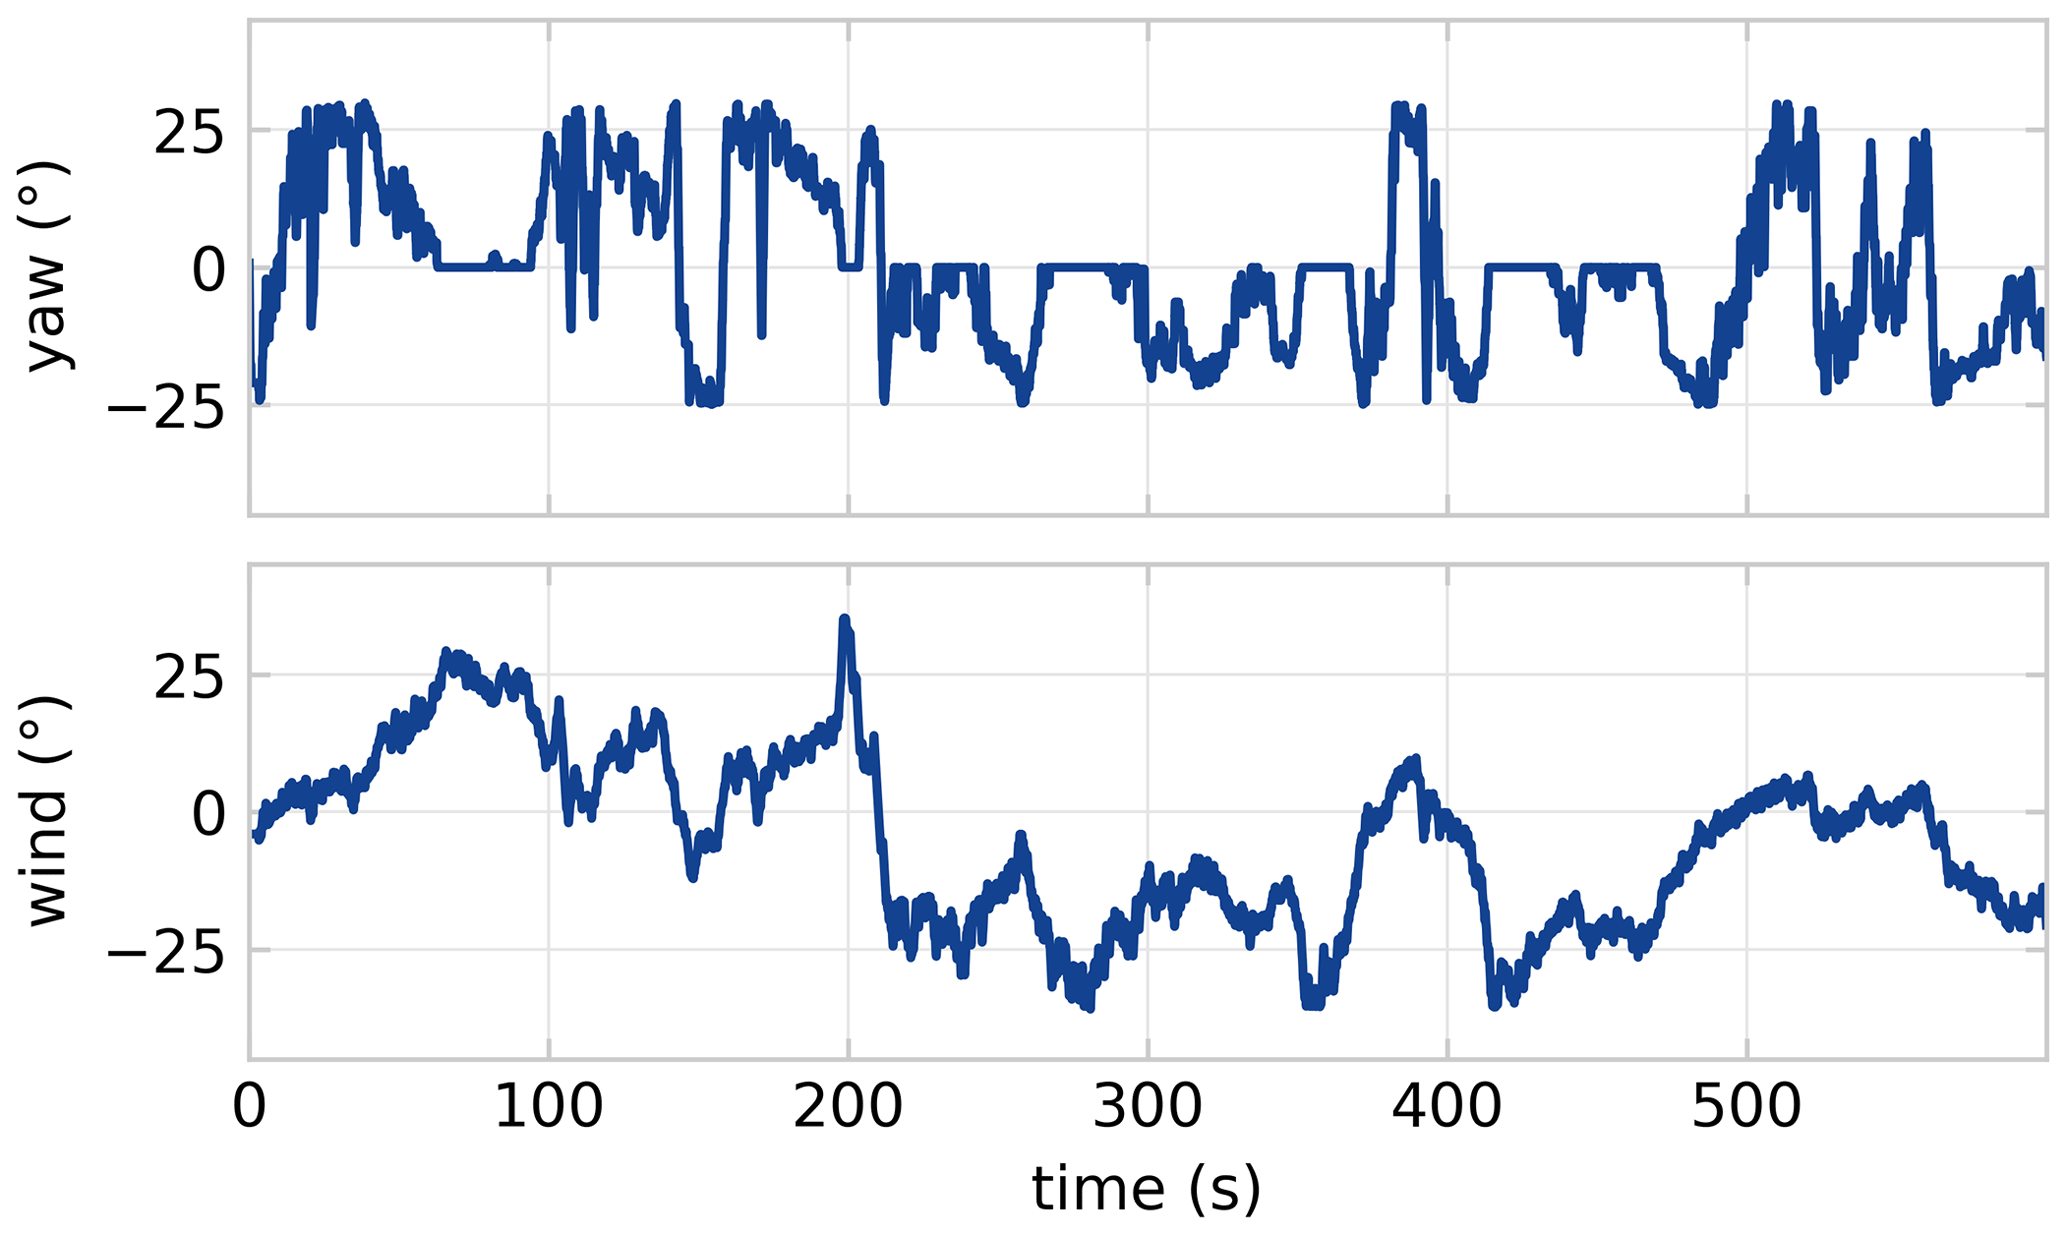
Figure 7Time series data from WTC showing yaw misalignment on the upstream turbine and the wind direction variation for the BW30 experiment. The changes in wind direction are achieved by translation of the downstream turbine on an x–y traverse system.
4.2 Performance measures
The performance measures in this study reflect the purpose of this model. It is oriented towards control for power maximisation, and therefore the predictive qualities for wake deflection and downstream aerodynamic power availability are important aspects to measure.
Wake deflection is determined according to the wake centre position, which is defined as the cross-stream position where aerodynamic power available for a virtual rotor at hub height is minimal. The potential power follows quite directly from the measured or simulated flow field and is directly related to downstream turbine performance as available aerodynamic power p* is calculated from the rotor-averaged velocity ur,
where is the theoretical maximum power coefficient, and n is the unit vector orthogonal to the rotor plane. This is similar to the potential power method introduced in Schottler et al. (2018).
For statistical analysis, the fits of the power predictions are evaluated with the variance accounted for (VAF),
and the normalised mean absolute error (NMAE),
where is the predicted power from the FVW model, and p is the measured power from the wind tunnel. Note that VAF values closer to 100 % indicate better performance, whereas NMAE values closer to 0 % represent a close fit.
A total comparison of power at different yaw angles is performed by binning the results according to wind direction and yaw angle bins and calculating the mean and standard deviation of the power in each bin. The analysis is the same for both model and experimental data, thus allowing equivalent comparison.
4.3 Experiment replication
A visual, qualitative comparison of the available flow measurements provides a general overview of the strengths and weaknesses of each of the models. These are provided for steady-state measurements from WTA and WTB. The cross-stream planes of the flow are considered to be more important than hub height planes because of the three-dimensional nature of wind turbine wakes under yaw misalignment.
A quantitative analysis of the steady-state wake deflection from WTA is performed by analysis of the flow cross-sections for the cross-stream position where potential power is minimal. This is considered to be the wake centre and a measure for predictive power for wake deflection under steady-state conditions.
The WTB experiment is replicated with all three FVW models to analyse the temporal dynamics of the model at high time resolution. The time series of potential power production provide insight into the propagation of yaw effects downstream through the wake.
Finally, the dynamic experiment in WTC is fully replicated with the ADM free-vortex wake model. The upstream turbine is set to the specified yaw angle as recorded in the experiment data and operated under a constant thrust coefficient. The downstream turbine performance is evaluated from the rotor-averaged velocity over a rotor disc at the downstream turbine position. This position varies over time as the turbine is translated to track the specified wind direction from the experiment. For both upstream and downstream turbines, the rotor-averaged velocity is recorded. The downstream velocity is increased by 2.5 % to account for the increased velocity due to the higher hub height in the shear profile of the inflow.
The wake model provides an estimate of the velocity, but the experimental data record generator power. A simple turbine model is specified to account for inertial dynamics,
where ωk is the angular velocity of the rotor at time step k, Δt is the time step size, J is the rotor inertia, pa is the available aerodynamic power, and τ is the generator torque. The generator torque τ is calculated from the angular velocity of the rotor ω as
with the gains k1 and k2. The form of this control law is based on the turbine controller used in the experiment, which was developed by Petrović et al. (2018). Generator torque and angular velocity are multiplied by an efficiency η to obtain a generator power estimate,
The efficiency term is there to capture all inefficiencies in converting aerodynamic power to electrical power, such as a suboptimal power coefficient and drive train losses. The parameters for the turbine model and controller polynomial are found through a least-squares estimate. The controller gains are first estimated using measured rotor speed and generator torque. The rotor inertia and power conversion efficiency are then estimated using the torque controller, modelled wind speed, and measured power at the upstream turbine. The yaw dependency of thrust and power is tuned with respective cosine exponents βt=1 and βp=3. The yaw-aligned thrust coefficient for all experiments is set to ct=0.91 for a=0.33. The final power estimate is filtered with the same low-pass filter that is applied to the experimental data.
This section presents the core results of this paper, the comparison of the model predictions with wind tunnel data for validation. Yaw misalignment under steady conditions is discussed in Sect. 5.1, followed by the time-resolved step change in yaw in Sect. 5.2. Finally, analysis of the wake steering experiment with wind direction variation is provided in Sect. 5.3.
5.1 Steady yaw misalignment – WTA
A visual comparison of cross-stream wake velocity profiles is provided in Fig. 8, illustrating wake development under yaw misalignment angles for experimental data from WTA and simulation results with the ADM, ADMR, and LLM.
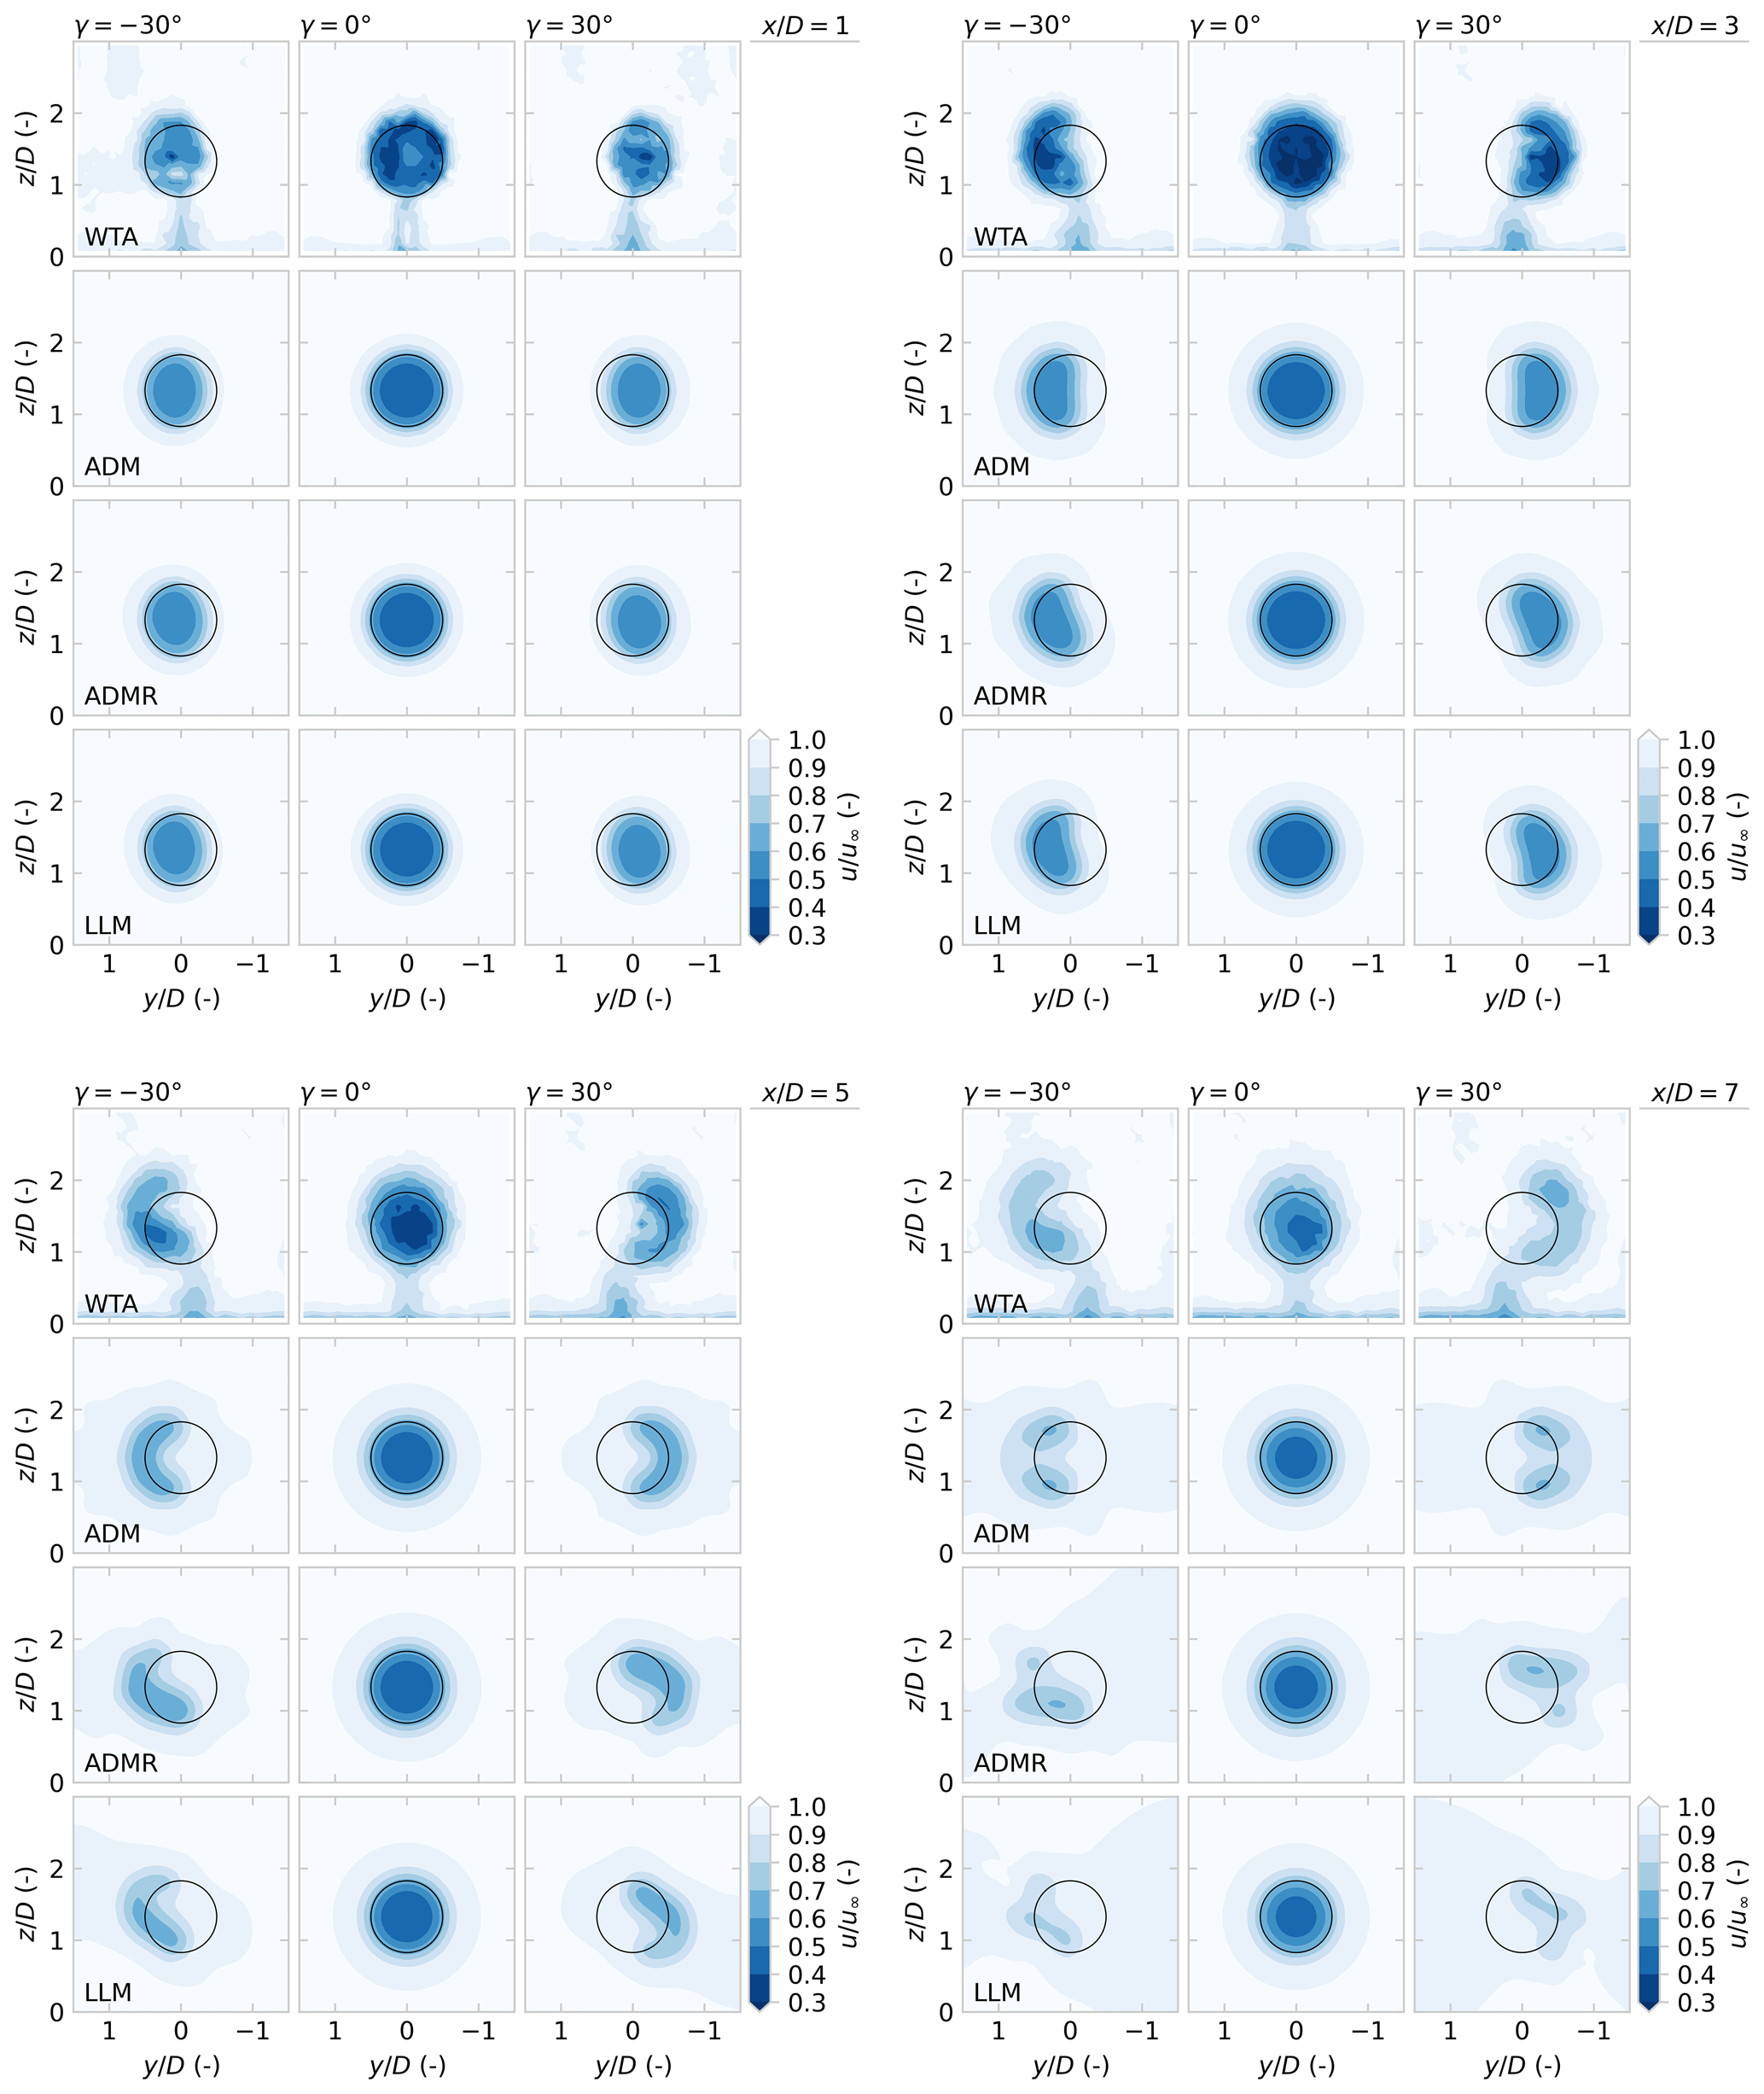
Figure 8A comparison of normalised streamwise velocity for wind turbines under yaw misalignment. The experimental data from WTA are compared to model results with the ADM, ADMR, and LLM with slices at for yaw misalignment angles . All three models represent the curled shape of the wake under yaw misalignment. The inclusion of rotation (ADMR, LLM) improves the qualitative representation of the asymmetry and vertical displacement that is observed in the wind tunnel. The deformation of the vortex filament structure with the LLM beyond becomes too large to provide useful predictions.
For yaw-aligned flow (), the wake is almost axisymmetric, both in the wind tunnel and in the FVW models. The wakes in the FVW are stable with a consistent wake deficit. There is some underestimation of wake depth in the near wake with the current numerical parameter choice as listed in Table 1. Some recovery is modelled through the growth of the Gaussian core, as described in Sect. 3.4, to represent the turbulent mixing that is visible in the wind tunnel measurements.
Both positive and negative yaw misalignment angles result in the generation of a counter-rotating vortex pair and subsequently a curled wake shape, which becomes apparent from 3 D downstream. The ADM produces wakes that are symmetric between positive and negative yaw misalignment, as expected. The inclusion of the root vortex in the ADMR models some of the asymmetry in wake shape that is also present in the experimental data. The LLM produces a similar asymmetric deformation of the wake.
A large deformation of the wake is visible from 5 D onwards for the wake under yaw misalignment. In the FVW models, this leads to stretching of the vortex filaments and unstable wake structures. The wake of the LLM breaks down in particular beyond 5 D downstream because of the large number of vortex filaments in close proximity. The ADMR still demonstrates similar stability in wake structure as the ADM at 7 D downstream, although resemblance of the wind tunnel data is reduced.
Finally, some of the details of the experimental data are not represented in the FVW models. The effect of the wake from the turbine tower on power predictions is assumed to be minor, and therefore it is not considered in the FVW models, although it is present in the wind tunnel measurements. Furthermore, the models assume the rotor to be uniformly loaded, which is not the case in the experiment. The inclusion of non-uniform rotor loading would increase the model complexity but might improve the modelling of wake deflection (Lin and Porté-Agel, 2022). Additionally, the effect of the ground is neglected, whereas the experimental data show a thin boundary layer near the bottom of the wind tunnel. Ground effects in FVW models may be modelled using a mirrored vortex structure (Leishman, 2000). An initial experiment showed that some asymmetry in wake deflection may be achieved this way. However, for the sake of limiting computational complexity, this option is not presented in this study.
The displacement of the wake centre is evaluated according to the cross-stream position where available aerodynamic power is minimal. Figure 9 compares the wake deflection for the data from WTA and the three FVW models. This corresponds to the wakes shown in Fig. 8.
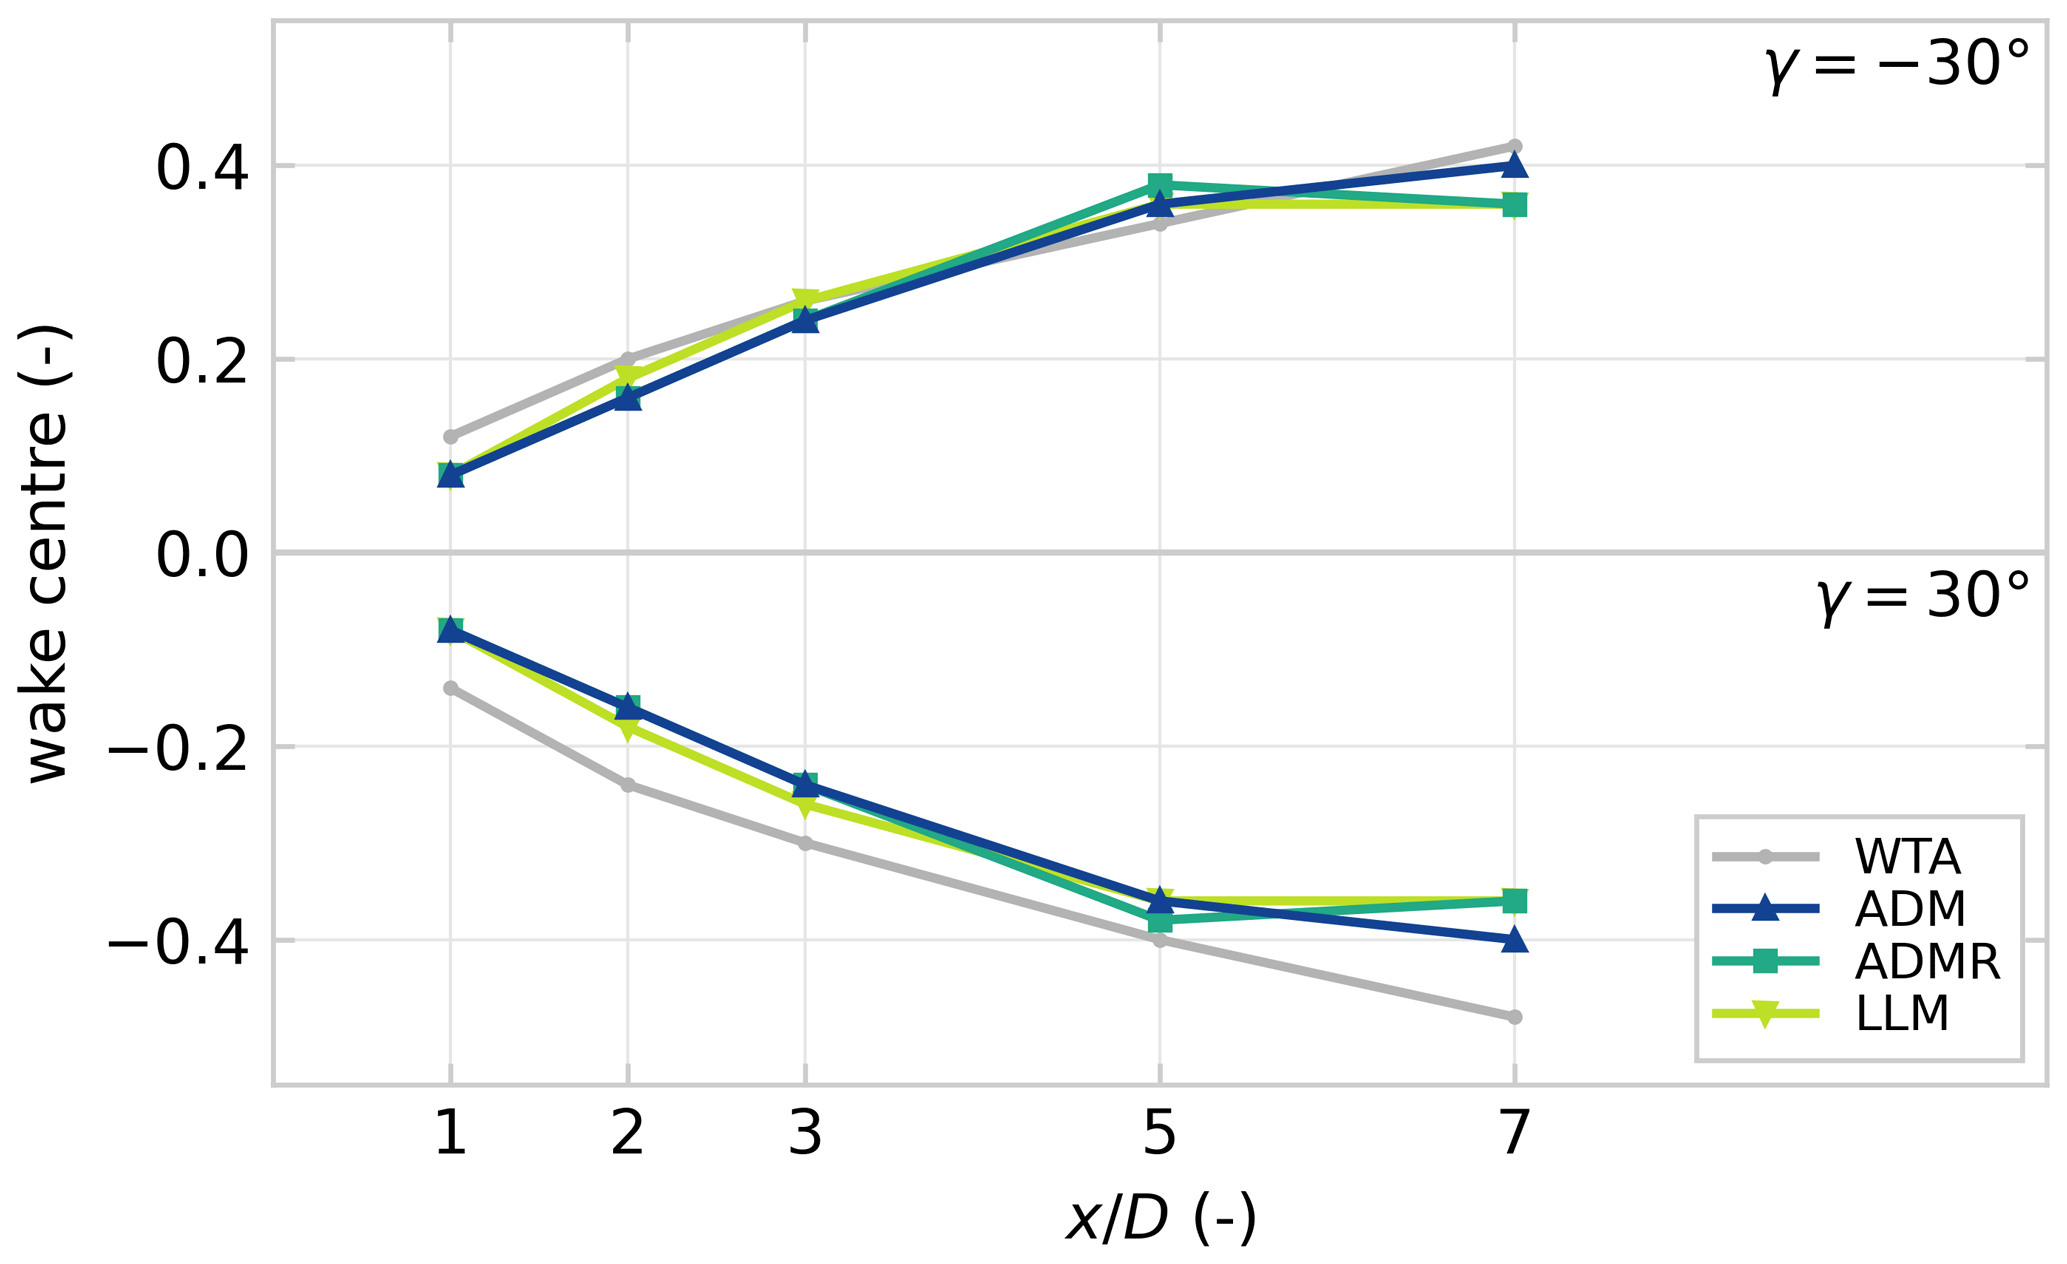
Figure 9Wake centre deflection over downstream distance calculated from the flow slices illustrated in Fig. 8, where the wake centre position is defined as the cross-stream position with minimal available aerodynamic power. The ADM provides the best estimate of wake centre deflection, whereas the rotation in the ADMR and LLM models leads to divergence of the deflection estimate by .
The ADM appears to have the best fit to the experimental data over the measured downstream distances. The ADMR and LLM show a similar deflection profile, which only shows good agreement with the experimental data up to , which matches the visual analysis of the wake structure. Towards 7 D downstream in particular, the wake centre predictions diverge. This is related to the large deformation of the wake under these high yaw angles and the numerical stability of the FVW wake structures. The lack of rotation in the ADM allows for a more stable wake structure and a better prediction of the wake deflection further downstream.
5.2 Step change in yaw – WTB
Experiment WTB recorded wake development at downstream distances for a turbine yawing from to . The cross-stream wake velocity profiles for are shown in Fig. 10 when the wake has settled after the step change. The comparison with the ADM supports the qualitative correspondence under steady-state conditions that was found in comparison with WTA.
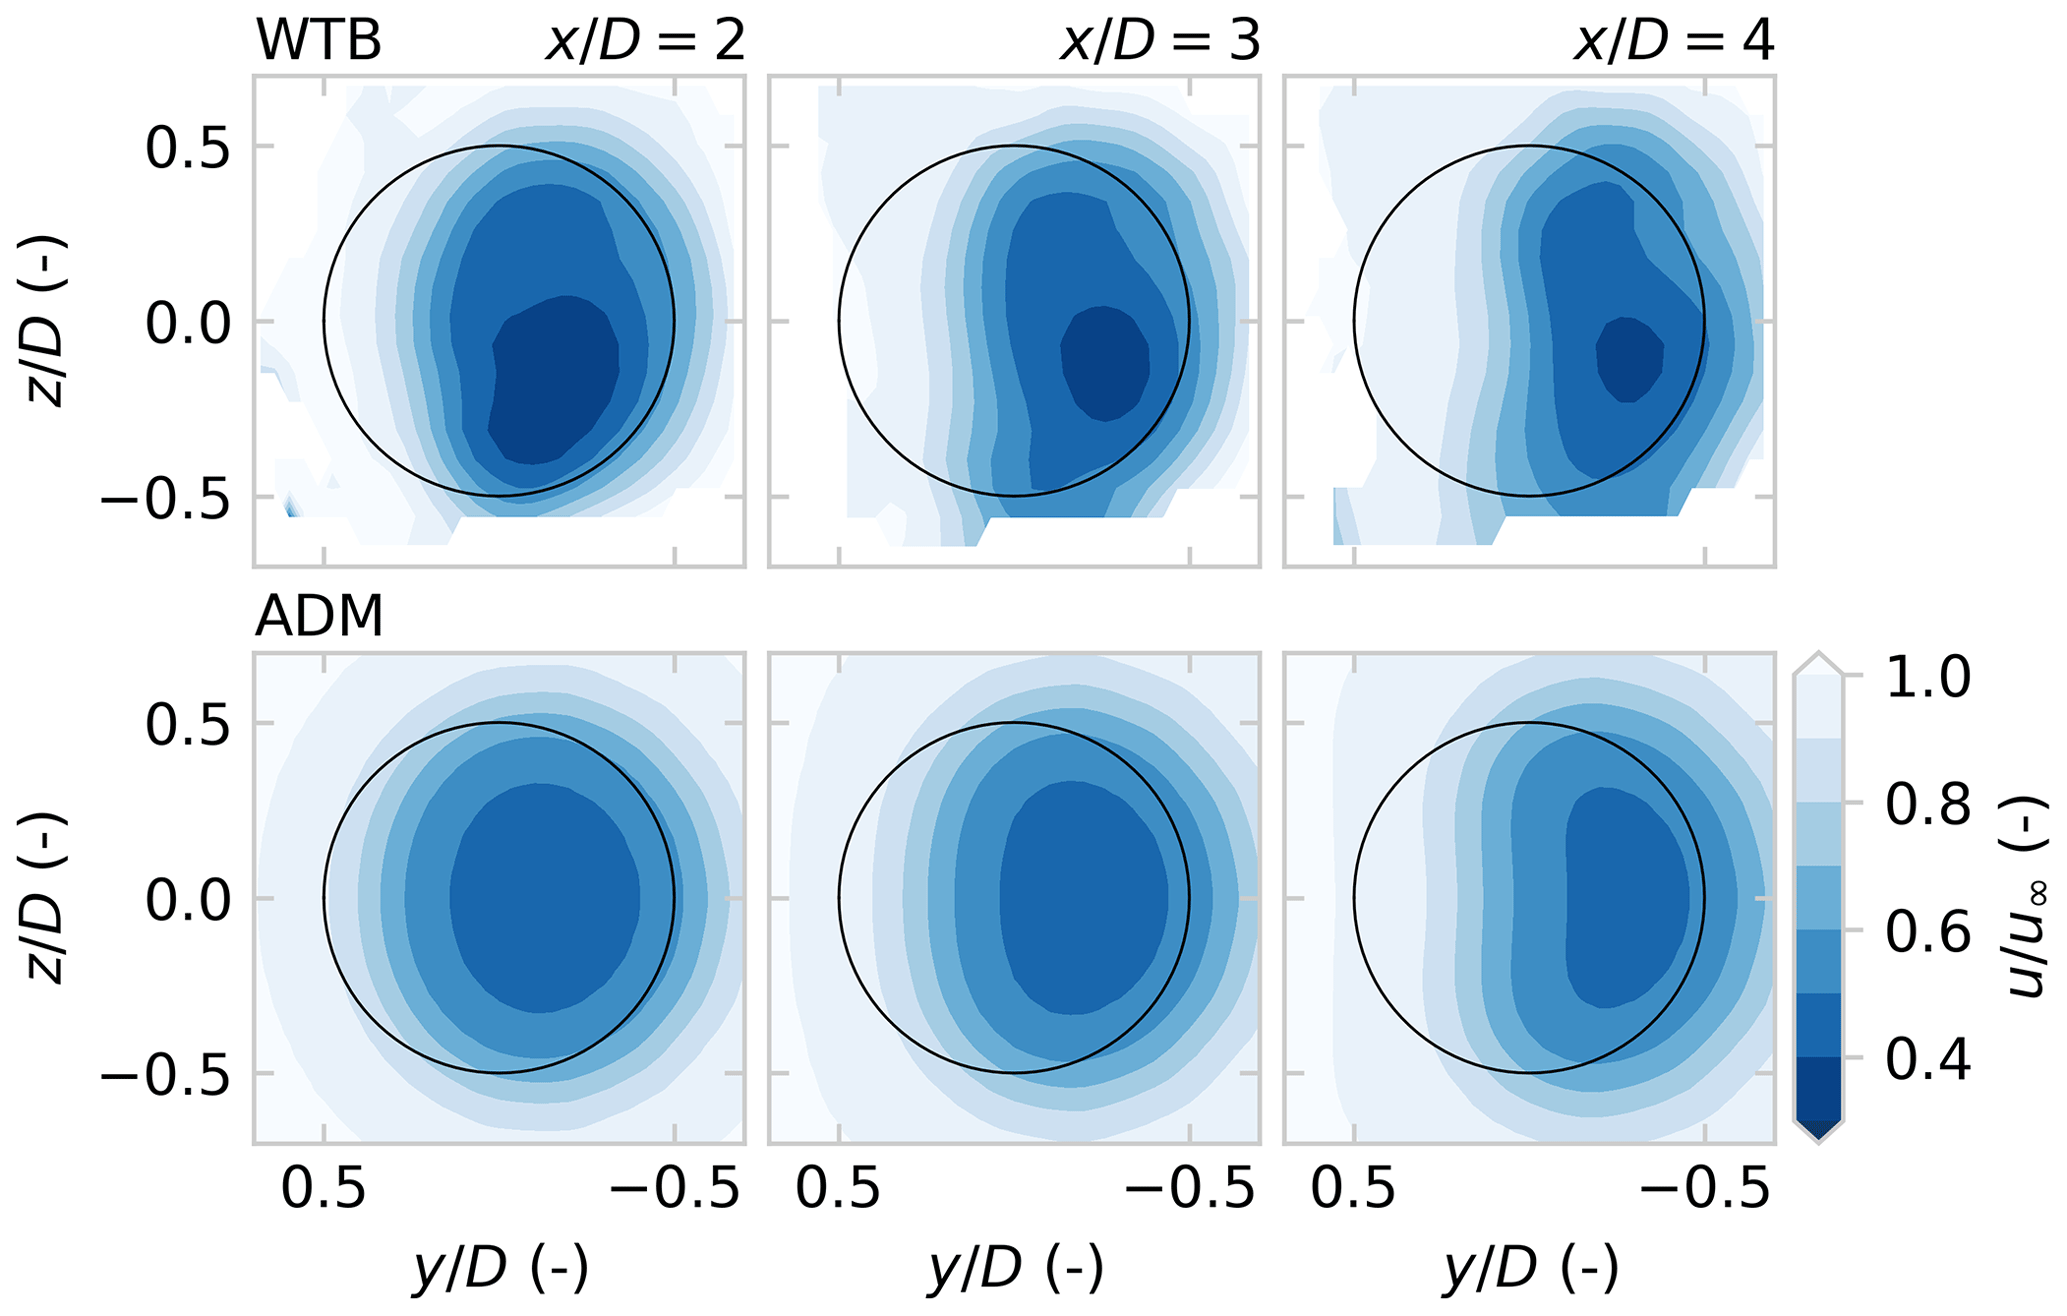
Figure 10Flow slices showing streamwise velocity for yaw misalignment , comparing experimental measurements from WTB with ADM results.
The good quality of the fit follows expectations because the wind tunnel has uniform inflow and a low turbulence intensity.
More importantly, this experiment can provide insight into the wake dynamics for changes in yaw misalignment with a high temporal resolution. The rotor-averaged wind speed for a virtual rotor is evaluated based on the PIV snapshots and is shown in Fig. 11, together with the realised yaw angle. The actual yaw signal is used to replicate the experiment with the three dynamic FVW models. Additionally, a lookup table is constructed with steady results from the ADM to illustrate the added value of including time-resolved wake dynamics. The downstream available power in steady state is recorded for a yaw misalignment varying in 1∘ increments and is linearly interpolated to produce the illustrated results. This approach yields results similar to the steady-state engineering models in the FLORIS toolbox.
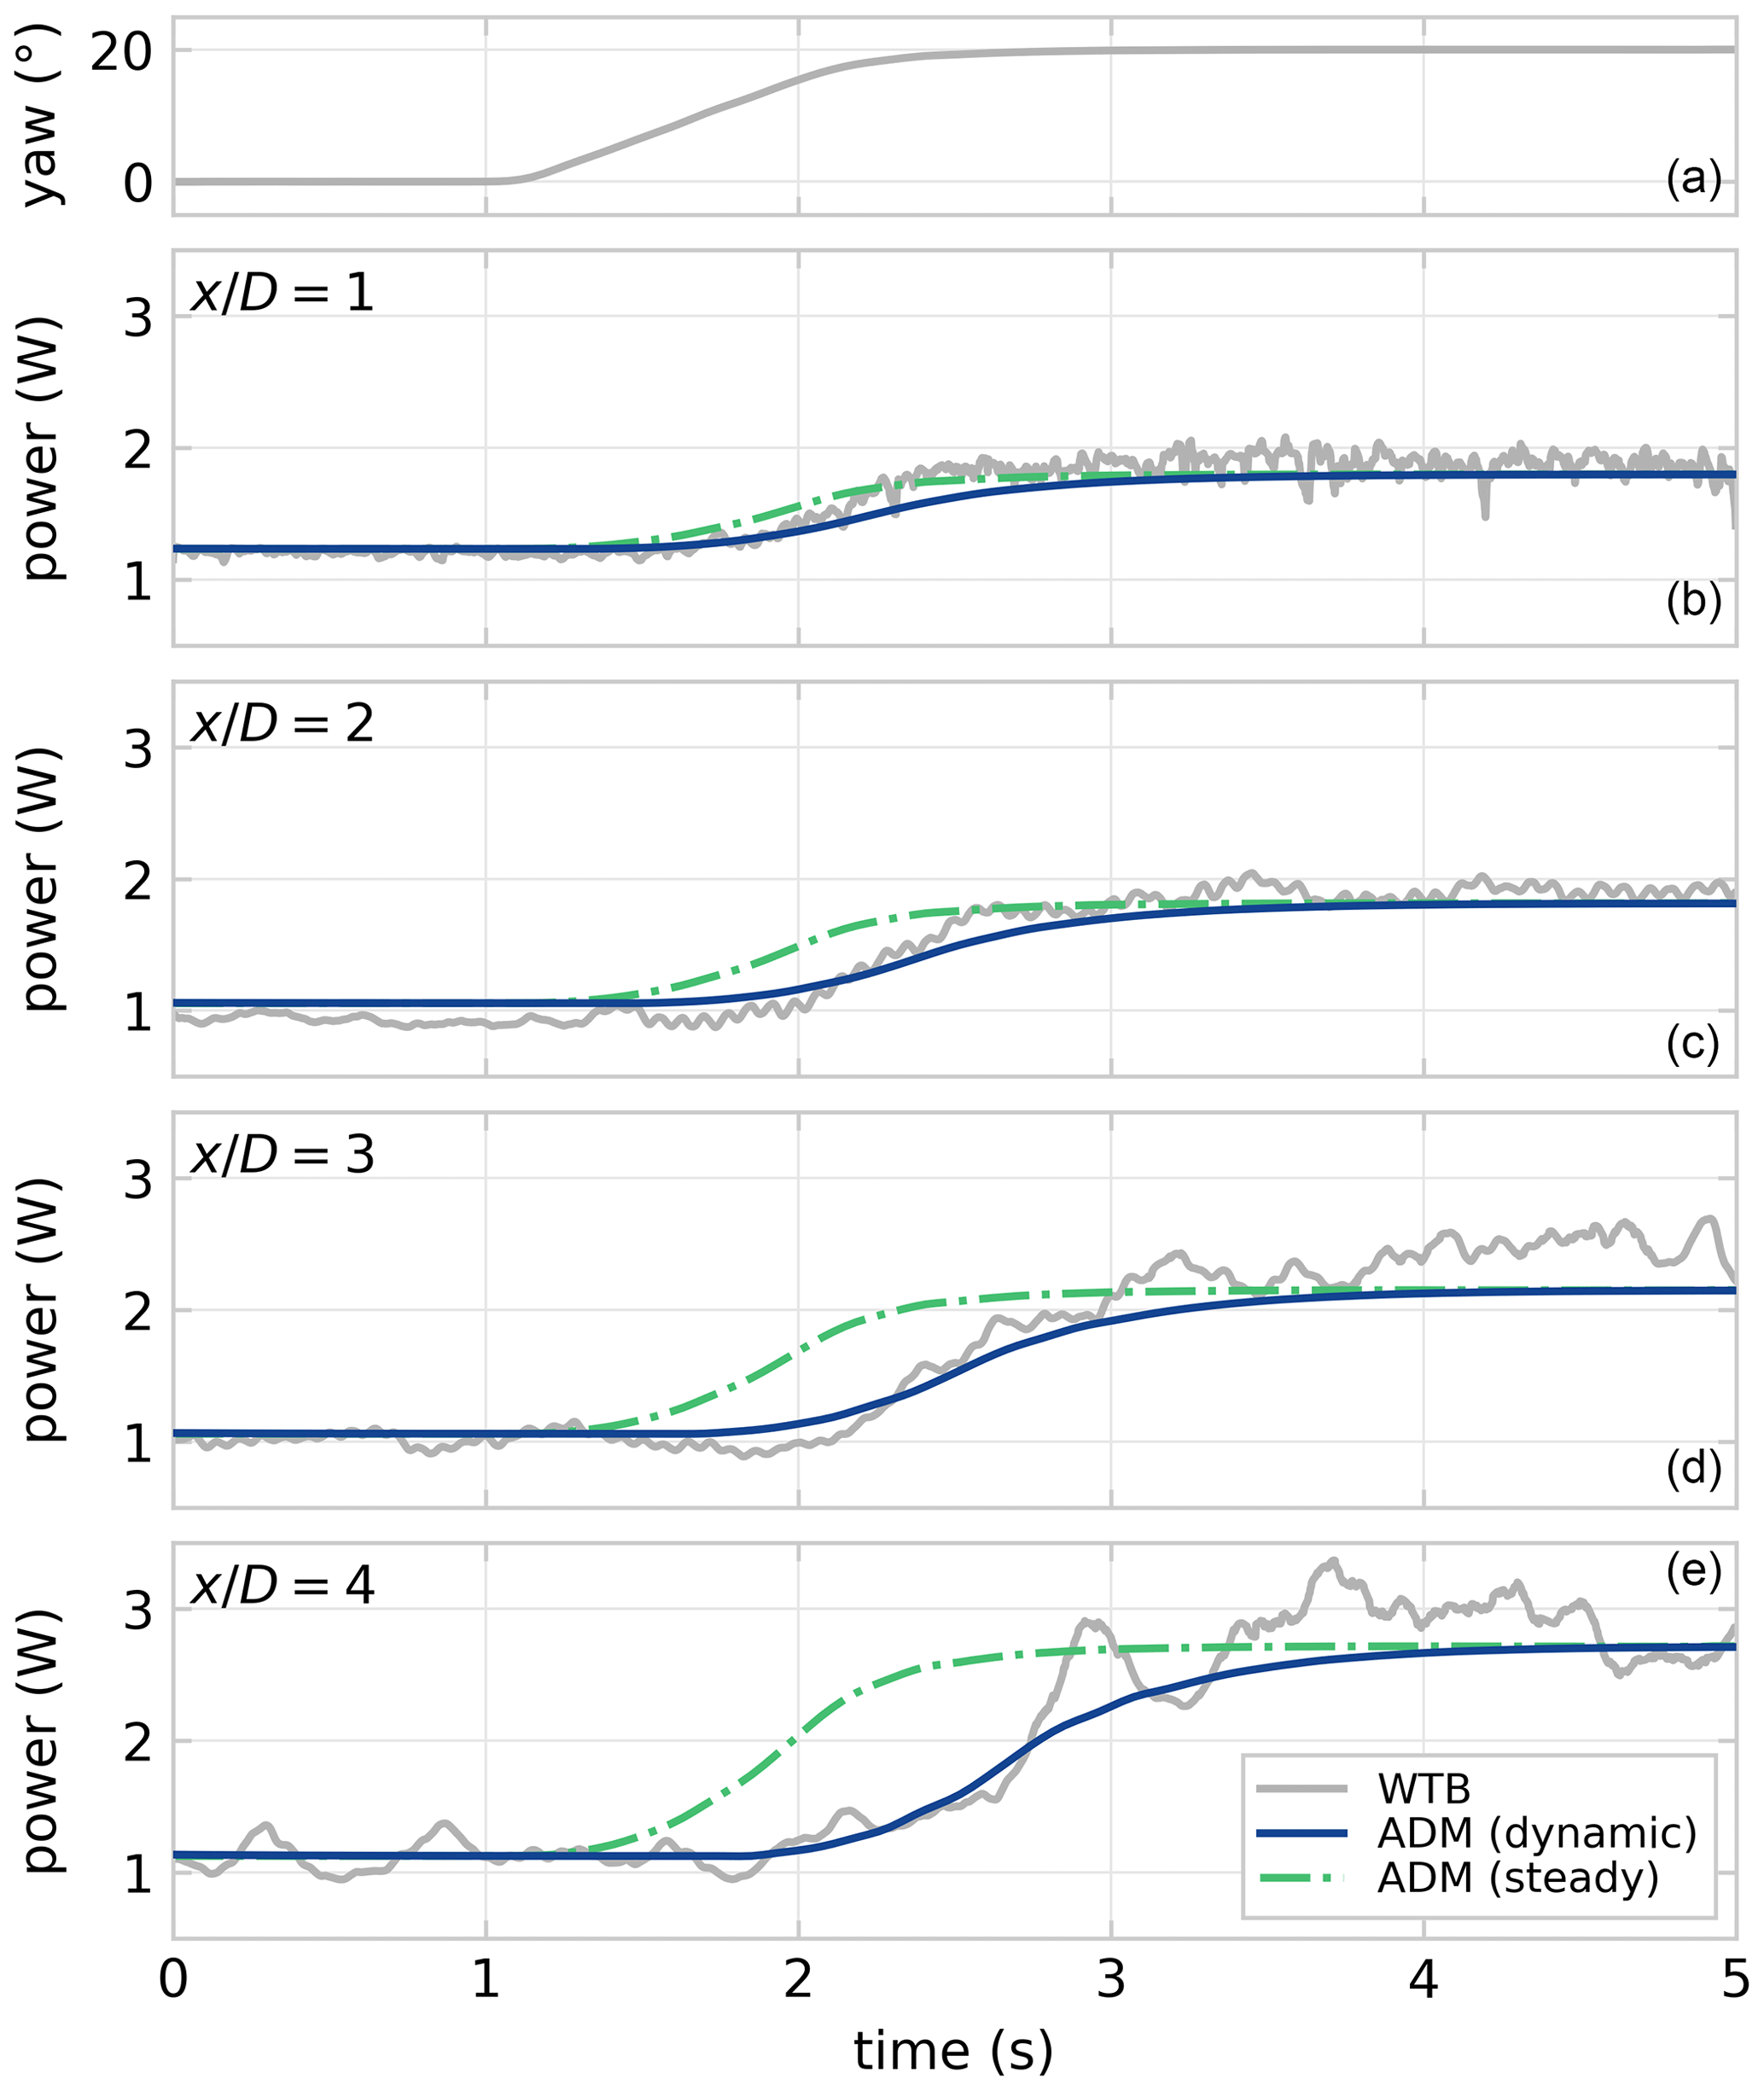
Figure 11The realisation of the step in yaw angle measured in WTB is shown in the top graph. The rotor-averaged potential power is calculated directly downstream of the turbine for , comparing the experimental data and a simulation with the ADM. The model estimates a power improvement of similar magnitude, although it lacks turbulent disturbances. The transient effects of the change in yaw angle propagating downstream through the wake are well represented in the dynamic FVW implementation of the ADM. These are not accounted for when using a steady-state lookup table with ADM results, which assumes a fully developed wake at every instant.
The value of VAF and NMAE for the three dynamic model simulations is listed in Table 2, as well as the steady results with the ADM lookup table. The use of precomputed steady results with the ADM performs considerably worse than the dynamic model in terms of accounting for wake dynamics, especially further downstream where the delays for transients propagating through the wake grow larger. The comparison highlights the motivation for implementing a dynamic wake model to be able to account for such wake dynamics in a model-predictive control strategy.
Table 2Fit quality of the time series of potential power estimates from the replication of the WTB experiment, listing VAF (V) and NMAE (N). The experimental data and ADM estimate, both using steady-state assumptions and dynamic simulation, are illustrated in Fig. 11.
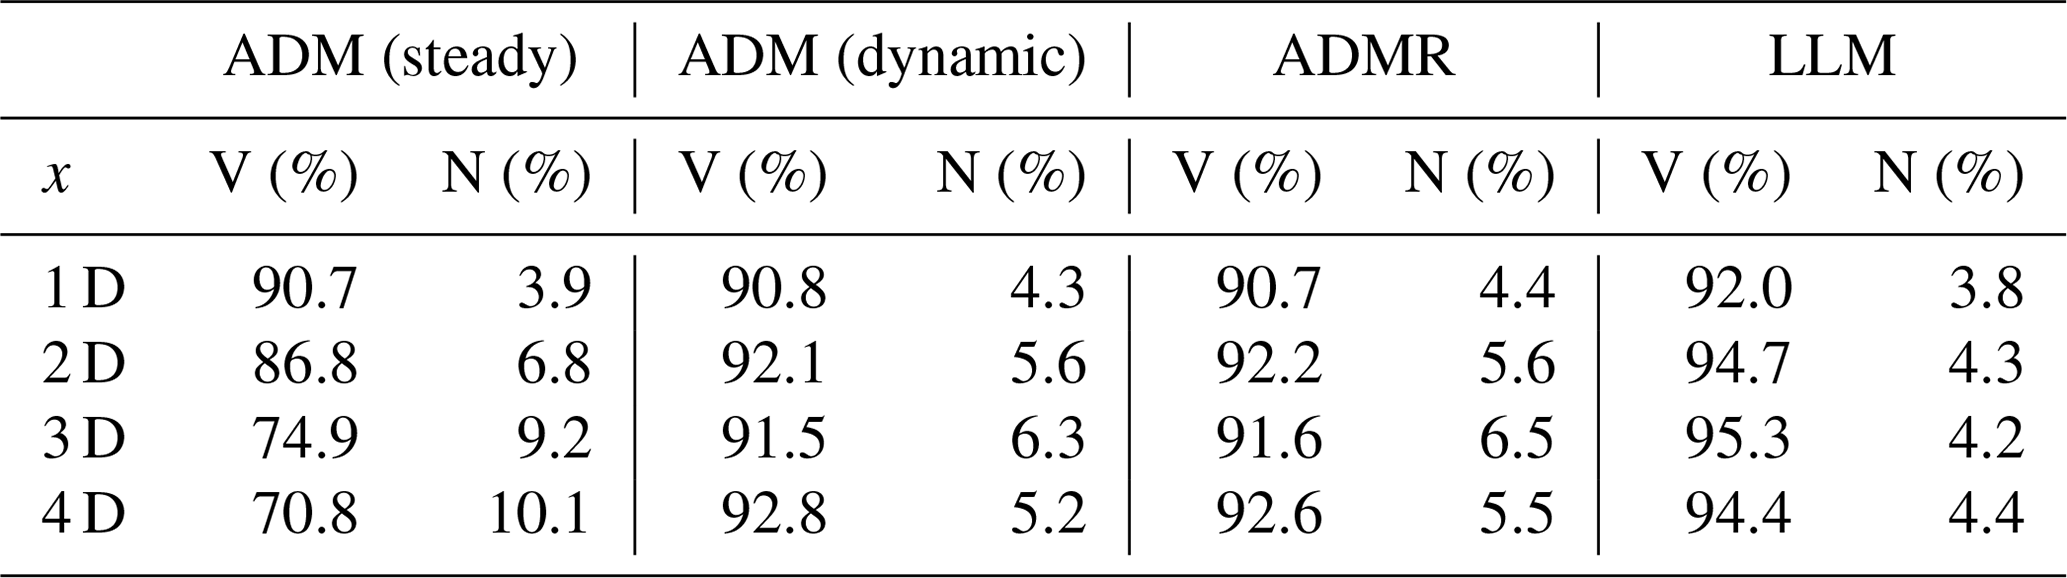
The dynamic ADM and ADMR perform to a similar level of accuracy in this mid-wake region. They are marginally outperformed by the LLM, which is considerably more computationally expensive. These results support the findings from Sect. 5.1 that the inclusion of rotation may improve the qualitative flow representation in the mid to far wake, but the added complexity does not appear necessary for control purposes.
The replication of the yaw step experiment with the ADM in Fig. 11 shows that the ADM estimates a potential power improvement of similar magnitude to a result of the wake deflection by yaw misalignment. The low-frequency changes show the delays of control effects propagating downstream through the wake. These slow dynamics are also well represented in the dynamic model estimate, whereas they are not accounted for in a steady-state wake modelling approach. Some turbulence develops in the wake in the wind tunnel that causes variations in the velocity deficit which are not accounted for in the FVW. Considering yaw control is quite slow to actuate, it is more important that the slower dynamics are properly represented than the resolution of turbulence at smaller timescales.
5.3 Wind direction variation – WTC
The WTC data set provides many performance measurements for varying yaw angle and wind direction. It is replicated only with the ADM, as it appears to perform similarly to the ADMR, and the LLM yields only minor improvements at a computational expense, which is prohibitive for control optimisation in the mid to far wake.
The replication of the experiment with the BW30 controller settings with the ADM yields a power estimate for which the time series is shown in Fig. 12. The conversion from available aerodynamic power to generator power is performed with a first-order rotor model for which the inertia and controller settings are estimated based on the upstream turbine measurements. The downstream power estimate is then computed using the same turbine model. The turbine model fit has an inertia J=0.6 kg m2. The gains for the torque controller polynomial are estimated to be and for the upstream turbine and and for the downstream turbine. The estimated efficiency in converting potential aerodynamic power to generator power is η=54 %.
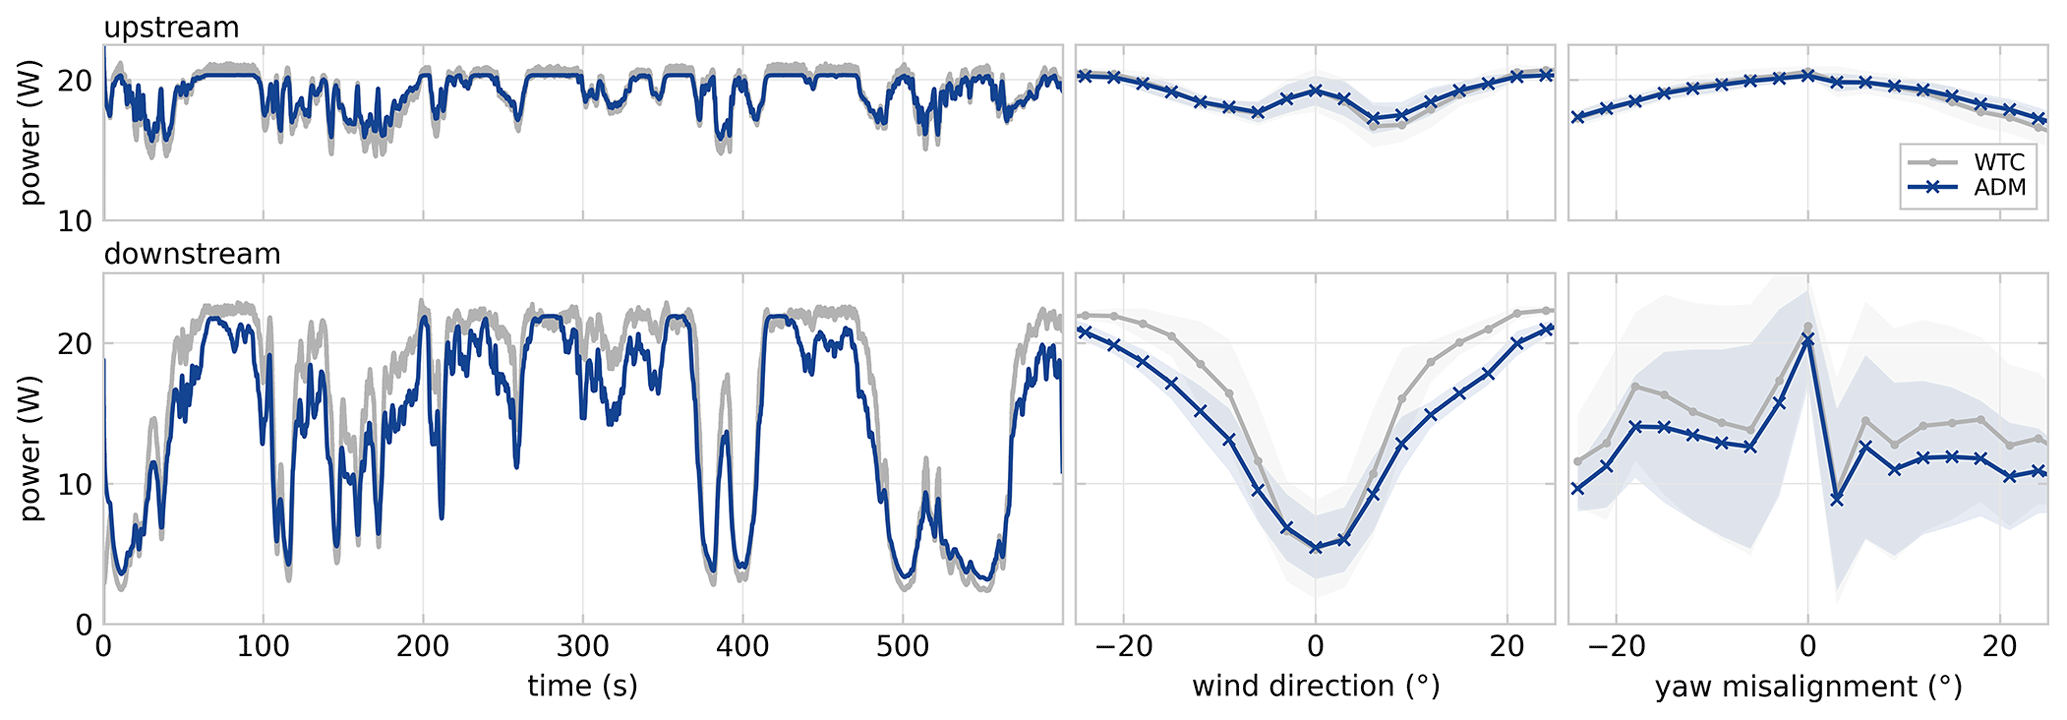
Figure 12Power predictions with the ADM are compared with experimental data from WTC for the BW30 control setting. The time series fit VAF is 92.1 % for the upstream turbine and 93.3 % for the downstream turbine. The power curves for wind direction and yaw misalignment show the mean and standard deviation in 3∘ bins. The power variation of the upstream turbine is completely due to variation in yaw misalignment from the open-loop yaw controller. The downstream power is affected both by yaw control on the upstream turbine and by translation for modelling wind direction variation. For larger wind direction magnitudes, the downstream turbine is no longer in waked conditions. The downstream effects of yaw misalignment are clouded by the variation in wind direction, and therefore the power-yaw curves filtered for alignment with the wind direction are presented in Fig. 13.
The upstream turbine power is estimated with a NMAE of 1.7 % and a VAF of 92.1 %. However, the downstream turbine power estimate is primarily relevant for evaluation of the performance of the wake model. The downstream power series estimate achieves a NMAE of 8.8 % and VAF of 93.3 %, which indicates most of the wake dynamics are accounted for. A similar fit quality is achieved for the power estimates with the other control settings from Hulsman et al. (2023), which are listed in Table 3. The first-order rotor model appears to be adequate in accounting for the delays due to rotor dynamics, and the efficiency term captures most of the losses in power conversion.
Table 3Fit quality of the time series of generator power estimates from the replication of the WTC experiment with the ADM, listing VAF (V) and NMAE (N). The experimental data and power estimate for the BW30 control strategy are illustrated in Fig. 12.
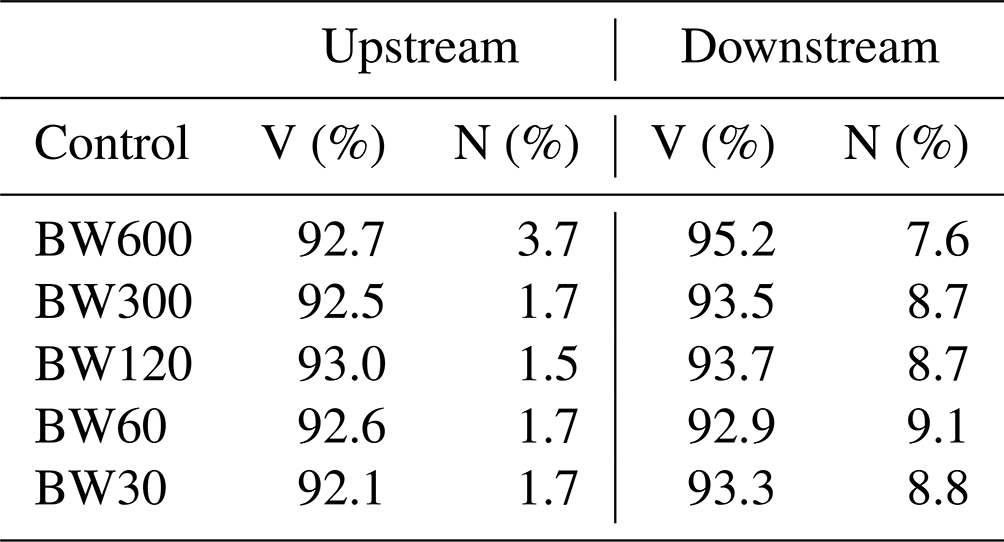
Figure 12 also presents a statistical analysis of these power signals, where the mean and standard deviation are illustrated based on 3∘ wind direction bins. As expected from the time series, there is a close fit for the upstream power estimate. The variation in power over wind direction is due to changes in yaw angle based on the control strategy. The downstream power estimate matches well for wind directions close to 0∘. For wind directions away from 0∘, where the downstream turbine is translated out of the waked conditions, the FVW underpredicts the power production on the downstream turbine. It is noteworthy that, in the wind tunnel, the downstream power exceeds the upstream power generated by about 6 % for wind directions where there is no aerodynamic wake interaction.
Besides possible differences between the model turbines themselves, this increase in power is likely due to a combination of two effects. First, the inflow has a shear profile with a power-law exponent of 0.28, and the downstream turbine has a higher hub height by 0.16 D. Consequently, it experiences a higher rotor-average velocity in unwaked conditions. This shear layer is unaccounted for in the FVW which assumes uniform inflow. Second, the wind tunnel has a limited 3 m × 3 m cross-section, which means there are blockage and speed-up effects due to the presence of the upstream turbine. These effects are especially amplified when the modelled wind direction 20∘. The lateral flow component due to translation of the downstream turbine is neglected.
The impact of wake steering through yaw misalignment on downstream power production is clouded in Fig. 12 because of the variation in wind direction. In order to analyse the model representation of wakes under yaw misalignment, the power signals are filtered for wind directions with fully waked conditions, i.e. −3∘ 3∘. The mean and standard deviation of power are calculated for 3∘ yaw angle bins and are shown in Fig. 13.
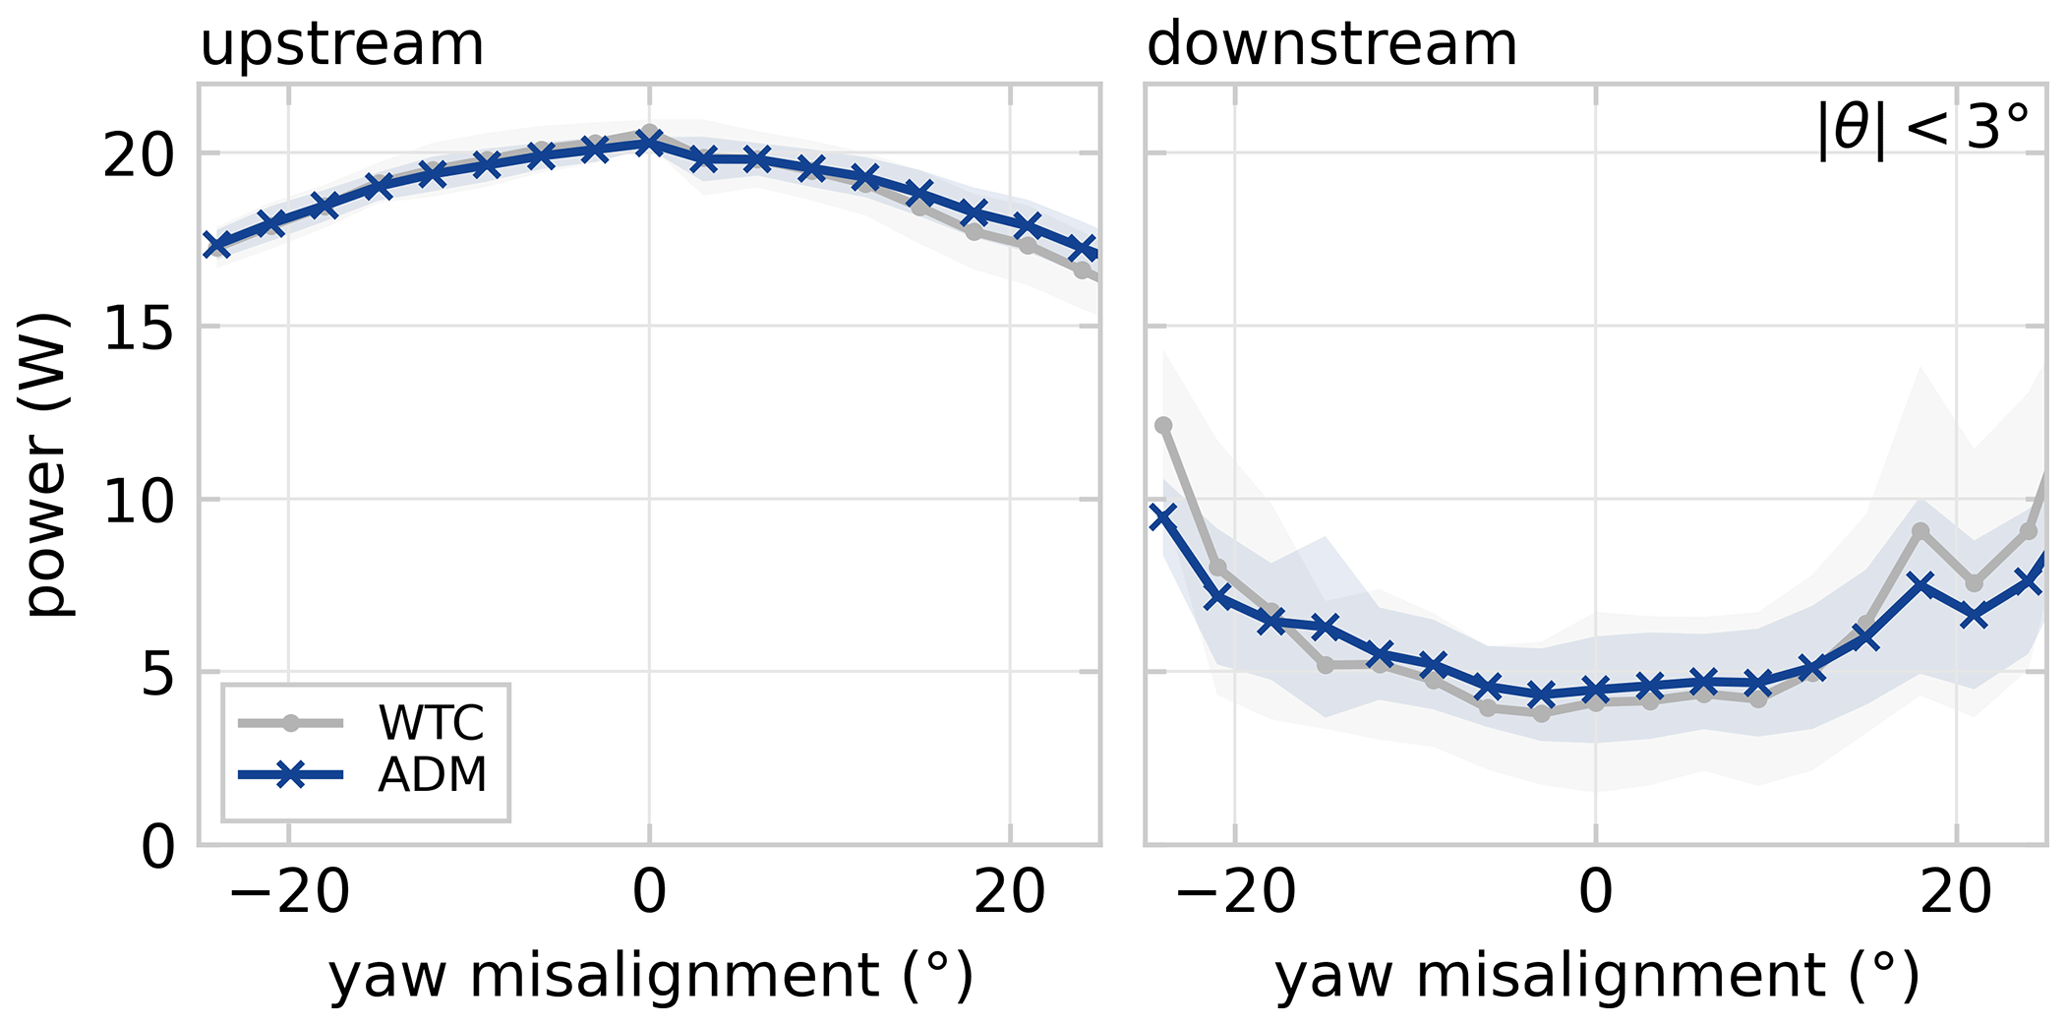
Figure 13Wind turbine power curve for the modelled yaw misalignment distribution, showing the mean and standard deviation of power in 3∘ yaw angle bins for the power data shown in Fig. 12. Data have been filtered to only consider those sections where the turbines are aligned with the wind direction, i.e. . The wind tunnel power-yaw curve of the upstream turbine is slightly asymmetric due to sheared inflow. The predicted downstream power matches quite well for these aligned conditions.
The power-yaw curve of the upstream turbine is slightly asymmetric in the wind tunnel experiment due to the operation under sheared inflow conditions. This asymmetric power profile is not represented in the ADM because of the model symmetry and uniform inflow. The downstream expected power production matches well given the model simplicity. The benefit of wake redirection is slightly underestimated for large misalignment angles.
The important aspect of the ADM estimate of power for these two turbines is that the trends are captured well. In the end, what matters for control optimisation of wake steering is accuracy in representing the optimal operating point more than exactness in the predicted power. The presented data indicate that there is a considerable correspondence between the model and experiment, but model implementation in a control strategy will have to point out whether that is sufficient. Additional error integration and state estimation could always be included if required, such as for tracking a power reference.
Three free-vortex wake wind turbine models (ADM, ADMR, LLM) are presented in this work for the prediction of wake dynamics under yaw misalignment for control optimisation. The two highlights in this work are (i) a study of parameter sensitivity and convergence and (ii) a comparison with three sets of experimental data from wind tunnel measurements in order to validate the power predictions in the far wake.
The parameter and convergence study indicated that the best results for mid- to far-wake predictions are achieved with ADM, i.e. when the wake model has minimum complexity. The addition of rotation does improve qualitative agreement of flow fields with experimental data but does not necessarily improve power predictions under yaw misalignment. The LLM may generate a slightly more accurate response, but the computational cost is prohibitive for use in online control optimisation for wake redirection.
The comparison with experimental data illustrates to what extent the FVW models can provide predictions for available power when utilising wake steering control. Even under the assumptions of uniform inflow and uniform rotor loading, there is considerable agreement with experimental data in terms of steady-state wake deflection, dynamic response to yaw change, and power estimates with yaw control and wind direction variation. However, implementation in a control framework will have to point out whether the accuracy is sufficient for the intended purpose of yaw control for power maximisation.
In conclusion, the ADM appears to be a suitable candidate for efficiently predicting the dynamic mid- to far-wake effects of wake steering, a range from approximately 1 to 7 D. As such, it could play a central role in the development of novel model-based strategies for wind farm flow control. These new controllers could further improve wind farm energy yield as more accurate wake dynamics are included in control optimisation for wake redirection.
For near-wake stability and rotor-plane effects, the LLM has added value as it models individual blades and tip vortices. Further downstream, large wake deformations under yaw misalignment limit the usefulness of the vortex filament approach. A transition to vortex particles or engineering wake models may be a suitable option to continue wake predictions further downstream.
Model code supporting the work in this paper is available at https://doi.org/10.4121/e32a9868-c5ea-43d3-8969-b1908662b2b2 (van den Broek, 2023). Experimental data from WTA are available at https://doi.org/10.5281/zenodo.5734877 (Hulsman et al., 2021) and from WTB at https://doi.org/10.4121/70ae7f4c-f87f-45f1-8360-f4958a60249f.v1 (van der Hoek et al., 2023b), and WTC data will be made available with Hulsman et al. (2023).
MJvdB: conceptualisation, methodology, software, validation, investigation, writing (original draft), visualisation. DDT: conceptualisation, writing (review and editing). PH: investigation (experiments WTA and WTC), writing (review and editing). DvdH: investigation (experiment WTB), writing (review and editing). BS: writing (review and editing), supervision. JWvW: writing (review and editing), conceptualisation, resources, funding acquisition.
At least one of the (co-)authors is a member of the editorial board of Wind Energy Science. The peer-review process was guided by an independent editor, and the authors also have no other competing interests to declare.
Publisher’s note: Copernicus Publications remains neutral with regard to jurisdictional claims made in the text, published maps, institutional affiliations, or any other geographical representation in this paper. While Copernicus Publications makes every effort to include appropriate place names, the final responsibility lies with the authors.
This work is part of the robust closed-loop wake steering for large densely spaced wind farms research programme with project number 17512, which is (partly) financed by the Dutch Research Council (NWO). The experimental data (labelled WTA and WTC) are acquired in the scope of the CompactWind II research project (ref. no. 0325492H) and are funded by the Federal Ministry for Economic Affairs and Energy according to a resolution by the German Federal Parliament.
This paper was edited by Johan Meyers and reviewed by two anonymous referees.
Bartl, J., Mühle, F., Schottler, J., Sætran, L., Peinke, J., Adaramola, M., and Hölling, M.: Wind tunnel experiments on wind turbine wakes in yaw: effects of inflow turbulence and shear, Wind Energ. Sci., 3, 329–343, https://doi.org/10.5194/wes-3-329-2018, 2018. a
Bastankhah, M. and Porté-Agel, F.: Experimental and theoretical study of wind turbine wakes in yawed conditions, J. Fluid Mech., 806, 506–541, https://doi.org/10.1017/jfm.2016.595, 2016. a
Becker, M., Ritter, B., Doekemeijer, B., van der Hoek, D., Konigorski, U., Allaerts, D., and van Wingerden, J.-W.: The revised FLORIDyn model: implementation of heterogeneous flow and the Gaussian wake, Wind Energ. Sci., 7, 2163–2179, https://doi.org/10.5194/wes-7-2163-2022, 2022. a
Bhagwat, M. J. and Leishman, J. G.: Transient rotor inflow using a time-accurate free-vortex wake model, in: 39th Aerosp. Sci. Meet. Exhib., p. 993, https://doi.org/10.2514/6.2001-993, 2001. a
Boersma, S., Doekemeijer, B., Vali, M., Meyers, J., and van Wingerden, J.-W.: A control-oriented dynamic wind farm model: WFSim, Wind Energ. Sci., 3, 75–95, https://doi.org/10.5194/wes-3-75-2018, 2018. a
Branlard, E., Martínez-Tossas, L. A., and Jonkman, J.: A time-varying formulation of the curled wake model within the FAST.Farm framework, Wind Energy, 26, 44–63, https://doi.org/10.1002/we.2785, 2023. a
Brown, K., Houck, D., Maniaci, D., and Westergaard, C.: Rapidly recovering wind turbine wakes with dynamic pitch and rotor speed control, in: AIAA Scitech 2021 Forum, p. 1182, ISBN 9781624106095, https://doi.org/10.2514/6.2021-1182, 2021. a
Burton, T., Sharpe, D., Jenkins, N., and Bossanyi, E.: Wind Energy Handbook, Wiley, ISBN 0471489972, 2001. a
de Vaal, J. B., Hansen, M. O., and Moan, T.: Validation of a vortex ring wake model suited for aeroelastic simulations of floating wind turbines, J. Phys. Conf. Ser., 555, 012025, https://doi.org/10.1088/1742-6596/555/1/012025, 2014. a
Doekemeijer, B. M., Kern, S., Maturu, S., Kanev, S., Salbert, B., Schreiber, J., Campagnolo, F., Bottasso, C. L., Schuler, S., Wilts, F., Neumann, T., Potenza, G., Calabretta, F., Fioretti, F., and van Wingerden, J.-W.: Field experiment for open-loop yaw-based wake steering at a commercial onshore wind farm in Italy, Wind Energ. Sci., 6, 159–176, https://doi.org/10.5194/wes-6-159-2021, 2021. a
Dong, J., Viré, A., Ferreira, C. S., Li, Z., and van Bussel, G.: A modified free wake vortex ring method for horizontal-axis wind turbines, Energies, 12, 3900, https://doi.org/10.3390/en12203900, 2019. a
Fleming, P., Annoni, J., Martínez-Tossas, L. A., Raach, S., Gruchalla, K., Scholbrock, A., Churchfield, M., and Roadman, J.: Investigation into the shape of a wake of a yawed full-scale turbine, J. Phys. Conf. Ser., 1037, 032010, https://doi.org/10.1088/1742-6596/1037/3/032010, 2018. a
Fleming, P., King, J., Simley, E., Roadman, J., Scholbrock, A., Murphy, P., Lundquist, J. K., Moriarty, P., Fleming, K., van Dam, J., Bay, C., Mudafort, R., Jager, D., Skopek, J., Scott, M., Ryan, B., Guernsey, C., and Brake, D.: Continued results from a field campaign of wake steering applied at a commercial wind farm – Part 2, Wind Energ. Sci., 5, 945–958, https://doi.org/10.5194/wes-5-945-2020, 2020. a
Fleming, P., Sinner, M., Young, T., Lannic, M., King, J., Simley, E., and Doekemeijer, B.: Experimental results of wake steering using fixed angles, Wind Energ. Sci., 6, 1521–1531, https://doi.org/10.5194/wes-6-1521-2021, 2021. a
Houck, D. R., DeVelder, N., and Kelley, C. L.: Comparison of a mid-fidelity free vortex wake method to a high-fidelity actuator line model large eddy simulation for wind turbine wake simulations, J. Phys. Conf. Ser., 2265, 042044, https://doi.org/10.1088/1742-6596/2265/4/042044, 2022. a
Howland, M. F., Bossuyt, J., Martínez-Tossas, L. A., Meyers, J., and Meneveau, C.: Wake structure in actuator disk models of wind turbines in yaw under uniform inflow conditions, J. Renew. Sustain. Ener., 8, 043301, https://doi.org/10.1063/1.4955091, 2016. a
Howland, M. F., Lele, S. K., and Dabiri, J. O.: Wind farm power optimization through wake steering, P. Natl. Acad. Sci. USA, 116, 14495–14500, https://doi.org/10.1073/pnas.1903680116, 2019. a
Hulsman, P., Wosnik, M., Petrović, V., Hölling, M., and Kühn, M.: Data Supplement for “Curled Wake Development of a Yawed Wind Turbine at Turbulent and Sheared Inflow” – Wind Energy Science Journal, Zenodo [data set], https://doi.org/10.5281/zenodo.5734877, 2021. a
Hulsman, P., Sucameli, C., Petrović, V., Rott, A., Gerds, A., and Kühn, M.: Turbine power loss during yaw-misaligned free field tests at different atmospheric conditions, J. Phys. Conf. Ser., 2265, 032074, https://doi.org/10.1088/1742-6596/2265/3/032074, 2022a. a
Hulsman, P., Wosnik, M., Petrović, V., Hölling, M., and Kühn, M.: Development of a curled wake of a yawed wind turbine under turbulent and sheared inflow, Wind Energ. Sci., 7, 237–257, https://doi.org/10.5194/wes-7-237-2022, 2022b. a, b, c, d
Hulsman, P., Petrović, V., Wosnik, and Kühn, M.: Evaluating Open-Loop Wake Steering Controllers by Replicating Dynamic Wind Direction Changes in the Wind Tunnel, in preparation, 2023. a, b, c, d, e
Janssens, N. and Meyers, J.: Towards real-time optimal control of wind farms using large-eddysimulations, Wind Energ. Sci. Discuss. [preprint], https://doi.org/10.5194/wes-2023-84, in review, 2023. a
Jeon, M., Lee, S., Kim, T., and Lee, S.: Wake influence on dynamic load characteristics of offshore floating wind turbines, AIAA J., 54, 3535–3545, https://doi.org/10.2514/1.J054584, 2016. a
Katz, J. and Plotkin, A.: Low-Speed Aerodynamics, Cambridge University Press, 2 edn., ISBN 9780521665520, 2001. a, b, c
Lee, H. and Lee, D. J.: Effects of platform motions on aerodynamic performance and unsteady wake evolution of a floating offshore wind turbine, Renew. Energ., 143, 9–23, https://doi.org/10.1016/j.renene.2019.04.134, 2019. a
Leishman, J. G.: Principles of Helicopter Aerodynamics, Cambridge University Press, ISBN 0521858607, 2000. a, b, c
Leishman, J. G.: Challenges in modeling the unsteady aerodynamics of wind turbines, Wind Energy, 5, 85–132, https://doi.org/10.1002/we.62, 2002. a
Lejeune, M., Moens, M., and Chatelain, P.: A Meandering-Capturing Wake Model Coupled to Rotor-Based Flow-Sensing for Operational Wind Farm Flow Prediction, Front. Energy Res., 10, 884068, https://doi.org/10.3389/fenrg.2022.884068, 2022. a
Lin, M. and Porté-Agel, F.: Large-eddy simulation of a wind-turbine array subjected to active yaw control, Wind Energ. Sci., 7, 2215–2230, https://doi.org/10.5194/wes-7-2215-2022, 2022. a
Martínez-Tossas, L. A., Annoni, J., Fleming, P. A., and Churchfield, M. J.: The aerodynamics of the curled wake: a simplified model in view of flow control, Wind Energ. Sci., 4, 127–138, https://doi.org/10.5194/wes-4-127-2019, 2019. a, b
Meyers, J., Bottasso, C., Dykes, K., Fleming, P., Gebraad, P., Giebel, G., Göçmen, T., and van Wingerden, J.-W.: Wind farm flow control: prospects and challenges, Wind Energ. Sci., 7, 2271–2306, https://doi.org/10.5194/wes-7-2271-2022, 2022. a
Munters, W. and Meyers, J.: Optimal dynamic induction and yaw control of wind farms: Effects of turbine spacing and layout, J. Phys. Conf. Ser., 1037, 032015, https://doi.org/10.1088/1742-6596/1037/3/032015, 2018. a
NREL: FLORIS. Version 3.0, https://github.com/NREL/floris (last access: 4 November 2023), 2022. a
Petrović, V., Schottler, J., Neunaber, I., Hölling, M., and Kühn, M.: Wind tunnel validation of a closed loop active power control for wind farms, J. Phys. Conf. Ser., 1037, 032020, https://doi.org/10.1088/1742-6596/1037/3/032020, 2018. a
Schottler, J., Hölling, A., Peinke, J., and Hölling, M.: Wind tunnel tests on controllable model wind turbines in yaw, in: 34th Wind Energy Symp., AIAA, ISBN 9781624103957, https://doi.org/10.2514/6.2016-1523, 2016. a
Schottler, J., Bartl, J., Mühle, F., Sætran, L., Peinke, J., and Hölling, M.: Wind tunnel experiments on wind turbine wakes in yaw: redefining the wake width, Wind Energ. Sci., 3, 257–273, https://doi.org/10.5194/wes-3-257-2018, 2018. a
Sebastian, T. and Lackner, M.: Analysis of the Induction and Wake Evolution of an Offshore Floating Wind Turbine, Energies, 5, 968–1000, https://doi.org/10.3390/en5040968, 2012. a
Simley, E., Fleming, P., Girard, N., Alloin, L., Godefroy, E., and Duc, T.: Results from a wake-steering experiment at a commercial wind plant: investigating the wind speed dependence of wake-steering performance, Wind Energ. Sci., 6, 1427–1453, https://doi.org/10.5194/wes-6-1427-2021, 2021. a
Simoes, F. J. and Graham, J. M.: Application of a free vortex wake model to a horizontal axis wind turbine, J. Wind Eng. Ind. Aerod., 39, 129–138, https://doi.org/10.1016/0167-6105(92)90539-M, 1992. a
Squire, H. B.: The Growth of a Vortex in Turbulent Flow, Aeronaut. Quart., 16, 302–306, https://doi.org/10.1017/s0001925900003516, 1965. a
van den Broek, M. J.: Simulation data and code underlying the publication: Free-vortex models for wind turbine wakes under yaw misalignment – a validation study on far-wake effects, 4TU.ResearchData [data set and code], https://doi.org/10.4121/e32a9868-c5ea-43d3-8969-b1908662b2b2, 2023. a
van den Broek, M. J. and van Wingerden, J. W.: Dynamic Flow Modelling for Model-Predictive Wind Farm Control, J. Phys. Conf. Ser., 1618, 022023, https://doi.org/10.1088/1742-6596/1618/2/022023, 2020. a
van den Broek, M. J., De Tavernier, D., Sanderse, B., and van Wingerden, J. W.: Adjoint optimisation for wind farm flow control with a free-vortex wake model, Renew. Energ., 201, 752–765, https://doi.org/10.1016/j.renene.2022.10.120, 2022a. a, b, c
van den Broek, M. J., Sanderse, B., and van Wingerden, J. W.: Flow Modelling for Wind Farm Control: 2D vs. 3D, J. Phys. Conf. Ser., 2265, 032086, https://doi.org/10.1088/1742-6596/2265/3/032086, 2022b. a
van den Broek, M. J., van den Berg, D., Sanderse, B., and van Wingerden, J. W.: Optimal Control for Wind Turbine Wake Mixing on Floating Platforms, IFAC-PapersOnLine, 56, 7656–7661, https://doi.org/10.1016/j.ifacol.2023.10.1165, 2023. a
van der Hoek, D., van den Abbeele, B., Ferreira, C. S., and van Wingerden, J. W.: Maximizing wind farm power output with the helix approach – experimental validation and wake analysis using tomographic PIV, arXiv [preprint], http://arxiv.org/abs/2306.12849, 2023a. a, b, c
van der Hoek, D., van den Broek, M. J., and van Wingerden, J. W.: Data underlying the publication: Free-vortex models for wind turbine wakes under yaw misalignment – a validation study on far-wake effects, 4TU.ResearchData [data set], https://doi.org/10.4121/70ae7f4c-f87f-45f1-8360-f4958a60249f.v1, 2023b. a
van Kuik, G. A. M.: The Fluid Dynamic Basis for Actuator Disc and Rotor Theories, ISBN 9781614998662, https://doi.org/10.3233/978-1-61499-866-2-i, 2018. a, b, c
van Wingerden, J. W., Fleming, P. A., Göcmen, T., Eguinoa, I., Doekemeijer, B. M., Dykes, K., Lawson, M., Simley, E., King, J., Astrain, D., Iribas, M., Bottasso, C. L., Meyers, J., Raach, S., Kölle, K., and Giebel, G.: Expert Elicitation on Wind Farm Control, J. Phys. Conf. Ser., 1618, 022025, https://doi.org/10.1088/1742-6596/1618/2/022025, 2020. a