the Creative Commons Attribution 4.0 License.
the Creative Commons Attribution 4.0 License.
 | 04 Jun 2026
Vortex generator design for unsteady flow separation control and dynamic stall suppression on pitching thick airfoils
Daniele Ragni
This study experimentally investigates the performance of vortex generators (VGs) designed for steady stall control in preventing unsteady trailing-edge flow separation and dynamic stall during pitch oscillations occurring on inboard and midboard wind turbine blade sections. Surface pressure measurements are conducted in the TU Delft low-speed wind tunnel on a DU-97-W-300 airfoil undergoing pitch oscillations while equipped with VGs of various vane sizes and shapes. In steady conditions, vanes with heights smaller than the local boundary layer thickness optimally balance delaying stall following trailing-edge separation with achieving maximum lift-to-drag ratio among the tested triangular vane VGs. However, these same VGs with vane heights smaller than or equal to the steady local boundary layer thickness are insufficient to suppress the onset and upstream progression of a trailing-edge separation front in all pitching cycles. VGs whose vane height exceeds the local boundary layer thickness for a larger part of the pitch cycle prevent the onset and upstream progression of the trailing-edge separation front for a larger percentage of cycles. Contrary to past literature, rectangular vanes yield a higher steady aerodynamic efficiency than triangular vanes. Rectangular vanes also suppress trailing-edge flow separation in all pitching cycles at all tested reduced frequencies, indicating more effective boundary layer energization than triangular vanes, thus proving to be a better VG shape for steady and unsteady stall suppression on thick airfoils.
- Article
(7266 KB) - Full-text XML
- BibTeX
- EndNote


Modern wind turbines are following a trend of increasing rotor diameters (IRENA, 2019). Recently deployed offshore wind turbines have blades of more than 100 m in length, such as the Siemens Gamesa SG 14-222 turbine with a blade length of 108 m and the Vestas V236 turbine with a blade length of 115 m. This trend is driving blade sections being made from thicker airfoils to ensure structural integrity and to balance the aero-structural loads, as seen in the newest reference wind turbines such as the IEA 15 MW (Gaertner et al., 2020) and 22 MW turbines (Zahle et al., 2024). These thicker airfoils are more prone to flow separation, with the consequent loss of lift decreasing the annual energy production and the fatigue lifetime of the blades (McKenna et al., 2016). The use of vortex generators (VGs) as passive flow control devices has become a common practice in wind turbine design (Griffin, 1996; Skrzypiński et al., 2014; Bak et al., 2016; Baldacchino et al., 2018). Vortex generators are also being used to mitigate the effects of leading-edge erosion (Gutiérrez et al., 2020; Ravishankara et al., 2020) and are being retrofitted on existing turbines to partly restore original performance (Skrzypiński et al., 2020; Manolesos et al., 2024).
Unsteady aerodynamics around the blade sections is becoming increasingly important in the design of large wind turbine blades. The occurrence of cyclic variations in the angle of attack on rotor blades leads to the flow detaching and reattaching on the blade sections as the local angle of attack moves above and below the static stall angle. This phenomenon is referred to as dynamic stall. Early investigations such as McCroskey (1972), McCroskey and Fisher (1972), McCroskey (1981), and Carr (1988) studied dynamic stall in the context of helicopter rotor blades. In the context of wind turbines, measurements from the NREL Combined Experiment (Butterfield and Nelsen, 1989; Butterfield et al., 1990) were one of the first to show the occurrence of rotating wind turbine blades. Butterfield et al. (1992) showed that dynamic stall occurred on operational wind turbine blades upon cyclic variations of the local angle of attack due to yaw misalignment. Shipley et al. (1995) further investigated the occurrence of dynamic stall on wind turbine blades and pointed to reasons such as yaw misalignment, fluctuating wind speed and direction, and tower shadow for the occurrence of dynamic stall. Dynamic stall on wind turbine blades can lead to cyclic load variations and higher loads on the blade. Shipley et al. (1994) showed that dynamic stall on wind turbine blades increases the chances of fatigue failure and reduces turbine lifetime. Rasmussen et al. (1998) have shown that the coupling of pitch motions with structural vibrations can lead to negative aerodynamic damping in the edgewise direction and positive damping in the flapwise direction. Negative damping imparts energy into the structural vibrations, causing uncontrolled growth of the vibrations and rapid failure.
At the airfoil level, the unsteady flow variations leading to dynamic stall are experienced as time-varying motions such as pitching and plunging, which lead to cycles of flow detachment and reattachment. The works of McCroskey (1981), McCroskey et al. (1981), Carr (1988), and Leishman and Beddoes (1989) detail the various flow phenomena occurring during dynamic stall. For an airfoil undergoing pitch oscillations, McCroskey et al. (1981) list three kinds of stall based on the occurrence and propagation of flow separation during the pitch cycle: leading-edge stall, trailing-edge stall, and mixed stall. Leading-edge stall is said to occur when flow separation first appears near the leading edge and moves towards the trailing edge with increasing angle of attack, while trailing-edge stall is said to occur when the separation front moves from the trailing edge towards the leading edge with increasing angle of attack. Mixed stall usually occurs either when separation fronts originating from both the leading and trailing edge move towards each other and merge somewhere near mid-chord, or when the separation front originates in the middle of the airfoil and moves both in leading-edge and trailing-edge directions. Trailing-edge stall is the most common type of turbulent stall for thick airfoils, typical of inboard and midboard wind turbine blade sections, and is also the type of stall observed on the airfoil section used in this work. When the unsteady angle of attack exceeds the static stall angle, flow reversal starts at the trailing edge and spreads upstream over much of the airfoil chord. At a certain angle of attack, the separated flow reaches a critical point and a strong vortex called the leading-edge vortex (LEV) forms near the leading edge and starts convecting downstream towards the trailing edge. The lift keeps increasing with increasing angle of attack during this process. Dynamic stall is observed when the LEV convects past the trailing edge into the wake.
Butterfield (1989) shows that dynamic stall causes the integrated aerodynamic forces on a rotating wind turbine blade section to deviate significantly from the static characteristics of the airfoil section. Shipley et al. (1995) show that the local pressure distributions on a wind turbine blade airfoil section differ significantly from the static pressure distributions during dynamic stall. The pressure and flow measurements presented by McCroskey et al. (1981), McAlister et al. (1982), Carr (1988), Choudhry et al. (2014), and Gupta and Ansell (2019), among many others, on several airfoils undergoing pitch oscillations show that the changed flow characteristics during dynamic stall lead to significant differences in the steady and unsteady pressure distributions, boundary layer characteristics, and flow separation behaviour. Since VGs control flow separation through energizing the boundary layer with streamwise vortices, the difference between steady and unsteady boundary layer characteristics around a pitching airfoil creates the need to investigate the behaviour of VGs in unsteady conditions.
The impact of VGs on the steady aerodynamic performance and flow around wind turbine blade sections has been well studied in detail in the past. We point readers to the works of Lin (2002) and Zhao et al. (2022) for detailed reviews on the use of VGs for steady flow separation control. Vane-type VGs are the most commonly used VG type for flow separation control on wind turbine blades. On wind turbine blades, VGs are designed to delay the stall onset and increase maximum lift of the airfoil section, while minimizing the drag increase caused by the presence of the VGs. The works of Godard and Stanislas (2006), Fouatih et al. (2016), and Baldacchino et al. (2018), among others, have investigated a wide range of VG configurations varying different geometric parameters such as vane height, spacing, angle, and chordwise location on the airfoil, studying the impact of these parametric variations on the steady performance using the aforementioned lift, drag, and stall metrics. All these studies concluded that the vane height is the most critical geometrical parameter affecting VG performance. Other parameters like vane spacing and vane inclination, have a significantly smaller impact than vane height. This follows from the fact that the strength of the streamwise vortices that energize the boundary layer and delay flow separation under adverse pressure gradients is proportional to the vane height, as shown by Lin (2002) and Ashill et al. (2005), among others. However, larger vane sizes also increase the drag caused by the VGs due to their increased surface area. Thus, designers seeking to optimize VGs designs make a trade-off between using larger vanes to delay stall to a higher angle of attack, and using smaller vanes to limit the drag increase. As solutions to this trade-off, low-profile VG designs aiming to reduce drag while maintaining the stall delay benefits have also been proposed in the past by works like Lin (2002), Martínez-Filgueira et al. (2017).
Besides the vane size, literature is also divided on the best vane shape for vane-type VGs. Most literature compares triangular and rectangular vanes. Godard and Stanislas (2006) recommend choosing triangular vanes over rectangular vanes due to their lower drag penalty for the same size. However, Zhen et al. (2011) show that rectangular vanes produce a higher maximum lift and lower skin friction coefficient than triangular vanes of the same size. The lower skin friction coefficient especially should lead to lower drag and is thus a finding contrary to the work of Godard and Stanislas (2006). Fouatih et al. (2016) also show that rectangular vanes generally produce a higher lift-to-drag ratio, but some configurations may perform poorly due to higher drag. The differences in performance between triangular and rectangular vanes in different studies create an additional variable leading to uncertainty in the optimal VG design.
The impact of VG designs on unsteady airfoil aerodynamics has been primarily studied through numerical simulations using computational fluid dynamics (CFD). Typically for unsteady studies, VGs have been designed based on steady-state performance, with the assumption that the performance in unsteady conditions would be similar. In recent work, Zhu et al. (2020) studied the effect of single and double-row VGs on the lift drag and moment characteristics of an NREL S809 airfoil undergoing pitch oscillations using URANS simulations. Zhu et al. (2022) extended the same investigation to combine the effect of leading-edge roughness and VGs using URANS simulations and equivalent sand grain roughness models. Both of these studies based their VG designs on guidelines established through steady investigations from the work of Mueller-Vahl et al. (2012) and Baldacchino et al. (2018). Experimental studies focussing on the effect of VGs on unsteady aerodynamic characteristics (Choudhry et al., 2016; Li et al., 2020; De Tavernier et al., 2021; Doosttalab et al., 2025) are challenging to conduct, since they require matching both the high chordwise Reynolds numbers and high degree of unsteadiness at which modern wind turbine blades operate. Representative dynamic stall tests thus require operating at high angles of attack with high wind speeds and high pitching frequencies, which can generate enormous loads, making safe operation of experimental setups a challenge. These experimental studies have also used VGs designed for optimal steady performance due to the limited prior experimental data on unsteady conditions, including VGs. The authors of this paper have also based their VG design used in a previous experimental work (Sahoo et al., 2024b) on the optimal VG design proposed by the steady investigations of Baldacchino et al. (2018), with the assumption that the steady optimal VG design will hold true for unsteady investigations as well. This previous investigation focussed on the ability of VGs to counteract the performance loss on a pitching airfoil due to leading-edge erosion (simulated via forced transition with a zigzag tape) when the airfoil is passing through various phases of dynamic stall. This paper will instead focus on investigating various VG designs in both steady and unsteady conditions, with the objective of verifying the assumption that steady and unsteady performance of all VG designs will be similar. The test conditions in this paper are also different from Sahoo et al. (2024b) in covering a wider range of unsteadiness regimes and to ensure transition to turbulence far upstream of the VGs so that the effects discussed in this work can solely be attributed to VG design variation.
The simulations of Zhu et al. (2020) on the NREL S809 airfoil with VGs show that VGs bring about a sharp decrease in the phase-averaged lift coefficient when the airfoil starts to pitch down from the maximum angle of attack and also slow down the reattachment process near the minimum angle of attack. Moreover, the phase-averaged Cp distributions indicate the presence of a stall vortex that oscillates near the trailing edge. Similar behaviour is also observed in the phase-averaged pressure distributions from the simulations of Zhu et al. (2022) on the same airfoil and VG combinations with forced transition added and from the experimental results of Wei et al. (2023) on a NACA 0012 airfoil with VGs. These results indicate that the interaction between the stall vortex and the streamwise vortices generated by the VGs may lead to complex unsteady flow separation behaviour that is lost when the results are phase averaged.
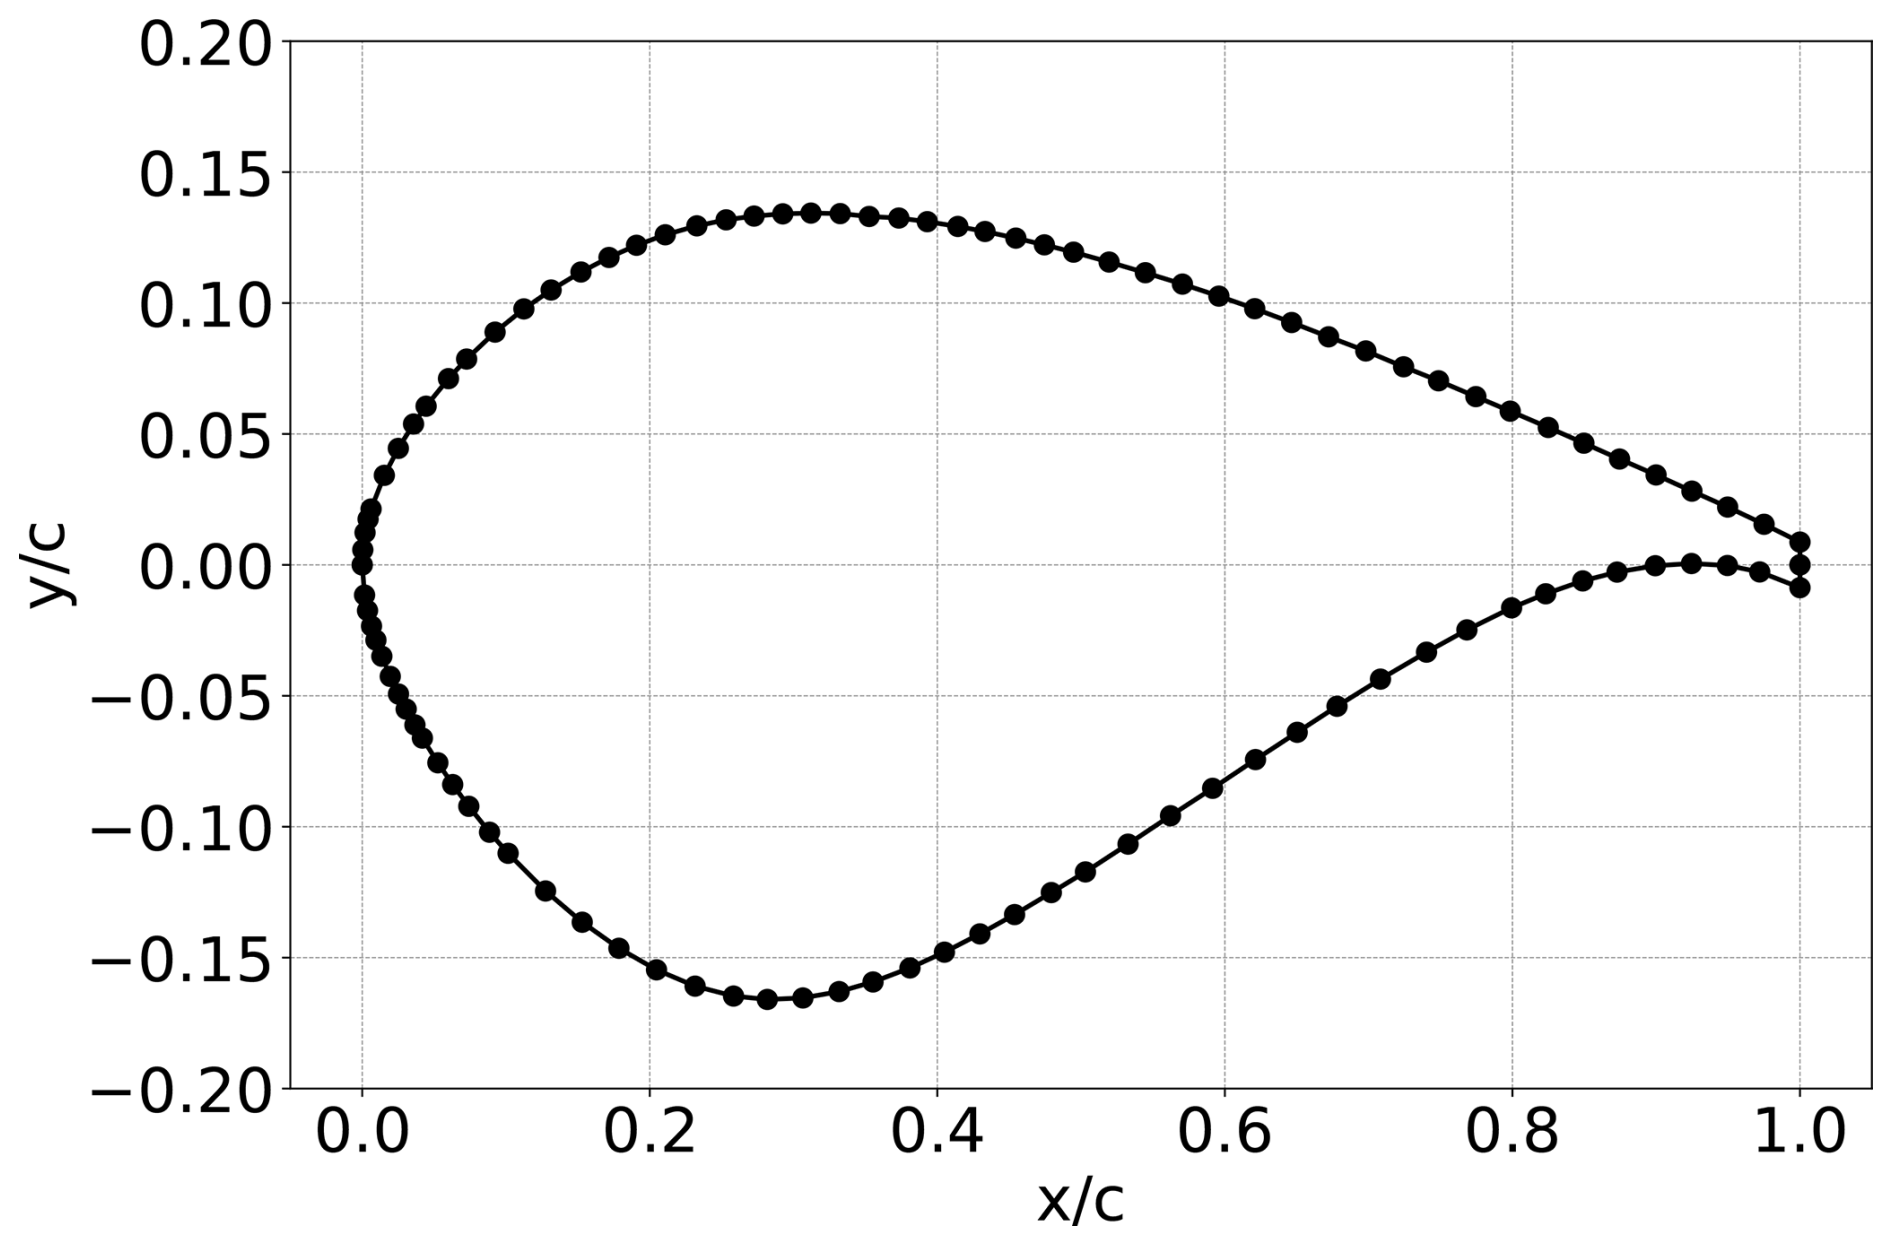
In this work, we conduct wind tunnel experiments on a DU-97-W-300 airfoil section equipped with different VG configurations undergoing pitch oscillations. The DU-97-W-300 airfoil has a maximum thickness-to-chord ratio of 30 % and was designed for wind turbine root sections (Timmer and van Rooij, 2003). Several reference wind turbines such as the DTU 10 MW (Bak et al., 2013), AVATAR (Schepers et al., 2018), IEA 15 MW (Gaertner et al., 2020), and IEA 22 MW (Zahle et al., 2024) use an airfoil of 30 % thickness-to-chord ratio for inboard and midboard sections where the positive stall angle of attack and the aerodynamic efficiency (lift-to-drag ratio) are important design criteria. The tested VGs are thus optimally designed for stall delay and lift-to-drag ratio for steady conditions.
First, we focus on varying the vane height of the VGs to study whether vanes smaller than the local boundary layer height generally recommended by literature for steady applications can prevent unsteady flow separation during pitch oscillations. Second, we also compare rectangular and triangular VG vane shapes to investigate which design can better prevent flow separation in unsteady conditions.
2.1 Model and wind tunnel description
The tests were carried out in the closed-loop, low-turbulence tunnel at TU Delft. The octagonal test section has a cross-sectional area of 1.80 m×1.25 m and is 2.60 m long. The tested DU-97-W-300 airfoil section has a maximum thickness-to-chord ratio of 30 %. The model has a chord of 0.65 m, a thick trailing edge of 1.7 % of the chord, and spans the height of the wind tunnel test section. This gives an aspect ratio of approximately 1.92. The airfoil model with trip tape and VGs installed is shown in Fig. 1.
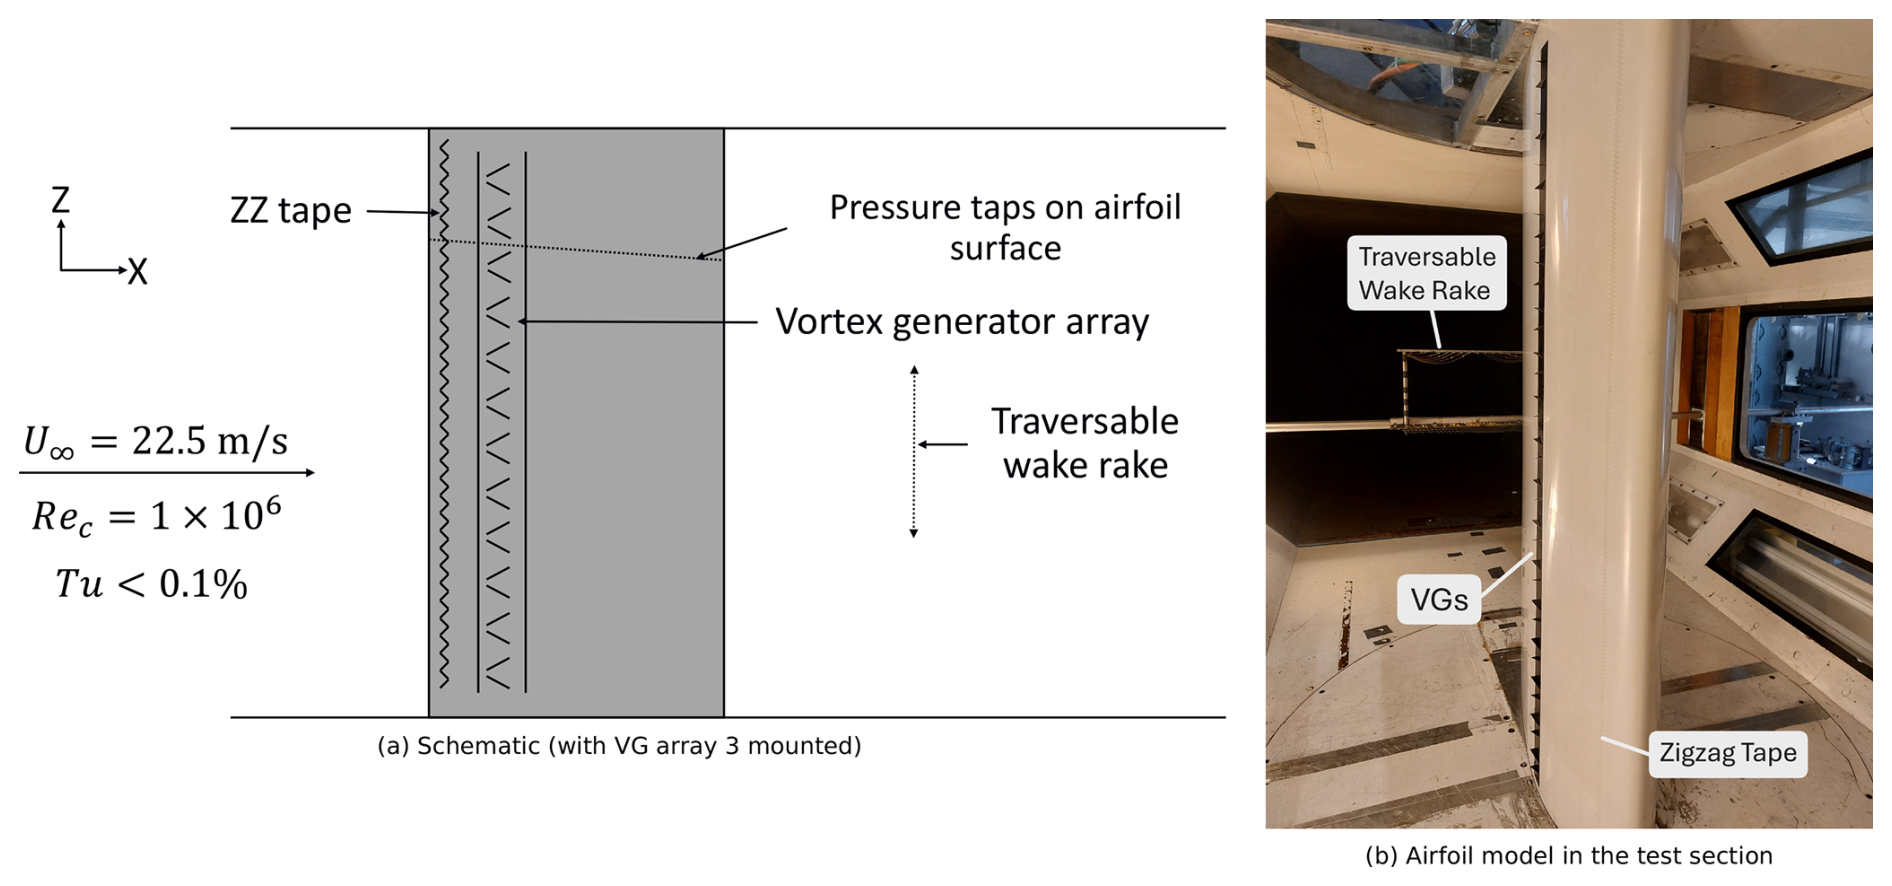
The airfoil was designed by Timmer and van Rooij (2003) at TU Delft for inboard sections of wind turbine blades with a high relative thickness for lower structural loads on the turbine shaft and bearings, and a relatively high maximum lift to deliver sufficient torque at lower wind speeds. We use 0.5 mm thick zigzag tape to force transition to a turbulent boundary layer at a 5 % chordwise location on both sides of the airfoil. As mentioned in Sect. 1, the forced transition is a key difference from the setup used in previous work by the authors in Sahoo et al. (2024b). The setup of the previous experiment had used 0.2 mm thick zigzag tape at a 5 % chordwise location, which proved insufficient to trigger a transition to turbulence at the zigzag tape location. Instead, with the thinner zigzag tape, the authors observed the flow transition location varying between the zigzag tape location and the VG location. This caused uncertainty in attributing differences in the pressure distribution between VG and no-VG cases solely to the presence of VGs. Hence, the authors opted for a thicker zigzag tape in this experiment to ensure a transition to turbulence at the zigzag tape location and far upstream of the VG location. Throughout the paper, “free” and “forced” are used to refer to the free or forced transition state of the boundary layer.
The pitching motion for the dynamic stall tests was imparted using a linear actuator connected to a steel shaft going through the model via a crank mechanism that converted the linear actuation to the rotational motion of the airfoil. The model was clamped at the top and bottom with rotational bearings, leaving a gap of about 1 mm between the model and the tunnel walls. During static tests, this gap was taped off.
2.2 Vortex generator design
The symbols used for the various VG array geometry and configuration parameters are shown in Fig. 2a. All VGs tested were counter-rotating vanes with a common downwash. Previous steady measurements (Baldacchino et al., 2018) tested VGs between 10 % and 50 % chordwise location on this airfoil and showed that VGs at 30 % chord were the most effective at delaying stall and increasing maximum lift. To simplify the test matrix by fixing the VG placement location, all VG arrays were placed at the most effective location of 30 % chord on both sides of the airfoil. The VGs were added across the span of the airfoil model, but leaving a gap of around 100 mm (approximately 8 % of the model span) near the tunnel walls (as illustrated in Fig. 1a) to avoid interactions between the VGs and the flow near the walls. Thus, the VGs cover around 84 % of the airfoil model span. Steady measurements from literature (Baldacchino et al., 2018) were reproduced to validate a stall angle of attack difference within 1° of the previous tests.
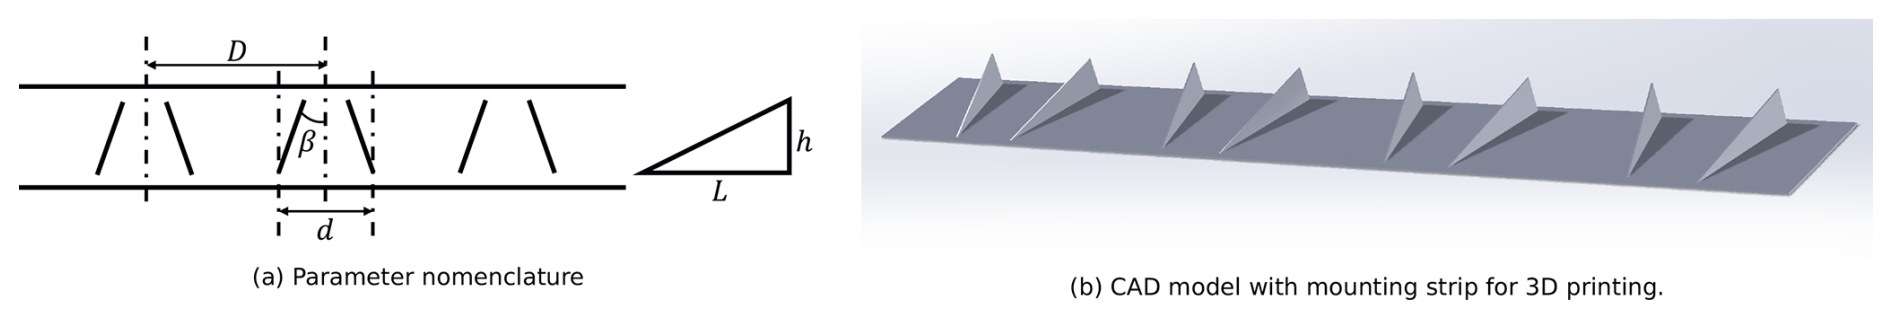
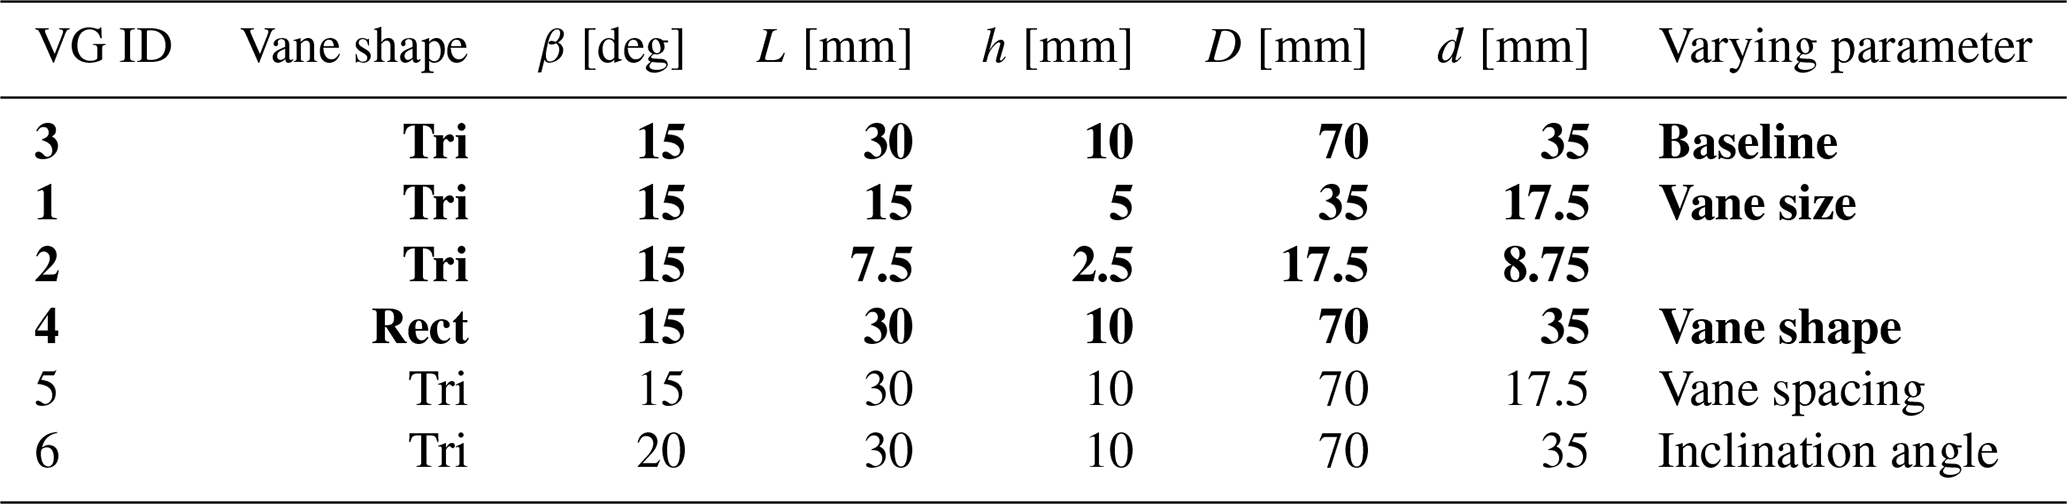
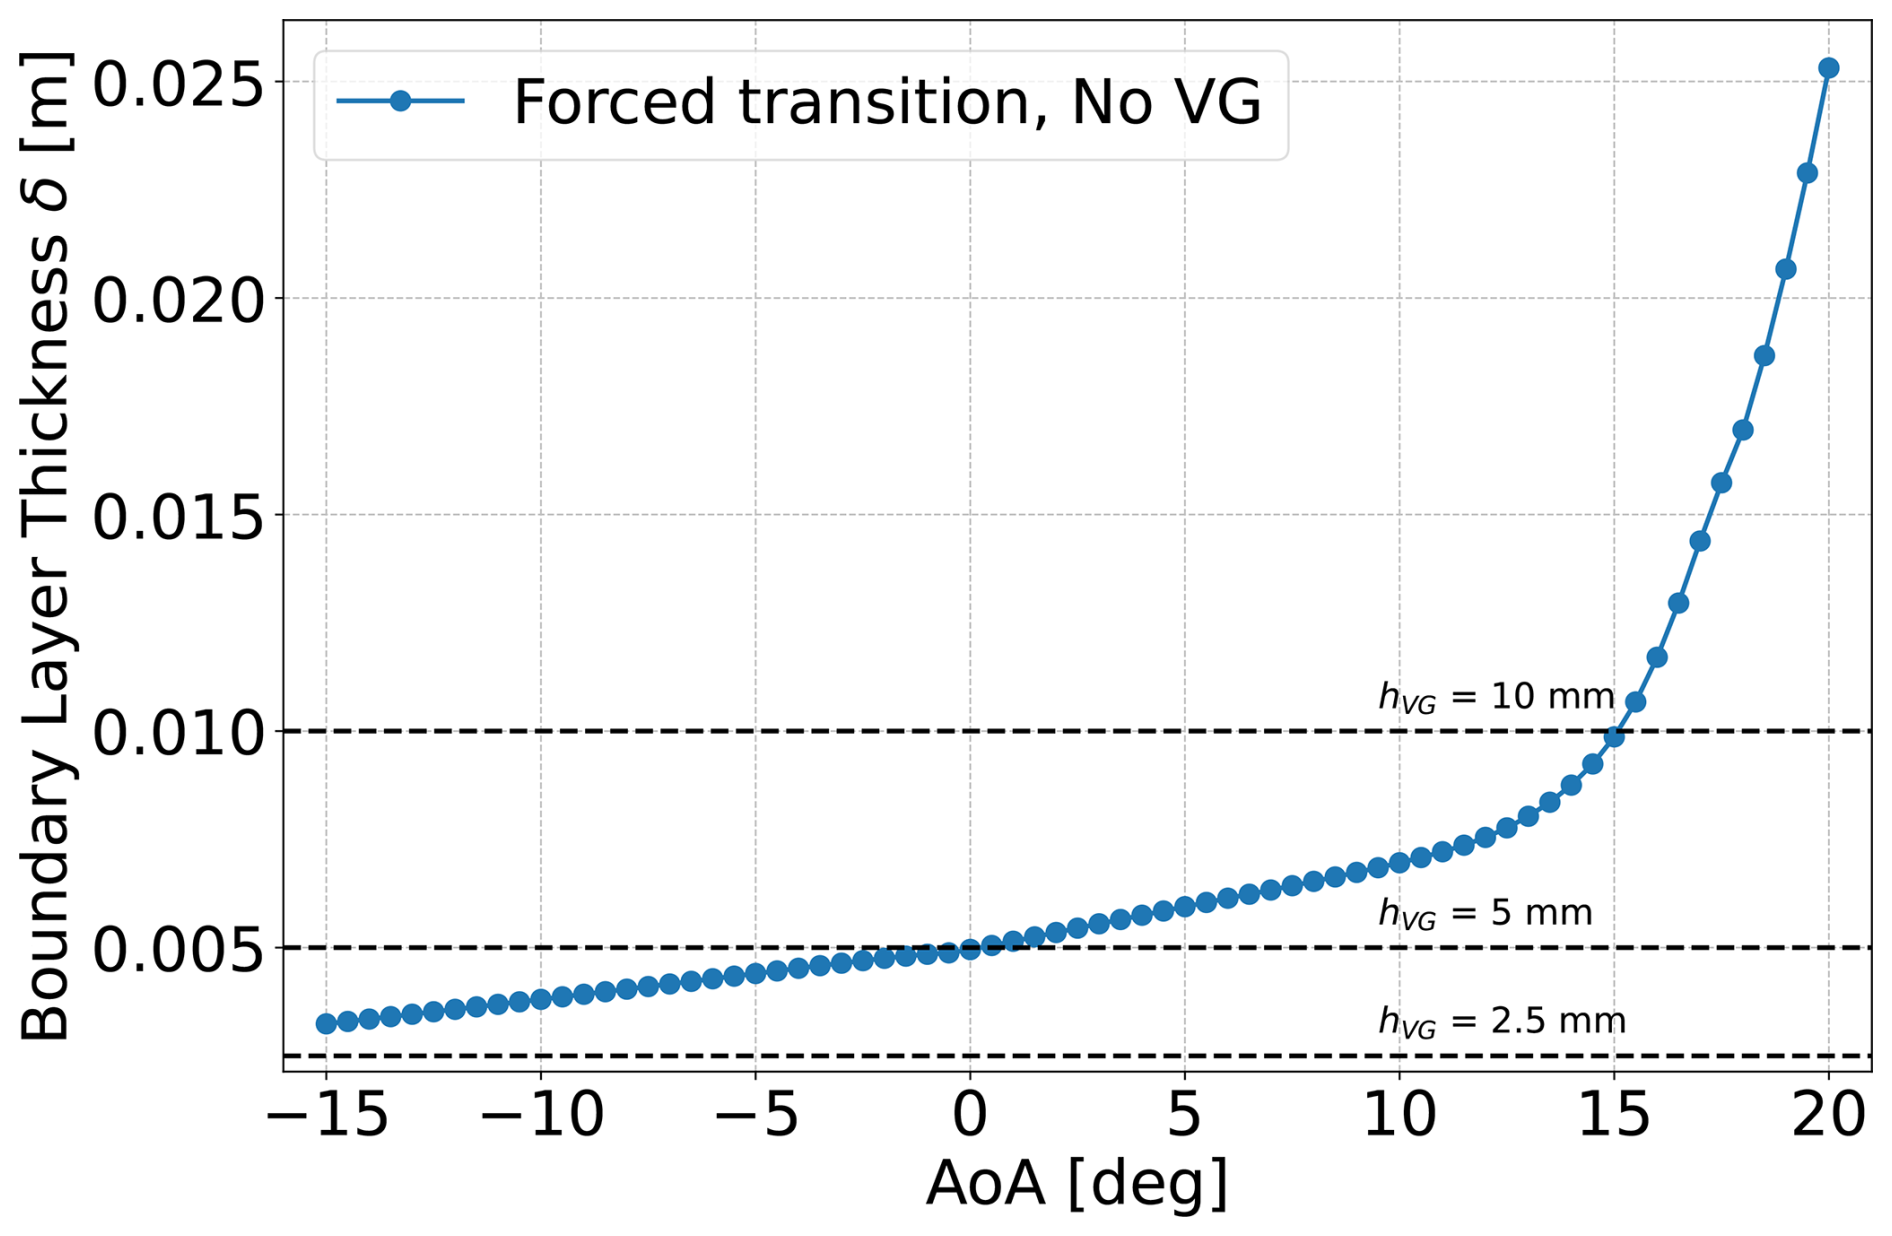
The VG arrays tested in the overall experiment are presented in Table 1. The VG arrays were manufactured via 3D printing. For ease of manufacture and mounting on the airfoil model, a thin mounting strip of 280 mm length and 0.5 mm thickness was included in the VG array designs, as shown in Fig. 2b. The height of the VGs was accordingly adjusted to match the total heights mentioned in Table 1. In this work, we compare VG IDs 1–3 for the vane size variation and VG4 for the vane shape variation. Henceforth in this paper, arrays 1–3 will be referred to with their vane height as the 2.5 mm, 5 and 10 mm VGs respectively and the array 4 will be referred to as the rectangular VGs. For reference, the heights of the three compared vane sizes with respect to the computed boundary layer height at the VG placement location on the no-VG airfoil are shown in Fig. 3 for the whole range of measured angles of attack. At 0° angle of attack, the 2.5 mm VGs are smaller than the local boundary layer thickness, the 5 mm VGs are approximately equal to the local boundary layer thickness, and the 10 mm VGs are larger. The boundary layer height is computed using RFOIL (van Rooij, 1996).
Table 1Overview of VG array geometries tested. The cases presented in this work are highlighted in bold text.
2.3 Test matrix
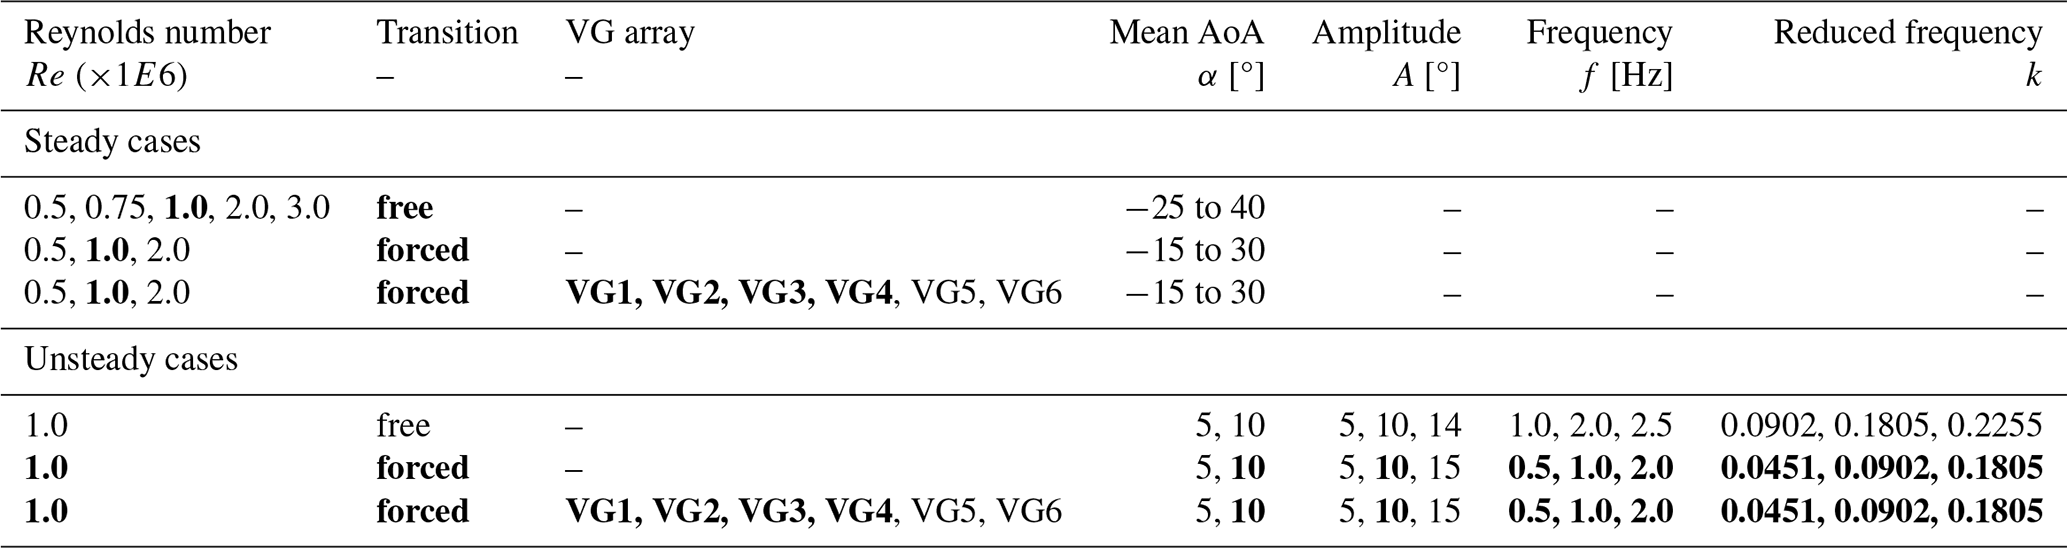
The test cases presented in this work are part of a larger test matrix presented in Table 2, with the cases discussed in this work highlighted with bold text. The static polars were acquired between −15° and 30°, capturing the stall region even with VGs. The chordwise Reynolds numbers were between 0.5 million and 2 million, corresponding to wind speeds between 11.3 to 45.3 m s−1. The free-stream turbulence level was well below 0.05 %. For the dynamic tests, the Reynolds number of 1 million was chosen. Sinusoidal pitch oscillations of different mean angle and amplitude combinations were applied to make the airfoil experience the various stages of dynamic stall development. The various pitching frequencies (presented dimensionless as the reduced frequency ) created unsteady flow around the airfoil that spanned quasi-steady (k=0.045), light unsteadiness (k=0.09), and high unsteadiness (k=0.18), as per the categorization made by Corke and Thomas (2015) based on the lag between the flow and the airfoil motion due to inertia. The unsteadiness regimes covered in this paper are another key difference between this experiment and the previous experiment described in Sahoo et al. (2024b). Of all the pitching motions tested, we focus on the 10±10° motion at all tested frequencies in this work. As will be illustrated in Sect. 3, the airfoil enters and exits the static stall region both with and without VGs, with the 10±10° pitching motion making it a good test case to investigate unsteady flow separation control with VGs.
Table 2Overview of all the test cases from the full experiment. The cases presented in this work are highlighted in bold text.
2.4 Instrumentation for data acquisition
The normal and tangential forces were calculated from surface pressures on the airfoil, measured using a distribution of 102 pressure ports on the model, including one port on the blunt trailing edge (illustrated in Fig. 4). The pressure ports are located between approximately 20 % and 25 % of the span from the top wall at a slight angle with the streamwise direction, as illustrated in Fig. 1a. This means the pressure ports span the length of one VG pair for the largest 10 mm VGs and four pairs for the smallest 2.5 mm VGs. The angled pressure port placement ensures that downstream pressure ports are not influenced by upstream disturbances. A traversable wake rake with 67 total pressure and 16 static pressure tubes was used to assess the total drag. The wake rake traversed over a spanwise distance of 140 mm spanning two VG pairs for the largest 10 mm VGs and eight pairs for the smallest 2.5 mm VGs. Steady measurements were acquired at a rate of 5 Hz for 25 s. Unsteady measurements were acquired at a rate of 300 Hz for 150 cycles of pitching motion.
2.5 Data processing
The measured pressures were used to calculate the normal force coefficient Cn, pitching moment coefficient Cm, lift coefficient Cl, and drag coefficient Cd. Drag coefficient from the wake rake pressures was calculated using the method described in Jones (1936). The uncorrected values of these coefficients are presented with a ′ symbol throughout the paper. In addition to the force and moment coefficients, the location of flow separation is also presented in this paper. Flow over the airfoil surface is considered to have separated when the pressure coefficient plateaus over the airfoil surface (). The separation location is determined to be the point where the pressure coefficient starts to plateau. An example of flow separation location determined for one steady and one unsteady case is shown in Sect. A.
The steady force, moment, and pressure coefficients were corrected for solid and wake blockage using the corrections from Allen and Vincenti (1944), and for wake buoyancy and lift interference (streamline curvature) using the corrections from Garner et al. (1966). The correction procedure is well documented in literature such as the work of Timmer (2021) and is thus left out of this paper for brevity.
The unsteady measurements were corrected for the effects of the tubes connecting the pressure ports to the scanner. The pressure signal at the transducer carries a phase lag and is attenuated in amplitude compared to the pressure signal at the surface of the airfoil due to the air column inside the measurement tubes. The measured pressure signal is corrected for these effects based on the theory of Bergh and Tijdeman (Bergh and Tijdeman, 1965; Boerrigter, 1996) that defines a process to determine the response time of a measurement system consisting of pressure tubes and transducers connected in series. It should be noted that the effect of a possibly oscillating air column in the pressure tubes due to the airfoil motion is not included in these corrections. For the current setup, two sets of pressure tubes of diameter 1.8 mm (connected to the model pressure taps) and diameter 1 mm (connected to the pressure scanner) are used alongside adaptors of inner diameter 0.8 mm to connect both sets of tubes. The larger diameter tubes connected to the model are remnants of the fact that the airfoil model was first manufactured for compatibility with an older pressure measurement system that is no longer used in the TU Delft low-turbulence tunnel (LTT). Both sets of tubes are 90 cm long, and the adaptor is 1 cm long. The unsteady measurements could not be corrected for the usual blockage, streamline curvature, and buoyancy effects due to the inability to measure the wake drag during dynamic conditions. The unsteady measurements are thus presented without these corrections.
The lift and drag characteristics of the airfoil without VGs in free and fixed transition for a Reynolds number of 1 million are shown in Fig. 5. As mentioned in Sect. 1, the static stall angle of attack, maximum lift coefficient, and lift-to-drag ratio are typically considered the important aerodynamic performance metrics for airfoils used in inboard and midboard sections of wind turbine blades where VGs are typically placed. In free transition, the airfoil stalls at around a 16° angle of attack with a maximum lift coefficient of about 1.6. The aerodynamic efficiency (lift-to-drag ratio) peaks at around a 14° angle of attack. When transition to turbulence is fixed at 5 % chord, the airfoil stalls earlier around a 9° angle of attack, with the maximum lift coefficient reduced by nearly 40 % to 0.95, displaying a strong sensitivity to leading edge roughness.
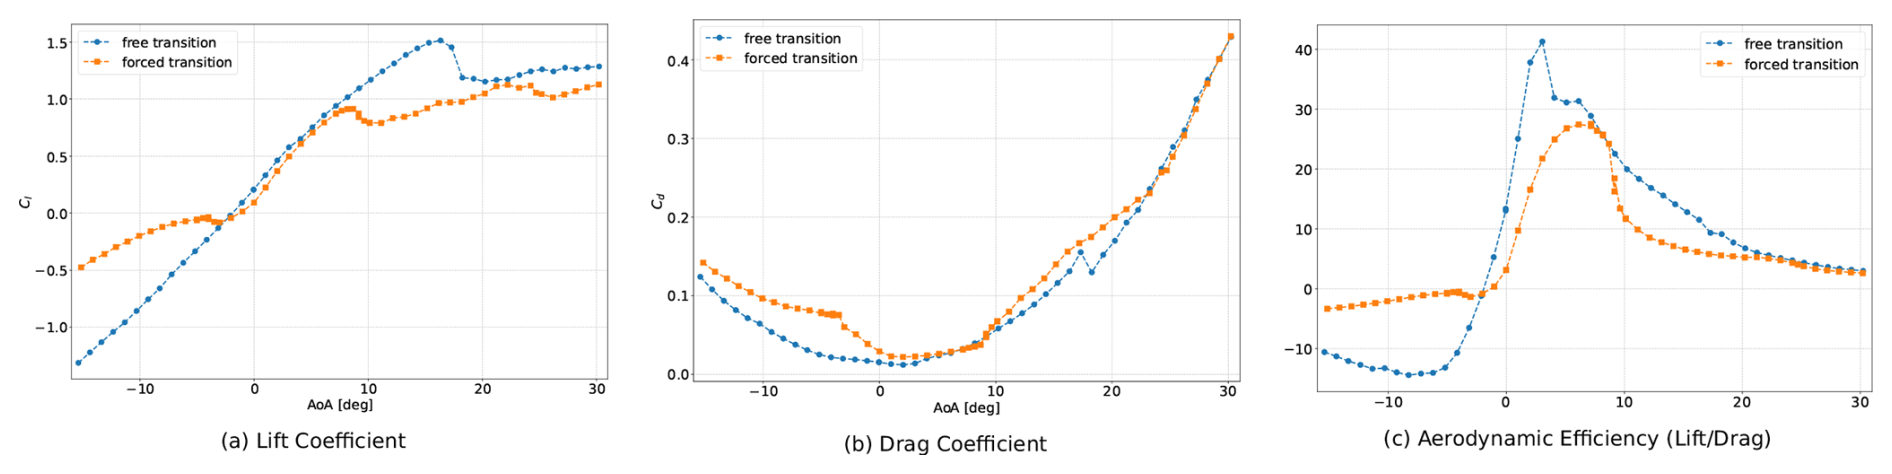
Figure 5Fixing transition to turbulence with zigzag tape at 5 % chord drastically reduces the stall angle and aerodynamic efficiency, indicating the airfoil's strong sensitivity to leading edge roughness.
In the presence of VGs, the lift polars in Fig. 6a show VGs delaying stall to a higher angle of attack. As expected from the literature (Ashill et al., 2005; Baldacchino et al., 2018), the larger the vane height, the stronger the vortices and the greater the stall delay and maximum lift. The increasing frontal area of the larger VG vanes brings a higher drag penalty due to larger vanes even when flow is attached over the airfoil, as seen in Fig. 6b. However, since the drag increases drastically when flow separates, the smaller vanes provide a higher peak lift-to-drag ratio but only over a narrow range of angles of attack, while the larger vanes provide a slightly lower peak lift-to-drag ratio but over a wider range of angles of attack, as seen in Fig. 6c. Of the three sizes of triangular vanes tested, the 5 mm VGs provide the best compromise between significant stall delay from the no-VG case, a high maximum lift, and a lower added drag.
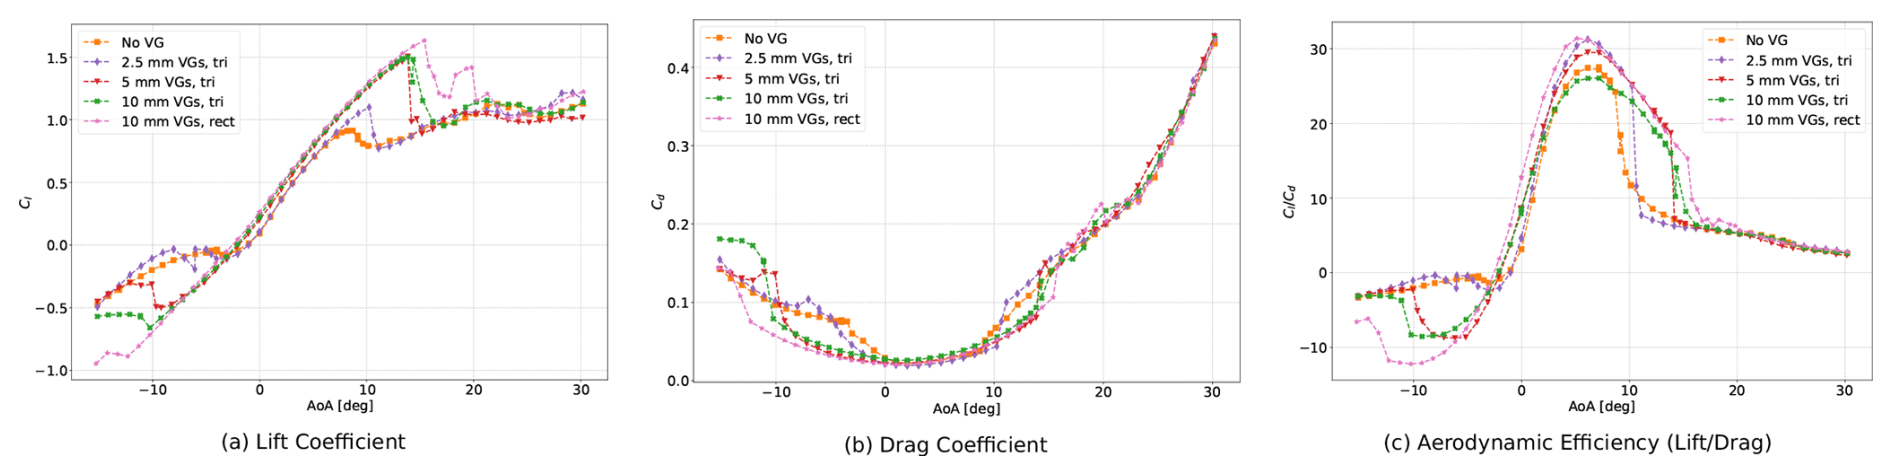
Figure 6Comparing the stall delay, lift enhancement, drag penalty, and aerodynamic efficiency for different VG heights and shapes.
Rectangular vanes of 10 mm vane height delayed stall further than triangular vanes of the same size. The rectangular vanes were also observed to generate lower drag when flow is attached. This led to rectangular vanes producing a significantly higher lift-to-drag ratio than triangular vanes of the same size, and even matching the peak lift-to-drag ratio from the smallest triangular vanes. To understand this behaviour, the flow separation characteristics over the suction side of the airfoil was compared for the different vane heights and shapes, by examining the flow separation location (determined as described in Appendix A) with increasing angle of attack in Fig. 7. In the no-VG case, trailing-edge flow separation gradually progresses upstream towards the leading edge with increasing angle of attack. The airfoil stalls when the separation front reaches slightly upstream of 40 % chord. With the addition of VGs, flow separation starts at a higher angle of attack. With the smallest 2.5 mm VGs, the separation front moves upstream at a slower rate than without VGs until the stall angle of attack of 10°, indicating energization of the boundary layer by the streamwise vortices from the VGs. At stall, the separation front moves upstream at a much faster rate, unlike the gradual upstream migration in the no-VG case. Trailing-edge separation appears at a higher angle of attack with VGs of increasing vane height. However, the larger the VG vane, the more abrupt the upstream migration of the trailing-edge separation front, leading to stall. The rectangular VGs both delay the appearance of trailing-edge separation and slow down the upstream migration of the separation front than triangular VGs of the same size. The separation front remains downstream of the VG location (), up to a higher angle of attack than with the triangular VGs.
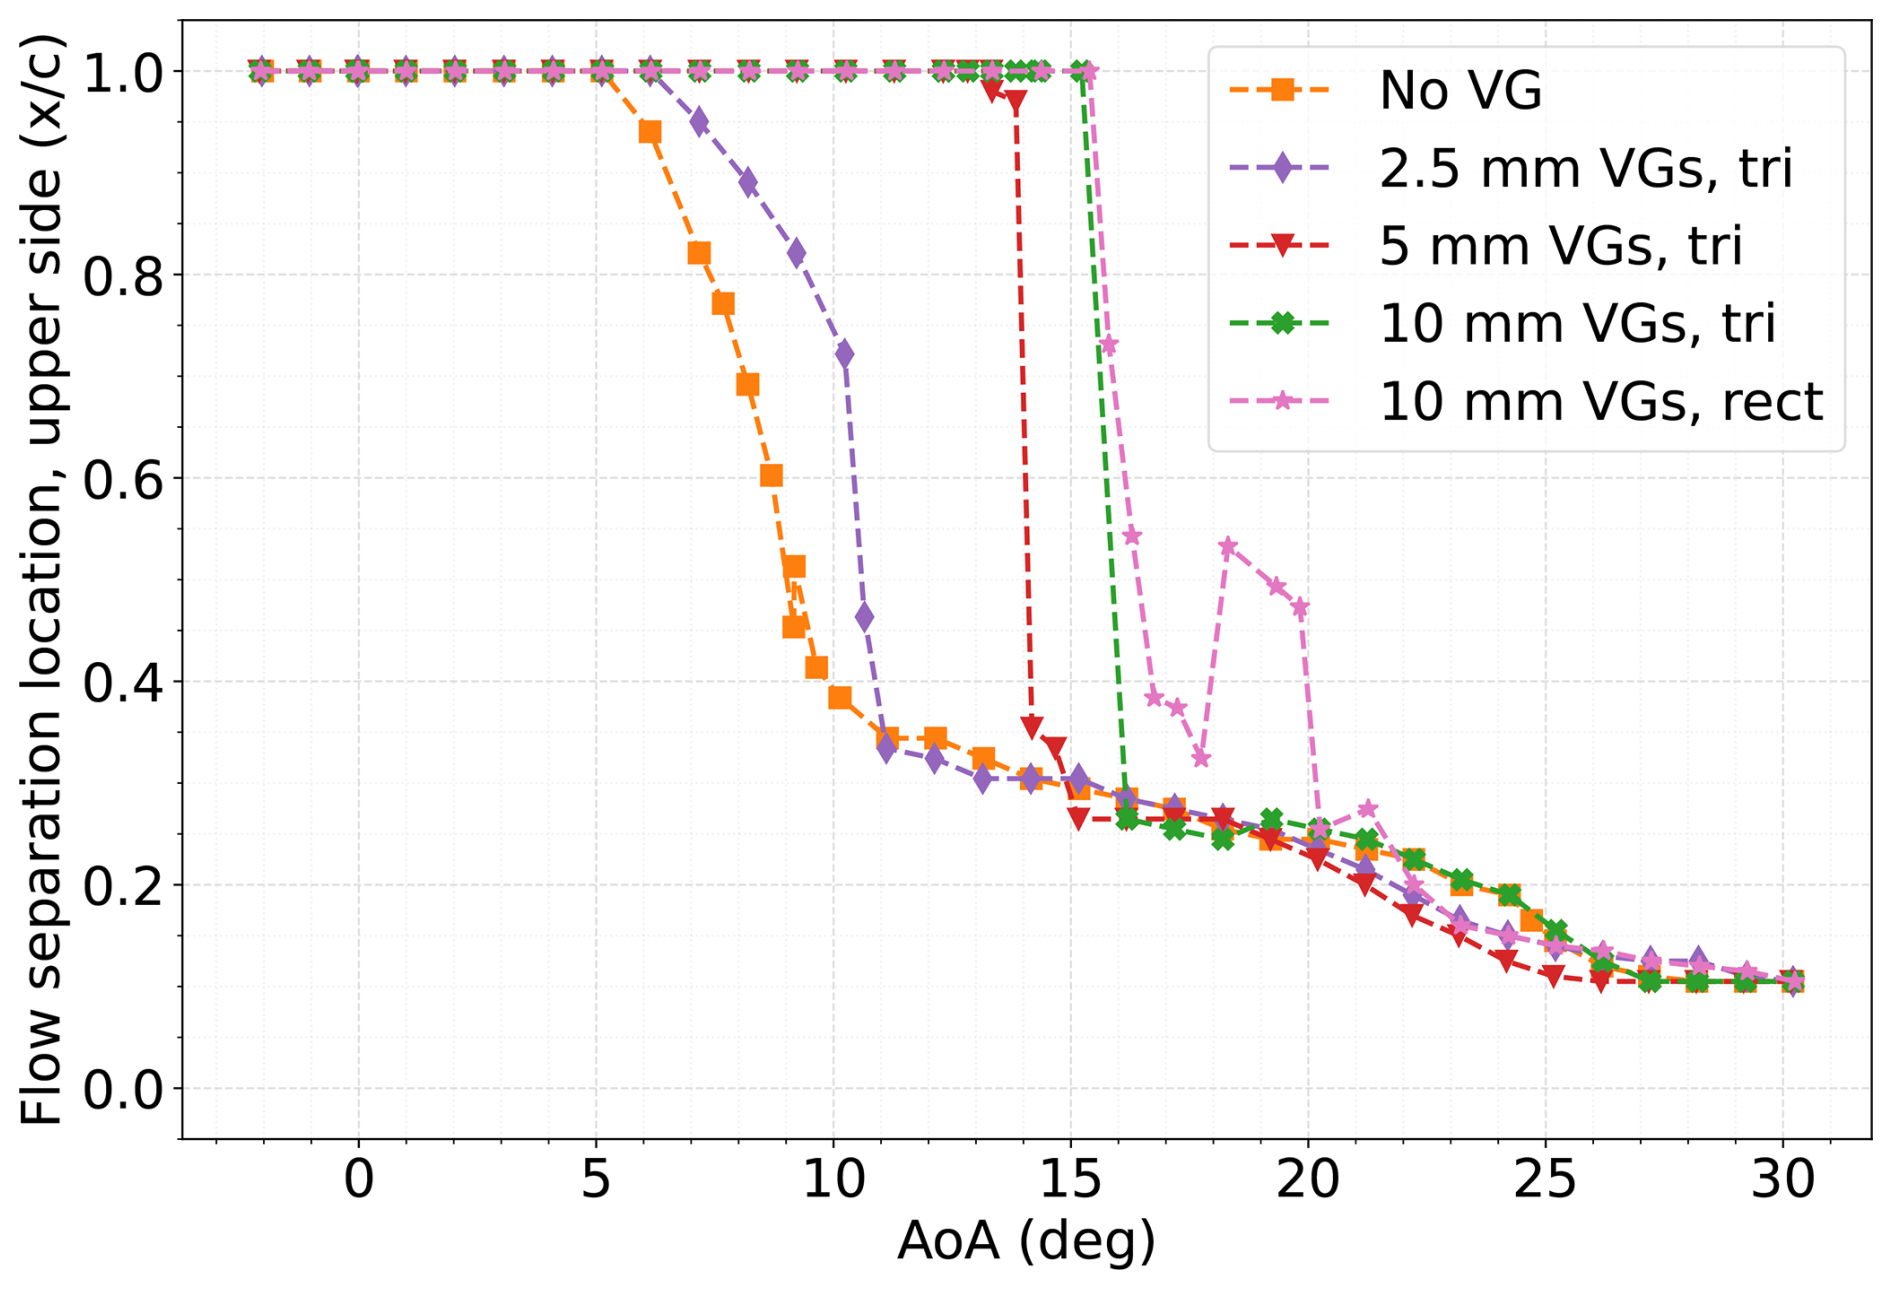
Figure 7Flow separation location over the suction side of the airfoil with increasing angle of attack for different VG vane heights and shapes. The flow separation location is determined from the pressure distribution over the airfoil surface.
The steady measurements indicate that rectangular vanes whose height is larger than the boundary layer height at the VG placement location are the best VGs for delaying both the appearance and the upstream progression of trailing-edge flow separation. As a result, the rectangular vanes provide the largest stall delay, the highest maximum lift, and the highest lift-to-drag ratio before stall among the compared VG configurations. This result is contrary to the conventional recommendation in literature that low-profile VG designs with vane heights smaller than the local boundary layer thickness provide the best compromise between maximizing stall delay and lift-to-drag ratio. The higher lift-to-drag ratio also runs counter to the common practice in wind turbine applications of using triangular rather than rectangular vanes, due to the perceived lower drag penalty of triangular vanes. The slower upstream progression of trailing-edge separation with rectangular vanes indicates that they energize the boundary layer more effectively than triangular vanes. This result calls for future measurements of airfoil boundary layers at high angles of attack in the presence of triangular and rectangular vanes to better understand the differences in streamwise vortices and turbulent boundary layer interactions for each vane shape.
For the dynamic cases, we use the normal force coefficient polar and the spatio-temporal evolution of the suction side (upper surface) flow separation location to investigate the development of the trailing-edge separation front and the unsteady aerodynamic loading on the airfoil.
4.1 Baseline airfoil without VGs
The normal force coefficient polar for 10±10° and all pitching frequencies is shown in Fig. 8. The suction side flow separation location for this pitching motion at different phases is shown in Fig. 9. Phases 0 to π represent the downstroke motion, and phases π to 2π represent the upstroke motion. A separation location of implies flow remains attached all over the airfoil upper surface.
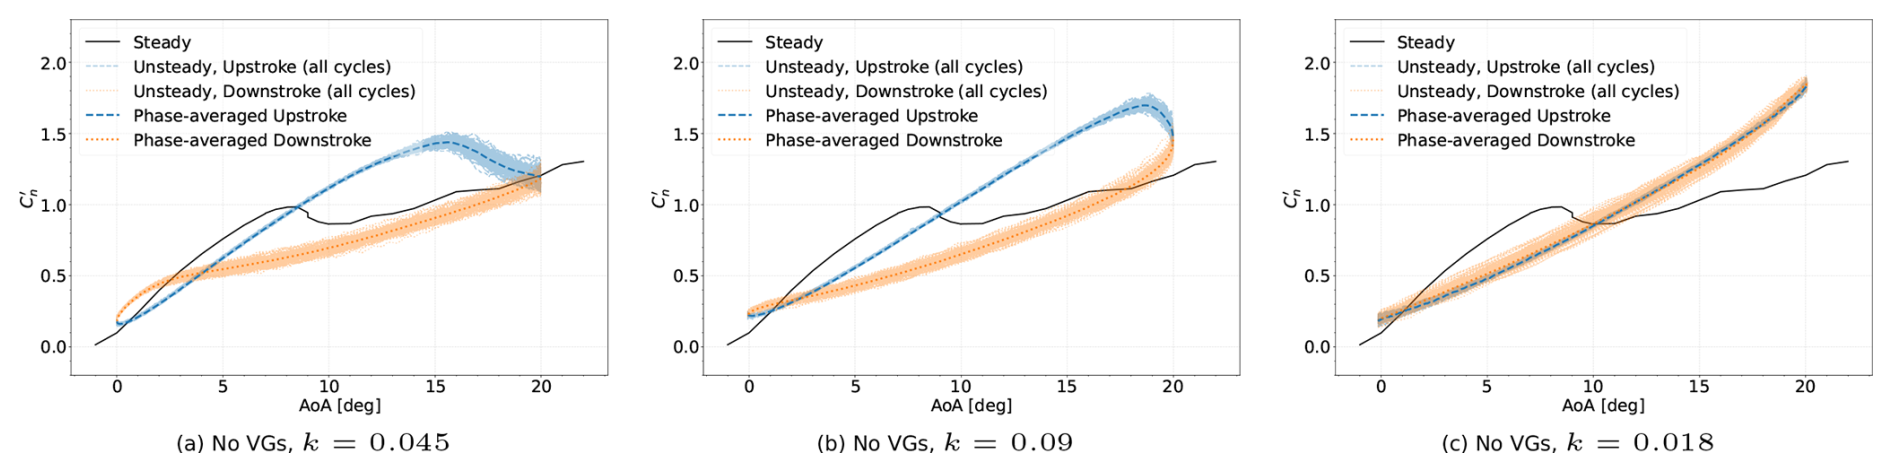
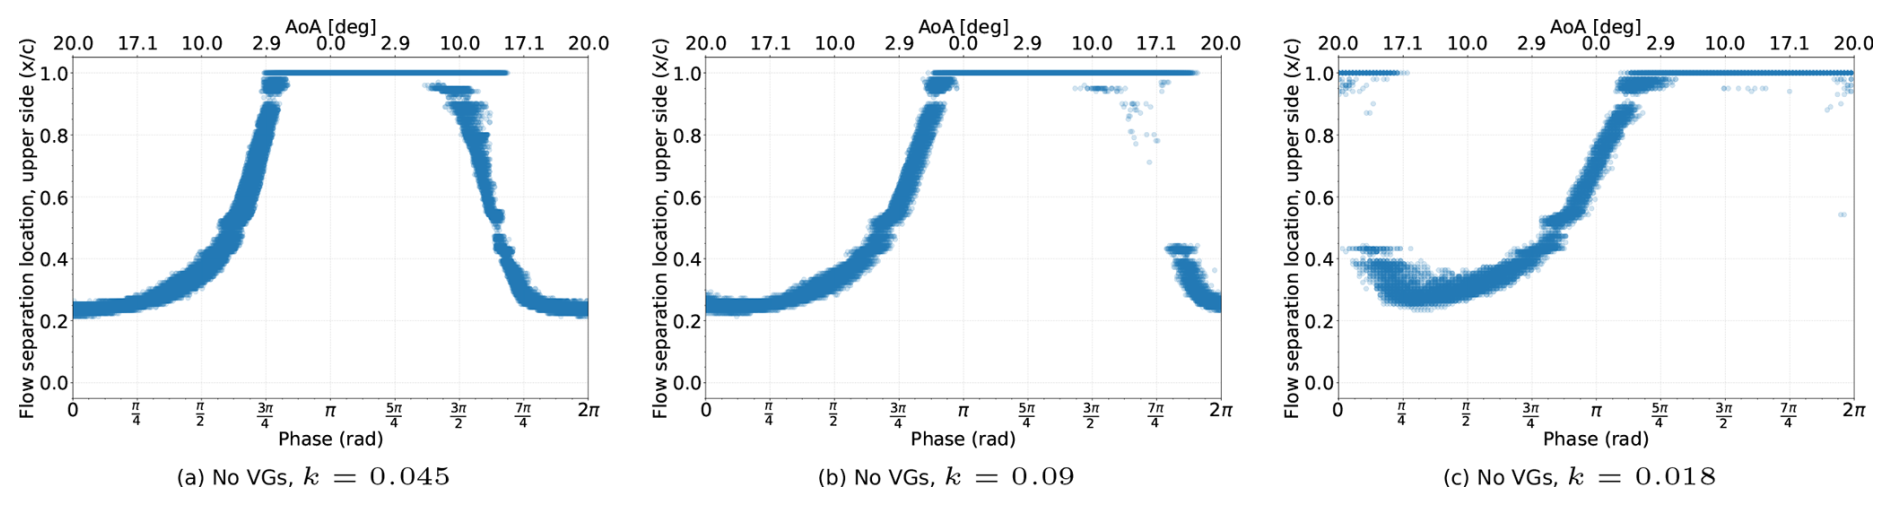
Figure 9Flow separation location on the suction side over 150 pitching cycles of 10±10° in the absence of VGs.
The unsteady motion of the airfoil causes the flow around the airfoil to lag behind the instantaneous angle of attack. Trailing-edge separation on the upper surface starts around 7° angle of attack during the upstroke motion with k=0.045 (Fig. 9a), close to the steady value of 6° (Fig. 7). While the trailing-edge separation front moves upstream, the airfoil keeps pitching up to higher angles of attack, allowing the normal force coefficient to increase beyond the maximum steady value. Just like the static case, dynamic stall is observed when trailing-edge separation has moved to , which occurs around an 16° angle of attack at k=0.045. The loss of lift post-stall is gradual as the separation front keeps moving upstream before settling at around by an 18° angle of attack, where the separation front remains for the rest of the upstroke motion. As the airfoil pitches down, flow starts to reattach and the separation point moves downstream until flow has reattached over the whole airfoil. For k=0.045, reattachment starts as soon the downstroke motion begins and complete reattachment occurs at around a 4–3° angle of attack. The downstroke normal force coefficient remains lower than the upstroke value until complete reattachment occurs, after which the downstroke value becomes higher than the upstroke value.
For higher pitching frequencies, the faster pitch rate causes a further lag between the airfoil motion and the flow on the airfoil surface. For k=0.09, separation appears abruptly on the airfoil around 18.5° angle of attack and progresses rapidly to by a 19° angle of attack. The airfoil already starts to pitch down while the separation front is still moving upstream, and thus the separation front stops slightly upstream of before reattachment starts. For k=0.09, reattachment starts only around a 17° angle of attack in the downstroke motion, and complete reattachment over the airfoil surface occurs around a 3–2° angle of attack. For k=0.18, the flow around the airfoil lags so far behind the airfoil motion that the trailing-edge separation does not appear during the upstroke motion but rather during the downstroke motion, at around a 17° angle of attack. The appearance and upstream progression of the separation front is abrupt and rapid, similar to the k=0.09 case. Reattachment only starts at around a 10° angle of attack in the downstroke, and complete reattachment only occurs close to a 0–1° angle of attack upstroke.
4.2 Influence of VGs and effect of vane height variation
To assess the impact of VGs on the unsteady aerodynamic behaviour, we first vary the VG vane height. The normal force coefficient polars for the different vane heights at various pitching frequencies are shown in Fig. 10, and the flow separation location over the suction side of the airfoil is shown in Fig. 11. For the smallest 2.5 mm VGs ( at AoA 0°), the normal force coefficient polars (Figs. 10a–c) are similar to the baseline case without VGs. For the slowest pitching frequency k=0.045, trailing-edge separation starts around a 12° angle of attack (Fig. 11a) upstroke as opposed to 7° observed in the steady case. However, the separation front progresses upstream rapidly. As with the no-VG case, the airfoil stalls when the separation front reaches around , which occurs at around a 17° angle of attack. While the VGs delay the onset of trailing-edge separation, the upstream progression of the separation front is even more rapid than the no-VG case, and, hence, dynamic stall is delayed by only about 1° by the 2.5 mm VGs. Reattachment during the downstroke motion starts at around 17°, which is later than the no-VG case. But the reattachment progresses faster than the no-VG case, and complete reattachment occurs at around a 5–4° angle of attack, which is slightly earlier than the no-VG case. When pitched at higher frequencies of k=0.09 (Fig. 11b) and k=0.18 (Fig. 11c), the onset of trailing-edge separation gets delayed further and the upstream progression of the separation front upstream is even more rapid and abrupt, establishing a similar trend as the no-VG case. The VGs do restrict the ultimate upstream location of the separation front to around , which is slightly farther downstream than the no-VG case where the separation front settles at around . Thus, while the smallest VGs energize the boundary layer enough to delay the onset of trailing-edge separation and speed up the reattachment process once started, they are not effective enough to significantly alter the overall unsteady aerodynamic behaviour of the airfoil.
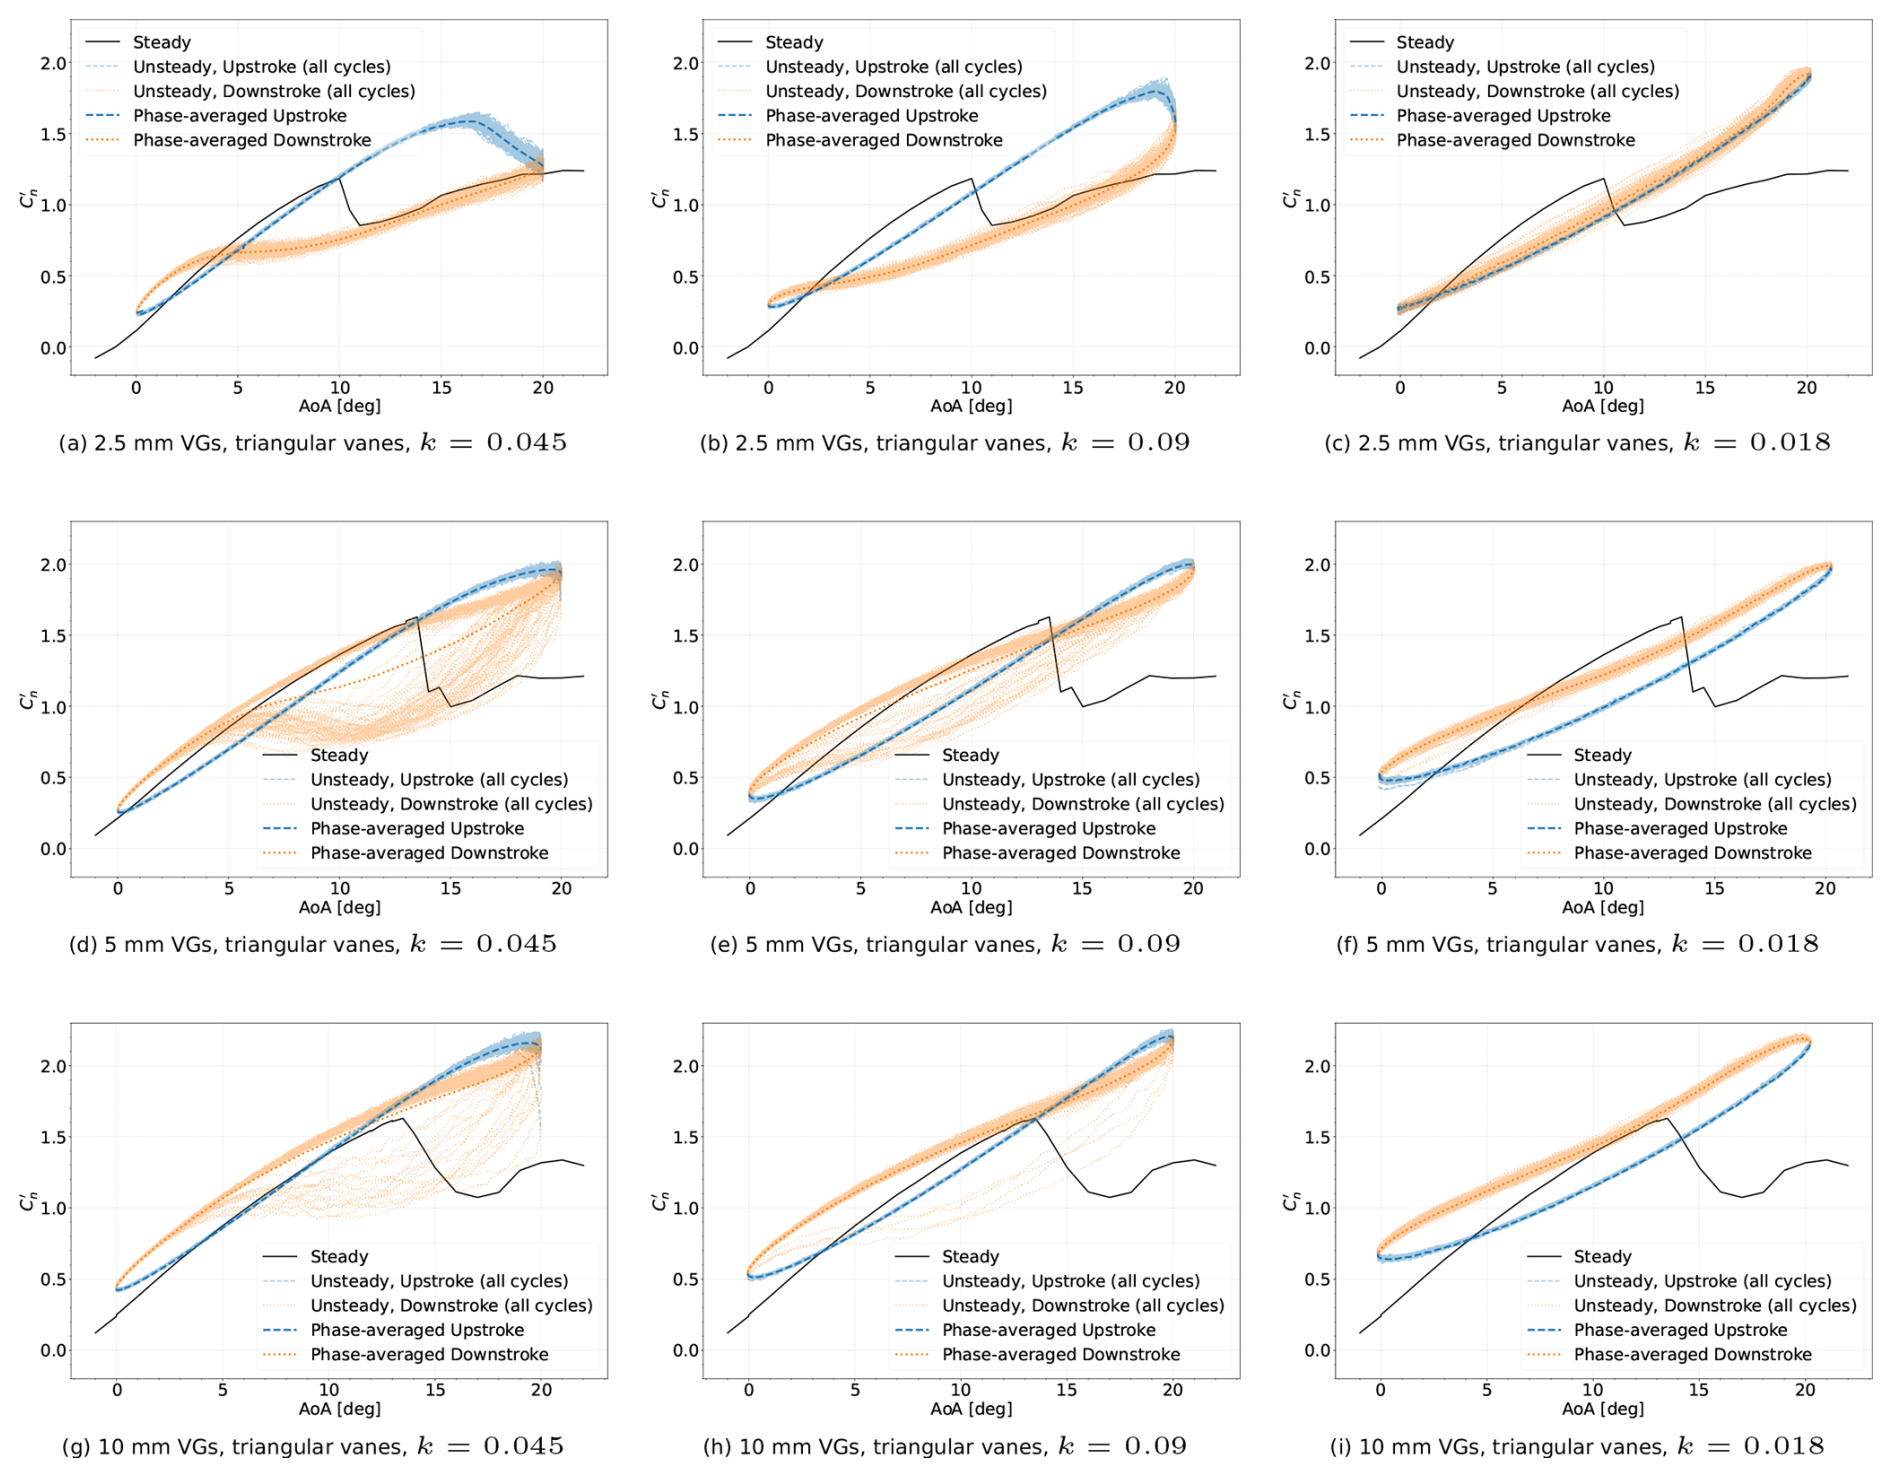
Figure 10Normal force coefficient polars when the airfoil equipped with triangular VGs of various vane heights is pitching 10±10°. The polars oscillate between two reattachment curves in the downstroke phase. The number of later reattaching cycles reduces with increasing pitching frequency, and the later reattaching cycles virtually disappear for the highest pitching frequency.
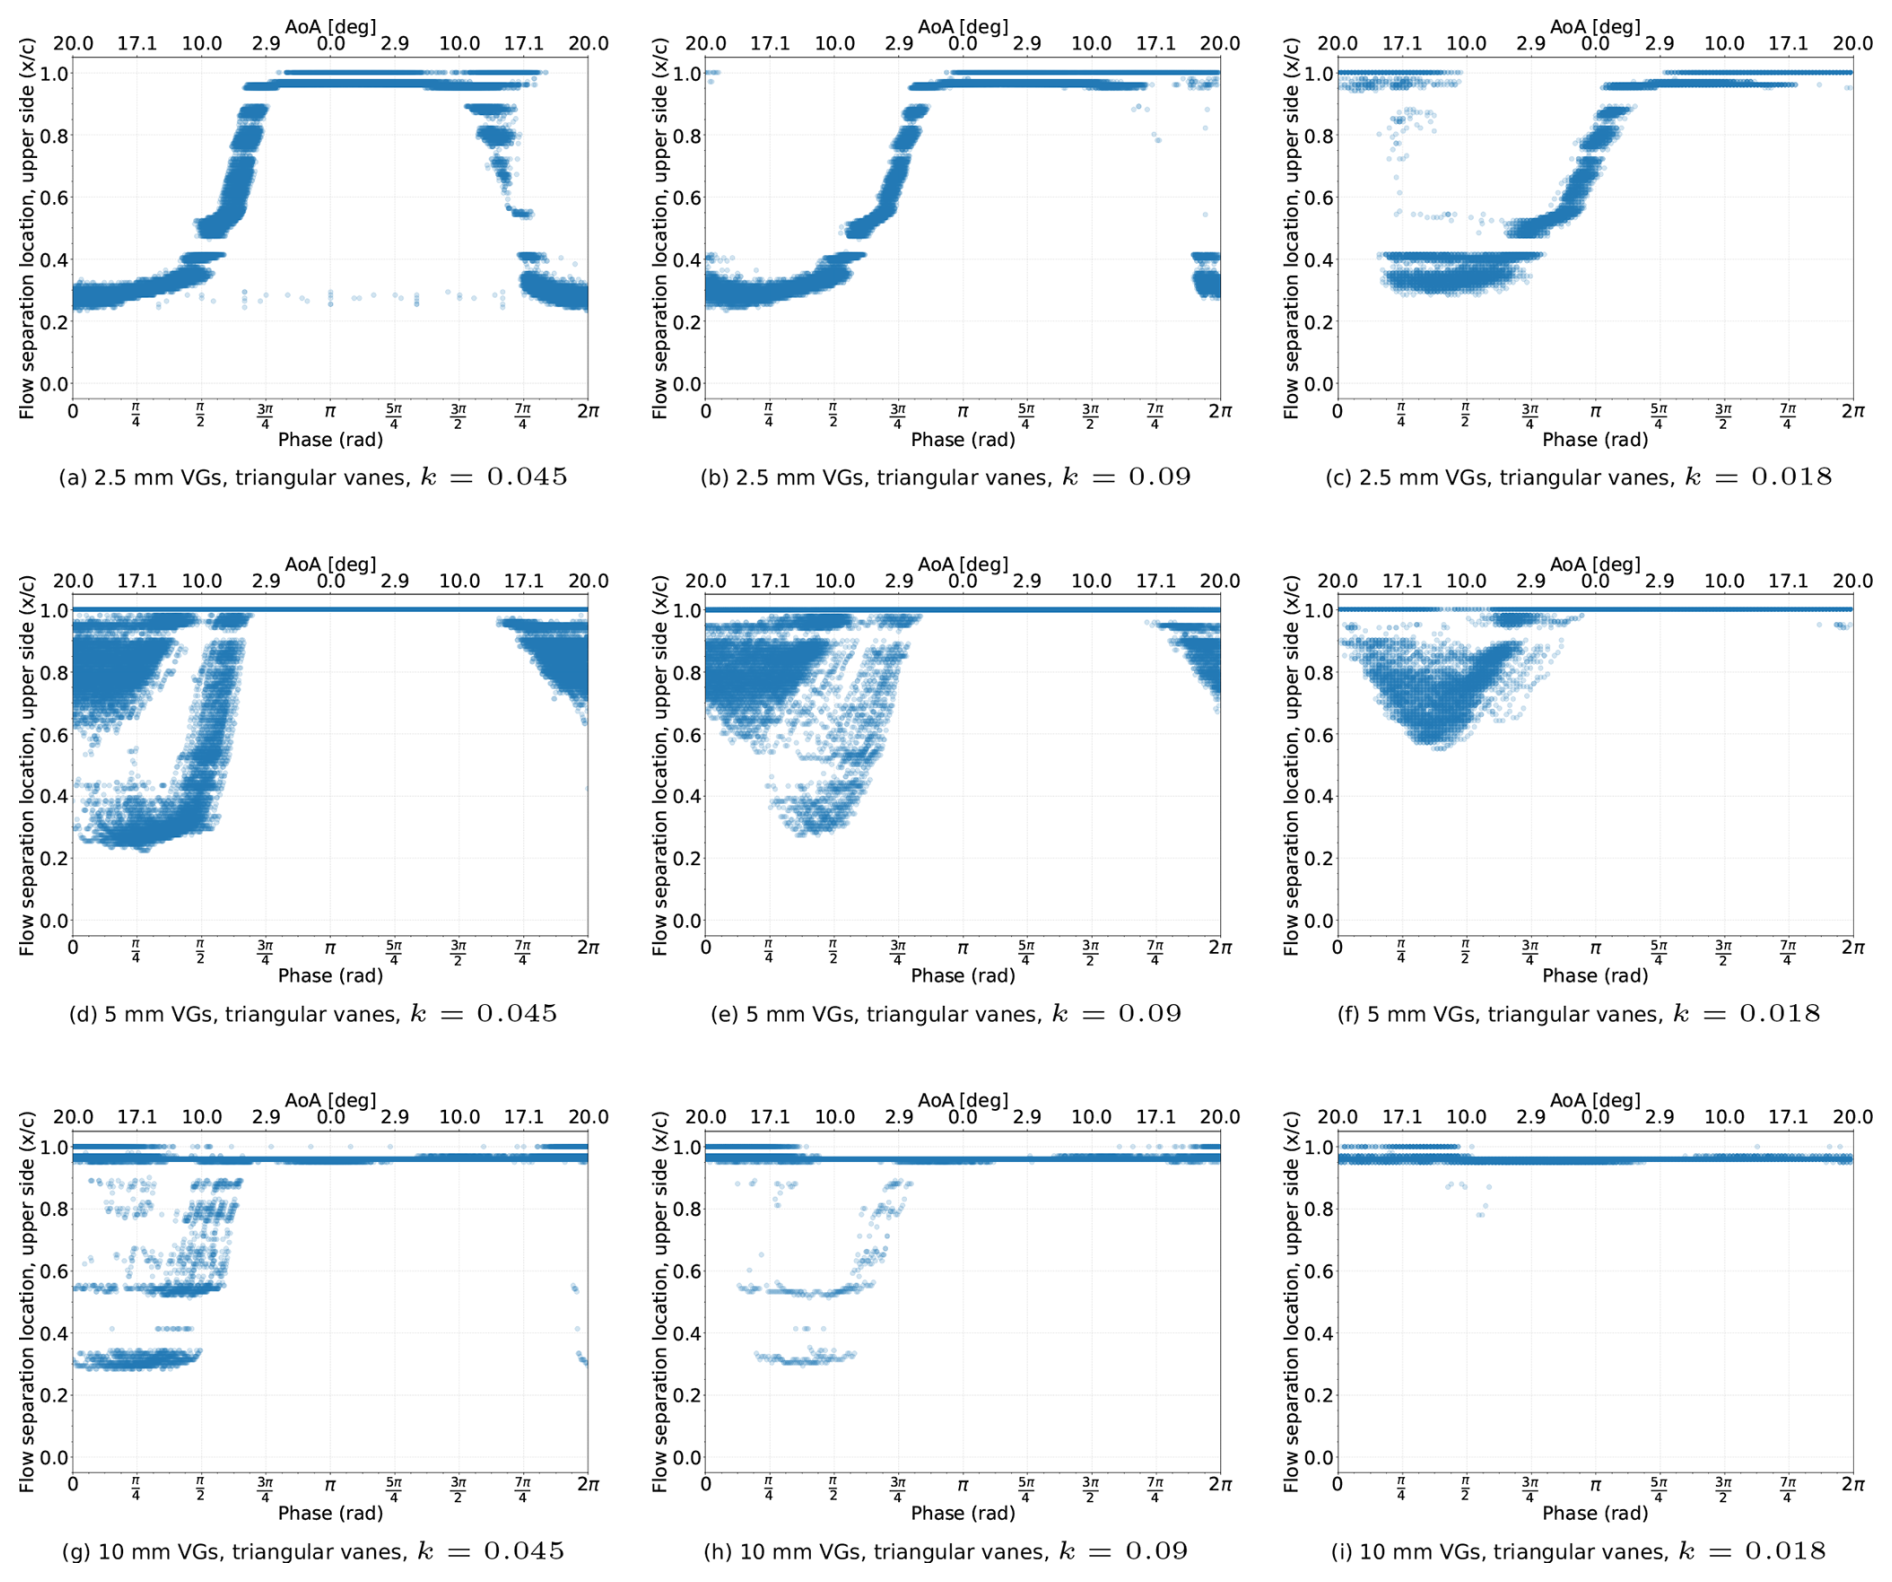
Figure 11Flow separation location on the suction side over 150 pitching cycles of 10±10° when the airfoil is equipped with triangular vane VGs of three different vane sizes.
The larger 5 mm VGs ( at AoA 0°) energize the boundary layer more than the 2.5 mm VGs and hence have a more pronounced impact on the unsteady aerodynamic behaviour. At the slowest pitching frequency k=0.045 (Fig. 11d), trailing-edge separation only starts at around a 15.5° angle of attack during the upstroke motion. The upstream progression of the separation front is gradual and not abrupt like the 2.5 mm VGs case. Flow separation only reaches around –0.6 before the airfoil starts pitching down, and stall does not occur (Fig. 10d). In the downstroke half of the pitching motion, the normal force coefficient polar and the separation front progression tend to follow two distinct paths – either an early reattachment path or a late reattachment path. In the early reattachment path, the separation front starts moving downstream as the airfoil pitches down. Reattachment is completed at around a 14–13° angle of attack. In the late reattachment path, the separation front first abruptly jumps upstream to and continues to move upstream to around before starting a downstream motion at a 10° angle of attack. Reattachment is faster in the late reattachment path, and complete reattachment occurs at an 8–5° angle of attack. At the higher pitching frequency of k=0.09 (Fig. 11e), trailing-edge separation starts later at around 17° upstroke. The separation front progresses upstream to at nearly the same rate as the k=0.045 case. This is a departure from the no-VG and 2.5 mm VG cases, where upstream progression of the separation front became more rapid and abrupt as the pitching frequency increased. The increased lag due to higher frequency means reattachment starts later than the k=0.045 case. Once again, the separation front and normal force coefficient polar follow either an early reattachment path or a late reattachment path during the downstroke motion. Complete reattachment occurs around a 16–14° angle of attack in the early reattachment path and around a 5–4° angle of attack in the late reattachment path. From the normal force coefficient polar (Fig. 10e), a fewer number of cycles follows the late reattachment path compared to the k=0.045 case. This is evident from the mean curve mostly following the early reattachment path for k=0.09, while the mean curve lies in between the early and late reattachment paths for k=0.045. For the highest frequency k=0.18, trailing-edge separation only starts when the airfoil has started to pitch down (Fig. 11f) and there are almost zero cycles with late reattachment (Fig. 10f). The existence of the late reattachment path and the sudden upstream movement of the separation front in some cycles indicates that the boundary layer energization provided by the 5 mm VGs is not effective enough. The boundary layer is susceptible to separation in the region around the VGs ( in this case), particularly at lower pitching frequencies where the flow has more time to react to the change in angle of attack.
With the largest 10 mm VGs ( at AoA 0°), trailing-edge separation is greatly reduced due to more effective energization of the boundary layer by the VGs. With k=0.045 (Fig. 11g), separation only appears in the downstroke phase and is limited to near the trailing edge. Late reattachment cycles where the separation front suddenly moves upstream are far fewer than the 5 mm VG case. The mean normal force coefficient curve closely follows the early reattachment path (Fig. 10g). The angle of attack for complete reattachment in the late reattachment path is around 8–5°, the same range as the 5 mm VGs. Trailing-edge separation nearly disappears at k=0.09, only observed in pitching cycles which follow the separated flow late reattachment path. At k=0.18, trailing-edge separation is completely prevented in all pitching cycles (Fig. 11i). In line with the trend observed for the 5 mm VGs, the number of cycles that enter the late reattachment state decreases with increasing reduced frequency, disappearing altogether at k=0.18 (Fig. 10g–i).
4.3 VG vane shape: triangular vs rectangular
For the steady case in Sect. 3, rectangular vane VGs proved better than triangular vanes of the same size because they delayed stall further with a higher maximum lift, while also generating lower drag leading to a higher lift-to-drag ratio than the triangular vanes. The rectangular vanes restricted the trailing edge flow separation from moving upstream of the VG location up to a much higher angle of attack, even after stall, than triangular vanes of the same size, indicating more effective energization of the airfoil boundary layer. For unsteady conditions, the normal force coefficient polar with rectangular vane VGs for the 10±10° pitching motion at various pitching frequencies is shown in Fig. 12, and the flow separation location over the suction side of the airfoil is shown in Fig. 13. The late reattachment cycles observed with the triangular vane VGs in the downstroke motion (Fig. 10g–i) are virtually absent with the rectangular vane VGs. Furthermore, the variation between cycles in the normal force coefficient polar is also slightly lower for rectangular vanes compared to triangular vanes. Both vane shapes prevent flow separation in the upstroke half of the pitching motion. Unlike triangular vanes where flow separation appears in the downstroke half (Fig. 11g–h), there is barely any separation observed with rectangular vanes. This reinforces the observation from the steady case that the rectangular vane VGs are more effective at keeping flow attached to the airfoil surface.
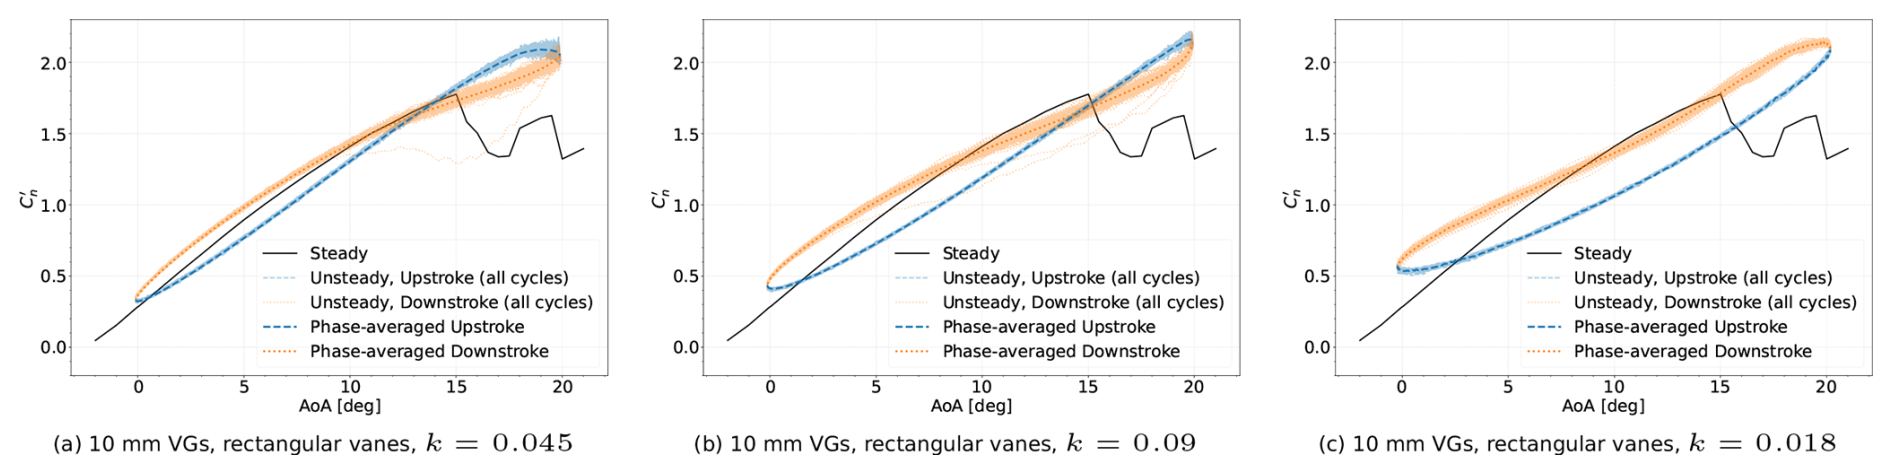
Figure 12Normal force coefficient polars when the airfoil equipped with triangular and rectangular VGs of the same vane size is pitching 10±10°.
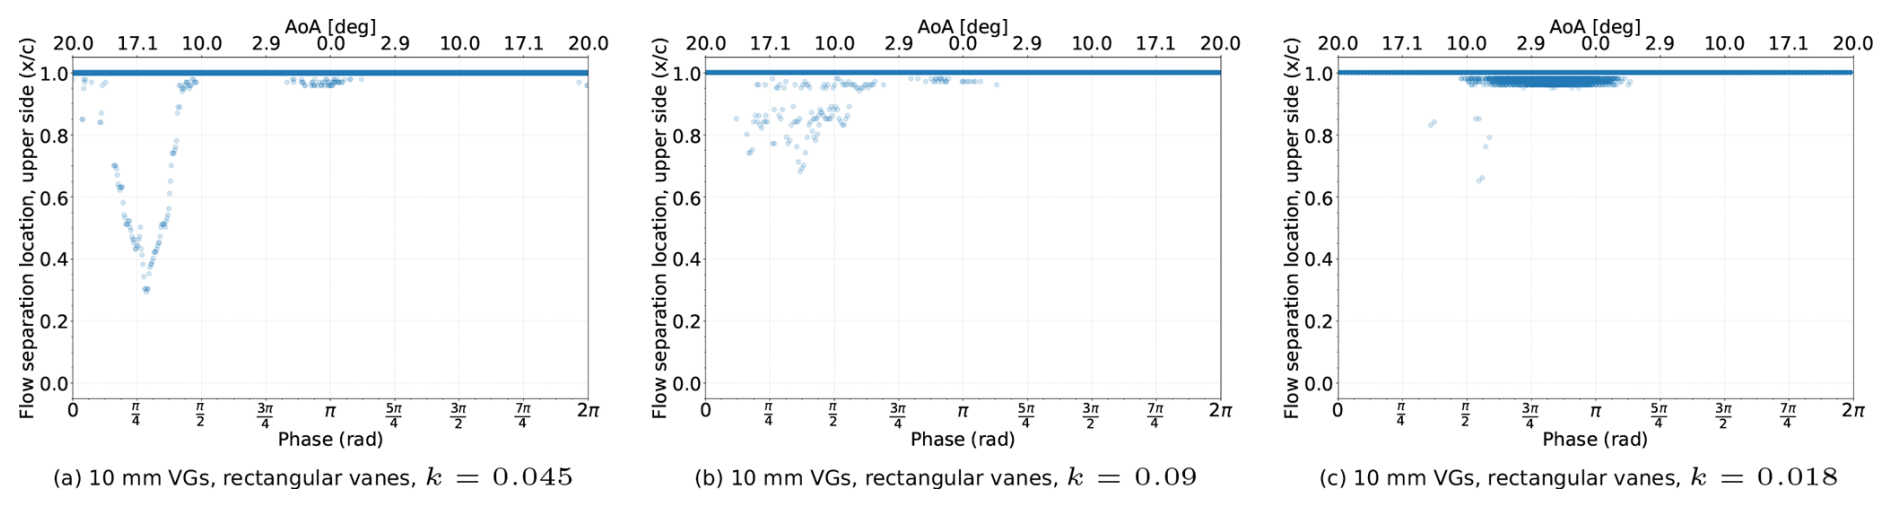
Figure 13Flow separation location on the suction side over 150 pitching cycles of 10±10° angle of attack when the airfoil is equipped with rectangular vane VGs.
The existence of different paths in the normal force coefficient polar and the trailing-edge separation front progression for the 5 and 10 mm triangular VGs points to the existence of cycle-to-cycle variations due to insufficient energization of the boundary layer by the VGs. This insufficient energization makes the flow around the airfoil susceptible to separation. Not only does this delay reattachment over the airfoil surface, lowering the aerodynamic performance, but the constant switching between attached and separated states also lowers the fatigue lifetime of the blade section due to the cycle-to-cycle variance. The number of cycles following the late reattachment path for each VG design is presented in Fig. 14. To quantify the number of late reattachment cycles, we calculate the percentage of cycles where flow over the airfoil is separated at at a 10° downstroke angle of attack. As we observed in Sects. 4.2 and 4.3, it is only in the late reattachment cases that the separation front goes beyond . A 10° downstroke lies between the reattachment angles of the early and late reattachment paths for all VGs, making it a suitable angle for this comparison. Note that the early and late reattachment paths are only observed for the 5 mm triangular, 10 mm triangular, and 10 mm rectangular VG cases. Thus, the number of separated cycles for these cases represents the cycles where the VGs fail to prevent upstream propagation of the separation front, resulting in the late reattachment path. For the no-VG and 2.5 mm triangular VG cases, the flow separation map and normal force coefficient polar follow only one path, and hence nearly 100 % of the cycles are separated. In Sect. 5.1 and 5.2, we discuss the implications of the number of cycles with late reattachment for different VG designs for unsteady flow separation and dynamic stall control.
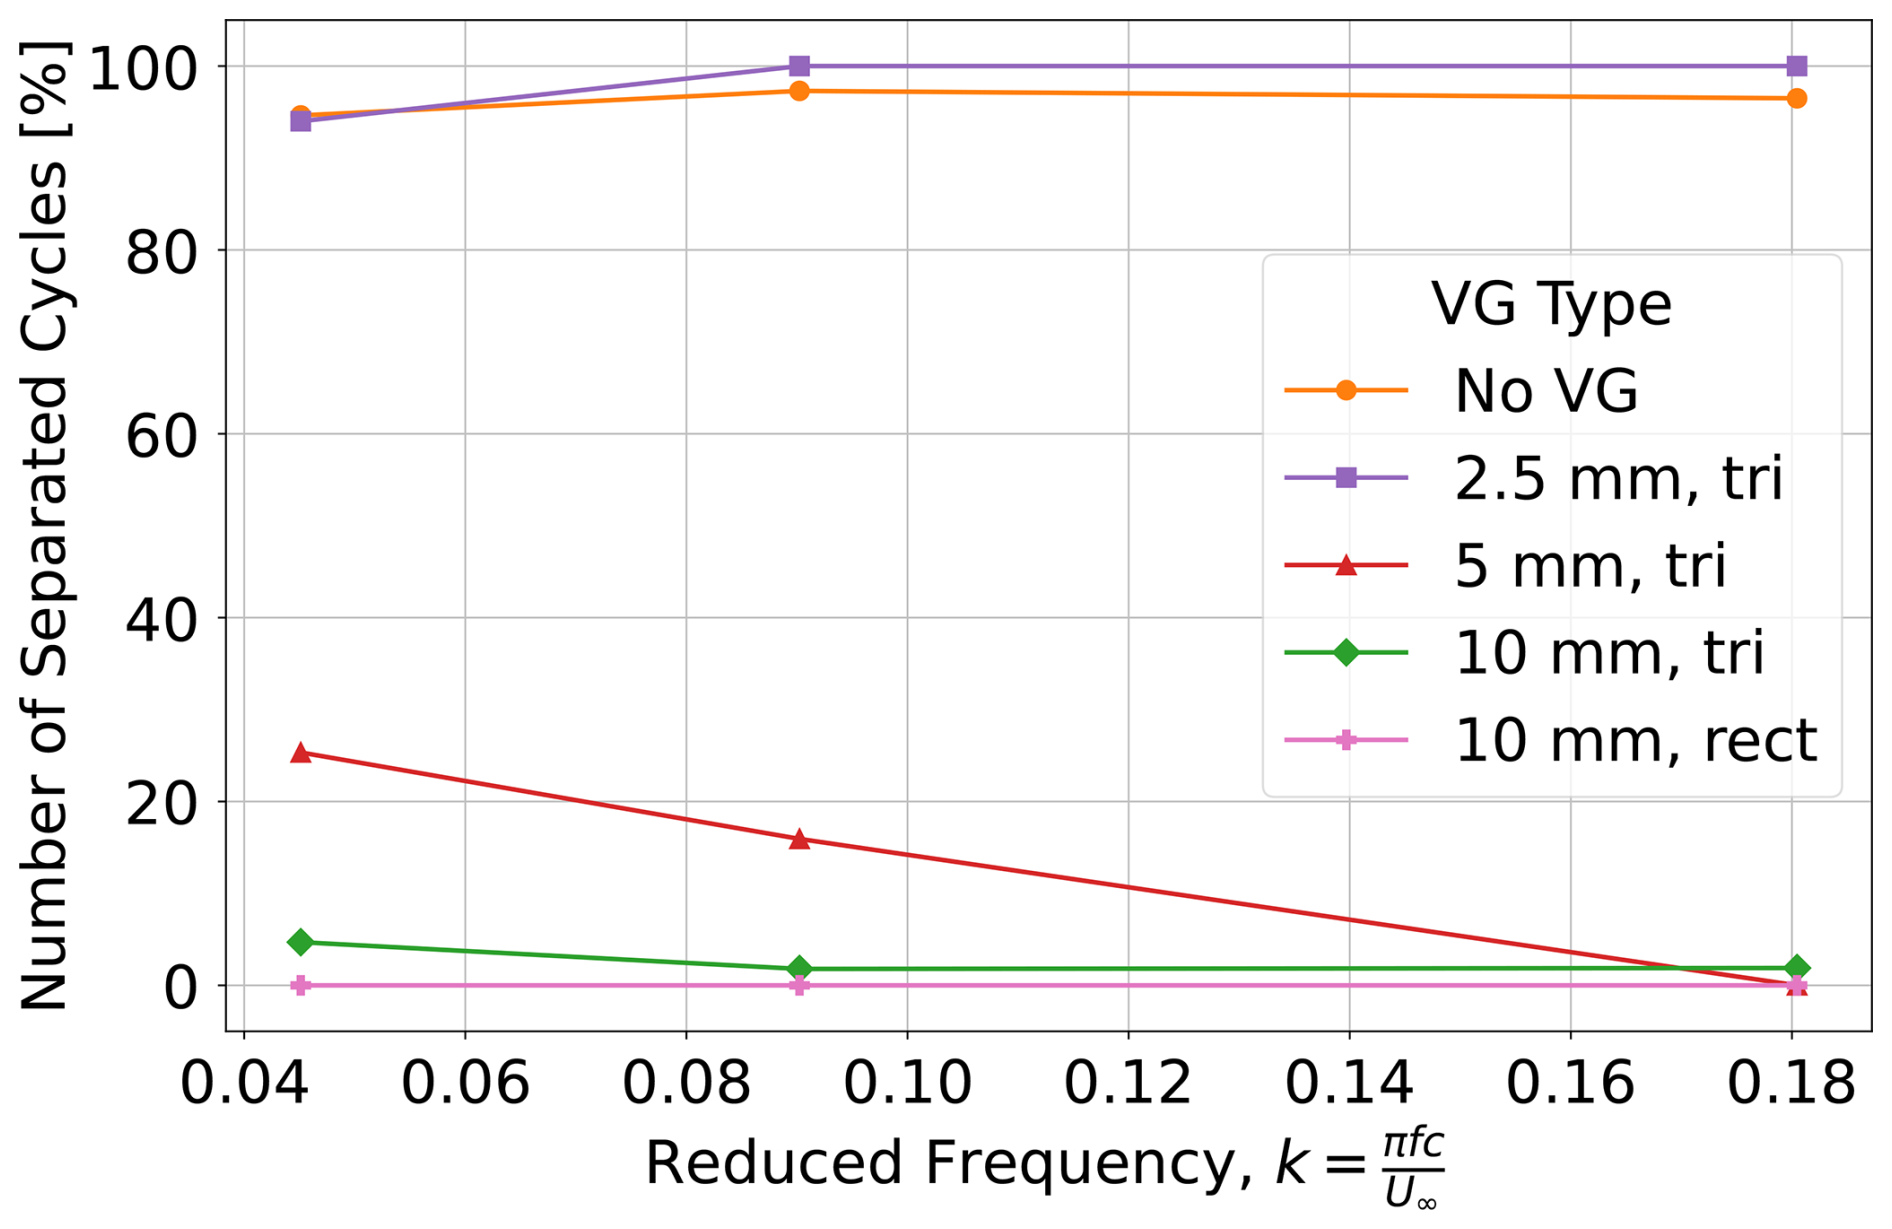
Figure 14Number of separated cycles at 10° downstroke when pitching 10±10° at all tested pitching frequencies with various VGs.
5.1 Vane size
In Sect. 4.2, we observed that the 2.5 mm VGs only energize the boundary layer enough to delay the onset of trailing-edge separation by a few degrees compared to the no-VG case but cannot restrict the upstream movement of the separation front after stall. The 5 mm VGs can both delay the onset of trailing-edge separation and restrict the upstream movement of the separation front to about a 60 % chord once it appears but not for 100 % of the pitching cycles. The boundary layer is still prone to separation, and the separation front can make a sudden upstream movement in some pitching cycles, settling at about a 20 % chord. This tendency to separate in some cycles creates early and late reattachment paths, increasing the variance of aerodynamic forces over pitching cycles. At the lowest frequency k=0.045 when the flow has the most time to react to the airfoil motion, the 5 mm VGs only restrict the separation front for 75 % of the pitching cycles, i.e. 25 % cycles follow the late reattachment path (Fig. 14). As the flow response time decreases with increasing pitching frequency, the airfoil boundary layer becomes less prone to separation. The separation front gets restricted for 85 % of the cycles at k=0.09 and 100 % of the cycles at k=0.18. The 10 mm VGs restrict the separation front for 95 % of the cycles at k=0.045 and nearly 100 % of the cycles at k=0.09 and k=0.18.
Based on the expected rate of change in angle of attack on the blade, the choice of VG vane height to prevent flow separation in unsteady conditions becomes more or less critical. For slower changes in angle of attack, VGs with larger vane heights would be prevent flow separation for a greater percentage of the pitching cycles. For faster changes in angle of attack, the choice of VG vane height is less critical because the flow around the airfoil is less prone to separation. Of the three vane heights tested in this work, choosing a suitable vane height based on steady criteria would have yielded the 5 mm VGs as the optimal choice because they optimize the stall delay and maximum lift increase with a lower drag increase. However, neither the 2.5 mm VGs nor the 5 mm VGs would be a suitable choice in unsteady conditions since they cannot sufficiently energize the boundary layer to prevent trailing-edge separation for a significant percentage of pitching cycles.
To aid wind turbine blade designers in selecting a suitable vane height for unsteady flow separation control, we use the boundary layer thickness at the VG location as a reference length scale to compare the vane heights. In Fig. 3, we calculated the steady boundary layer thickness at the VG location () using RFOIL. Note that the cycles of flow separation and reattachment due to the pitching motion can cause the instantaneous local boundary layer thickness and its evolution to vary slightly between pitching cycles and deviate from the steady value. Nevertheless, the ease of calculating the steady boundary layer thickness still makes it a useful reference length scale for preliminary VG vane height selection. A comparison of vane height with the boundary layer thickness also helps to translate the results of this study to other chordwise placement locations not tested in this study. Assuming that the incoming boundary layer upstream of the VG location does not change significantly between the no-VG and VG cases, we can divide the range of angles of attack covered in the 10±10° pitching motion into two regions based on whether the vane height is larger or smaller than the incoming boundary layer thickness. From Fig. 3, the 10 mm vanes are larger than the steady boundary layer thickness till 15° angle of attack, the 5 mm vanes until 1°, and the 2.5 mm vanes are always smaller than the boundary layer thickness within the calculated angle of attack range. The flow separation results show that the greater the percentage of the pitching cycle where the vane height is higher than the incoming boundary layer height, the greater the likelihood of preventing flow separation during the pitching cycle. If a wind turbine blade designer desires to keep flow attached in all pitching cycles during unsteady conditions with VGs, the vane height should be designed to be larger than the local steady boundary layer thickness for as much of the operating angle of attack range as possible.
5.2 Vane shape
As mentioned in Sect. 1, the choice of an optimal VG vane shape between triangular and rectangular vanes is still an open question in the literature. Some literature recommended the use of triangular vanes over rectangular vanes due to the expected higher drag of rectangular vanes in steady conditions. The steady results of this study in Sect. 3 showed that rectangular vane VGs energize the boundary layer more effectively than triangular vane VGs in steady conditions, delaying the onset of trailing-edge separation and slowing down the upstream progression of the separation front with increasing angle of attack. Rectangular vanes are both able to delay static stall to a higher angle of attack with a higher maximum lift, while also generating lower drag, leading to a higher lift-to-drag ratio than the triangular vanes.
The out-performance of rectangular vane VGs over triangular vane VGs continued in unsteady conditions. Rectangular vane VGs kept the flow attached for 100 % of the cycles at all the tested pitching frequencies, virtually eliminating the likelihood of separated flow during the 10±10° pitching motion. The near absence of flow separation with rectangular vanes throughout the pitching cycle further reinforces the inference from the steady results that rectangular vanes energize the boundary layer more effectively than triangular vanes of the same size. Combining the results from the VG vane height and vane shape comparisons, for a wind turbine blade designer aiming to prevent flow separation in unsteady conditions, rectangular vane VGs with height larger than the local boundary layer thickness would be the optimal choice among the VG designs described in this work.
One of the central recommendations of this paper is that VGs selected for unsteady flow control during pitching motions should have a vane height larger than the local boundary layer thickness for as much of the pitching angle of attack range as possible. The reference used for this is the steady no-VG boundary layer thickness at the VG chordwise location calculated using RFOIL. While RFOIL calculations come with their own uncertainties quantified in the literature (van Rooij, 1996; Sahoo et al., 2024a), using the steady no-VG boundary layer thickness as a reference for preliminary VG vane height selection also comes with limitations. During pitching motions, the flow around the airfoil depends on various factors like the phase of motion (upstroke or downstroke) and the pitching frequency which leads to how the flow responds to the motion. Cycles of flow separation and reattachment due to the pitching motion can cause the instantaneous boundary layer thickness and its unsteady characteristics to deviate from the steady characteristics calculated from RFOIL. This can cause the exact range of angles of attack in the pitching cycle where the vane height is larger than the local boundary layer thickness and can deviate from the range presented in this work. In an attempt to provide practical VG design recommendations while overcoming this limitation, our analysis is statistical in nature. We base our comparisons of VG vane height and shape on their impact on the percentage of separated and attached flow cycles. The greater the range of angles of attack in the pitching cycle where the vane height is larger than the local boundary layer thickness, the greater the likelihood of preventing flow separation during the pitching cycle. Overall, the recommendation of this paper is to use larger rectangular VGs considering the need for unsteady flow separation control, even when smaller triangular VGs may prove sufficient for steady flow control.
Some other uncertainties in the data arise from the measurement setup itself. Particularly for the unsteady results, we base our analysis on quasi-2D chordwise pressure coefficient distributions. The angled placement of the pressure ports (described in Sect. 2.4), which covers the spanwise length of at least one VG pair for every VG design tested, can average over the spanwise periodic flow variations caused by the vortices from the counter-rotating VGs. However, unsteady trailing-edge separation is 3D and the spanwise variation in flow due to separation cannot be covered by the pressure ports. This can lead to some uncertainty in predicting the exact chordwise location of the separation front from the measured pressure data. The relatively low aspect ratio of the wing section means that the boundary layer growing on the top wall of the wind tunnel can also introduce spanwise variation in the flow, affecting the pressure measurements. These sources of uncertainty mean that the conclusions of this work should rather be interpreted in the context of the general trends in the flow separation behaviour and aerodynamic polars in presence of different VG designs.
Past literature and industrial practice on designing vortex generators for wind turbine blades have assumed that the optimal VG designs for steady conditions will also perform optimally in unsteady conditions. This paper presents arguments against that hypothesis by showing that VGs which prevent steady flow separation can still allow unsteady flow separation in a significant portion of the pitching cycles. Variations in the onset and progression of separation lead to significant variations in aerodynamic loads between cycles, which can reduce the fatigue lifetime of the blade section and detrimentally impact the aerodynamic damping on structural vibrations. To demonstrate this, we use wind tunnel measurements in the TU Delft Low Speed Tunnel on a DU-97-W-300 airfoil section, a typical representative in terms of aerodynamic performance of midboard and inboard sections of modern wind turbines, equipped with various VG array designs. The airfoil is subjected to pitching motions that pitch the airfoil above and below the static stall angle of attack in the presence of VGs with various pitching frequencies for 150 pitching cycles. A transition to turbulence is fixed using zigzag tape close to the leading edge to simulate the effect of leading-edge erosion often experienced in wind turbine blades where VGs are used. The forces on the airfoil are calculated using surface pressure measurements (and wake rake measurements for the steady cases). The VGs were fixed at a 30 % chordwise location to simplify the test matrix, also owing to the fact that a 30 % chord has been shown to be the most effective VG location for this airfoil. The results of VG design selection are contextualized with local steady boundary layer development with increasing angle of attack to translate the results to other VG placement locations not covered by this study. Primarily, the VG vane size and vane shape have been varied to investigate their impact on steady and unsteady flow separation control and the onset of static and dynamic stall.
In steady conditions, triangular vane VGs followed the expected trend from the literature, where both the angle of attack of trailing-edge separation onset and the added drag simultaneously increase with vane height, resulting in the selection of an optimal vane height to balance the trade-off between delayed stall and a high lift-to-drag ratio. In this study, the VGs with vane height approximately equal to the local boundary layer thickness at 0° angle of attack (i.e. the 5 mm vanes) provided this optimal balance. However, when considering both vane height and vane shape, rectangular vane VGs whose vane height is larger than the local boundary layer thickness at a 0° angle of attack (i.e. the 10 mm vanes) outperformed all other VG designs by both delaying trailing-edge separation onset (and hence static stall too) and producing a smaller drag penalty than even the smallest triangular VGs tested. This is contrary to recommendations from literature to opt for low-profile triangular VGs, and indicates that rectangular vane VGs overall energize the boundary layer more effectively than triangular vane VGs.
When pitching, only VGs whose vane height exceeds the local boundary layer thickness for a significant portion of the pitching cycle (i.e. the 10 mm vanes in this study) energized the boundary layer enough to significantly delay the onset of trailing-edge flow separation and prevent upstream propagation of the separation front (thus preventing dynamic stall) for more than 90 % of the pitching cycles at all pitching frequencies. The smaller 5 mm vanes, whose boundary layer energization was considered sufficient in steady conditions to optimally balance static stall delay with lift-to-drag ratio, could only prevent flow separation for 75 % of the cycles at the lowest pitching frequency, resulting in two distinct flow separation maps and two distinct paths of early and late reattachment in the normal force coefficient polars. For 25 % of the pitching cycles, flow separated over a significant portion of the airfoil surface to cause a large drop in the normal force coefficient. These large variations between cycles can detrimentally impact the aerodynamic damping on structural vibrations and reduce the fatigue lifetime of the blade section. The overall results show that the greater the chance that the vane height exceeds the local boundary layer thickness during the oscillation cycle, the more effective the boundary layer energization and the more likely that trailing-edge separation and large variations in aerodynamic loads can be prevented. Rectangular vanes proved the best at preventing trailing-edge separation at all pitching frequencies and were the only VG design to prevent flow separation for all pitching cycles, regardless of pitching frequency. This indicates that rectangular vanes overall energize the boundary layer more effectively than triangular vane VGs. Finally, motions of faster pitching frequencies were less sensitive to the choice of VG vane size, since the larger lag between flow and airfoil motion ensured a lower tendency for flow separation and a higher tendency for faster reattachment if flow does separate.
Overall, the conclusions of this paper highlight the importance of designing VGs that keep unsteady flow conditions under consideration. The importance of longer measurement durations spanning numerous pitching cycles to capture the significant variations between cycles is also emphasized. The findings of this paper can serve as a basis for choosing more optimal VG designs to prevent unsteady flow separation for wind turbine blades facing dynamic stall. The presented results also motivate the need for further research of the interaction of streamwise vortices generated by VGs of different geometries with the trailing-edge separation front and the dynamic stall vortex through flow field measurements that can resolve these complex interactions. Finally, the dataset associated with this paper and the larger experiment are also intended to aid with the validation and development of numerical models for airfoils with VGs undergoing dynamic stall. A deeper understanding of the impact of VGs on the unsteady aerodynamic characteristics of wind turbine blade sections and the underlying flow interactions will help to create more accurate numerical models to aid in the optimal design of VGs for modern wind turbines. This will lead to the smarter deployment of these flow control devices for improved performance and lifetime of wind turbine blades.
The flow separation location is determined by analysing the surface pressure coefficient (Cp) distribution along the airfoil chord. As mentioned in Sect. 2.5, flow is assumed to have separated when the pressure coefficient plateaus over the airfoil surface (), and the flow separation location is determined to be the point where this plateau begins. An example of this calculation is shown in Fig. A1 for both the steady and unsteady cases at an angle of attack of 14° when the airfoil is equipped with the 5 mm VGs. Both cases are at a chordwise Reynolds number of 1 million, and transition to turbulence is fixed with zigzag tape at on both sides of the airfoil. For the unsteady case, the pitching motion is 10±10° at a frequency of 0.5 Hz, corresponding to a reduced frequency of k=0.045. The steady flow separation location is . As discussed in Sect. 4.2, the unsteady downstroke cases show two different flow separation locations – either at around –0.4 or around – depending on whether the flow around the airfoil takes the early reattachment or late reattachment path, respectively. Note that a separation location of implies that the flow is fully attached over the airfoil surface.
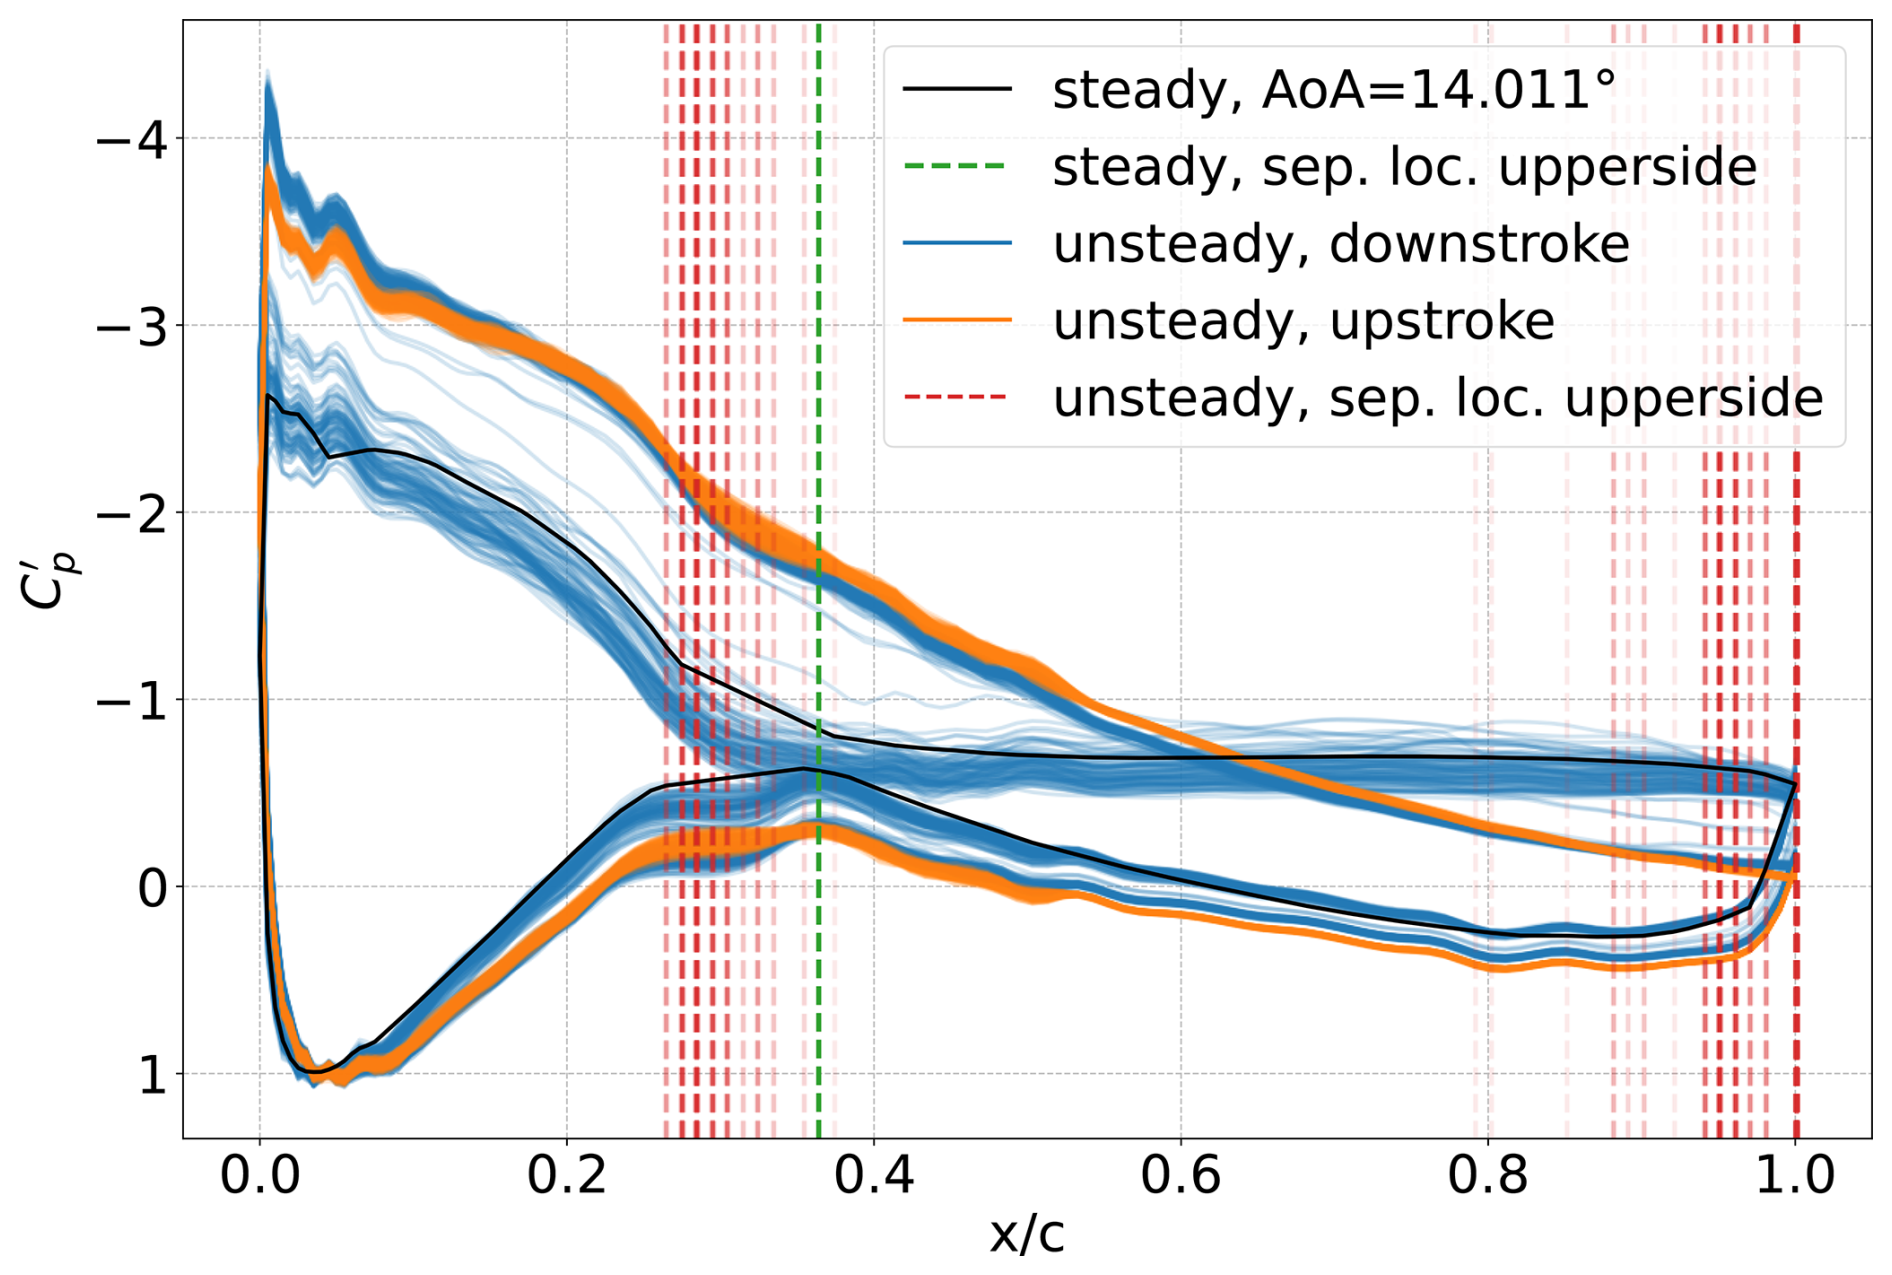
Figure A1Example of determining the flow separation location from the surface pressure coefficient distribution for both steady and unsteady cases at α=14°, Rec=1 million with 5 mm VGs, and transition fixed at with zigzag tape.
The data supporting this paper's findings are available in the 4TU.ResearchData repository at https://doi.org/10.4121/374c2baa-aca1-487e-8463-6ef167569be7 (Sahoo et al., 2026).
AS: Conceptualization, methodology, formal analysis, and writing (original draft). WY: writing (review and editing) and supervision. DR: Writing (review and editing) and supervision.
The contact author has declared that none of the authors has any competing interests.
Publisher's note: Copernicus Publications remains neutral with regard to jurisdictional claims made in the text, published maps, institutional affiliations, or any other geographical representation in this paper. The authors bear the ultimate responsibility for providing appropriate place names. Views expressed in the text are those of the authors and do not necessarily reflect the views of the publisher.
We would like to thank Stefan Bernardy and Frits Donker Duyvis (TU Delft AE faculty) for help with preparing the airfoil model and vortex generators. A part of this work was carried out in conjunction with the VoGUe project funded by a Privaat-Publieke Samenwerkingen-toeslag (PPS toeslag) granted by the Netherlands Enterprise Agency (RVO). Partners involved in the VoGUe project are TNO, TU Delft, and Vestas Wind Systems A/S.
This paper was edited by Oguz Uzol and reviewed by two anonymous referees.
Allen, H. J. and Vincenti, W. G.: Wall interference in a two-dimensional-flow wind tunnel, with consideration of the effect of compressibility, Tech. Rep. 782, NACA, 1944. a
Ashill, P. R., Fulker, J. L., and Hackett, K. C.: A review of recent developments in flow control, Aeronaut. J., 109, 205–232, https://doi.org/10.1017/S0001924000005200, 2005. a, b
Bak, C., Zahle, F., Bitsche, R., Kim, T., Yde, A., Henriksen, L. C., Hansen, M. H., Blasques, J. P. A. A., Gaunaa, M., and Natarajan, A.: The DTU 10-MW reference wind turbine, in: Danish Wind Power Research 2013, DTU Wind Energy Report-I-0092, 2013. a
Bak, C., Skrzypiński, W., Gaunaa, M., Villanueva, H., Brønnum, N. F., and Kruse, E. K.: Full scale wind turbine test of vortex generators mounted on the entire blade, J. Phys. Conf. Ser., 753, 022001, https://doi.org/10.1088/1742-6596/753/2/022001, 2016. a
Baldacchino, D., Ferreira, C., Tavernier, D. D., Timmer, W., and van Bussel, G. J. W.: Experimental parameter study for passive vortex generators on a 30% thick airfoil, Wind Energy, 21, 745–765, https://doi.org/10.1002/we.2191, 2018. a, b, c, d, e, f, g
Bergh, H. and Tijdeman, H.: Theoretical and experimental results for the dynamic response of pressure measuring systems, Tech. rep., NLR-TRF 328, Nationaal Lucht en Ruimtevaartlaboratorium, 1965. a
Boerrigter, H. L.: PreMeSys: A Simulation Program to Determine the Frequency and Time Response of a Pressure Measurement System, Technical memorandum, Von Karman Institute for Fluid Dynamics, 1996. a
Butterfield, C. P.: Three-dimensional airfoil performance measurements on a rotating wing, Tech. rep., NREL/TP-217-3505, 1989. a
Butterfield, C. P. and Nelsen, E. N.: Aerodynamic testing of a rotating wind turbine blade, Tech. rep., SERI/TP-257-3490, 1989. a
Butterfield, C. P., Jenks, M. D., Simms, D. A., and Musial, W. P.: Aerodynamic pressure measurements on a rotating wind turbine blade, Tech. rep., SERI/TP-257-3695, 1990. a
Butterfield, C. P., Simms, D., and Huyer, S. A.: Dynamic stall on wind turbine blades, Tech. rep., NREL/TP-257-4510, 1992. a
Carr, L. W.: Progress in analysis and prediction of dynamic stall, J. Aircraft, 25, 6–17, https://doi.org/10.2514/3.45534, 1988. a, b, c
Choudhry, A., Leknys, R., Arjomandi, M., and Kelso, R.: An insight into the dynamic stall lift characteristics, Exp. Therm. Fluid Sci., 58, 188–208, https://doi.org/10.1016/j.expthermflusci.2014.07.006, 2014. a
Choudhry, A., Arjomandi, M., and Kelso, R.: Methods to control dynamic stall for wind turbine applications, Renew. Energ., 86, 26–37, https://doi.org/10.1016/j.renene.2015.07.097, 2016. a
Corke, T. C. and Thomas, F. O.: Dynamic Stall in Pitching Airfoils: Aerodynamic Damping and Compressibility Effects, Annu. Rev. Fluid Mech., 47, 479–505, https://doi.org/10.1146/annurev-fluid-010814-013632, 2015. a
De Tavernier, D., Ferreira, C., Viré, A., LeBlanc, B., and Bernardy, S.: Controlling dynamic stall using vortex generators on a wind turbine airfoil, Renew. Energ., 172, 1194–1211, https://doi.org/10.1016/j.renene.2021.03.019, 2021. a
Doosttalab, M., Ferreira, C. S., Ragni, D., Yu, W., and Rautmann, C.: Vortex generator effects on dynamic stall of thick airfoils, Renew. Energ., 255, 123746, https://doi.org/10.1016/j.renene.2025.123746, 2025. a
Fouatih, O. M., Medale, M., Imine, O., and Imine, B.: Design optimization of the aerodynamic passive flow control on NACA 4415 airfoil using vortex generators, https://doi.org/10.1016/j.euromechflu.2015.11.006, 2016. a, b
Gaertner, E., Rinker, J., Sethuraman, L., Zahle, F., Anderson, B., Barter, G., Abbas, N., Meng, F., Bortolotti, P., Skrzypinski, W., Scott, G., Feil, R., Bredmose, H., Dykes, K., Shields, M., Allen, C., and Viselli, A.: IEA Wind TCP Task 37: Definition of the IEA 15-Megawatt Offshore Reference Wind Turbine, Tech. rep., National Renewable Energy Laboratory (NREL), Golden, CO (United States), https://doi.org/10.2172/1603478, 2020. a, b
Garner, H. C., Rogers, E. W. E., Acum, W. E. A., and Maskell, E. C.: Subsonic Wind Tunnel Wall Corrections, Tech. rep., Advisory Group for Aerospace Research and Development (AGARD), https://doi.org/10.14339/AGARD-AG-109, 1966. a
Godard, G. and Stanislas, M.: Control of a decelerating boundary layer. Part 1: Optimization of passive vortex generators, Aerosp. Sci. Technol., 10, 181–191, https://doi.org/10.1016/J.AST.2005.11.007, 2006. a, b, c
Griffin, D. A.: Investigation of Vortex Generators for Augmentation of Wind Turbine Power Performance, National Renewable Energy Laboratory (NREL), https://doi.org/10.2172/414367, 1996. a
Gupta, R. and Ansell, P. J.: Unsteady Flow Physics of Airfoil Dynamic Stall, AIAA J., 57, 165–175, https://doi.org/10.2514/1.J057257, 2019. a
Gutiérrez, R., Llórente, E., Echeverría, F., and Ragni, D.: Wind tunnel tests for vortex generators mitigating leading-edge roughness on a 30% thick airfoil, J. Phys. Conf. Ser., 1618, 52058, https://doi.org/10.1088/1742-6596/1618/5/052058, 2020. a
IRENA: Future of wind: Deployment, investment, technology, grid integration and socio-economic aspects (A Global Energy Transformation paper), Tech. rep., International Renewable Energy Agency, Abu Dhabi, ISBN 978-92-9260-155-3, 2019. a
Jones, B.: The Measurement of Profile Drag by the Pitot-Traverse Method, Tech. rep., The Cambridge University Aeronautics Laboratory (R&M No. 1688), 1936. a
Leishman, J. G. and Beddoes, T. S.: A Semi-Empirical Model for Dynamic Stall, J. Am. Helicopter Soc., 34, 3–17, https://doi.org/10.4050/JAHS.34.3.3, 1989. a
Li, S., Zhang, L., Xu, J., Yang, K., Song, J., and Guo, G.: Experimental investigation of a pitch-oscillating wind turbine airfoil with vortex generators, J. Renew. Sustain. Ener., 12, 63304, https://doi.org/10.1063/5.0013300, 2020. a
Lin, J. C.: Review of research on low-profile vortex generators to control boundary-layer separation, Prog. Aerosp. Sci., 38, 389–420, https://doi.org/10.1016/S0376-0421(02)00010-6, 2002. a, b, c
Manolesos, M., Celik, Y., Ramsay, H., Karande, R., Wood, B., Dinwoodie, I., Masters, I., Harrold, M., and Papadakis, G.: Performance improvement of a Vestas V52 850 kW wind turbine by retrofitting passive flow control devices, J. Phys. Conf. Ser., 2767, 022027, https://doi.org/10.1088/1742-6596/2767/2/022027, 2024. a
Martínez-Filgueira, P., Fernandez-Gamiz, U., Zulueta, E., Errasti, I., and Fernandez-Gauna, B.: Parametric study of low-profile vortex generators, International Journal of Hydrogen Energy, 42, 17700–17712, https://doi.org/10.1016/j.ijhydene.2017.03.102, 2017. a
McAlister, K. W., Pucci, S. L., McCroskey, W. J., and Carr, L. W.: An Experimental Study of Dynamic Stall on Advanced Airfoil Sections, Pressure and Force Data, vol. 2, Tech. rep., NASA Technical Memorandum 84245, 1982. a
McCroskey, W. J.: Recent developments in rotor blade stall, in: AGARD Conference Proceedings no. 111 Aerodynamics of Rotary Wings, vol. 111, pp. 15–1 to 15–13, 1972. a
McCroskey, W. J.: The Phenomenon of Dynamic Stall, Tech. rep., NASA-TM-81264, 1981. a, b
McCroskey, W. J. and Fisher, R.: Dynamic stall of airfoils and helicopter rotors, AGARD R, 595, 1–7, 1972. a
McCroskey, W. J., McAlister, K. W., Carr, L. W., Pucci, S. L., Lambert, O., and Indergrand, R. F.: Dynamic Stall on Advanced Airfoil Sections, J. Am Helicopter Soc., 26, 40–50, https://doi.org/10.4050/JAHS.26.3.40, 1981. a, b, c
McKenna, R., Ostman, P., and Fichtner, W.: Key challenges and prospects for large wind turbines, Renew. Sust. Energ. Rev., 53, 1212–1221, https://doi.org/10.1016/j.rser.2015.09.080, 2016. a
Mueller-Vahl, H., Pechlivanoglou, G., Nayeri, C. N., and Paschereit, C. O.: Vortex generators for wind turbine blades: A combined wind tunnel and wind turbine parametric study, Proceedings of the ASME Turbo Expo, 6, 899–914, https://doi.org/10.1115/GT2012-69197, 2012. a
Rasmussen, F., Petersen, J., and Madsen, H.: Dynamic stall and aerodynamic damping, in: 1998 ASME Wind Energy Symposium, 44–51, American Institute of Aeronautics and Astronautics, Reston, Virigina, https://doi.org/10.2514/6.1998-24, 1998. a
Ravishankara, A. K., Bakhmet, I., and Özdemir, H.: Estimation of roughness effects on wind turbine blades with vortex generators, J. Phys. Conf. Ser., 1618, 52031, https://doi.org/10.1088/1742-6596/1618/5/052031, 2020. a
Sahoo, A., Ferreira, C. S., Ravishankara, A. K., Schepers, G., and Yu, W.: Validation of an engineering model for vortex generators in a viscous-inviscid interaction method for airfoil analysis, J. Phys. Conf. Ser., 2647, 112012, https://doi.org/10.1088/1742-6596/2647/11/112012, 2024a. a
Sahoo, A., Ferreira, C. S., and Yu, W.: Assessing the impact of vortex generators on the dynamic stall behaviour of a thick airfoil, J. Phys. Conf. Ser., 2767, 22019, https://doi.org/10.1088/1742-6596/2767/2/022019, IOP Publishing, 2024b. a, b, c, d
Sahoo, A., Yu, W., Ragni, D., and Simao Ferreira, C.: Data supporting the publication: “Vortex generator design for unsteady flow separation control and dynamic stall suppression on pitching thick airfoils”, Version 1, 4TU.ResearchData [data set], https://doi.org/10.4121/374c2baa-aca1-487e-8463-6ef167569be7, 2026. a
Schepers, J., Boorsma, K., Sørensen, N., Voutsinas, Sieros, G., Rahimi, H., Heisselmann, H., Jost, E., Lutz, T., Maeder, T., Gonzalez, A., Ferreira, C., Stoevesandt, B., Barakos, G., Lampropoulos, N., Croce, A., and Madsen, J.: Final results from the EU project AVATAR: Aerodynamic modelling of 10 MW wind turbines, J. Phys. Conf. Ser., 1037, 022013, https://doi.org/10.1088/1742-6596/1037/2/022013, 2018. a
Shipley, D. E., Miller, M. S., Robinson, M. C., Luttges, M. W., and Simms, D. A.: Evidence that Aerodynamic Effects, including Dynamic Stall, Dictate HAWT Structure Loads and Power Generation in Highly Transient Time Frames, in: Windpower, NREL/TP-441-7080, May 9–13, Minneapolis, Minnesota, 1994. a
Shipley, D. E., Miller, M. S., and Robinson, M. C.: Dynamic stall occurrence on a horizontal axis wind turbine blade, Tech. rep., NREL/TP-442-6912, 1995. a, b
Skrzypiński, W., Gaunaa, M., and Bak, C.: The effect of mounting vortex generators on the DTU 10MW reference wind turbine blade, J. Phys. Conf. Ser., 524, https://doi.org/10.1088/1742-6596/524/1/012034, 2014. a
Skrzypiński, W., Gaunaa, M., Bak, C., Junker, B., Brønnum, N. B., and Kruse, E. K.: Increase in the annual energy production due to a retrofit of vortex generators on blades, Wind Energy, 23, 617–626, https://doi.org/10.1002/we.2446, 2020. a
Timmer, W. A.: Wind Tunnel Wall Corrections for Two-Dimensional Testing up to Large Angles of Attack, in: Handbook of Wind Energy Aerodynamics, Springer International Publishing, Cham, 1–29, https://doi.org/10.1007/978-3-030-05455-7_27-1, 2021. a
Timmer, W. A. and van Rooij, R. P. J. O. M.: Summary of the Delft University Wind Turbine Dedicated Airfoils, Journal of Solar Energy Engineering, 125, 488–496, https://doi.org/10.1115/1.1626129, 2003. a, b
van Rooij, R.: Modification of the boundary layer calculation in RFOIL for improved airfoil stall prediction, Tech. rep., Institute for Wind Energy IWE, Department of Civil Engineering, Delft University of Technology, Delft (Netherlands), IW-96087R, 1996. a, b, c
Wei, B., Gao, Y., and Hu, S.: Experimental Study on Multiobjective Flow Control of Dynamic Stalls Using a Vortex Generator, J. Aerospace Eng., 36, 4023083, https://doi.org/10.1061/JAEEEZ.ASENG-4989, 2023. a
Zahle, F., Barlas, T., Lønbæk, K., Bortolotti, P., Zalkind, D., Wang, L., Labuschagne, C., Sethuraman, L., and Barter, G.: Definition of the IEA Wind 22-Megawatt Offshore Reference Wind Turbine, Tech. rep., https://doi.org/10.11581/DTU.00000317, 2024. a, b
Zhao, Z., Jiang, R., Feng, J., Liu, H., Wang, T., Shen, W., Chen, M., Wang, D., and Liu, Y.: Researches on vortex generators applied to wind turbines: A review, Ocean Eng., 253, 111266, https://doi.org/10.1016/j.oceaneng.2022.111266, 2022. a
Zhen, T. K., Zubair, M., and Ahmad, K. A.: Experimental and Numerical Investigation of the Effects of Passive Vortex Generators on Aludra UAV Performance, Chinese J. Aeronaut., 24, 577–583, https://doi.org/10.1016/S1000-9361(11)60067-8, 2011. a
Zhu, C., Wang, T., Chen, J., and Zhong, W.: Effect of Single-Row and Double-Row Passive Vortex Generators on the Deep Dynamic Stall of a Wind Turbine Airfoil, Energies, 13, 2535, https://doi.org/10.3390/en13102535, 2020. a, b
Zhu, C., Qiu, Y., Feng, Y., Wang, T., and Li, H.: Combined effect of passive vortex generators and leading-edge roughness on dynamic stall of the wind turbine airfoil, Energ. Convers. Manage., 251, 115015, https://doi.org/10.1016/j.enconman.2021.115015, 2022. a, b
- Abstract
- Introduction
- Experiment description
- Impact of VGs on steady behaviour
- Dynamic stall and VG effectiveness
- Outlook on VG design for unsteady flow separation control
- Sources of uncertainty
- Conclusions
- Appendix A: Determining the flow separation location
- Data availability
- Author contributions
- Competing interests
- Disclaimer
- Acknowledgements
- Review statement
- References