
the Creative Commons Attribution 4.0 License.
the Creative Commons Attribution 4.0 License.
 | 27 Aug 2026
On the effects of bat protection strategies on energy production and structural loads of wind farms
Tuhfe Göçmen
Thomas Duc
Andreas Vad
Antonina Vukobrat
As wind energy deployment expands, bat protection curtailment is increasingly required for ecological and regulatory reasons. Operators typically implement static, also called “blanket”, schedules based on environmental thresholds for predefined periods, while dynamic approaches based on real-time sensing have emerged as an alternative that can reduce unnecessary curtailment. To date, these strategies have been primarily evaluated using production-based metrics, although frequent curtailment-induced start-ups and shutdowns may affect structural loading and long-term fatigue accumulation. This study proposes an evaluation methodology to quantify impacts on both energy production and structural fatigue accumulation under different bat protection operational strategies. The methodology combines long-term environmental and bat activity data with wind-farm flow modeling, mode-dependent surrogate models to represent aeroelastic fatigue response in normal and curtailment-related operating states, and consistent aggregation of energy and fatigue metrics over long-time horizons. The approach is demonstrated in a case study of an onshore wind farm in France by comparing representative static and dynamic bat protection strategies with a baseline in which no bat protection strategy is implemented. The results show that energy losses are lower for the evaluated dynamic strategies compared to all considered static schedules. Cumulative fatigue impacts are channel dependent and are small for most responses and bat protection strategies. However, some loads showed sensitivity to curtailment, indicating that bat activity frequency and its combination with the local climate can lead to increased fatigue loading. The operational, energy, and fatigue cumulative impacts are analyzed, along with the effects of interannual variability, and the main drivers and sensitivities are identified. Based on these, implications for decision-making when selecting an operational strategy are discussed, and the need for the site-specific evaluation of both energy and fatigue is highlighted. Moreover, key assumptions are explained and research gaps are identified, especially how fatigue contributions from transient events should be modeled and accounted for in long-term evaluations. Finally, based on the findings, pathways to optimize bat protection strategies are suggested, aiming to achieve the targeted bat protection levels while minimizing energy losses and supporting asset reliability.
- Article
(3707 KB) - Full-text XML
- BibTeX
- EndNote


Wind energy deployment is expanding rapidly as part of global decarbonization efforts, but it also causes substantial unintended mortality of bats at turbines, raising concerns about long-term population impacts for several species (Kunz et al., 2007; Rydell et al., 2010; Voigt et al., 2022). Empirical studies in Europe and North America show that most fatalities involve open-air foraging and migratory bats, and are concentrated in late summer and autumn, at low-to-moderate wind speeds, warm temperatures, and during nighttime hours when bats forage and migrate (Rydell et al., 2010; Cryan et al., 2014; Măntoiu et al., 2020; Richardson et al., 2021). Syntheses and guidance documents for Europe emphasize that all European bat species are strictly protected under the Habitats Directive, therefore wind farms must avoid or effectively mitigate significant mortality through careful siting, monitoring, and operational measures (Rydell et al., 2012; BirdLife International, 2016; Rodrigues et al., 2015).
This situation is increasingly framed as a “green–green dilemma” between climate mitigation and biodiversity conservation, in which the same wind projects that reduce greenhouse gas emissions can locally endanger vulnerable bat populations (Voigt et al., 2022, 2024). Conceptual work argues that solving this dilemma requires clear legal standards for acceptable bat mortality, robust implementation of the mitigation hierarchy (avoid–minimize–offset), and explicit consideration of economic and energy system constraints when designing mitigation (Voigt et al., 2024; Frick et al., 2026). In practice, the overarching regulatory requirements are translated by regional authorities into site-specific operating conditions through the formal permitting and monitoring process, taking into account local bat activity, environmental conditions, and wind farm characteristics. Based on the operational experience of the industry co-authors, these assessments primarily consider ecological protection indicators (such as number or proportion of “bat contacts” protected) and coarse estimates of annual energy production (AEP) loss, whereas structural loading, lifetime effects, and longer-term economic implications are generally not evaluated explicitly. Curtailment changes operating patterns (start-up, shutdown, idling), which can influence fatigue loading and therefore lifetime/OPEX implications, therefore energy-only metrics can miss part of the trade-off.
Start-up and shutdown maneuvers and associated idling periods are also relevant from a turbine loading perspective, because transient events can introduce additional load cycles compared to steady production, while idling may reduce fatigue loading for some components depending on the size and foundation type. The study in Ziegler et al. (2024) used measured loads during shutdown and start-up events, from an onshore and an offshore wind turbine, to show that the net fatigue implication of curtailment depends on the balance between event-induced damage and reduced loading during idling, motivating curtailment strategies that consider structural loading alongside energy and ecological objectives. Measurements at an offshore wind farm show that normal shutdowns near cut-out occur tens of times per year and can significantly amplify tower-top and drivetrain loads, prompting recommendations that designers account explicitly for the expected frequency of shutdowns when assessing drivetrain fatigue and safety factors (Natarajan and Buhl, 2016). Simulation studies of multi-megawatt floating wind turbines also demonstrate that including start-up and shutdown transients can substantially increase tower fatigue damage, with the long-term effect depending on how often these events occur over the turbine lifetime (Luan and Moan, 2021). This indicates that transition-induced loading is relevant across different turbine and support-structure technologies, although its magnitude and the most affected components remain system specific. Recent work on revenue-driven curtailment similarly shows that projected lifetime extension and economic benefits are highly sensitive to how loads during idling, start-up, and shutdown are modeled, because changes in start–stop frequency and idling operating loads can shift the balance between reduced fatigue accumulation and lost production (Gräfe et al., 2026).
Operational curtailment, i.e. shutting down the wind turbines at low wind speeds during periods of high bat activity, has emerged as the primary mitigation strategy at operating wind farms. Site-specific curtailment experiments in North America, Europe, and Australia have shown that increasing the cut-in wind speed by 1–3 m s−1 can reduce bat fatalities by roughly 50 %–80 % relative to standard operation, with effectiveness varying among sites and years (Arnett et al., 2011; Martin et al., 2017; Bennett et al., 2022; Rnjak et al., 2023). Meta-analyses combining multiple studies indicate that curtailment is consistently effective: aggregated over several facilities, bat fatalities decrease by about 60 % on average for typical increases in cut-in speed, and fatality reductions scale approximately linearly with the size of the cut-in increase, although interannual variability remains high (Adams et al., 2021; Whitby et al., 2024).
The present study distinguishes between static and dynamic operational protection strategies. Static strategies implement fixed shutdown conditions based on predefined environmental thresholds (e.g., season, time of day, wind speed, and temperature), typically applied uniformly across a wind farm. Dynamic strategies, in contrast, adapt turbine operation in response to time-varying indicators of bat activity or risk, for example, through event-triggered shutdowns of predefined duration following detections. While dynamic approaches aim to reduce unnecessary curtailment compared to static rules, they may also increase the number of operational transitions, which motivates evaluating not only energy loss and protection metrics but also start–stop behavior and fatigue loading.
To reduce energy losses associated with simple, static curtailment rules, several “smart” or dynamic bat protection strategies have been developed that adapt turbine operation in response to real-time or forecasted bat activity. Sensor-informed curtailment algorithms and turbine-integrated systems shut down turbines only when bats are detected or when predictive models indicate high risk, thereby reducing both fatalities and curtailment time compared to wind-speed-only rules (Hayes et al., 2019; Rabie et al., 2022; Vallejo et al., 2023; Newman et al., 2024). Recent work shows that smart curtailment can maintain high levels of bat protection while substantially reducing lost production relative to conventional curtailment at the same nominal protection level, highlighting the value of site-specific optimization based on acoustic monitoring and local wind regimes (Sobchenko et al., 2025). At larger scales, national-level modeling for the United States indicates that even relatively conservative curtailment schemes to protect bats would reduce annual wind generation by less than a few percent under most scenarios, suggesting that bat protection can be compatible with continued wind energy expansion if mitigation is planned at the system level (Maclaurin et al., 2022; Thurber et al., 2023).
Regulatory and guidance frameworks have begun to formalize expectations for bat protection at wind farms, but they generally focus on ecological outcomes and procedural requirements rather than detailed turbine-level performance metrics. At the European scale, the EUROBATS guidelines and BirdLife position papers recommend thorough pre-construction surveys, sensitivity mapping, and post-construction monitoring, with operational mitigation to be implemented where high bat mortality is expected (Rodrigues et al., 2015; BirdLife International, 2016; Rydell et al., 2012). At the national level in Europe, several countries have translated these overarching obligations into detailed bat-specific guidance and operating practice. In the UK, guidance for Scotland and Northern Ireland sets out standardized protocols for acoustic surveys, risk assessment, and mitigation, and typically evaluates curtailment plans in terms of the proportion of bat activity or predicted collisions avoided (NatureScot et al., 2021; NIEA, Natural Environment Division, 2021). In Germany, a recent report by the Federal Agency for Nature Conservation analyzes the new species protection provisions of the Federal Nature Conservation Act and the Wind Energy Act, and provides concrete recommendations on how to reconcile accelerated onshore wind expansion with strict protection obligations for birds and bats, including through operational mitigation measures (Wulfert et al., 2025). Among other topics, the report introduces a statutory “reasonableness threshold” that limits the financial losses from protective measures, shows that standard operating requirements for bat protection (e.g., generic cut-in wind speeds and temperature thresholds) are often insufficient for modern large turbines, and recommends more differentiated, nationally standardized operational restrictions to ensure compliance with collision thresholds for bats. In Denmark, updated handbooks on Habitats Directive Annex IV species and associated technical notes on bats, wind turbines, and solar farms similarly propose extensive curtailment at relatively high wind speeds and the exclusion of projects from core bat habitats, prompting debate about their implications for the pace of the green transition (Elmeros and Møller, 2025).
In France, where the case study is located, bat protection practice is increasingly structured around quantitative protection targets that must be met by curtailment plans derived from site-specific monitoring. Regulatory authorities typically require 1 year of acoustic monitoring at selected turbines, and curtailment plans are designed so that a specified proportion of recorded “bat contacts” would have occurred when turbines are stopped, with commonly used thresholds of 90 % or 95 % protection (Leger, 2024; Groupe Chiroptères de la SFEPM, 2016). These static curtailment plans are usually defined by fixed conditions on wind speed, air temperature, time of day, and period of the year, and are then implemented across the entire wind farm. Existing French work shows that such plans can achieve regulatory protection levels but also that protection efficacy and energy losses are sensitive to interannual variability in bat activity and to the choice of thresholds, and that current practice rarely accounts for wake interactions among turbines or for the mechanical consequences of frequent shutdowns and start-ups (Leger, 2024).
Several reviews and synthesis papers summarize the state of knowledge on wildlife interactions with wind energy and on bat mitigation options, yet they seldom consider the interactions between bat protection control logic, farm-scale flow effects, and turbine structural response in a unified framework. Overviews of bird and bat collisions emphasize the importance of siting, turbine design, and operational mitigation, and list a variety of technical measures such as curtailment, on-turbine deterrents, and selective shutdown of high-risk turbines (Marques et al., 2014; Schuster et al., 2015; Arnett and May, 2016; Garcia-Rosa and Tande, 2023). Detailed studies of bat activity at turbines, including vertical activity profiles and temporal peaks in activity, demonstrate the potential for targeted curtailment schemes that align with species-specific behavior patterns (Wellig et al., 2018; Richardson et al., 2021; Ellerbrok et al., 2023). However, existing work typically evaluates mitigation effectiveness in terms of fatalities avoided per turbine, per MW, or per unit of bat activity, combined with coarse estimates of associated energy losses. There is very limited published work that explicitly quantifies how alternative bat protection strategies affect fatigue damage accumulation of individual turbines and entire wind farms.
In this context, there is a need for evaluation frameworks that can quantify the coupled effects of various bat protection strategies on energy production, structural loads, and bat protection metrics at the level of real wind farms, and that can be applied under realistic regulatory constraints. The present paper contributes to this need by developing and applying such a framework to an onshore wind farm in France equipped with acoustic bat monitoring. Several static curtailment plans reflecting current French practice, including various protection levels, are compared with idealized dynamic strategies inspired by smart curtailment concepts. Using long-term SCADA and bat activity data, the effects of these strategies are assessed in terms of energy production, the frequency and duration of start–stop maneuvers, and fatigue load accumulation at turbine and farm level, and the associated implications for turbine reliability are discussed. The framework is intended not only to inform regulators about the trade-offs between bat protection and technical performance but also to support wind farm operators in choosing between alternative bat protection options. This it does by making the trade-offs between protection effectiveness, production or revenue loss, and implementation and maintenance costs explicit. Because the case study operates under a fixed tariff (non-merchant), revenue is proportional to energy, therefore energy impacts are reported as the primary economic proxy. The aim is to quantify these trade-offs in a setting representative of current European regulatory practice and to provide insights that can guide both the design of more efficient bat protection strategies and the operational decision-making of wind farm operators.
The remainder of the paper is organized as follows. Section 2 describes the evaluation framework, including the flow modeling approach, the surrogate-based aeroelastic load modeling, the implementation of operational logic and aggregation, and the wind farm and bat activity datasets used in the case study. Section 3 presents the results for the evaluated static and dynamic bat protection strategies, including operational impacts, effects on cumulative fatigue and energy production, and interannual variability. Section 4 discusses key assumptions and limitations, implications for generalizability and decision-making, and potential pathways to improving and optimizing bat protection strategies. Section 5 derives overall conclusions and outlines directions for future work.
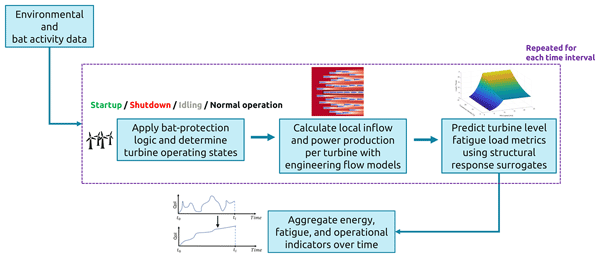
This work applies a modular, multi-fidelity evaluation framework to quantify how alternative bat protection curtailment strategies influence wind farm performance and turbine structural fatigue loading under realistic operating conditions. The framework couples (i) time series of ambient conditions and (if relevant) bat activity, (ii) user-defined curtailment control logic and turbine operational-state handling, (iii) wake-aware flow modeling for farm-level interactions, and (iv) surrogate-based turbine-response prediction into a unified workflow that can be executed consistently across different strategies. The overall methodological basis follows the wind farm evaluation framework presented in Pettas et al. (2026); additional background on related evaluation and optimization concepts is provided in Pettas (2024). Figure 1 summarizes the main processing chain and data flow.
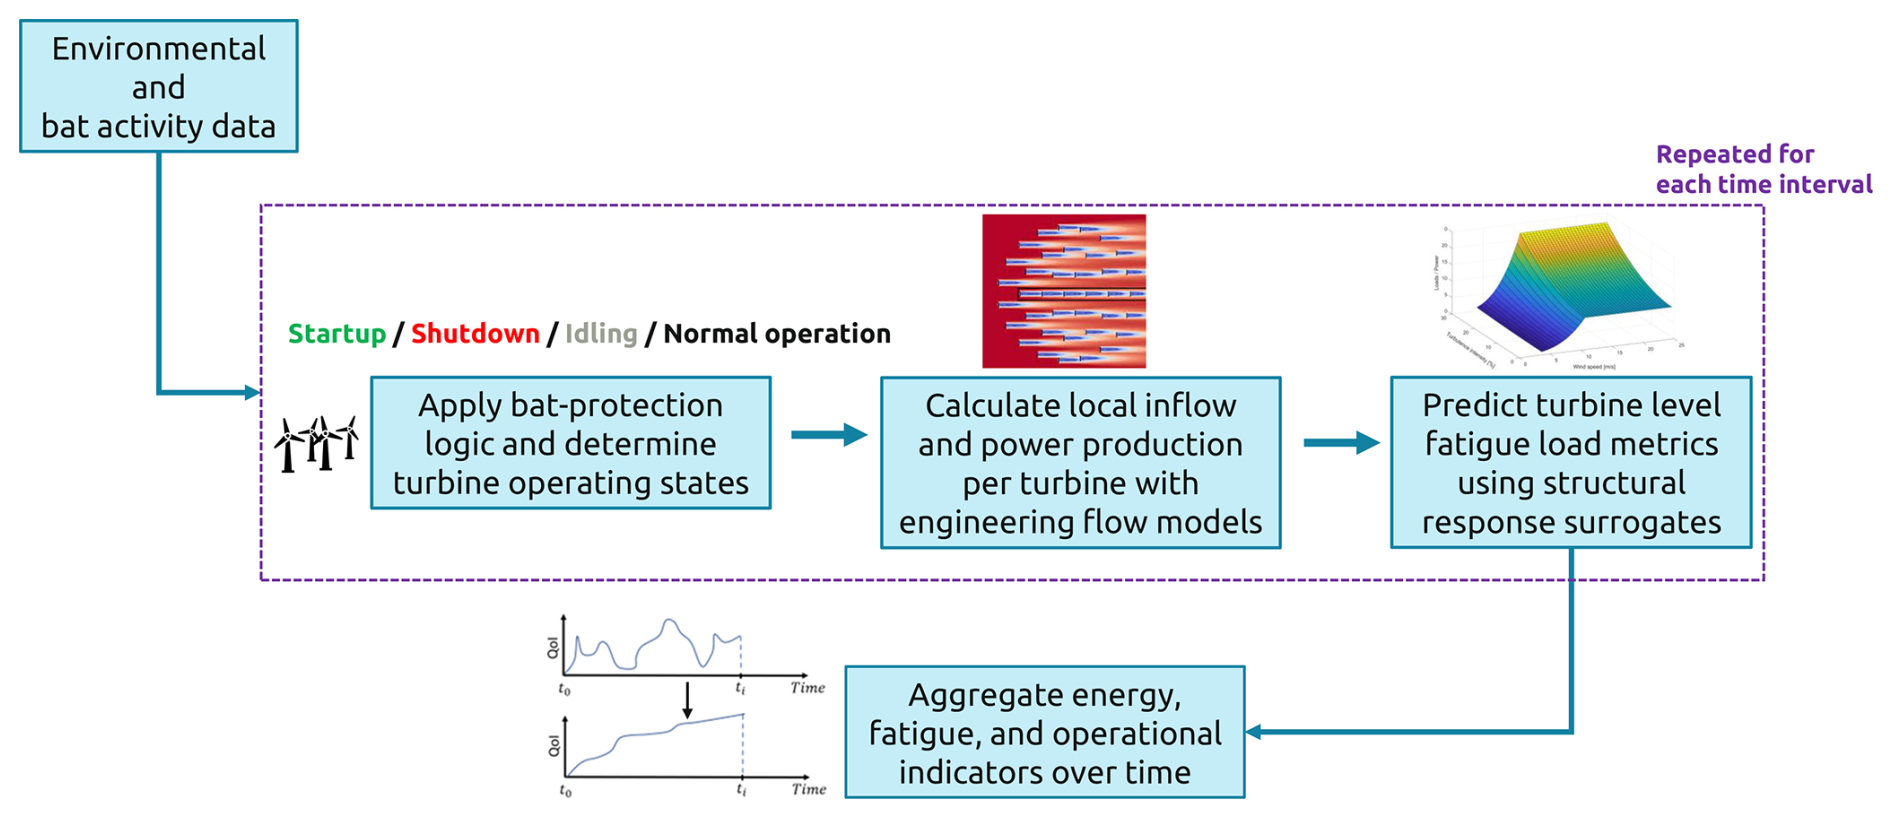
At each evaluation time step, the specified control strategy provides turbine-level curtailment requests (e.g., normal operation or shutdown commands). These requests are mapped to applied operational states using a turbine state-machine logic, enabling the consistent representation of non-producing states and start–stop transitions. Given ambient inputs and resulting operational states, a wake-aware engineering flow model is used to compute turbine-wise effective inflow descriptors and turbine-wise power, accounting for wake interactions. The turbine-wise inflow descriptors, together with the applied operational state, are then passed to a structural-response surrogate model trained on mid-fidelity aero-servo-elastic simulations to predict response metrics relevant for fatigue assessment. Step-wise quantities are accumulated over the full evaluation horizon to obtain turbine-level and farm-level indicators used for case comparisons, including energy production, fatigue damage proxies, and operational statistics related to start–stop behavior.
The framework can operate at different temporal resolutions depending on the available input data and the response models employed. In the present case study, a 10 min resolution is used because SCADA and bat activity inputs are available at this resolution and the turbine-response surrogates are tailored to 10 min simulation outputs. The framework also supports computing revenue when a price signal is provided (e.g., fixed tariff or time-varying market prices). However, the present paper does not specify a specific price input; instead, energy production is used as the primary revenue proxy in the considered fixed-tariff context. Detailed descriptions of the individual modules (flow modeling, surrogate modeling, control, and aggregation) and the case-study-specific data processing are provided in the following sections.
2.1 Flow modeling
The flow model captures wake interactions within the wind farm and links the ambient inflow conditions to turbine-level inflow and the resulting power production. Steady-state engineering wake models offer a practical compromise between predictive accuracy and computational efficiency, which explains their widespread use in both industry and research (Porté-Agel et al., 2019). In this study, the engineering flow modeling framework FLORIS (Fleming et al., 2023) is used to represent the wind farm flow field.
Terrain and boundary layer dynamics significantly affect real wind farm inflow conditions. In this work, these influences are captured using flow parameters, represented as speed-up factors, that quantify terrain-induced changes in wind speed. For a given wind direction, the flow field between the node locations is obtained by linear interpolation of these factors. In parallel, the wake parameters define the wake-model formulation. Following the “wind farm as a sensor” methodology of Braunbehrens et al. (2023), both parameter sets are jointly calibrated using site-specific historical data. Figure 2 illustrates this procedure. A more detailed description of the tuning process, including tuned coefficients, is provided in Appendix A.
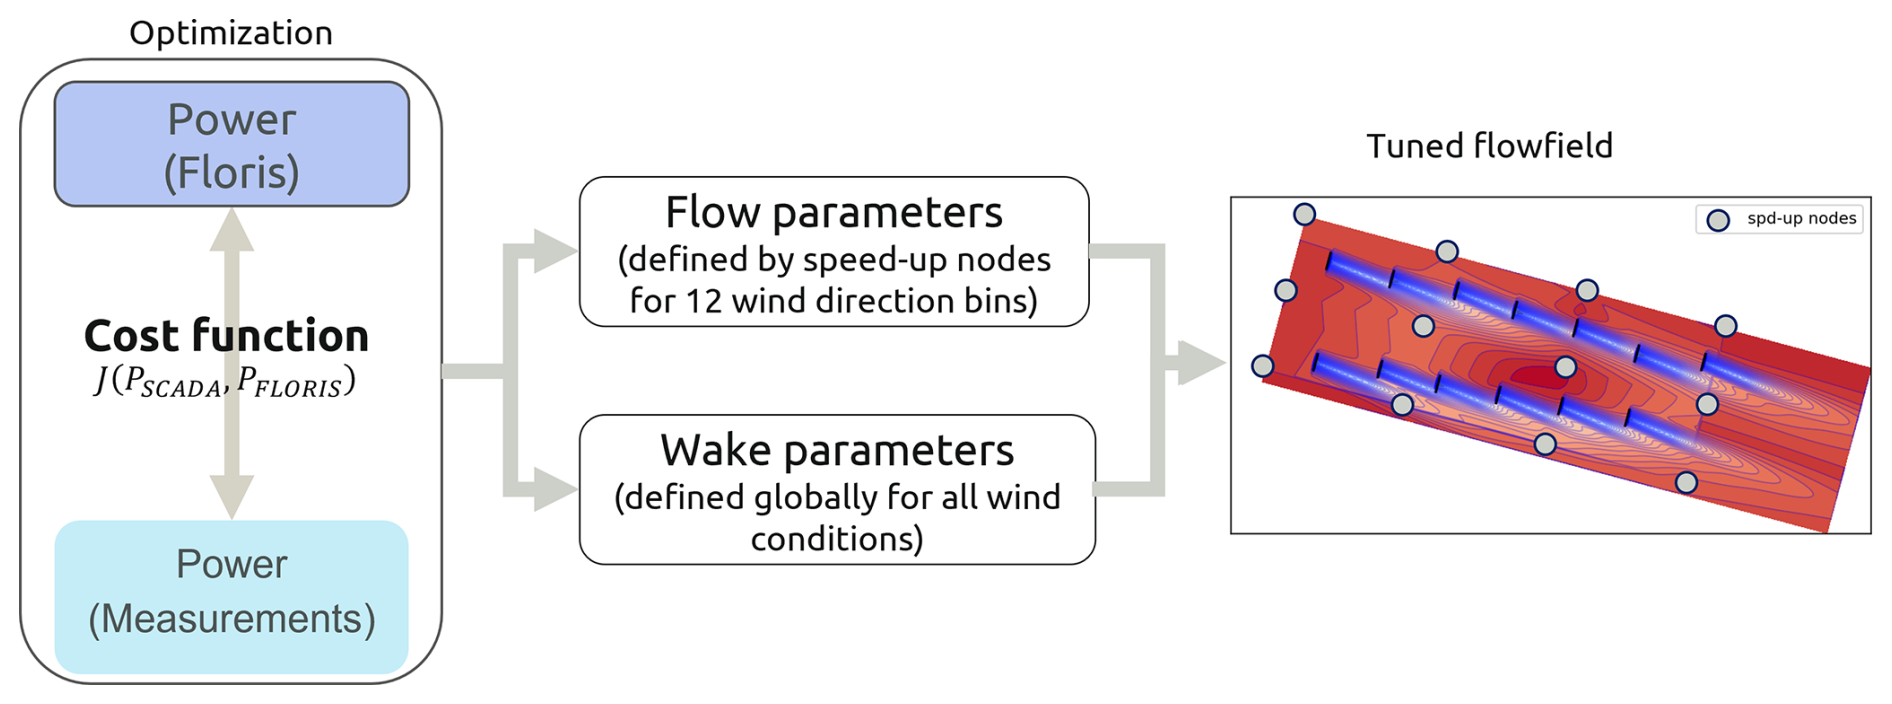
Figure 2Calibration process at the site to obtain the tuned wake parameters and flow parameters according to Braunbehrens et al. (2023).
The calibrated wind-farm model provides turbine-specific inflow conditions that reflect spatially varying wind speeds and turbulence intensities resulting from upstream wakes and terrain-induced speed-ups. Wind speed and turbulence intensity (TI) are rotor averaged using a 3×3 discretization of the rotor plane. These turbine-level inflow conditions are then used to compute power output and serve as inputs to the turbine-response models, together with the control inputs. The underlying assumption is that steady-state engineering wake models yield 10 min averaged wake characteristics that are consistent with those obtained from the dynamic wake model used in the aeroelastic simulations (Ardillon et al., 2023). The power production for each turbine at each 10 min interval is also calculated by the calibrated FLORIS model explained here. For the idling, start-up, and shutdown operational modes, inter-farm wakes are not considered as they mostly correspond to transient behavior not captured by this quasi-steady modeling framework. Therefore, the ambient conditions are assumed to be uniform across the wind farm and fed directly to the surrogate for these operational modes.
2.2 Modeling, control, and simulation database
Structural response during bat protection curtailment is evaluated using a surrogate modeling approach to enable long-horizon, wind-farm-scale simulations. The wake model provides turbine-wise rotor-averaged effective wind speed and TI, and the operational strategy determines turbine operational requests represented through discrete operational modes. Conditioned on these inputs, mode-specific load surrogate models map effective inflow to 1 Hz equivalent damage-equivalent loads (DELs) for a set of structural load channels.
The surrogate database is generated from standalone aero-servo-elastic simulations of the IEA 3.4 MW reference wind turbine (Bortolotti et al., 2019), selected as a proxy due to the unavailability of the OEM (original equipment manufacturer)-specific aeroelastic model for the case-study turbines. The case-study wind farm and the available field data are described in Sect. 2.6. The rotor size, tower height, and power rating are comparable to the turbines of the considered wind farm. Simulations are carried out with the HAWC2 software (Larsen and Hansen, 2007) using turbulent inflow generated with the Mann model (Mann, 1998). The DTU Wind Energy controller (Meng et al., 2020) is used to control the wind turbine with mode-specific configurations, described below. All simulations have a duration of 800 s. The first 200 s are discarded to remove numerical transients, and fatigue metrics are computed over the remaining 600 s segment. For each inflow condition and operational mode, six independent turbulence realizations are considered to capture seed-to-seed variability. Vertical wind shear is prescribed with a power law exponent of 0.2 due to the lack of site-specific shear measurements, and yaw misalignment is not considered.
Four operational modes are considered in the surrogate database: normal operation, idling, start-up, and shutdown. Normal-operation simulations follow the standard controller configuration for the IEA 3.4 MW turbine. Idling is modeled as a non-producing state with the rotor freewheeling. During idling, the blades are pitched to the feather position (90°) without engaging the mechanical brake.
Start-up and shutdown states are considered to represent the additional loading associated with operational maneuvers within a 10 min evaluation interval. In the field, curtailment-induced start/stop events may occur at any time within a 10 min interval, and the corresponding duration of producing versus non-producing operation within that interval is not uniquely defined. To obtain a practical surrogate representation without introducing a large number of additional cases with different maneuver timings and durations, a fixed interval structure is adopted: within the 600 s evaluation segment, 150 s correspond to normal operation and the remaining time corresponds to idling, with the maneuver triggered at a fixed time instant in each simulation. This choice ensures that the maneuver remains a dominant contribution to the loading response while retaining a representative fraction of normal-operation behavior. The maneuver duration depends on wind speed but is typically on the order of 10–30 s.
Start-up and shutdown maneuvers are simulated using the DTU Wind Energy controller's built-in functionality. Controller parameters that adjust the pitch actuation rate during the maneuvers are tuned to align the simulated transition behavior with the pitch-rate characteristics observed in high-frequency SCADA during normal (non-emergency) start-up and shutdown events at the case-study site. The shutdown is modeled through pitching to the 90° feather target combined with generator torque action, without engaging the mechanical brake. Figure 3 illustrates an example time series demonstrating the transition behavior during start-ups and shutdowns based on the simulation outputs.
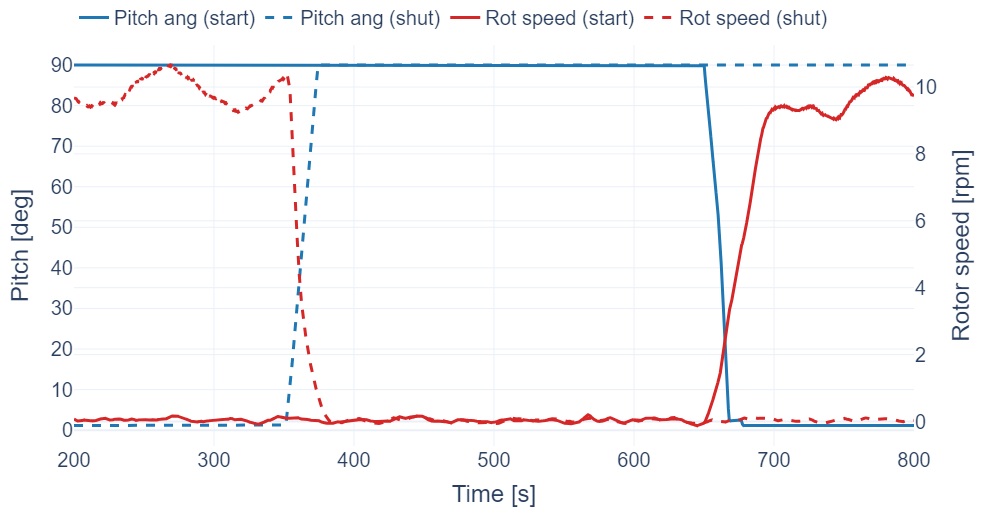
Figure 3Illustrative aeroelastic time series of pitch angle and rotor speed for start-up and shutdown simulations, showing the imposed structure within the 10 min evaluation interval and the timing of the maneuver relative to normal-operation and idling segments.
The aeroelastic simulation database is generated using a full factorial design of experiments (DOE) in wind speed and TI, defined separately for each operational mode to reflect the expected operating domain and sensitivity. For normal operation, simulations cover wind speeds from 3 to 26 m s−1 in 1 m s−1 increments and turbulence intensities from 3 % to 31 % in 2 % increments. Idling simulations use the same wind speed range but a coarser TI grid (3 % to 31 % in 4 % increments) to reduce the number of simulations while retaining coverage of the relevant inflow space, as it was observed that in this operational mode, loading is less sensitive to TI. For start-up and shutdown, the simulated wind speed range is limited to 3–10 m s−1 (1 m s−1 increments). This limited wind speed range, from cut-in to rated, was chosen as shutdowns for bat protection occur at low wind speeds close to cut-in. TI spans 3 % to 31 % in 2 % increments for both modes. For each inflow condition and operational mode, six independent turbulence realizations (seeds) are simulated to account for seed-to-seed variability, as suggested in the IEC standard. Table 1 summarizes the resulting DOE and the number of seed-averaged training points per mode.
Table 1Design of experiments (DOE) for aeroelastic simulations used to construct the surrogate models.

In addition to the factorial database used for model training, an independent test set is generated for each operational mode to evaluate predictive performance under unseen inflow conditions. Test points are sampled over the input domain using a Latin Hypercube sampling approach and are simulated with the same aeroelastic setup and number of turbulence realizations as the training database. The test set comprises 100 sampled inflow conditions for the normal-operation mode and 50 sampled conditions for each of the idling, start-up, and shutdown modes. Figure 4 illustrates the coverage of the training and test sets in the wind speed–turbulence intensity space for the normal-operation mode.
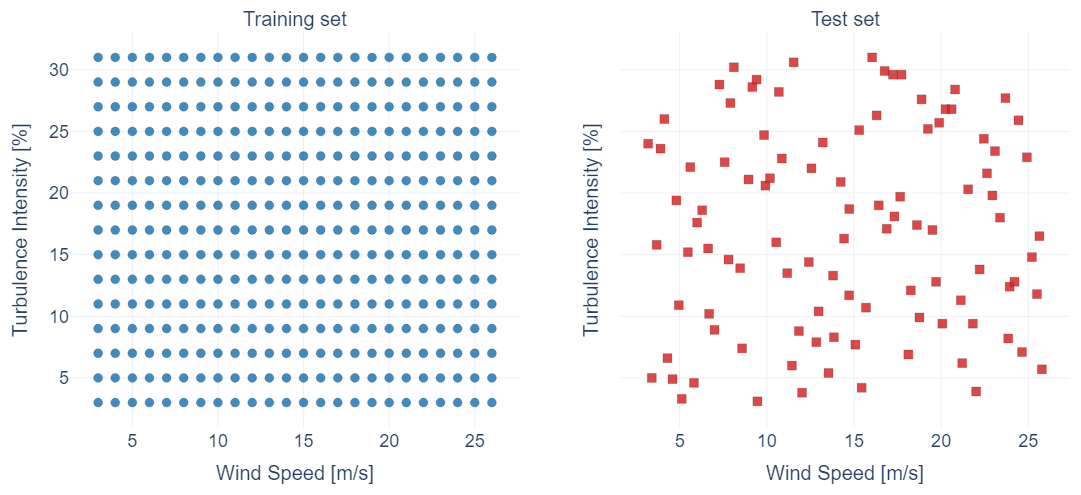
Figure 4Training and independent test sets in wind speed–turbulence intensity space for the normal operation mode.
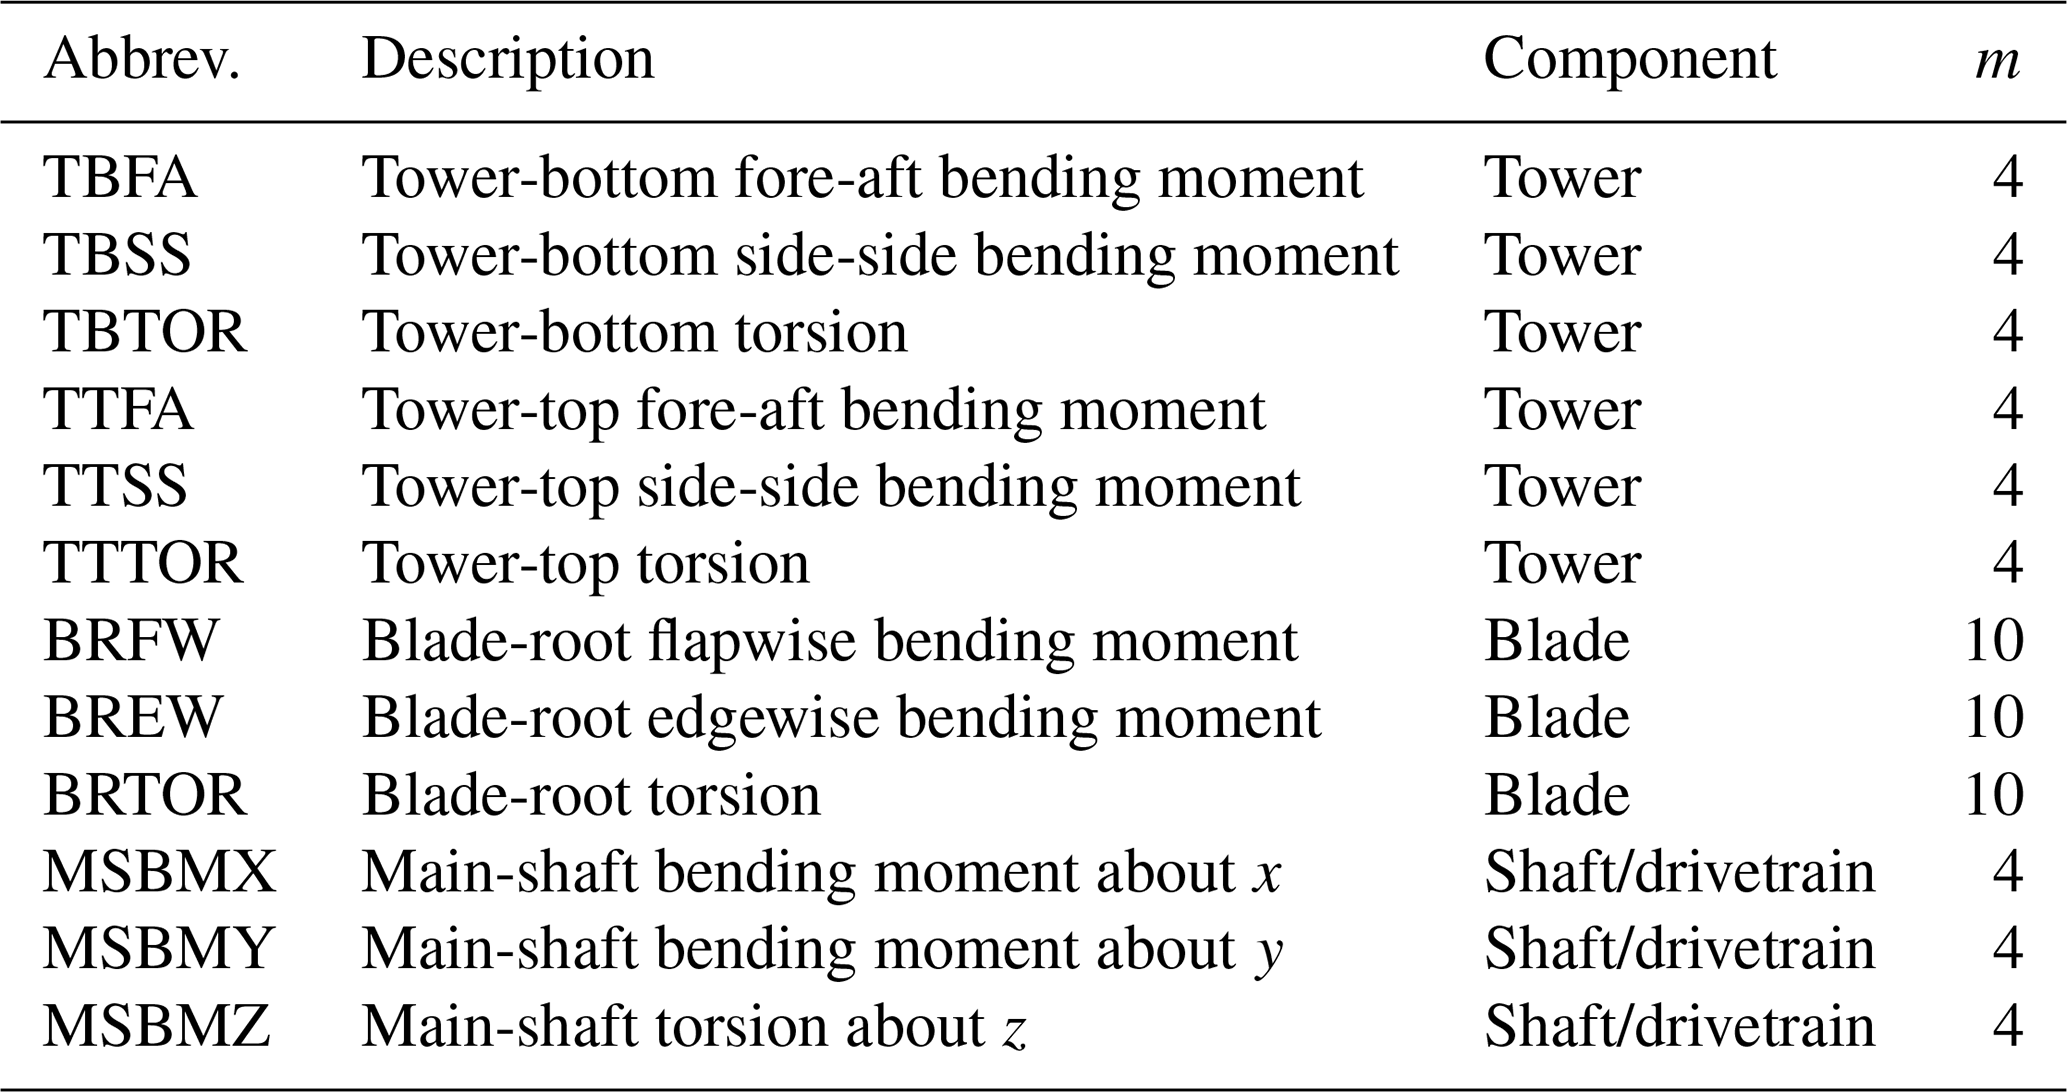
For each simulation and load channel, cycle counting is performed using the rainflow algorithm, and 1 Hz DELs are calculated considering a reference cycle number of 600. Wöhler exponents are prescribed as m=4 for steel-dominated components and m=10 for blade-root channels, consistent with common practice in wind turbine fatigue assessment. Table 2 lists the channels considered and the corresponding Wöhler exponents used for DEL calculation.
Table 2Load channels considered for surrogate modeling and corresponding Wöhler exponents used for DEL calculation.
2.3 Surrogate models for structural loads
Mode-specific load surrogate models are formulated as multiple-input single-output (MISO) mappings with two inflow descriptors as inputs and one fatigue metric as output. Specifically, rotor-averaged wind speed (RAWS) and rotor-averaged turbulence intensity (RATI) are used as inputs, and the target output is the 1 Hz DEL for a given load channel. Separate surrogate models are constructed for each operational mode and each load channel. Two regression approaches are evaluated: cubic spline interpolation and feedforward neural networks (NNs). The selection is motivated by the small and structured two-dimensional input dataset, where simple interpolants can perform competitively, as reported in Pettas and Cheng (2024).
Spline-based interpolation is implemented using SciPy's RectBivariateSpline, fitted on the structured RAWS–RATI grid. A tensor-product spline surface of degree (cubic in both dimensions) is constructed over the two-dimensional input space. In this formulation, the spline representation is defined with respect to the supplied RAWS and RATI grids, and no manual knot placement is performed. Feedforward neural networks with two hidden layers are used as a benchmark, with the architecture, activation functions, and learning rate selected using Hyperband optimization (Li et al., 2018). Further implementation details and the selected architectures are provided in Appendix B.
The prediction accuracy of the developed surrogate models is compared across operational modes and load channels using the independent test sets described in Sect. 2.2. Both approaches provide broadly comparable central error levels, but the NN models show wider error distributions and more frequent extreme deviations for several mode-channel combinations. Errors are generally more dispersed for the transient modes because maneuver-driven responses and seed-to-seed variability make the interval-level DELs more difficult to approximate. The complete error distributions and performance metrics are reported in Appendix B.
Given the comparable accuracy and the structured two-dimensional input space, spline-based surrogates are selected for all subsequent analyses in this paper. In the present application, surrogate predictions are evaluated repeatedly over long-horizon wind farm simulations and subsequently used for fatigue accumulation. Under these conditions, robustness to occasional large over- or under-predictions is prioritized, since extreme prediction errors can influence accumulated results in an inconsistent manner. The spline formulation provides a simple and stable interpolator on the factorial RAWS-RATI grid and exhibits reduced sensitivity to outliers relative to the NN approach for the considered datasets. The selection of spline-based surrogates for downstream use is further motivated by the risk profile associated with deploying either method in a safety-relevant fatigue assessment context. Over long simulation horizons, sporadic large prediction errors accumulate across evaluation intervals and introduce an uncertainty that is difficult to mitigate or trace back to specific inflow conditions.
The surrogate models use rotor-averaged inflow descriptors. While such low-dimensional descriptors are attractive for long-horizon evaluation frameworks due to the low computational cost, they have known limitations in representing spatially non-uniform inflow conditions – in particular, partial-wake situations where load responses depend on the distribution of velocity deficit and turbulence across the rotor. Recent studies have shown that surrogate models conditioned on richer inflow descriptors, such as sector-averaged or spatially resolved rotor quantities, can improve load prediction in wake-affected conditions, especially when trained on inflow fields that explicitly represent wake-induced shear and turbulence structures (Guilloré et al., 2024; Doubrawa et al., 2023; Ramaswamy et al., 2026; Vad et al., 2026a; Guilloré et al., 2026).
In the present work, the aeroelastic training database is generated using free-stream turbulent inflow rather than wake-aware inflow fields, and wake effects are not represented explicitly in the aeroelastic inputs. Instead, wake interactions are accounted for at the wind farm level through the wake model, which provides turbine-wise effective wind speed and TI that reflect the presence of wakes. For the present application, the dominant mechanism differentiating strategies is the frequency and duration of curtailment-induced operating states and transient events at low wind speeds, rather than fine-scale differences in partial-wake inflow structure. Rotor-averaged descriptors are therefore considered appropriate to capture the main effects targeted in the analysis. Nevertheless, the use of rotor-averaged descriptors and free-stream training inflow should be kept in mind when interpreting absolute load levels under strongly non-uniform wake conditions, and it motivates future extensions using higher-dimensional inflow representations when required by the application.
2.4 Aeroelastic response
To support interpretation of the subsequent results, the selected spline surrogate is further used to examine the mode-dependent aeroelastic response trends across the inflow domain. For all load channels considered, DEL predictions are evaluated on a dense wind speed grid for fixed TI levels of 7 % and 17 %, and the resulting trends are presented in Fig. 5.
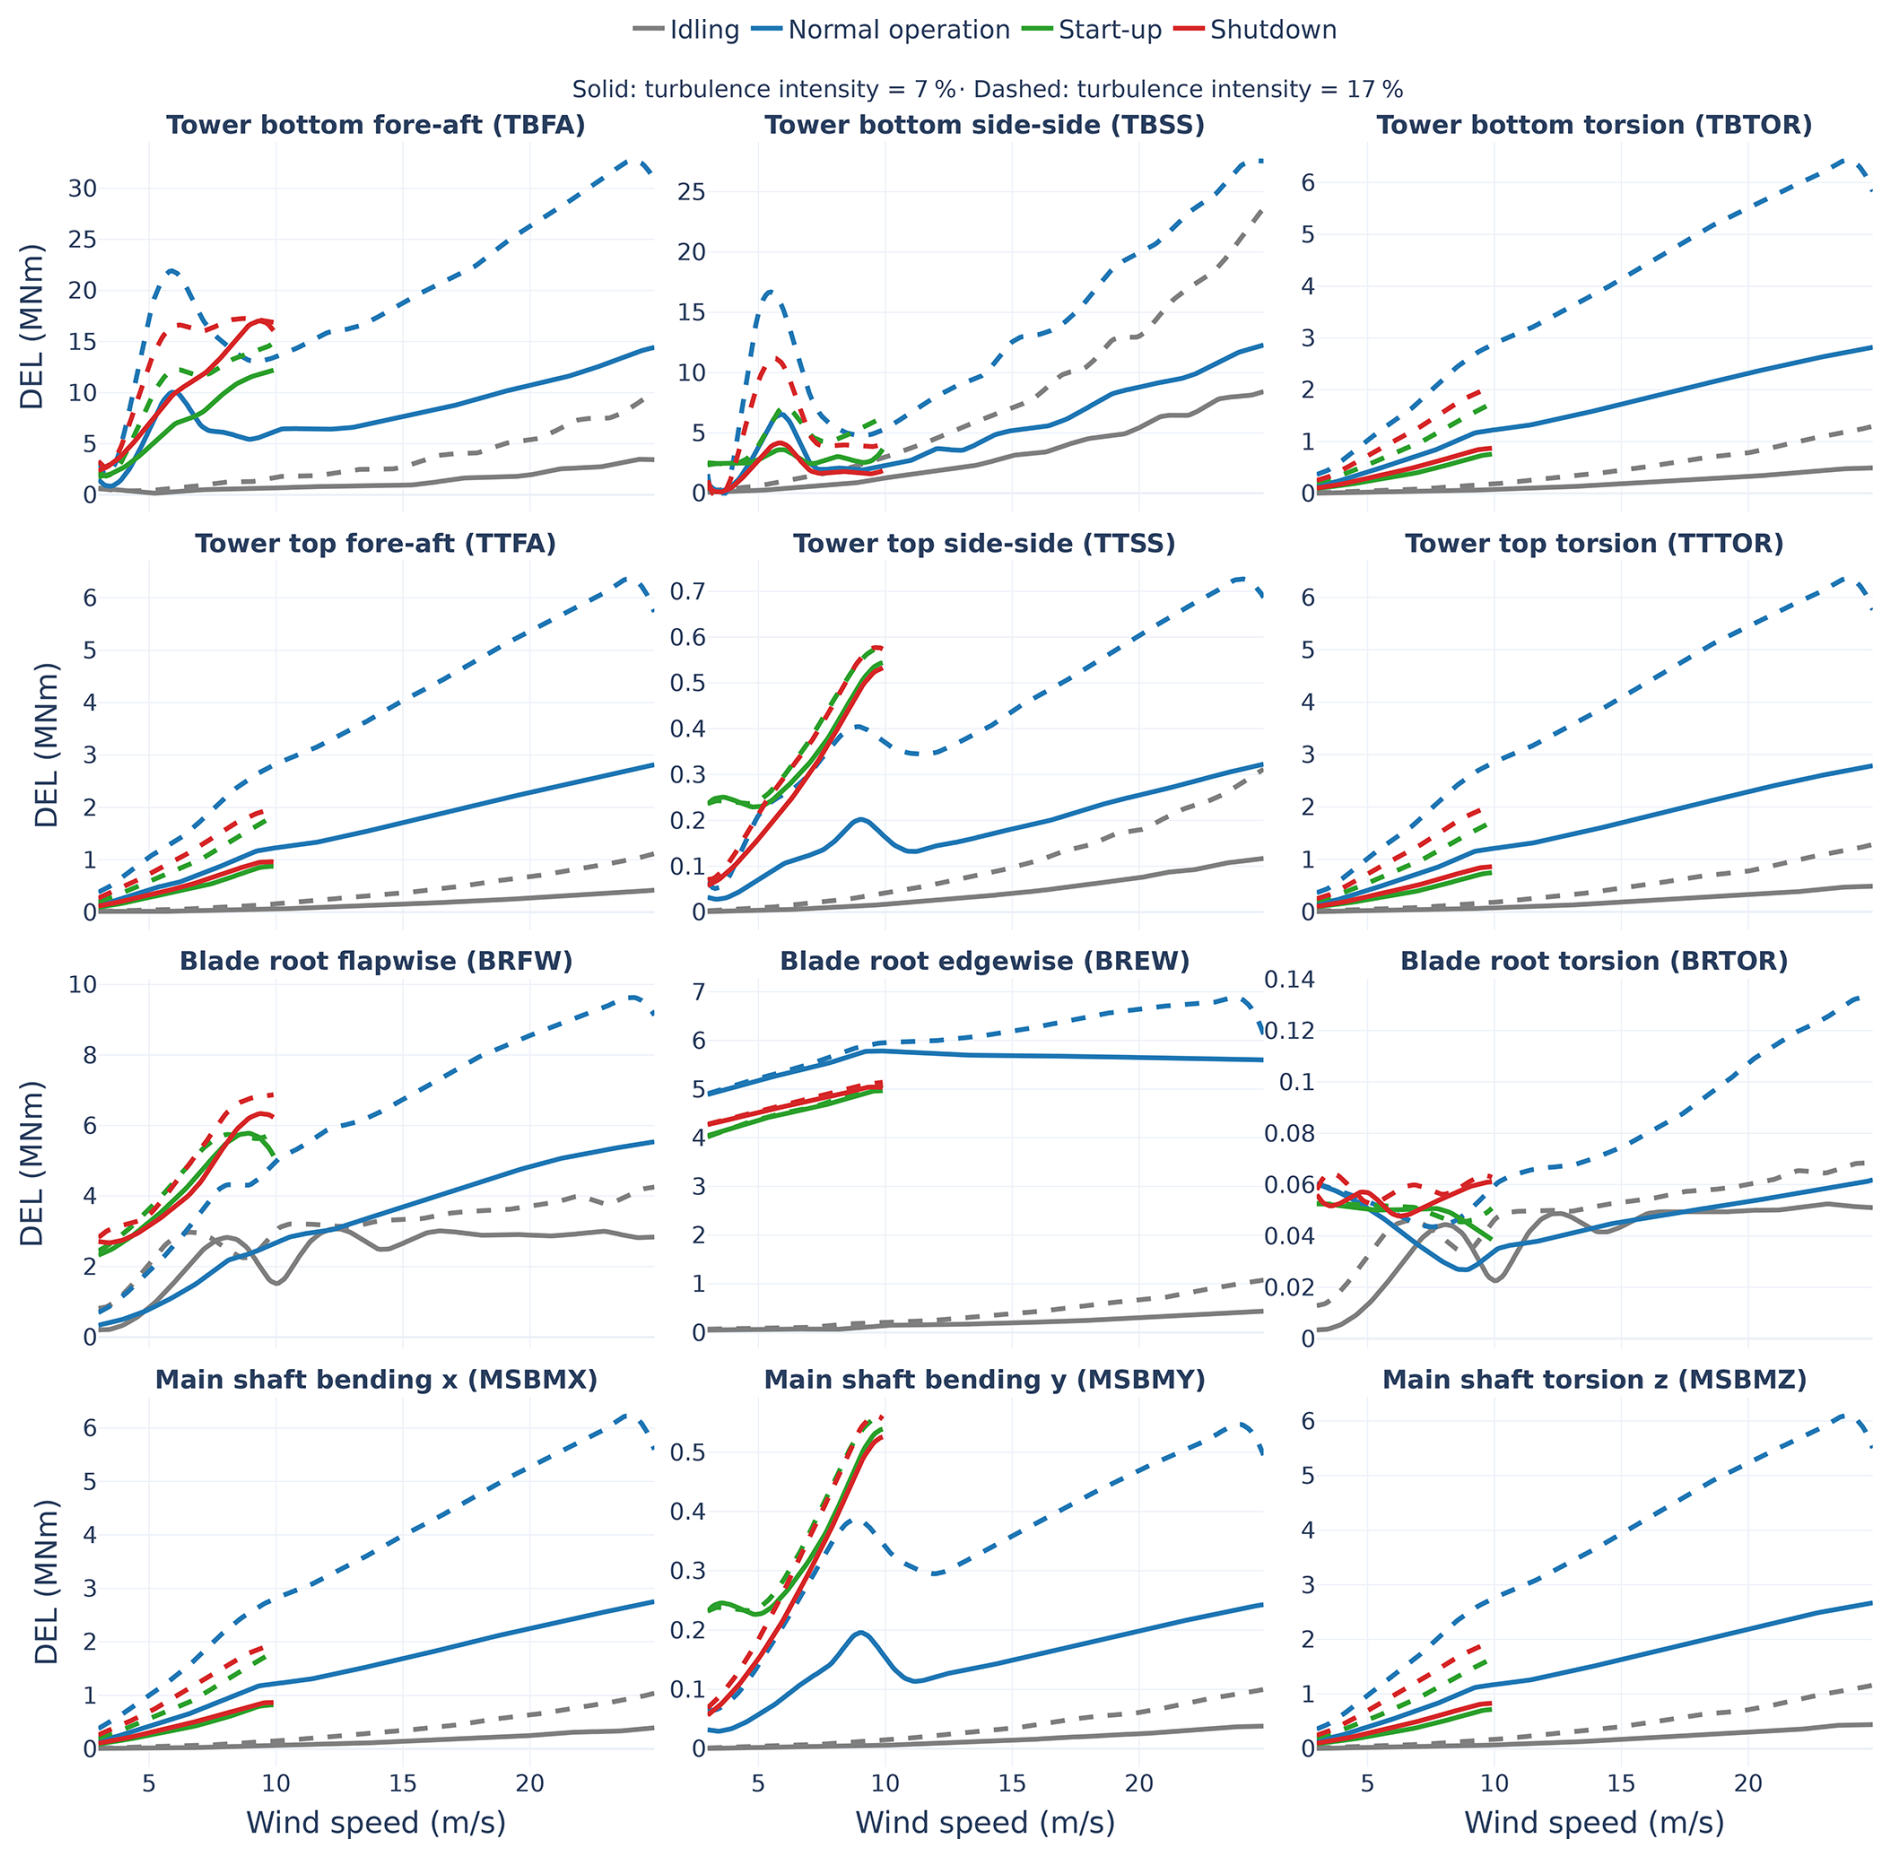
Figure 5Parametric sweeps of surrogate-predicted DELs for all considered structural load channels as functions of wind speed at turbulence-intensity levels of 7 % (solid lines) and 17 % (dashed lines), shown for each operational mode.
Normal operation provides a reference trend for interpreting the non-producing and transitional modes. Across channels, in general, DELs increase with wind speed over the simulated range, and TI is a primary driver of load magnitude for many components, with the separation between the 7 % and 17 % curves indicating the sensitivity to turbulence-induced fluctuations. This behavior is consistent with established fatigue-loading trends under normal producing operation and is therefore only summarized briefly here.
Idling generally leads to substantially reduced DEL levels compared to normal operation for most channels, and DELs show a low sensitivity to TI. This is even more pronounced at low wind speeds close to cut-in where bat protection curtailment is applied. Idling DELs for several tower, blade, and drivetrain channels (TBFA, TTFA, TTSS, TTTOR, BREW, MSBMX, MSBMY, MSBMZ) are close to zero relative to the producing case, indicating that idling periods are typically load relieving and can reduce accumulated fatigue for these responses.
However, idling does not uniformly reduce fatigue loading across all channels. Blade-root flapwise bending (BRFW) exhibits comparatively elevated idling DEL levels at low wind speeds that are of similar order to normal operation, indicating that idling is not load neutral for this channel and the considered turbine model configuration. A similar exception is observed for blade-root torsion (BRTOR), which also remains comparatively high during idling in the low-wind speed region. Tower-bottom side-side bending (TBSS) shows intermediate behavior: idling DELs are lower than normal operation but remain comparatively larger than for most other channels, and the idling response approaches the normal-operation level more closely at higher wind speeds. These exceptions imply that, while idling is generally expected to reduce fatigue accumulation for most channels relevant to the present application, the benefit is channel dependent and not universal. This observation provides motivation for considering curtailment interval duration as a design parameter, since longer idling periods can partly offset start/stop-related fatigue impacts for channels where idling is load relieving, as also discussed in the context of measured start/stop loading and curtailment-interval optimization (Ziegler et al., 2024).
Start-up and shutdown responses depend strongly on the channel and, relative to normal operation, tend to exhibit reduced sensitivity to turbulence intensity for several components. Consequently, the ranking between producing and transitional modes can shift with TI: at low TI, start/stop-related DELs for some channels are comparable to or exceed normal-operation DELs, whereas at higher TI the normal production DELs can become higher. This behavior is consistent with start/stop loading being governed to a larger extent by the imposed maneuver and the associated transient/oscillatory response, rather than by sustained turbulence excitation alone.
For a subset of channels, start-up and shutdown DELs are consistently higher than normal operation in the low-wind-speed region for at least one turbulence level. Blade-root flapwise bending (BRFW) shows the most pronounced increase: start-up and shutdown DELs exceed normal-operation DELs across the simulated wind speed range and remain elevated even at the higher turbulence level, indicating that curtailment-induced transitions are potentially fatigue-relevant for flapwise blade-root loading. Blade-root torsion (BRTOR) exhibits a smaller increase that is primarily observed in the lower turbulence regime. Drivetrain responses can also be transition sensitive: MSBMY shows substantially increased start/stop DELs relative to normal operation for low TI, with the difference reducing as TI increases. Tower-top side-side bending (TTSS) exhibits a mode-dependent response that is comparable to, or slightly lower than, normal operation at low TI and becomes lower than normal operation at higher TI.
For TBFA and TBTOR, start/stop DELs are comparable to normal operation near cut-in for low TI and become increasingly elevated with wind speed over the simulated range; at higher TI, start/stop DELs are lower relative to normal operation. In contrast, several channels exhibit start/stop DELs that are consistently slightly lower than normal operation across the simulated conditions, indicating that bat curtailment transitions do not increase fatigue loading for these responses in the considered setup. This group includes blade-root edgewise bending (BREW) and several tower-top and drivetrain channels (MSBMX, MSBMZ, TTFA, TTTOR), for which the start/stop DEL levels remain at or below the corresponding normal-operation levels over the considered wind speed and turbulence-intensity combinations.
Start-up and shutdown exhibit broadly similar wind speed dependence, with DEL magnitudes generally increasing with wind speed over the simulated domain. It is noted that start-up and shutdown simulations are limited to wind speeds up to 11 m s−1 in the present database; therefore, the trends discussed here are not intended to describe rated or above-rated behavior. Across channels, start-up and shutdown DELs are typically close in magnitude, with shutdown occasionally producing slightly higher DELs depending on the channel.
Overall, this analysis highlights the fact that the fatigue impact of bat protection curtailment is governed by a balance between (i) the number of start/stop events, which can be load intensive for specific channels; and (ii) the duration of idling periods, which are load relieving for many tower-top and drivetrain channels but not for all responses (notably BRFW and BRTOR). The net effect over long horizons, therefore, depends on the interplay between curtailment strategy, wind speed, and TI conditions during curtailment, and the channel-specific response characteristics across operational modes. While the qualitative behavior described above provides insight into the subsequent results, the absolute magnitudes and the relative ordering among modes are expected to depend on turbine and foundation design, controller implementation, and the adopted representation of idling and maneuver dynamics. These aspects should be considered when transferring conclusions to other turbines or support-structure configurations.
2.5 Application of operational logic and aggregation
Once the flow model and mode-specific load surrogates are defined, the 10 min time series of ambient wind speed, TI, wind direction, temperature, and, where applicable, bat activity are processed sequentially. At each interval, the bat protection logic issues a farm-wide shutdown request. For the static cases, the request is activated when the prescribed calendar date, nighttime, temperature, and wind speed conditions are satisfied simultaneously; nighttime is determined from the site-specific sunrise and sunset times. For the dynamic cases, each recorded detection initiates a shutdown timer of prescribed duration, which is reset if another detection occurs before the timer expires.
The bat protection request is combined with the turbine operating envelope, with turbines assumed to be non-producing outside the 3–25 m s−1 wind speed range. Other sources of downtime, such as maintenance, repair, or grid curtailment, are not considered. A state-machine logic then maps the current shutdown request and the previous turbine state to one of four operational modes: normal operation, shutdown, idling, or start-up, following the general framework discussed in detail in Pettas et al. (2026). This prevents direct switching between producing and idling states without passing through the transient state. At the adopted 10 min resolution, a shutdown and a subsequent restart are each represented by one full 10 min transient interval.
For each turbine and time step, the assigned mode determines the response calculation. During normal operation, the wake model provides turbine-specific rotor-effective wind speed, TI, and power, and the inflow descriptors are passed to the normal-operation load surrogate. For shutdown, idling, and start-up, wake effects are neglected, ambient inflow is used, and the corresponding mode-specific surrogate is evaluated. These non-producing modes are assigned zero power production. For the transient modes, this is a conservative approximation because their exact timing within the 10 min interval is unresolved.
Turbine energy is summed over turbines and time to obtain the cumulative farm energy yield. For each turbine and load channel, the predicted DEL is converted to a relative fatigue damage increment, following Miner's linear accumulation rule (Miner, 1945), as
where Leq is the interval DEL, m is the channel-specific Wöhler exponent, and nref=600 is the reference number of cycles for a 10 min interval. Since the material constants required for absolute lifetime prediction are not introduced here, the accumulated quantities are used as relative damage indicators for comparing operational strategies rather than as absolute lifetime estimates. Energy and cumulative fatigue are finally compared with a baseline case evaluated using the same ambient time series and modeling assumptions but without bat-protection curtailment.
2.6 Wind farm data and processing
The case study is based on an onshore wind farm in France operated by ENGIE Green. Owing to confidentiality restrictions, the name, exact location, and OEM turbine type cannot be disclosed. The wind farm consists of 13 turbines, and the layout is shown in Fig. 6 in normalized coordinates using the rotor diameter D as reference. The layout figure also indicates the turbine equipped with the bat monitoring system, which is described in more detail in the following subsection. Curated 10 min SCADA data for all turbines were provided by ENGIE Green for 2 full years, with an availability of 99.6 %. The variables used in the present study are turbine wind speed, wind speed standard deviation, wind direction, and ambient temperature. In addition, turbine power signals were used to calibrate the flow model as described in Sect. 2.1; and high-frequency data were used to tune the start-up and shutdown maneuvers, as described in Sect. 2.2.
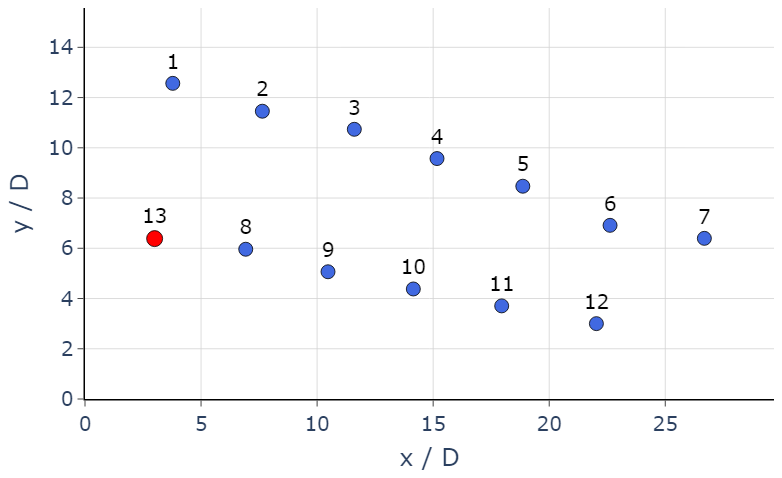
Figure 6Normalized layout of the wind farm shown in dimensionless coordinates . The turbine equipped with the bat monitoring system is indicated with red.
For each 10 min interval, a farm-level ambient wind direction is first derived from all turbines using the circular mean of the available wind direction signals. Based on this direction, the front-row turbines expected to operate in free-stream conditions are identified for the corresponding inflow sector. Ambient wind speed, wind speed standard deviation, and wind direction are then derived as the mean values of these free-stream turbines, providing a single ambient inflow time series for the farm. Since nacelle-anemometer measurements are known to produce noisy estimates, particularly for the wind speed standard deviation, the resulting TI values are capped at 30 % in order to avoid unrealistic input values and extrapolation beyond the surrogate domain. Missing timestamps in the derived ambient time series are finally patched using ERA5 reanalysis data at the nearest grid point (Hersbach et al., 2020), such that the simulation inputs used in the subsequent analysis achieve full temporal coverage. Since ERA5 is available at hourly resolution, the corresponding variables are first linearly interpolated to 10 min resolution.
Figure 7 summarizes the resulting ambient inflow characteristics for the 2-year period. The wind speed distribution indicates a relatively low-wind site, with a substantial fraction of occurrences in the low-to-moderate wind speed range and a high probability of conditions close to cut-in. This is directly relevant for the present application, since bat protection curtailment is activated in this operating region and may therefore affect a non-negligible fraction of the annual production. The embedded wind rose shows that the inflow is not directionally uniform and that specific sectors dominate the site exposure. The TI distributions binned by wind speed show the expected decrease in TI with increasing wind speed, together with a broad spread in the low-wind-speed region. The broad spread of TI in the low-wind-speed region is particularly relevant for the present study. As shown in the aeroelastic response analysis, the loading behavior of start-up, shutdown, and idling relative to normal operation depends significantly on TI. Since a wide range of TI values occurs under the wind speed conditions most relevant for bat curtailment, the net structural impact of the curtailment strategies cannot be inferred a priori by the local climate and must be evaluated through the full time series.
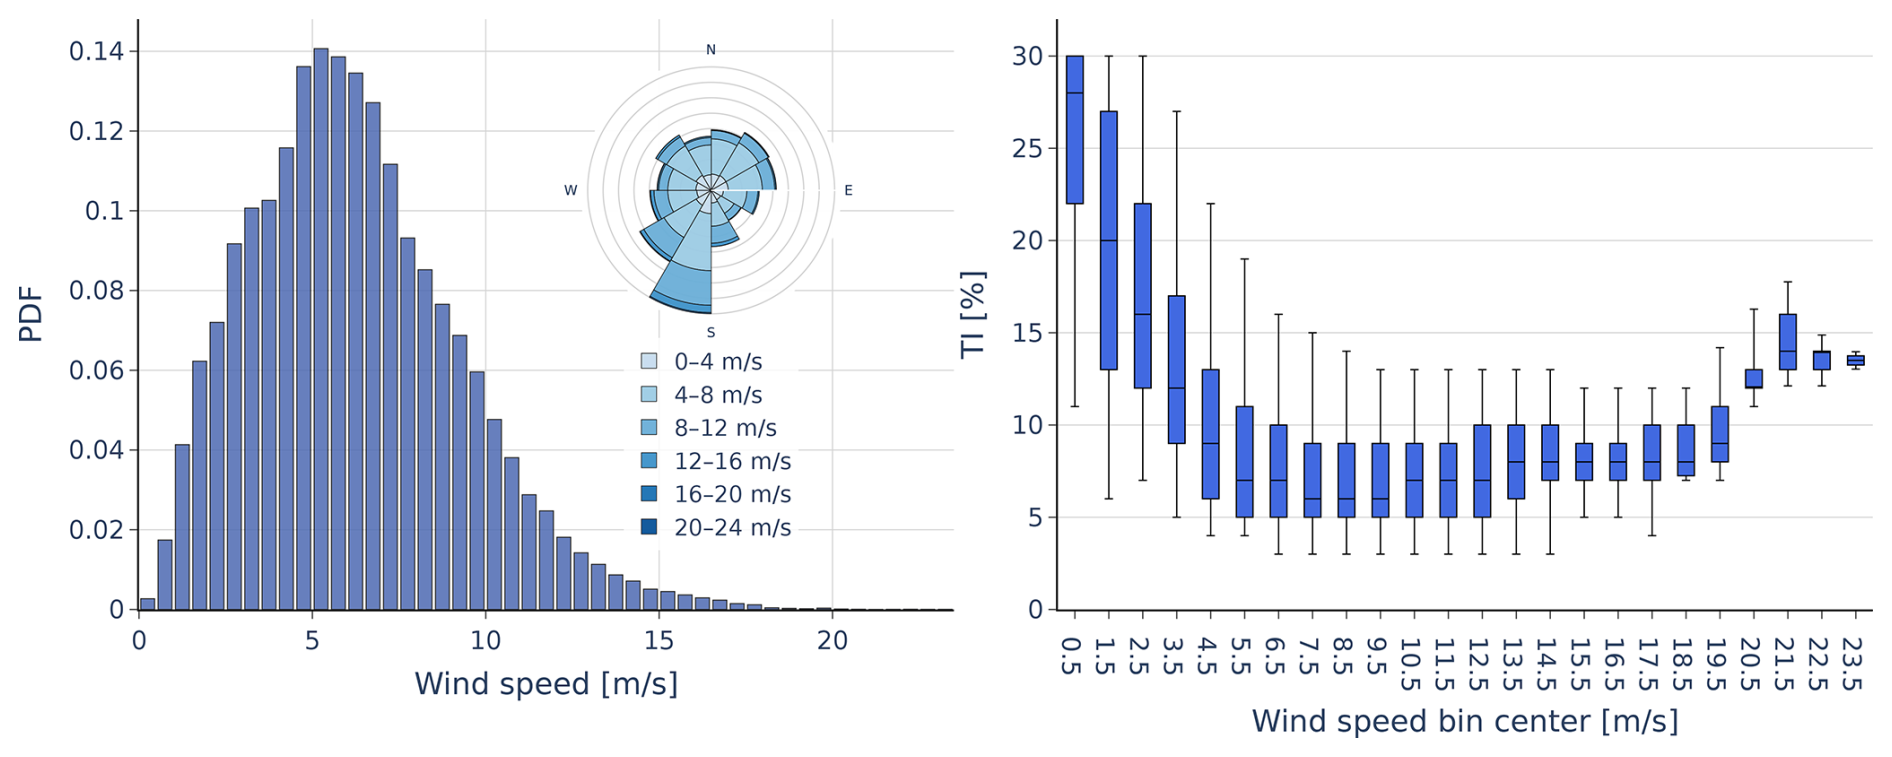
Figure 7Ambient inflow characteristics derived from the available dataset. Left: normalized wind speed distribution with embedded wind rose. Right: turbulence-intensity distributions shown as box plots for wind speed bins. Center line in the box denotes the median value, and whiskers indicate the 5th and 95th percentiles.
2.7 Bat activity measurement campaign and analysis
For both years considered, the bat detection system was installed during the spring, before the end of the hibernation period, and removed in the fall at the end of the seasonal activity period. The monitoring campaigns were performed using a batcorder system (ecoObs GmbH, 2026), which records sound and ultrasound in the vicinity of the equipped turbine. The raw data were processed by a third-party company specializing in environmental studies, including filtering of parasitic noise and expert validation of bat activity by a chiropterologist to confirm the bat activity and to identify, when possible, the bat species involved in the recording. The full procedure was carried out by the third-party company, and only the final cleaned dataset is considered within the scope of the present study. It consists of a table of individual bat contacts, including the timestamp of each recording, the identified species when available, and an activity magnitude indicator.
For the purposes of the present analysis, all detected bat activity is considered jointly, and the dynamic control logic is therefore not implemented on a species-specific basis. To combine bat activity with the ambient atmospheric conditions used in the simulation framework, the cleaned monitoring data are aggregated to 10 min resolution and matched to the processed SCADA-derived ambient time series.
Figures 8 and 9 show the observed bat activity as a function of wind speed and air temperature, and as a function of time during the investigated period, respectively. The observed activity is concentrated predominantly under low wind speed and relatively warm conditions between sunset and sunrise during the months with elevated bat activity. The seasonal distribution is consistent with the biological activity cycle of bats. In particular, the wind speed distribution of the recorded activity in Fig. 9 is shifted toward lower values than the ambient wind speed distribution shown in Fig. 8. Therefore, the activity peak does not simply coincide with the most frequently occurring wind speed regime at the site. These site-specific observations motivate the environmental and temporal thresholds used in the static bat protection strategies. However, the distributions are presented descriptively and are not intended to quantify causal relationships between environmental conditions and bat behavior or to generalize across species and sites. The data also show interannual variability as in year 2, the first meaningful activity is observed only from June onward, whereas in year 1, bat activity is already recorded from April, with substantial occurrences during May.
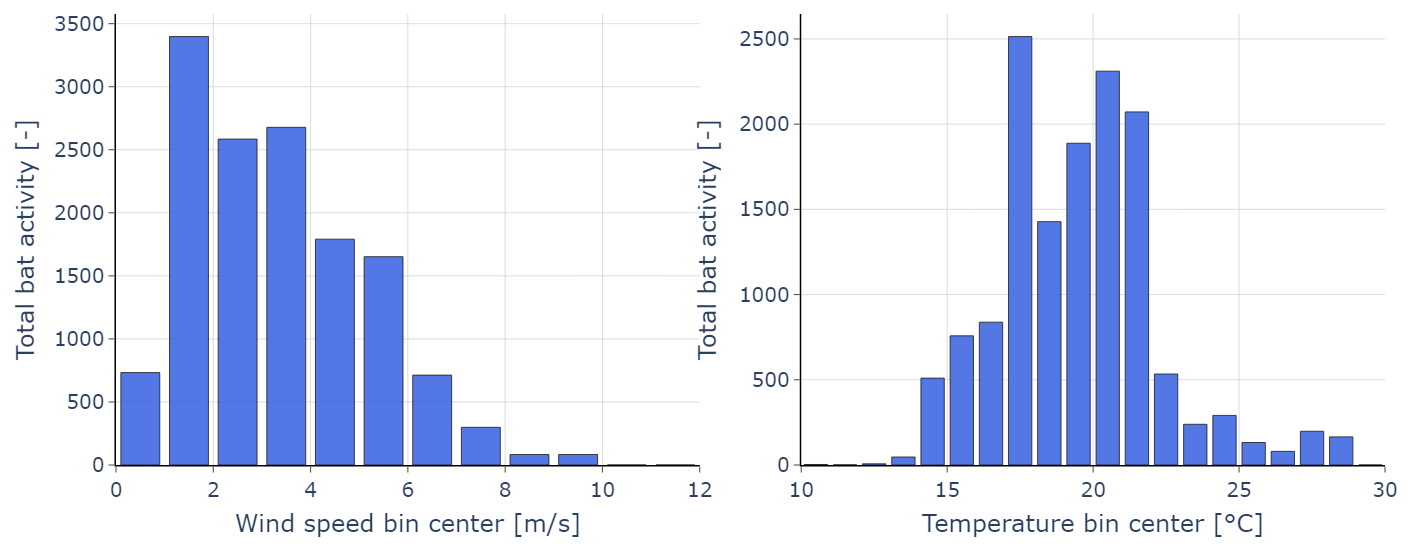
Figure 8Bat activity observed at the site for all the species. Left: bat activity with respect to wind speed. Right: bat activity with respect to temperature.
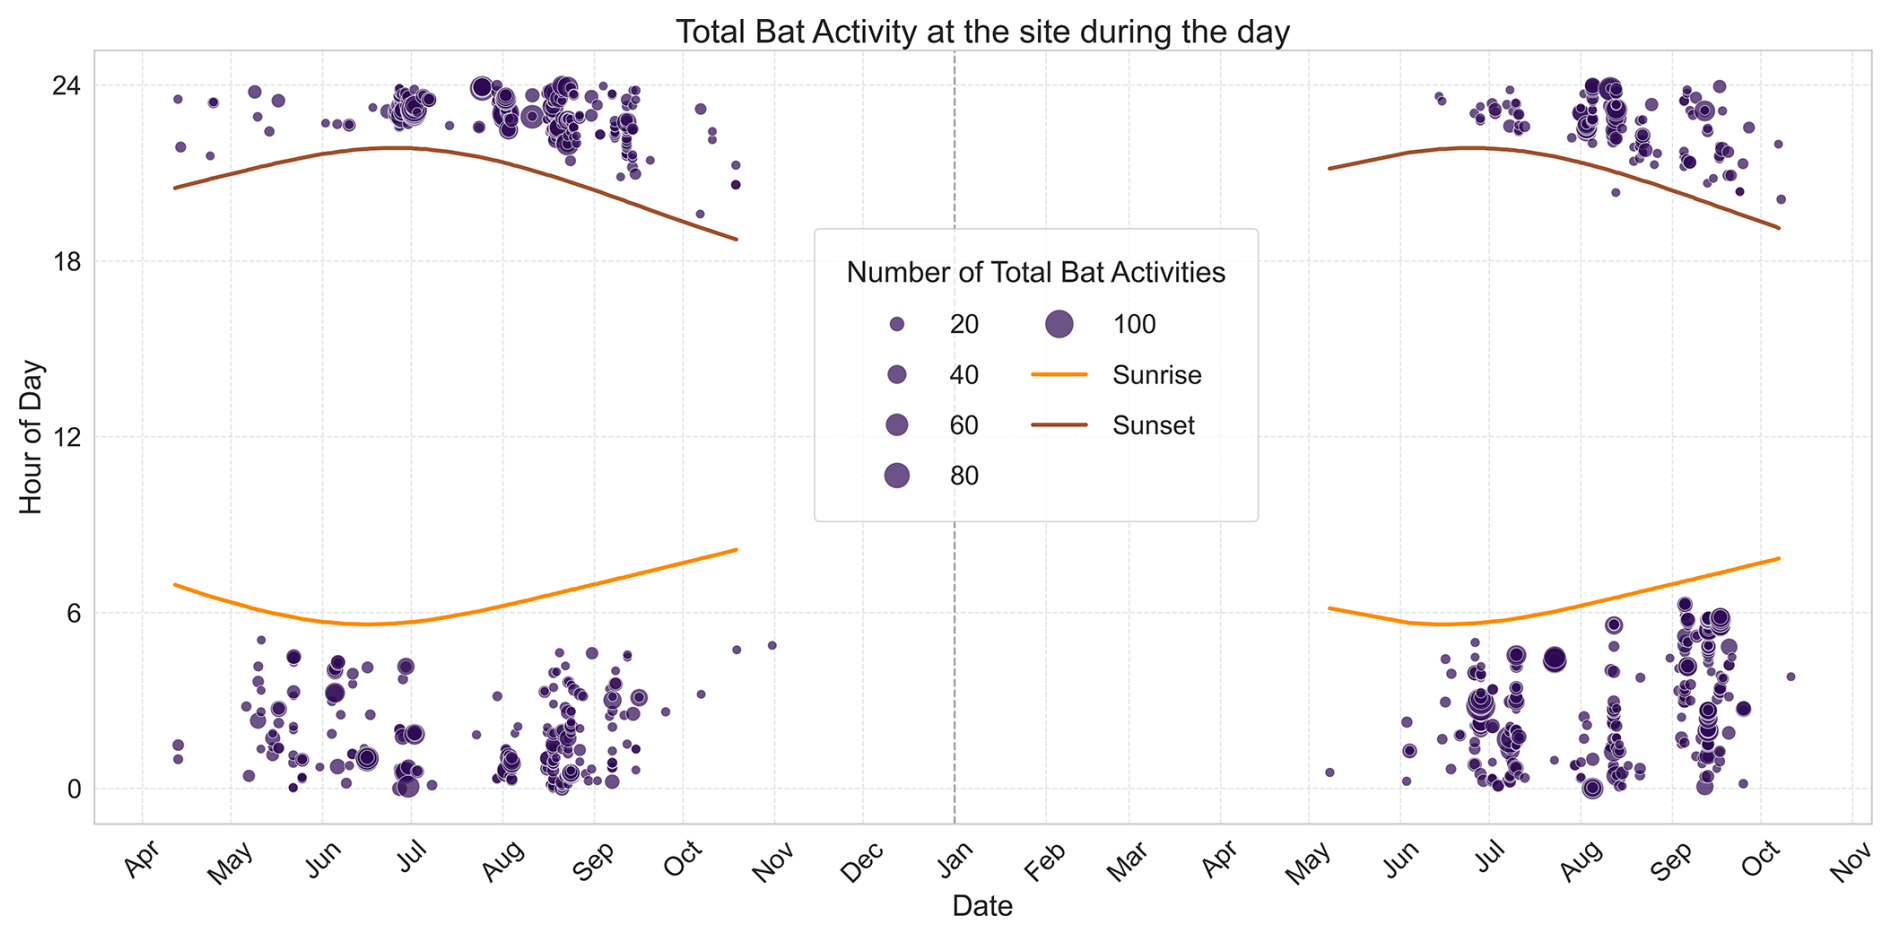
Figure 9Daily bat activity observed during year 1 (left) and year 2 (right) at the site for all species. The size of the dark circles indicates the number of activities recorded for the first and second year. Light- and dark-brown circles show the sunrise and sunset times for the days, respectively, where bats were observed within the investigated period.
2.8 Case study definition
The case study evaluates a baseline without bat control, along with a set of static (blanket) and dynamic (event-triggered) bat protection operational strategies across the full 2-year dataset. All cases are simulated using the evaluation framework described in the previous sections, and the resulting energy and fatigue metrics are reported relative to the baseline case. In line with current practice, the static curtailment schedules are derived from year 1 bat monitoring dataset and then applied to both years. The evaluated cases are summarized in Table 3.
Table 3Definition of the evaluated bat protection operational strategies. Static thresholds are derived from year 1 monitoring data and applied to both years. All turbines in the farm are stopped when the corresponding control conditions are met.

The baseline case represents normal wind farm operation without bat protection curtailment. Turbines are therefore assumed to remain in normal operation unless the ambient wind speed falls outside the operating envelope considered in the framework. This case is used only as a reference against which the relative changes in energy production and accumulated fatigue damage of the bat protection operational strategies are quantified.
The three static (blanket) cases are derived from year 1 monitoring data and represent different levels of bat protection consistent with current industry practice. They are defined through combinations of environmental thresholds on seasonal period, nighttime operation, ambient wind speed, and ambient temperature, which must be satisfied simultaneously to trigger curtailment. The specific threshold combinations adopted for the present study were provided by ENGIE Green following the expert-based evaluation procedure described in Sect. 2.7. The first case (Static90) can be interpreted as a production-oriented curtailment schedule, designed to retain as much energy as possible while still targeting a minimum bat protection level of 90 %. The second case (Static99) represents a more protection-oriented schedule, in which turbines are stopped more frequently in order to reach a target protection level of 99 %. The third case (Static100) corresponds to a full-protection scenario. In this case, the activation thresholds are extended to the most conservative values among the considered environmental variables such that all bat contacts observed during the reference year campaign would fall within the shutdown window.
The two dynamic (event-triggered) cases are based on direct bat detections and use the control logic described in Sect. 2.5. In both cases, a detection recorded by the monitoring system triggers shutdown of the entire wind farm, such that all turbines stop and restart simultaneously. The parameter varied is the shutdown duration following a detection, which is set to either 10 min (Dynamic10) or 30 min (Dynamic30). These values are chosen as plausible implementation scenarios rather than site-optimized settings, since dynamic curtailment is not currently deployed at the studied wind farm and detailed information on the appropriate field reset time after a detection is not available. Their purpose is to probe how shutdown duration changes the balance between frequent start/stop transitions and time spent idling. As shown in the aeroelastic analysis, idling is load relieving for many channels, whereas start-up and shutdown can be load intensive for some responses; longer curtailment intervals may therefore reduce fatigue for selected channels by decreasing the number of transitions, even though they increase lost production.
For the purpose of the operational impact assessment, the available monitoring signal is assumed to be representative of the bat activity relevant to the entire wind farm. Under this idealized assumption, and neglecting possible false-positive and false-negative detections, the dynamic strategies are assumed to correspond to a nominal protection level of 100 %. This value should not be interpreted as an independently verified measure of realized ecological protection.
This section compares the baseline, static, and dynamic bat protection operational strategies in terms of their operational impact, farm energy production, and cumulative fatigue response. The analysis focuses on relative differences with respect to the baseline case and examines both the overall 2-year behavior and the variability between the 2 investigated years. The section concludes with a discussion of the main assumptions, limitations, and implications of the obtained results.
3.1 Operational impact of the curtailment strategies
Before discussing the effects on energy and fatigue, it is useful to examine how the different bat protection operational strategies modify the wind farm's operational schedule. Figure 10 summarizes, for the full 2-year period, the total number of start-up and shutdown events (left) and the total downtime in hours (right) for each case, including the baseline. Here, downtime denotes the cumulative time spent in shutdown, idling, and start-up modes. Start-up and shutdown are counted as individual events; therefore, one stop followed by one restart contributes two counts. For reference, the baseline case already includes 3141 start-up/shutdown events and 2780 h of downtime over the 2-year period, driven by wind speeds falling below the cut-in speed. Over the same period, bat activity was detected in 264 ten-minute intervals in year 1 and 301 intervals in year 2, corresponding to 565 intervals in total.
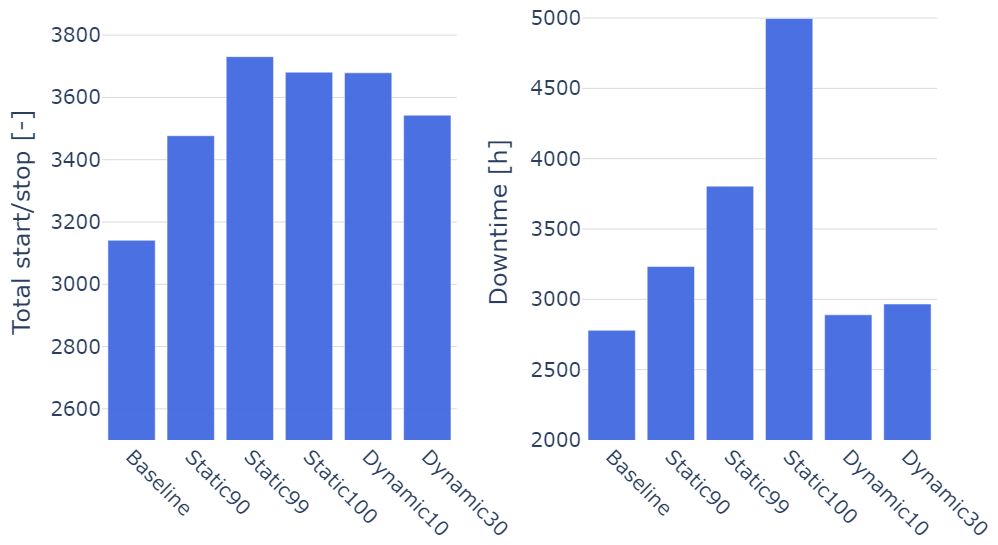
Figure 10Operational impact of the evaluated strategies over the full 2-year period. Left: total number of start-up and shutdown events. Right: total downtime in hours, defined as the cumulative time spent in shutdown, idling, and start-up modes.
The static cases lead to progressively larger changes in turbine operation but not in a strictly monotonic manner with respect to the number of transitions. Static90 increases the total number of start-up/shutdown events to 3477 and the total downtime to 3233 h. Static99 produces the highest number of transitions, with 3731 total events, while downtime increases to 3805 h. In contrast, Static100 results in fewer total start-up/shutdown events (3681) than Static99 but substantially greater downtime, reaching 4996 h. This behavior is consistent with the much broader shutdown windows of Static100: as the environmental activation criteria are extended, shutdown requests more often merge into long consecutive non-producing periods, including also intervals in which the turbines would in any case be below cut-in. The result is fewer repeated restarts and shutdowns but much longer total time spent in idling.
The dynamic cases remain much closer to the baseline than the static schedules in terms of total downtime but not in terms of transition count. Dynamic10 increases the total number of start-up/shutdown events from 3141 in the baseline case to 3679, which is almost the same level as Static100 and only slightly below Static99. In contrast, its total downtime increases only to 2889 h, remaining far below all static cases. Extending the shutdown duration to 30 min (Dynamic30) reduces the total number of transitions to 3543, i.e., fewer than all static cases and only slightly above the baseline. At the same time, total downtime increases only moderately to 2967 h, again remaining much closer to the baseline than to any static schedule. This behavior indicates that extending the event-triggered shutdown duration mainly merges closely spaced detections into longer consecutive non-producing periods, thereby reducing repeated restarts and shutdowns without causing a proportional increase in total downtime. As in the static cases, longer enforced shutdown periods also overlap more frequently with intervals when wind speed is below the cut-in speed, further limiting additional transitions while extending continuous idling periods. These differences in operational patterns are important for interpreting the corresponding energy losses and channel-dependent fatigue responses discussed in the following section.
3.2 Farm-level effects on cumulative energy and fatigue
To compare the evaluated curtailment strategies with the baseline, the relative change in any quantity X is calculated as
where X denotes either the farm-level cumulative energy production or the cumulative fatigue damage of a given load channel.
Figure 11 shows the resulting relative differences in cumulative fatigue damage over the full 2-year period for all considered channels, summarized as box plots across turbines. Overall, for most bat protection operational strategies, the differences relative to the baseline case remain small. For most channels, cumulative fatigue damage is reduced by a few percent. The main exceptions are tower-top side-side bending (TTSS), blade-root flapwise bending (BRFW), and main-shaft bending about y (MSBMY), which increase for most strategies.
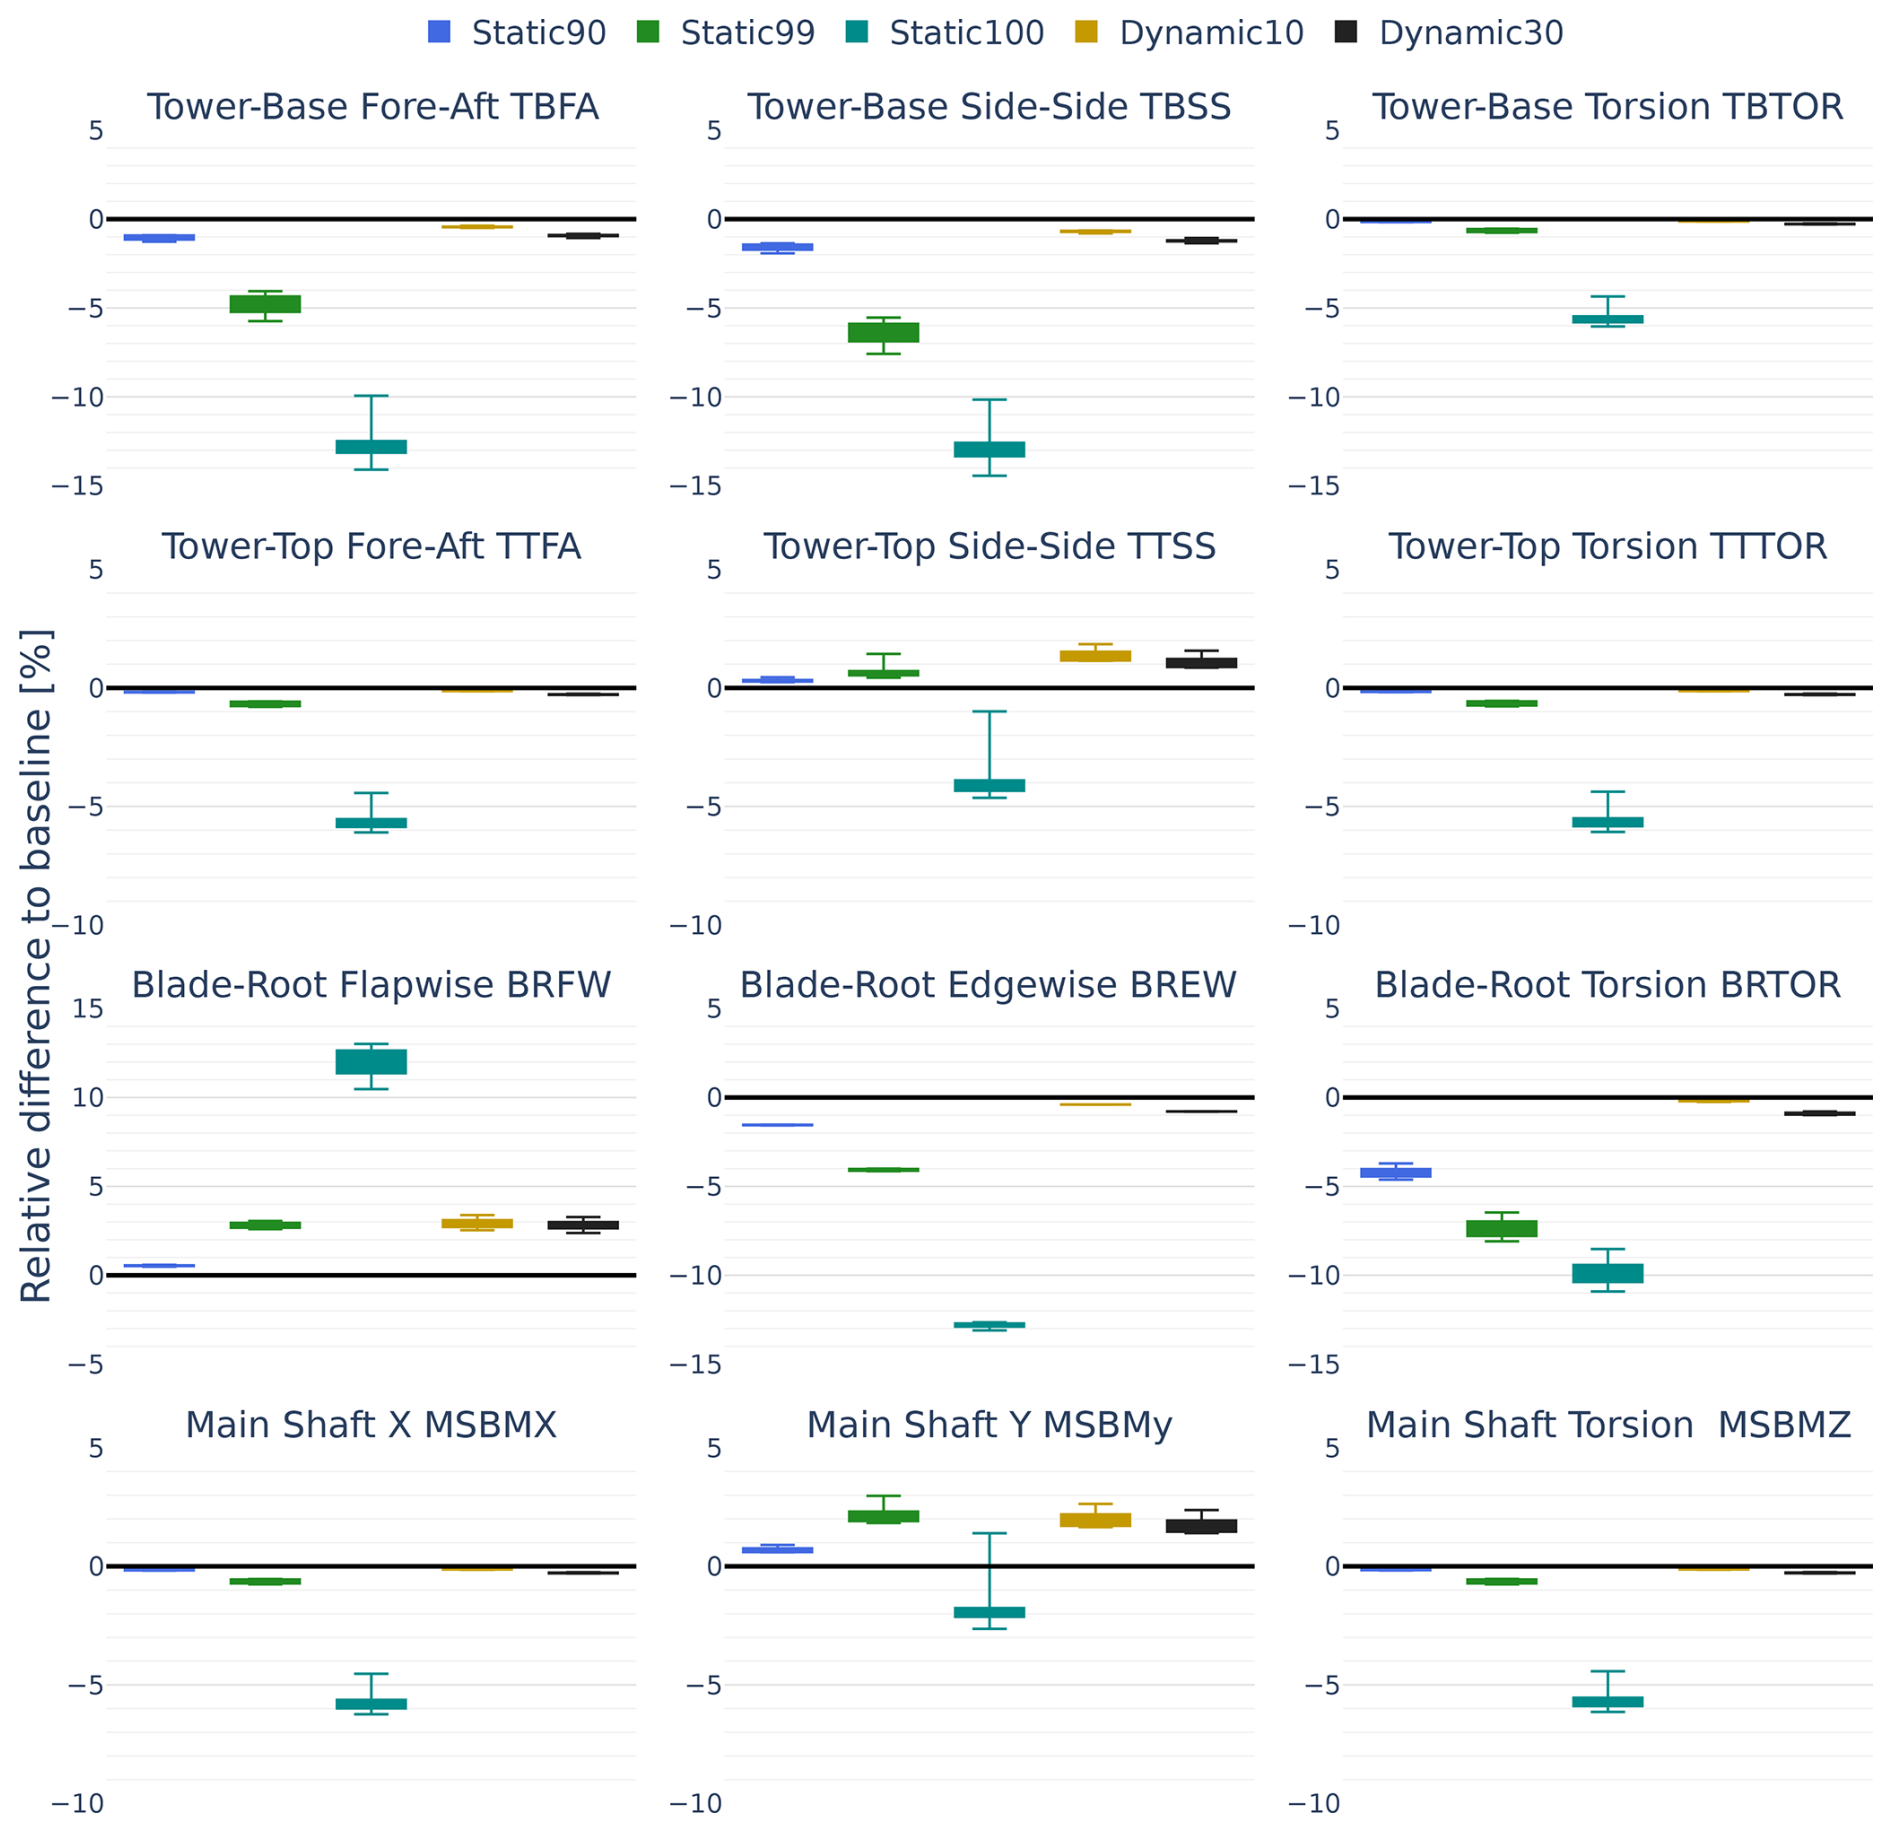
Figure 11Relative differences in cumulative fatigue damage with respect to the baseline case for the full evaluation period. Each subplot corresponds to one load channel, and box plots summarize the distribution across turbines for the evaluated strategies. The box spans the 25th to 75th percentiles, and the whiskers denote the minimum and maximum values.
The largest reductions are observed for TBFA, TBSS, BREW, and BRTOR. For these channels, the dynamic strategies produce only minor changes, typically below about 2 %, whereas the static strategies show a clearer reduction that increases with the target protection level. This behavior is consistent with the aeroelastic trends discussed in Sect. 2.2. These channels experience low loading during idling compared to normal operation, so longer idling periods reduce the cumulative damage, while the start-up and shutdown loads remain comparable to or lower than normal operation over most of the relevant inflow range. Consequently, the extended non-producing periods of the static schedules progressively lower cumulative fatigue damage.
A second group of channels – TBTOR, TTFA, TTTOR, MSBMX, and MSBMZ – is only weakly affected by the considered strategies. Both static and dynamic cases remain within about 2 % of the baseline for most conditions, with more noticeable reductions observed for Static100. For these channels, the lower loading during idling is partly offset by start-up and shutdown loads that can be comparable to or locally exceed those during normal operation. Since normal operation still dominates the operational history in all cases, these competing effects largely cancel out unless downtime becomes very large.
In contrast, TTSS, MSBMY, and BRFW, show consistent increases under most of the considered strategies, although the changes generally remain below approximately 4 %. These channels are more sensitive to start-up and shutdown maneuvers and, in the case of BRFW, also experience comparatively high loading during idling. Therefore, the additional transitions introduced by curtailment can outweigh the fatigue reduction associated with reduced time in normal operation. This effect becomes particularly pronounced for BRFW under Static100, where the increase reaches roughly 10 %–13 % across all turbines.
The pronounced BRFW increase for Static100 is not explained by the total number of transitions alone, which is comparable to Static99 and the dynamic cases. The broader environmental activation window leads to a larger fraction of transitions occurring at higher wind speeds. This is illustrated in Fig. 12, which presents the distributions of start-up and shutdown events over wind speed and TI. In the Static100 case, the broader blanket window produces more transition events at wind speeds of about 7 m s−1 and above than in the other strategies, where start-up and shutdown loads are substantially larger, particularly when combined with elevated TI. This leads to increased accumulated fatigue despite the extended downtime. More generally, this result indicates that the fatigue impact of curtailment depends not only on the number of transient events but also on the operating conditions under which they occur.
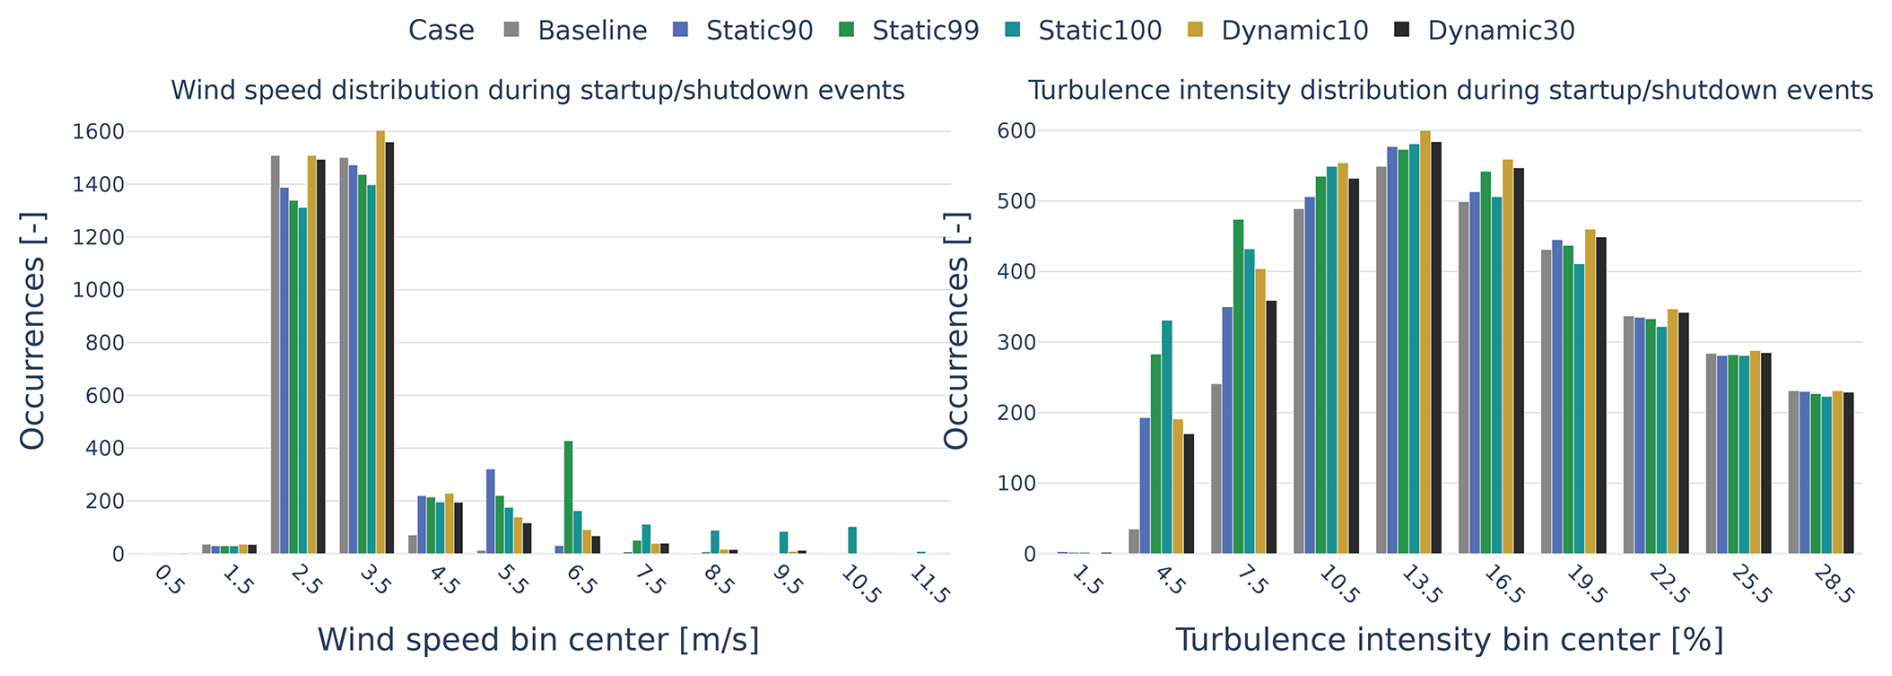
Figure 12Histograms of ambient wind speed (left) and turbulence intensity (right) at the times of start-up/shutdown events, aggregated over the full evaluation period for all evaluated cases.
Comparing the two dynamic strategies, they remain close to one another, with Dynamic10 tending to produce slightly higher fatigue damage for several channels, consistent with its larger number of transitions and shorter enforced idling periods. Across the static strategies, increasing the target protection level, and consequently the downtime, generally produces larger reductions for channels that benefit from idling. For channels that are more sensitive to start-up and shutdown, this pattern can reverse, as the contribution of transient-event loading and its dependence on wind conditions become more important.
Overall, these results show that the fatigue impact of bat protection is governed by the balance between three competing effects: reduced time in normal operation, increased time in idling together with the channel-dependent loading level in that state, and the additional loading introduced by start-up and shutdown maneuvers (with responses dependent on the wind conditions and the channel). For most channels and strategies, this balance leads to only small changes relative to baseline under the assumptions and site-specific data of the present study. This suggests that, from the perspective of fatigue-driven lifetime, most of the considered strategies would not be expected to produce a substantial overall effect for the majority of the assessed responses. However, for channels particularly sensitive to maneuver-related loads, broad blanket curtailment windows can still create adverse effects. This underlines the importance of evaluating bat protection strategies considering channel-resolved load metrics; realistic operating conditions during curtailment; and a realistic representation of loading behavior under normal operation, idling, start-up, and shutdown.
The spread across turbines remains below approximately 3 % for nearly all channels and strategies, indicating that the modeled fatigue trends are broadly consistent across the wind farm rather than driven by isolated turbines. Larger spreads are observed mainly for a few channels under Static100, which is consistent with the earlier interpretation that this strategy triggers a larger fraction of start-up and shutdown events under higher wind speed and TI conditions. When combined with local differences in effective inflow among turbines, these more-severe operating conditions can lead to greater variability in the accumulated response. The generally limited spread is consistent with the site characteristics: a relatively small onshore 13-turbine farm, the modest baseline variation among turbines within the adopted wake-model representation, and the uniform farm-wide shutdown requests. This implies comparatively weak wake-induced heterogeneity under the prevailing wind directions and the given layout, so applying uniform farm-wide shutdown requests is not expected to substantially alter the relative distribution of loading among turbines. Larger farms, stronger spatial wake heterogeneity, or partial-shutdown strategies could produce greater turbine-to-turbine differences.
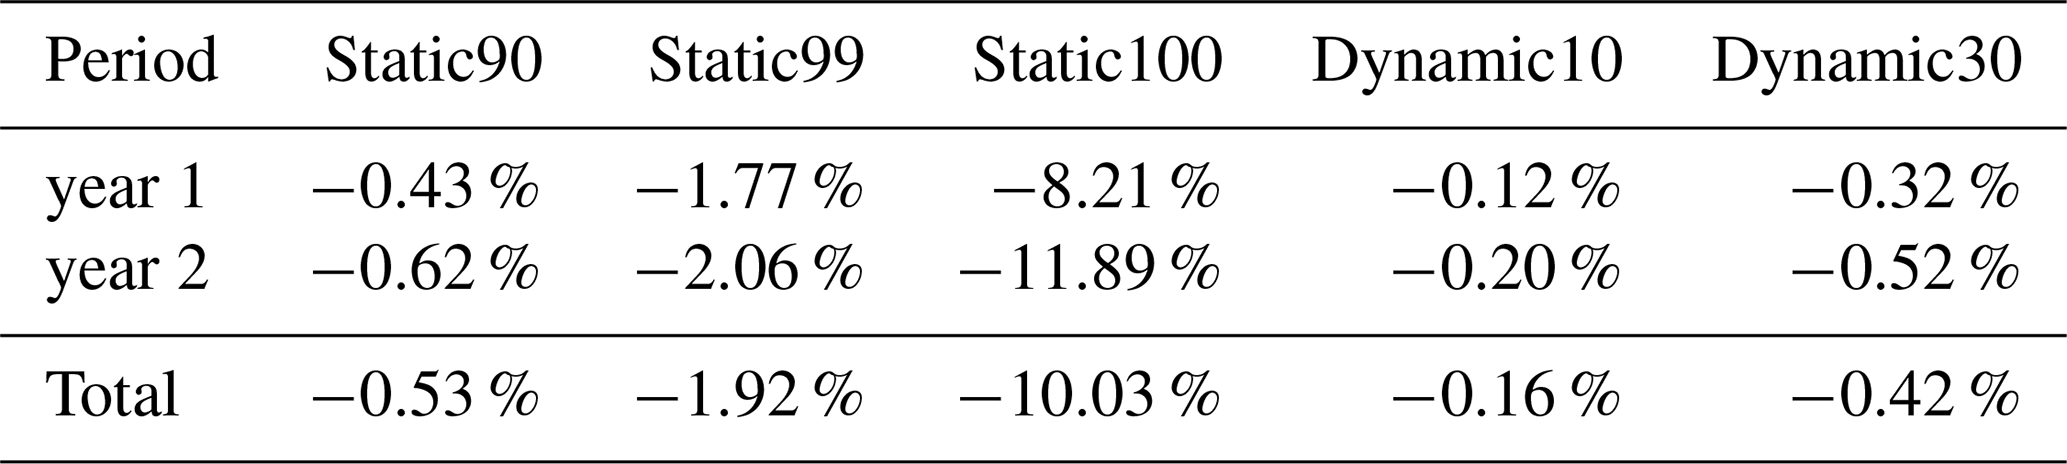
The relative differences in cumulative energy production are summarized in Table 4. Under a fixed feed-in tariff assumption, these differences directly translate to differences in revenue. Unlike the channel-dependent fatigue response, the energy response is monotonic and follows the total downtime in Sect. 3.1. Over the 2-year period, Dynamic10 and Dynamic30 produce the smallest losses, at 0.16 % and 0.42 %, respectively, compared with 0.53 % for Static90 and 1.92 % for Static99. Static100 results in a loss of 10.03 % and can be regarded as a boundary case illustrating the practical limitations of overly conservative blanket curtailment, leading to production losses that would be difficult for an operator to absorb and highlighting why less-restrictive schedules are typically adopted in practice.
Table 4Relative differences in total wind farm energy production with respect to the baseline case for each evaluated strategy. Values are reported separately for year 1, year 2, and for the full 2-year period.
From a practical decision-making perspective, the combined results of energy production and fatigue damage suggest that the dominant trade-off is financial for the present case study for wildlife protection. The fatigue results show that, for most channels and strategies, the additional impact remains small, and that differences between static and dynamic strategies are in most cases within about 2 %. Such differences are considered within the uncertainty bounds of the current modeling chain and hence are considered insufficient to make fatigue the primary decision criterion for the cases considered here. In this regard, all strategies except Static100 can be considered broadly load neutral for the present application, considering the assumptions and case-specific data used in this study. The final choice, however, also depends on implementation costs: static strategies require expert evaluation of temporary monitoring campaigns and may need periodic readjustment, whereas dynamic strategies require procurement and installation of sensing equipment, controller integration, and continued maintenance. These additional operational and implementation costs are not quantified here, but together with the projected energy losses they define the practical decision space.
3.3 Interannual variability
Interannual variability is assessed by comparing year-specific deviations from the baseline case for the operational, energy, and fatigue metrics. For each strategy, Table 5 summarizes the additional number of start-up/shutdown events and downtime together with representative fatigue responses, while Table 4 reports the corresponding relative differences in farm-level cumulative energy production. The 2 years differ in the number of 10 min intervals with recorded bat activity and in the wind and turbulence conditions under which curtailment-related operating states and transitions occur.
Table 5Interannual summary of relative values with respect to the baseline case. Reported are the additional total number of start/stop events (ΔNSS), additional downtime (ΔTdown), and median relative difference in cumulative fatigue damage across turbines for three representative channels: tower-bottom fore-aft bending moment (TBFA), blade-root flapwise bending moment (BRFW), and main-shaft bending moment about y (MSBMY). Fatigue values are expressed in percent (%).
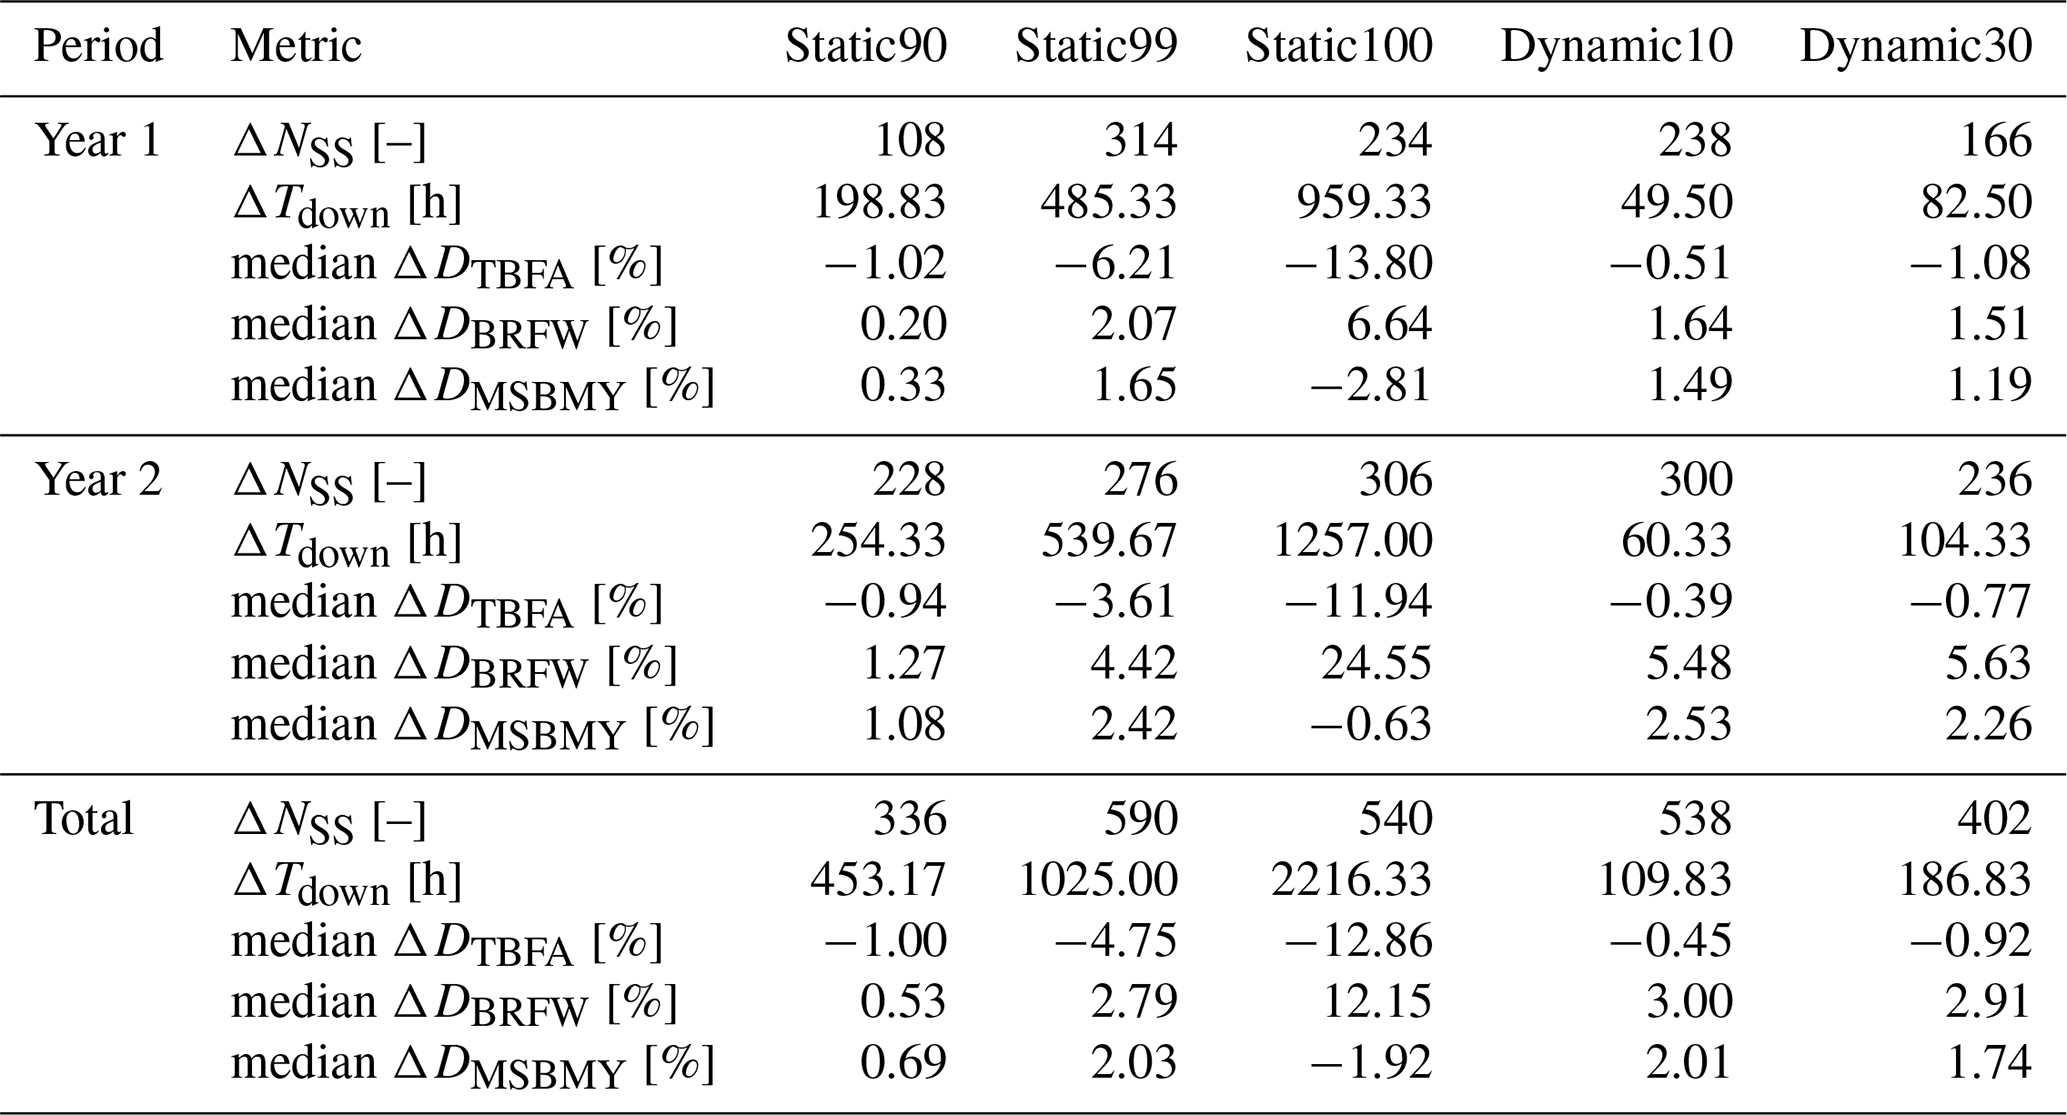
Across all strategies, the second year exhibits larger operational and production impacts than the first year. The additional downtime and associated energy losses are consistently higher in year 2 than in year 1 for both static and dynamic strategies, while the ranking of strategies by energy losses remains unchanged. This is consistent with energy production being primarily governed by the total time spent in non-producing states, as discussed in Sect. 3.1, indicating that year-to-year variability affects the magnitude of energy losses without altering the qualitative ordering among the evaluated cases.
In contrast, the interannual response of cumulative fatigue damage is more channel dependent. The representative tower-bottom fore-aft channel (TBFA) remains consistently reduced relative to baseline across both years and all strategies, indicating a robust load-relieving effect for this response under curtailment. Conversely, the blade-root flapwise channel (BRFW) shows substantially stronger year sensitivity, with larger positive deviations in year 2 than in year 1 for both static and dynamic cases. The main-shaft bending response about y (MSBMY) exhibits an intermediate behavior, with year-to-year changes that are noticeable but less pronounced than for BRFW. These differences indicate that the interannual variability of fatigue effects is not a uniform scaling across all responses but depends on the underlying loading mechanisms of each channel and on how curtailment-induced transitions and idling periods are distributed across inflow conditions.
From a practical perspective, the year-to-year differences observed here imply that the technical impacts of a given bat protection strategy should be expected to vary over the operational lifetime of a wind farm. While energy impacts remain comparatively straightforward to anticipate from total downtime, fatigue impacts can vary more strongly for channels that are sensitive to start-up and shutdown maneuvers and to the operating conditions under which these events occur. This reinforces the importance of evaluating strategies over multiple years where possible and motivates treating interannual variability as a contributor to uncertainty in impact assessment and decision-making.
The proposed framework relies on modeling choices that enable consistent long-horizon, wind-farm-scale evaluation but also introduce uncertainty that should be considered when interpreting the results. The wake model is calibrated to site-specific conditions. However, predicting TI accurately with engineering wake models remains challenging, and TI is an important driver of structural loads for several load channels and operating modes. In addition, the use of rotor-averaged inflow descriptors cannot represent partial-wake structure, which can be important in farms with stronger wake effects. This may alter the distribution of inflow conditions across the farm and, in turn, fatigue accumulation. Structural response is evaluated using surrogate models trained on aeroelastic simulations of a generic turbine/controller configuration, which introduces additional uncertainty due to the lack of an OEM-specific model and controller. Although key maneuver characteristics were tuned to match observed field behavior, the load response can be highly sensitive to turbine design and control details. Finally, turbine operation is represented through discrete operational modes at a 10 min resolution, which is necessary for tractable long-horizon evaluation but limits the fidelity of within-interval dynamics. These assumptions are required to make multi-year comparisons computationally feasible and transparent. Thus, the quantitative outcomes should be interpreted as conditional on the adopted modeling chain and primarily used to assess relative trends and strategy comparisons within that consistent setup.
A particularly important limitation – and a broader research gap beyond the present bat protection application – concerns the representation of start-up and shutdown transients under realistic operational variability. Modern wind farms increasingly experience frequent curtailments driven not only by wildlife protection but also by other operational constraints. However, there is currently no standardized methodology for translating such transient events into fatigue-relevant metrics under the 10 min resolution at which SCADA data are commonly available. Existing standards (e.g., IEC 61400-1, International Electrotechnical Commission, 2019) provide only limited guidance for these use cases: fatigue contribution from start-ups and shutdowns is typically addressed through simplified, non-turbulent simulations over short time windows (in the order of 100 s at selected wind speeds) and by accounting for an assumed number of events per year. This leaves open how to represent event timing within a 10 min interval (e.g., when exactly the actuation should be triggered within this 10 min), how to model transients under turbulent inflow, and how to consistently accumulate their contributions in long-horizon fatigue evaluation. The present study adopts a pragmatic transient representation, informed by field observations, to enable consistent multi-year comparisons; the sensitivity of several responses to transient loading and to the conditions under which transitions occur underscores the need for improved, field-informed approaches. Future work should therefore focus on high-frequency field measurements of start/stop trajectories and loads, standardized protocols for mapping transient events to SCADA resolution, and validated reduced-order or surrogate models specifically designed for transient operating regimes.
Real wind farm operation is more complex than the operating history representation adopted in this study. Beyond bat protection, turbines experience downtime and curtailment due to bird and noise protection, maintenance, grid constraints, and many other operational requirements. Turbine behavior can also evolve over time due to component degradation, maintenance interventions, and changes in aerodynamic performance (e.g., leading-edge erosion). These effects are not represented here, since the intent is to isolate the incremental impact of bat protection strategies under a consistent operational baseline and enable transparent relative comparisons between strategies. In practice, additional downtime mechanisms and long-term performance changes may alter the absolute energy and fatigue budgets, and could modify the relative contribution of bat protection strategies.
The results indicate that dynamic bat protection can be attractive, as it can significantly reduce downtime and energy losses relative to blanket strategies while maintaining a broadly load-neutral response for most channels in the present case study. However, the evaluation of dynamic control here relies on simplified assumptions about sensing coverage and turbine-controller interaction, since details of the actual field implementation were not available. The practical performance depends on how detections are translated into control actions and on the reliability and spatial representativeness of the sensing system. A key factor is the effective reset behavior after detections, i.e., how long curtailment remains active once bat activity ceases and whether this is based purely on fixed time windows or on additional information. Another factor is sensing coverage, including whether a single device can reliably represent risk over the full farm or whether multiple sensors and redundancy are required. Performance also depends on how curtailment commands interact with the turbine control system, and how shutdown and start-up maneuvers are executed (e.g., brake use and maneuver trajectory), since these choices influence both transition loading and the duration of downtime.
Finally, false positives can increase unnecessary transitions and associated fatigue contributions, whereas false negatives can reduce the intended bat protection level and may affect regulatory compliance. The present study assumes farm-wide representativeness of the available monitoring signal and applies uniform shutdown requests to all turbines. Future analyses should therefore consider sensing redundancy, spatially differentiated control (including partial shutdown), direct comparisons between dynamic and static control schedules to assess whether the broader environmental and temporal coverage of static schedules can provide protection during events missed by dynamic approaches, and field-informed parameterization of dynamic control timing and turbine response.
The quantitative trade-offs reported here are case specific and depend on a set of influencing parameters that vary across sites and turbine types. The frequency and duration of bat activity, the local wind climate, and associated interannual variability determine how often curtailment is triggered and under which inflow conditions start-up and shutdown events occur for both static and dynamic strategies. The results showed that these conditions can matter as much as the number of events, because transition loads can increase strongly with wind speed and may have a different dependence on turbulence intensity than normal-operation loads. Turbine and controller characteristics further shape the load response. Farm layout and the related strength of wake effects also influence the distribution of loads among turbines and components. These dependencies highlight the difficulty of generalizing the present findings and underscore the importance of site-specific evaluation to assess the technical impact of bat protection strategies, which is enabled by the proposed methodology.
As discussed, multiple sources of uncertainty affect the magnitude of the reported effects. In addition, cumulative fatigue damage is evaluated here using a simplified damage metric, and several in-field factors that drive fatigue and reliability are not accounted for. Therefore, the small changes in fatigue observed in this case study should not be treated as the primary criterion for selecting a bat protection strategy at a given wind farm. Instead, strategy selection requires a multi-criteria assessment that accounts for projected energy production losses, implementation, operation, and maintenance costs, and the robustness of the bat protection levels to ensure regulatory compliance over time. To support such decision-making, uncertainty quantification for both energy production and fatigue impacts is needed to characterize the confidence bounds of the predicted trade-offs. Combining these uncertainty bounds with multi-criteria decision frameworks can enable economically informed decisions while reducing technical risk and supporting asset reliability.
Based on the analysis in this study, several pathways to optimize bat protection strategies can be identified. Since start-up and shutdown loads are sensitive to wind speed and turbulence intensity, one potential improvement is to apply condition-aware logic so that, once a curtailment period ends, turbine restart is initiated only when wind speed and/or turbulence intensity fall within favorable ranges. Implementing such logic requires additional aeroelastic analysis to identify inflow regimes in which maneuver-related loads are minimized for a given turbine and controller design. In parallel, OEM-level optimization of the turbine control trajectory during start-up and shutdown (e.g., pitch scheduling, generator torque control, and brake usage) could reduce the fatigue contribution from frequent transitions.
A further pathway is to consider hybrid strategies that combine a relaxed static schedule with dynamic triggering. These approaches could reduce curtailment frequency during periods of consistently high activity while maintaining high protection levels and avoiding unnecessary downtime outside those periods. Spatially differentiated operation is another promising extension. Partial shutdown based on multiple sensors, farm zoning, or turbine-level risk classification could improve the balance between protection effectiveness, production loss, and technical impacts, particularly in larger wind farms.
Finally, in wind farms with pronounced wake interactions, wind farm flow-control strategies such as wake steering or induction control could be explored to offset part of the production losses associated with bat protection, provided that their additional load impacts remain acceptable. Together, these directions highlight opportunities for both industry and academia to develop bat protection strategies that better balance ecological objectives with operational constraints and asset reliability.
Wildlife protection curtailment is increasingly required at operating wind farms for ecological and regulatory reasons. While curtailment strategies are commonly assessed using production-based indicators, their operational implementation can introduce frequent start-ups and shutdowns that may affect structural loading and long-term fatigue accumulation at the turbine and farm level. The purpose of this study was therefore to enable a realistic, data-driven evaluation of both production and structural effects under bat protection operation, and to apply the evaluation consistently to representative static (blanket) and dynamic (event-triggered) strategies on the same site dataset.
To address this need, an evaluation methodology was developed that combines (i) long-term environmental and bat activity time series, (ii) wind-farm flow modeling to estimate turbine-wise effective inflow, (iii) mode-dependent surrogate models of aeroelastic fatigue response for normal operation and curtailment-related operating states, and (iv) operational logic that reproduces the evolution of turbine operating modes over time. This enables multi-year simulations in which farm-level energy production and load-specific fatigue metrics are aggregated consistently across all turbines and major components. A central methodological aspect is the explicit representation of start-up and shutdown states, which allows the cumulative impact of transient events to be assessed alongside downtime effects.
Applying the methodology to the case study in France, several key findings and contributions emerge. First, evaluating static and dynamic strategies on the same dataset enables a directly comparable assessment of their operational, production, and loading consequences. Second, energy losses are substantially lower for the evaluated dynamic strategies than for the considered static blanket schedules, including the most relaxed static case. Energy impacts are strongly correlated with total downtime, yielding a largely monotonic response across strategies. Third, cumulative fatigue impacts are channel dependent and, for this case study, remain small for most load channels and strategies. A slight tendency for dynamic strategies to yield higher cumulative fatigue is observed, but the magnitude is small and comparable to the uncertainty level of the present evaluation chain. At the same time, the analysis identifies specific sensitivities: a subset of load responses that are most affected by curtailment-induced transients, and which exhibit a strong dependence on wind speed and turbulence intensity, can increase when the distribution of start-up and shutdown events shifts toward higher wind speed and turbulence conditions. In particular, blade-root flapwise loading is highlighted as a sensitive response under the strictest static schedule, where prolonged curtailment windows lead to more transitions under higher wind speed and turbulence regimes. Fourth, the study provides an understanding of what drives fatigue under bat protection operation. The cumulative response depends on the aeroelastic behavior of the specific turbine and controller in transient states, the number of start/stop events and their distribution over wind speed and turbulence intensity, and the time spent in idling, which in many channels reduces fatigue accumulation due to lower loading relative to normal operation. Finally, interannual variability is found to be significant. While the qualitative classification of strategies remains consistent, the magnitude of both production and fatigue impacts can vary from year to year, reinforcing the value of multi-year assessment when available.
These findings support decision-making by clarifying which effects are likely to dominate strategy selection. For the present case study, the choice among realistic strategies is primarily driven by production impacts, since most fatigue indicators remain close to baseline and small percent-level differences should be interpreted cautiously given the uncertainty of the calculation chain. Nevertheless, energy loss alone is not sufficient as a decision criterion, because transition-sensitive load responses can exhibit increased fatigue under certain operational patterns and inflow conditions. In practice, selecting an operational strategy therefore requires a multi-criteria perspective that considers production losses, technical risks, implementation and operational costs, robustness of the protection approach, and regulatory compliance over time. The methodology developed here can support such site-specific decision-making by quantifying operational patterns, production impacts, and channel-resolved technical effects under consistent assumptions.
The study also identifies general gaps that require further research. A key gap is the representation of fatigue contributions from repeated start-up and shutdown transients in long-horizon evaluations under the 10 min resolution typical of SCADA data. This work proposes a practical approach to represent these events in a consistent manner, but more detailed, field-informed, and standardized methodologies are needed to better match real operational behavior and to support broader adoption across applications beyond bat protection. In addition, uncertainty quantification is needed to characterize confidence bounds for both production and fatigue impacts, and to provide decision-relevant measures of risk and robustness when comparing strategies.
Finally, several improvement pathways can be explored based on the sensitivities identified in this work. These include (i) tuning controller trajectories during start-up and shutdown to minimize transient loading under relevant operating conditions, (ii) evaluating hybrid strategies that combine relaxed static schedules with dynamic triggering to balance downtime and transitions, (iii) implementing condition-aware restart logic where turbine start-up is delayed until more favorable inflow conditions occur, (iv) extending dynamic strategies toward spatially differentiated operation (including partial shutdown supported by multiple sensors), and (v) where applicable, coupling bat protection operation with wind farm control strategies that can recover part of the production loss. Together, these directions motivate future studies by both industry and academia aimed at maintaining bat protection while limiting production losses and supporting asset reliability.
The calibration relies on the widely adopted Gaussian–Curl–Hybrid wake model (King et al., 2021), the Crespo–Hernandez turbulence model (Crespo and Hernández, 1996), and the sum-of-squares superposition approach in FLORIS (Fleming et al., 2023). By simultaneously tuning wake parameters that define the wake shape and learning the terrain-induced speed-up field, a flow field is reconstructed that closely approximates the actual conditions for each wind speed and wind direction bin. For this study, 12 spatially distributed FLORIS flow-model parameters are calibrated for each of the 12 sectors with 30° wind direction bins covering the full 360°. These parameters represent speed-up factors that define the background flow across the wind farm. For any given wind direction, the corresponding values are linearly interpolated at each node location. The positions of these speed-up nodes are shown in Fig. 2. In total, 144 flow parameters and 10 global wake parameters are simultaneously calibrated using 1 year of operational wind farm data and the methodology described in Braunbehrens et al. (2023). This method minimizes a cost function based on residuals between simulated and measured power, and applies singular-value decomposition to discard non-identifiable parameter combinations.
The resulting calibrated wake parameters for the site are summarized in Table A1.
Table A1Tuned wake parameters of the Gaussian velocity deficit, the deflection model, and the Crespo–Hernandez turbulence model.

This appendix provides the detailed neural-network implementation and the complete independent test-set evaluation of the spline and NN surrogate models. The spline formulation and the basis for selecting it for the long-horizon analysis are described in Sect. 2.3.
B1 Neural-network implementation
Feedforward neural-network surrogates are implemented in Keras with hyperparameter optimization carried out using the Hyperband algorithm (Li et al., 2018) from the Keras Tuner library. Each network is a shallow two-hidden-layer sequential model accepting RAWS and RATI as inputs and predicting a single DEL channel, a deliberate architectural constraint motivated by the small size of the available training datasets. Both inputs and outputs are normalized using min–max scaling prior to training, with separate scalers fitted per operational mode and per load channel. The Hyperband search explored the number of units in each hidden layer (8–32, step 4), the activation function per layer (relu, tanh, or sigmoid), and the Adam learning rate (10−4–10−2, log-uniform), with Glorot uniform kernel initialization applied throughout. The search was conducted independently for all four operational modes and all 12 DEL channels. The final surrogate models were selected as the best-validated trial per mode-channel combination, and their corresponding architectures are summarized in Table B1.
Table B1“Best” neural-network architectures identified per operational mode and DEL channel. All networks have two hidden layers; n1 and n2 denote the number of units in the first and second hidden layer, respectively.
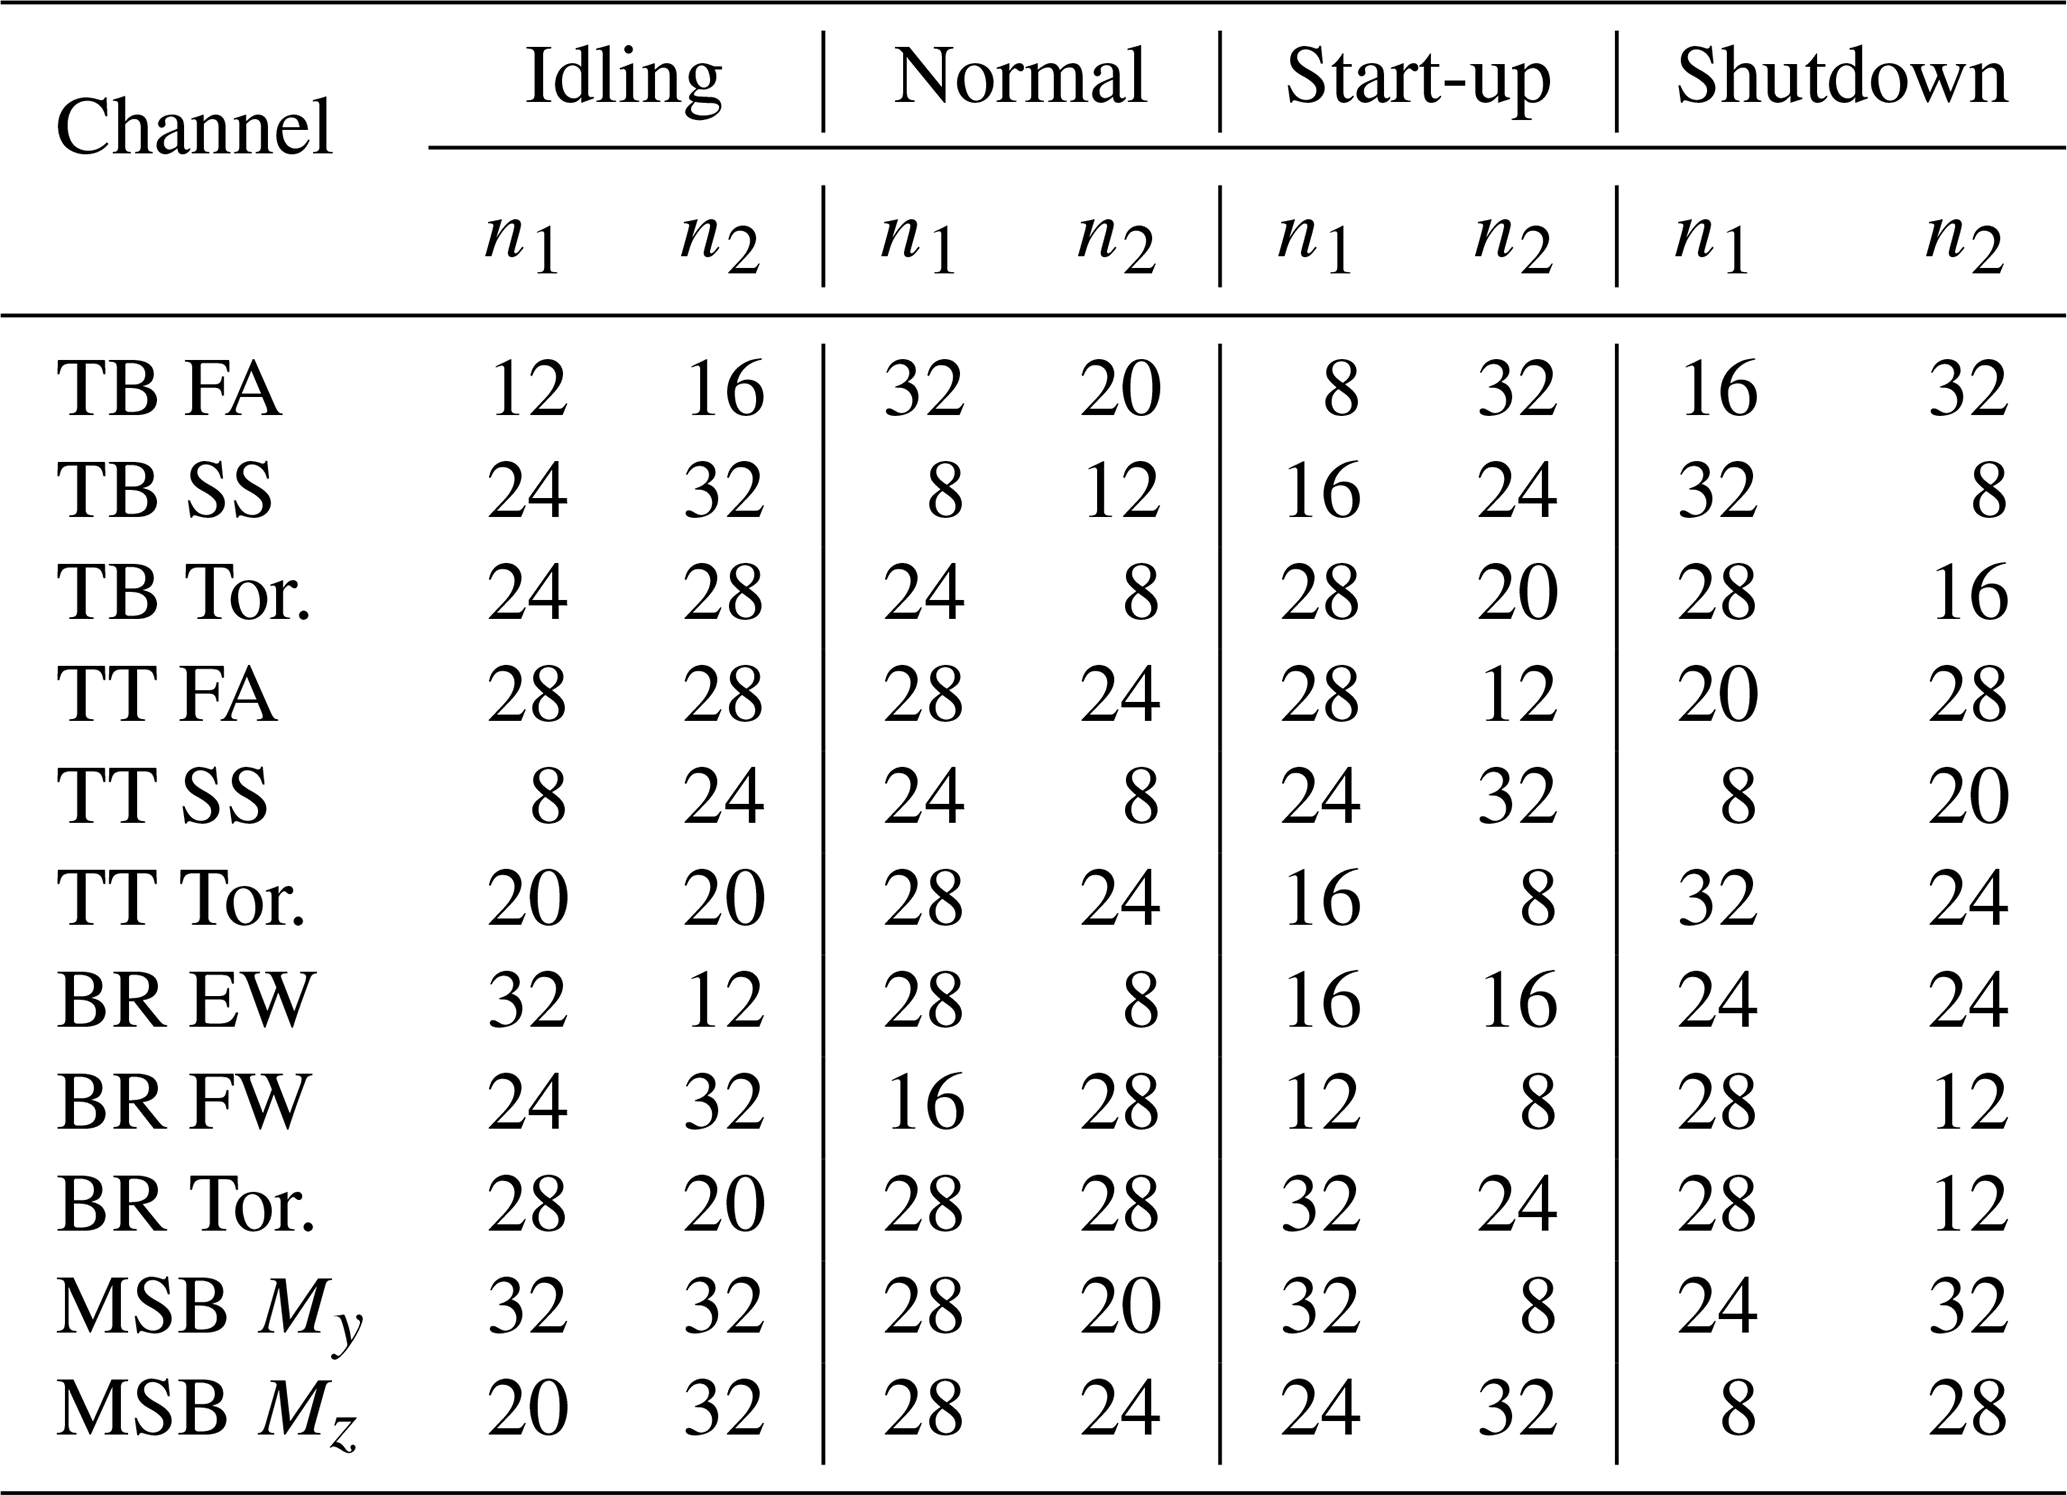
B2 Surrogate-model evaluation
Figure B1 summarizes the predictive error distribution for each operational mode and regression method using channel-wise error statistics. The comparison is used to assess both the general accuracy level achieved in each mode and the consistency of performance across channels. Detailed cumulative error metrics across all channels and operating modes are reported in Appendix B (Tables B2–B5).
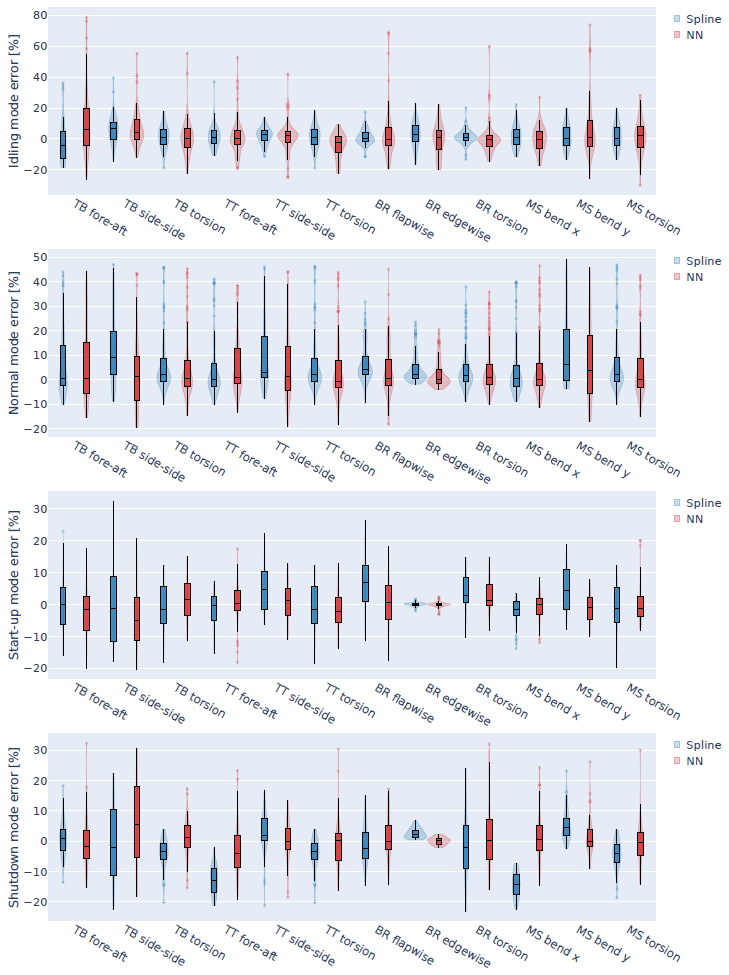
Figure B1Comparison of surrogate-model accuracy on the independent test set for spline interpolation and neural networks. Violin plots summarize the distribution of signed percentage errors across channels for each operational mode. Overlapping box plots show mean along with 25th and 75th percentiles. The 2 % of the distribution tails have been trimmed to improve readability.
Across operational modes and channels, spline interpolation and the NN approach show broadly comparable central error tendencies, whereas differences are more apparent in the dispersion and tail behavior of the error distributions in Fig. B1. In several channels, NN predictions exhibit wider distributions and heavier tails than the corresponding spline predictions, even after trimming extreme values for readability. This behavior may reflect increased sensitivity of the NN regression to limited training data and to the low-dimensional input space. The spline formulation, constrained by the structured two-dimensional input grid, tends to provide a more stable interpolation with fewer extreme deviations for the considered datasets.
Differences between operational modes reflect both data density and the nature of the simulated response represented within each 10 min interval. Normal operation is supported by the largest simulation dataset and corresponds to a steady producing state, in which aerodynamic loading and damping effects are present throughout the interval and no operating-state transition occurs. This generally leads to a smoother target response and reduced seed-to-seed variability, and therefore more concentrated error distributions than in the transitional modes. Idling corresponds to reduced aerodynamic loading and low rotational speed, resulting in substantially lower load magnitudes. Consequently, percentage errors can appear comparatively large for some channels even when absolute deviations are small. In addition, several idling responses are dominated by turbulence-driven oscillations, which can increase output variability and thus make the regression harder. For the normal and idling modes, the signed error distributions show a tendency toward positive deviations in many channels, indicating that over-prediction occurs more frequently than under-prediction for parts of the input space. In contrast, start-up and shutdown exhibit wider and flatter error distributions for many channels, along with more pronounced channel-specific biases in some cases. This is consistent with the stronger influence of maneuver-driven transients and subsequent oscillations within the evaluation interval, which increase seed-to-seed variability at fixed inflow conditions and make the interval-level DEL response more difficult to approximate. The smaller training datasets available for start-up and shutdown contribute further to this effect, particularly for the NN regressor.
Differences among channels and modes are expected due to the underlying physical drivers of the response. Channels dominated by gravity and rotational-speed effects with comparatively weak sensitivity to TI (for example, blade-root edgewise moment) tend to exhibit lower relative error across modes because the target response varies more smoothly over the inflow space and shows less variability between turbulence seeds. In contrast, channels that are more sensitive to TI and may be subject to resonance effects at low wind speeds or under low aerodynamic damping conditions (for example, tower-bottom bending moments) exhibit greater intrinsic variability and therefore broader error distributions and occasional biases, especially in the transitional start-up and shutdown modes where the response is influenced by the imposed maneuver and post-maneuver oscillations. In general, when the target response is noisy, spline smoothing can yield larger approximation errors, whereas more flexible regressors such as NNs can become more sensitive to limited data due to overfitting.
Tables B2–B5 report surrogate-model performance on the independent Latin Hypercube test sets for each operational mode, comparing spline interpolation and neural-network regressors across the considered load channels. Reported metrics include the mean error (ME) and median error (MedianErr) as signed bias indicators; the mean absolute error (MAE) and median absolute error (MedianAE) as magnitude-based error measures; the mean absolute percentage error (MAPE) and median absolute percentage error (MedianAPE) as relative error measures; the normalized, with the range of values, root mean square error (NRMSErange) as a scale-independent accuracy measure; and the coefficient of determination (R2) as a goodness-of-fit measure. For each metric and channel, the best-performing method is highlighted (smallest absolute value for error-based metrics; highest value for R2).
Table B2Error metrics on the independent test set for normal operation (spline vs. NN). The best value between spline and NN is highlighted for each metric.
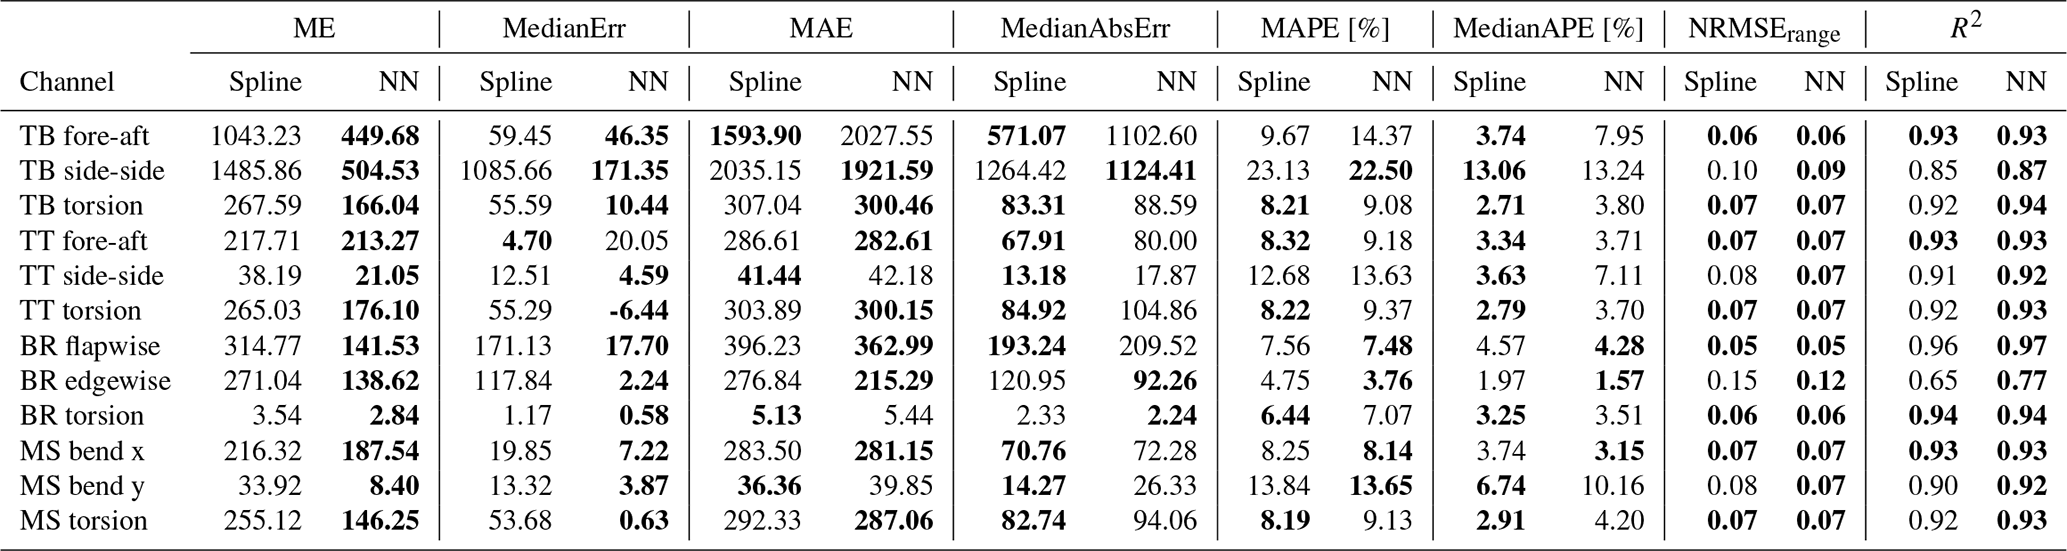
Table B3Error metrics on the independent test set for idling operation (spline vs. NN). The best value between spline and NN is highlighted for each metric.
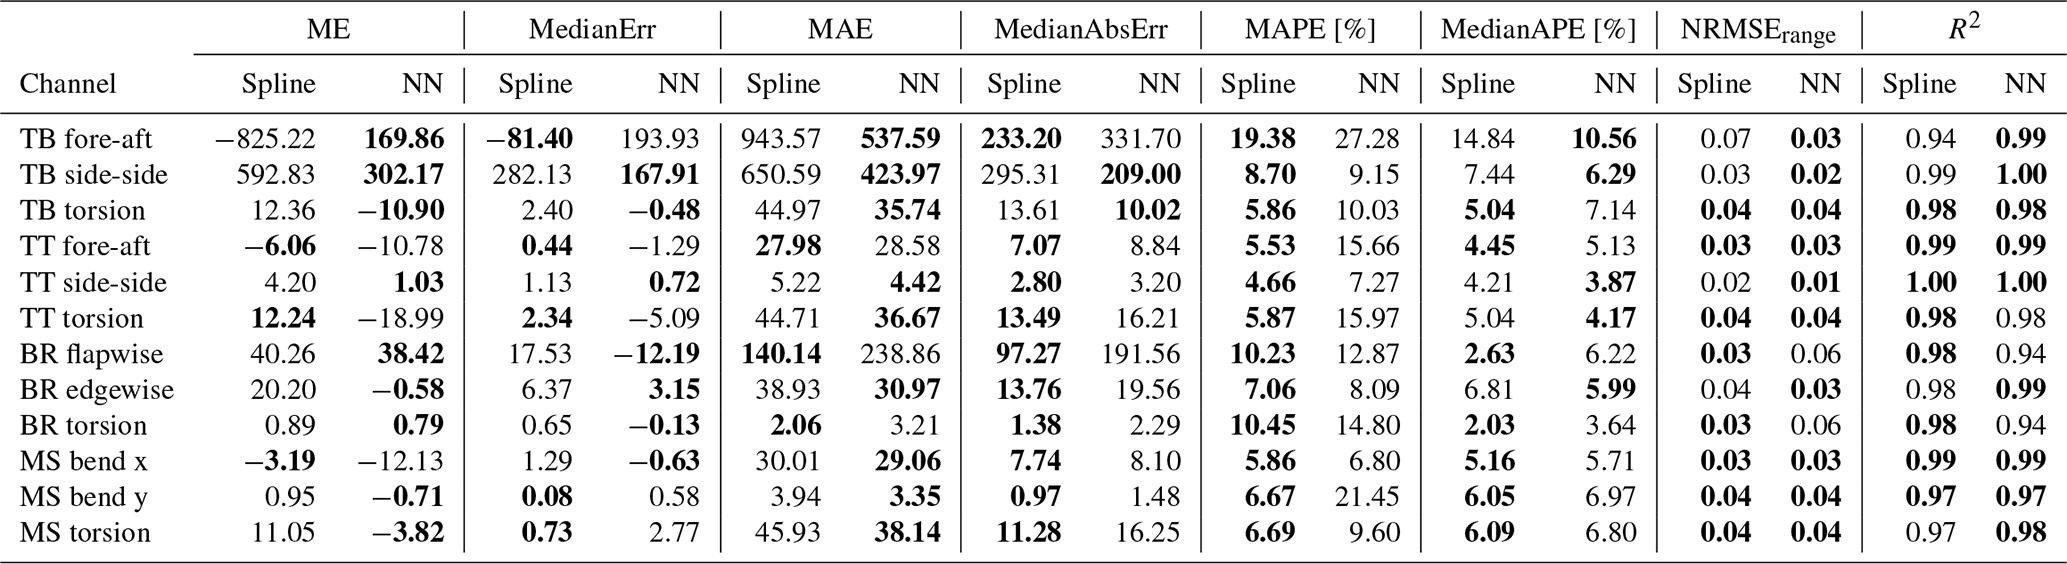
Table B4Error metrics on the independent test set for start-up operation (spline vs. NN). The best value between spline and NN is highlighted for each metric.
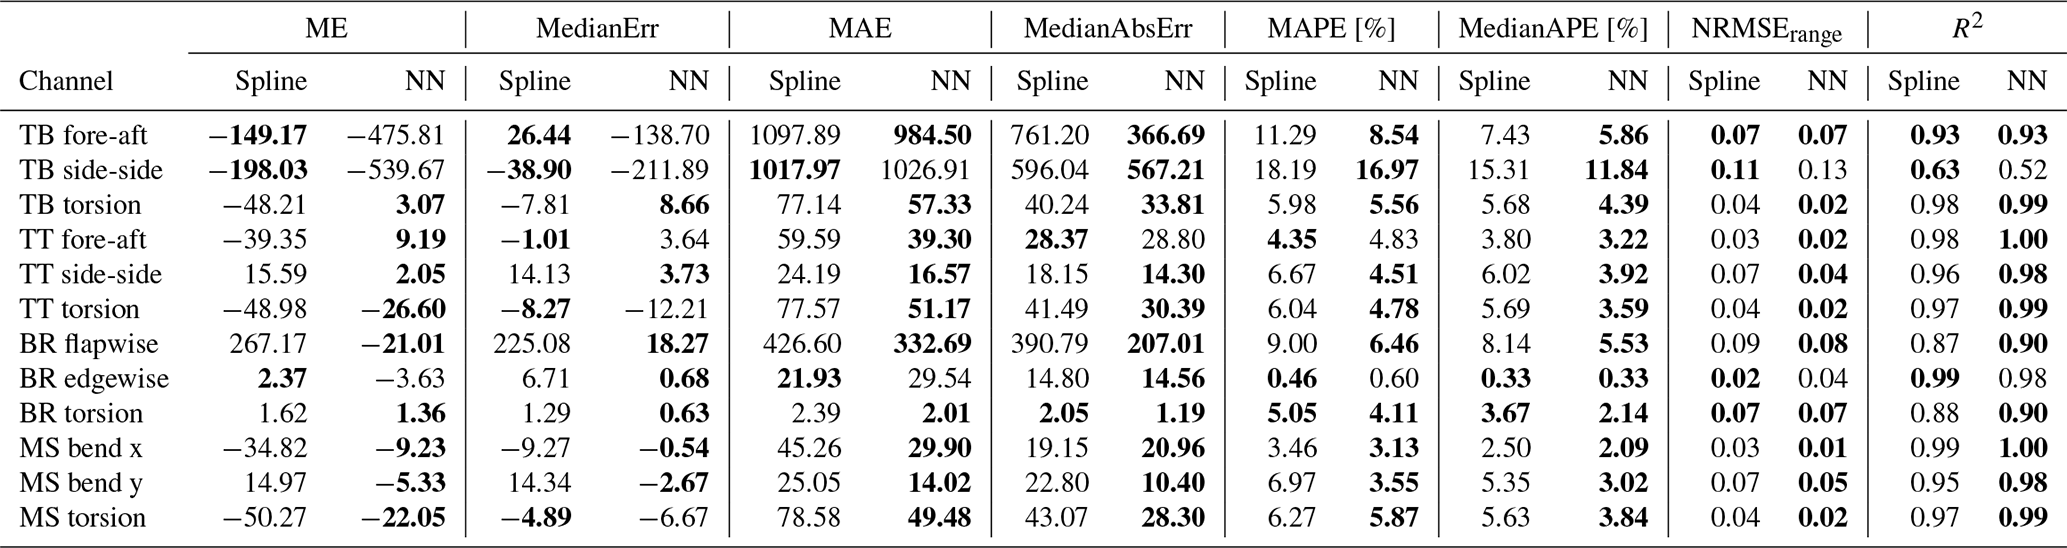
Table B5Error metrics on the independent test set for shutdown operation (spline vs. NN). The best value between spline and NN is highlighted for each metric.
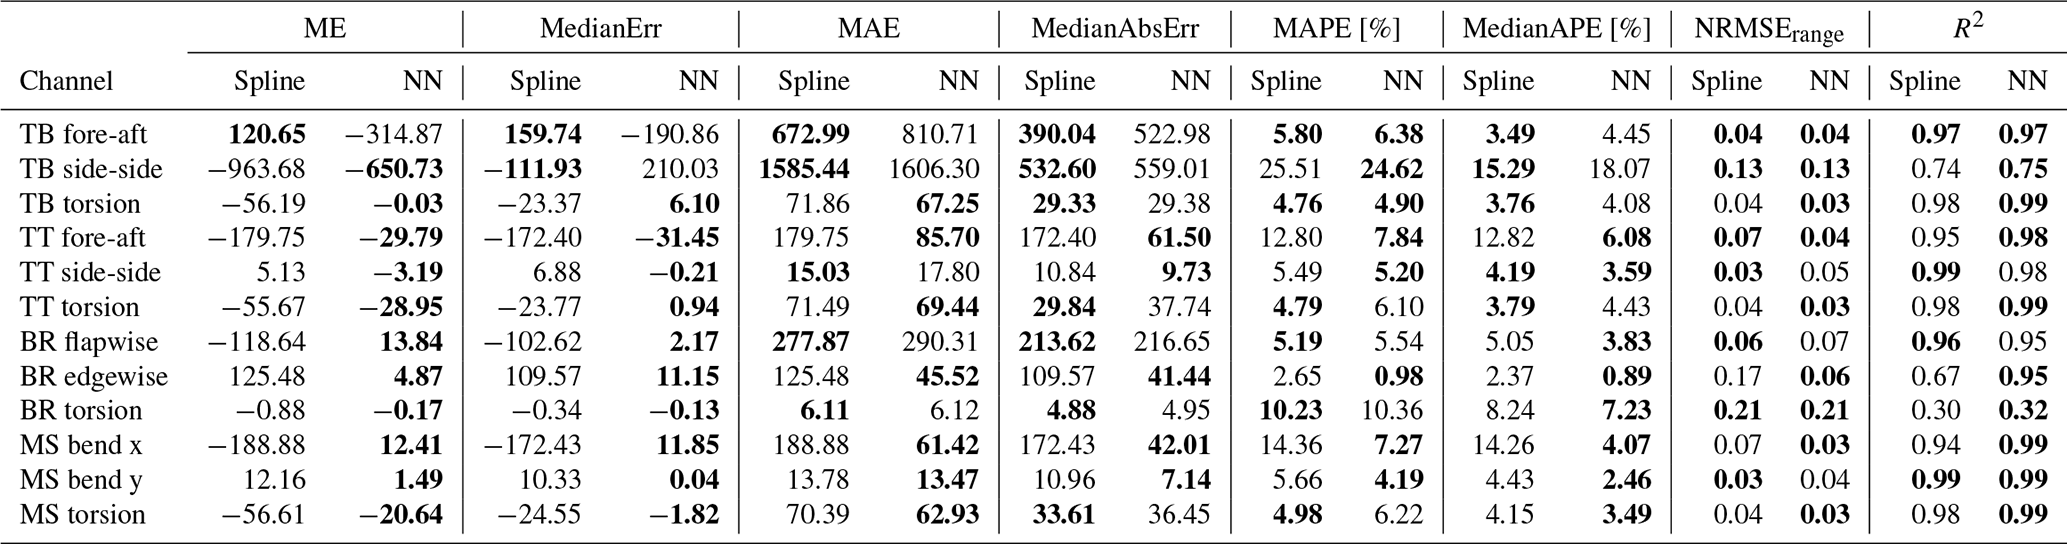
The developed evaluation framework is part of the WINPACT impact assessment tool developed by DTU and is available at https://doi.org/10.5281/zenodo.17641606 (Gräfe et al., 2025). The FLORIS extension developed by TUM is part of the wind farm response framework and is available at https://doi.org/10.5281/zenodo.18633504 (Vad et al., 2026b). The wind farm and bat activity measurement data are not publicly available due to confidentiality.
VP: conceptualization, method development, software implementation, data analysis, visualization, results interpretation, and writing (initial draft and review). TG: conceptualization, method development, data analysis, results interpretation, and writing (assigned sections and full review). TD: conceptualization, method development, data preparation, results interpretation, and writing (assigned sections and full review). AVA: wind-farm flow modeling, processing of environmental conditions, and writing (assigned sections). AVU: wind-farm flow modeling, processing of environmental conditions, and review.
The contact author has declared that none of the authors has any competing interests.
Publisher's note: Copernicus Publications remains neutral with regard to jurisdictional claims made in the text, published maps, institutional affiliations, or any other geographical representation in this paper. The authors bear the ultimate responsibility for providing appropriate place names. Views expressed in the text are those of the authors and do not necessarily reflect the views of the publisher.
This work has been supported by the TWAIN project, which receives funding from the European Union's Horizon Europe Programme under grant agreement no. 101122194. SCADA and bat activity data have been kindly provided by ENGIE Green.
This research has been supported by EU Horizon Europe Climate, Energy and Mobility (grant no. 101122194).
This paper was edited by Shawn Sheng and reviewed by two anonymous referees.
Adams, E. M., Gulka, J., and Williams, K. A.: A review of the effectiveness of operational curtailment for reducing bat fatalities at terrestrial wind farms in North America, PLoS ONE, 16, https://doi.org/10.1371/journal.pone.0256382, 2021. a
Ardillon, E., Bakhoday Paskyabi, M., Cousin, A., Dimitrov, N., Dupoiron, M., Eldevik, S., Fekhari, E., Ferreira, C., Guiton, M., Jezequel, B., Joulin, P.-A., Lovera, A., Mayol, L., and Penchah, M. R.: Turbine Loading and Wake Model Uncertainty, D3-2, European Union, https://hal.science/hal-04096504 (last access: 25 August 2026), 2023. a
Arnett, E. B. and May, R. F.: Mitigating wind energy impacts on wildlife: approaches for multiple taxa, Human–Wildlife Interactions, 10, 28–41, https://www.jstor.org/stable/10.2307/24874154 (last access: 25 August 2026), 2016. a
Arnett, E. B., Huso, M. M., Schirmacher, M. R., and Hayes, J. P.: Altering turbine speed reduces bat mortality at wind-energy facilities, Front. Ecol. Environ., 9, 209–214, https://doi.org/10.1890/100103, 2011. a
Bennett, E. M., Florent, S. N., Venosta, M., Gibson, M., Jackson, A., and Stark, E.: Curtailment as a successful method for reducing bat mortality at a southern Australian wind farm, Austral Ecol., 47, 1329–1339, https://doi.org/10.1111/aec.13220, 2022. a
BirdLife International: BirdLife Position on Wind Energy and Birds and Bats in the European Union, Position paper, EU Birds and Habitats Directive Task Force, BirdLife International, https://ornithologiki.gr/images/ekdoseis/pdf/2016_Wind_energy_birds_and_bats_BirdLife.pdf (last access: 25 August 2026), 2016. a, b
Bortolotti, P., Tarres, H. C., Dykes, K., Merz, K., Sethuraman, L., Verelst, D., and Zahle, F.: IEA Wind Task 37 on Systems Engineering in Wind Energy – WP2.1 Reference Wind Turbines, Tech. rep., International Energy Agency, https://www.osti.gov/biblio/1529216 (last access:25 August 2026), 2019. a
Braunbehrens, R., Vad, A., and Bottasso, C. L.: The wind farm as a sensor: learning and explaining orographic and plant-induced flow heterogeneities from operational data, Wind Energ. Sci., 8, 691–723, https://doi.org/10.5194/wes-8-691-2023, 2023. a, b
Crespo, A. and Hernández, J.: Turbulence characteristics in wind-turbine wakes, J. Wind Eng. Ind. Aerod., 61, 71–85, https://doi.org/10.1016/0167-6105(95)00033-X, 1996. a
Cryan, P. M., Gorresen, P. M., Hein, C. D., Schirmacher, M. R., Diehl, R. H., Huso, M. M., Hayman, D. T. S., Fricker, P. D., Bonaccorso, F. J., Johnson, D. H., Heist, K., and Dalton, D. C.: Behavior of bats at wind turbines, P. Natl. Acad. Sci. USA, 111, 15126–15131, https://doi.org/10.1073/pnas.1406672111, 2014. a
Doubrawa, P., Shaler, K., and Jonkman, J.: Difference in load predictions obtained with effective turbulence vs. a dynamic wake meandering modeling approach, Wind Energ. Sci., 8, 1475–1493, https://doi.org/10.5194/wes-8-1475-2023, 2023. a
ecoObs GmbH: batcorder 3.1: Automatic recording of bat calls in real-time, Product webpage, https://ecoobs.com/batcorder.html (last access: 10 March 2026). a
Ellerbrok, J. S., Farwig, N., Peter, F., Rehling, F., and Voigt, C. C.: Forest gaps around wind turbines attract bat species with high collision risk, Biol. Conserv., 288, https://doi.org/10.1016/j.biocon.2023.110347, 2023. a
Elmeros, M. and Møller, J. D.: Flagermus, vindmøller og solceller: Uddybning af udvalgte emner i Håndbog om dyrearter på Habitatdirektivets bilag IV, del 2, Fagligt notat (rådgivningsnotat) 2025|07, Aarhus Universitet, DCE – Nationalt Center for Miljø og Energi, institut for Ecoscience. Rekvirent: Miljøstyrelsen (nu Styrelsen for Grøn Arealomlægning og Vandmiljø), https://pure.au.dk/portal/da/publications/flagermus-vindmøller-og-solceller-uddybning-af-udvalgte-emner-i-h/ (last access: 25 August 2026), 2025. a
Fleming, P., Annoni, J., and Mudafort, R.: FLORIS v3.5 Wake Modeling and Wind Farm Controls Software [SWR-17-43 and SWR-14-20], https://doi.org/10.11578/dc.20230807.1, 2023. a, b
Frick, W. F., Whitby, M., Wilson, D., MacEwan, K. L., Hulka, S., Akre, K. L., and O'Mara, M. T.: A global decision framework for reducing bat fatalities at wind energy facilities, Ecological Solutions and Evidence, 7, e70189, https://doi.org/10.1002/2688-8319.70189, 2026. a
Garcia-Rosa, P. B. and Tande, J. O. G.: Mitigation measures for preventing collision of birds with wind turbines, J. Phys. Conf. Ser., 2626, 012072, https://doi.org/10.1088/1742-6596/2626/1/012072, 2023. a
Gräfe, M., Pettas, V., and Dimitrov, N.: WINPACT (Version v1.0.0), Zenodo [code], https://doi.org/10.5281/zenodo.17641606, 2025. a
Gräfe, M., Pettas, V., Ioannou, A., Kolios, A., and Dimitrov, N.: Wind farm project valuation under revenue-driven farm control considering life time extension, J. Phys. Conf. Ser., 3224, 062063, https://doi.org/10.1088/1742-6596/3224/6/062063, 2026. a
Groupe Chiroptères de la SFEPM: Diagnostic chiroptèrologique des projets éoliens terrestres: Actualisation 2016 des recommandations de la SFEPM, Tech. rep., Société Française pour l'Étude et la Protection des Mammifères (SFEPM), Paris, France, https://www.sfepm.org/sites/default/files/inline-files/20160201_diagnostic_V2.1.pdf (last access: 25 August 2026), 2016. a
Guilloré, A., Chaudhary, A., Anand, A., Vad, A., Shah, A. H., Pettas, V., Göçmen, T., and Bottasso, C. L.: Efficient generation of location-agnostic wind turbine load surrogate models using wake slices, J. Phys. Conf. Ser., 3224, 032106, https://doi.org/10.1088/1742-6596/3224/3/032106, 2026. a
Guilloré, A., Campagnolo, F., and Bottasso, C. L.: A control-oriented load surrogate model based on sector-averaged inflow quantities: capturing damage for unwaked, waked, wake-steering and curtailed wind turbines, J. Phys. Conf. Ser., 2767, 032019, https://doi.org/10.1088/1742-6596/2767/3/032019, 2024. a
Hayes, M. A., Hooton, L. A., Gilland, K. L., Grandgent, C., Smith, R. L., Lindsay, S. R., Collins, J. D., Schumacher, S. M., Rabie, P. A., Gruver, J. C., and Goodrich-Mahoney, J.: A smart curtailment approach for reducing bat fatalities and curtailment time at wind energy facilities, Ecol. Appl., 29, https://doi.org/10.1002/eap.1881, 2019. a
Hersbach, H., Bell, B., Berrisford, P., Hirahara, S., Horányi, A., Muñoz Sabater, J., Nicolas, J., Peubey, C., Radu, R., Schepers, D., Simmons, A., Soci, C., Abdalla, S., Abellan, X., Balsamo, G., Bechtold, P., Biavati, G., Bidlot, J.-R., Bonavita, M., De Chiara, G., Dahlgren, P., Dee, D., Diamantakis, M., Dragani, R., Flemming, J., Forbes, R., Fuentes, M., Geer, A., Haimberger, L., Healy, S., Hogan, R. J., Hólm, E., Janisková, M., Keeley, S., Laloyaux, P., Lopez, P., Lupu, C., Radnoti, G., de Rosnay, P., Rozum, I., Vamborg, F., Villaume, S., and Thépaut, J.-N.: The ERA5 global reanalysis, Q. J. Roy. Meteor. Soc., 146, 1999–2049, https://doi.org/10.1002/qj.3803, 2020. a
International Electrotechnical Commission: Wind energy generation systems – Part 1: Design requirements, IEC 61400-1:2019, https://webstore.iec.ch/en/publication/26423 (last access: 25 August 2026), 2019. a
King, J., Fleming, P., King, R., Martínez-Tossas, L. A., Bay, C. J., Mudafort, R., and Simley, E.: Control-oriented model for secondary effects of wake steering, Wind Energ. Sci., 6, 701–714, https://doi.org/10.5194/wes-6-701-2021, 2021. a
Kunz, T. H., Arenett, E. B., Cooper, B. M., Erickson, W. P., Larkin, R. P., Mabee, T., Morrisson, M. L., Strickland, M. D., and Szewzcak, J. M.: Assessing Impacts of Wind‐Energy Development on Nocturnally Active Birds and Bats: A Guidance Document, J. Wildlife Manage., 71, 2449–2486, https://doi.org/10.2193/2007-270, 2007. a
Larsen, T. and Hansen, A.: How 2 HAWC2, the user's manual, no. 1597 (ver. 3-1) (EN) in Denmark. Forskningscenter Risoe. Risoe-R, Risø National Laboratory, ISBN 978-87-550-3583-6, 2007. a
Leger, C.: Study on optimizing French wind farms bat curtailment plans: reducing production losses while protecting bats, MS thesis, KTH School of industrial engineering and management, https://urn.kb.se/resolve?urn=urn:nbn:se:kth:diva-346343 (last access: 25 August 2026), 2024. a, b
Li, L., Jamieson, K., DeSalvo, G., Rostamizadeh, A., and Talwalkar, A.: Hyperband: A Novel Bandit-Based Approach to Hyperparameter Optimization, J. Mach. Learn. Res., 18, 1–52, https://jmlr.org/papers/v18/16-558.html (last access: 25 August 2026), 2018. a, b
Luan, C. and Moan, T.: On Short-Term Fatigue Analysis for Wind Turbine Tower of Two Semi-Submersible Wind Turbines Including Effect of Startup and Shutdown Processes, J. Offshore Mech. Arct., 143, 012003, https://doi.org/10.1115/1.4047542, 2021. a
Maclaurin, G., Hein, C., Williams, T., Roberts, O., Lantz, E., Buster, G., and Lopez, A.: National-scale impacts on wind energy production under curtailment scenarios to reduce bat fatalities, Wind Energy, 25, 1514–1529, https://doi.org/10.1002/we.2741, 2022. a
Mann, J.: Wind field simulation, Probabilist. Eng. Mech., 13, 269–282, 1998. a
Măntoiu, D. Ş., Kravchenko, K., Lehnert, L. S., Vlaschenko, A., Moldovan, O. T., Mirea, I. C., Stanciu, R. C., Zaharia, R., Popescu-Mirceni, R., Nistorescu, M. C., and Voigt, C. C.: Wildlife and infrastructure: impact of wind turbines on bats in the Black Sea coast region, Eur. J. Wildlife Res., 66, 44, https://doi.org/10.1007/s10344-020-01378-x, 2020. a
Marques, A. T., Batalha, H., Rodrigues, S., Costa, H., Pereira, M. J. R., Fonseca, C., Mascarenhas, M., and Bernardino, J.: Understanding bird collisions at wind farms: An updated review on the causes and possible mitigation strategies, Biol. Conserv., 179, 40–52, https://doi.org/10.1016/j.biocon.2014.08.017, 2014. a
Martin, C. M., Arnett, E. B., Stevens, R. D., and Wallace, M. C.: Reducing bat fatalities at wind facilities while improving the economic efficiency of operational mitigation, J. Mammal., 98, 378–385, https://doi.org/10.1093/jmammal/gyx005, 2017. a
Meng, F., Lio, W. H., and Barlas, T.: DTUWEC: an open-source DTU Wind Energy Controller with advanced industrial features, J. Phys. Conf. Ser., 1618, 022009, https://doi.org/10.1088/1742-6596/1618/2/022009, 2020. a
Miner, M. A.: Cumulative Damage in Fatigue, J. Appl. Mech., 12, A159–A164, https://doi.org/10.1115/1.4009458, 1945. a
Natarajan, A. and Buhl, T.: Variation of Loads on Offshore Wind Turbine Drivetrains During Measured Shutdown Events, Journal of Ocean and Wind Energy, 3, 46–52, https://doi.org/10.17736/jowe.2016.ilr05, 2016. a
NatureScot, Natural England, Natural Resources Wales, RenewableUK, ScottishPower Renewables, Ecotricity Ltd, University of Exeter, and Bat Conservation Trust (BCT): Bats and Onshore Wind Turbines: Survey, Assessment and Mitigation, Guidance document, https://www.nature.scot/bats-and-onshore-wind-turbines-survey-assessment-and-mitigation (last access: 25 August 2026), 2021. a
Newman, C., Solick, D., Fitchett, B., Nassary, P., Whitby, M., Frick, W., Huso, M., Hein, C., and Gottlieb, I.: Evaluation of the Turbine Integrated Mortality Reduction (TIMR) Technology as a Smart Curtailment Approach (Final Summary Report), Tech. rep., Golden Field Office, https://doi.org/10.2172/2397339, 2024. a
NIEA, Natural Environment Division: Guidance on Bat Surveys, Assessment & Mitigation for Onshore Wind Turbine Developments in Northern Ireland, Guidance document, Northern Ireland Environment Agency (NIEA), Natural Environment Division, Northern Ireland, UK, https://www.daera-ni.gov.uk/publications/niea-natural-environment-division (last access: 25 August 2026), 2021. a
Pettas, V.: Wind turbine operational optimization considering revenue and fatigue objectives, Dissertation, Universität Stuttgart, Stuttgart, Germany, https://doi.org/10.18419/opus-13959, 2024. a
Pettas, V. and Cheng, P. W.: Surrogate modeling and aeroelastic analysis of a wind turbine with down-regulation, power boosting, and IBC capabilities, Energies, 17, 1284, https://doi.org/10.3390/en17061284, 2024. a
Pettas, V., Gräfe, M., Dirik, D. G., Ramaswamy, H. R., Riva, R., Quick, J., and Réthoré, P.-E.: A framework to evaluate structural fatigue accumulation and health metrics of wind farms under different operational strategies, J. Phys. Conf. Ser., 3224, 032079, https://doi.org/10.1088/1742-6596/3224/3/032079, 2026. a, b
Porté-Agel, F., Bastankhah, M., and Shamsoddin, S.: Wind-turbine and wind-farm flows: A review, Bound.-Lay. Meteorol., 174, 1–59, https://doi.org/10.1007/s10546-019-00473-0, 2019. a
Rabie, P. A., Welch-Acosta, B., Nasman, K., Schumacher, S., Schueller, S., and Gruver, J.: Efficacy and cost of acoustic-informed and wind speed-only turbine curtailment to reduce bat fatalities at a wind energy facility in Wisconsin, PLOS ONE, 17, e0266500, https://doi.org/10.1371/journal.pone.0266500, 2022. a
Ramaswamy, H., Guilloré, A., Riva, R., Quick, J., Pettas, V., Murcia, J. P., Campagnolo, F., Bottasso, C. L., and Réthoré, P. E.: Comparison of wind turbine load surrogate model performances with multi-scale local inflow parameterization, J. Phys. Conf. Ser., 3224, 032073, https://doi.org/10.1088/1742-6596/3224/3/032073, 2026. a
Richardson, S. M., Lintott, P. R., Hosken, D. J., Economou, T., and Mathews, F.: Peaks in bat activity at turbines and the implications for mitigating the impact of wind energy developments on bats, Sci. Rep., 11, 3636, https://doi.org/10.1038/s41598-021-82014-9, 2021. a, b
Rnjak, D., Janeš, M., Krizan, J., and Antonić, O.: Reducing bat mortality at wind farms using site-specific mitigation measures: A case study in the Mediterranean region, Croatia, Mammalia, 87, 259–270, https://doi.org/10.1515/mammalia-2022-0100, 2023. a
Rodrigues, L., Bach, L., Dubourg-Savage, M.-J., Karapandža, B., Kovač, D., Mervyn, T., Dekker, J., Kepel, A., Bach, P., Collins, J., Harbusch, C., Park, K., Micevski, B., and Minderman, J.: Guidelines for consideration of bats in wind farm projects: Revision 2014, Tech. Rep. 6, UNEP/EUROBATS Secretariat, Bonn, Germany, ISBN 978-92-95058-31-6, 2015. a, b
Rydell, J., Bach, L., Dubourg-Savage, M. J., Green, M., Rodrigues, L., and Hedenström, A.: Bat mortality at wind turbines in northwestern Europe, Acta Chiropterol., 12, 261–274, https://doi.org/10.3161/150811010X537846, 2010. a, b
Rydell, J., Engström, H., Hedenström, A., Kyed Larsen, J., Pettersson, J., and Green, M.: The effect of wind power on birds and bats: A synthesis, Tech. Rep. Report 6511, Swedish Environmental Protection Agency (Naturvårdsverket), Stockholm, Sweden, ISBN 978-91-620-6511-9, 2012. a, b
Schuster, E., Bulling, L., and Köppel, J.: Consolidating the State of Knowledge: A Synoptical Review of Wind Energy's Wildlife Effects, Environ. Manage., 56, 300–331, https://doi.org/10.1007/s00267-015-0501-5, 2015. a
Sobchenko, A., Maynard, I., Kilpatrick, R., and LaFreniere, K.: Investigation on the Impacts of Smart Curtailment for Bat Fatality Mitigation in Alberta, Wind Energ. Sci. Discuss. [preprint], https://doi.org/10.5194/wes-2025-164, 2025. a
Thurber, B. G., Kilpatrick, R. J., Tang, G. H., Wakim, C., and Zimmerling, J. R.: Economic Impacts of Curtailing Wind Turbine Operations for the Protection of Bat Populations in Ontario, Wind, 3, 291–301, https://doi.org/10.3390/wind3030017, 2023. a
Vad, A., Guilloré, A., Anand, A., Pettas, V., Shah, A. H., Lizarraga-Saenz, I., Aparicio-Sanchez, M., Eguinoa, I., Conti Gost, N., Tsaklis, I., Frère, A., Hermans, K. W., Kamau, J. K., Dimitrov, N., Göçmen, T., and Bottasso, C. L.: Modeling wind farm response: a modular, integrated, and multi-stakeholder approach, Wind Energ. Sci. Discuss. [preprint], https://doi.org/10.5194/wes-2026-45, in review, 2026a. a
Vad, A., Anand, A., Guilloré, A., Lizarraga-Saenz, I., Aparicio-Sanchez, M., Conti Gost, N., Tsaklis, I., Göçmen, T., and Gonzalez Lope, R.: Code repositories of the wind farm response framework and data preparation scripts as supplement for the journal publication “Modeling wind farm response: a modular, integrated, and multi-stakeholder approach”, Zenodo [code], https://doi.org/10.5281/zenodo.18633504, 2026b. a
Vallejo, G., Saywers, D., Rodriguez, R., Quillen, J., and Denman, K.: Bat Smart Curtailment: Efficacy and Operational Testing, Department of Energy, Office of Energy Efficiency & Renewable Energy, Wind Energy Technologies Office (WETO), https://doi.org/10.2172/2212448, 2023. a
Voigt, C. C., Kaiser, K., Look, S., Scharnweber, K., and Scholz, C.: Wind turbines without curtailment produce large numbers of bat fatalities throughout their lifetime: A call against ignorance and neglect, Global Ecology and Conservation, 37, e02149, https://doi.org/10.1016/j.gecco.2022.e02149, 2022. a, b
Voigt, C. C., Bernard, E., Huang, J. C.-C., Frick, W. F., Kerbiriou, C., MacEwan, K., Mathews, F., Rodríguez-Durán, A., Scholz, C., Webala, P. W., Welbergen, J., and Whitby, M.: Toward solving the global green–green dilemma between wind energy production and bat conservation, BioScience, 74, 240–252, https://doi.org/10.1093/biosci/biae023, 2024. a, b
Wellig, S. D., Nusslé, S., Miltner, D., Kohle, O., Glaizot, O., Braunisch, V., Obrist, M. K., and Arlettaz, R.: Mitigating the negative impacts of tall wind turbines on bats: Vertical activity profiles and relationships to wind speed, PLOS ONE, 13, e0192493, https://doi.org/10.1371/journal.pone.0192493, 2018. a
Whitby, M. D., O'Mara, M. T., Hein, C. D., Huso, M., and Frick, W. F.: A decade of curtailment studies demonstrates a consistent and effective strategy to reduce bat fatalities at wind turbines in North America, Ecological Solutions and Evidence, 5, https://doi.org/10.1002/2688-8319.12371, 2024. a
Wulfert, K., Vaut, L., Lau, M., Köstermeyer, H., Blew, J., and Engel, E.: Artenschutz und rechtliche Neuregelungen zum Windenergieausbau an Land: Endbericht, Tech. Rep. 760, Bundesamt für Naturschutz (BfN), Bonn, Germany, ISBN 978-3-89624-524-3, https://doi.org/10.19217/skr760, 2025. a
Ziegler, L., Schulze, A., and Henning, M.: Optimization of curtailment intervals of wind turbines through assessment of measured loads during start-up and shutdown events, J. Phys. Conf. Ser., 2767, 032006, https://doi.org/10.1088/1742-6596/2767/3/032006, 2024. a, b
- Abstract
- Introduction
- Methodology and data
- Results and discussion
- Limitations and outlook
- Conclusions
- Appendix A: Flow model calibration
- Appendix B: Surrogate-model implementation and evaluation
- Code and data availability
- Author contributions
- Competing interests
- Disclaimer
- Acknowledgements
- Financial support
- Review statement
- References
- Abstract
- Introduction
- Methodology and data
- Results and discussion
- Limitations and outlook
- Conclusions
- Appendix A: Flow model calibration
- Appendix B: Surrogate-model implementation and evaluation
- Code and data availability
- Author contributions
- Competing interests
- Disclaimer
- Acknowledgements
- Financial support
- Review statement
- References