the Creative Commons Attribution 4.0 License.
the Creative Commons Attribution 4.0 License.
 | 28 Apr 2025
Comparison of wind farm control strategies under realistic offshore wind conditions: turbine quantities of interest
Joeri A. Frederik
Eric Simley
Kenneth A. Brown
Gopal R. Yalla
Lawrence C. Cheung
Paul A. Fleming
Wind farm flow control is a strategy to increase the efficiency and therefore lower the levelized cost of energy of a wind farm. This is done using turbine settings such as the yaw angle, blade pitch angles, or generator torque to manipulate the flow behind the turbine, affecting downstream turbines in the farm. Two inherently different wind farm flow control methods have been identified in the literature: wake steering and wake mixing. This paper focuses on comparing the turbine quantities of interest between these methods for a simple two-turbine wind farm setup, while a companion article (Brown et al., 2025) focuses on the wake quantities of interest for a single wind turbine setup. Both papers use the same set of wind farm simulations based on high-fidelity large-eddy simulations (LESs) coupled with OpenFAST turbine models. First, precursor simulations are executed in order to match wind conditions measured with lidars in an offshore wind farm off the east coast of the USA. These measurements show general wind conditions that exhibit substantially higher vertical wind shear and veer than any of the LES studies performed with wind farm flow control strategies currently available in the literature. The precursors are used to evaluate the effectiveness of the control methods. In the LES, the wind veer leads to highly skewed wakes, which have considerable influence on the power uplift of wind farm flow control strategies. In addition to a baseline controller, four different control strategies, each of which uses either pitch or yaw control, are performed on the upstream turbine of a simple two-turbine wind farm. Assuming that the wind direction is known and constant over time, the simulations show that wake steering is generally the superior wind farm flow control strategy, considering both wind farm power production and turbine damage equivalent loads when substantial wind veer is present. This result is consistent over different wind speeds and wind directions. On the other hand, for similar wind conditions with lower veer, wake mixing was found to yield the highest power production, although at the expense of generally higher loads. This leads us to conclude that the effect of wind veer, which has so far not usually been considered, can not be neglected when determining the optimal wind farm flow control strategy.
Please read the corrigendum first before continuing.
-
Notice on corrigendum
The requested paper has a corresponding corrigendum published. Please read the corrigendum first before downloading the article.
-
Article
(5652 KB)
-
The requested paper has a corresponding corrigendum published. Please read the corrigendum first before downloading the article.
- Article
(5652 KB) - Full-text XML
- Corrigendum
- Companion paper
- BibTeX
- EndNote


Dozens to hundreds of wind turbines are commonly placed closely together in wind farms. While this decreases installation and maintenance costs and increases power capacity for the available installation area, it also comes at a price. As turbines extract energy from the wind, they create a wake, in which the wind speed is lower and the turbulence is higher. When turbines are installed close together in wind farms, some form of interaction between turbines and their wakes is inevitable. A downstream turbine located partially or fully in the wake of another turbine subsequently produces lower power while experiencing higher loads.
Field studies have shown that the average loss of power from these waked turbines is in the range of 20 %–40 % with respect to their upstream counterparts (Nygaard, 2014; El-Asha et al., 2017). For low-turbulence wind conditions, this loss can be even higher. As a result, finding the optimal control settings for a wind farm is not necessarily the same as finding the optimal control settings for individual turbines in the farm. It might be beneficial to have upstream turbines operate at a suboptimal set point for the benefit of downstream turbines – this premise is exploited in the field of wind farm flow control (WFFC) research.
A wind turbine has a limited number of actuators that can be controlled to influence its performance and the characteristics of its wake. Wind turbine control publications focus on one or multiple of the following three actuation methods: blade pitch, generator torque, and nacelle yaw. All of these affect the axial induction factor, i.e., how much of the available kinetic energy is extracted from the wind, and subsequently, the behavior of the wake. When the blade pitch or the generator torque is moved away from the optimal power coefficient, CP,max, that turbine's power production drops. However, as the turbine extracts less energy from the wind, the kinetic energy in the wake increases, potentially leaving more energy to be extracted by downstream turbines. This method is commonly referred to as axial induction control, as it changes the induction factor, i.e., the ratio of the wind velocity reduction in the wake. Similarly, yawing the nacelle at an offset to the wind direction also lowers the power extraction. Simultaneously, this yaw offset introduces a lateral force on the flow of the wind, thus deflecting the wake away from its usual path. This strategy is known as wake steering.
When a fixed yaw offset or de-rating level is prescribed for given wind conditions, this can be thought of as a static or steady-state control strategy. Such strategies aim to find control set points that are constant over time, assuming that the wind conditions do not change. Much of the early WFFC research focused on controllers that fall into this categorization. For example, given a certain wind speed and direction and a predefined wind farm layout, Marden et al. (2012) and Ciri et al. (2017) used optimization algorithms to find the optimal induction factor for each turbine in the farm. While static induction control initially showed some potential, additional studies in higher-fidelity models (Annoni et al., 2016), scaled experiments (Campagnolo et al., 2016), and full-scale experiments (van der Hoek et al., 2019; Bossanyi and Ruisi, 2021) found limited to nonexistent gains. Steady-state wake steering, on the other hand, has shown potential to improve wind farm annual energy production in full-scale wind farms (Fleming et al., 2019; Howland et al., 2019a; Fleming et al., 2020; Doekemeijer et al., 2021) and has since been incorporated in commercial WFFC products (Martinez and Coussy, 2024; Bachant et al., 2024).
More recently, interest has increased in time-varying or dynamic WFFC strategies. Unlike static strategies, these methods not only allow but even depend on time-varying control signals under constant wind conditions. A similar distinction between axial induction and wake steering strategies can be made here. Dynamic induction control (DIC), in this paper referred to as the pulse strategy, changes the induction factor of a turbine at a specific frequency to vary the wake width, which has been shown to enhance mixing in the wake of the turbine. This mixing promotes interaction between the slower wind in the wake of the turbine and the faster, freestream flow around it. As a result, the average velocity in the wake increases, and downstream turbines can improve their energy capture. In dynamic wake steering, a similar strategy is applied, but it uses the yaw angle as the time-varying actuator instead of the induction factor. Research on this strategy is more sparse than on its induction equivalent (Meyers et al., 2022), and it has been found to be less effective than static yaw (Munters and Meyers, 2018b; Howland et al., 2020). We therefore dismiss dynamic wake steering for now and focus on different variants of DIC.
The easiest way to achieve induction variations is by controlling the pitch actuators. This strategy was first implemented in wind tunnel experiments executed in Frederik et al. (2020b), showing its effectiveness in a scaled, controlled environment. Alternatively, a combination of pitch and torque control could be used (Yılmaz and Meyers, 2018). Time variations come in infinitely many different shapes, but ever since Munters and Meyers (2018a) showed that simple sinusoidal signals are very effective in DIC applications, most research has focused on sinusoidal variations. Munters and Meyers (2018a) suggested normalizing the frequency, f, used for these sinusoidal variations using the freestream wind speed, U∞, and the turbine rotor diameter, D, to attain a specific Strouhal number, St, defined as
and reported an optimum of St=0.25. Although later publications found slightly different optima (Yılmaz and Meyers, 2018; Frederik et al., 2020b; Coquelet et al., 2022; Wang et al., 2020), the optimum is always found to be in the range 0.2–0.4. Differences in optima might be attributed to variations in wind conditions, spacing, actuator implementation, and/or turbine characteristics. Power uplifts in the range of 2.3 %–6.3 % are found in these simulation studies for simple two- or three-turbine wind farms with full wake overlap and low turbulence intensities (≤6 %). However, studies into turbine (damage equivalent) loads show that the variations in induction and subsequently rotor thrust substantially increase the loads experienced by the excited turbine's tower and blades (Frederik et al., 2020b; Wang et al., 2020; Frederik and van Wingerden, 2022).
To mitigate these large thrust variations while retaining the potential power uplift, a variation to DIC was proposed in Frederik et al. (2020a). In this publication, the induction was varied over each blade of a turbine individually instead of over the entire rotor plane. When combined with the Coleman – or multi-blade coordinate – transformation (Batchelor and Gill, 1962), dynamic variations in the rotor plane tilt (vertical) and yaw (horizontal) moments can be accomplished. Fleming et al. (2015) first proposed applying static offsets in the tilt and yaw moments in order to steer the wake without using a yaw or tilt angle offset. However, the static application of a multi-blade coordinate-transformed offset proved to be ineffective and was subsequently disregarded.
Nevertheless, when the tilt and yaw moments are varied at the same frequency and with a 90° phase offset, a moment that rotates over the rotor disk over time is created, resulting in a helical wake structure. This method is therefore called the helix approach, where the wake can rotate in either the clockwise or the counterclockwise direction, depending on whether the tilt moment has a 90° phase lead or lag with respect to the yaw moment. Frederik et al. (2020a) showed that the counterclockwise helix enhances wake mixing substantially more than the clockwise helix and found energy uplifts that even exceeded DIC. Comparing these results to Fleming et al. (2015) once more underlines how dynamic control signals can outperform static signals, in this case the multi-blade coordinate-transformed blade moments, in terms of wind farm power production.
The helix approach has since attracted more research: Frederik and van Wingerden (2022), Van Vondelen et al. (2023a), and Taschner et al. (2023) simulated turbine loads when the helix approach was implemented, finding that the biggest load impact was made on the controlled, upstream turbine. The helix approach was found to impact mostly blade flapwise (or out-of-plane) moments and tower top moments, as well as the pitch bearings due to increased pitching activity. Comparing the helix approach to DIC, Frederik and van Wingerden (2022) found substantially lower tower loads at the expense of the blade and pitch bearings. Taschner et al. (2024) studied the potential benefit of the helix approach compared to wake steering for different wind turbine layouts, demonstrating that the helix could be preferable over wake steering in near-full wake overlap scenarios with turbine spacing of up to 6 rotor diameters (6D). Brown et al. (2022), Korb et al. (2023), and Cheung et al. (2024) investigated the flow characteristics underlying this method, finding that the helix increases turbulent entrainment, wake deflection, and wake mixing. Coquelet et al. (2024) investigated why the counterclockwise helix is more effective than its clockwise rotating counterpart and concluded that it is likely due to the wake swirl created by blade rotation. In Van der Hoek et al. (2024) and Mühle et al. (2024), the helix approach was performed on model turbines in a wind tunnel. The outcomes of these experiments generally agreed with results from simulation studies: the counterclockwise helix outperforms the clockwise variant, and the power uplift obtained exceeds the gains obtained from DIC in similar wind tunnel experiments (Frederik et al., 2020b; van der Hoek et al., 2022). Finally, Van Den Berg et al. (2022) investigated the implementation of the helix approach using a floating offshore wind turbine and found that the combination of pitch actuation and platform motion might further enhance the wake mixing effect.
The same multi-blade coordinate-transformed tilt and yaw moments can also be applied separately (Frederik et al., 2020a; Cheung et al., 2024) or at higher harmonics (Huang et al., 2023). These approaches have not yet been investigated to the same degree as the helix approach, but initial results are promising and show that perhaps strategies based on individual pitch control (IPC) rather than on the helix approach should be considered in future research.
Because the dynamic pitch methods work on the premise that they actively increase the mixing between the slower flow in the wake and the faster flow around the wake, we will reference the totality of these strategies as active-wake-mixing (AWM) strategies. In this paper, the validity of these relatively novel AWM strategies is further investigated by comparing them, in terms of both power uplift and structural loads, to the more established wake steering strategy. We perform the helix approach, an IPC approach where only the yaw moment is varied; DIC (or the pulse strategy); and wake steering on a wind turbine, and examine the effect they have on the turbine, on the wake, and on a potential downstream turbine. For this purpose, high-fidelity flow simulations are set up to resemble data acquired from lidar measurements in a real offshore wind farm off the east coast of the United States. We investigate the effect that wind properties such as speed, direction, turbulence intensity, and veer have on the effectiveness of WFFC strategies. Apart from wind turbine and wind farm power production, we also review the damage equivalent load (DEL) of multiple critical turbine components. The results of these simulations contribute to our understanding of the potential of AWM as a WFFC strategy depending on wind speed, turbulence intensity, atmospheric stability, and wind farm layout.
This paper is a companion to Brown et al. (2025). Where this paper mainly focuses on the turbine-level behavior of the different control strategies, Brown et al. (2025) dives deeper into the fluid dynamics behind the results. On multiple occasions, we will summarize results from and reference Brown et al. (2025) for the reader's convenience. However, for a complete understanding of the effect that AWM has on both turbine and flow, the reader is advised to study both papers.
As mentioned in Sect. 1, the objective of this paper is to compare different AWM strategies to the more established wake steering control approach. To assess the effectiveness in terms of wind farm power and the turbine structural loads of these strategies, high-fidelity simulations of the turbine–flow interaction are executed. In this section, we discuss the simulation environment in detail, as well as the control strategies that are implemented. First, we review the simplified wind farm setup used in this study.
2.1 Wind farm setup
As discussed previously, applying WFFC only makes sense if there is some sort of interaction between turbines through their wakes. Without interaction, the optimal WFFC strategy in terms of power production would always be to have each turbine operate at its individual optimum. However, wind farm layouts are not standardized but depend on the topology of the farm, and wind directions vary over time. As a result, the potential of WFFC varies substantially between different wind farms, and it is not possible to assess one specific case and then extrapolate the results for different farms. We therefore choose to study a simplified wind farm case with only two interacting turbines. The internal distance between the two turbines is set to 5D in the streamwise direction, assuming perfect alignment with the average wind direction unless stated otherwise. Note that this means that we ignore the possible benefit of controlling turbines downstream. Studies have shown that applying yaw control (Howland et al., 2019b) or AWM (van Vondelen et al., 2023b) to downstream turbines could have the potential to further increase power capture. However, including this interaction in our study would substantially increase the number of simulations. Due to the relatively large number of different wind conditions that are to be studied, the scope of this paper is limited to a single controlled turbine.
Apart from these two-turbine simulations, we also execute simulations with a single turbine to study the wake of the turbine. By sampling flow data in the wake, we are able to estimate the potential power uplift of a downstream turbine at any given location. We call this a virtual turbine and determine its power using the rotor-averaged wind speed, , as a function of wind speed data points , where i,j, and k are the grid points in the x, y, and z directions, respectively, and the virtual hub location .
The set of points within the rotor-swept area, C, is first defined as
where the subscript h in yh and zh denotes the index of the location of the hub of this virtual turbine in the lateral and wall-normal (vertical) directions, respectively. Note that the location xh of the turbine in the streamwise direction does not affect C, as we assume that the virtual turbine is yawed perpendicular to the average wind direction. The rotor-averaged wind speed at streamwise location xh is then defined as
where is the size of set C(yh,zh). Finally, the power of the virtual turbine, Pv(t,x), is computed as
where the power coefficient, CP, is assumed to be a function of the wind speed as provided by a lookup table of the turbine model chosen (see Sect. 2.2.2). In Sect. 3, we evaluate how well the power of a virtual turbine corresponds to simulations with an actual downstream turbine model.
2.2 Simulation environment
The simulations conducted for this paper have been executed in AMR-Wind (Lawrence Berkeley National Laboratory et al., 2024), an incompressible flow solver for wind turbine and wind farm simulations that is part of the ExaWind ecosystem. AMR-Wind is actively being developed by the Lawrence Berkeley National Laboratory, National Renewable Energy Laboratory (NREL), and Sandia National Laboratories and executes large-eddy simulations (LES) of atmospheric boundary layer flows. For more information on AMR-Wind, see, e.g., Brazell et al. (2021) and Min et al. (2024).
2.2.1 Flow conditions
The wind flow conditions of the simulations used in this paper are based on measurements from a floating-lidar campaign at a proposed wind farm site in the New York Bight (DNV, 2023). Wind measurements were collected over a period of 1.6 years, with the lidars sampling at heights between 20 and 200 m. All data used to set up these simulations are publicly available (DNV, 2023).
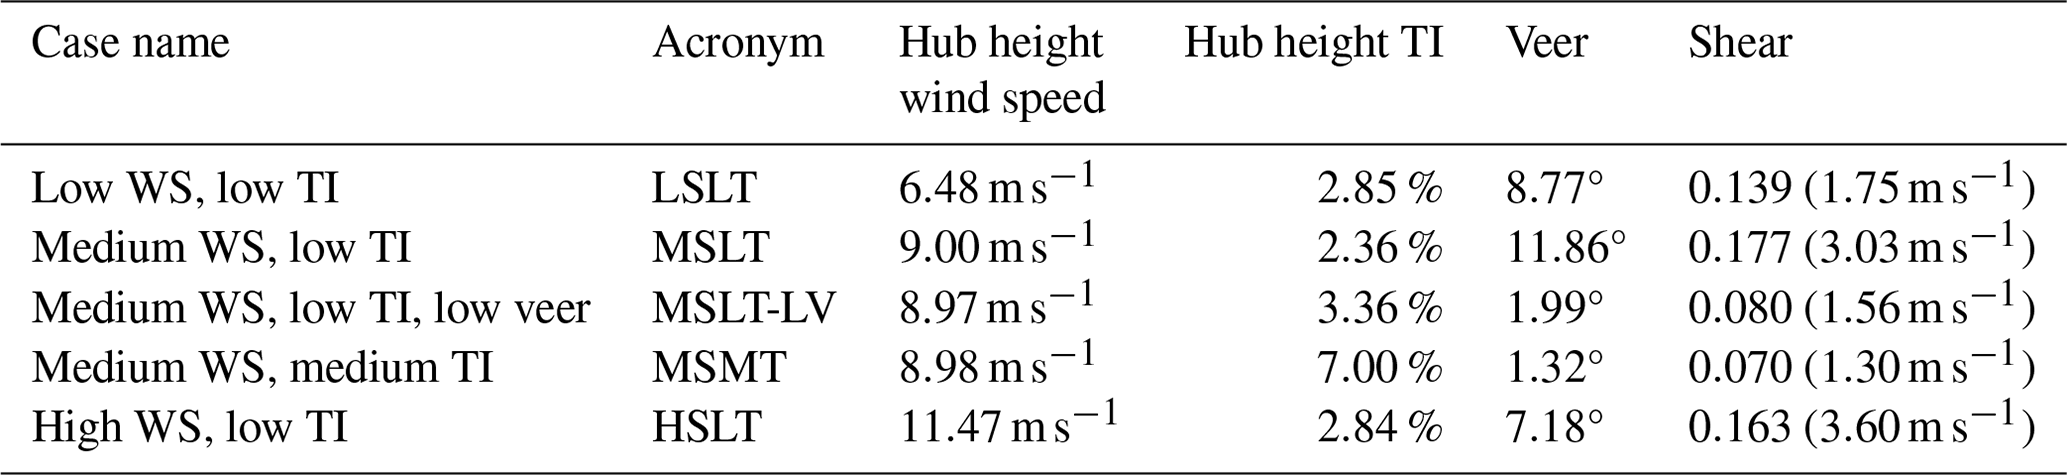
The effectiveness of different WFFC strategies can depend heavily on the wind conditions. Therefore, the lidar data are divided over three wind speed (WS) and turbulence intensity (TI) bins: low (), medium (), and high () WS cases and low (TI≤5 %), medium (), and high (TI>10 %) TI cases; see Brown et al. (2025) for details. This results in a total of nine cases that could be investigated. Both the low- and medium-WS cases are in the below-rated regime of the modeled turbine, while the high-WS cases are in the above-rated regime (see Sect. 2.2.2).
Note that WFFC is generally considered to be most effective at low TI. Turbulence provides mixing between the slower flow in the wake and the faster freestream flow, thus inducing natural wake recovery. As WFFC reduces wake losses, lower natural losses imply lower potential for improvement by the implementation of WFFC. Furthermore, above-rated conditions are less favorable for the implementation of WFFC, as upstream turbines are already operating at lower-than-maximal power and thrust coefficients. Subsequently, the relative wake deficit – and therefore the potential gain for WFFC – is lower than in below-rated conditions. As a consequence, we focus most of our attention in this paper on the low- and medium-WS, low-TI cases. Nevertheless, we also study the high-WS, low-TI and medium-WS, medium-TI cases to demonstrate their effects on WFFC strategies. More details on the setup of these simulations can be found in the companion paper, Brown et al. (2025).
In addition to the simulation cases based on lidar measurements, one more simulation case is added to study the direct effect of veer and shear on the effectiveness of WFFC. This case is set up to be comparable to the main medium-WS, low-TI case but with negligible veer and shear. There is some evidence in the literature (Bodini et al., 2017; Churchfield and Sirnivas, 2018) that LESs overestimate the amount of wake skewing induced by wind veer, which is discussed in more detail in Sect. 3.3.2. This case is therefore included to account for that possibility. Furthermore, it serves to show the direct effects of both TI (by comparison to the medium-TI case) and wake skewing (by comparison to the low-TI case) on the effectiveness of WFFC strategies. The numerical domain of simulation for all cases is summarized in Table 1, and Table 2 shows relevant quantities that define the airflow through the domain in all of the simulation cases.
Table 1An overview of the most relevant AMR-Wind LES settings used in the different wind condition cases reviewed in this paper.
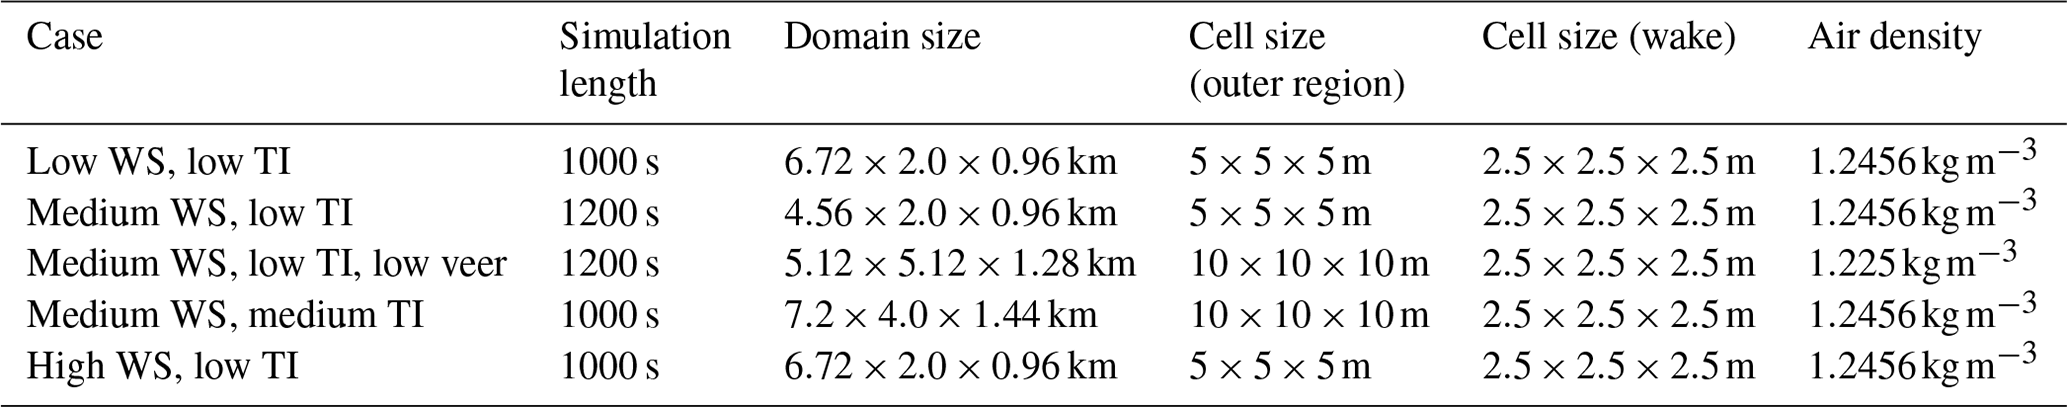
It should be noted that although not all simulations have the same cell size in the outer regions of the domain, the cell size in the region of interest, i.e., around and behind the turbines, is the same for all simulations. For practical reasons, not all simulation settings are uniform throughout the different precursors. These reasons include ensuring the desired wind conditions over the simulation time and reducing computation time. More details on these choices can be found in the companion paper (Brown et al., 2025).
Table 2Wind conditions for different precursors, including WS, TI, and veer levels. The veer is expressed in terms of degrees of wind direction change over the rotor disk (height of 30 to 270 m). The shear is expressed as the power exponent that best fits the vertical wind speed profile and in brackets as the wind speed difference over the rotor disk in meters per second.
2.2.2 Turbine model
The AMR-Wind flow solver described above is coupled with the well-known OpenFAST wind turbine simulation tool (National Renewable Energy Laboratory, 2024b). OpenFAST couples computational models for aerodynamics, electrical system dynamics, structural dynamics, and controls to simulate the wind turbine response in the time domain. The OpenFAST turbine simulations are run with a constant time step of s.
Because this study focuses specifically on offshore wind conditions, the 15 MW monopile offshore reference wind turbine model developed in IEA Wind Task 37 is used (Gaertner et al., 2020). This turbine is henceforth referenced to as the IEA 15 MW turbine, and it has a hub height of 150 m, a rotor diameter of 240 m, and a rated wind speed of 10.59 m s−1.
The structural dynamics of the turbine are calculated using the ElastoDyn solver. All blade, tower, generator, and drivetrain degrees of freedom are activated, while the turbine is not allowed to yaw away from its set point.
Although BeamDyn is the preferred module to calculate the structural loads on the blades, this also substantially increases the computational load of the simulations. As this study comprises a large number of highly expensive LESs, we chose to use the simpler ElastoDyn solver instead. This should be taken into consideration when evaluating the blade loads presented in Sect. 3.
2.3 Turbine control
In this paper, we investigate five different WFFC strategies. Before elaborating on these strategies, it is relevant to discuss how a standard wind turbine controller works. In below-rated wind conditions a turbine controller typically aims to maximize CP, so it operates using constant blade pitch angles and a nacelle yaw angle that is aligned with the wind direction. The generator torque is then controlled to regulate the blade-tip-speed ratio, λ, toward its optimum for maximal power extraction, . This strategy can be called greedy control from the perspective of individual wind turbines. As the IEA 15 MW turbine has a rated wind speed of 10.59 ms−1, all simulation cases apart from the HSLT case fall within the below-rated regime.
In above-rated conditions, maximal power production is no longer the control objective. In this regime, a typical wind turbine controller actuates the blade pitch angles to keep the rotor speed constant while producing rated power. As a result, the controller is pitching the blades to counteract changes in wind speed. The HSLT simulation case is the only one with above-rated conditions considered in this paper.
In this paper, the control strategy aimed at maximizing the power yield of individual turbines in below-rated conditions and producing constant rated power in above-rated conditions is the first approach implemented. It is used as the baseline strategy to which we compare the different WFFC strategies. Furthermore, all downstream turbines in this paper are also controlled using this baseline controller.
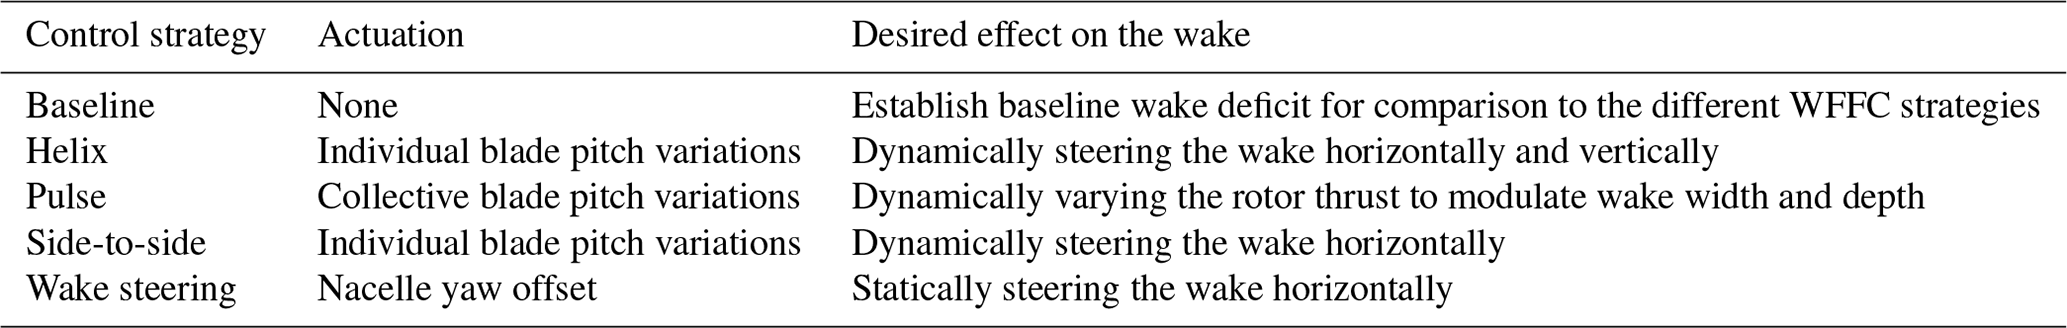
The four WFFC strategies investigated in this paper are summarized in Table 3. Three of these strategies are AWM strategies: DIC, from here on out referred to as the pulse strategy, which uses collective pitching, and the helix and side-to-side strategy, using IPC. These AWM strategies are compared to wake steering, which uses a time-invariant yaw angle offset.
Table 3Overview of WFFC strategies and how they are applied to the upstream wind turbine.
To perform the different control strategies on the IEA 15 MW turbine, NREL's reference open-source controller (ROSCO v2.8.0; National Renewable Energy Laboratory, 2024a) is used. ROSCO was developed to offer the scientific community a baseline wind turbine reference controller with industry-standard functionality (Abbas et al., 2022).
For the work executed in this paper, AWM functionality had to be added to ROSCO. This functionality was included in ROSCO version 2.8.0 and uses the Coleman transformation (Batchelor and Gill, 1962) to set the parameters for different wake mixing strategies. The pitch angles θi, are defined as the outcome of the inverse Coleman transformation:
where n is the Coleman transformation harmonic number and ψi(t), is the azimuth position of blade i at time t. In ROSCO, the user is able to define Mtilt and Myaw individually as a constant or sinusoidal signal:
with amplitude, A; frequency, fe; and offset angle, ϕ, as user inputs and ωe=2πfe. For the AWM strategies investigated in this paper, the required settings are summarized in Table 4. Note that equivalent to the Coleman transform method, the AWM strategies can also be defined using the normal mode method (Cheung et al., 2024). For completeness, these settings are shown in Table 4 as well.
Table 4Control settings for AWM as implemented in ROSCO. St is the Strouhal number, set to 0.3 in this paper, and D=240 m is the turbine rotor diameter. n/a stands for not applicable.
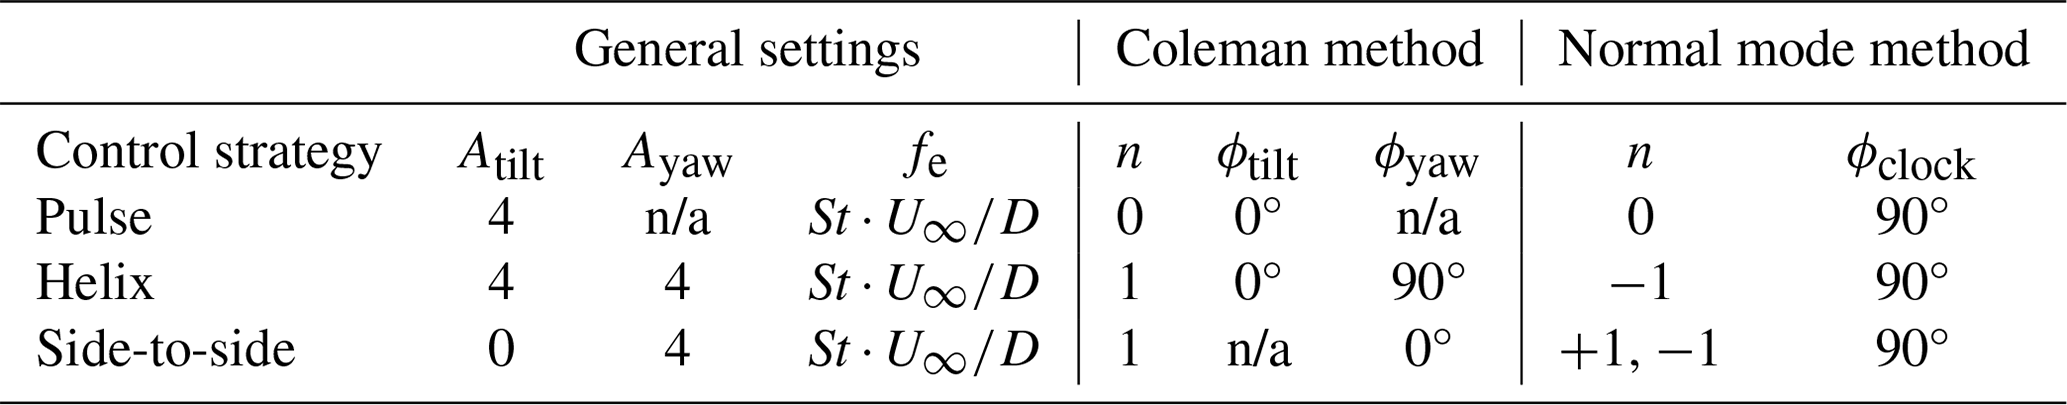
To limit the number of simulations to be executed, the amplitude and frequency of the AWM strategies are not optimized for all wind conditions. Instead, a Strouhal frequency of St=0.3 and a pitch amplitude of A=4° are used in all simulations. This frequency was found to be optimal in the MSLT case, and from the literature (Frederik et al., 2020b; Van der Hoek et al., 2024), we know that the gradient is low around the optimum. The pitch amplitude of A=4° is relatively large but is chosen to represent the case in which maximizing power production is prioritized over minimizing loads. Decreasing the amplitude has a close-to-linear effect on power production and DEL; see, e.g., Van Vondelen et al. (2023a).
As the azimuth angle is a function of rotor speed ωr,
the individual pitch angles, θi, for each blade, i, are a product of two sinusoidal signals, which, using simple rules of trigonometry, can be simplified to
Note that the rated rotor rotational frequency, Hz, is on the order of magnitude of 10 times faster than the standard excitation frequency, . As a result, the pitch frequency of the pulse strategy is about 10 times slower than that of the helix and side-to-side strategies. This is visualized in Fig. 1, which shows the pitch signals of one blade for all control strategies.
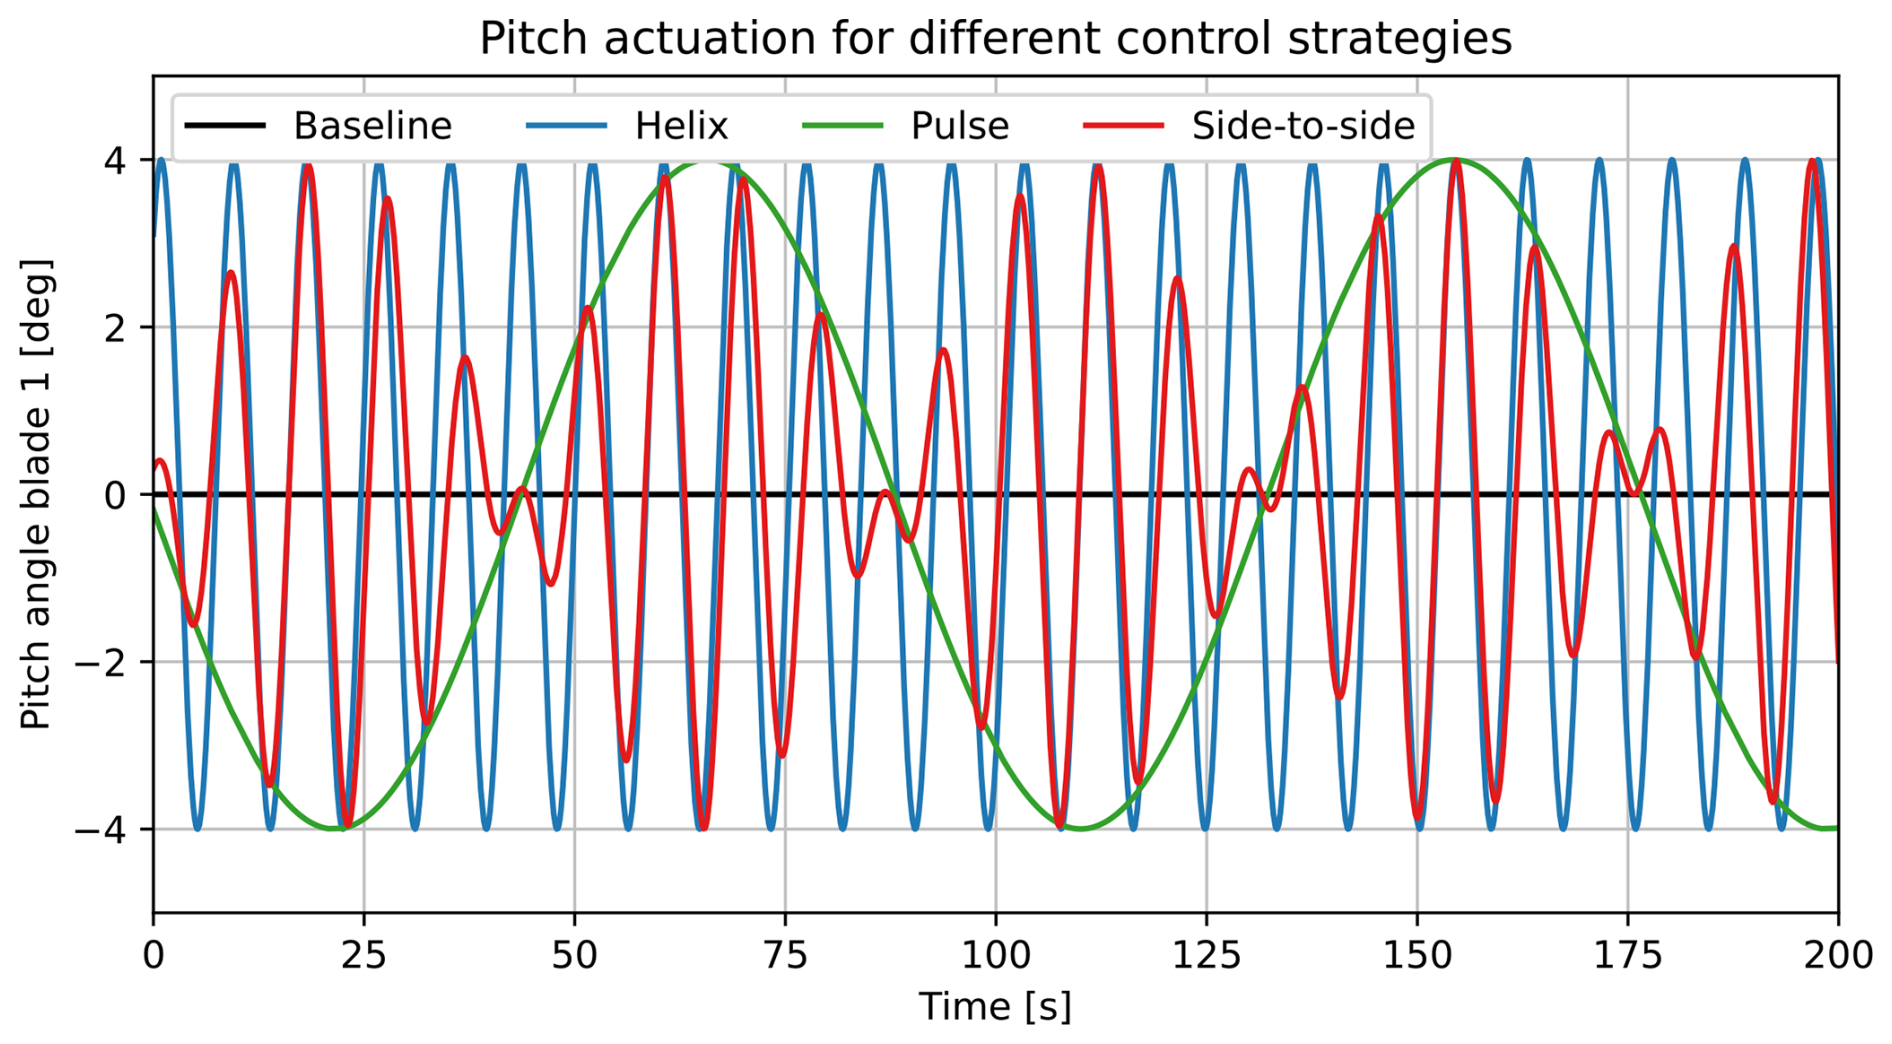
Figure 1A visualization of typical pitch actuation for a single blade when different AWM strategies are applied, as defined in Eq. (8.) This example comes from a simulation with a wind speed U∞=9.0 m s−1, with an amplitude of A=4° and a Strouhal number of St=0.3, resulting in an excitation frequency of Hz and an excitation period of Te=88.9 s. The average rotor speed over these simulations is Hz.
Finally, for the wake steering case, no active control is implemented. For this strategy, the turbine runs using the same control settings as the baseline case, with the exception of a constant yaw misalignment defined with respect to the mean wind direction. Note that for simplicity, we assume that the wind direction is constant over time and known a priori in all control cases. Subsequently, the yaw angle is constant over the entire simulation and based on the average wind direction. The positive yawing direction is defined as counterclockwise when seen from above.
Equivalently to the AWM pitch amplitude, in the simplified case of a constant wind direction with full wake overlap, a larger yaw angle offset generally results in higher power at the expense of higher loads. Therefore, to match the large pitch amplitudes used in AWM, we have also chosen to implement a relatively large yaw angle offset. In field experiments, a yaw angle offset of up to 20° is commonly considered acceptable to manage structural loads (Fleming et al., 2019; Doekemeijer et al., 2021; Simley et al., 2021). We have subsequently chosen to implement a yaw angle offset of ±20° in all WS simulations.
2.4 Load calculations
A common argument that is regularly made against WFFC strategies, specifically AWM, is that the benefits in terms of power increase do not outweigh the drawback of higher structural turbine fatigue loads. To address these valid concerns, we will not only study wind farm power uplift in this paper but also investigate the effect on fatigue loads. Specifically, we look at a quantity called damage equivalent load (DEL).
The DEL of a component is calculated using rain flow counting to obtain the amplitudes and frequencies of different load cycles within load bins, k. To correct for mean loads, the Goodman correction (see, e.g., Sutherland and Mandell (2004)) is applied to obtain stress signals, L, based on the ultimate stresses of the materials. The DEL is then computed as
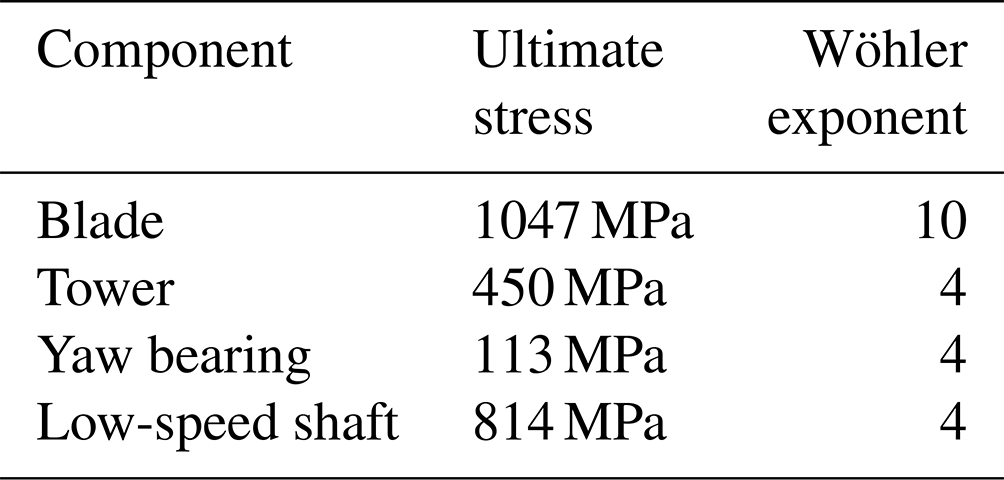
where T is the number of 1 Hz cycles over the simulation, nk is the number of cycles of amplitude L in load bin k, and m is the Wöhler exponent in question. All material properties used in these calculations are shown in Table 5. Note that when a component consists of multiple different materials, the lower ultimate load is used here to obtain a worst-case DEL.
Table 5Material properties of all the components considered in the load studies executed in this publication.
In turbine load calculations, orthogonal signals – such as the blade root flapwise and edgewise bending moments – are typically studied individually. However, in reality, these orthogonal projections form a single moment that has both a magnitude and a direction. Therefore, in Thedin et al. (2024), a method is used that combines these orthogonal loads over a 180° rose with 10° steps. The DEL is then calculated for each of the 18 directional bins, and the highest DEL is taken as the critical DEL. The loads of the components described in Table 5 are determined using the blade root flapwise and edgewise moments, the tower base fore–aft and side–side moments, the yaw bearing pitch and roll moments, and the low-speed shaft non-rotating yaw and tilt bending moments at the shaft tip.
In this section, we discuss the results from the simulations executed based on the methodology described in Sect. 2. Unless stated otherwise, the simulations consist of a two-turbine wind farm, with 5D streamwise spacing and 0D lateral spacing; i.e., the downstream turbine is experiencing full wake overlap in baseline operation.
3.1 Upstream turbine behavior
First, we consider the behavior of the upstream turbine, on which the different control strategies introduced in Sect. 2.3 are performed. Some relevant turbine signals are plotted in Fig. 2. As known from the literature, the most significant power drop is observed in the wake steering case. However, it is also expected to yield the most significant uplift on downstream turbines. When the pulse is implemented, the variations in thrust also lead to power fluctuations, as would be expected. Note that these power fluctuations are not present for the IPC-based AWM strategies, as these are designed to keep the rotor-averaged induction constant.
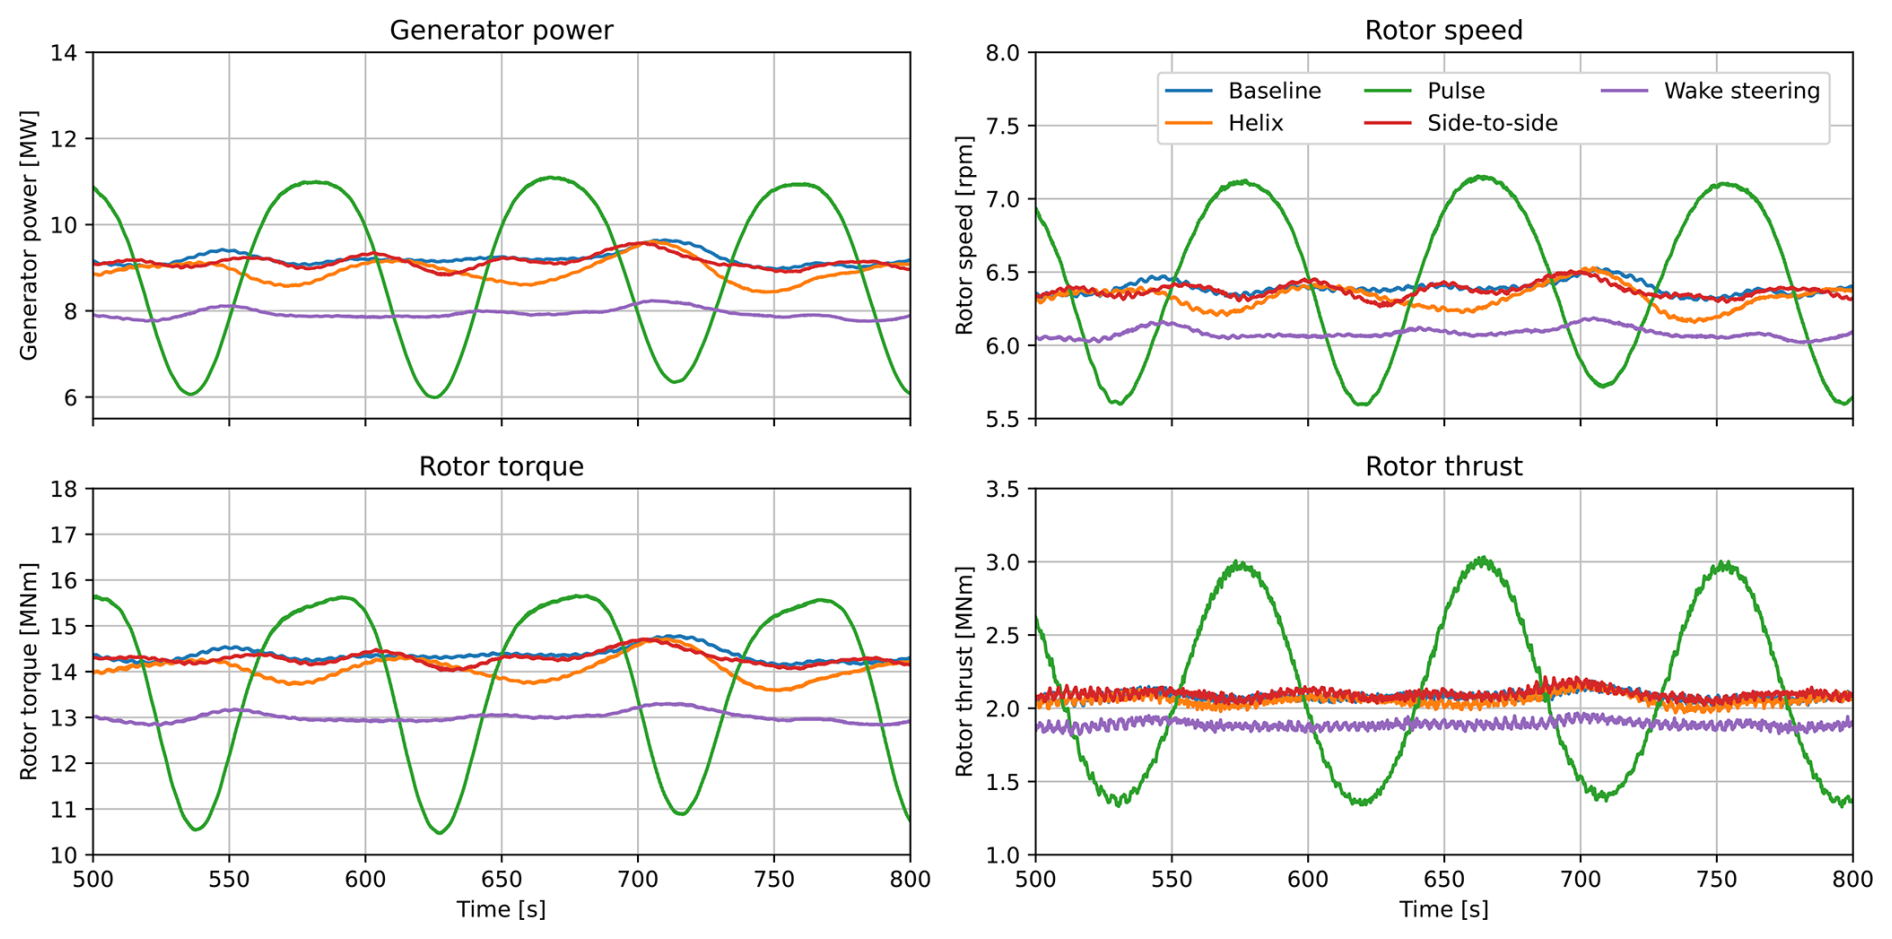
Figure 2The generator power and rotor speed, torque, and thrust for all five control cases described in Table 3. The active-wake-control strategies each have an amplitude of 4°, while the wake steering yaw offset is +20°.
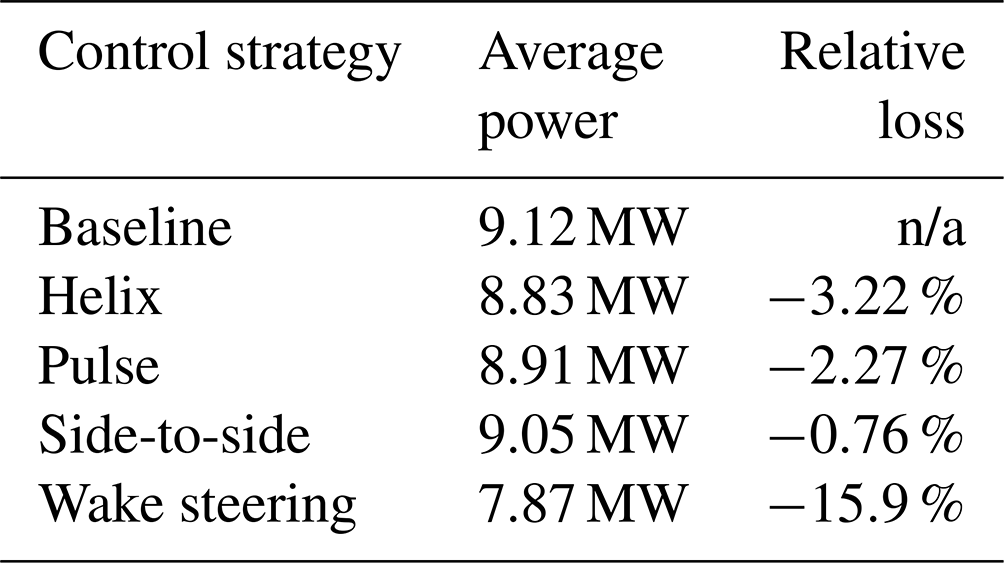
The average power production of the turbine for all control strategies is shown in Table 6. The power loss of the AWM strategies is well within single-digit percentages; the helix strategy has the highest power loss, and the side-to-side strategy has the lowest power loss.
Table 6The average power production over the last eight excitation periods (≈707 s) of the single turbine LES for all five control strategies. The relative loss is given compared to the baseline case. n/a stands for not applicable.
3.2 Single-turbine wake analysis
Next, we study the wake behind a single turbine. In Sect. 3.2.1, we investigate the effect that the wind veer has on wake skewing in the baseline control operation, and in Sect. 3.2.2, the effect of the different control strategies on the wind speed in the wake is examined.
3.2.1 Wind veer analysis
As shown in Table 2, the low-TI cases all exhibit substantial wind veer. Specifically, the MSLT case has very high veer: 11.86° over the D=240 m rotor disk. As a result, we expect the wake to be skewed, possibly affecting the downstream wake loss. To estimate the level of wake skewing, the average wake profile is fitted to a Gaussian curve defined as
where Ud is a measure of the wake deficit, r is the lateral distance from the hub center, μ is the lateral wake center position, and variance σ2 is a measure of the wake width. Using simple nonlinear least-squares optimization to find all the abovementioned parameters, we can extract the wake center, μ, at different elevations. The result is shown in Fig. 3 for the MSLT case at 5D behind a turbine operating with the baseline controller.
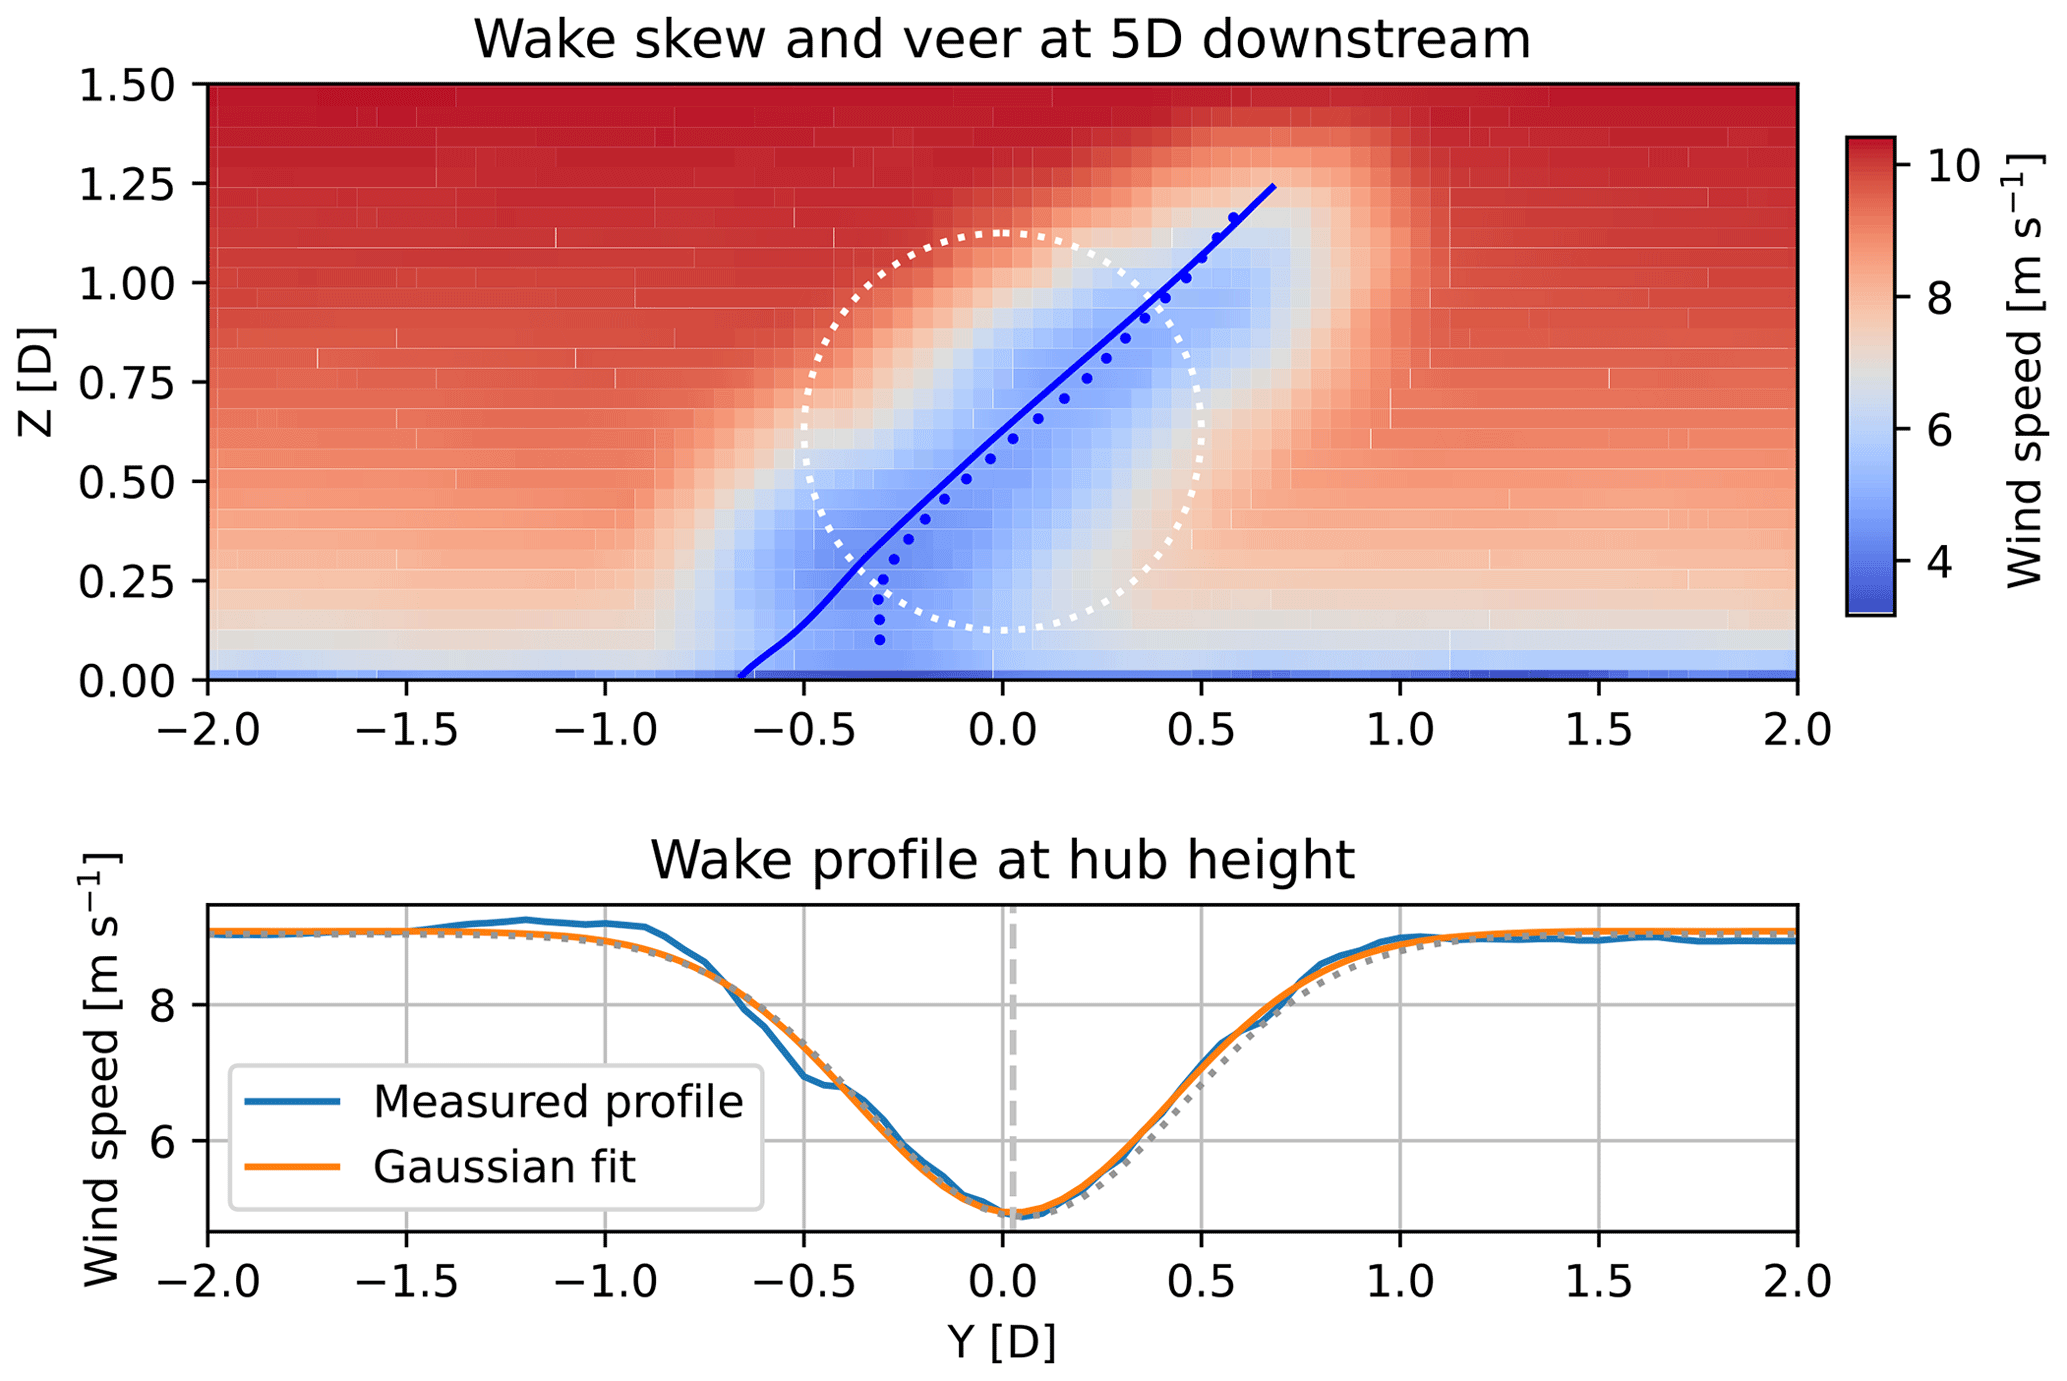
Figure 3Average wake skewing at 5D downstream of a turbine operating using baseline control in the MSLT simulations. The average is taken over the last 500 s of the simulation. In the top panel, the velocity profile over a cross-section of the flow is shown. The solid line shows the expected skew, assuming that veer is 1:1 correlated with skew. The dotted line shows the estimated wake center based on the Gaussian fits. The dotted white circle represents the location of the upstream rotor disk. The bottom figure shows the average wind speeds and the corresponding fit and resulting wake center at hub height ().
Considering Fig. 3, the wake skew at 5D is substantial but in line with what could be expected based on the veer (solid blue line). Apart from the exact skewing of the wake, other factors might affect the power production of a downstream turbine. First, the shape of the wake is not circular or even very elliptical. Instead, the wake width stays relatively consistent over the y axis while only the wake center shifts. As a result, the wake would not affect a downstream turbine as much as would be the case in un-veered conditions, and subsequently, the potential gain from using WFFC is also expected to be lower. Second, the aforementioned wake center does not align with the wind direction but instead veers slightly to the right when looking downstream. At hub height, this offset is 0.12D (28.7 m), equivalent to a wind direction offset of 1.4°. Both effects could possibly favor wake steering over AWM as a WFFC strategy, as both make it easier to steer the deepest part of the wake away from downstream turbines.
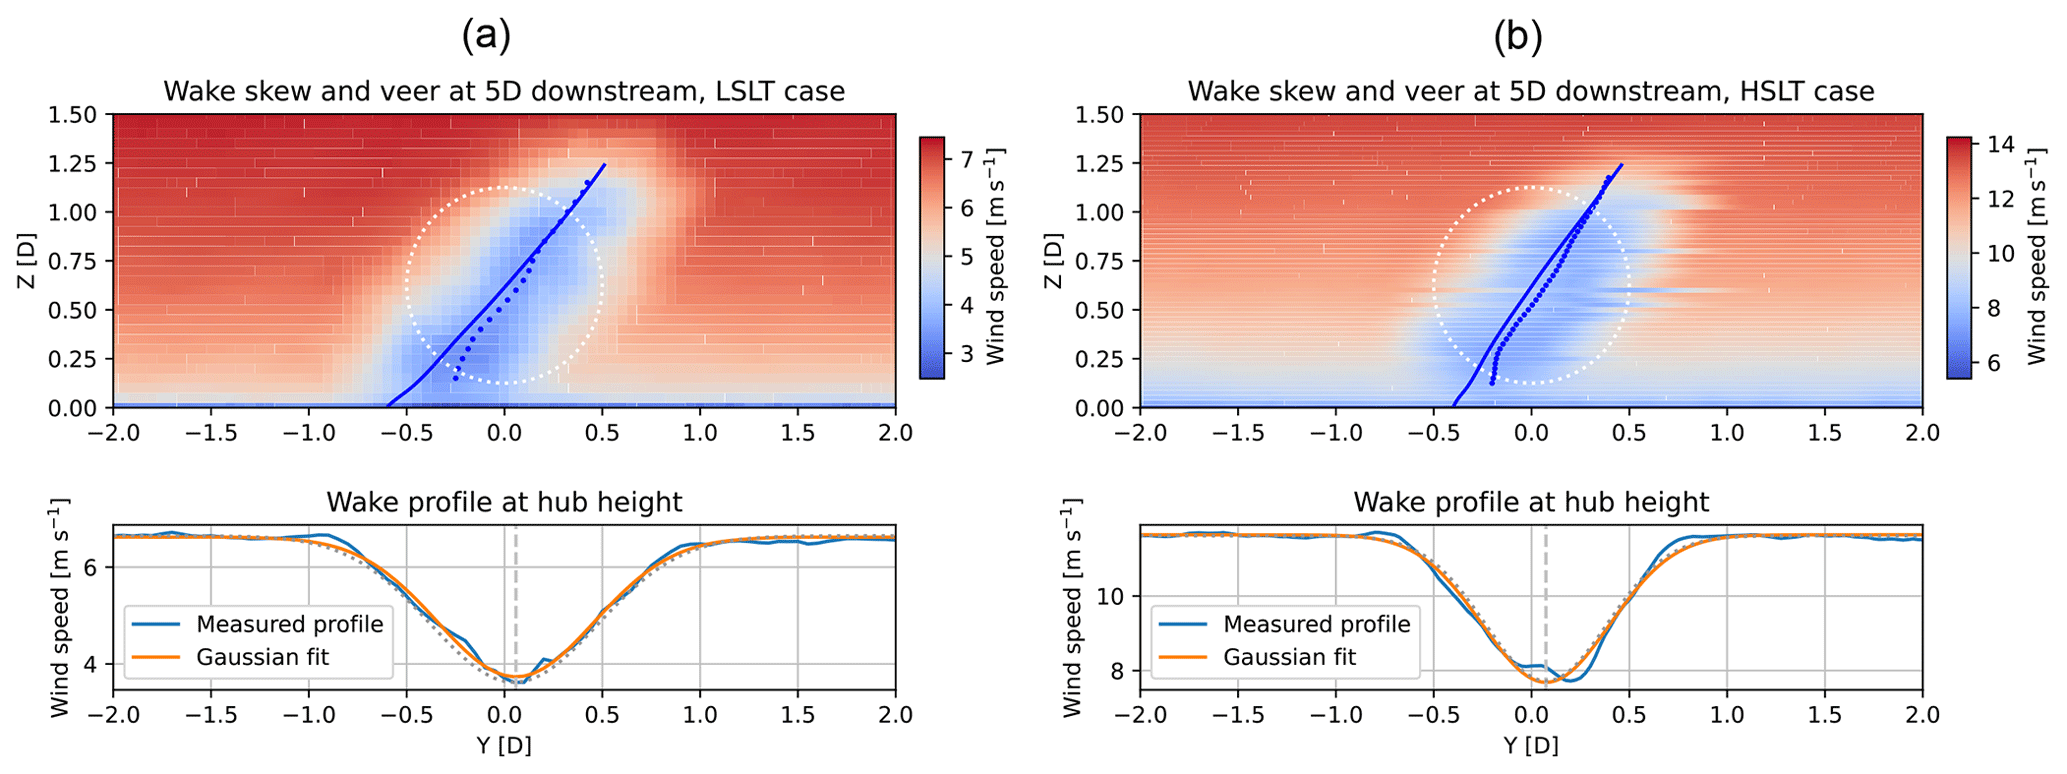
Figure 4Average wake skewing at 5D downstream of a turbine operating using baseline control in the LSLT (a) and HSLT (b) simulations, equivalent to Fig. 3 for the MSLT case. In the top panels, the velocity profile over a cross-section of the flow is shown. The bottom panels show the average wind speeds and the corresponding fit and resulting wake center at hub height ().
Figure 4 similarly shows the wake skewing at 5D downstream for the low- and high-WS simulations. In these cases, the veer and, subsequently, the wake skew are slightly less prominent than in the MSLT case. The correspondence between the veer and the wake skew is still close to a 1:1 ratio. To see if this is realistic, we compare the wakes to similar cases found in the literature. In Churchfield and Sirnivas (2018), the effects of wake skew were studied using different LES code called SOWFA (Churchfield and Lee, 2012). This study investigated the actual-to-expected skew angle ratio, i.e., the ratio between skew and veer, as a function of the downstream location and shows a ratio close to 1 at 2D downstream, going down to 0.8 at 10D. This is very similar to the LSLT case, as shown in the left panel of Fig. 5. The MSLT and HSLT cases have slightly higher relative skewing, which is likely to influence the performance of downstream turbines. Churchfield and Sirnivas (2018) showed that a turbine located 9D downstream of a different turbine in a skewed wake produces 30 % more power than in a non-skewed wake and experiences generally higher DELs.
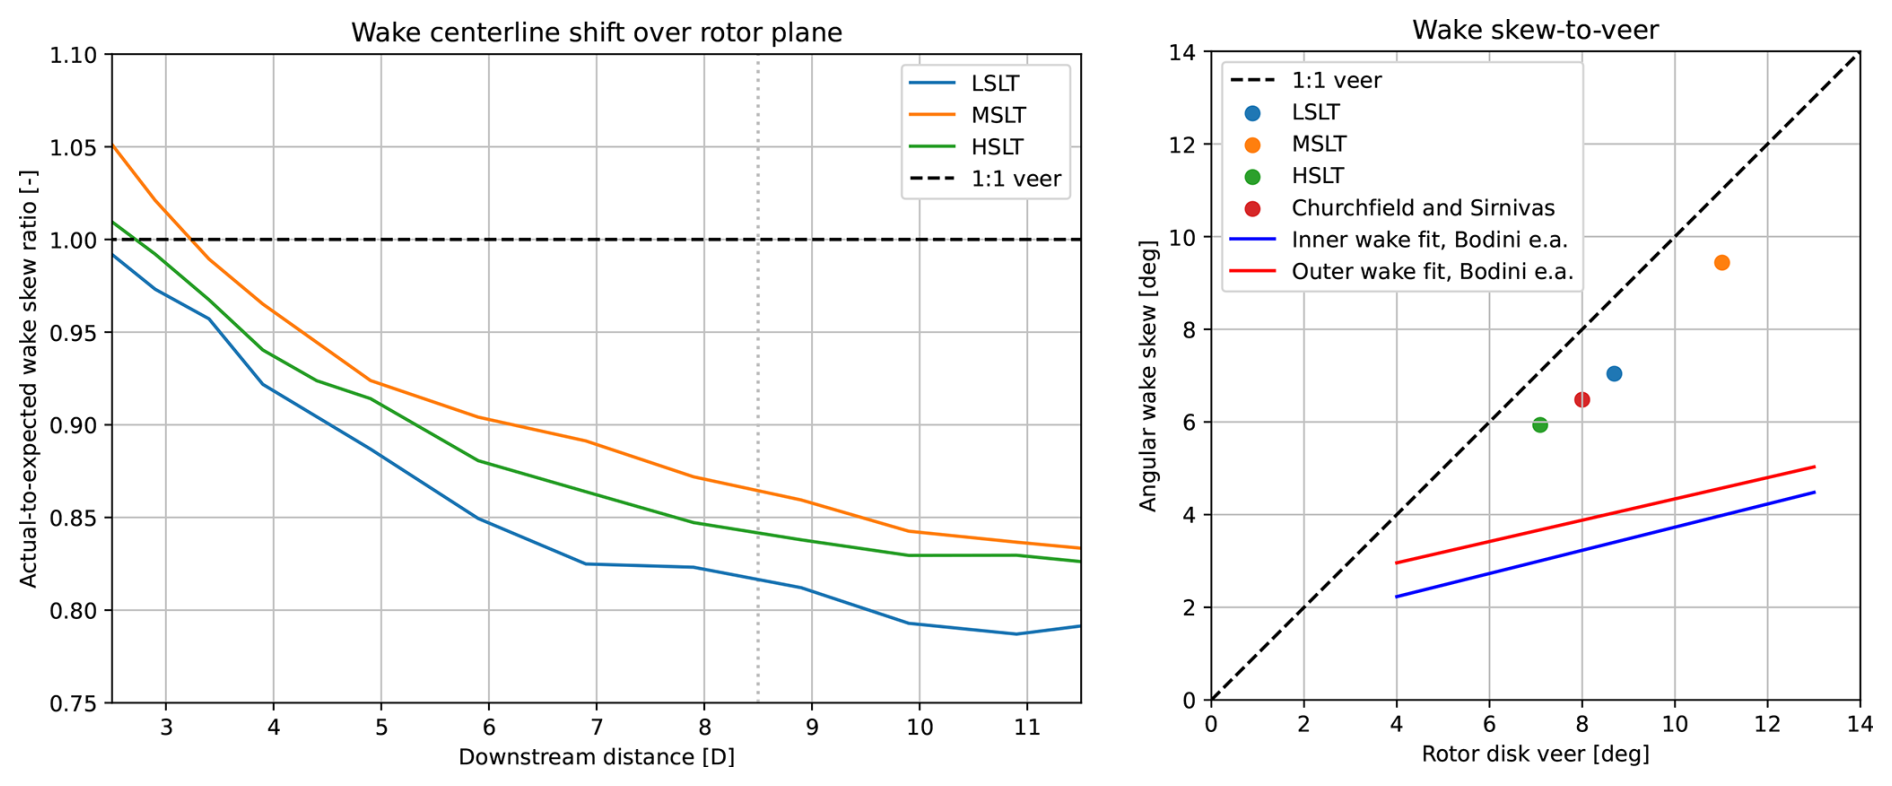
Figure 5The wake skewing obtained in the simulations assessed here is compared to results found in the literature. The left panel shows the actual-to-expected wake skew ratio based on the veer present at the three different wind speeds. The right panel shows the skew-to-veer ratio at 8.5D downstream (dotted line in the left figure) and compares it to the fits found for onshore lidar wake measurements performed in Bodini et al. (2017) and LES from Churchfield and Sirnivas (2018). The wake skewing in our simulations is determined by taking the difference between the time-averaged flow wake center at the bottom and top of the rotor plane.
Bodini et al. (2017) studied the structure of wakes using lidar wind measurements in a land-based wind farm. This study showed that at the measured downstream distance of 8.5D (680 m), the wake skewing was substantially lower than a 1:1 relationship with wind veer (see the solid lines in the left panel of Fig. 5). The values at 8.5D downstream for the simulation cases from this paper are shown by the dots. In comparison, the simulation cases presented here, as well as those in Churchfield and Sirnivas (2018), have wake skewing that is much closer to the wind veer conditions. Furthermore, in the field measurements, the relationship effect of veer on wake skewing decreases as veer increases, whereas this is not observed in any of the LES cases.
Churchfield and Sirnivas (2018) showed the effect that wake skewing has on downstream turbine behavior, and Bodini et al. (2017) showed that the wake skew in our simulation cases is substantially higher than that observed in field experiments. Therefore, the results in this paper might overestimate the effect of wind veer on WFFC. However, these field experiments were conducted onshore, whereas the wind measurements used to generate these simulations were taken offshore. It is therefore also plausible that the wake skewing effect is bigger offshore than it is onshore due to a lack of ground effects to disturb the flow.
3.2.2 Energy in the wake
In this section, we study the level of wake recovery achieved by the different control strategies and the effect it could have on wind farm power production. Figure 6 shows the rotor-averaged wind speed for a downstream turbine location, assuming alignment with the wind direction, as a function of the downstream distance. Note that this figure shows that the streamwise plane at hub height does not give an accurate estimate of the rotor-averaged wind speed for all cases. There is a clear discrepancy compared to the more accurate cross-sections that is likely explained by the significant wake skew present in these cases. Furthermore, this figure clearly shows that wake steering results in the highest velocity uplift in the wake. However, this strategy also accounts for the largest upstream power loss.
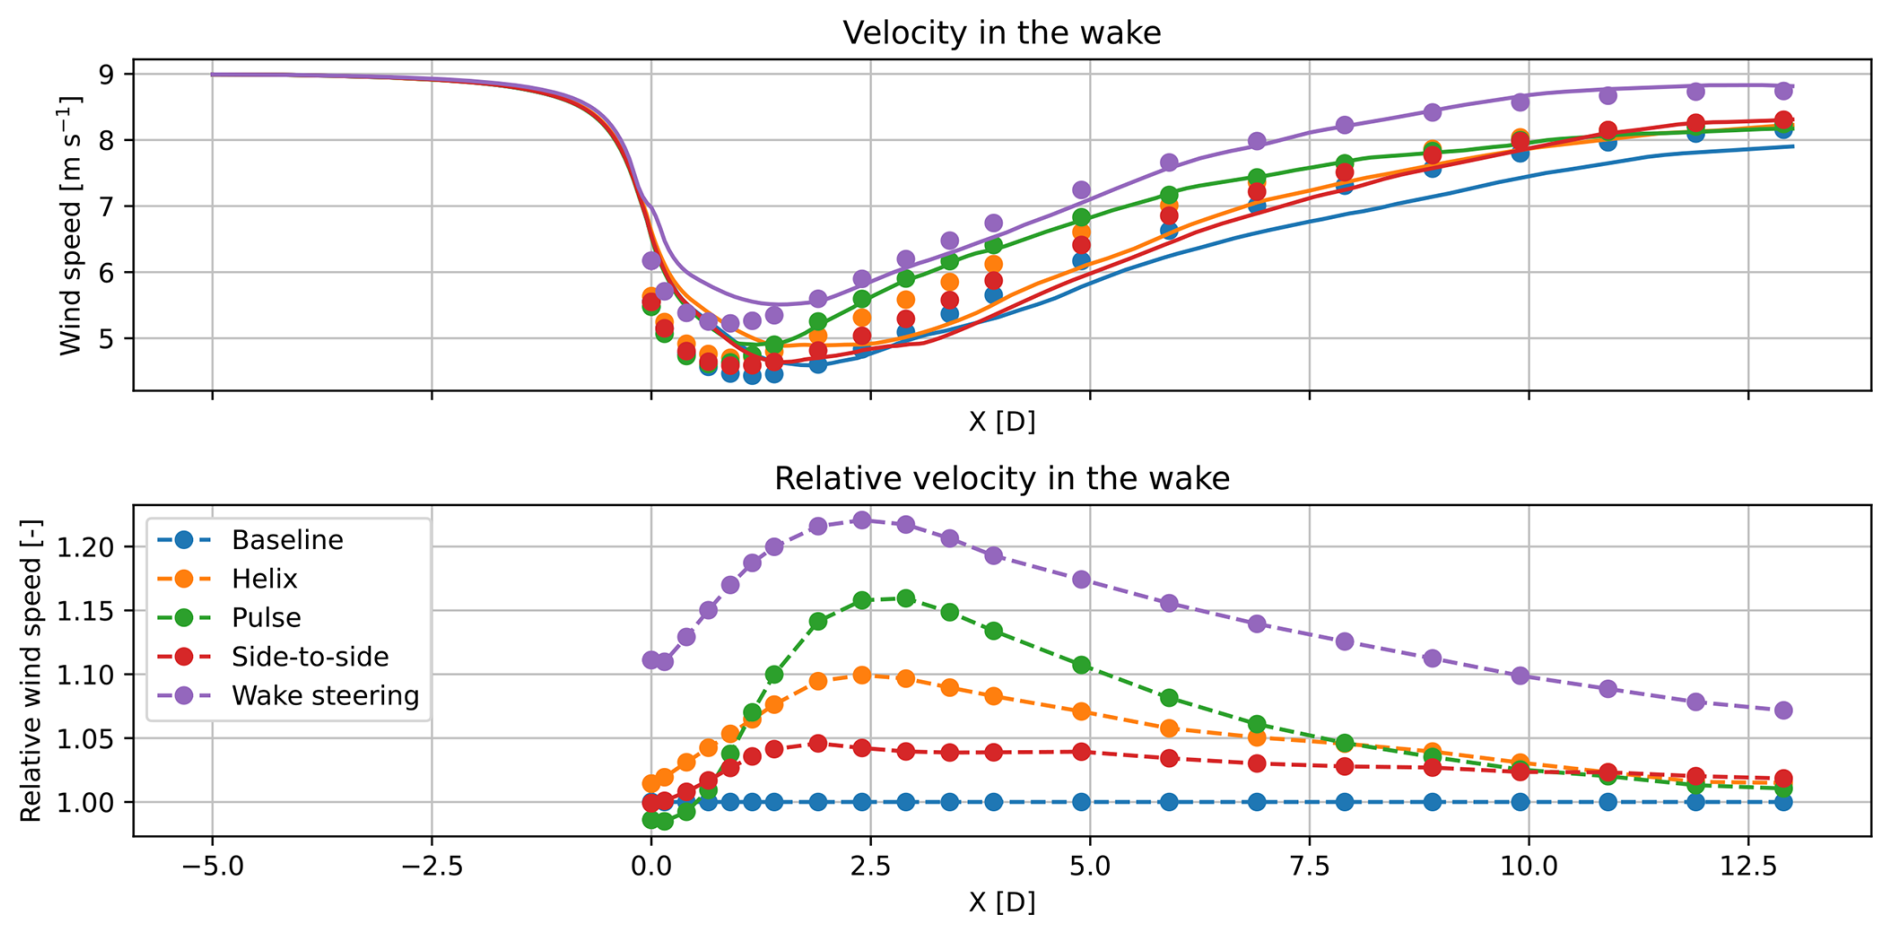
Figure 6The rotor-averaged velocity as a function of downstream distance in the MSLT simulation, assuming alignment with the upstream turbine. The solid lines show the estimated average velocity for all five control strategies when only the streamwise hub height data are taken into account. The dotted line uses cross-sectional planes that capture the entire rotor plane and should therefore be considered more accurate. The relative wind speed in the bottom panel uses the cross-sectional data only.
To get the full picture in terms of wind farm power, the power loss at the upstream turbine should also be taken into account. This is shown in Fig. 7, where the combined power production of a two-turbine wind farm is estimated for any position of the downstream turbine based on the rotor-averaged velocity obtained from the cross-sectional planes. This figure shows that for specific locations of the downstream turbine, wake steering and the pulse have the highest predicted power uplift, 7.7 % and 9.0 %, respectively. Both these optima are at 4D downstream and have a slight offset – 0.4D to the right for the pulse, 0.3D to the left for wake steering. The helix and side-to-side strategies both have a maximum predicted uplift of 2.4 %, whereas the side-to-side optimum lies slightly farther downstream.
Note that the width of this uplift region is essentially different for wake steering and wake mixing. For the former, there is a narrow band of turbine locations with high uplift, but outside of this band, wake steering results in substantial power losses. For the latter, the gradient of the uplift with respect to lateral offset is much smaller. This difference has two causes. First of all, the power loss of the upstream turbine, as shown in Fig. 2, is substantially higher for WS than for AWM. Subsequently, the combined two-turbine power drops much more quickly when the wake interaction decreases, as the downstream machine gains less while the upstream machine loses the same. Secondly, WS directs the wake away from a specific location. This is very effective if the downstream turbine is positioned at this location but could be counterproductive if it is not. If the downstream turbine is located in the negative y direction in Fig. 7, it would experience increased wake overlap and lose power compared to the baseline case. This could be an argument for applying wake mixing in real-world wind farms, as the wind direction is rarely known exactly and varies over time. This is also argued in Taschner et al. (2024). This study shows that in the case of close to full wake overlap, the helix strategy provides power gains that are more robust to wind direction changes.
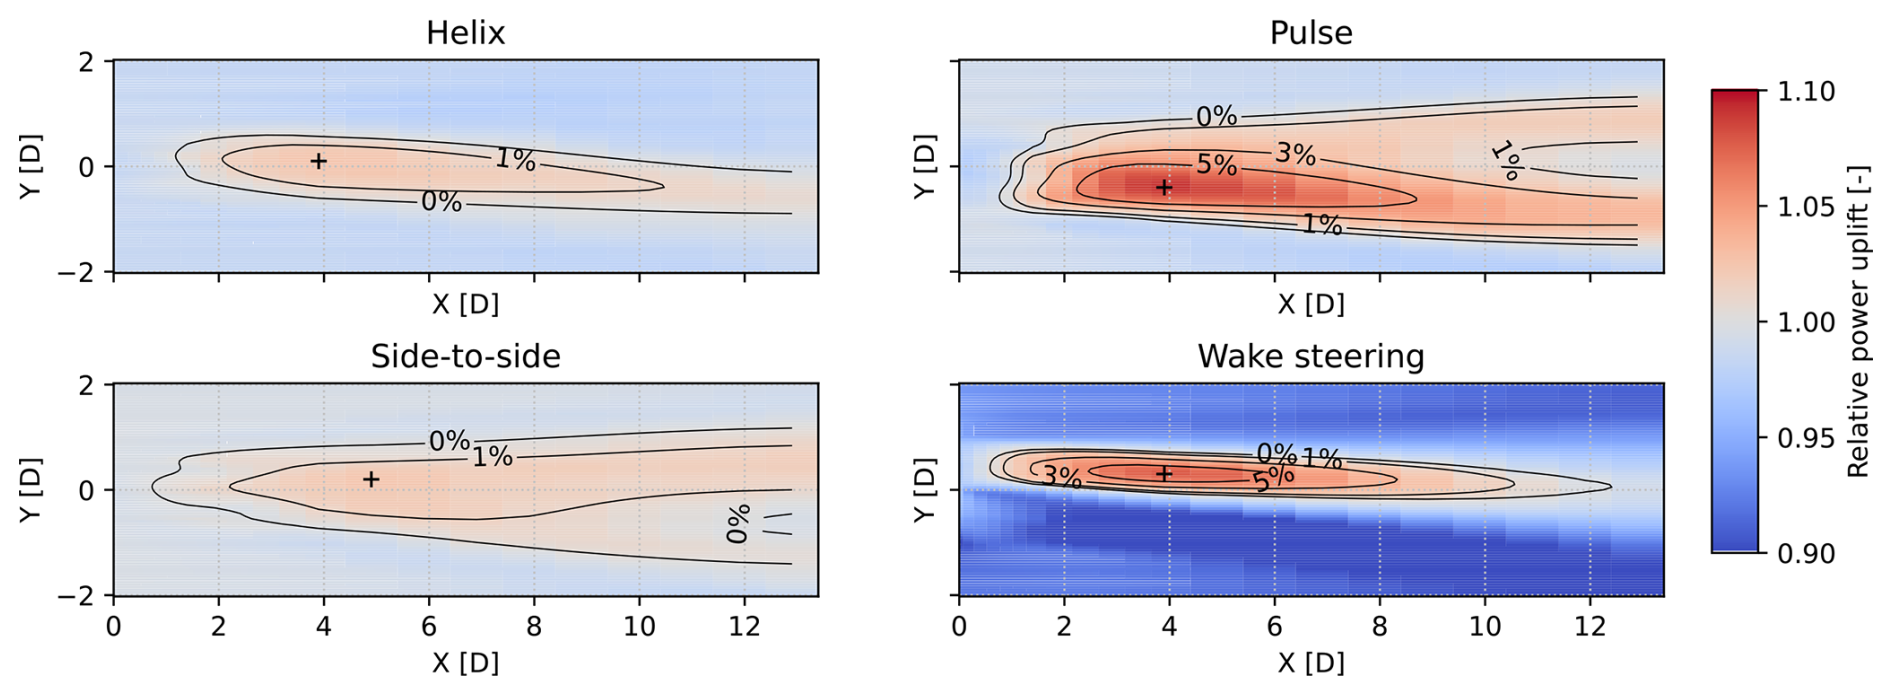
Figure 7The estimated power gains with respect to the baseline for a combined two-turbine wind farm when different control strategies are implemented in the MSLT simulation. The power of the downstream turbine is given as a function of its position with respect to the upstream turbine and is based on the rotor-averaged downstream velocities in the cross-sectional planes. The + in each panel shows the location of a downstream turbine that would experience the highest percentage of power uplift based on the estimated downstream power.
Finally, Fig. 7 shows that the IPC-based control strategies (helix and side-to-side) are not nearly as effective as the other two strategies. This is likely related to the skewed shape of the wake: as the wake is not cylindrical, these strategies might not be as successful in creating the helical structures that enable wake mixing in lower-veer conditions. Note that Brown et al. (2025) come to the same conclusion by investigating the mean and turbulent entrainment in the wake of the turbines. This result is further discussed in the next section.
3.3 Two-turbine results
In this section, we discuss the results from simulations run with two turbines. The second turbine is located 5D downstream of the first turbine with, unless stated otherwise, no lateral offset. First, we discuss the results in the medium-WS, low-TI (MSLT) case, followed by a comparison with the low-veer (MSLT-LV) and medium turbulence (MSMT) cases. Finally, we discuss the results from the low- and high-WS cases.
3.3.1 Effect of wind farm layout
In this section, we discuss the results from the medium-WS, low-TI (MSLT) case, as defined in Table 2, focusing our attention on the turbine power and DELs of four relevant components through the method described in Sect. 2.4. We study the effect of wind farm layout on the turbine performance by varying the location of the downstream turbine.
For a two-turbine wind farm with the second turbine aligned with the first 5D downstream and running with a baseline controller, the power and critical DELs are plotted in Fig. 8. Looking at the top row, representing the upstream turbine, we see the same power losses as were observed in Sect. 3.2 on the y axis, with wake steering resulting in the biggest and side-to-side resulting in the smallest power loss. On the y axes, we see the effect on DEL. What stands out is that wake steering has very minimal effect on the DELs compared to the wake mixing strategies. The blades and tower are most impacted by the pulse strategy, while the internal components (yaw bearing and low-speed shaft) are more impacted by the AWM strategies using IPC. The helix and side-to-side strategy generally lead to similar DELs, except for the yaw bearing moments. This can be explained by the lack of rotor tilt moment excitation in the side-to-side method, which subsequently does not excite the yaw bearing pitch moment in the same way as the helix strategy does.
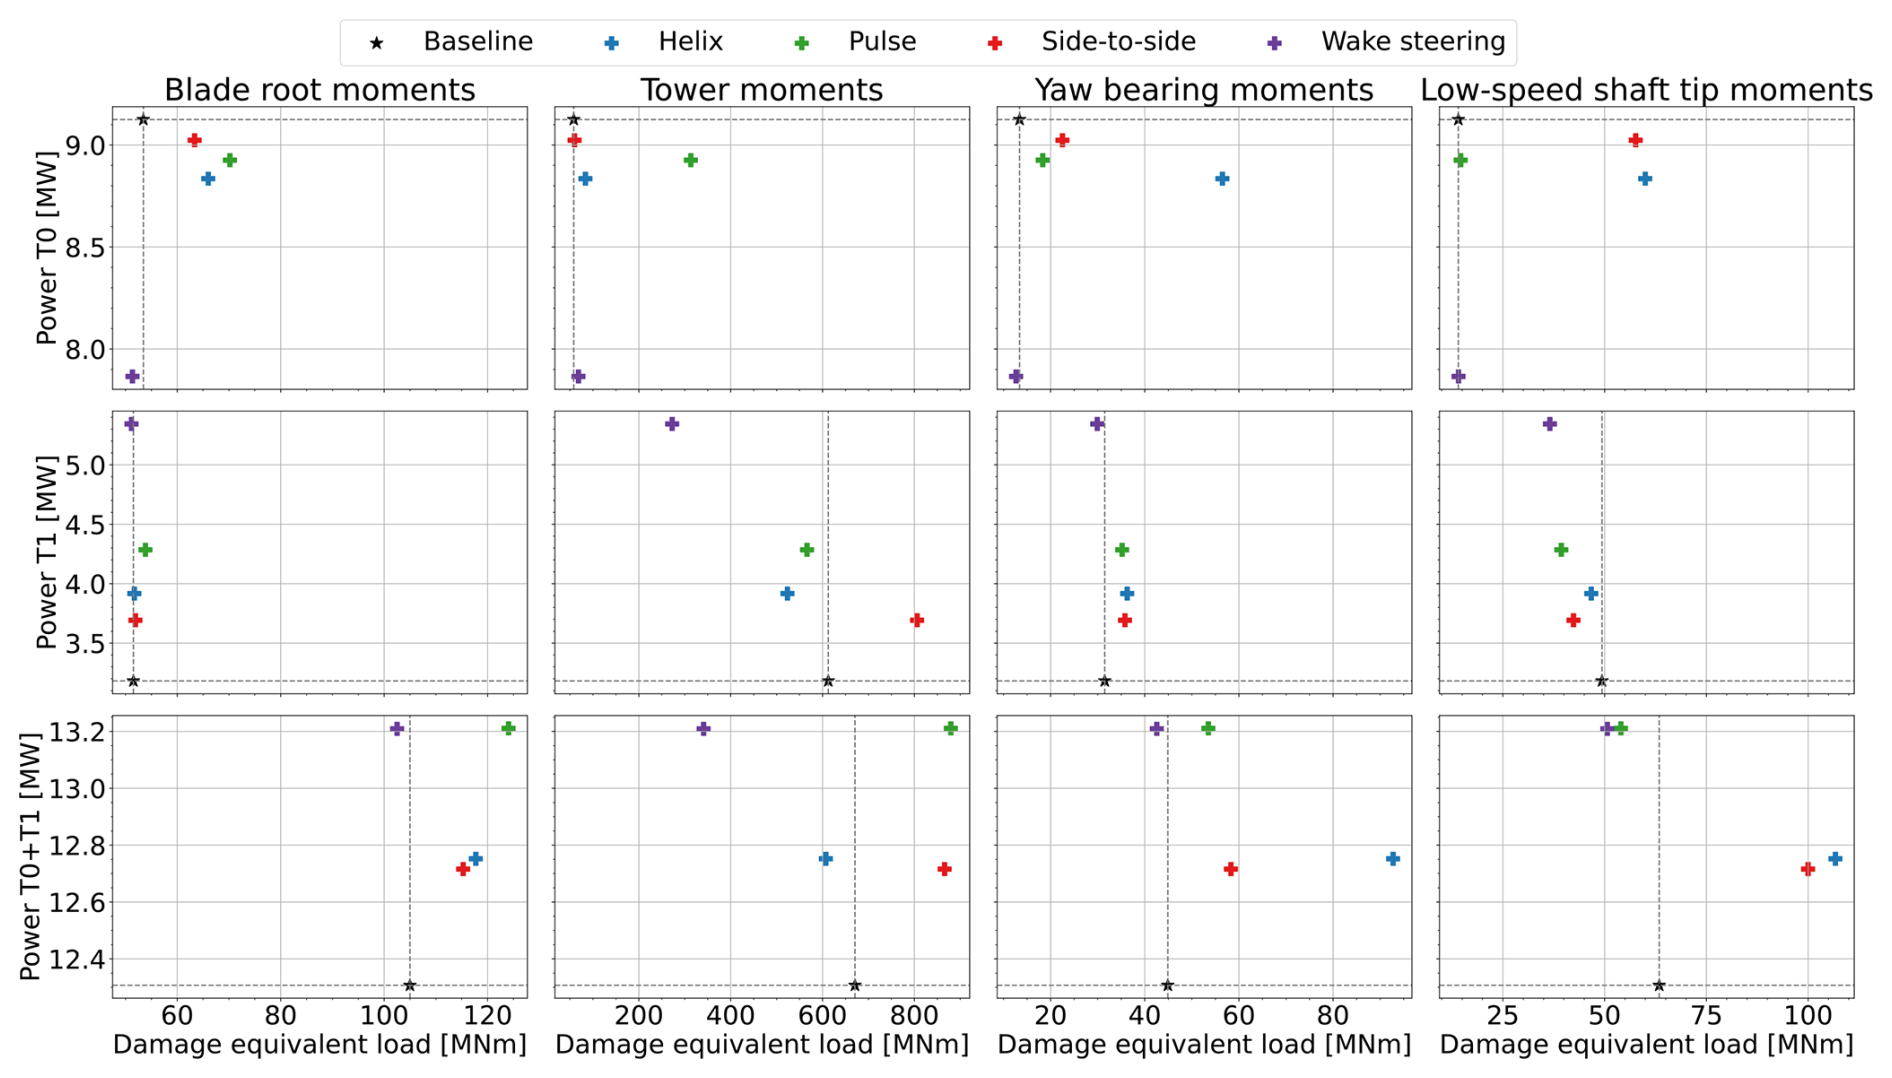
Figure 8DELs plotted on the x axis versus generator power on the y axis for the different control strategies in the medium-WS, low-TI (MSLT) case. The first row shows the results for the upstream turbine, the second row shows the results for the downstream turbine, and the third row sums the results of both turbines. The different columns represent the DEL for different turbine components, as labeled at the top.
The second row shows the results for the downstream turbine. The only strategy that has any substantial impact on the blades is the pulse, although the impact is still significantly lower than the impact on the upstream blades. The downstream tower is most affected by the side-to-side strategy. A possible explanation for this is the increased turbulent entrainment at the left and right sides of the wake, which is documented in the companion paper (Brown et al., 2025). Wake steering, on the other hand, reduces the tower DEL of the downstream turbine by a factor of 2. The effect of different control strategies on the internal components is much smaller but again shows that wake steering can lower downstream turbine DELs.
Comparing the first and second rows, it should be noted that although some of the first turbine's DELs increase significantly when AWM is applied, all but the blade loads are still comparable or are lower than the loads of the waked second turbine. In other words, although the loads increase, they are still close to the loads of a normally operated waked turbine.
Finally, the third row shows the sum of results from the first two rows. Note that these results are not weighted in any way, and the DELs should therefore not be considered equivalent to the likelihood of damage to any of the two turbines in the wind farm. Clearly, the ideal control strategy would be in the upper-left corner of the plots in this row, as this would represent the highest power capture while the turbines experience the lowest DELs. Wake steering can actually be found closest to this upper-left corner in all the plots, indicating that in these conditions, wake steering is the superior control strategy.
Next, we study the impact of different wind directions on the effectiveness of the WFFC strategies. In these simulations, the downstream turbines are no longer aligned with the wind direction but are instead offset by −0.5D (120 m) in either direction. This corresponds to a wind direction change of 5.72°. Note that the yaw angle offset of the upstream turbine is adjusted such that the wake is steered away from the downstream turbine; i.e., for an offset of 0.5D, the yaw angle is −20° instead of 20°.
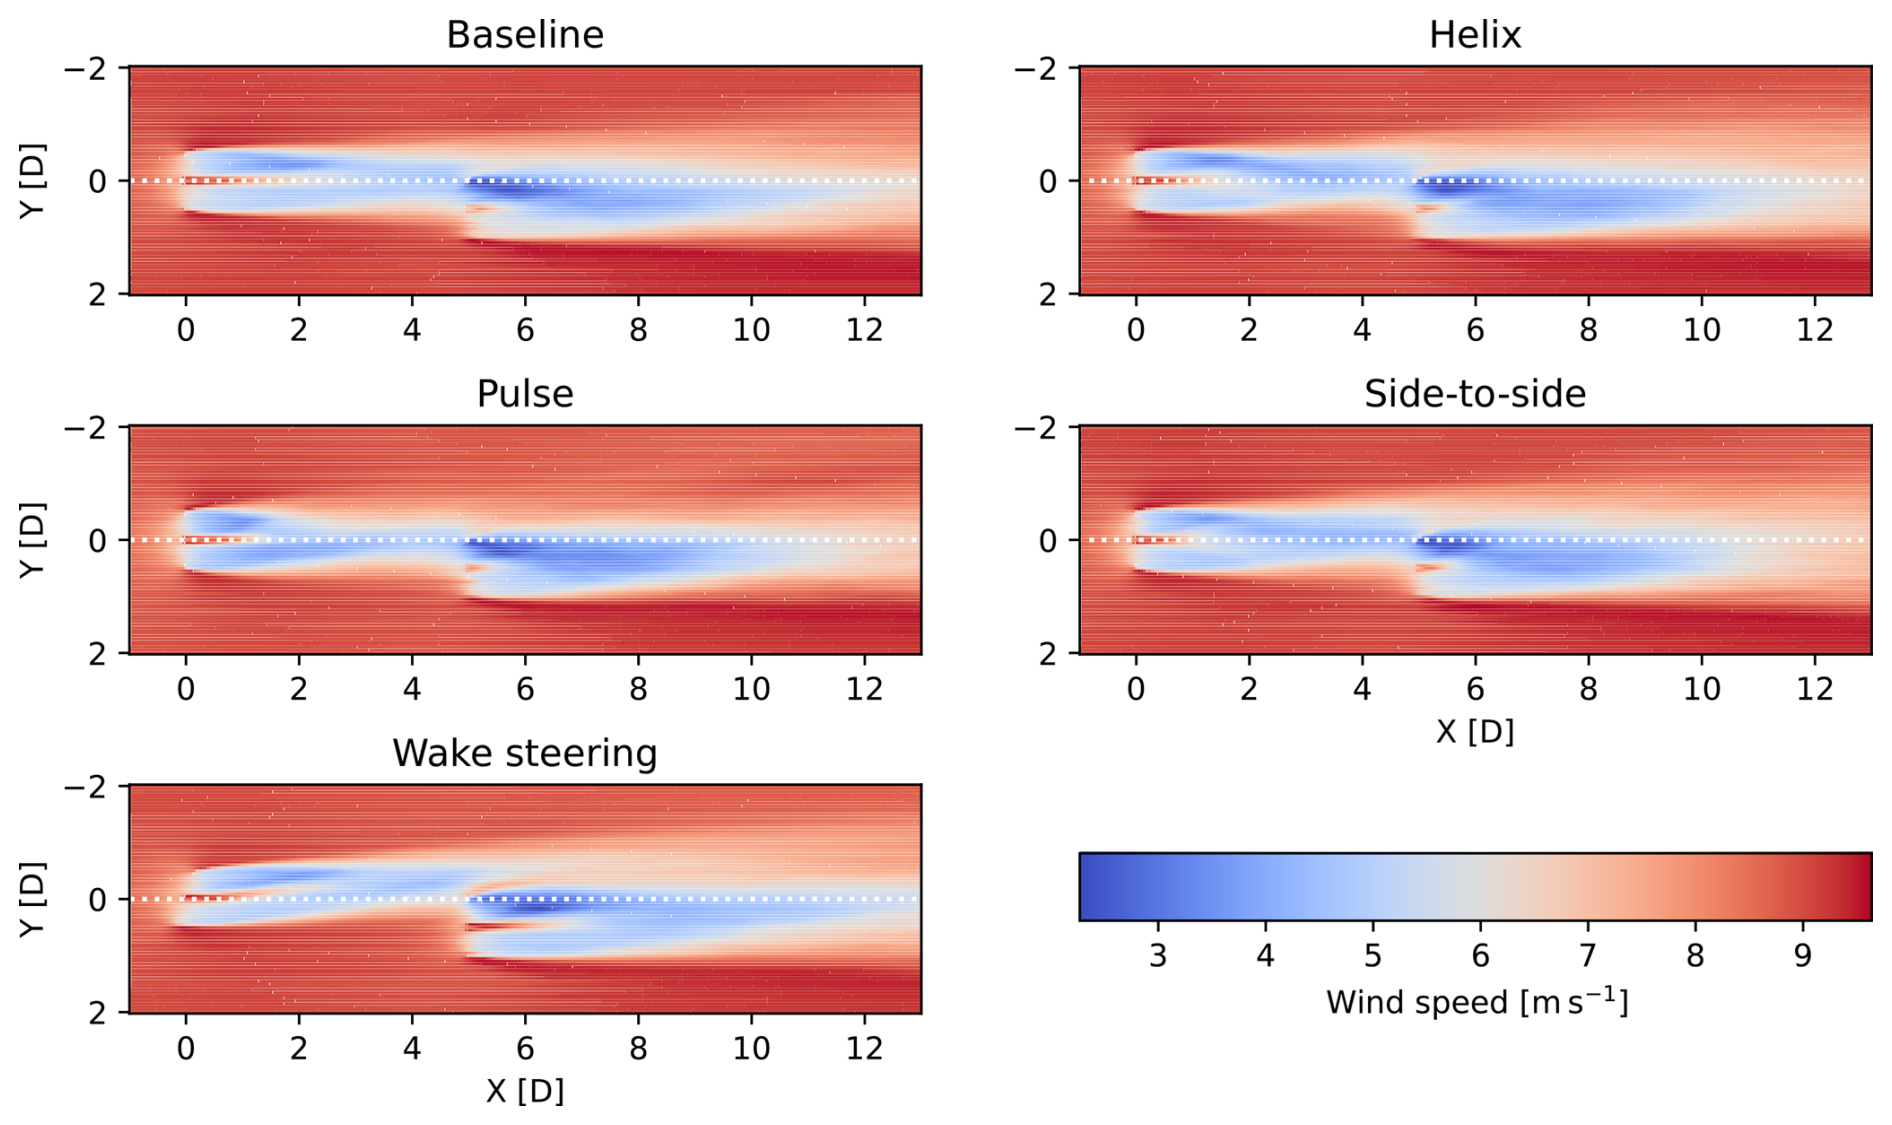
Figure 9Average flow field at hub height for the two-turbine wind farm when different control strategies are applied. The second turbine is offset by −0.5D or 120 m at 5D downstream, equivalent to a wind direction change of 5.72° compared to the aligned case.
Figure 9 shows the time-averaged flow fields when the downstream turbine is offset by −0.5D. It demonstrates how, on average, all the wake mixing strategies manage to create a narrower wake, thus increasing the wind speed experienced by the downstream turbine while losing minimal power at the upstream turbine. However, comparatively, the pulse method appears to be the most effective, substantially narrowing the wake from 2.5D onward. As expected, although wake steering is the most effective control strategy when there is a lateral offset in turbine locations, the bottom panel in Fig. 9 shows that the wake is steered almost completely away from the downstream turbine. As a result, the power uplift is also the greatest for wake steering, as shown in Fig. 10.
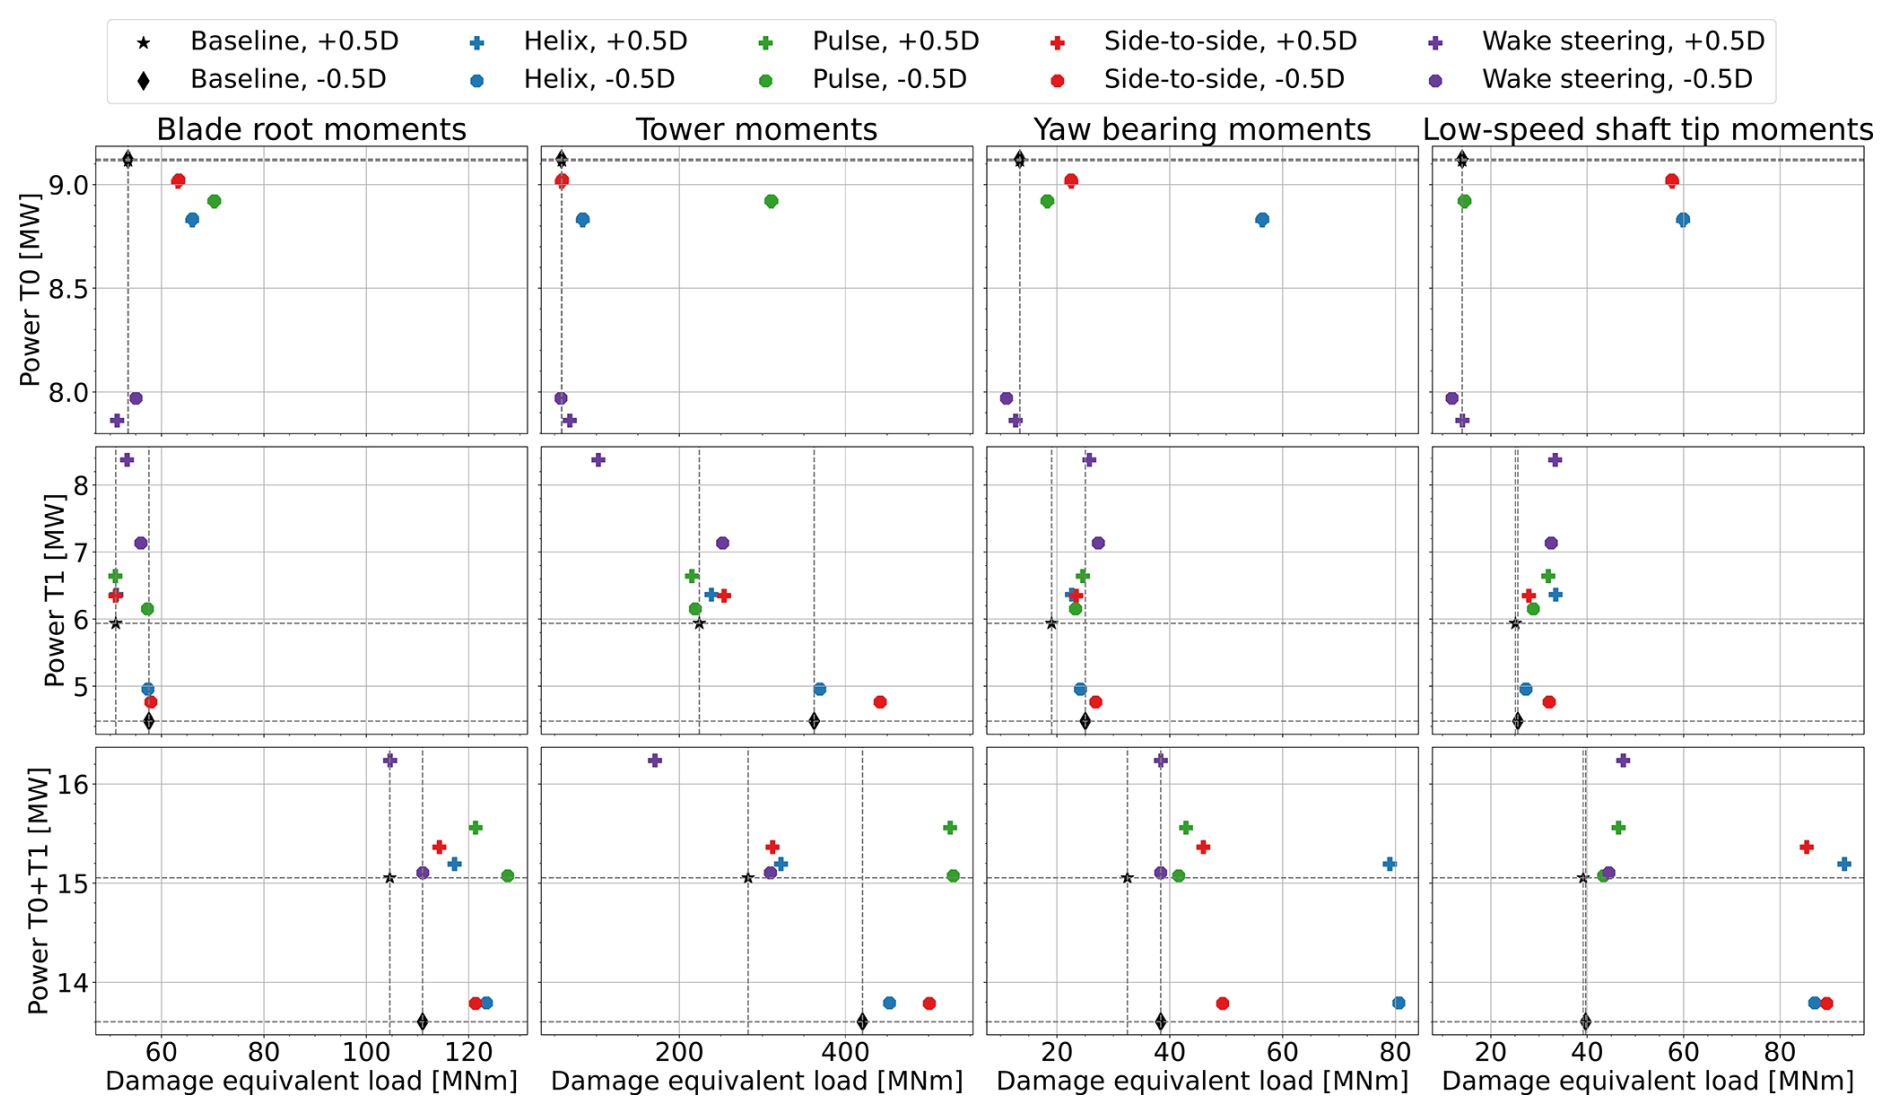
Figure 10DELs plotted on the x axis versus generator power on the y axis for the different control strategies in the medium-WS, low-TI (MSLT) case, with a lateral turbine offset of −0.5D and 0.5D. The first row shows the results for the upstream turbine, the second row shows the results for the downstream turbine, and the third row sums the results for both turbines. The different columns represent the DELs for different turbine components, as labeled at the top.
The power of and DELs on the first turbine are equivalent to those shown in Fig. 8, as the upstream turbine operates under the same conditions regardless of the downstream turbine's location. On the downstream turbine, however, the loads are generally lower than in the aligned case – note that the scales of Figs. 8 and 10 are not identical. As the turbine is now experiencing more less-turbulent freestream flow, the DEL on all components is also reduced substantially. Compared to baseline control, wake steering now has a slightly adverse effect on the yaw bearing and low-speed shaft DELs, whereas in the aligned case it reduced these loads.
In terms of power production, wake steering is, as expected, clearly the best choice in this scenario, increasing overall power production by 7.8 %. The wake mixing strategies score substantially worse, with 0.9 %, 3.3 %, and 2.0 % power uplift for the helix, pulse, and side-to-side strategies, respectively. Note that in these conditions, the side-to-side strategy performs better than the helix, even though it requires lower pitch actuation and subsequently also has generally lower DELs. This shows that the additional pitch actuation that is intended to excite the wake in the vertical direction is clearly not effective and perhaps even counterproductive in these high-veer, high-shear wind conditions.
Comparing these results to the estimated power gains from Fig. 7, we find that these estimates are close but not exact. The estimated uplift for the helix is very close to the uplift found in the two-turbine simulation, but the side-to-side strategy performs slightly better than predicted. For the pulse, Fig. 7 predicted a 5 % power uplift, whereas only a 3.3 % uplift is achieved. The opposite is true for wake steering, which performs substantially better than the 4 % power uplift estimated based on the flow field.
Finally, Fig. 10 also shows the power and DELs for a lateral offset of the downstream turbine of +0.5D. The first row of this figure is still equivalent to the cases with a different lateral offset, but the second row is remarkably different from the −0.5D offset case. Due to the shape of the wake, shown in Fig. 3, the wake loss at 0.5D lateral offset is substantially higher than at −0.5D. As a result, wake mixing strategies, specifically the pulse, are able to create more power uplift at the downstream turbine at the same cost for the upstream turbine. This is also visible in Fig. 7, where the negative offset direction clearly shows a higher power uplift than the positive offset direction.
Overall, all strategies still lead to a power uplift compared to the baseline: the helix and side-to-side strategies both increase power by 1.4 %, the pulse strategy increases power by 10.8 %, and wake steering increases power by 11.0 %. Note that although the power uplift for the IPC-based AWM strategies is limited, they correspond well to the expected uplift predicted in Fig. 7. The pulse strategy, on the other hand, significantly outperforms the expected power uplift obtained from the single-turbine simulations, although they did predict that this downstream turbine location would be the “sweet spot” in terms of power uplift.
Investigating the horizontal axes of Fig. 10, we see that wake steering has the lowest DELs for all signals except for the downstream turbine low-speed shaft. The DELs of the AWM strategies are in line with what we have seen at different lateral offsets. Overall, wake steering should still be considered the best strategy in terms of combined power and loads.
3.3.2 Effect of veer and turbulence
In this section, we study the results obtained in the cases with low wind veer, as defined in Table 2. First, we consider the results in the MSLT-LV case, which is similar to the conditions discussed in the previous section but with substantially lower wind veer and shear. Subsequently, the wakes under these conditions are more circular, resulting in higher downstream wake losses. The ensuing power and DEL results are shown in Fig. 11.
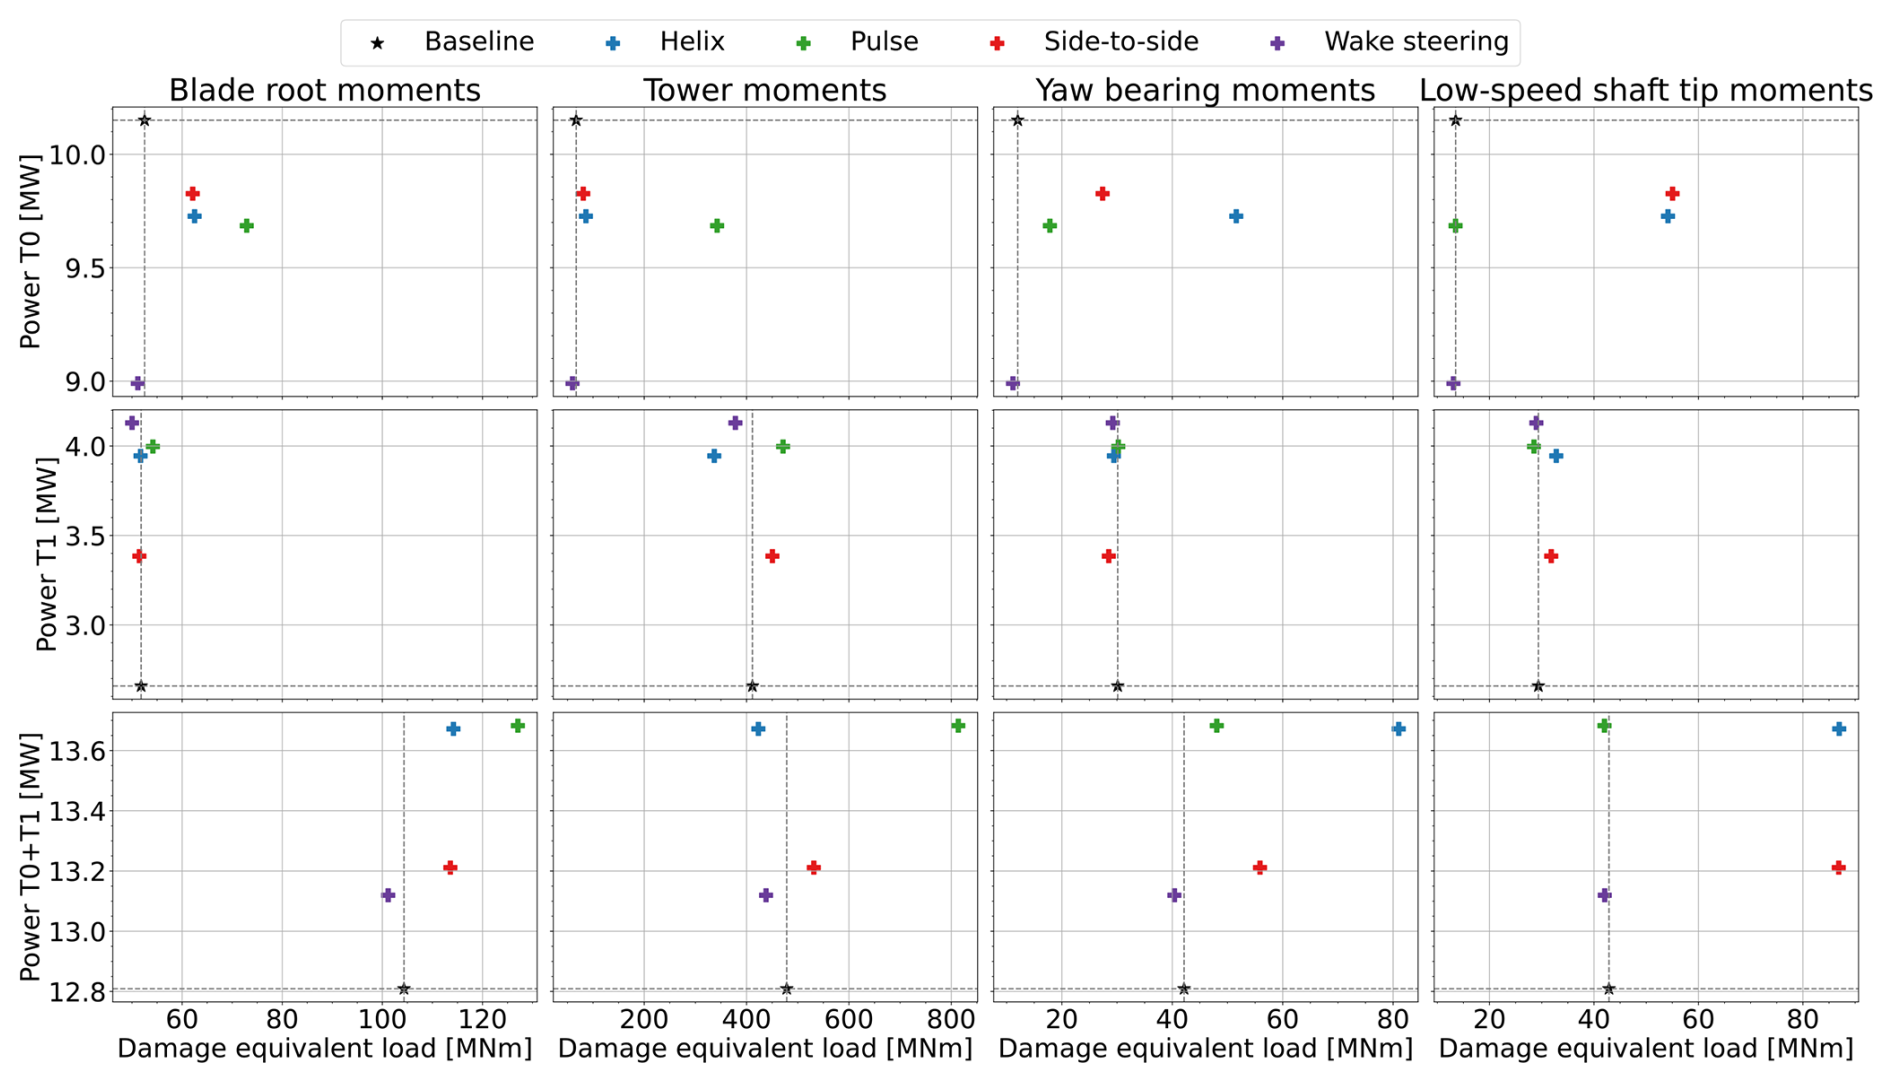
Figure 11DELs plotted on the x axis versus generator power on the y axis for the different control strategies in the medium-WS, low-TI, low-veer (MSLT-LV) case. The first row shows the results for the upstream turbine, the second row shows the results for the downstream turbine, and the third row sums the results for both turbines. The different columns represent the DELs for different turbine components, as labeled at the top.
If we compare the first row, i.e., the first turbine, with the results in Fig. 8, we observe very similar behavior in the two cases. The overall power is slightly higher in the low-veer case, which makes sense, as the rotor is more uniformly aligned with the wind in this case. The DELs, too, are similar to those in the high-veer case, with the pulse strategy mostly increasing the tower DEL and the helix and side-to-side strategies increasing the DELs of the yaw bearing and low-speed shaft.
The second row of Fig. 11 shows some significant differences from the high-veer case. First and foremost, the power gained at the second turbine when AWM is applied on the upstream turbine is substantially higher here. This likely has to do with the fact that we now have full wake overlap at the downstream turbine, whereas in the previous case, the veered wind already naturally created some recovery at the downstream turbine location (see Fig. 3). Note that the absolute power production of the downstream turbines for all control cases is still lower than in the MSLT case, but as the baseline power is now lower, the relative power uplift is bigger. Wake steering still increases downstream power the most, but the pulse and helix now have a similar uplift. In terms of loads, the differences from the MSLT case are smaller. Most notably, the tower DEL does not decrease as significantly with wake steering as was the case in Fig. 8. This is likely caused by the fact that the downstream rotor now experiences partial wake overlap, whereas in the MSLT case, the wake was steered away from the downstream turbine more successfully.
Finally, the bottom row of Fig. 11 displays the sum of the results from the first two rows. In the MSLT case, this showed wake steering as the clear winner; the picture is a lot more ambiguous in low-veer conditions. Overall, wake steering still performs best in terms of DELs but is now surpassed in terms of power production by all AWM strategies. The pulse and helix strategies are on par in terms of power production, with, again, the pulse having higher blade and tower loads and the helix a bigger impact on the yaw bearing and low-speed shaft. In these conditions, picking the most preferable WFFC strategy therefore depends on how much priority is given to increasing wind farm power and whether increasing the DEL on certain specific components might be more acceptable than on others.
Next, we study the turbine behavior in the medium-WS, medium-TI (MSMT) case. This case has higher turbulence than any of the other cases studied in this paper, which is expected to have a number of effects on turbine performance. Turbulence induces natural wake mixing, resulting in lower power deficits at waked downstream turbines. This also affects the potential of WFFC, as a lower power deficit means that the uplift achievable at the downstream turbine is lower as well. Additionally, variations in wind speed and direction inherent to turbulence are known to result in higher DELs.
The results of these simulations are shown in Fig. 12. The first important observation taken from these plots is that the DELs are, contradictory to the literature, lower than in the low-TI case. This is most likely explained by the lower wind veer and shear in the medium-TI simulations. The higher TI causes variations in the moments experienced by the turbine but at a relatively slow timescale. In the low-TI case, however, the wind veer and shear cause variations at the faster, once-per-rotation (1P) frequency, resulting in generally higher DELs. Compared to Fig. 11, the relative change in DELs for all WFFC signals is very similar between the low- and medium-TI cases.
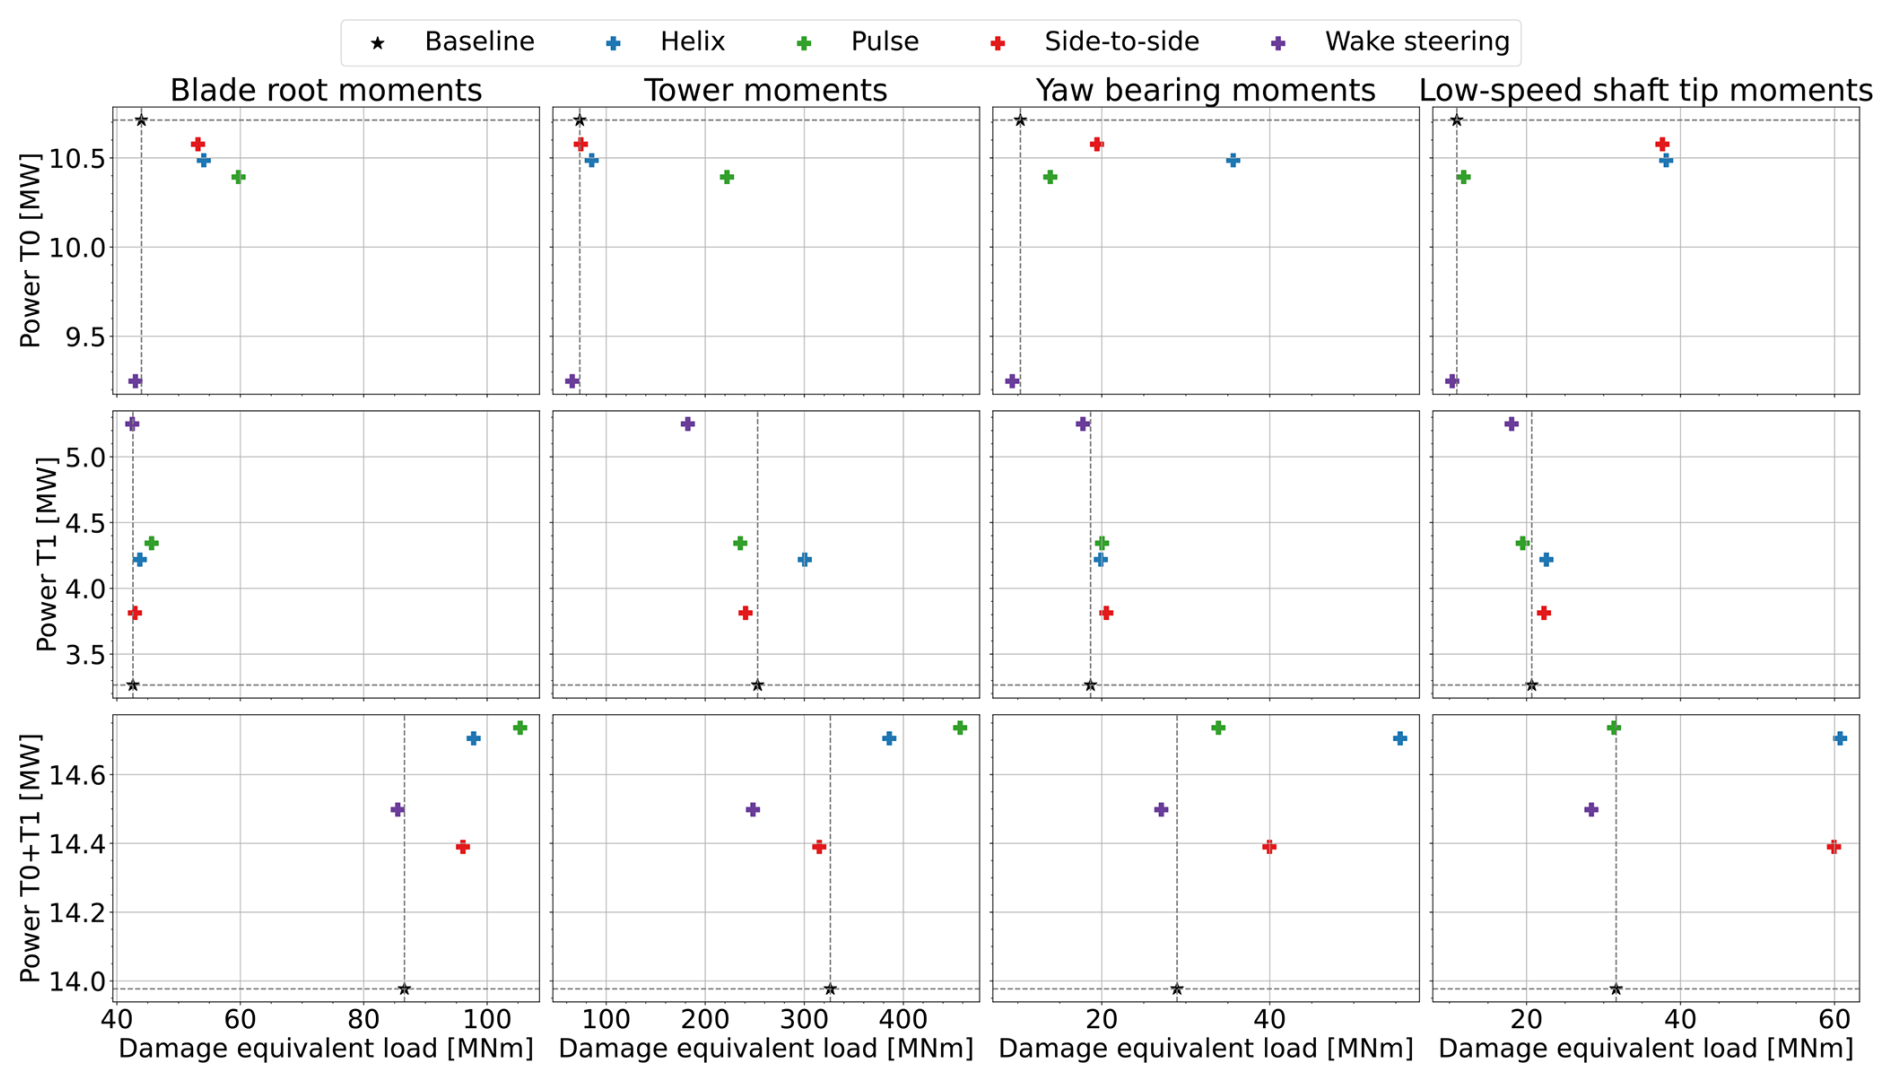
Figure 12DELs plotted on the x axis versus generator power on the y axis for the different control strategies in the medium-WS, medium-TI (MSMT) case. The first row shows the results for the upstream turbine, the second row shows the results for the downstream turbine, and the third row sums the results for both turbines. The different columns represent the DELs for different turbine components, as labeled at the top.
A second observation from Fig. 12 is that the relative power uplift achieved by the different WFFC strategies matches the low-TI, low-veer case much better than the low-TI, high-veer case. Similar to this case, the pulse and helix strategies are on par with the strategies with the highest uplift, while wake steering results in lower DELs at the expense of lower power production. The relative power uplift compared to the baseline case is, as expected, generally lower than in the low-TI cases. However, for the helix strategy, the power uplift in the MSMT case, 5.2 %, is higher than in the MSLT case (3.6 %). Wake steering and the pulse strategy, on the other hand, only generate half (3.7 %) and two-thirds (5.4 %) of the relative power uplift, respectively, compared to the MSLT case, while the side-to-side method remains about equally effective, with a 2.9 % power uplift. This result clearly shows that the effect of veer on WFFC effectiveness is substantial and should be considered when determining the optimal WFFC strategy.
3.3.3 Effect of wind speed
Next, we study the results from the low-WS, low-TI (LSLT) case. This case is similar to the MSLT case in a lot of ways. Like this previously discussed case, it features below-rated wind speed and high wind veer. Subsequently, the results from this case resemble the MSLT results to a high degree. This is shown in Fig. 13, showing again the power and DELs for the two-turbine wind farm under these conditions. The most notable difference from the MSLT case is the fact that the pulse strategy loses some of its ability to increase wind farm power. The DEL results look very similar to the MSLT case, with the most significant difference being that all control strategies now lead to a general decrease in tower DELs. Subsequently, wake steering is also the preferred WFFC strategy in these simulations, generally reducing overall DELs while resulting in the highest power uplift.
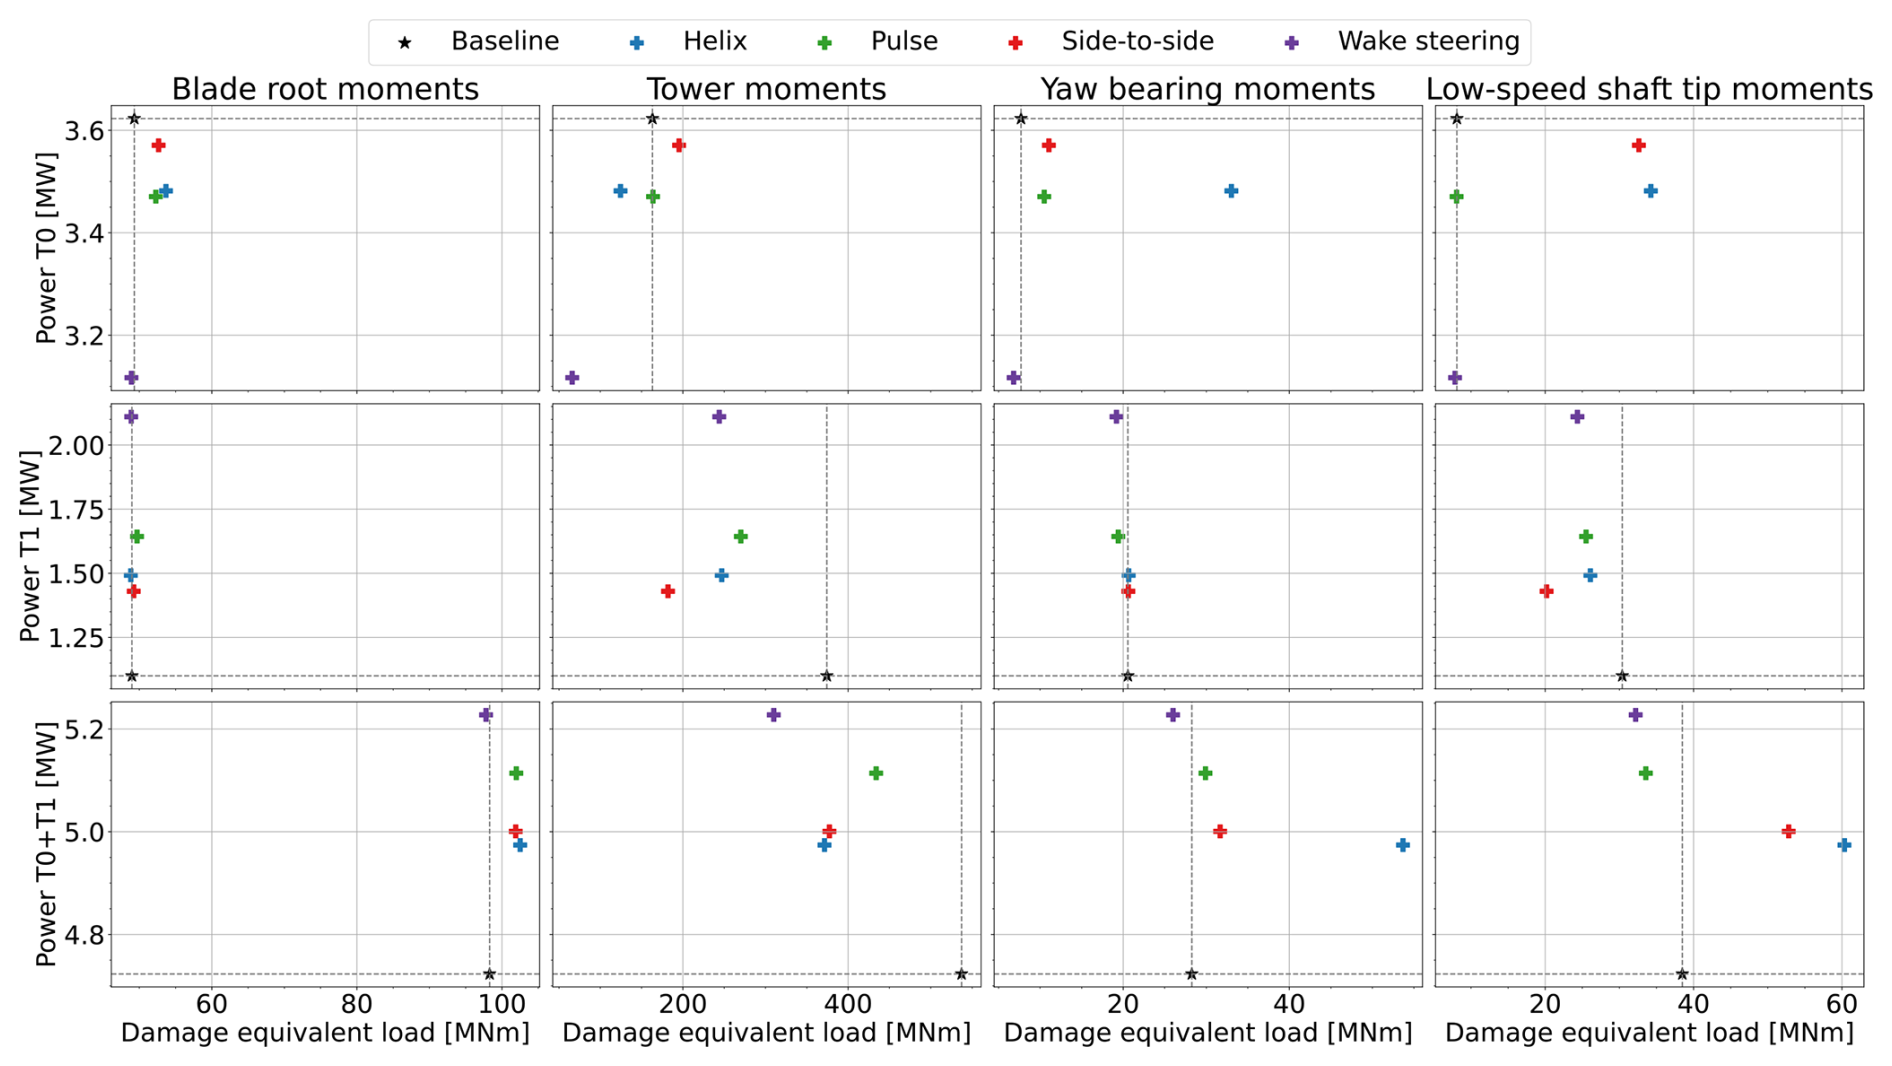
Figure 13DELs plotted on the x axis versus generator power on the y axis for the different control strategies in the low-WS, low-TI (LSLT) case. The first row shows the results for the upstream turbine, the second row shows the results for the downstream turbine, and the third row sums the results for both turbines. The different columns represent the DELs for different turbine components, as labeled at the top.
Finally, we examine the results from the high-WS, low-TI (HSLT) case. As discussed in Sect. 2.2.1, the wind speed is above rated in this simulation case. This makes this case significantly different from the previous cases. First, applying WFFC to the upstream turbine no longer leads to a loss in turbine power. Therefore, the uplift at the downstream turbine comes without the cost of power loss at the upstream machine. Second, in the below-rated cases, the baseline pitch angle was constant at zero. In above-rated conditions, the pitch angle is regulated by the baseline controller to regulate the turbine power to the rated value. The AWM pitch signal is then superimposed on this baseline pitch control signal.
The pulse strategy, in which all blades are pitched collectively, leads to an undesired interaction between the baseline controller and the AWM signal. The fluctuations sent by the active wake controller interfere with the objective of the baseline controller to regulate the power at rated value. As a result, the baseline controller counteracts the AWM signal in order to keep power constant. This leads to a controller that does not demonstrate the desired variations in thrust that make the pulse a successful WFFC strategy. To circumvent this issue, the baseline pitch controller is turned off in the above-rated pulse case. Instead, the baseline controller pitch signal for the pulse simulation is set to be constant at the average angle obtained from the baseline simulation. The AWM signal is now again superimposed on top of this baseline controller signal. Note that this does not lead to behavior that can realistically be expected from an above-rated turbine, and the results from the pulse simulation should therefore be taken with this in mind. However, for completeness, these results are still included in our analysis.
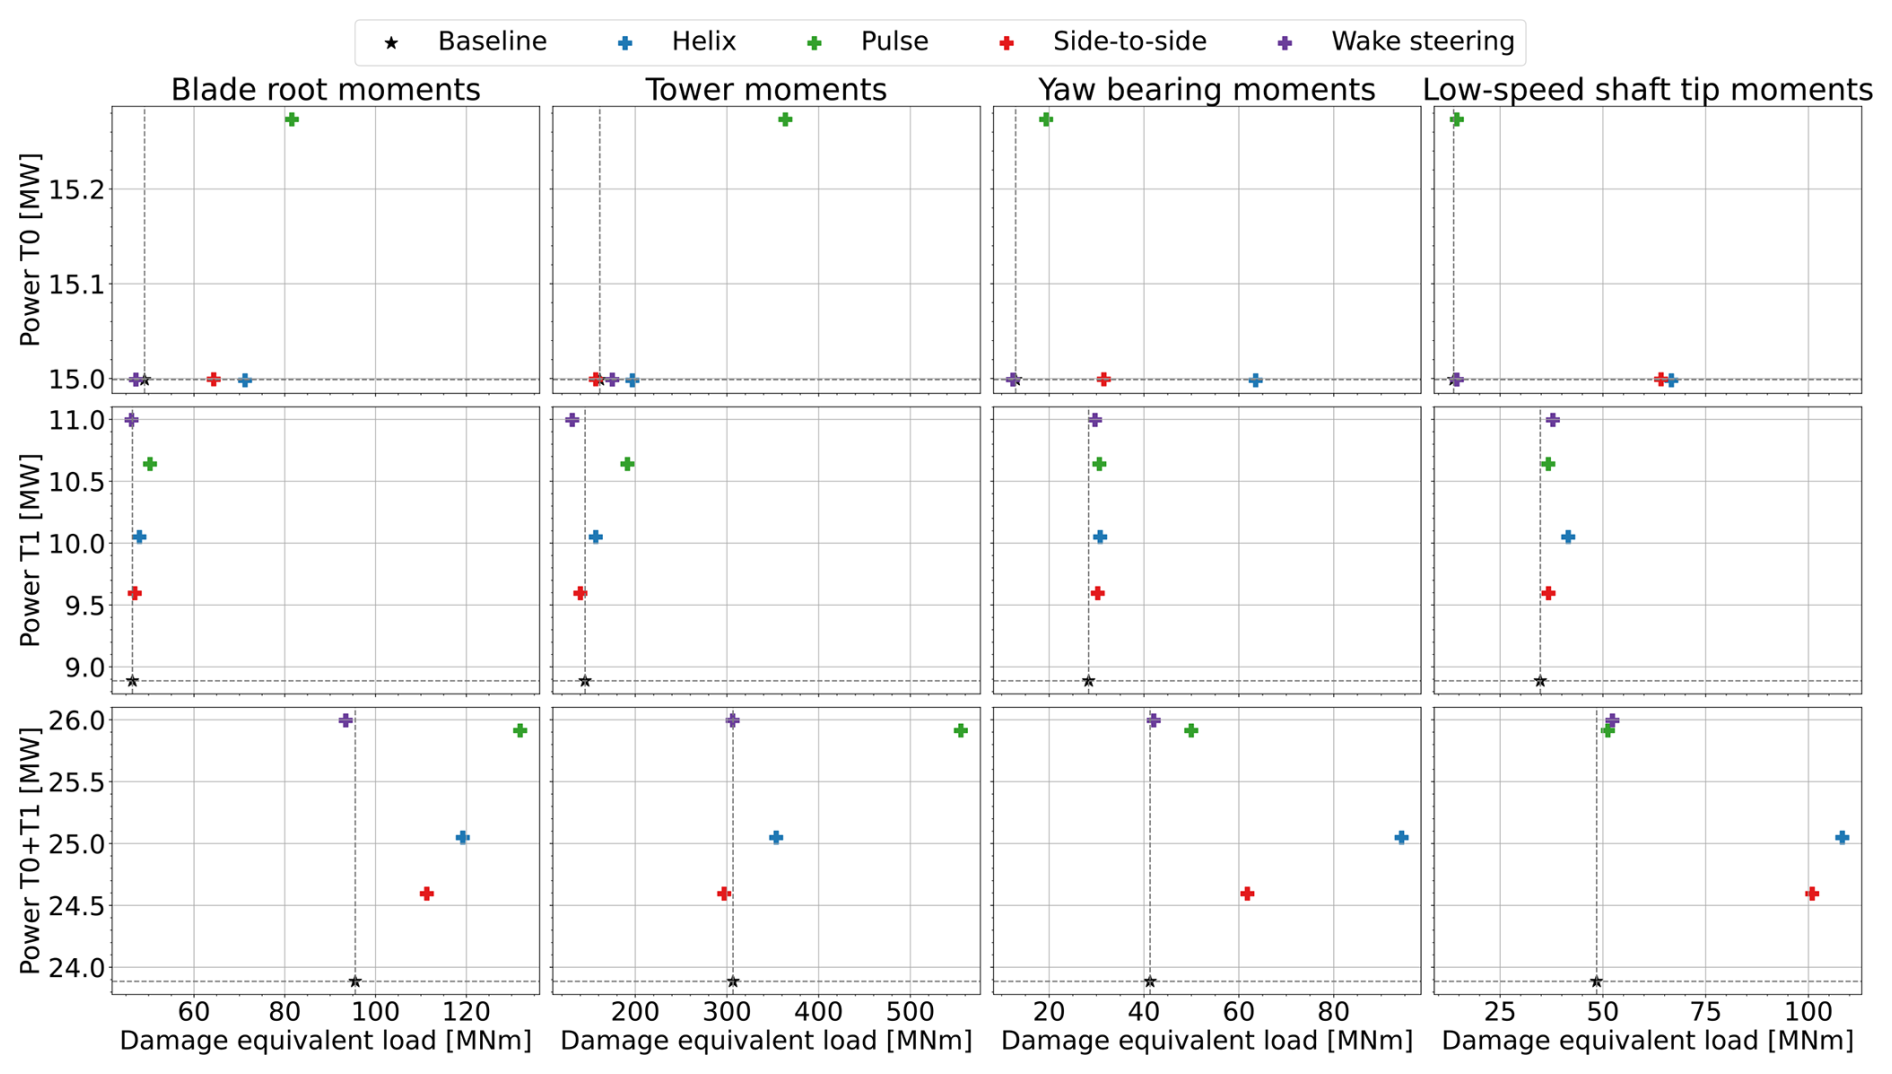
Figure 14DELs plotted on the x axis versus generator power on the y axis for the different control strategies in the high-WS, low-TI (HSLT) case. The first row shows the results for the upstream turbine, the second row shows the results for the downstream turbine, and the third row sums the results for both turbines. The different columns represent the DELs for different turbine components, as labeled at the top. Note that the increased power in the pulse simulation for the first turbine is caused by adjustments made to the controller.
Figure 14 shows the results for the above-rated conditions. As explained, the power of the first turbine is not truly relevant here. The DELs are affected more significantly at these higher wind speeds, and the baseline DELs are already higher than for any WFFC case in the lower-wind-speed simulations. Overall, the trend is similar to the below-rated simulations but with wake steering leading to the lowest (if any) increase in DELs. The DELs of the downstream turbine are affected less by the WFFC strategy implemented, with only the tower moments increasing significantly for the pulse case. In these above-rated conditions, wake steering is the most effective strategy in terms of power maximization, surpassing the pulse despite the artificial power uplift the latter sees at the upstream turbine.
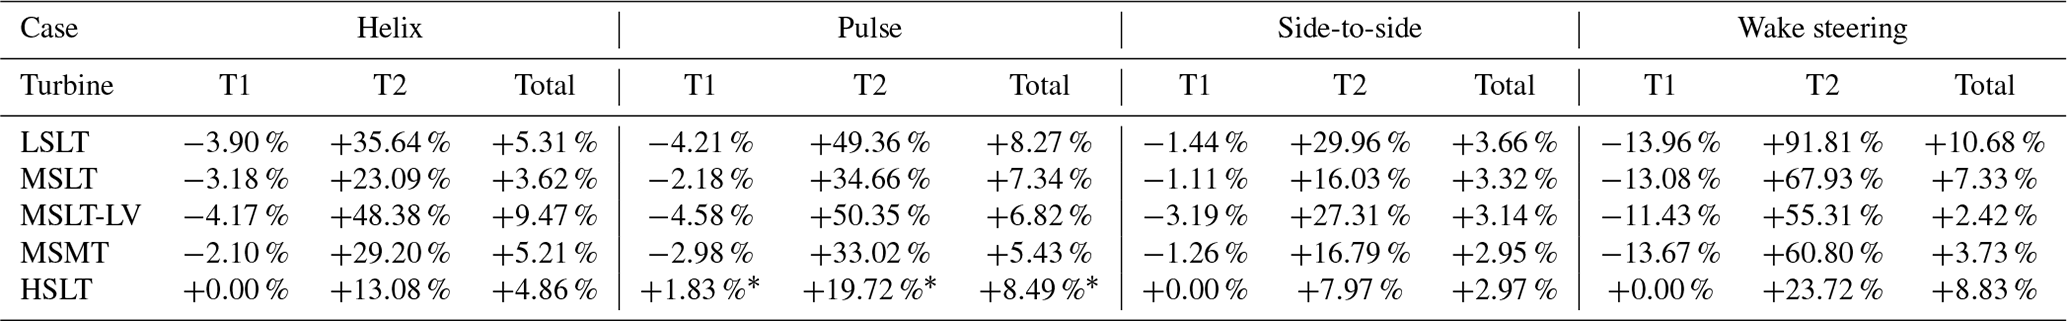
The results for all aligned two-turbine simulations investigated in this study are summarized in Table 7 for power and Table 8 for DELs. The power results show that each WFFC strategy investigated in this paper is able to increase wind farm power production under every set of wind conditions studied. Wake steering is generally the most effective strategy under veered wind conditions, followed closely by the pulse strategy. The helix strategy specifically shows a direct relationship between the skewedness of the wake and the loss of power uplift.
Table 7The power uplift of each WFFC strategy relative to the baseline controller implementation in each of the wind condition cases studied. Note that the pulse case in HSLT (marked with a *) should be considered academically relevant only and not practically relevant, as the baseline controller was deactivated for the above-rated conditions, resulting in very large power and thrust variations on the upstream turbine.
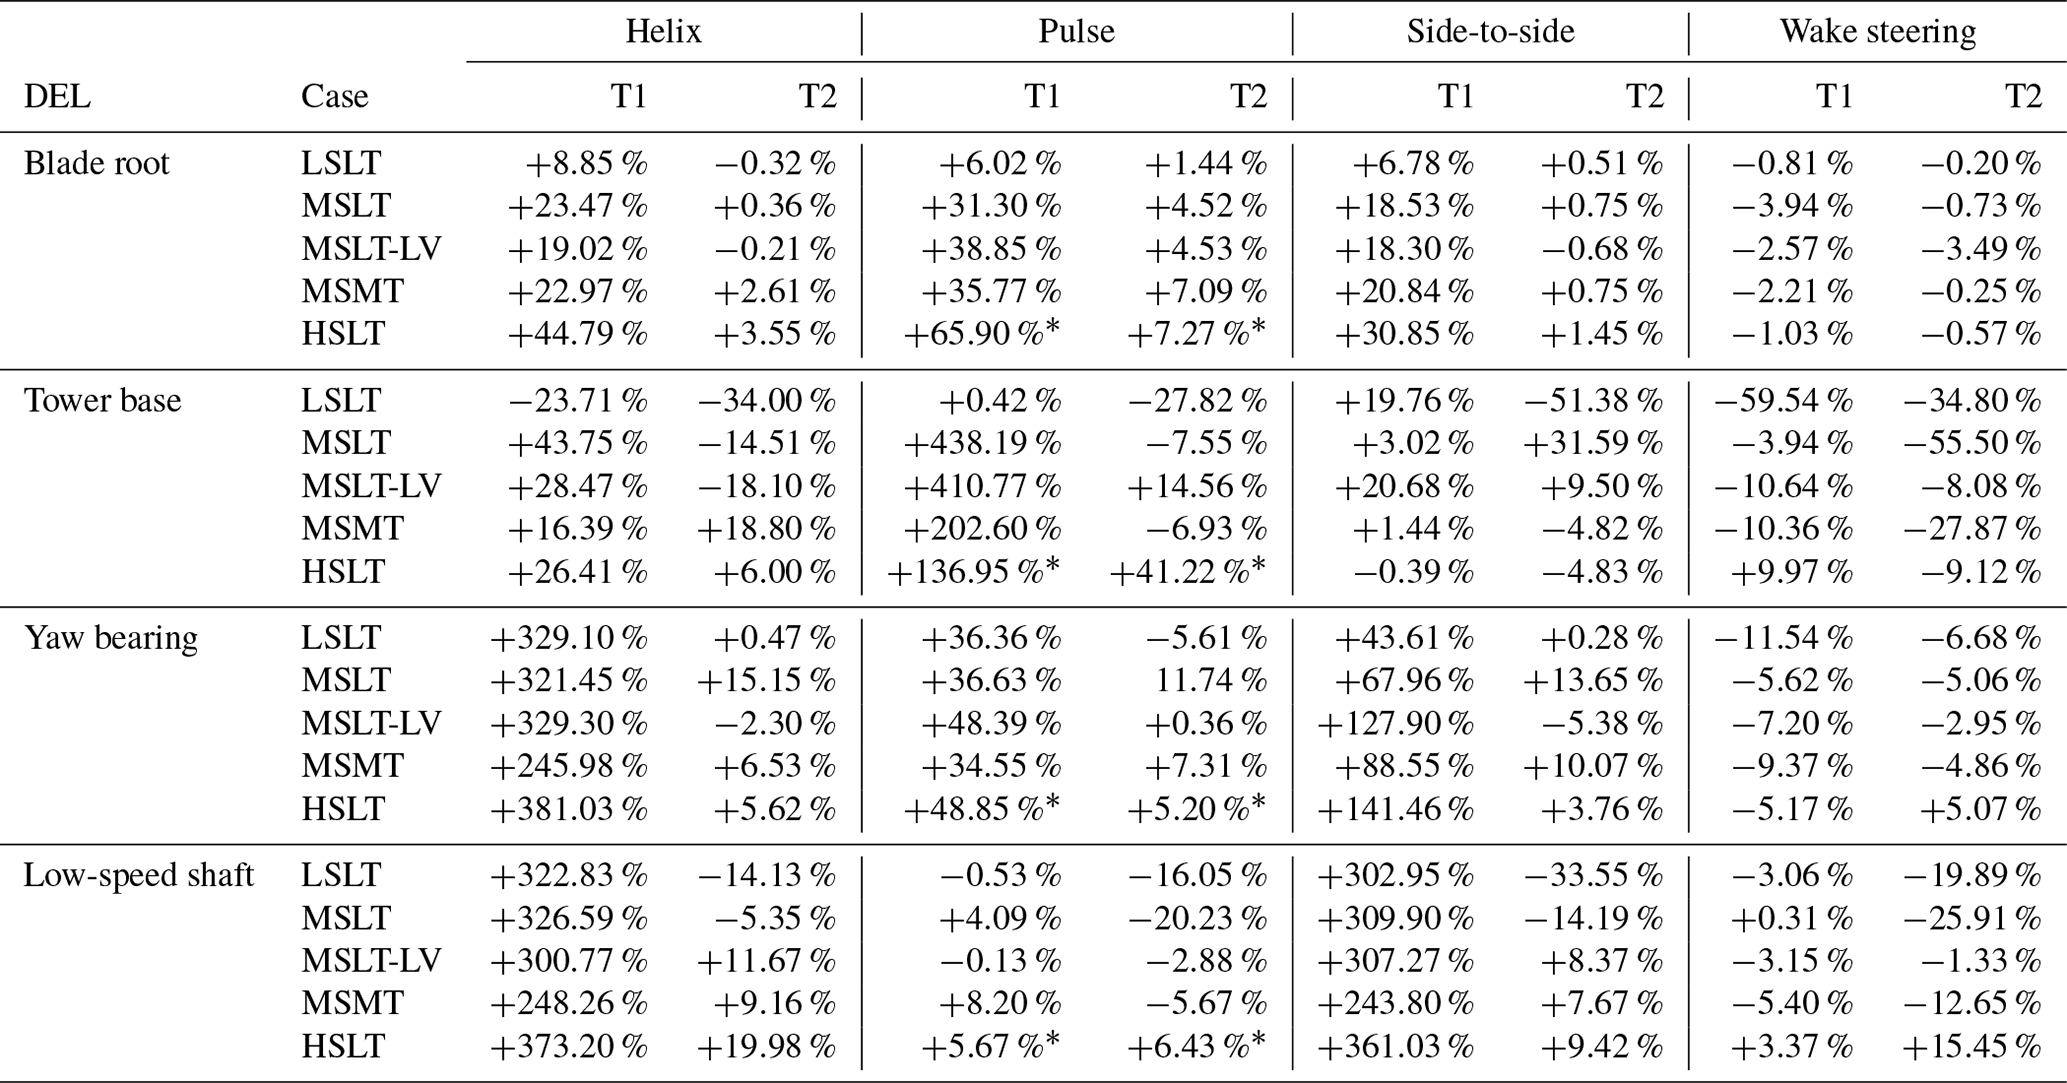
In terms of DELs, the results for all simulations with respect to baseline control are summarized in Table 8. We see here that at lower wind speeds, the impact of using WFFC on DELs of the upstream turbine is generally smaller than at higher wind speeds. Furthermore, the impact of a veered wake on the relative DEL change is generally small. Overall, we can conclude that wake steering performs substantially better than the AWM strategies in terms of DELs, with loads generally decreasing or only increasing by a small amount.
Table 8The relative effect on DEL of each WFFC strategy relative to the baseline controller implementation in each of the wind condition cases studied. All loads are relative to the baseline case for that turbine, where it should be noted that the DELs for the downstream baseline case are generally higher than for the upstream turbine to start with. Note also that the pulse case in HSLT (marked with a *) should be considered academically relevant only and not practically relevant, as the baseline controller was deactivated for the above-rated conditions, resulting in very large power and thrust variations on the upstream turbine.
In this paper (and in its companion paper, Brown et al., 2025), we have investigated and compared the performance of four different WFFC strategies that are currently considered in the literature as viable options to increase wind farm power. High-fidelity flow simulations were set up in AMR-Wind to replicate average wind speeds, turbulence intensities, and wind veer and shear obtained from lidar measurements in a proposed offshore wind farm site. These datasets exhibited significant wind veer in low-turbulence conditions, which was shown to have significant effects on the performance of different WFFC strategies.
First, the skewing of the wakes seen in this study was compared to results from the literature. This comparison found that the skewing is in line with results from simulations using different LES code. However, comparing our results with data from onshore lidar measurements shows that these real-world wakes are skewed substantially less relative to the wind veer. It is possible that this is caused by a difference between onshore and offshore conditions or that it is an undesired side effect of how the simulations are set up. More research is therefore needed to conclude which one of these hypotheses holds true.
Regardless of wind speed, the simulations presented in this paper showed that when the wakes are highly skewed due to wake veer, wake steering is generally superior to the different wake mixing strategies investigated. The pulse strategy, where all blades are dynamically pitched collectively, showed similar effectiveness in terms of power uplift but at the cost of substantially higher DELs. The wake mixing strategies using individual pitch control – the counterclockwise helix and the side-to-side strategy – still achieved a power uplift, but it was less significant than that of the former two strategies.
The study further shows that regardless of wind conditions, the pulse strategy leads to the most significant increase in DELs on the upstream turbine blades and tower. The yaw bearings and low-speed shaft of the upstream turbine, on the other hand, are more affected by the helix and side-to-side strategies. Comparatively, wake steering has a minimal effect on the upstream turbine loads and in some cases even decreases them. Equivalently, the downstream turbine is affected much less by the control action performed on the upstream turbine, with generally smaller changes in structural DELs regardless of the control strategy implemented.
Additionally, we have executed simulations in otherwise similar wind conditions but with lower veer and shear. These simulations showed markedly different results in terms of wind farm power uplift, with the pulse and helix wake mixing strategies now being more effective than wake steering. In terms of DELs, the results were similar to the high-veer case. Simulations at higher turbulence intensity showed similar results. This is more in line with previous studies, which were also executed under low-veer conditions. These results highlight the importance of wind veer, which has so far not been given much attention in WFFC simulation research, to the effectiveness of different WFFC strategies. The results presented here demonstrate that veer or, more accurately, the wake skewing caused by veer is a much more important variable to consider than the wind speed or turbulence intensity when choosing the optimal WFFC strategy. High-wind-veer conditions generally increase the effectiveness of wake steering while reducing the power uplift achieved with wake mixing strategies that use individual pitch control.
The results presented in this paper raise the question of whether wake steering should always be preferred over wake mixing in low-turbulence conditions. The authors stress caution in making such claims. Most of the wakes seen in this study are highly skewed, and it is questionable whether a real-life wake would skew to the same degree. Furthermore, wake steering has another possible downside that is not captured in this study. In real wind farms, the wind direction is constantly changing, and the exact wind direction is not always known instantly or accurately at each turbine. As a result, wake steering sometimes results in a power loss in the case of near-perfect alignment, as the wake can be accidentally steered toward a downstream turbine instead of away from it. Furthermore, yaw actuators are not able to respond to changes in wind conditions as quickly as pitch actuators. The effects of time-varying or uncertain wind conditions are not captured in the simulations presented here.
To conclude, this study shows that wind veer plays a major role in how effective different WFFC strategies are and should therefore always be considered a variable when choosing the optimal strategy. Both wake mixing and wake steering strategies can achieve substantial power uplifts in all wind conditions. However, wake steering has been shown to be the most reliable tool to achieve wind farm power uplift regardless of wind conditions and at minimal to no cost to the turbine DELs. Nonetheless, to conclusively say that wake steering outperforms wake mixing in realistic wind conditions, additional research is necessary. Future studies should focus on time-varying wind conditions as well as wake skewing analysis and comparison with field measurements. Furthermore, this paper's scope is limited to a simple two-turbine wind farm and can not be extrapolated directly to larger farms. Studies on larger wind farm layouts, potentially with WFFC applied to downstream turbines, are needed to validate whether the results presented here still hold. Finally, lidar measurements of the wake of a full-scale turbine operating using different control strategies would be the next step in studying the effects of the control strategies on the wake and therefore on possible downstream turbines.
The code and datasets generated for this paper are available upon request.
The NREL team (JAF, ES, and PAF) was responsible for the running the majority of the simulations presented in this paper, for executing the analysis, and for writing the paper. Sandia National Laboratories (KAB, LCC, and GRY) developed the precursor simulations and assisted in running simulations and analysis.
At least one of the (co-)authors is a member of the editorial board of Wind Energy Science. The peer-review process was guided by an independent editor, and the authors also have no other competing interests to declare.
The views expressed in the article do not necessarily represent the views of the DOE or the US government. The US government retains and the publisher, by accepting the article for publication, acknowledges that the US government retains a nonexclusive, paid-up, irrevocable, worldwide license to publish or reproduce the published form of this work, or allow others to do so, for US government purposes.
Publisher’s note: Copernicus Publications remains neutral with regard to jurisdictional claims made in the text, published maps, institutional affiliations, or any other geographical representation in this paper. While Copernicus Publications makes every effort to include appropriate place names, the final responsibility lies with the authors.
This work was authored in part by the National Renewable Energy Laboratory, operated by Alliance for Sustainable Energy, LLC, for the US Department of Energy (DOE) under contract no. DE-AC36-08GO28308. Funding was provided by the US Department of Energy Office of Energy Efficiency and the Renewable Energy Wind Energy Technologies Office. A portion of this research was performed using computational resources sponsored by the US Department of Energy's Office of Energy Efficiency and Renewable Energy and located at the National Renewable Energy Laboratory.
Sandia National Laboratories is a multi-mission laboratory managed and operated by the National Technology & Engineering Solutions of Sandia, LLC, a wholly owned subsidiary of Honeywell International Inc., for the US Department of Energy’s National Nuclear Security Administration under contract no. DE-NA0003525.
This research has been supported by the Office of Energy Efficiency and Renewable Energy (grant no. DE-AC36-08GO28308) and the National Nuclear Security Administration (grant no. DE-NA0003525).
This paper was edited by Johan Meyers and reviewed by two anonymous referees.
Abbas, N. J., Zalkind, D. S., Pao, L., and Wright, A.: A reference open-source controller for fixed and floating offshore wind turbines, Wind Energ. Sci., 7, 53–73, https://doi.org/10.5194/wes-7-53-2022, 2022. a
Annoni, J., Gebraad, P. M., Scholbrock, A. K., Fleming, P. A., and van Wingerden, J.-W.: Analysis of axial-induction-based wind plant control using an engineering and a high-order wind plant model, Wind Energy, 19, 1135–1150, 2016. a
Bachant, P., Ireland, P., Burrows, B., Qiao, C., Duncan, J., Zheng, D., and Dua, M.: Development and validation of a hybrid data-driven model-based wake steering controller and its application at a utility-scale wind plant, Wind Energ. Sci., 9, 2235–2259, https://doi.org/10.5194/wes-9-2235-2024, 2024. a
Batchelor, G. and Gill, A.: Analysis of the stability of axisymmetric jets, J. Fluid Mech., 14, 529–551, 1962. a, b
Bodini, N., Zardi, D., and Lundquist, J. K.: Three-dimensional structure of wind turbine wakes as measured by scanning lidar, Atmos. Meas. Tech., 10, 2881–2896, https://doi.org/10.5194/amt-10-2881-2017, 2017. a, b, c, d
Bossanyi, E. and Ruisi, R.: Axial induction controller field test at Sedini wind farm, Wind Energ. Sci., 6, 389–408, https://doi.org/10.5194/wes-6-389-2021, 2021. a
Brazell, M., Ananthan, S., Vijayakumar, G., Cheung, L., Sprague, M., et al.: Amr-wind: adaptive mesh-refinement for atmospheric-boundary-layer wind energy simulations, in: APS Division of Fluid Dynamics Meeting Abstracts, T29-007, https://ui.adsabs.harvard.edu/abs/2021APS..DFDT29007B/abstract (last access: 22 April 2025), 2021. a
Brown, K., Houck, D., Maniaci, D., Westergaard, C., and Kelley, C.: Accelerated wind-turbine wake recovery through actuation of the tip-vortex instability, AIAA J., 60, 3298–3310, 2022. a
Brown, K., Yalla, G., Cheung, L., Frederik, J., Houck, D., deVelder, N., Simley, E., and Fleming, P.: Comparison of wind-farm control strategies under realistic offshore wind conditions: wake quantities of interest, Wind Energ. Sci. Discuss. [preprint], https://doi.org/10.5194/wes-2024-191, in review, 2025. a, b, c, d, e, f, g, h, i, j
Campagnolo, F., Petrović, V., Bottasso, C. L., and Croce, A.: Wind tunnel testing of wake control strategies, in: 2016 American Control Conference (ACC), 513–518, https://doi.org/10.1109/ACC.2016.7524965, 2016. a
Cheung, L. C., Brown, K. A., Houck, D. R., and Develder, N. B.: Fluid-dynamic mechanisms underlying wind turbine wake control with Strouhal-timed actuation, Energies, 17, 865, https://doi.org/10.3390/en17040865, 2024. a, b, c
Churchfield, M. and Lee, S.: NWTC design codes-SOWFA, Tech. rep., National Renewable Energy Laboratory (NREL), 15013 Denver West Parkway, Golden, CO, https://www.nrel.gov/wind/nwtc/sowfa (last access: 22 April 2025), 2012. a
Churchfield, M. J. and Sirnivas, S.: On the effects of wind turbine wake skew caused by wind veer, in: 2018 wind energy symposium, p. 0755, https://www.nrel.gov/docs/fy18osti/70686.pdf (last access: 22 April 2025), 8–12 January 2018, Kissimmee, Florida, 2018. a, b, c, d, e, f
Ciri, U., Rotea, M. A., and Leonardi, S.: Model-free control of wind farms: A comparative study between individual and coordinated extremum seeking, Renew. Energ., 113, 1033–1045, 2017. a
Coquelet, M., Moens, M., Bricteux, L., Crismer, J.-B., and Chatelain, P.: Performance assessment of wake mitigation strategies, J. Phys. Conf. Ser., 2265, 032078, https://doi.org/10.1088/1742-6596/2265/3/032078, 2022. a
Coquelet, M., Gutknecht, J., Van Wingerden, J., Duponcheel, M., and Chatelain, P.: Dynamic individual pitch control for wake mitigation: Why does the helix handedness in the wake matter?, J. Phys. Conf. Ser., 2767, 092084, https://doi.org/10.1088/1742-6596/2767/9/092084, 2024. a
DNV: NYSERDA Floating LiDAR Buoy Data, https://data.ny.gov/Energy-Environment/Floating-LiDAR-BUOY-Data-Beginning-August-2019/xdq2-qf34/about_data (last accesss: 22 April 2025), 2023. a, b
Doekemeijer, B. M., Kern, S., Maturu, S., Kanev, S., Salbert, B., Schreiber, J., Campagnolo, F., Bottasso, C. L., Schuler, S., Wilts, F., Neumann, T., Potenza, G., Calabretta, F., Fioretti, F., and van Wingerden, J.-W.: Field experiment for open-loop yaw-based wake steering at a commercial onshore wind farm in Italy, Wind Energ. Sci., 6, 159–176, https://doi.org/10.5194/wes-6-159-2021, 2021. a, b
El-Asha, S., Zhan, L., and Iungo, G. V.: Quantification of power losses due to wind turbine wake interactions through SCADA, meteorological and wind LiDAR data, Wind Energy, 20, 1823–1839, 2017. a
Fleming, P., Gebraad, P. M., Lee, S., van Wingerden, J.-W., Johnson, K., Churchfield, M., Michalakes, J., Spalart, P., and Moriarty, P.: Simulation comparison of wake mitigation control strategies for a two-turbine case, Wind Energy, 18, 2135–2143, 2015. a, b
Fleming, P., King, J., Dykes, K., Simley, E., Roadman, J., Scholbrock, A., Murphy, P., Lundquist, J. K., Moriarty, P., Fleming, K., van Dam, J., Bay, C., Mudafort, R., Lopez, H., Skopek, J., Scott, M., Ryan, B., Guernsey, C., and Brake, D.: Initial results from a field campaign of wake steering applied at a commercial wind farm – Part 1, Wind Energ. Sci., 4, 273–285, https://doi.org/10.5194/wes-4-273-2019, 2019. a, b
Fleming, P., King, J., Simley, E., Roadman, J., Scholbrock, A., Murphy, P., Lundquist, J. K., Moriarty, P., Fleming, K., van Dam, J., Bay, C., Mudafort, R., Jager, D., Skopek, J., Scott, M., Ryan, B., Guernsey, C., and Brake, D.: Continued results from a field campaign of wake steering applied at a commercial wind farm – Part 2, Wind Energ. Sci., 5, 945–958, https://doi.org/10.5194/wes-5-945-2020, 2020. a
Frederik, J., Doekemeijer, B., Mulders, S., and van Wingerden, J.-W.: On wind farm wake mixing strategies using dynamic individual pitch control, J. Phys. Conf. Ser., 1618, 022050, https://doi.org/10.1088/1742-6596/1618/2/022050, 2020a. a
Frederik, J. A. and van Wingerden, J.-W.: On the load impact of dynamic wind farm wake mixing strategies, Renew. Energ., 194, 582–595, 2022. a, b, c
Frederik, J. A., Doekemeijer, B. M., Mulders, S. P., and van Wingerden, J.-W.: The helix approach: Using dynamic individual pitch control to enhance wake mixing in wind farms, Wind Energy, 23, 1739–1751, 2020a. a, b
Frederik, J. A., Weber, R., Cacciola, S., Campagnolo, F., Croce, A., Bottasso, C., and van Wingerden, J.-W.: Periodic dynamic induction control of wind farms: proving the potential in simulations and wind tunnel experiments, Wind Energ. Sci., 5, 245–257, https://doi.org/10.5194/wes-5-245-2020, 2020b. a, b, c, d, e
Gaertner, E., Rinker, J., Sethuraman, L., Zahle, F., Anderson, B., Barter, G. E., Abbas, N. J., Meng, F., Bortolotti, P., Skrzypinski, W., Scott, G., Feil, R., Bredmose, H., Dykes, K., Shields, M., Allen, C., and Viselli, A.: IEA wind TCP task 37: definition of the IEA 15-megawatt offshore reference wind turbine, Tech. rep., National Renewable Energy Laboratory (NREL), Golden, CO (United States), https://www.nrel.gov/docs/fy20osti/75698.pdf (last access: 22 April 2025), 2020. a
Howland, M. F., Lele, S. K., and Dabiri, J. O.: Wind farm power optimization through wake steering, P. Natl. Acad. Sci. USA, 116, 14495–14500, 2019a. a
Howland, M. F., Lele, S. K., and Dabiri, J. O.: Wind farm power optimization through wake steering, P. Natl. Acad. Sci. USA, 116, 14495–14500, 2019b. a
Howland, M. F., Ghate, A. S., Lele, S. K., and Dabiri, J. O.: Optimal closed-loop wake steering – Part 1: Conventionally neutral atmospheric boundary layer conditions, Wind Energ. Sci., 5, 1315–1338, https://doi.org/10.5194/wes-5-1315-2020, 2020. a
Huang, L., Mulders, S. P., Taschner, E., and van Wingerden, J.-W.: Enhancing Wake Mixing in Wind Farms by Multi-Sine Signals in the Helix Approach, in: 2023 American Control Conference (ACC), San Diego, CA, USA, 31 May–2 June 2023 824–830, https://doi.org/10.23919/ACC55779.2023.10155870, IEEE, 2023. a
Korb, H., Asmuth, H., and Ivanell, S.: The characteristics of helically deflected wind turbine wakes, J. Fluid Mech., 965, A2, https://doi.org/10.1017/jfm.2023.390, 2023. a
Lawrence Berkeley National Laboratory, National Renewable Energy Laboratory, and Sandia National Laboratories: AMR-Wind v2.0.0, GitHub [code], https://github.com/Exawind/amr-wind (last access: 22 April 2025), 2024. a
Marden, J., Ruben, S., and Pao, L.: Surveying game theoretic approaches for wind farm optimization, in: 50th AIAA aerospace sciences meeting including the new horizons forum and aerospace exposition, p. 1154, Nashville, Tennessee, USA, 9–12 January 2012, https://arc.aiaa.org/doi/pdf/10.2514/6.2012-1154 (last access: 22 April 2025), 2012. a
Martinez, J. J. P. and Coussy, J.: Wake steering experiments in onshore and offshore wind farms, J. Phys. Conf. Ser., 2767, 092090, https://doi.org/10.1088/1742-6596/2767/9/092090, 2024. a
Meyers, J., Bottasso, C., Dykes, K., Fleming, P., Gebraad, P., Giebel, G., Göçmen, T., and van Wingerden, J.-W.: Wind farm flow control: prospects and challenges, Wind Energ. Sci., 7, 2271–2306, https://doi.org/10.5194/wes-7-2271-2022, 2022. a
Min, M., Brazell, M., Tomboulides, A., Churchfield, M., Fischer, P., and Sprague, M.: Towards exascale for wind energy simulations, Int. J. High Perform. C., 38, 337–355, 2024. a
Mühle, F. V., Heckmeier, F. M., Campagnolo, F., and Breitsamter, C.: Wind tunnel investigations of an individual pitch control strategy for wind farm power optimization, Wind Energ. Sci., 9, 1251–1271, https://doi.org/10.5194/wes-9-1251-2024, 2024. a
Munters, W. and Meyers, J.: Towards practical dynamic induction control of wind farms: analysis of optimally controlled wind-farm boundary layers and sinusoidal induction control of first-row turbines, Wind Energ. Sci., 3, 409–425, https://doi.org/10.5194/wes-3-409-2018, 2018a. a, b
Munters, W. and Meyers, J.: Dynamic strategies for yaw and induction control of wind farms based on large-eddy simulation and optimization, Energies, 11, 177, https://doi.org/10.3390/en11010177, 2018b. a
National Renewable Energy Laboratory: ROSCO v2.8.0, GitHub [code], https://github.com/NREL/ROSCO (last access: 22 April 2025), 2024a. a
National Renewable Energy Laboratory: OpenFAST v3.5.0, GitHub [code], https://github.com/OpenFAST/openfast (last access: 22 April 2025), 2024b. a
Nygaard, N. G.: Wakes in very large wind farms and the effect of neighbouring wind farms, J. Phys. Conf. Ser., 524, 012162, https://doi.org/10.1088/1742-6596/524/1/012162, 2014. a
Simley, E., Fleming, P., Girard, N., Alloin, L., Godefroy, E., and Duc, T.: Results from a wake-steering experiment at a commercial wind plant: investigating the wind speed dependence of wake-steering performance, Wind Energ. Sci., 6, 1427–1453, https://doi.org/10.5194/wes-6-1427-2021, 2021. a
Sutherland, H. J. and Mandell, J. F.: Effect of mean stress on the damage of wind turbine blades, J. Sol. Energ.-T. ASME, 126, 1041–1049, 2004. a
Taschner, E., Van Vondelen, A., Verzijlbergh, R., and Van Wingerden, J.: On the performance of the helix wind farm control approach in the conventionally neutral atmospheric boundary layer, J. Phys. Conf. Ser., 2505, 012006, https://doi.org/10.1088/1742-6596/2505/1/012006, 2023. a
Taschner, E., Becker, M., Verzijlbergh, R., and Van Wingerden, J.: Comparison of helix and wake steering control for varying turbine spacing and wind direction, J. Phys. Conf. Ser., 2767, 032023, https://doi.org/10.1088/1742-6596/2767/3/032023, 2024. a, b
Thedin, R., Barter, G., Jonkman, J., Mudafort, R., Bay, C. J., Shaler, K., and Kreeft, J.: Load assessment of a wind farm considering negative and positive yaw misalignment for wake steering, Wind Energ. Sci. Discuss. [preprint], https://doi.org/10.5194/wes-2024-6, in review, 2024. a
Van Den Berg, D., De Tavernier, D., and van Wingerden, J.-W.: Using the helix mixing approach on floating offshore wind turbines, J. Phys. Conf. Ser., 2265, 042011, https://doi.org/10.1088/1742-6596/2265/4/042011, 2022. a
van der Hoek, D., Kanev, S., Allin, J., Bieniek, D., and Mittelmeier, N.: Effects of axial induction control on wind farm energy production – A field test, Renew. Energ., 140, 994–1003, 2019. a
van der Hoek, D., Frederik, J., Huang, M., Scarano, F., Simao Ferreira, C., and van Wingerden, J.-W.: Experimental analysis of the effect of dynamic induction control on a wind turbine wake, Wind Energ. Sci., 7, 1305–1320, https://doi.org/10.5194/wes-7-1305-2022, 2022. a
Van der Hoek, D., den Abbeele, B. V., Simao Ferreira, C., and van Wingerden, J.-W.: Maximizing wind farm power output with the helix approach: Experimental validation and wake analysis using tomographic particle image velocimetry, Wind Energy, 27, 463–482, 2024. a, b
Van Vondelen, A. A., Navalkar, S. T., Kerssemakers, D. R., and Van Wingerden, J.-W.: Enhanced wake mixing in wind farms using the Helix approach: A loads sensitivity study, in: 2023 American Control Conference (ACC), 831–836, San Diego, CA, USA, 31 May–2 June 2023, IEEE, https://doi.org/10.23919/ACC55779.2023.10155965, 2023a. a, b
van Vondelen, A. A., Ottenheym, J., Pamososuryo, A. K., Navalkar, S. T., and van Wingerden, J.-W.: Phase synchronization for helix enhanced wake mixing in downstream wind turbines, IFAC-PapersOnLine, 56, 8426–8431, 2023b. a
Wang, C., Campagnolo, F., Sharma, A., and Bottasso, C.: Effects of dynamic induction control on power and loads, by LES-ALM simulations and wind tunnel experiments, J. Phys. Conf. Ser., 1618, 022036, https://doi.org/10.1088/1742-6596/1618/2/022036, 2020. a, b
Yılmaz, A. E. and Meyers, J.: Optimal dynamic induction control of a pair of inline wind turbines, Phys. Fluids, 30, 085106, https://doi.org/10.1063/1.5038600, 2018. a, b
The requested paper has a corresponding corrigendum published. Please read the corrigendum first before downloading the article.
- Article
(5652 KB) - Full-text XML